SpectralBench v5 — Scenario Review
XANES benchmark scenarios with PDF evidence screenshots
1283
Scenarios
361
Papers
6
Categories
4
Facilities
Harnessing Neural Networks for Elucidating X-ray Absorption Structure–Spectrum Relationships in Amorphous Carbon
Original-17
Synthesis
Hyuna Kwon et al.
DOI: 10.1021/acs.jpcc.3c02029
2 scenarios
PDF
▶
Key Paper Evidencep.21, p.23▶
Page 21 (PDF page 21)

Page 23 (PDF page 23)
#1
Monolayer graphene grown via high-temperature thermal annealing on 4H-SiC (grapheneHT)
C K-edge
▶
LLM Prompt
Sample Information
Material: Monolayer graphene grown via high-temperature thermal annealing on 4H-SiC (grapheneHT)
Method: thermal annealing
Post Treatment: Annealing
Sample-Specific Conditions
- Material type: Graphene
- Experimental XANES data of an annealed graphene sample evaluated by the trained neural network model to predict hybridization composition.
Preparation
- GrapheneHT films were synthesized by thermally annealing the Si face of 4H-SiC substrates at atmospheric pressure in an Ar ambient at 1650 °C for 5 min, terminating the growth before the formation of a second graphene layer.
Measurement
We plan to measure the C K-edge XANES spectrum of this sample.
Questions
Based on all the information above:
1. When analyzing the C K-edge XANES spectrum of this annealed graphene sample to determine its hybridization composition, what candidate carbon hybridization phases (basis components) should be considered?
2. Based on the synthesis conditions (high-temperature thermal annealing to form monolayer graphene), estimate the phase fractions of the different carbon hybridization states present in the sample.
3. Explain the physical reasoning behind the expected phase composition, specifically addressing why a small non-sp2 fraction might be detected in the experimental XANES data of this graphene sample.
Ground Truth
Material: Annealed graphene
Measurement: C K-edge XANES
Fit method: NN inversion
Phase fractions:
| Phase | Fraction |
|---|---|
| sp2 carbon | 0.979 |
| sp3 carbon | 0.021 |
Fit basis (paper's reference spectra):
- sp2 carbon
- sp3 carbon
- sp carbon
Source evidence: Page 21 (OCR page 23), Results and Discussion
Key reasoning: The sample is expected to be primarily composed of sp2 hybridized carbon, which aligns with the intrinsic structure of pristine graphene. The small fraction of sp3 carbon (2.1%) detected in the experimental sample is attributed to the presence of defects or other chemical groups that complicate a perfectly pure sp2 composition.
Reasoning source: Page 21 (OCR page 23), Results and Discussion
Scoring Rubric (total: 100 pts)
| Q | Type | Max | Question | Reference Answer | Scoring Criteria |
|---|---|---|---|---|---|
| q1 | identification | 20 | When analyzing the C K-edge XANES spectrum of this annealed graphene sample to determine its hybridization composition, what candidate carbon hybridization phases (basis components) should be considered? | When analyzing the C K-edge XANES spectrum of this sample using a neural network inversion model, the candidate basis components to consider are sp2 carbon, sp3 carbon, and sp carbon. These specific hybridization phases are selected because the sample is a monolayer graphene film synthesized via high-temperature thermal annealing at 1650 °C on 4H-SiC. Under these growth conditions, the intrinsic structure of the resulting pristine graphene is expected to be overwhelmingly composed of sp2 hybridized carbon. However, sp3 and sp carbon must also be included in the basis to account for any structural defects or chemical groups that may form during the high-temperature synthesis, which would disrupt a perfectly pure sp2 network. | Full points for identifying sp2 and sp3 carbon (and optionally sp carbon) as the relevant hybridization states to quantify. |
| q2 | quantification | 40 | Based on the synthesis conditions (high-temperature thermal annealing to form monolayer graphene), estimate the phase fractions of the different carbon hybridization states present in the sample. | The estimated phase fractions for this sample are 0.979 (97.9%) sp2 carbon and 0.021 (2.1%) sp3 carbon. These specific values result directly from the synthesis conditions, where annealing the Si face of 4H-SiC at 1650 °C in an Ar ambient successfully forms a highly crystalline monolayer graphene film. Because pristine graphene is intrinsically composed of a honeycomb lattice of sp2 hybridized carbon, the sp2 fraction heavily dominates the composition at 97.9%. The minor 2.1% fraction of sp3 carbon is present because the experimental growth conditions inevitably introduce a small amount of defects or other chemical groups, preventing a perfectly pure sp2 composition. | Full points for estimating a highly dominant sp2 carbon fraction (>95%) and a very small sp3 carbon fraction (<5%). |
| q3 | reasoning | 40 | Explain the physical reasoning behind the expected phase composition, specifically addressing why a small non-sp2 fraction might be detected in the experimental XANES data of this graphene sample. | The expected phase composition of 97.9% sp2 and 2.1% sp3 carbon is a direct consequence of the high-temperature thermal annealing process used to synthesize the monolayer graphene. By annealing the 4H-SiC substrate at 1650 °C for 5 minutes in an Ar ambient, the process promotes the formation of the intrinsic lattice of pristine graphene, which is entirely composed of sp2 hybridized carbon. Consequently, the sample is overwhelmingly dominated by the sp2 phase. However, a small non-sp2 (sp3) fraction is detected because the experimental realities of the growth process—such as terminating the growth before a second layer forms—can leave structural defects or incorporate other chemical groups. These imperfections disrupt the ideal lattice, complicating a perfectly pure sp2 composition and resulting in the observed 2.1% sp3 fraction. | Full points for explaining that while graphene is intrinsically composed of sp2 carbon, experimental samples often contain defects or other chemical groups that manifest as a small fraction of sp3 hybridized carbon. |
Review
#2
Diamond
C K-edge
▶
LLM Prompt
Sample Information
Material: Diamond
Method: Detonation synthesis and thermal oxidation
Precursors: carbon-containing explosives (TNT and hexogen)
Temperature C: 425
Duration Hours: 5
Heating Rate C Per Min: 50
Post Treatment: Multistage acidic purifications using nitric and sulfuric acids (for UD90 and UD98 prior to oxidation)
Sample-Specific Conditions
- Material type: Diamond
- Experimental XANES data of nanodiamond powder evaluated by the trained neural network model to predict hybridization composition.
Preparation
- Nanodiamond powders produced by detonation synthesis (supplied by NanoBlox, Inc.). Samples included raw detonation soot (UD50) and acid-purified samples (UD90, UD98). Oxidative purification was performed by rapid heating to 425 °C and isothermal oxidation for 5 hours in ambient air at atmospheric pressure to selectively remove sp2-bonded carbon.
Measurement
We plan to measure the C K-edge XANES spectrum of this sample.
Questions
Based on all the information above:
1. What candidate carbon hybridization phases (basis components) should be considered when analyzing the C K-edge XANES spectrum of this nanodiamond powder sample to determine its composition?
2. Explain why a sample nominally identified as 'diamond' powder might exhibit significant fractions of non-sp3 hybridized carbon when analyzed via XANES spectroscopy.
Ground Truth
Material: Diamond powder
Measurement: C K-edge XANES
Fit method: NN inversion
Phase fractions:
| Phase | Fraction |
|---|---|
| sp carbon | 0.219 |
| sp2 carbon | 0.244 |
| sp3 carbon | 0.528 |
Fit basis (paper's reference spectra):
- sp carbon
- sp2 carbon
- sp3 carbon
Source evidence: Page 21, text: 'Similarly, using the XANES data reported in Ref. [64] for diamond, our model predicts a composition of 21.9% sp, 24.4% sp2, and 52.8% sp3 carbon...'
Key reasoning: When the neural network model trained on DFT-calculated spectra is applied to experimental XANES data of nanodiamond powder, it predicts a mixture of carbon hybridizations. While the majority of the carbon atoms are in the expected sp3 hybridization state (52.8%), significant fractions of sp (21.9%) and sp2 (24.4%) carbon are also predicted. The presence of these non-sp3 phases in experimental samples can be attributed to inherent differences between experimental samples and simulated models, such as surface and interface effects, as well as the presence of defects and other chemical groups.
Reasoning source: Page 21
Scoring Rubric (total: 100 pts)
| Q | Type | Max | Question | Reference Answer | Scoring Criteria |
|---|---|---|---|---|---|
| q1 | identification | 33 | What candidate carbon hybridization phases (basis components) should be considered when analyzing the C K-edge XANES spectrum of this nanodiamond powder sample to determine its composition? | When analyzing the C K-edge XANES spectrum of this nanodiamond powder, the candidate basis components to consider are sp, sp2, and sp3 hybridized carbon. Although the sample is nominally diamond and underwent oxidative purification at 425 °C for 5 hours to selectively remove sp2-bonded carbon, a mixture of hybridizations is still expected. This is because detonation synthesis from explosive precursors yields nanoscale particles where surface and interface effects become highly prominent. Consequently, alongside the expected bulk sp3 diamond phase, non-sp3 phases (sp and sp2 carbon) must be included in the neural network inversion model to account for surface defects, interfaces, and residual chemical groups not fully removed by the acid and thermal treatments. | Full points for identifying sp, sp2, and sp3 carbon as the necessary basis components. |
| q3 | reasoning | 67 | Explain why a sample nominally identified as 'diamond' powder might exhibit significant fractions of non-sp3 hybridized carbon when analyzed via XANES spectroscopy. | A sample nominally identified as diamond powder can exhibit significant non-sp3 hybridized carbon due to the inherent characteristics of nanoscale experimental samples compared to ideal bulk models. The nanodiamonds in this study are produced via detonation synthesis from TNT and hexogen, resulting in high surface-area-to-volume ratios. Even after multistage acidic purifications and isothermal oxidation at 425 °C for 5 hours intended to selectively remove sp2-bonded carbon, the neural network inversion still predicts 21.9% sp and 24.4% sp2 carbon alongside the 52.8% sp3 carbon. These significant non-sp3 fractions arise from surface and interface effects, structural defects, and the presence of other chemical groups that persist on the nanodiamond surfaces despite the rigorous purification process. | Full points for explaining that experimental nanodiamond samples often contain surface and interface effects, defects, or other chemical groups that introduce sp and sp2 hybridized carbon, deviating from an ideal 100% sp3 bulk structure. |
Review
Supervised Machine-Learning-Based Determination of Three-Dimensional Structure of Metallic Nanoparticles
Original-17
Catalyst
Janis Timoshenko et al.
DOI: 10.1021/acs.jpclett.7b02364
6 scenarios
PDF
▶
Key Paper Evidence3c, 1, p.13, p.14, p.15, p.16, p.17▶
Figure 3c (PDF page 15)
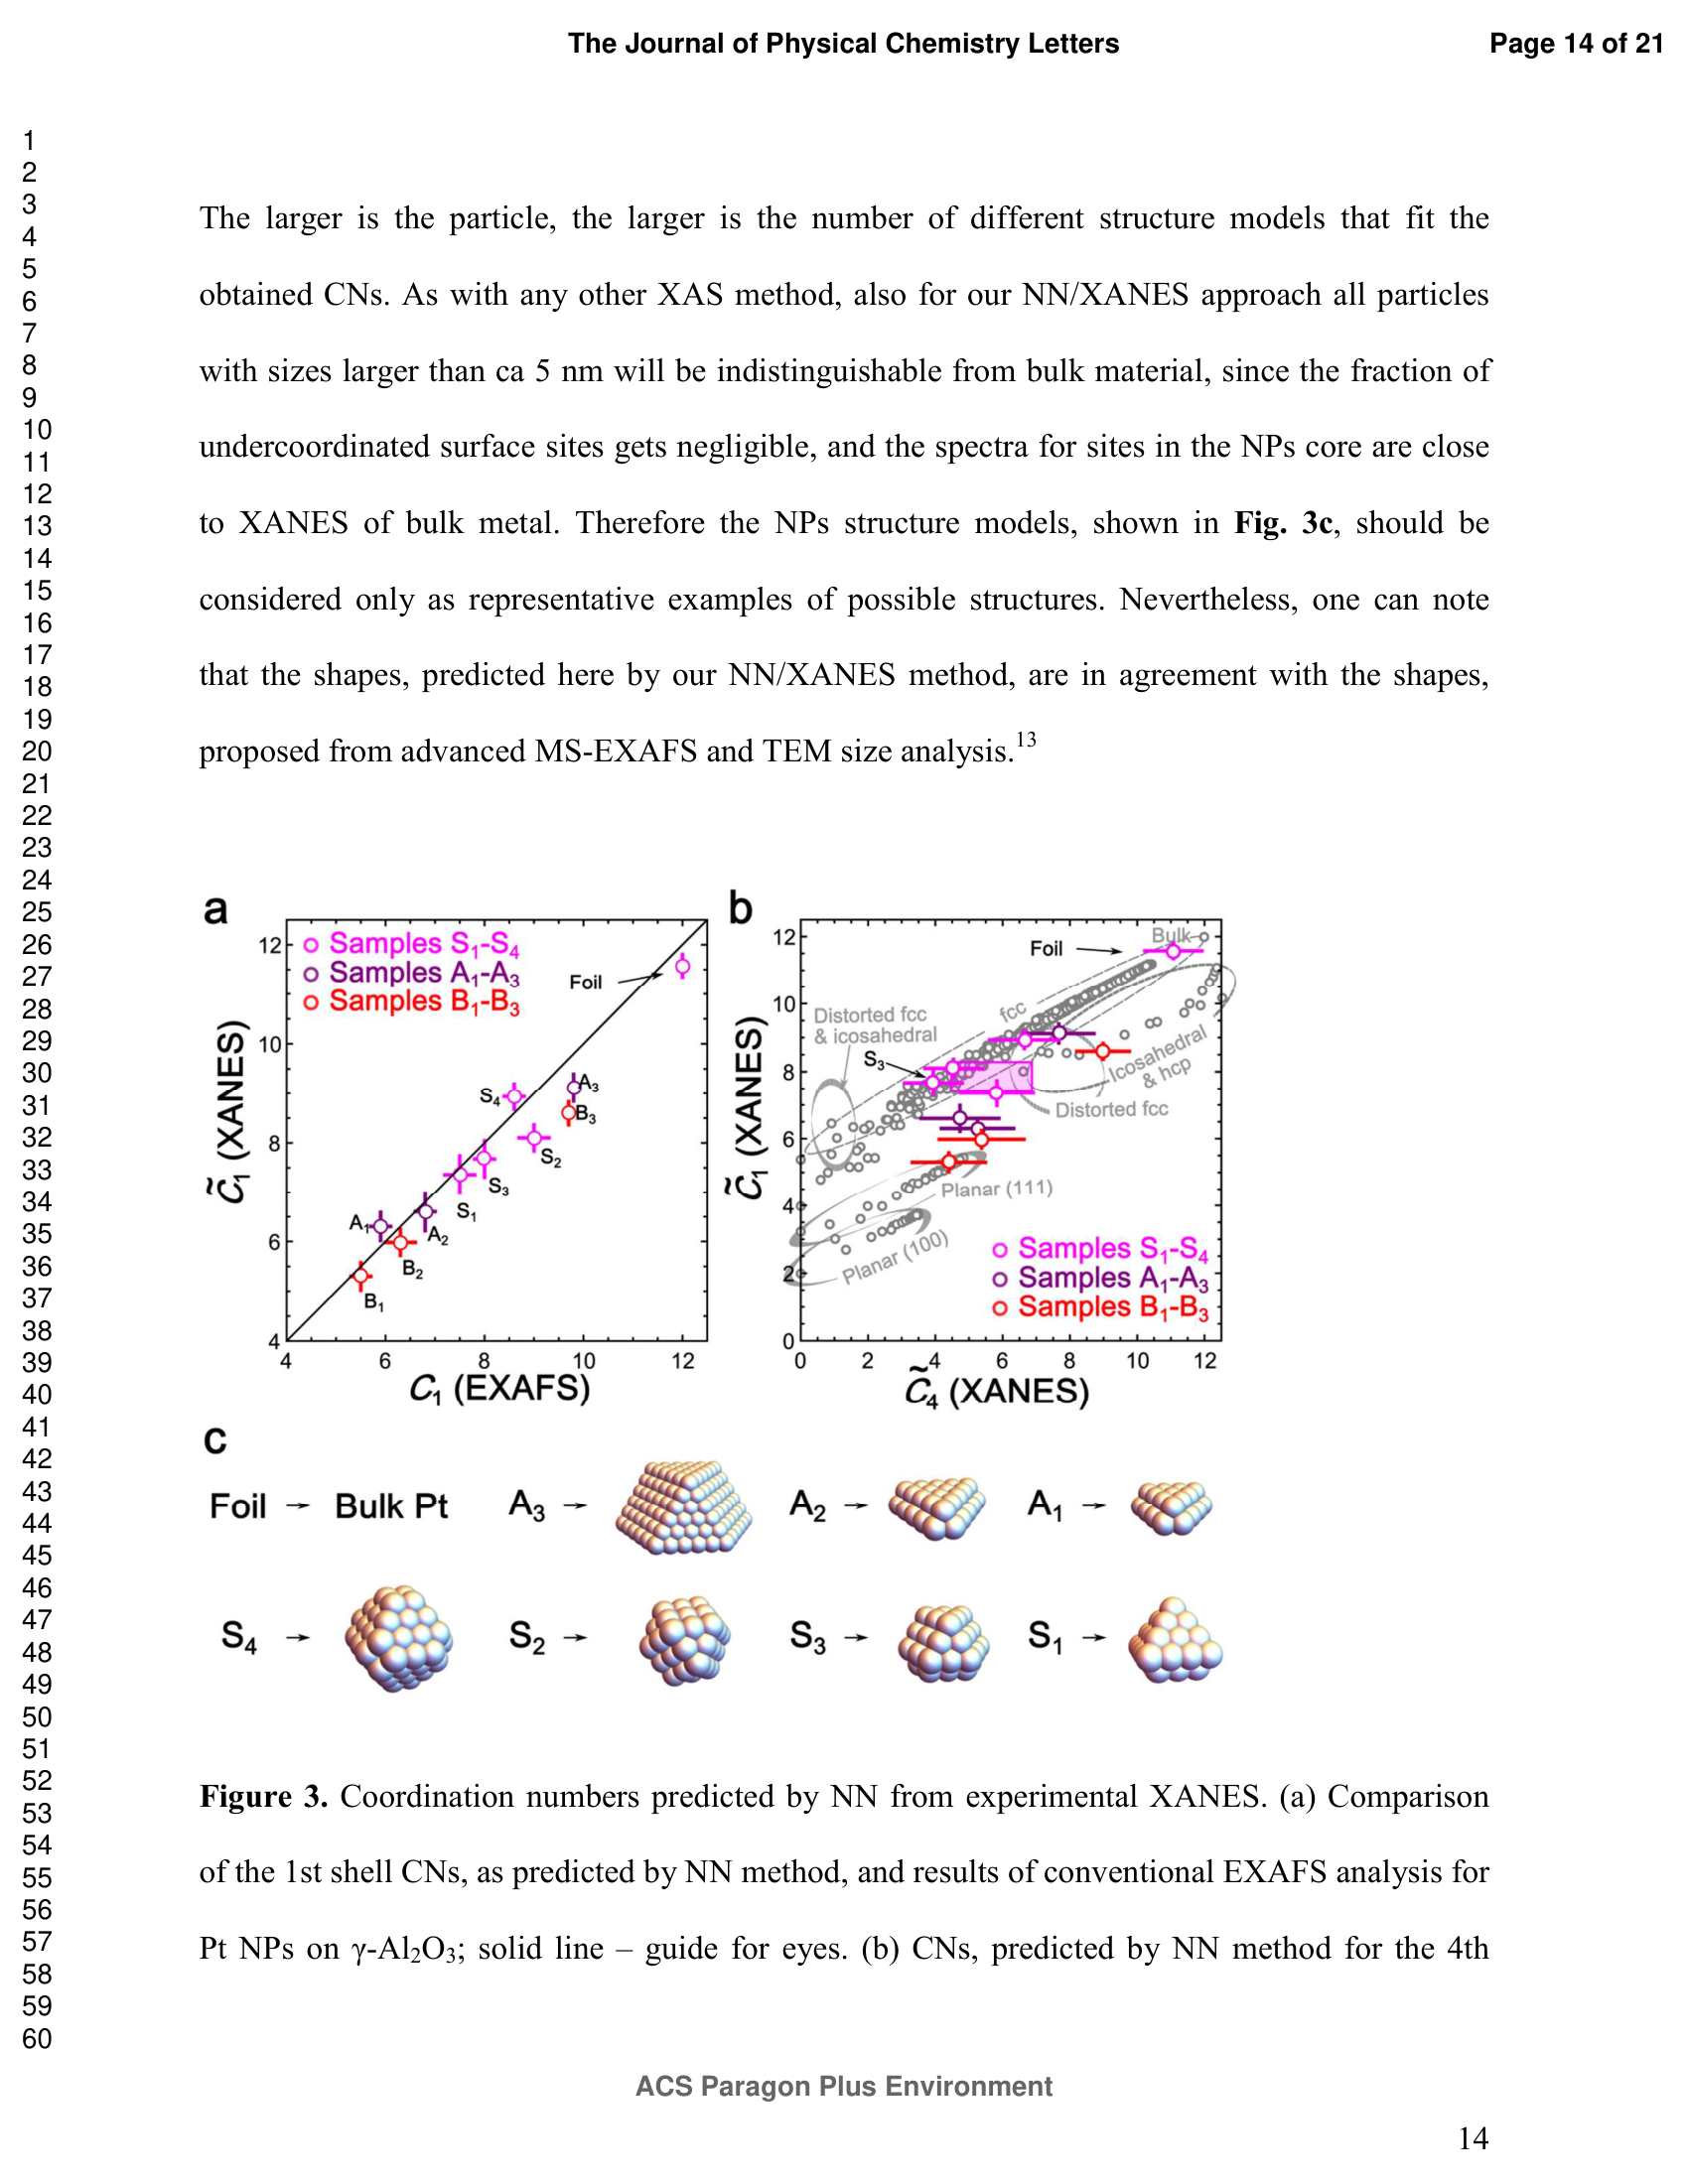
Table 1 (PDF page 16)
Page 13 (PDF page 13)
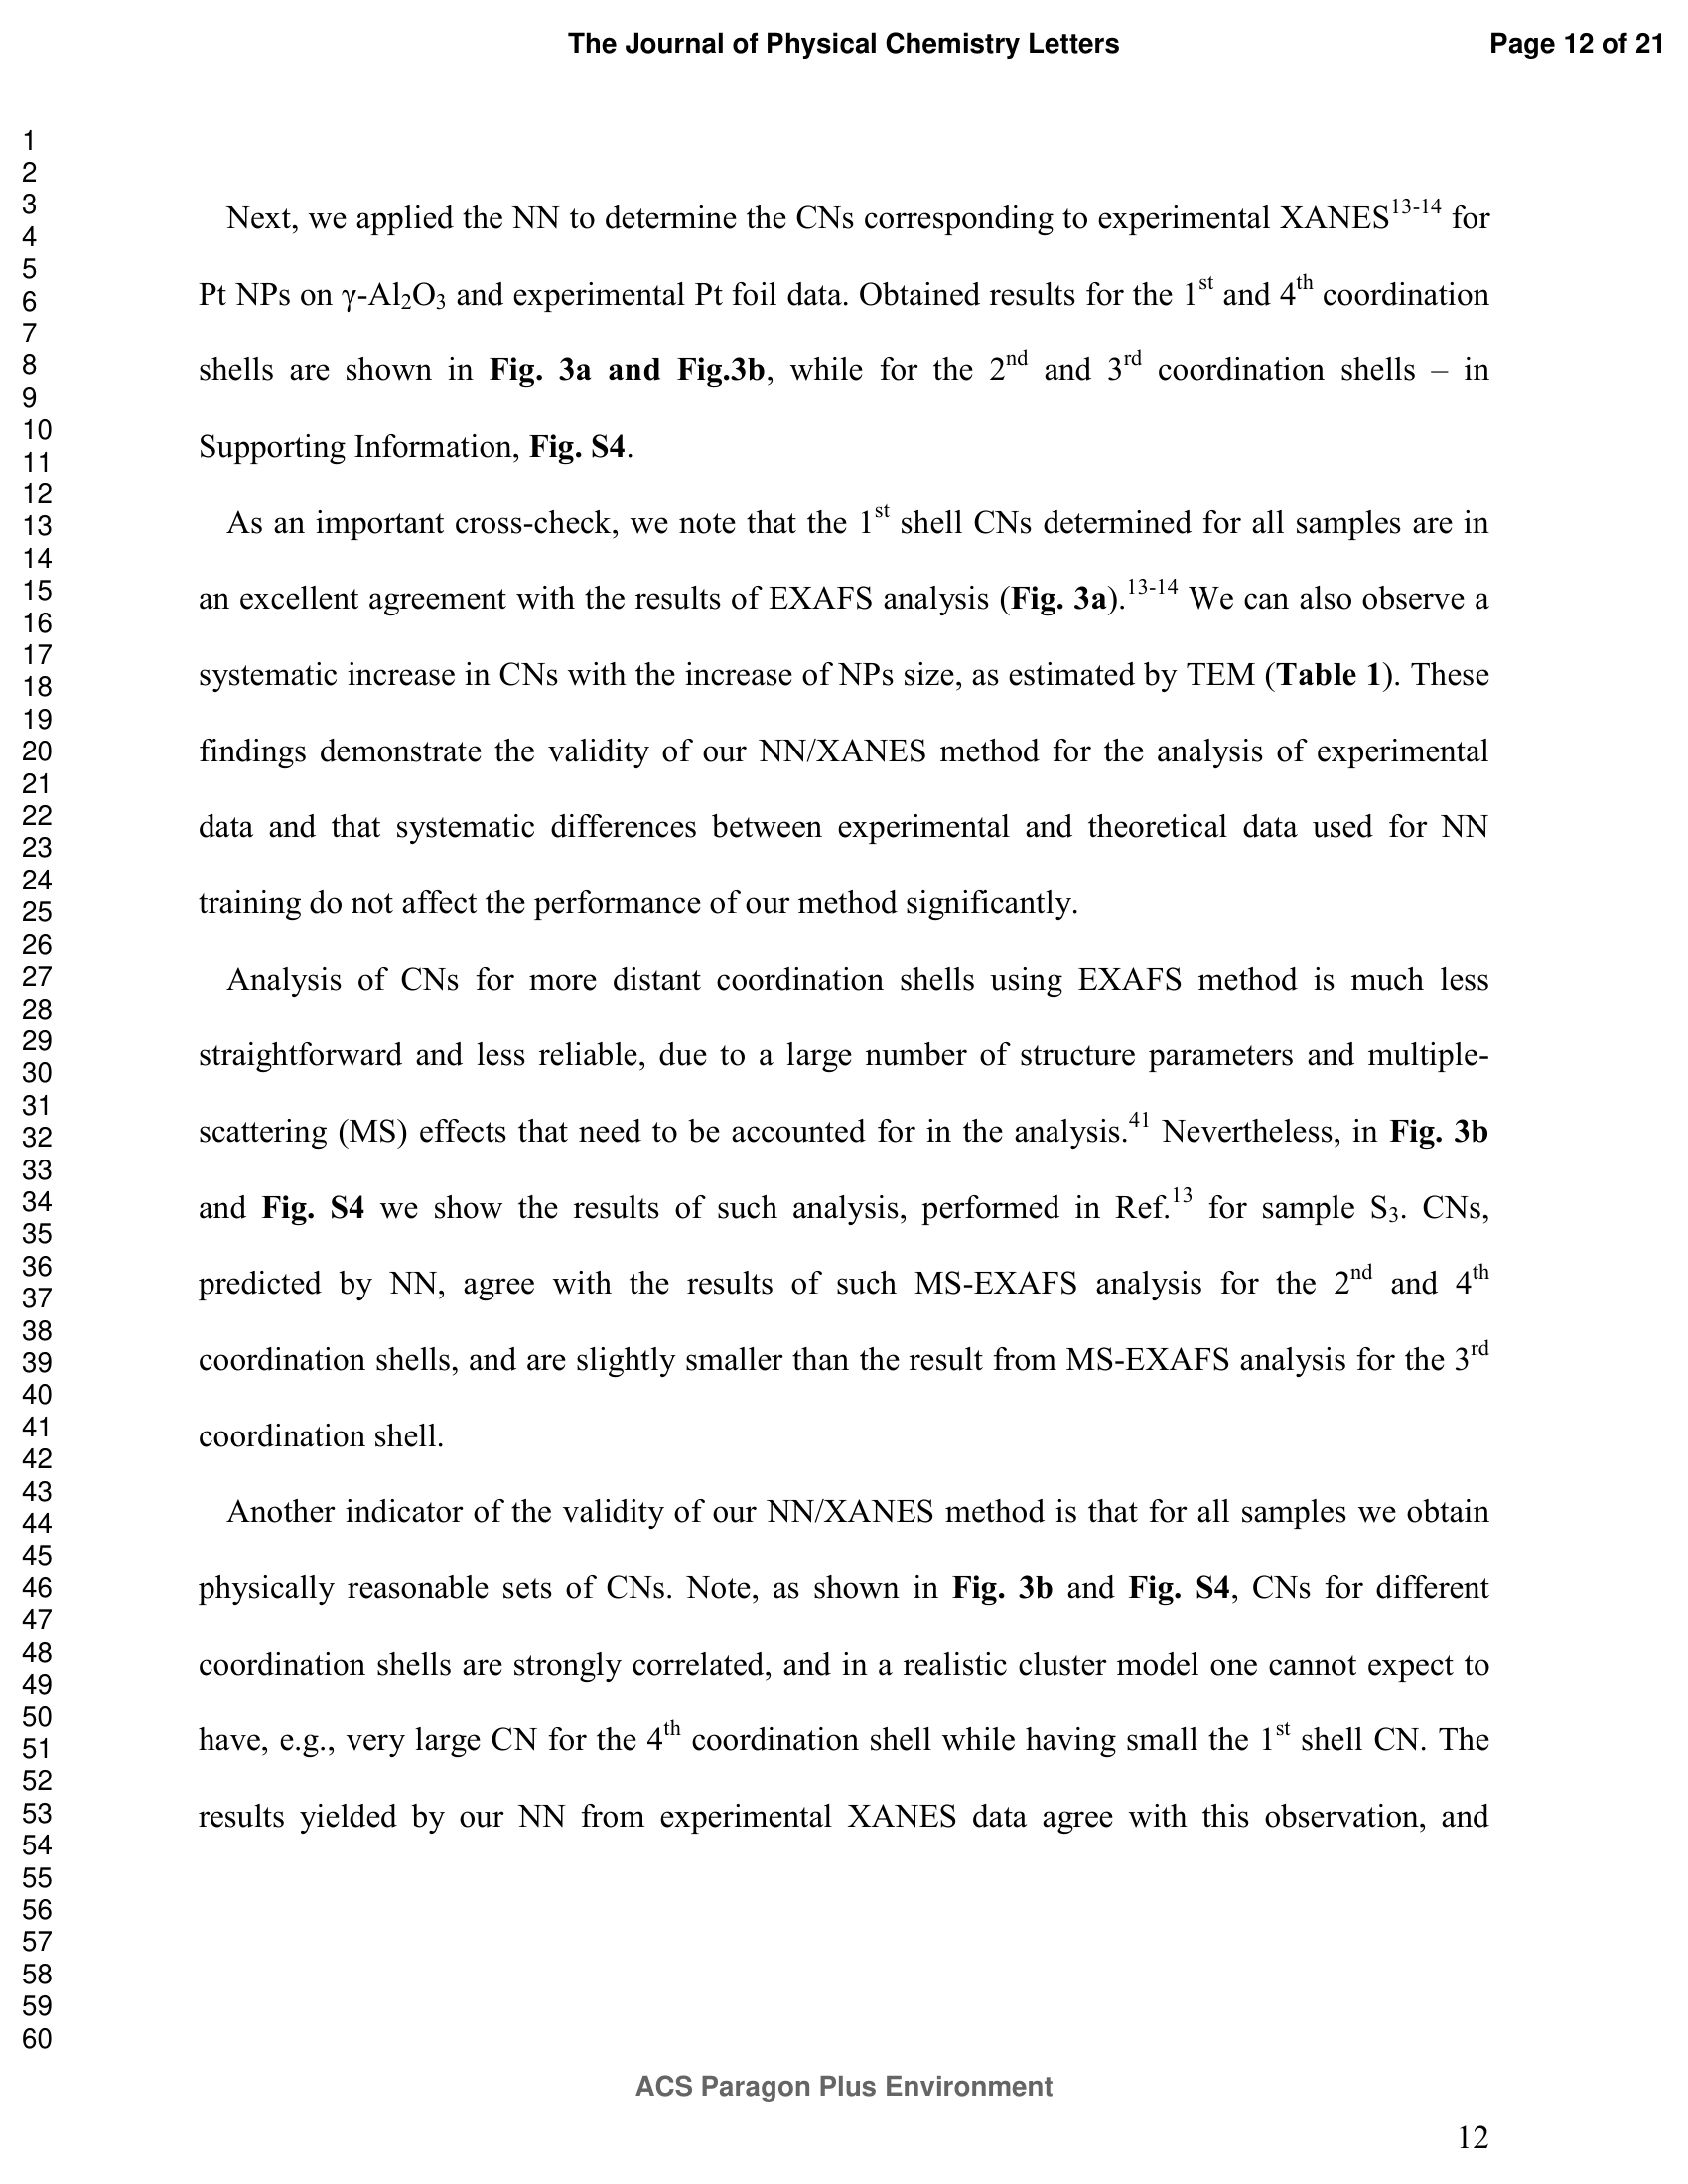
Page 14 (PDF page 14)
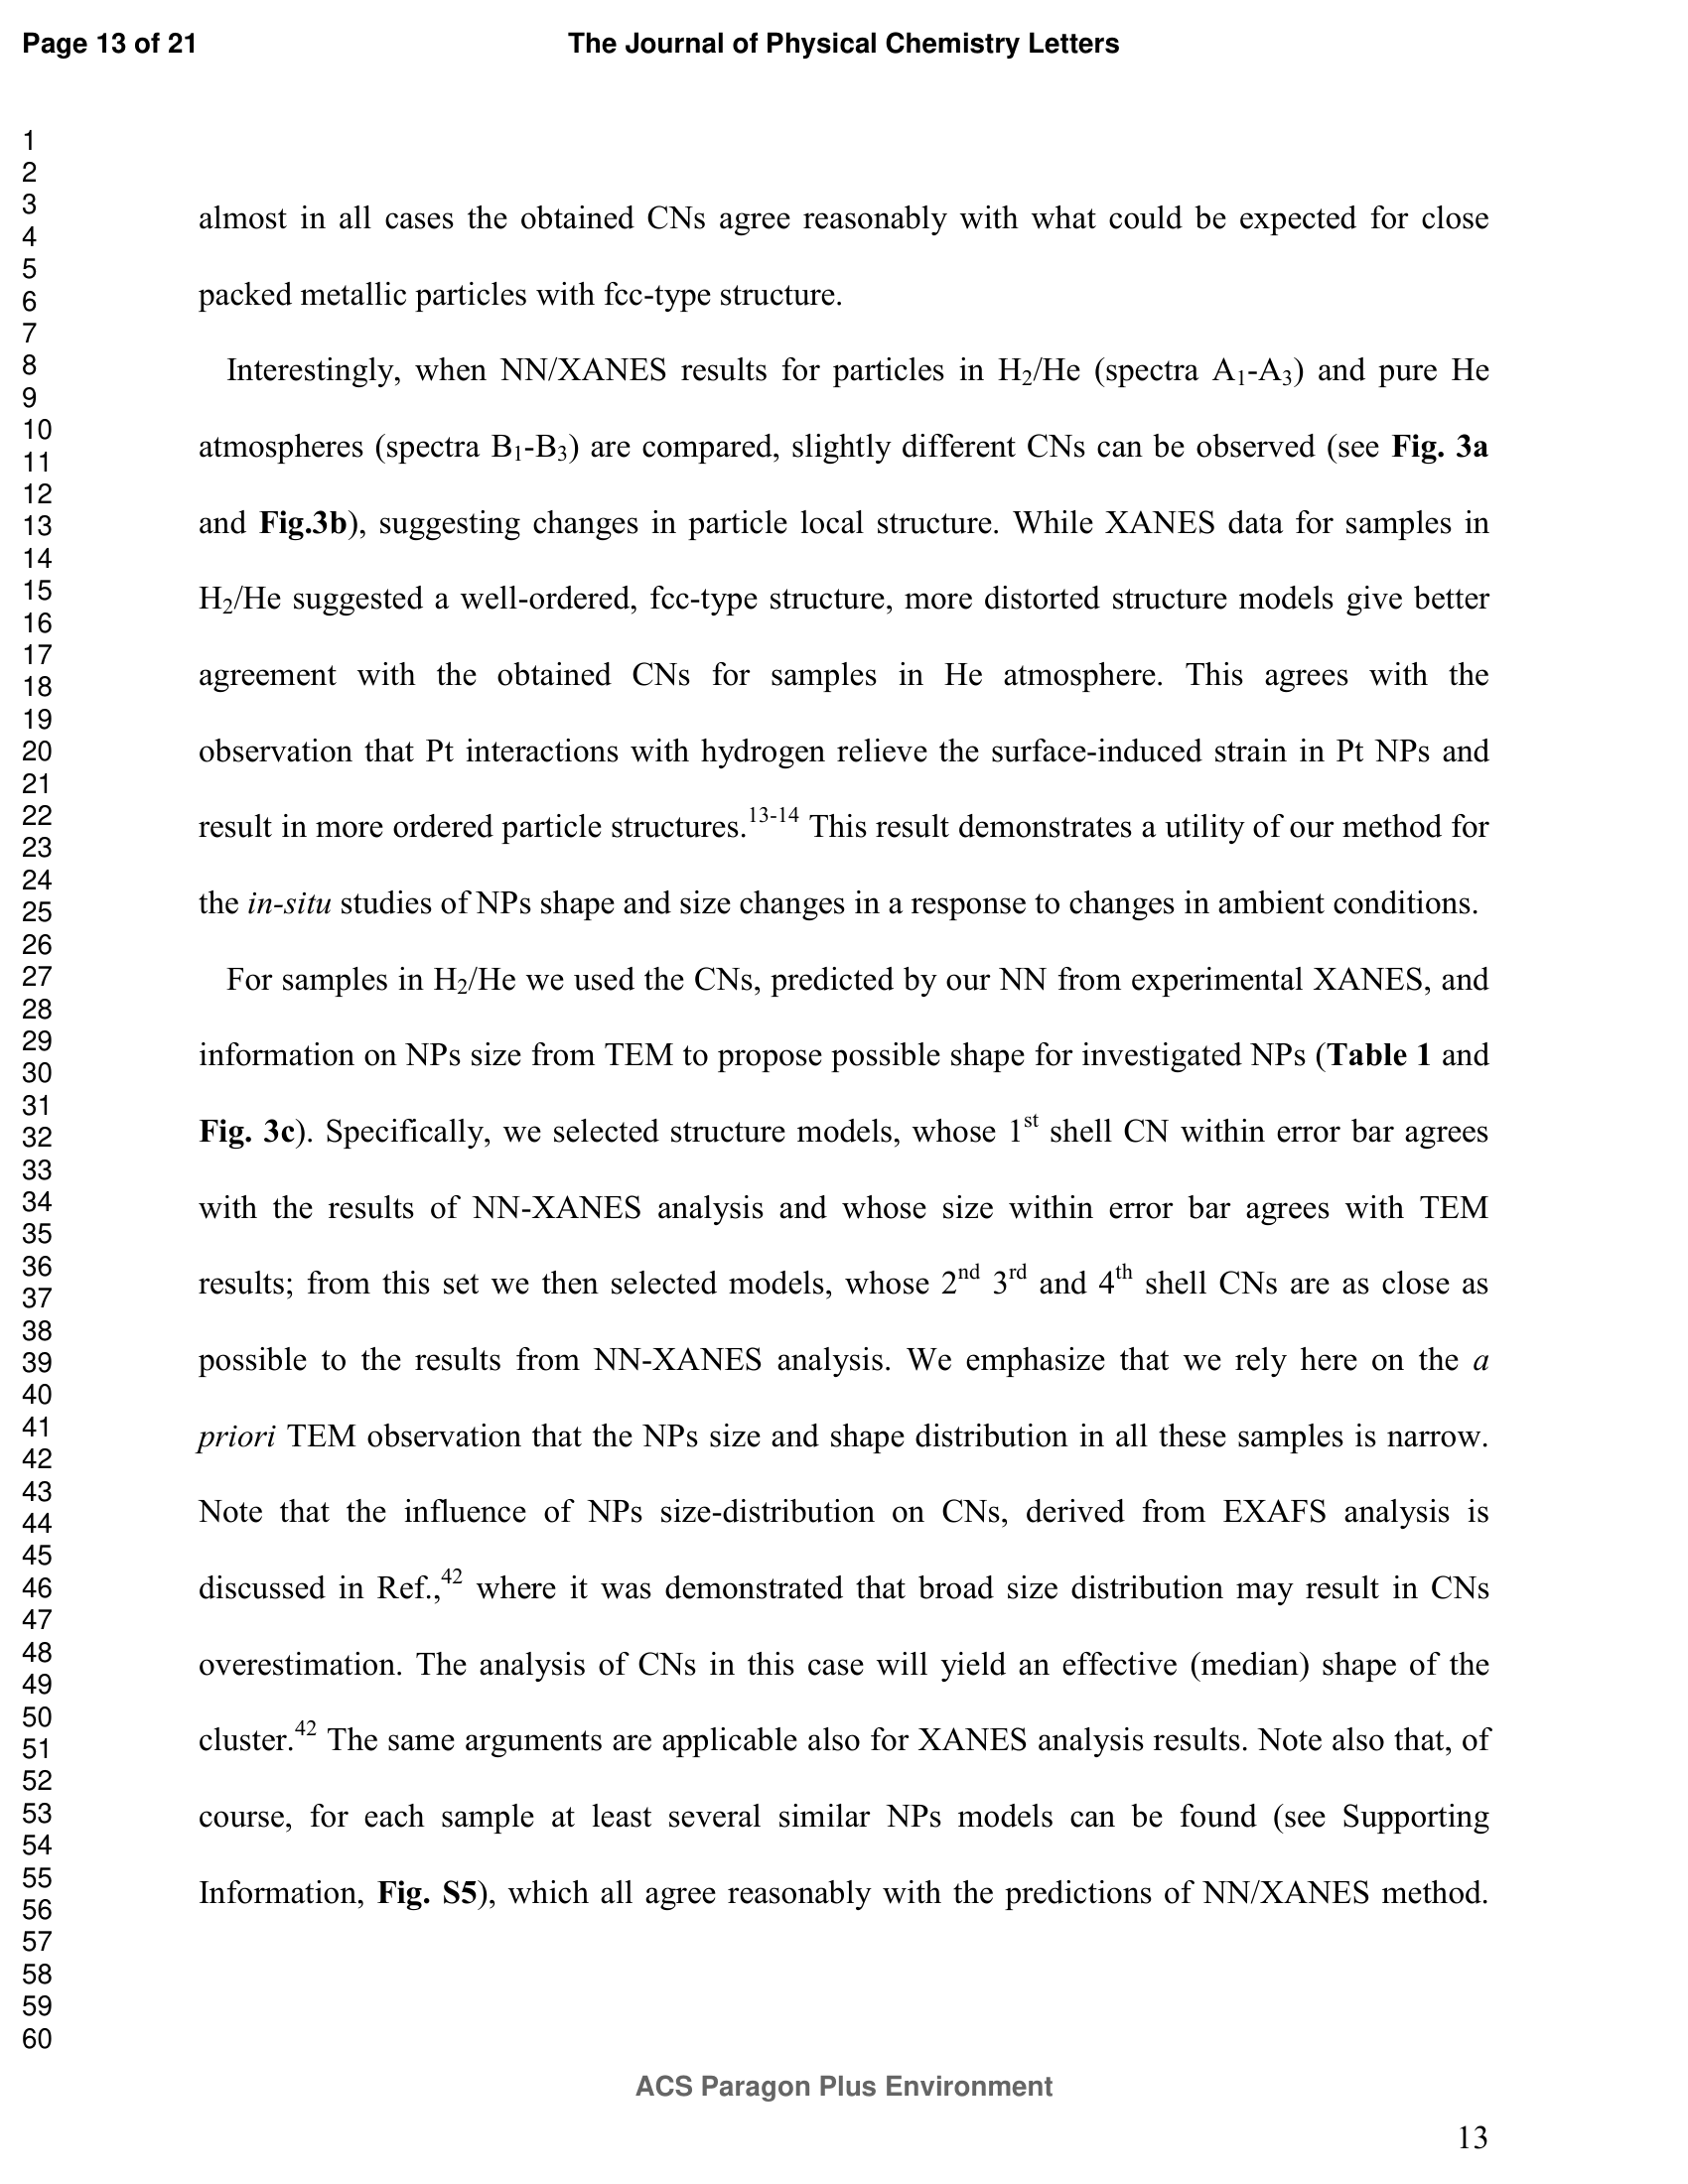
Page 17 (PDF page 17)
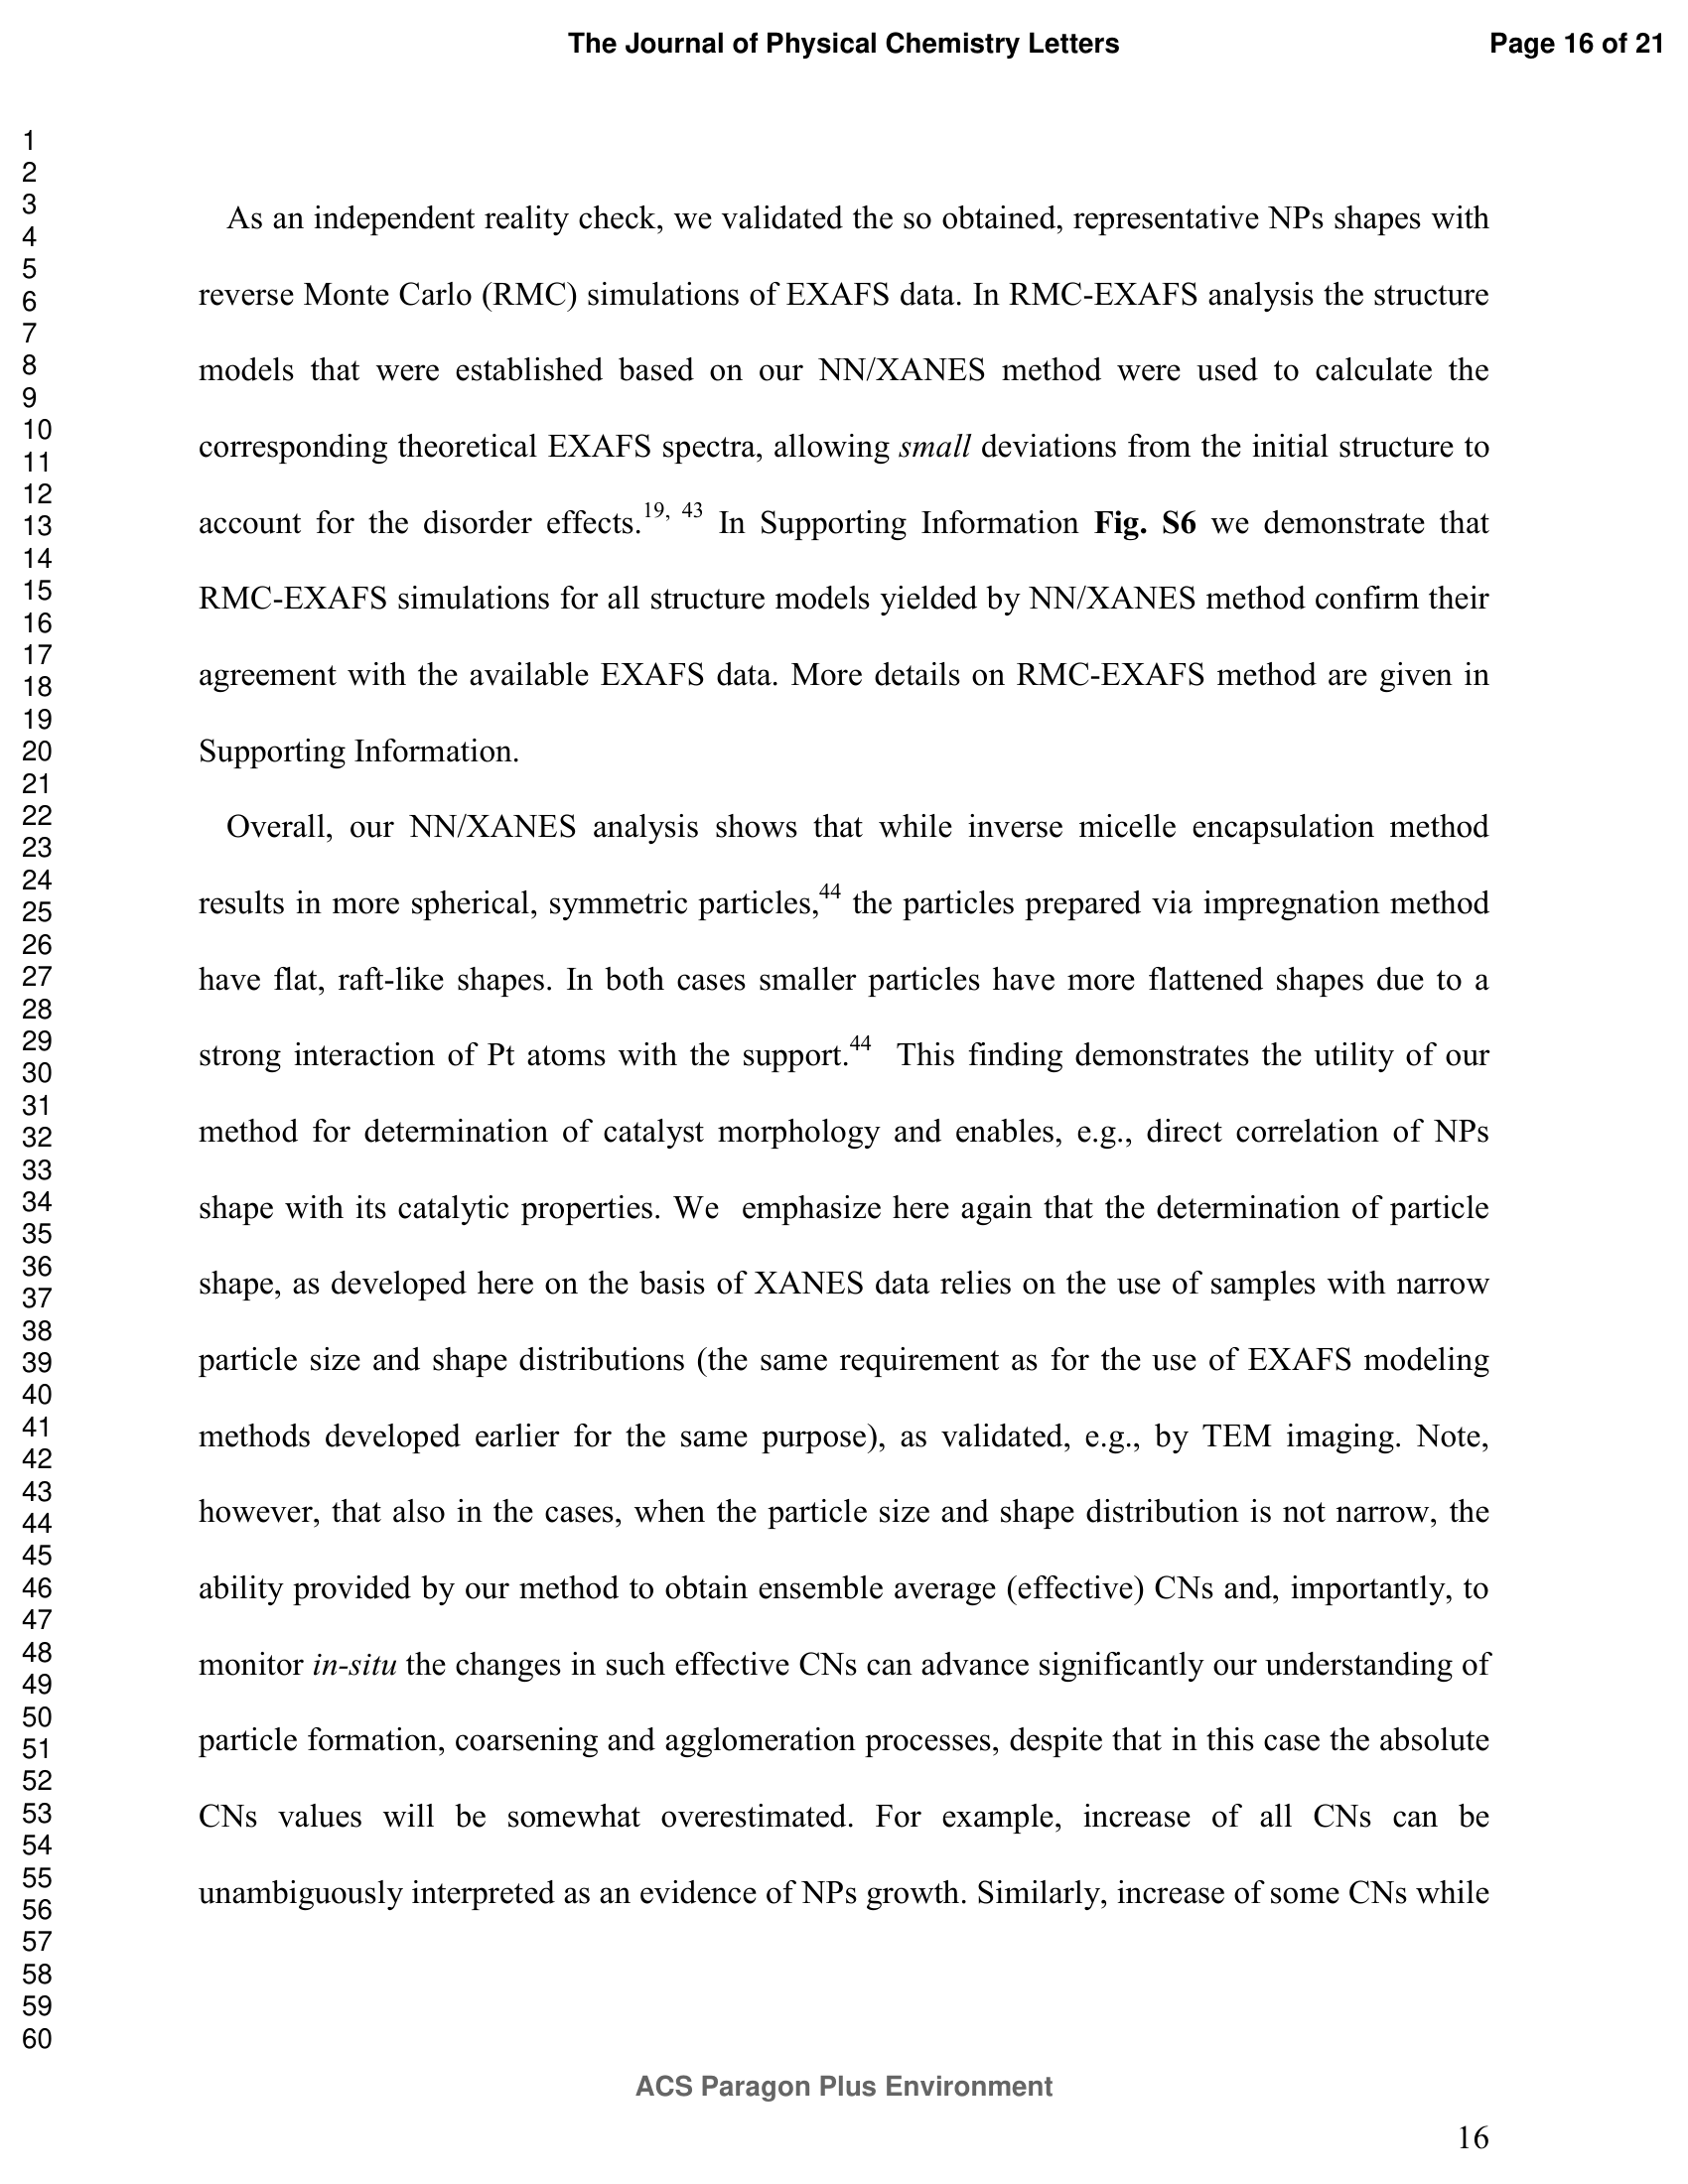
#3
Pt
Pt L
▶
LLM Prompt
Sample Information
Material: Pt
Support: gamma-Al2O3
Reaction Conditions: H2/He atmosphere, room temperature
Sample-Specific Conditions
- synthesis method and size: impregnation, 3 nm
- Pt nanoparticles on alumina
Measurement
We plan to measure the Pt L XANES spectrum of this sample.
Questions
Based on all the information above:
1. What structural morphology dominates this Pt nanoparticle sample prepared via impregnation, and what physical interaction drives this specific shape?
2. How does the specified reaction condition (H2/He atmosphere) affect the local atomic structure of these Pt nanoparticles compared to an inert environment?
3. To extract detailed 3D structural descriptors (such as coordination numbers beyond the first shell) from the XANES spectrum of this sample, what type of reference spectra or basis set is required?
Ground Truth
Material: Pt nanoparticles on gamma-Al2O3
Measurement: Pt L3-edge XANES, in-situ
Fit method: NN inversion
Phase fractions: (±15%)
| Phase | Fraction |
|---|---|
| Flat, raft-like Pt nanoparticle (well-ordered fcc-type, ~2.8 nm) | 1.0 |
Fit basis (paper's reference spectra):
- Theoretical XANES spectra calculated with FEFF and FDMNES for Pt particles of different sizes and shapes
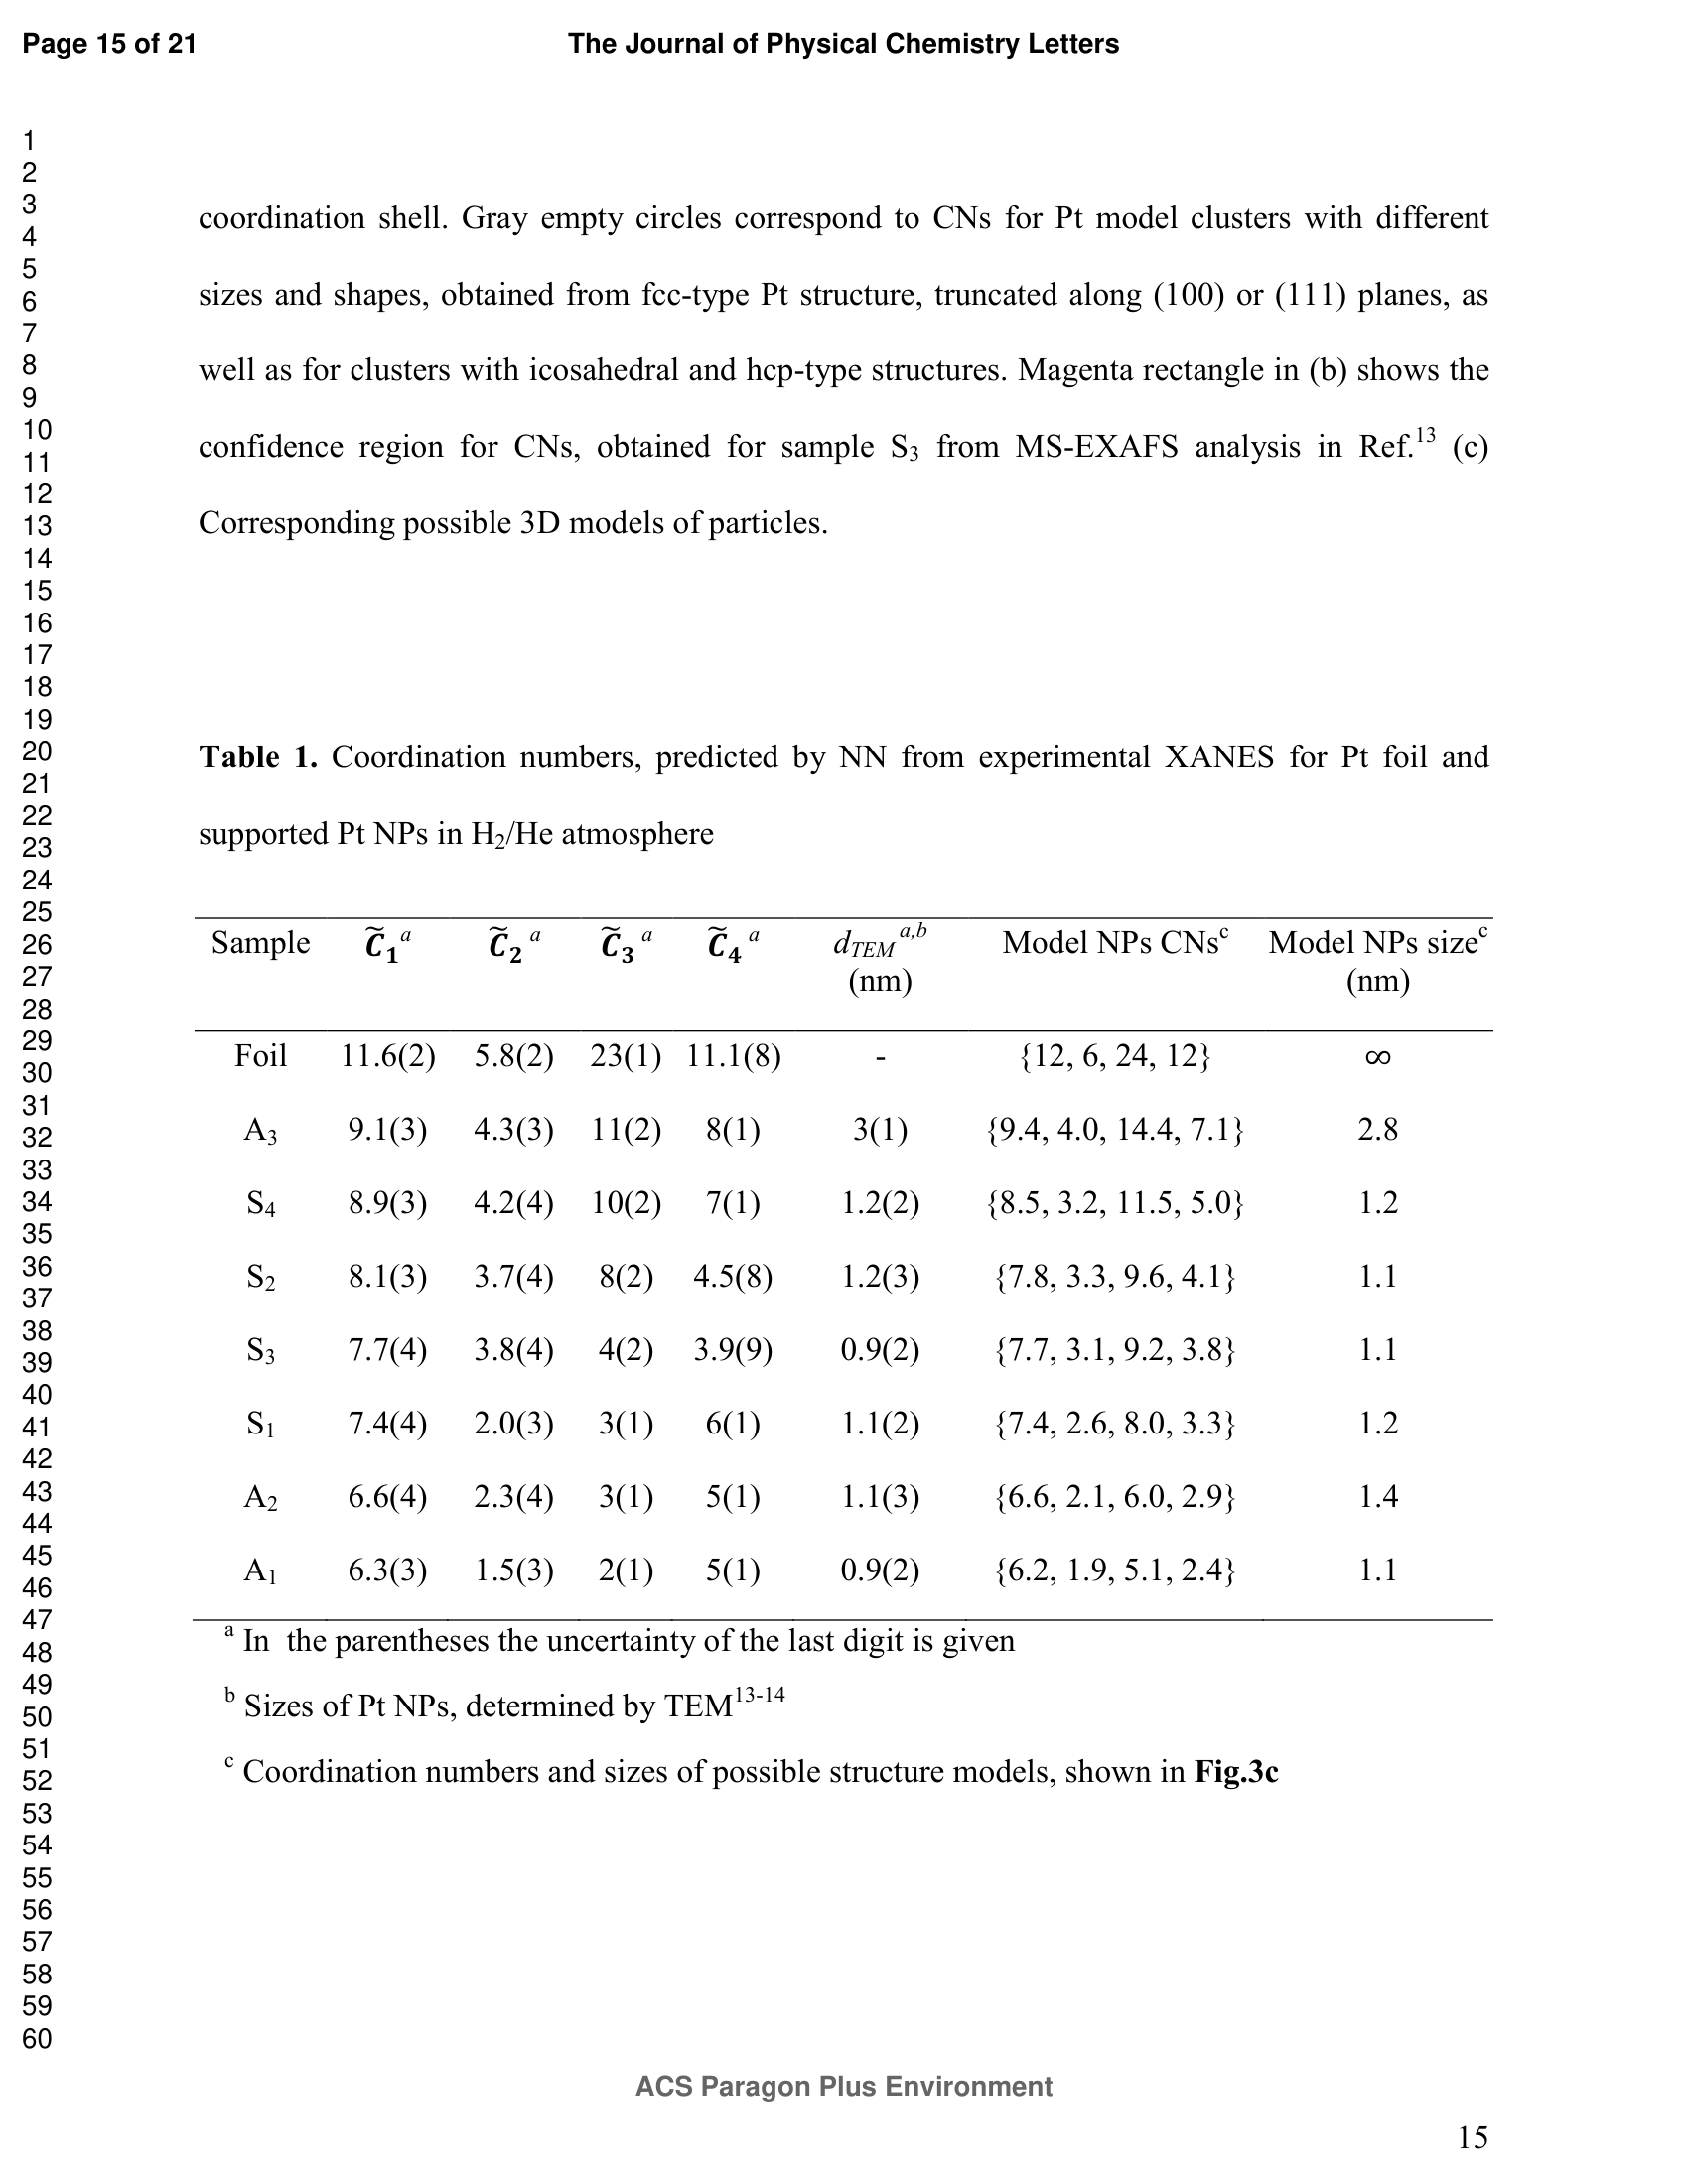
Source evidence: Table 1, Page 15; Page 13, paragraph 2; Page 16, paragraph 2
Key reasoning: Particles prepared via the impregnation method exhibit flat, raft-like shapes due to a strong interaction of Pt atoms with the support. The presence of H2 in the atmosphere results in a well-ordered, fcc-type structure because Pt interactions with hydrogen relieve surface-induced strain that would otherwise distort the particles.
Reasoning source: Page 13, paragraph 2; Page 16, paragraph 2
Scoring Rubric (total: 100 pts)
| Q | Type | Max | Question | Reference Answer | Scoring Criteria |
|---|---|---|---|---|---|
| q1 | reasoning | 40 | What structural morphology dominates this Pt nanoparticle sample prepared via impregnation, and what physical interaction drives this specific shape? | The dominant structural morphology for this sample is flat, raft-like Pt nanoparticles of approximately 2.8 nm in size, which account for 100% of the phase fraction. This specific shape arises directly from the impregnation synthesis method used to deposit the ~3 nm Pt particles onto the gamma-Al2O3 support. Specifically, this preparation method induces a strong physical interaction between the Pt atoms and the alumina support. It is this strong metal-support interaction that drives the particles to spread out and adopt a flat, raft-like configuration rather than forming more spherical structures. | Must identify the shape as flat or raft-like (20 points) and attribute it to strong interactions between the Pt atoms and the alumina support (20 points). |
| q2 | reasoning | 30 | How does the specified reaction condition (H2/He atmosphere) affect the local atomic structure of these Pt nanoparticles compared to an inert environment? | Under the specified H2/He atmosphere at room temperature, the Pt nanoparticles adopt a well-ordered, fcc-type local atomic structure. This structural ordering occurs because the presence of hydrogen gas fundamentally alters the physical state of the ~3 nm Pt particles. Specifically, the interactions between the Pt atoms and hydrogen relieve surface-induced strain that would otherwise distort the particles in a purely inert environment. Consequently, this hydrogen-induced strain relief allows the flat, raft-like nanoparticles to maintain a highly ordered fcc crystalline arrangement. | Must explain that the hydrogen atmosphere promotes a well-ordered, fcc-type structure (15 points) by relieving surface-induced strain in the nanoparticles (15 points). |
| q3 | identification | 30 | To extract detailed 3D structural descriptors (such as coordination numbers beyond the first shell) from the XANES spectrum of this sample, what type of reference spectra or basis set is required? | To extract detailed 3D structural descriptors from the Pt L3-edge XANES spectrum, the required basis set consists of theoretical XANES spectra calculated with FEFF and FDMNES for Pt particles of different sizes and shapes. This theoretical basis is necessary because the sample conditions—specifically the impregnation synthesis and H2/He atmosphere—produce unique ~2.8 nm flat, raft-like nanoparticles with a well-ordered fcc-type structure. Because these specific morphological and strain-relieved features are driven by strong metal-support interactions and hydrogen adsorption, empirical bulk standards are insufficient to capture the local geometry. Instead, theoretical spectra are required to accurately model these distinct nanoscale size and shape effects so they can be extracted via neural network (NN) inversion. | Must state that theoretical or ab-initio XANES spectra calculated for Pt nanoparticles of various sizes and shapes are needed as the basis set. |
Review
#4
Pt
Pt L
▶
LLM Prompt
Sample Information
Material: Pt
Support: gamma-Al2O3
Reaction Conditions: H2/He atmosphere, room temperature
Sample-Specific Conditions
- synthesis method and size: inverse micelle, 1.2 nm
- Pt nanoparticles on alumina
Measurement
We plan to measure the Pt L XANES spectrum of this sample.
Questions
Based on all the information above:
1. Given the synthesis method (inverse micelle encapsulation) and particle size (1.2 nm), what is the expected dominant structural motif or shape of the Pt nanoparticles in this sample?
2. Explain how the inverse micelle preparation method and the H2/He atmosphere influence the 3D structure and ordering of the Pt nanoparticles in this sample.
3. To model the XANES spectrum of this sample and extract 3D structural descriptors, what types of reference structures or basis functions should be included in the theoretical dataset?
Ground Truth
Material: Pt nanoparticles on gamma-Al2O3
Measurement: Pt L3-edge XANES, in-situ
Fit method: NN inversion
Phase fractions: (±15%)
| Phase | Fraction |
|---|---|
| Pt NP model {8.5, 3.2, 11.5, 5.0} (spherical/symmetric) | 1.0 |
Fit basis (paper's reference spectra):
- Theoretical XANES spectra of Pt nanoparticles with various sizes and shapes (fcc-type truncated by (100) and (111) planes, icosahedral, and hcp structures)
Source evidence: Table 1 and page 16
Key reasoning: The inverse micelle encapsulation method tends to produce more spherical, symmetric Pt nanoparticles compared to impregnation methods (which yield flatter, raft-like shapes). For a 1.2 nm particle, the coordination numbers extracted from XANES match a structural model with CNs {8.5, 3.2, 11.5, 5.0}. Furthermore, the H2/He atmosphere relieves surface-induced strain, resulting in a more ordered, fcc-type structure compared to particles in a pure He atmosphere.
Reasoning source: Page 13, 14, 16, and Table 1
Scoring Rubric (total: 100 pts)
| Q | Type | Max | Question | Reference Answer | Scoring Criteria |
|---|---|---|---|---|---|
| q1 | identification | 30 | Given the synthesis method (inverse micelle encapsulation) and particle size (1.2 nm), what is the expected dominant structural motif or shape of the Pt nanoparticles in this sample? | The expected dominant structural motif for this sample is a spherical, symmetric Pt nanoparticle model characterized by coordination numbers {8.5, 3.2, 11.5, 5.0}, which represents 100% of the phase fraction. This specific shape arises because the inverse micelle encapsulation method promotes the formation of highly spherical and symmetric nanoparticles, in contrast to impregnation methods that typically yield flatter, raft-like shapes. For the specific 1.2 nm size of these particles, the extracted coordination numbers perfectly match this symmetric structural model. Furthermore, the room temperature H2/He atmosphere relieves surface-induced strain, stabilizing this ordered, fcc-type structure. | Full credit for identifying spherical/symmetric Pt nanoparticles with an ordered fcc-type structure and matching coordination numbers. |
| q2 | reasoning | 40 | Explain how the inverse micelle preparation method and the H2/He atmosphere influence the 3D structure and ordering of the Pt nanoparticles in this sample. | The inverse micelle preparation method and H2/He atmosphere work synergistically to produce highly ordered, spherical, and symmetric Pt nanoparticles. The inverse micelle encapsulation method specifically drives the formation of spherical and symmetric shapes, avoiding the flatter, raft-like structures that are typically produced by standard impregnation methods. Additionally, the H2/He atmosphere at room temperature plays a critical role by relieving surface-induced strain on the 1.2 nm particles. This strain relief results in a more ordered, fcc-type structure compared to what would form in a pure He atmosphere, ultimately yielding a structural model with coordination numbers {8.5, 3.2, 11.5, 5.0}. | Full credit for explaining that inverse micelle synthesis yields more spherical/symmetric particles (unlike raft-like shapes from impregnation) and that H2 relieves surface-induced strain to produce a well-ordered fcc-type structure. |
| q3 | prediction | 30 | To model the XANES spectrum of this sample and extract 3D structural descriptors, what types of reference structures or basis functions should be included in the theoretical dataset? | To model the XANES spectrum using neural network inversion, the theoretical dataset must include basis functions of Pt nanoparticles with various sizes and shapes, specifically fcc-type structures truncated by (100) and (111) planes, icosahedral, and hcp structures. These specific reference structures are required because the 1.2 nm Pt nanoparticles synthesized via inverse micelle encapsulation form spherical, symmetric structures that must be accurately matched against diverse theoretical geometries. Because the H2/He atmosphere at room temperature relieves surface strain to produce an ordered, fcc-type structure, the basis set must encompass these ordered fcc-type models to successfully identify the correct structural match. Including this comprehensive theoretical basis allows the model to accurately extract the final 3D structural descriptors, specifically the coordination numbers {8.5, 3.2, 11.5, 5.0}. | Full credit for mentioning theoretical XANES spectra of Pt nanoparticles with various sizes and shapes, including fcc-type (truncated by (100) and (111) planes), icosahedral, and hcp structures. |
Review
#5
Pt
Pt L
▶
LLM Prompt
Sample Information
Material: Pt
Support: gamma-Al2O3
Reaction Conditions: H2/He atmosphere, room temperature
Sample-Specific Conditions
- synthesis method and size: inverse micelle, 0.9 nm
- Pt nanoparticles on alumina
Measurement
We plan to measure the Pt L XANES spectrum of this sample.
Questions
Based on all the information above:
1. Based on the synthesis method (inverse micelle encapsulation) and the reaction conditions (H2/He atmosphere), what is the expected 3D structural shape and ordering of these 0.9 nm Pt nanoparticles, and what physical effect does the atmosphere have on the structure?
2. What is the expected approximate first-shell coordination number (CN1) for this 0.9 nm Pt nanoparticle sample, and what structural characteristic of the nanoparticle does this value indicate?
3. To extract 3D structural descriptors (such as coordination numbers up to the 4th shell) from the XANES spectrum of this sample, what specific type of reference spectra or basis functions must be utilized?
Ground Truth
Material: Pt nanoparticles on gamma-Al2O3
Measurement: Pt L3-edge XANES, in-situ
Fit method: NN inversion
Phase fractions: (±15%)
| Phase | Fraction |
|---|---|
| Pt NP model {7.7, 3.1, 9.2, 3.8} | 1.0 |
Fit basis (paper's reference spectra):
- Theoretical XANES spectra calculated for Pt particles of different sizes and shapes using FEFF and FDMNES codes
Source evidence: Table 1, Figure 3c, and text on pages 14 and 17
Key reasoning: The sample S3 consists of very small (0.9 nm) Pt nanoparticles prepared by inverse micelle encapsulation. XANES analysis yields low coordination numbers (CN1=7.7, CN2=3.8, CN3=4, CN4=3.9), which is consistent with a highly undercoordinated, spherical, and symmetric particle model characteristic of this synthesis method. Furthermore, the H2/He atmosphere relieves surface-induced strain, resulting in a more ordered, fcc-type structure compared to particles measured in a pure He atmosphere.
Reasoning source: Page 14 (discussion of H2/He vs He atmosphere effects on structure) and Page 17 (discussion of inverse micelle vs impregnation shapes)
Scoring Rubric (total: 100 pts)
| Q | Type | Max | Question | Reference Answer | Scoring Criteria |
|---|---|---|---|---|---|
| q1 | reasoning | 40 | Based on the synthesis method (inverse micelle encapsulation) and the reaction conditions (H2/He atmosphere), what is the expected 3D structural shape and ordering of these 0.9 nm Pt nanoparticles, and what physical effect does the atmosphere have on the structure? | The 0.9 nm Pt nanoparticles synthesized via inverse micelle encapsulation are expected to have a highly undercoordinated, spherical, and symmetric 3D structural shape. Because the sample is measured in an H2/He atmosphere at room temperature, the hydrogen acts to relieve surface-induced strain on the nanoparticles. This strain relief results in a more ordered, fcc-type structure compared to particles measured in a pure He atmosphere. The specific synthesis method dictates the symmetric, spherical morphology, while the H2/He environment directly modifies the structural ordering by relaxing the surface tension of these ultra-small particles. | The answer must state that the particles are expected to be spherical/symmetric (due to the inverse micelle method) and have an ordered fcc-type structure because the hydrogen in the atmosphere relieves surface-induced strain. |
| q2 | prediction | 30 | What is the expected approximate first-shell coordination number (CN1) for this 0.9 nm Pt nanoparticle sample, and what structural characteristic of the nanoparticle does this value indicate? | The expected approximate first-shell coordination number (CN1) for this sample is 7.7. This low coordination number indicates that the 0.9 nm Pt nanoparticles are highly undercoordinated, which is characteristic of a spherical and symmetric particle model. This specific value arises because the inverse micelle synthesis method produces ultra-small (0.9 nm) particles with a high surface-to-volume ratio, inherently reducing the average number of nearest neighbors. Furthermore, the H2/He atmosphere relieves surface-induced strain, allowing the particles to maintain this ordered, fcc-type spherical structure without severe distortion. | The answer must predict a CN1 value of approximately 7.7 (or < 8) and explain that this low coordination number indicates a highly undercoordinated structure dominated by surface sites due to the extremely small particle size. |
| q3 | identification | 30 | To extract 3D structural descriptors (such as coordination numbers up to the 4th shell) from the XANES spectrum of this sample, what specific type of reference spectra or basis functions must be utilized? | To extract 3D structural descriptors from the XANES spectrum, the analysis must utilize a basis of theoretical XANES spectra calculated for Pt particles of different sizes and shapes using FEFF and FDMNES codes. These theoretical reference spectra are necessary because the sample consists of ultra-small (0.9 nm) Pt nanoparticles synthesized via inverse micelle encapsulation, which exhibit unique, highly undercoordinated spherical structures that cannot be accurately represented by bulk reference foils. By applying a neural network (NN) inversion method to these theoretical models, the specific coordination numbers up to the 4th shell (such as CN1=7.7 and CN2=3.8) can be accurately extracted. The H2/He atmosphere ensures the particles adopt a more ordered, fcc-type structure, making these theoretical fcc-based calculations a valid basis for fitting the experimental data. | The answer must specify that theoretical or ab-initio XANES spectra calculated for Pt particles of various sizes and shapes (e.g., using FEFF or FDMNES) are required as the basis. |
Review
#6
Pt
Pt L
▶
LLM Prompt
Sample Information
Material: Pt
Support: gamma-Al2O3
Reaction Conditions: H2/He atmosphere, room temperature
Sample-Specific Conditions
- synthesis method and size: inverse micelle, 1.1 nm
- Pt nanoparticles on alumina
Measurement
We plan to measure the Pt L XANES spectrum of this sample.
Questions
Based on all the information above:
1. Given the sample conditions (1.1 nm Pt nanoparticles synthesized via inverse micelle encapsulation, measured in H2/He), what is the expected dominant structural phase or motif, and what are its approximate coordination characteristics?
2. To model the XANES spectrum of this sample and extract its 3D structure beyond the first coordination shell, what type of reference spectra or basis functions must be included in the analysis?
3. Discuss how the specific synthesis method (inverse micelle) and the reaction atmosphere (H2/He) physically influence the expected 3D structure and coordination environment of the Pt nanoparticles in this sample.
Ground Truth
Material: Pt nanoparticles on gamma-Al2O3
Measurement: Pt L3-edge XANES, in-situ
Fit method: NN inversion
Phase fractions: (±15%)
| Phase | Fraction |
|---|---|
| Pt NP model {7.4, 2.6, 8.0, 3.3} | 1.0 |
Fit basis (paper's reference spectra):
- theoretical XANES spectra calculated for Pt nanoparticles of different sizes and shapes
Source evidence: Table 1, page 16
Key reasoning: The sample S1 was prepared via the inverse micelle encapsulation method, which results in more spherical, symmetric particles compared to impregnation methods. In a H2/He atmosphere, interactions with hydrogen relieve surface-induced strain, leading to a well-ordered fcc-type structure. The small particle size (1.1 nm) corresponds to a high fraction of undercoordinated surface sites, reflected in the predicted coordination numbers {7.4, 2.6, 8.0, 3.3} for the first four shells.
Reasoning source: Page 14 (discussion on H2/He atmosphere) and Page 17 (discussion on synthesis method effects)
Scoring Rubric (total: 100 pts)
| Q | Type | Max | Question | Reference Answer | Scoring Criteria |
|---|---|---|---|---|---|
| q1 | identification | 30 | Given the sample conditions (1.1 nm Pt nanoparticles synthesized via inverse micelle encapsulation, measured in H2/He), what is the expected dominant structural phase or motif, and what are its approximate coordination characteristics? | The expected dominant structural phase is a well-ordered fcc-type Pt nanoparticle model with coordination numbers of {7.4, 2.6, 8.0, 3.3} for the first four shells, representing 100% of the sample. This specific structure arises because the inverse micelle synthesis method produces highly spherical and symmetric particles. Furthermore, the ultra-small 1.1 nm particle size results in a high fraction of undercoordinated surface sites, which dictates these specific low coordination numbers. Finally, the H2/He atmosphere allows hydrogen interactions to relieve surface-induced strain, stabilizing this well-ordered fcc-type structure at room temperature. | Full points for identifying a small, spherical, well-ordered fcc-type Pt nanoparticle model with a significantly reduced first-shell coordination number (around 7.4) due to the high fraction of surface sites. |
| q2 | identification | 30 | To model the XANES spectrum of this sample and extract its 3D structure beyond the first coordination shell, what type of reference spectra or basis functions must be included in the analysis? | To model this spectrum using NN inversion, the analysis must include a basis of theoretical XANES spectra calculated for Pt nanoparticles of various sizes and shapes. These theoretical references are required because the sample consists of ultra-small 1.1 nm Pt nanoparticles, which possess a high fraction of undercoordinated surface sites that cannot be accurately represented by bulk standards. The inverse micelle synthesis yields spherical, symmetric particles, while the H2/He atmosphere relieves surface strain to form a well-ordered fcc-type structure. Therefore, using a diverse theoretical basis allows the extraction of the specific {7.4, 2.6, 8.0, 3.3} coordination environment that uniquely matches the physical realities of these sample conditions. | Full points for stating that theoretical/ab-initio XANES spectra calculated for Pt nanoparticles of various sizes and shapes are required as the basis. |
| q3 | reasoning | 40 | Discuss how the specific synthesis method (inverse micelle) and the reaction atmosphere (H2/He) physically influence the expected 3D structure and coordination environment of the Pt nanoparticles in this sample. | The inverse micelle encapsulation method directly influences the 3D structure by producing highly spherical and symmetric Pt nanoparticles compared to standard impregnation techniques. Because these particles are only 1.1 nm in size, they inherently possess a high fraction of undercoordinated surface sites, leading to a specific coordination environment of {7.4, 2.6, 8.0, 3.3} for the first four shells. Additionally, the H2/He reaction atmosphere plays a critical role by facilitating interactions between the Pt surface and hydrogen gas. This interaction relieves surface-induced strain, ultimately allowing the nanoparticles to adopt a well-ordered fcc-type structure at room temperature. | Full points for explaining that the inverse micelle method yields more spherical and symmetric particles (unlike the raft-like shapes from impregnation), and that the H2/He atmosphere allows hydrogen to relieve surface-induced strain, promoting a more ordered fcc-type structure. |
Review
#7
Pt
Pt L
▶
LLM Prompt
Sample Information
Material: Pt
Support: gamma-Al2O3
Reaction Conditions: H2/He atmosphere, room temperature
Sample-Specific Conditions
- synthesis method and size: impregnation, 1.1 nm
- Pt nanoparticles on alumina
Measurement
We plan to measure the Pt L XANES spectrum of this sample.
Questions
Based on all the information above:
1. Based on the synthesis method (impregnation) and the 1.1 nm size, what specific structural motif or phase dominates this Pt nanoparticle sample, and what physical interactions drive the formation of this structure?
2. To determine the 3D structure of these 1.1 nm Pt nanoparticles from their XANES spectrum, what kind of reference spectra or basis set is necessary, given that bulk metal references are insufficient for capturing size and shape effects?
Ground Truth
Material: Pt nanoparticles on gamma-Al2O3
Measurement: Pt L3-edge XANES, in-situ
Fit method: NN inversion
Phase fractions: (±15%)
| Phase | Fraction |
|---|---|
| Pt NP model {6.6, 2.1, 6.0, 2.9} | 1.0 |
Fit basis (paper's reference spectra):
- Theoretical XANES spectra calculated with FEFF and FDMNES for Pt particles of different sizes and shapes
Source evidence: Table 1 and Page 16
Key reasoning: Sample A2 was prepared via the impregnation method, which results in flat, raft-like nanoparticle shapes due to strong interactions between the Pt atoms and the gamma-Al2O3 support. The XANES analysis yields a specific set of coordination numbers (e.g., first shell CN ~6.6) that correspond to this flattened structural motif. This contrasts with other synthesis methods like inverse micelle encapsulation, which produce more spherical, symmetric particles.
Reasoning source: Page 16, paragraph 3; Table 1
Scoring Rubric (total: 100 pts)
| Q | Type | Max | Question | Reference Answer | Scoring Criteria |
|---|---|---|---|---|---|
| q1 | reasoning | 57 | Based on the synthesis method (impregnation) and the 1.1 nm size, what specific structural motif or phase dominates this Pt nanoparticle sample, and what physical interactions drive the formation of this structure? | The sample is dominated by a flat, raft-like Pt nanoparticle structural motif, specifically represented by a Pt NP model with coordination numbers {6.6, 2.1, 6.0, 2.9} at a fraction of 1.0. This specific structure arises because the 1.1 nm nanoparticles were synthesized using the impregnation method on a gamma-Al2O3 support. During this synthesis, strong interactions between the Pt atoms and the alumina support drive the particles to adopt a flattened shape rather than a symmetric, spherical one. Consequently, the XANES analysis yields a distinct set of coordination numbers, such as a first shell coordination number of ~6.6, which is characteristic of this strongly interacting, raft-like morphology. | The answer must identify that the sample consists of flat, raft-like Pt nanoparticles (or specify the corresponding low-coordination number model) and explain that this flattened shape is driven by strong interactions between the Pt atoms and the alumina support. |
| q2 | identification | 43 | To determine the 3D structure of these 1.1 nm Pt nanoparticles from their XANES spectrum, what kind of reference spectra or basis set is necessary, given that bulk metal references are insufficient for capturing size and shape effects? | To determine the 3D structure of these nanoparticles, the necessary basis set consists of theoretical XANES spectra calculated with FEFF and FDMNES for Pt particles of various sizes and shapes. This specific theoretical basis is required because the sample consists of 1.1 nm Pt nanoparticles synthesized via impregnation, which form flat, raft-like structures due to strong interactions with the gamma-Al2O3 support. Bulk references cannot capture the unique electronic and structural properties of these highly dispersed, flattened particles. By using a diverse theoretical basis set, the neural network inversion method can accurately identify the specific Pt NP model {6.6, 2.1, 6.0, 2.9} that corresponds to the unique coordination environment (e.g., first shell CN ~6.6) produced by these synthesis conditions. | The answer must state that theoretical or ab-initio XANES spectra calculated for Pt nanoparticles of various sizes and shapes (e.g., fcc, icosahedral, hcp) are required as the basis. |
Review
#8
Pt
Pt L
▶
LLM Prompt
Sample Information
Material: Pt
Support: gamma-Al2O3
Reaction Conditions: H2/He atmosphere, room temperature
Sample-Specific Conditions
- synthesis method and size: impregnation, 0.9 nm
- Pt nanoparticles on alumina
Measurement
We plan to measure the Pt L XANES spectrum of this sample.
Questions
Based on all the information above:
1. Given the synthesis method (impregnation) and the extremely small particle size (0.9 nm) on the gamma-Al2O3 support, what specific structural morphology dominates this sample, and what physical interaction drives the formation of this shape?
2. To accurately model the XANES spectrum of this sample using a theoretical approach, what types of structural models should be included in the basis set to capture the possible geometries?
3. How does the expected coordination environment (e.g., the first-shell coordination number) of this sample reflect its specific morphology compared to bulk Pt?
Ground Truth
Material: Pt nanoparticles on gamma-Al2O3
Measurement: Pt L3-edge XANES, in-situ (H2/He atmosphere, room temperature)
Fit method: Neural Network (NN) inversion to coordination numbers
Phase fractions: (±15%)
| Phase | Fraction |
|---|---|
| Flat, raft-like Pt NP model (CNs ~ {6.2, 1.9, 5.1, 2.4}) | 1.0 |
Fit basis (paper's reference spectra):
- Theoretical XANES spectra of Pt clusters with different sizes and shapes (fcc-type truncated by (100) and (111) planes, icosahedral, and hcp structures)
Source evidence: Table 1, Figure 3c, and text on page 16-17
Key reasoning: The sample consists of very small (0.9 nm) Pt nanoparticles prepared via the impregnation method. Due to the strong interaction of Pt atoms with the gamma-Al2O3 support, these particles adopt flat, raft-like shapes rather than symmetric spherical structures. This morphology is characterized by a highly undercoordinated environment (e.g., first shell CN ~ 6.3) that matches flattened cluster models.
Reasoning source: Page 16, paragraph 3 (Page 17 of PDF)
Scoring Rubric (total: 100 pts)
| Q | Type | Max | Question | Reference Answer | Scoring Criteria |
|---|---|---|---|---|---|
| q1 | reasoning | 40 | Given the synthesis method (impregnation) and the extremely small particle size (0.9 nm) on the gamma-Al2O3 support, what specific structural morphology dominates this sample, and what physical interaction drives the formation of this shape? | The sample is dominated entirely (1.0 fraction) by a flat, raft-like Pt nanoparticle morphology. This specific shape arises because the Pt nanoparticles are extremely small (0.9 nm) and synthesized via impregnation on a gamma-Al2O3 support. At this sub-nanometer scale, the strong physical interaction between the Pt atoms and the gamma-Al2O3 support overcomes the tendency of the metal to form symmetric spherical structures. Consequently, the particles flatten out to maximize contact with the support, resulting in this highly undercoordinated, raft-like geometry. | Full credit if the answer identifies a flat or raft-like morphology and attributes it to the strong interaction between the Pt atoms and the support. |
| q2 | identification | 30 | To accurately model the XANES spectrum of this sample using a theoretical approach, what types of structural models should be included in the basis set to capture the possible geometries? | To accurately model the XANES spectrum, the basis set must include theoretical XANES spectra of Pt clusters with various sizes and shapes, specifically fcc-type structures truncated by (100) and (111) planes, as well as icosahedral and hcp structures. These diverse models are required because the sample consists of extremely small 0.9 nm Pt nanoparticles synthesized via impregnation on a gamma-Al2O3 support. Under these specific conditions, the strong interaction between the Pt atoms and the support drives the formation of flat, raft-like shapes rather than standard symmetric spheres. Including this wide range of theoretical cluster geometries allows the Neural Network inversion method to accurately capture the highly undercoordinated environment characteristic of this flattened morphology. | Full credit if the answer mentions theoretical spectra of Pt clusters with various sizes and shapes, specifically noting fcc-type (truncated), icosahedral, and/or hcp structures. |
| q3 | reasoning | 30 | How does the expected coordination environment (e.g., the first-shell coordination number) of this sample reflect its specific morphology compared to bulk Pt? | The sample exhibits a highly undercoordinated environment, characterized by a first-shell coordination number (CN) of approximately 6.2 to 6.3, alongside higher shell CNs of ~ {1.9, 5.1, 2.4}. This low coordination directly reflects the flat, raft-like morphology of the Pt nanoparticles, which contrasts sharply with the higher coordination found in bulk or symmetric spherical Pt. This specific geometry and resulting low coordination occur because the extremely small 0.9 nm particles, prepared via impregnation, experience a strong interaction with the gamma-Al2O3 support. Instead of forming fully coordinated three-dimensional structures, the Pt atoms spread out over the support, resulting in the flattened cluster models and the observed low coordination numbers. | Full credit if the answer explains that the sample will have a significantly reduced coordination number (e.g., ~6.3) compared to bulk Pt (12) due to the high fraction of undercoordinated surface sites in the flat, raft-like nanoclusters. |
Review
Ultrathin Amorphous Titania on Nanowires: Optimization of Conformal Growth and Elucidation of Atomic-Scale Motifs
Original-17
Thin Film
Danhua Yan et al.
DOI: 10.1021/acs.nanolett.8b04888
2 scenarios
PDF
▶
Key Paper Evidence5a, 5b, p.11, p.13, p.14, p.16▶
Figure 5a (PDF page 14)
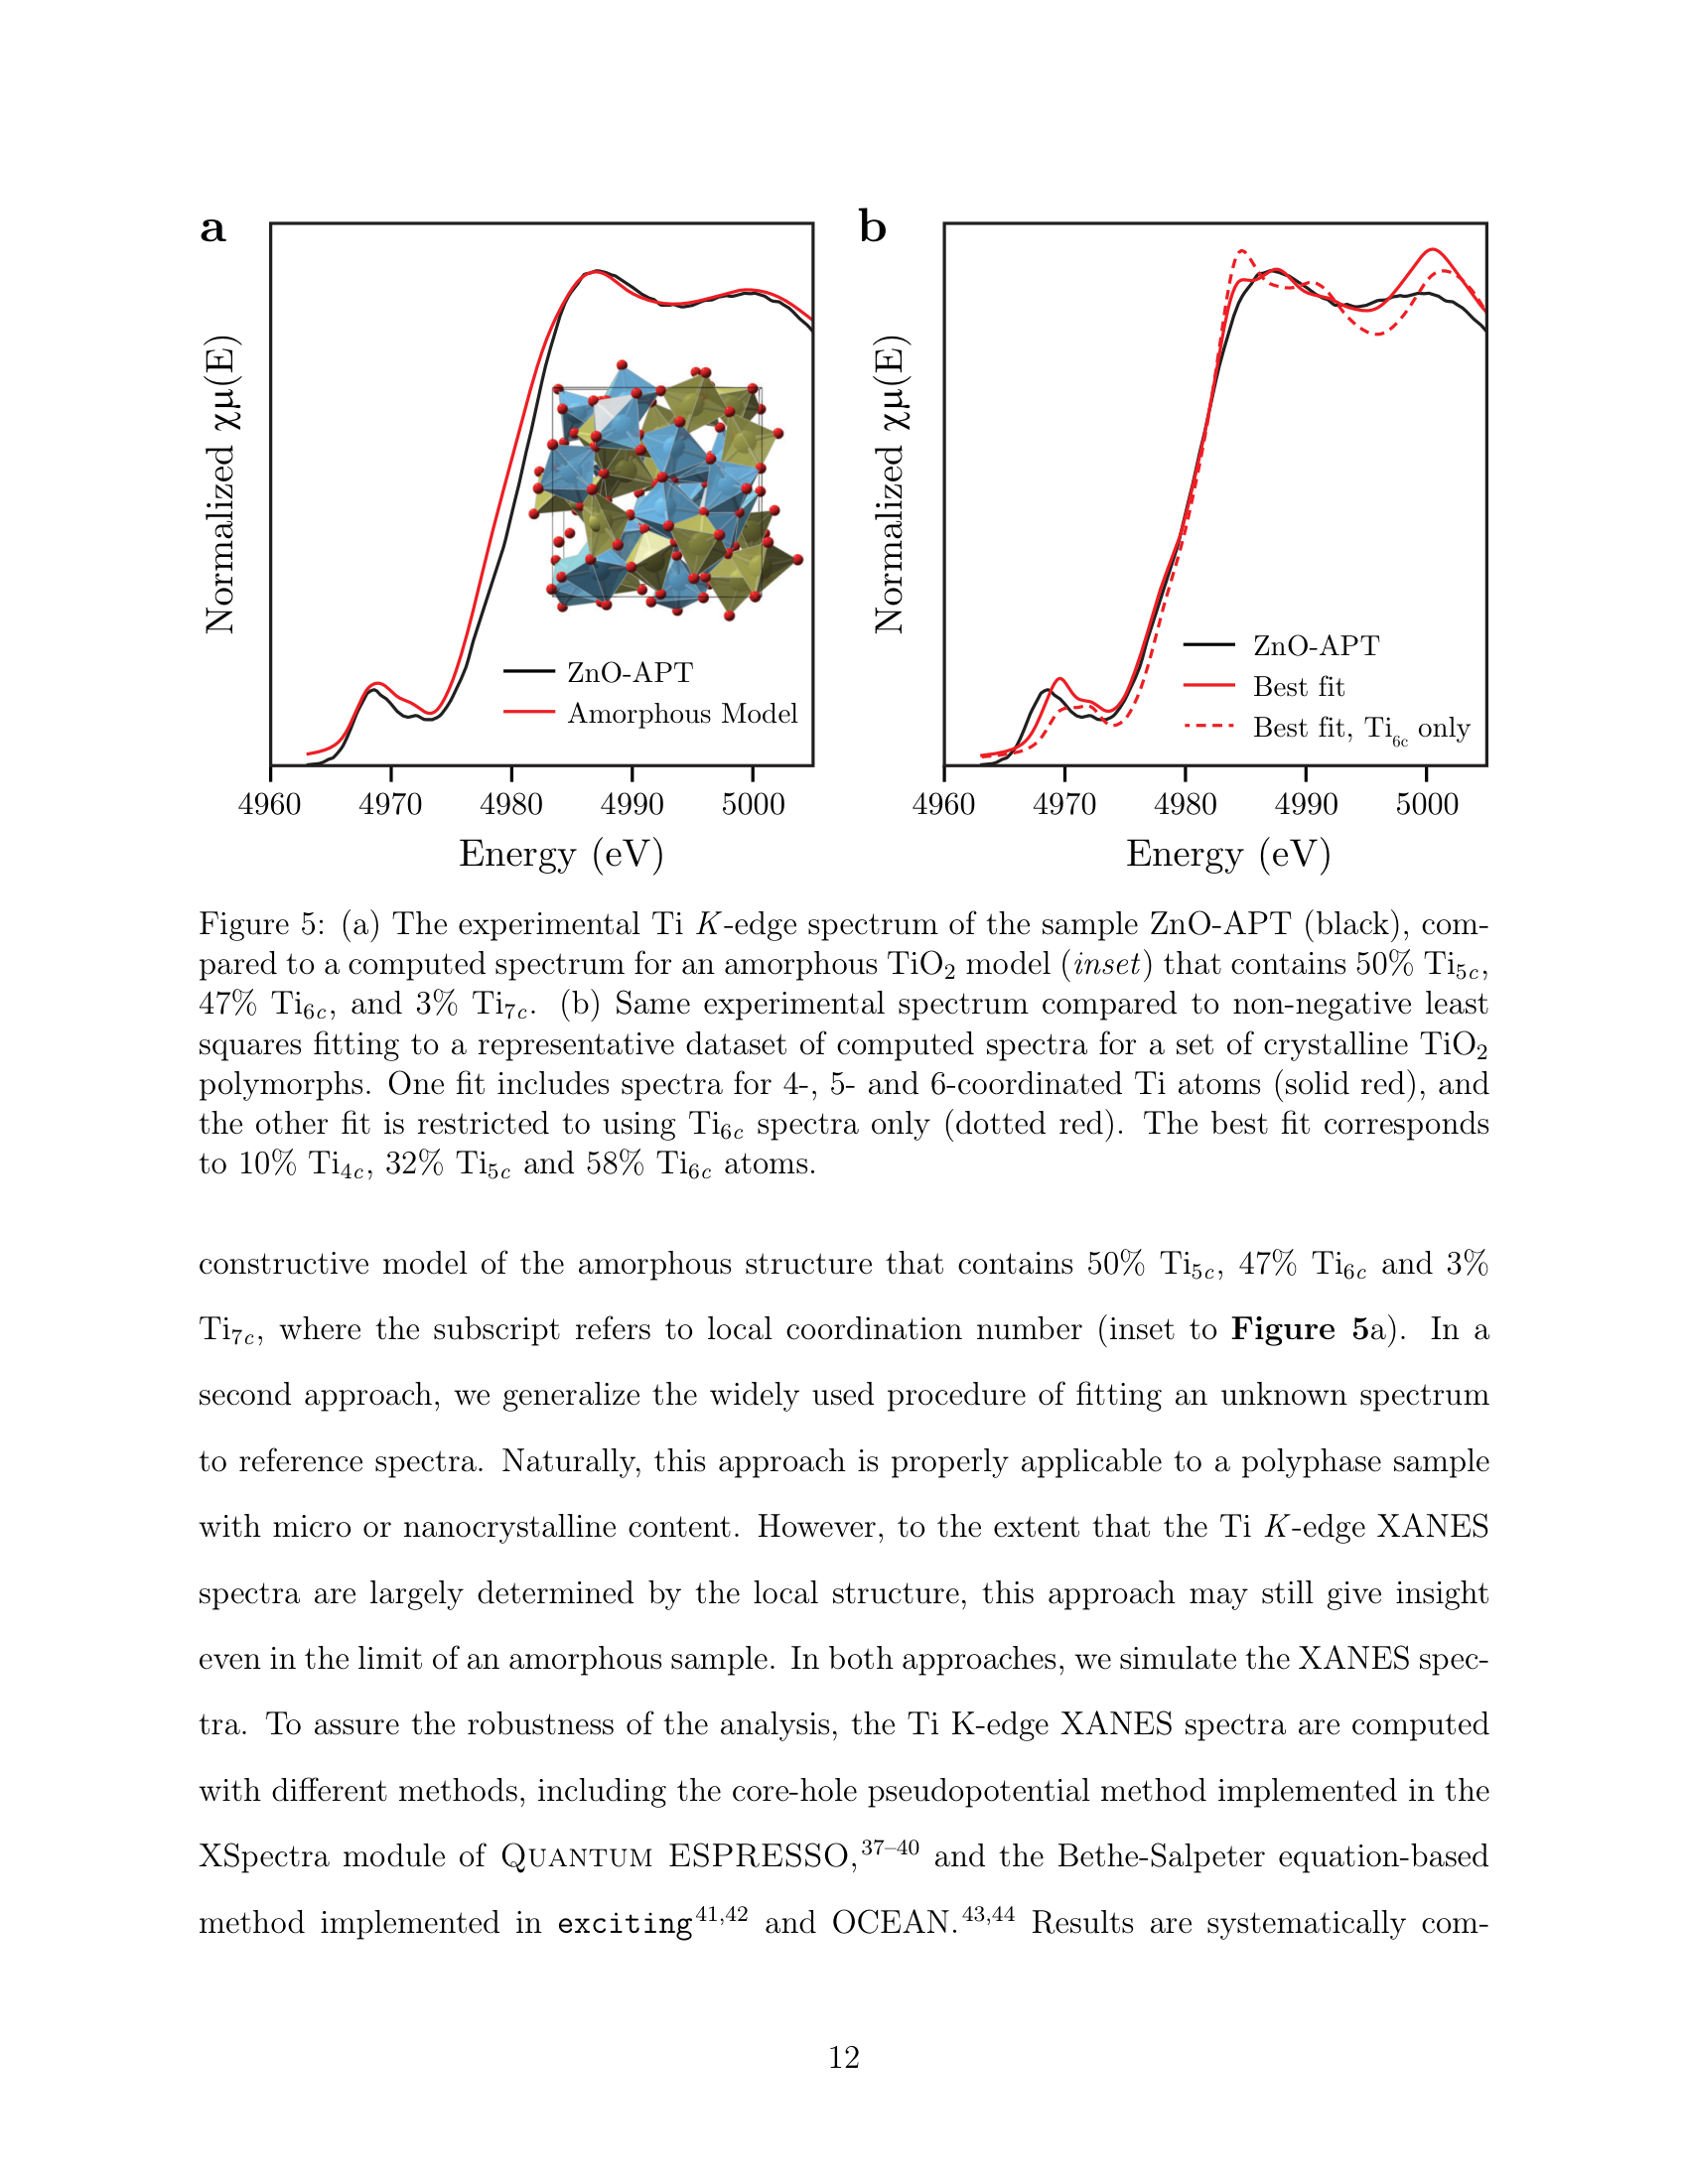
Page 11 (PDF page 11)
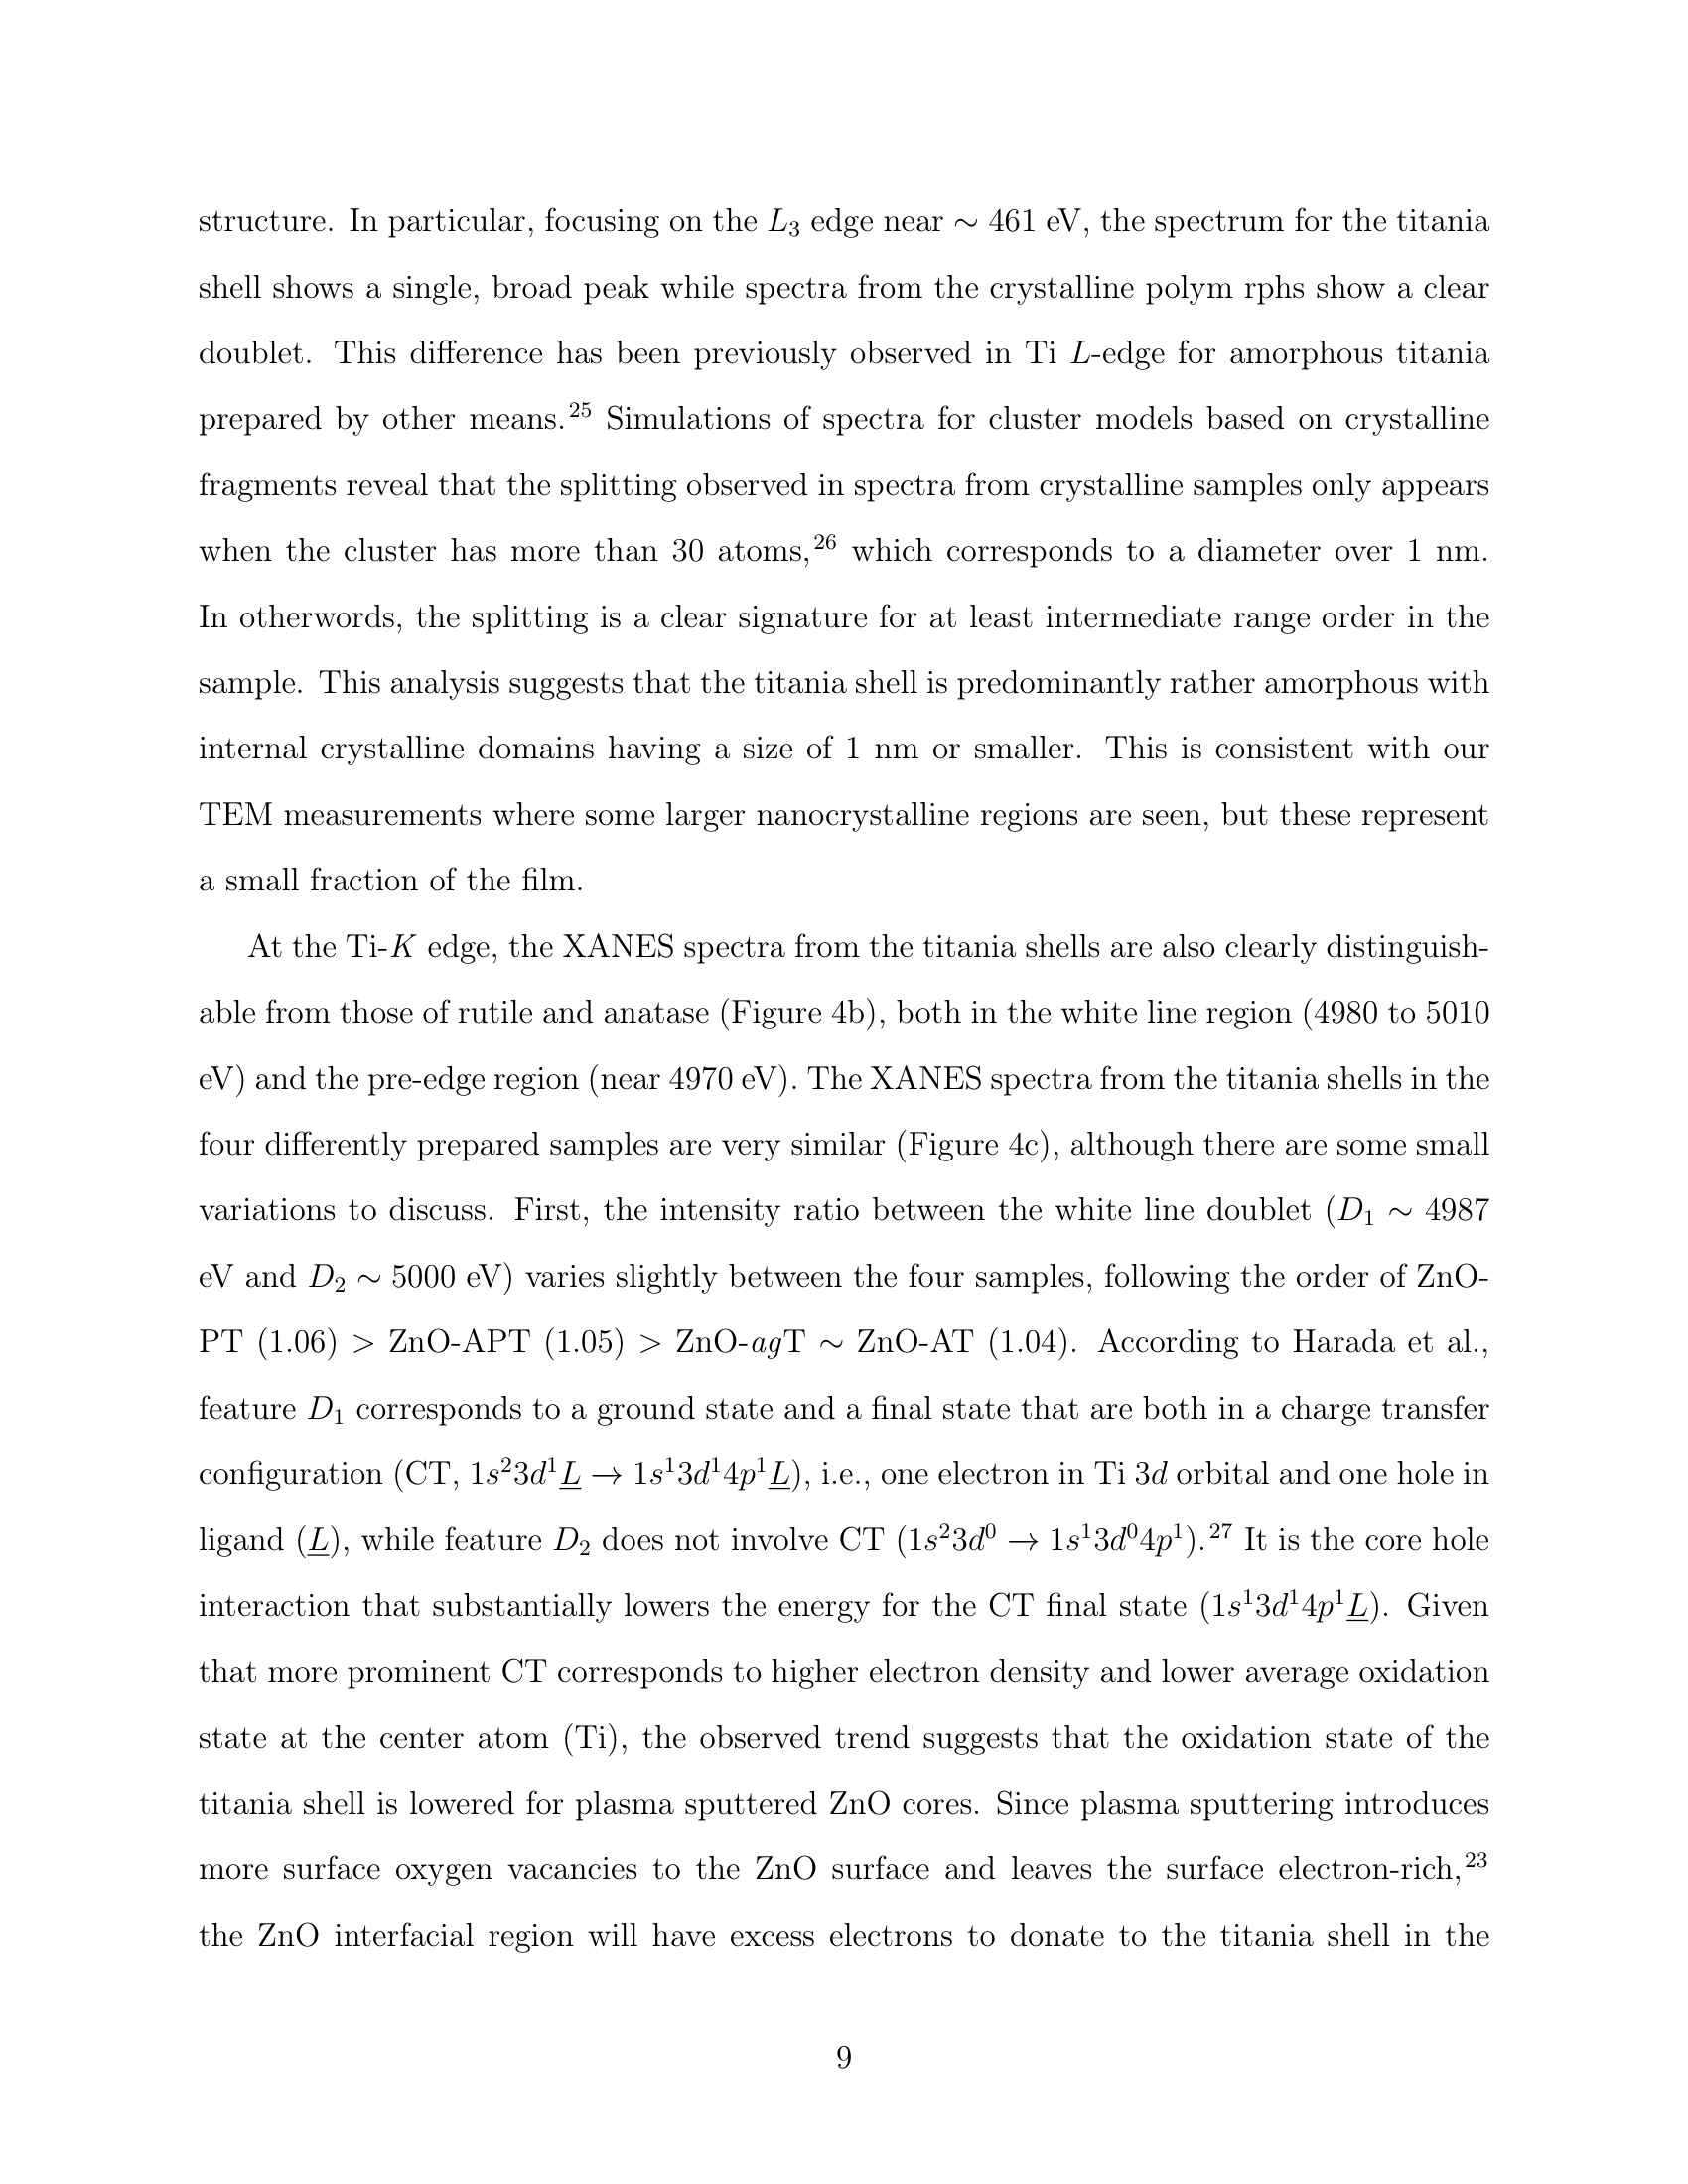
Page 13 (PDF page 13)
Page 16 (PDF page 16)
#9
TiO2 on ZnO
Ti K
▶
LLM Prompt
Sample Information
Material: TiO2 on ZnO
Deposition Method: ALD
Substrate: ZnO nanowires
Deposition Temperature C: 250
Film Thickness Nm: 3
Sample-Specific Conditions
- Analysis method: LCF of computed crystalline polymorph spectra
- Amorphous TiO2 shell on ZnO nanowires (core annealed and plasma treated)
Measurement
We plan to measure the Ti K XANES spectrum of this sample.
Questions
Based on all the information above:
1. What local Ti coordination environments (structural motifs) should be considered as candidate components when analyzing the Ti K-edge XANES spectrum of this ultrathin amorphous TiO2 shell?
2. Explain the physical and structural reasons why this ultrathin ALD TiO2 film on ZnO nanowires contains a significant fraction of undercoordinated Ti atoms, in contrast to bulk crystalline TiO2.
3. If performing a Linear Combination Fit (LCF) to determine the local structure of this highly amorphous film, what type of basis set or reference spectra would be required, given that standard bulk crystalline references (like pure rutile or anatase) are insufficient?
Ground Truth
Material: TiO2 on ZnO
Measurement: Ti K-edge XANES at NSLS-II beamline 8-ID ISS
Fit method: LCF (non-negative least squares fitting)
Phase fractions:
| Phase | Fraction |
|---|---|
| Ti4c | 0.1 |
| Ti5c | 0.32 |
| Ti6c | 0.58 |
Fit basis (paper's reference spectra):
- Computed XANES spectra of representative local Ti structure motifs (4-, 5-, and 6-fold coordinated Ti centers) derived from a database of titania polymorphs
Source evidence: Figure 5b and text on pages 14-16
Key reasoning: The experimental spectrum of the amorphous titania shell exhibits a strong, asymmetric pre-edge feature and a redshifted peak position compared to bulk rutile or anatase, indicating a lack of inversion symmetry and a high fraction of undercoordinated Ti atoms. The ultrathin nature of the shell means its atomic motifs are strongly affected by surface and interfacial energy. Furthermore, the interface with ZnO (which consists of 4-coordinated Zn) represents a transition from four-coordinated to six-coordinated metal oxides, which may exert a templating effect that stabilizes lower coordination numbers (like Ti4c) in the titania shell.
Reasoning source: Pages 13, 14, and 16
Scoring Rubric (total: 101 pts)
| Q | Type | Max | Question | Reference Answer | Scoring Criteria |
|---|---|---|---|---|---|
| q1 | identification | 29 | What local Ti coordination environments (structural motifs) should be considered as candidate components when analyzing the Ti K-edge XANES spectrum of this ultrathin amorphous TiO2 shell? | The candidate components for analyzing the Ti K-edge XANES spectrum must include 4-fold (Ti4c), 5-fold (Ti5c), and 6-fold (Ti6c) coordinated Ti centers. These specific motifs, which are quantified at fractions of 0.10, 0.32, and 0.58 respectively, are expected because the 3 nm ultrathin amorphous TiO2 shell is strongly affected by surface and interfacial energies. Furthermore, the underlying ZnO nanowire substrate consists of 4-coordinated Zn, and this interface exerts a templating effect during the transition to the titania shell. This templating stabilizes lower coordination numbers (like Ti4c) and causes a lack of inversion symmetry, which manifests as a strong, asymmetric pre-edge feature and redshifted peak position in the spectrum. | Full points for identifying 4-fold (Ti4c), 5-fold (Ti5c), and 6-fold (Ti6c) coordinated Ti centers. Partial credit for missing one. |
| q3 | reasoning | 43 | Explain the physical and structural reasons why this ultrathin ALD TiO2 film on ZnO nanowires contains a significant fraction of undercoordinated Ti atoms, in contrast to bulk crystalline TiO2. | The ultrathin 3 nm ALD TiO2 film contains a significant fraction of undercoordinated Ti atoms (10% Ti4c, 32% Ti5c, and 58% Ti6c) because its atomic motifs are strongly governed by surface and interfacial energies rather than bulk properties. Specifically, the interface with the ZnO nanowire substrate, which contains 4-coordinated Zn, represents a transition from four-coordinated to six-coordinated metal oxides. This structural interface exerts a templating effect on the amorphous titania shell deposited at 250 °C, stabilizing lower coordination numbers like Ti4c. Consequently, the material lacks inversion symmetry, which is spectroscopically confirmed by a strong, asymmetric pre-edge feature and a redshifted peak position compared to bulk crystalline TiO2. | Full points for mentioning the effects of surface/interfacial energy in ultrathin films and the potential templating effect of the ZnO interface (transitioning from 4-coordinated Zn to 6-coordinated Ti). |
| q4 | methodology | 29 | If performing a Linear Combination Fit (LCF) to determine the local structure of this highly amorphous film, what type of basis set or reference spectra would be required, given that standard bulk crystalline references (like pure rutile or anatase) are insufficient? | To perform an LCF on this highly amorphous film, the basis set must consist of computed XANES spectra of representative local Ti structure motifs, specifically 4-, 5-, and 6-fold coordinated Ti centers derived from a database of titania polymorphs. Standard bulk references are inadequate because the 3 nm ultrathin TiO2 shell deposited on ZnO nanowires is dominated by surface and interfacial energies that stabilize undercoordinated Ti atoms (yielding fractions of 0.10 Ti4c, 0.32 Ti5c, and 0.58 Ti6c). The 4-coordinated Zn substrate exerts a templating effect on the amorphous shell, creating a lack of inversion symmetry that produces a strong, asymmetric pre-edge feature and a redshifted peak position. Therefore, computed spectra of these specific undercoordinated motifs are required to accurately model the physical reality of this interfacial transition. | Full points for stating the need for a basis set of computed/simulated XANES spectra representing specific local Ti structure motifs (e.g., 4-, 5-, and 6-coordinated Ti centers) rather than just bulk macroscopic phases. |
Review
#10
TiO2 on ZnO
Ti K
▶
LLM Prompt
Sample Information
Material: TiO2 on ZnO
Deposition Method: ALD
Substrate: ZnO nanowires
Deposition Temperature C: 250
Film Thickness Nm: 3
Sample-Specific Conditions
- Analysis method: Amorphous structural model (simulated annealing + MD)
- Amorphous TiO2 shell on ZnO nanowires (core annealed and plasma treated)
Measurement
We plan to measure the Ti K XANES spectrum of this sample.
Questions
Based on all the information above:
1. Based on the sample conditions (ultrathin ALD TiO2 on ZnO nanowires), what local Ti coordination environments (structural motifs) should be considered as the primary basis components when modeling the Ti K-edge XANES spectrum of this amorphous film?
2. Explain the physical reasoning for why this ultrathin TiO2 film exhibits such a high fraction of undercoordinated Ti atoms compared to bulk crystalline TiO2 polymorphs.
Ground Truth
Material: TiO2 on ZnO nanowires
Measurement: Ti K-edge XANES at NSLS-II beamline 8-ID ISS
Fit method: Theoretical modeling (simulated annealing + DFT-MD)
Phase fractions:
| Phase | Fraction |
|---|---|
| Ti5c | 0.5 |
| Ti6c | 0.47 |
| Ti7c | 0.03 |
Fit basis (paper's reference spectra):
- Ti5c (5-coordinated Ti) structural motif
- Ti6c (6-coordinated Ti) structural motif
- Ti7c (7-coordinated Ti) structural motif
Source evidence: Figure 5a and page 13 text
Key reasoning: The ultrathin titania shell grown by ALD at 250 °C is highly amorphous, lacking long-range order. The atomic motif of the ultrathin TiO2 shell is strongly affected by surface and interfacial energy, preventing the formation of crystalline phases like anatase. This results in a 'glassy' structure with a significant proportion (roughly half) of undercoordinated Ti atoms, primarily 5-coordinated Ti, unlike bulk crystalline TiO2 which contains only 6-coordinated Ti.
Reasoning source: Pages 11, 14, and 16
Scoring Rubric (total: 100 pts)
| Q | Type | Max | Question | Reference Answer | Scoring Criteria |
|---|---|---|---|---|---|
| q1 | identification | 38 | Based on the sample conditions (ultrathin ALD TiO2 on ZnO nanowires), what local Ti coordination environments (structural motifs) should be considered as the primary basis components when modeling the Ti K-edge XANES spectrum of this amorphous film? | When modeling the Ti K-edge XANES spectrum of this sample, the primary basis components to consider are 5-coordinated Ti (Ti5c), 6-coordinated Ti (Ti6c), and 7-coordinated Ti (Ti7c) structural motifs. These specific local coordination environments are expected because the 3 nm ultrathin TiO2 shell grown by ALD at 250 °C is highly amorphous and lacks long-range order. The atomic motif of this ultrathin film is strongly affected by surface and interfacial energies with the ZnO nanowire substrate, which prevents the formation of standard crystalline phases like anatase. Consequently, the material adopts a 'glassy' structure containing a mixture of these coordination states, including a large proportion of undercoordinated Ti5c, rather than the purely 6-coordinated Ti found in bulk crystalline TiO2. | Full credit for identifying 5-coordinated (Ti5c) and 6-coordinated (Ti6c) environments. Partial credit for mentioning undercoordinated Ti without specifying the exact coordination numbers. Mentioning 7-coordinated (Ti7c) is a bonus but not strictly required for full credit given its low fraction. |
| q3 | reasoning | 62 | Explain the physical reasoning for why this ultrathin TiO2 film exhibits such a high fraction of undercoordinated Ti atoms compared to bulk crystalline TiO2 polymorphs. | The high fraction of undercoordinated Ti atoms, specifically roughly 50% 5-coordinated Ti (Ti5c), arises directly from the sample's ultrathin 3 nm geometry and its deposition via ALD at 250 °C on ZnO nanowires. Under these specific conditions, the atomic motif of the TiO2 shell is strongly dominated by surface and interfacial energies. These energetic constraints prevent the film from developing the long-range order necessary to form crystalline phases like anatase, which would normally consist entirely of 6-coordinated Ti. Instead, the film forms a highly amorphous, 'glassy' structure where the lack of crystalline constraints allows for a significant proportion of undercoordinated Ti atoms to exist. | Full credit for explaining that the ultrathin nature of the film makes its atomic motifs highly susceptible to surface and interfacial energies, leading to a 'glassy' or highly amorphous structure that lacks the long-range order required to form purely 6-coordinated octahedral networks found in bulk crystalline phases like anatase or rutile. |
Review
Sub-20 nm Hard X-ray Spectromicroscopy Reveals Nanoscale Redox Heterogeneity in Ultrafine Particulates
Original-17
Environmental
Ajith Pattammattel et al.
DOI: 10.1021/acsnano.6c05068
3 scenarios
PDF
▶
Key Paper Evidence2A, 4B, p.5, p.6, p.7▶
Figure 2A (PDF page 5)
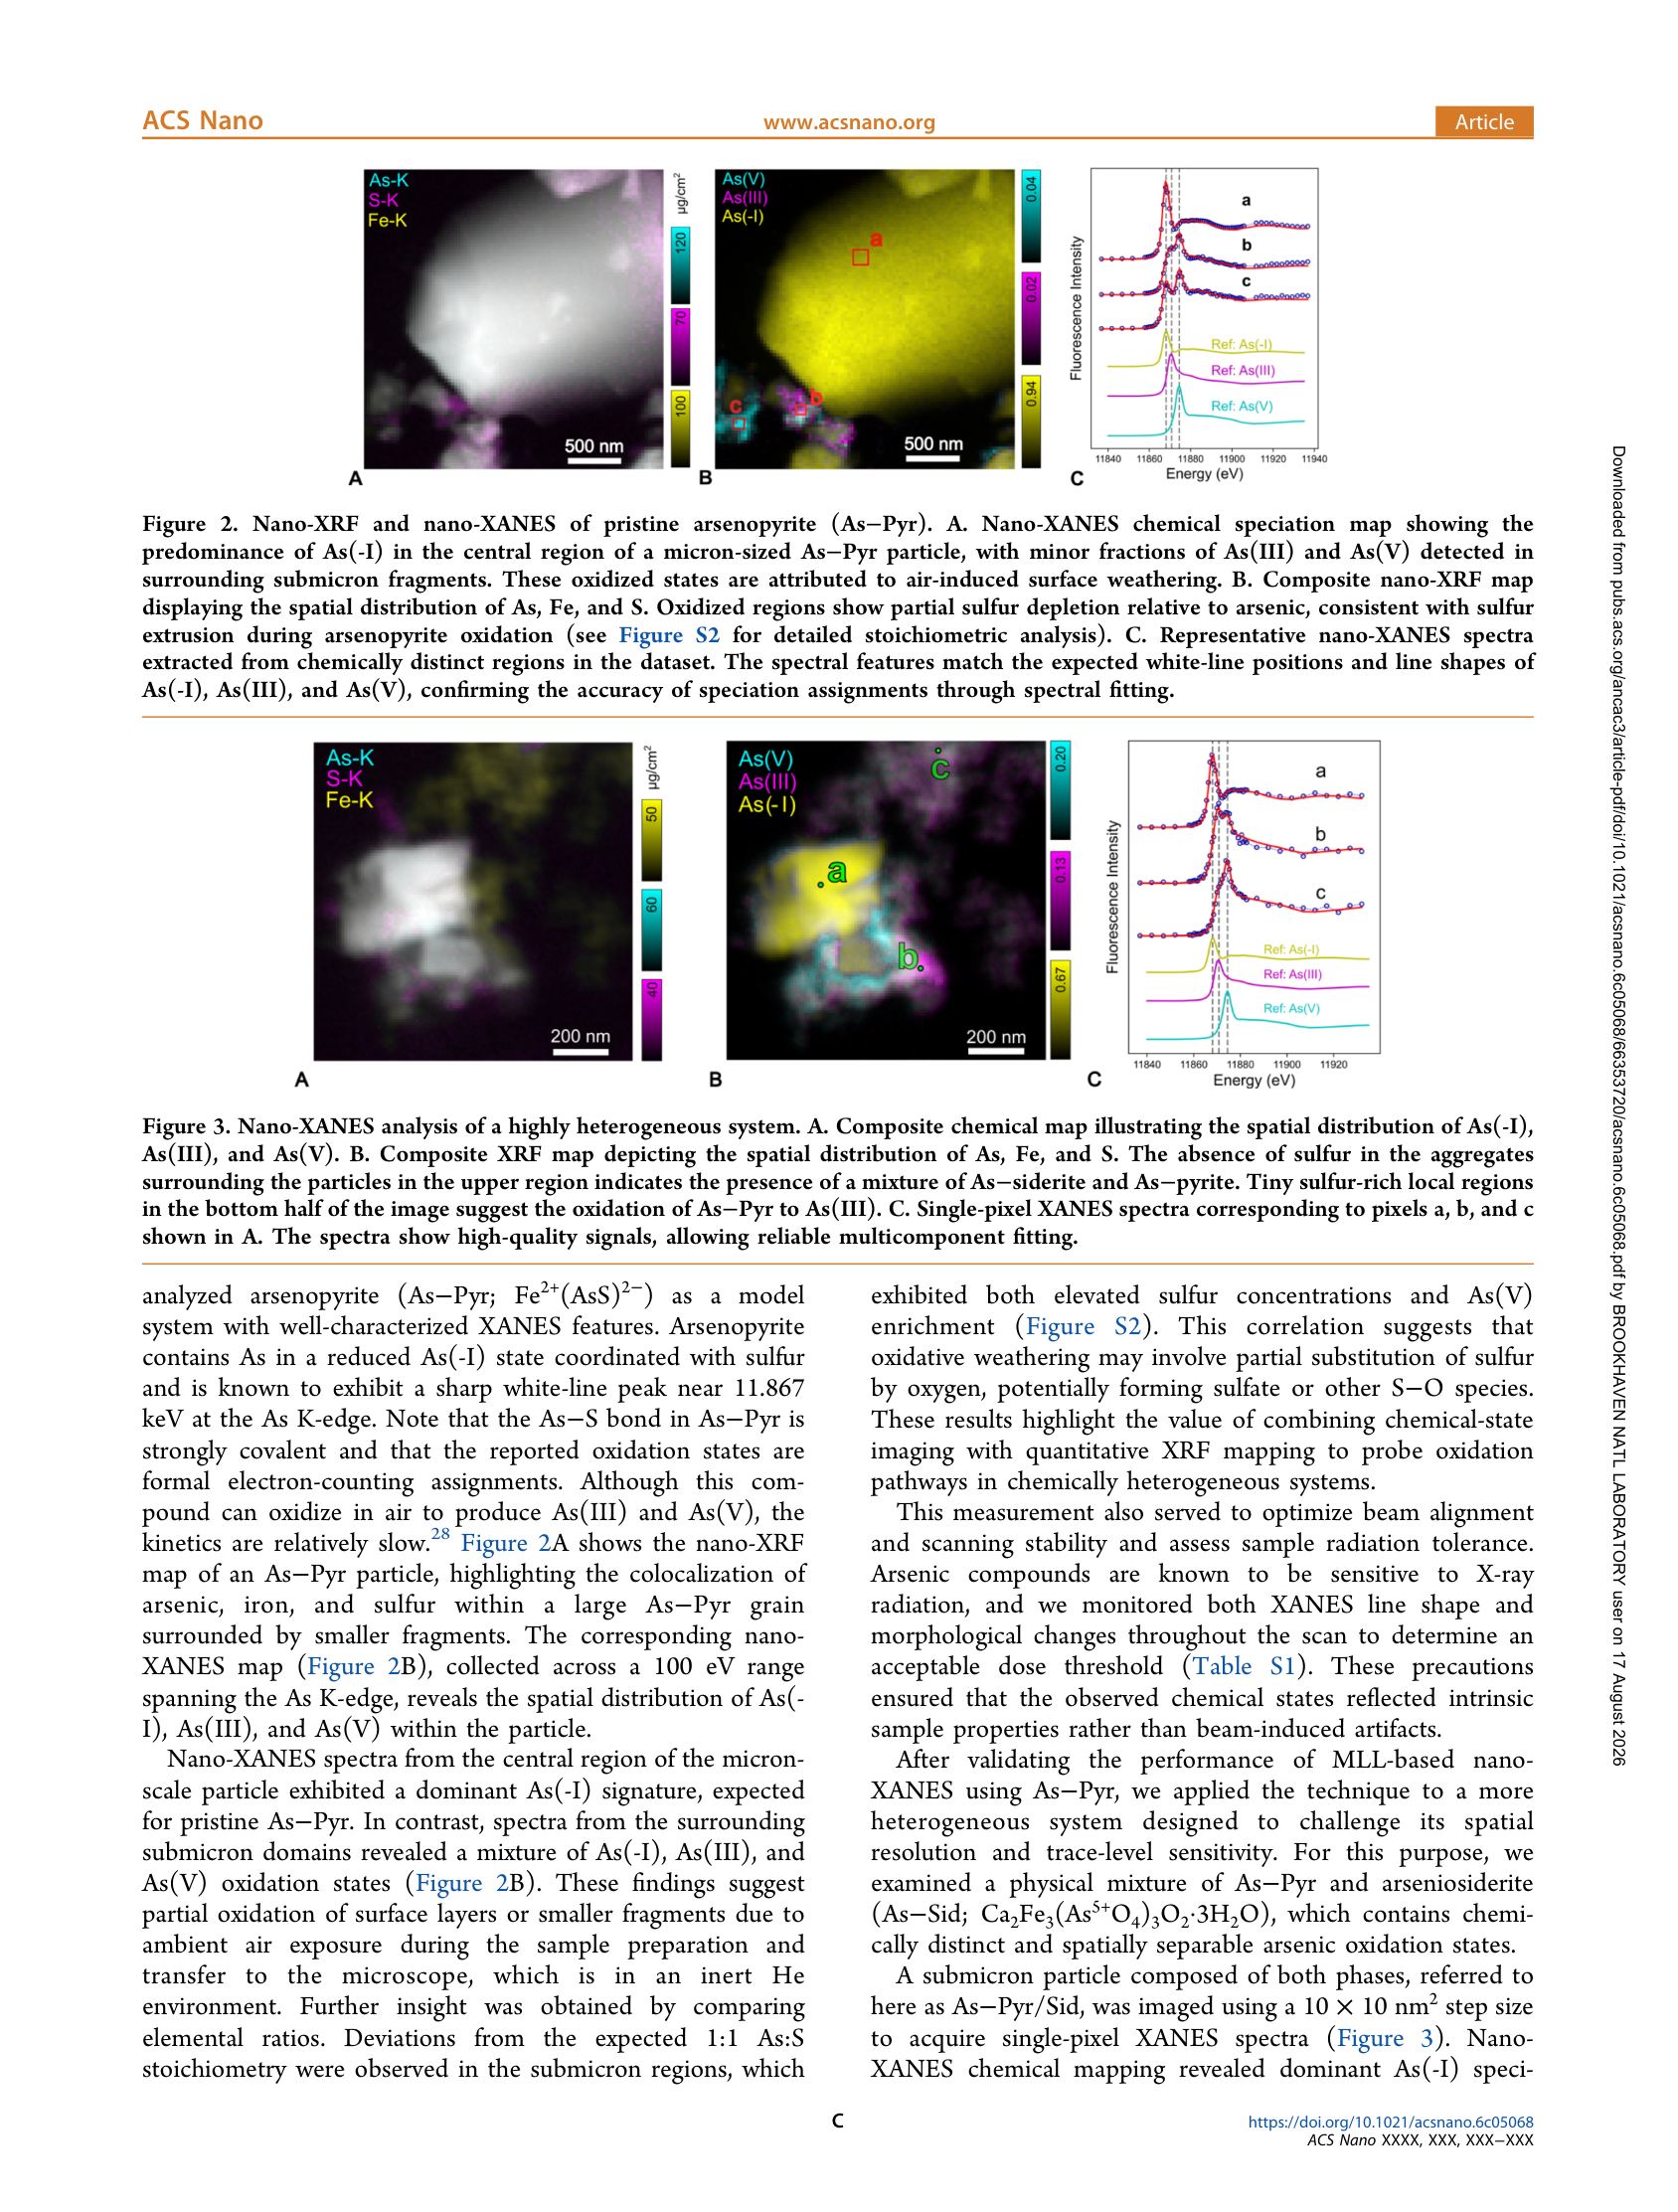
Figure 4B (PDF page 6)
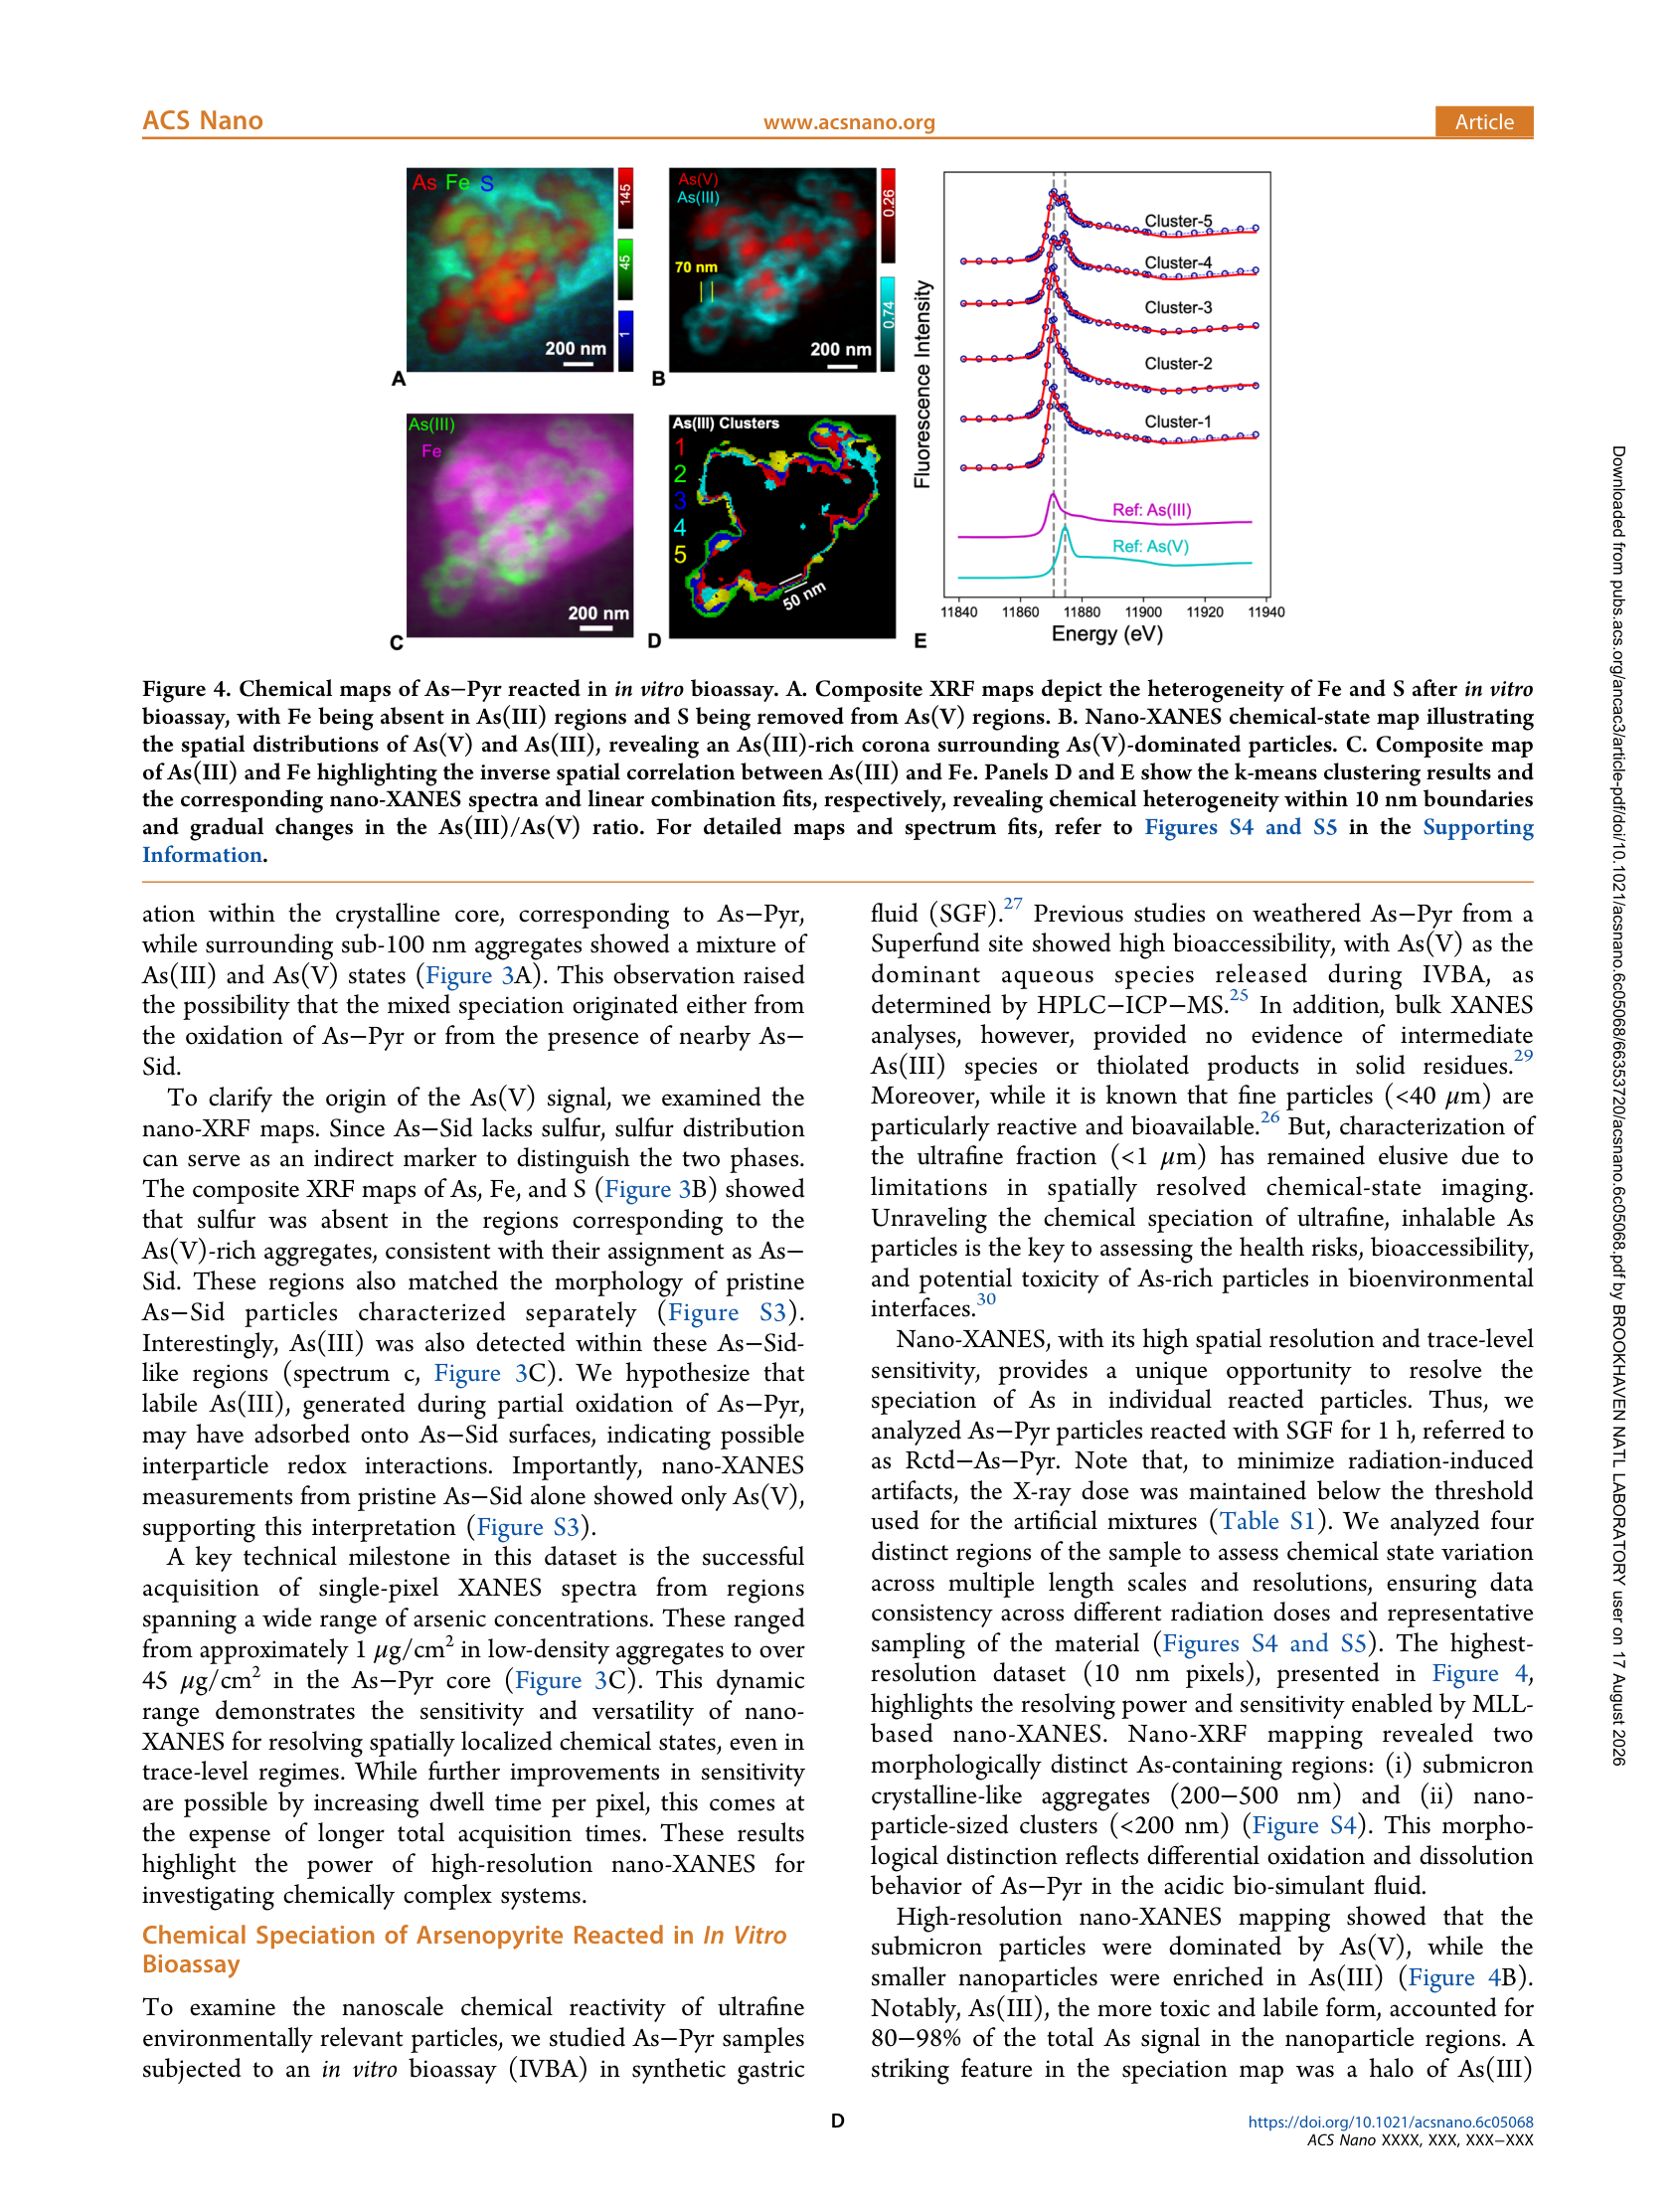
Page 7 (PDF page 7)
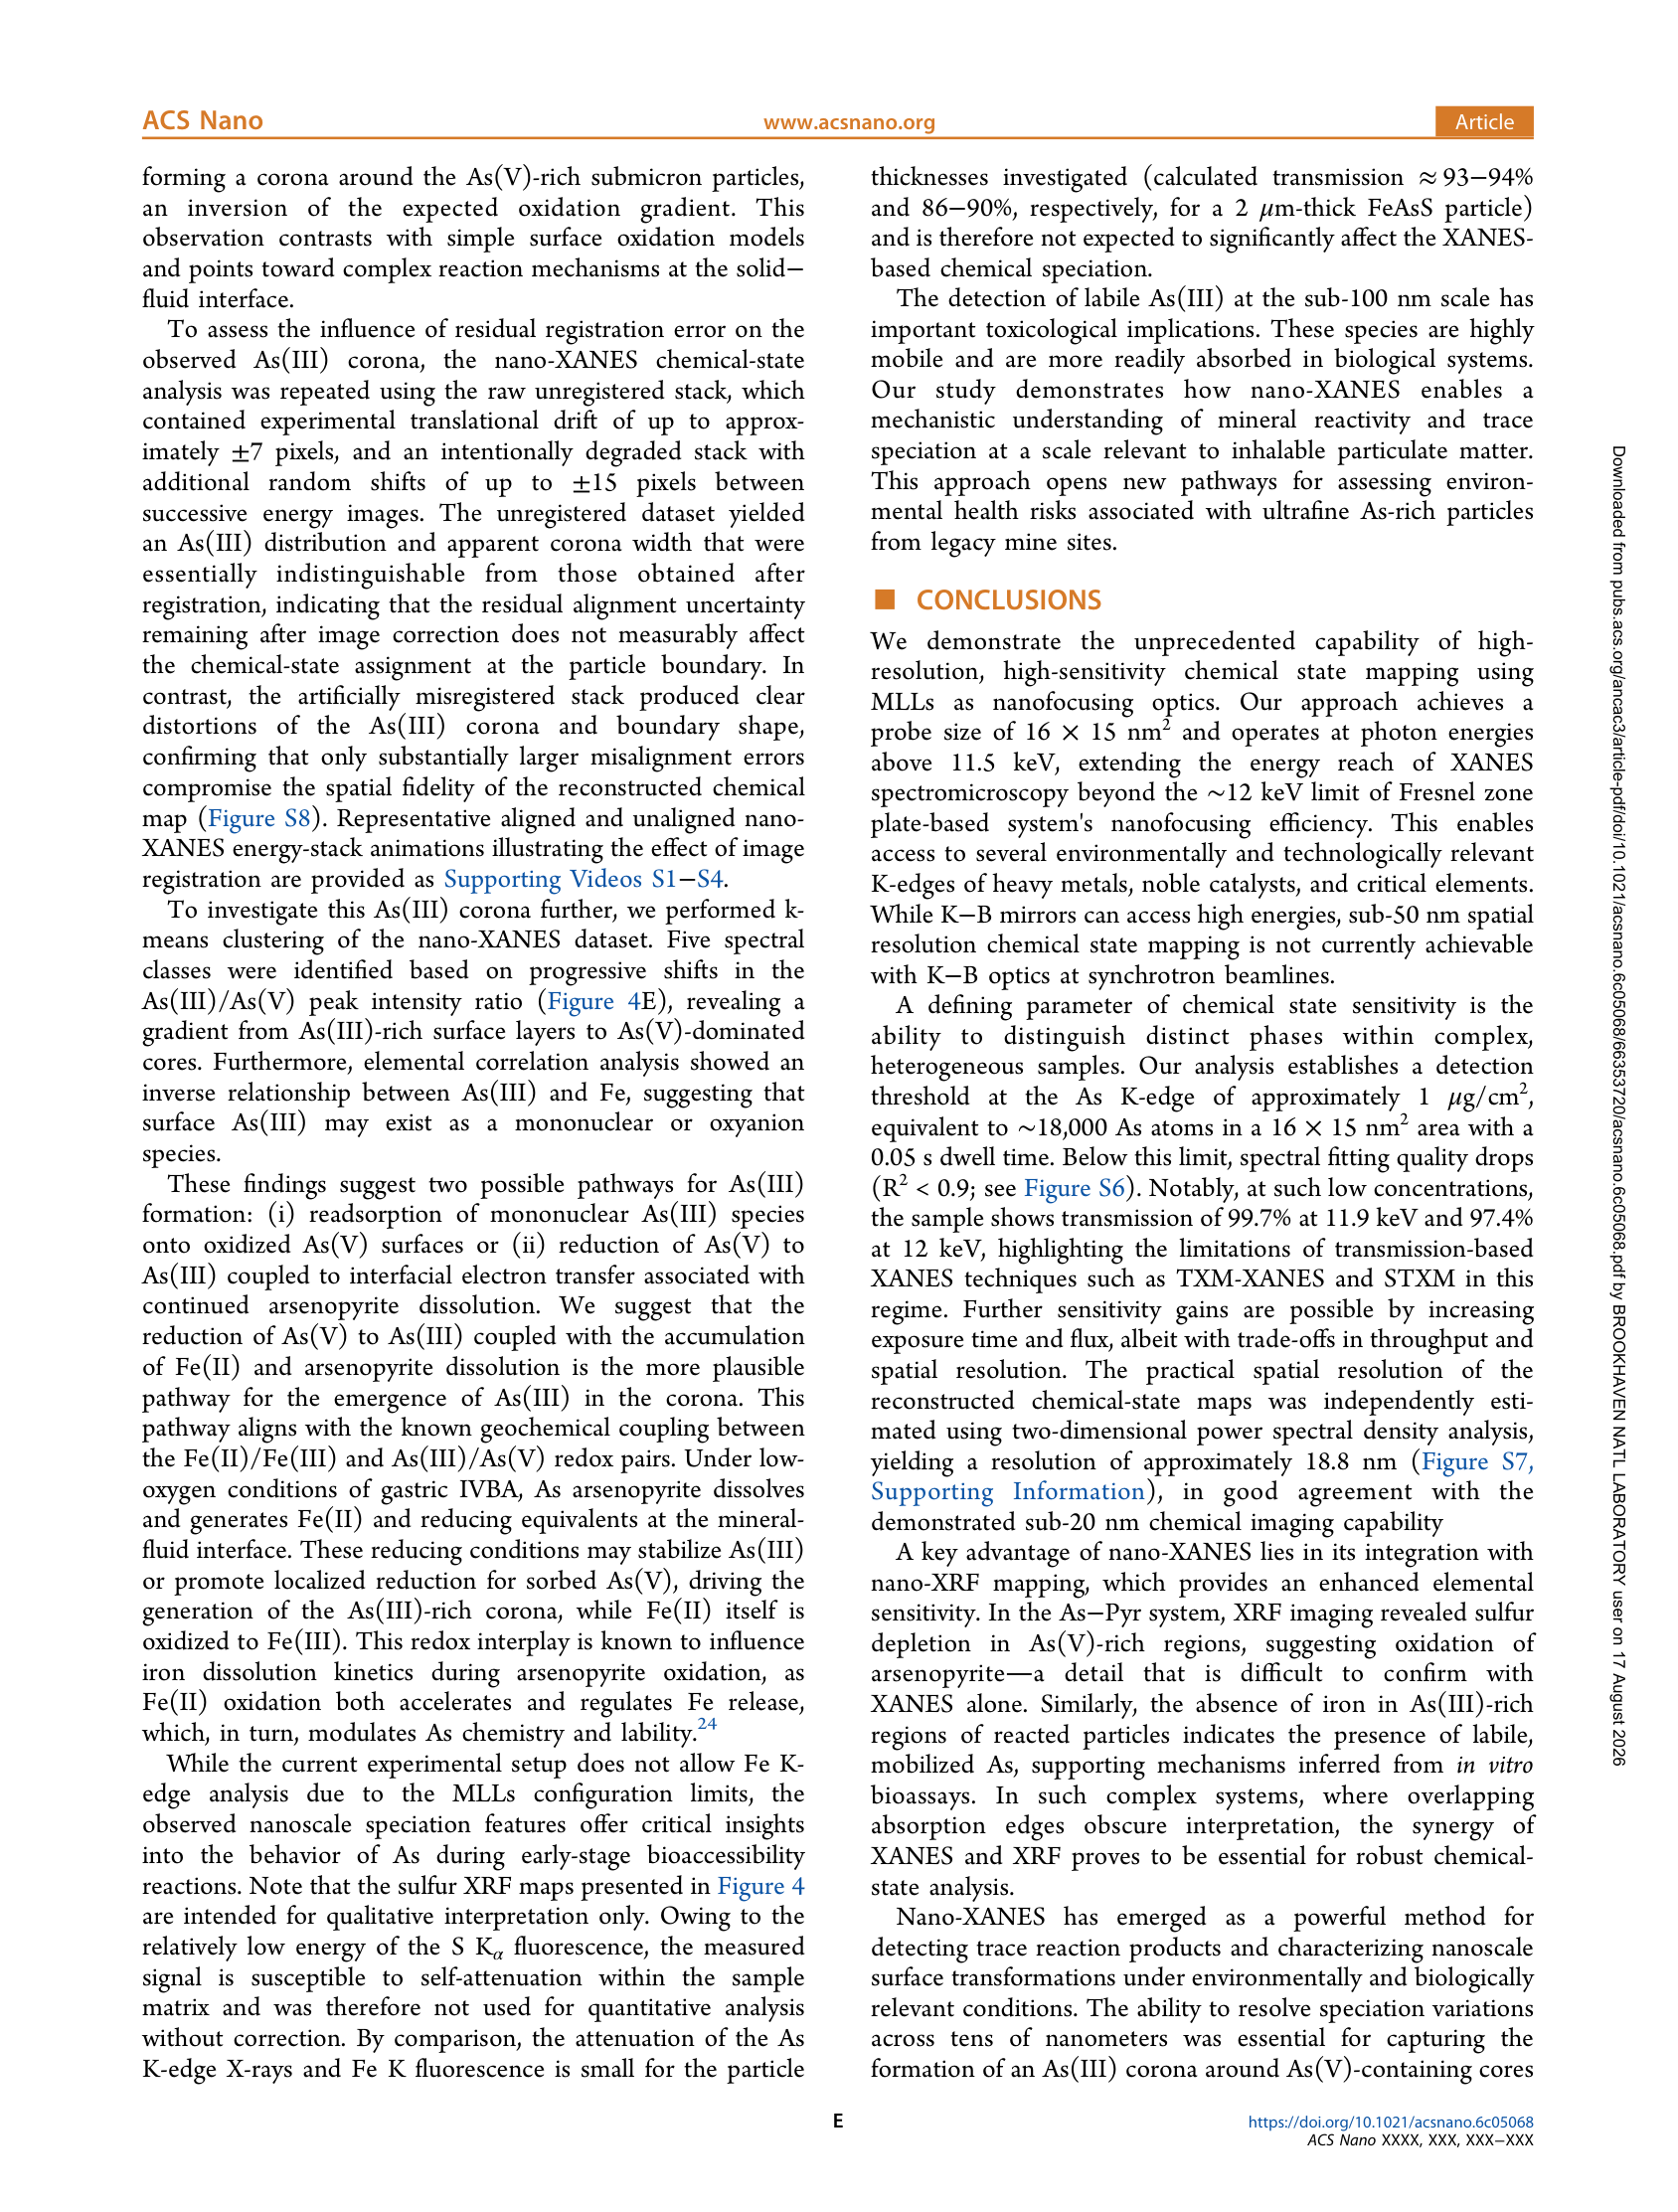
#11
arsenopyrite mineral
As K-edge
▶
LLM Prompt
Sample Information
Material: arsenopyrite mineral
Sample Origin: Yaogangxian Mine, Hunan Province, China
Sample-Specific Conditions
- spatial region: core
- Central region of a micron-sized pristine arsenopyrite particle
Measurement
We plan to measure the As K-edge XANES spectrum of this sample.
Questions
Based on all the information above:
1. What candidate reference spectra should be included in a linear combination fitting basis to fully capture the speciation across this entire arsenopyrite particle (including its surfaces), and which specific phase is expected to completely dominate the central core region?
2. Based on the sample conditions, explain why the central core of the particle remains as pure As(-I) while other regions (like the surface or smaller fragments) exhibit different oxidation states.
Ground Truth
Material: arsenopyrite mineral
Measurement: As K-edge nano-XANES in fluorescence mode at the Hard X-ray Nanoprobe (HXN) beamline
Fit method: pixel-wise spectral fitting (linear combination fitting)
Phase fractions: (±10%)
| Phase | Fraction |
|---|---|
| As(-I) | 1.0 |
Fit basis (paper's reference spectra):
- As(-I) reference
- As(III) reference
- As(V) reference
Source evidence: Page 5, Figure 2A-C and text in 'Nano-XANES Imaging' section
Key reasoning: The central region of the micron-scale pristine arsenopyrite particle exhibits a dominant As(-I) signature, which is the expected state for pristine As-Pyr. While the surrounding submicron domains and surface layers undergo partial oxidation to As(III) and As(V) due to ambient air exposure during sample preparation and transfer, the core remains unoxidized and protected. The pristine As(-I) state in this core is characterized by a sharp white-line peak near 11.867 keV.
Reasoning source: Page 5, Section: Nano-XANES Imaging
Scoring Rubric (total: 100 pts)
| Q | Type | Max | Question | Reference Answer | Scoring Criteria |
|---|---|---|---|---|---|
| q1 | identification | 43 | What candidate reference spectra should be included in a linear combination fitting basis to fully capture the speciation across this entire arsenopyrite particle (including its surfaces), and which specific phase is expected to completely dominate the central core region? | To fully capture the speciation across the entire arsenopyrite particle, the linear combination fitting basis should include As(-I), As(III), and As(V) reference spectra. Within the central core region of this micron-sized pristine particle, the As(-I) phase is expected to completely dominate, representing a fraction of 1.0. This specific phase distribution occurs because the core remains physically protected and unoxidized, preserving the expected pristine As(-I) state of the arsenopyrite mineral. In contrast, the As(III) and As(V) references are necessary to account for the surrounding submicron domains and surface layers, which undergo partial oxidation due to ambient air exposure during sample preparation and transfer. | Full points for identifying As(-I), As(III), and As(V) as the necessary basis spectra to account for potential weathering, and correctly stating that As(-I) dominates the core. |
| q2 | reasoning | 57 | Based on the sample conditions, explain why the central core of the particle remains as pure As(-I) while other regions (like the surface or smaller fragments) exhibit different oxidation states. | The central core of the micron-sized arsenopyrite particle remains as pure As(-I) (fraction of 1.0) because it is physically protected from the surrounding environment, preserving the expected pristine state of the mineral. While the core remains unoxidized, the surface layers and surrounding submicron domains are exposed to ambient air during sample preparation and transfer. This air exposure drives a partial oxidation mechanism in the unprotected regions, resulting in the formation of As(III) and As(V) oxidation states. Consequently, the protected core retains its pristine As(-I) signature, characterized by a sharp white-line peak near 11.867 keV, while the exterior regions exhibit mixed speciation. | Full points for explaining that the core remains unoxidized pristine arsenopyrite, while surface layers or smaller fragments undergo partial oxidation to As(III) and As(V) due to ambient air exposure during sample preparation and transfer. |
Review
#12
reacted arsenopyrite
As K-edge
▶
LLM Prompt
Sample Information
Material: reacted arsenopyrite
Sample Origin: Yaogangxian Mine, Hunan Province, China
Sample-Specific Conditions
- particle size/morphology: <200 nm
- Arsenopyrite particles reacted with synthetic gastric fluid (SGF) for 1 h, nanoparticle-sized clusters (<200 nm)
Measurement
We plan to measure the As K-edge XANES spectrum of this sample.
Questions
Based on all the information above:
1. What candidate reference spectra should be included in a linear combination fitting (LCF) model to properly evaluate the speciation of this reacted arsenopyrite sample?
2. Estimate the phase fractions of the arsenic species present in these <200 nm nanoparticle clusters after 1 hour of reaction in synthetic gastric fluid.
3. Provide the geochemical reasoning for why As(III) becomes the dominant species in these specific nanoparticle regions under the described anoxic bioassay conditions, despite the starting material being As(-I).
Ground Truth
Material: reacted arsenopyrite
Measurement: As K-edge nano-XANES in fluorescence mode at the Hard X-ray Nanoprobe (HXN) beamline, NSLS-II
Fit method: Linear combination fitting (LCF)
Phase fractions: (±10%)
| Phase | Fraction |
|---|---|
| As(III) | 0.89 |
| As(V) | 0.11 |
Fit basis (paper's reference spectra):
- As(-I) (pristine arsenopyrite)
- As(III)
- As(V)
Source evidence: Page 6, text ('As(III)... accounted for 80-98% of the total As signal in the nanoparticle regions') and Figure 4B
Key reasoning: Under the low-oxygen conditions of the gastric in vitro bioassay, arsenopyrite dissolves and generates Fe(II) and reducing equivalents at the mineral-fluid interface. These reducing conditions stabilize As(III) or promote localized reduction of sorbed As(V) to As(III), driving the generation of highly concentrated, labile As(III) in the nanoparticle regions.
Reasoning source: Page 7, text discussing pathways for As(III) formation
Scoring Rubric (total: 100 pts)
| Q | Type | Max | Question | Reference Answer | Scoring Criteria |
|---|---|---|---|---|---|
| q1 | identification | 20 | What candidate reference spectra should be included in a linear combination fitting (LCF) model to properly evaluate the speciation of this reacted arsenopyrite sample? | The linear combination fitting (LCF) model should include reference spectra for As(-I) representing pristine arsenopyrite, alongside As(III) and As(V) references. These specific phases are expected because the initial <200 nm arsenopyrite particles contain As(-I) that reacts and dissolves in the synthetic gastric fluid. Under the low-oxygen conditions of this gastric bioassay, the dissolution generates Fe(II) and reducing equivalents at the mineral-fluid interface. This reducing environment stabilizes As(III) and promotes the localized reduction of sorbed As(V) to As(III), necessitating the inclusion of all three oxidation states to accurately model the resulting nanoparticle clusters. | Full credit for identifying As(III) and As(V) as the primary reaction products, and As(-I) (or pristine arsenopyrite) as the unreacted starting material. |
| q2 | quantification | 30 | Estimate the phase fractions of the arsenic species present in these <200 nm nanoparticle clusters after 1 hour of reaction in synthetic gastric fluid. | After 1 hour of reaction in synthetic gastric fluid, the arsenic species in the <200 nm nanoparticle clusters are estimated to be 0.89 (89%) As(III) and 0.11 (11%) As(V), with an uncertainty of 10%. These specific fractions arise because the low-oxygen conditions of the gastric bioassay cause the arsenopyrite to dissolve, generating Fe(II) and reducing equivalents at the mineral-fluid interface. These localized reducing conditions strongly stabilize As(III) and promote the reduction of any sorbed As(V) back to As(III). As a result, highly concentrated and labile As(III) is driven to become the overwhelmingly dominant fraction in these nanoparticle regions. | Full credit for stating that As(III) is the highly dominant phase (accepting ~89% or the paper's stated range of 80-98%) with the remainder being As(V). |
| q3 | reasoning | 50 | Provide the geochemical reasoning for why As(III) becomes the dominant species in these specific nanoparticle regions under the described anoxic bioassay conditions, despite the starting material being As(-I). | As(III) becomes the dominant species in the <200 nm nanoparticle clusters because the arsenopyrite particles undergo dissolution under the low-oxygen conditions of the synthetic gastric fluid bioassay. During this 1-hour reaction, the dissolving mineral generates Fe(II) and reducing equivalents directly at the mineral-fluid interface. These localized reducing conditions are critical because they stabilize As(III) and promote the localized reduction of any oxidized, sorbed As(V) back into As(III). Consequently, this mechanism drives the generation of highly concentrated, labile As(III) in the nanoparticle regions, overcoming the initial As(-I) state of the pristine mineral. | Full credit for explaining that arsenopyrite dissolution generates Fe(II) and reducing equivalents at the mineral-fluid interface, which either stabilizes As(III) or promotes the localized reduction of sorbed As(V) back to As(III) under low-oxygen conditions. |
Review
#13
reacted arsenopyrite
As K-edge
▶
LLM Prompt
Sample Information
Material: reacted arsenopyrite
Sample Origin: Yaogangxian Mine, Hunan Province, China
Sample-Specific Conditions
- particle size/morphology: 200-500 nm
- Arsenopyrite particles reacted with synthetic gastric fluid (SGF) for 1 h, submicron crystalline-like aggregates (200-500 nm)
Measurement
We plan to measure the As K-edge XANES spectrum of this sample.
Questions
Based on all the information above:
1. What candidate reference spectra are necessary to perform linear combination fitting on this reacted arsenopyrite sample to fully capture its potential oxidation states?
2. Based on the provided sample conditions (200-500 nm submicron aggregates of arsenopyrite reacted in synthetic gastric fluid), what is the dominant arsenic oxidation state expected in this specific morphological fraction?
3. Explain the geochemical reasoning for why this specific morphological fraction (200-500 nm aggregates) exhibits this dominant oxidation state, and contrast it with the speciation expected in smaller (<200 nm) nanoparticle clusters or surface coronas under the same in vitro bioassay conditions.
Ground Truth
Material: reacted arsenopyrite
Measurement: As K-edge nano-XANES at the Hard X-ray Nanoprobe (HXN) beamline at NSLS-II
Fit method: Linear combination fitting (LCF)
Phase fractions: (±10%)
| Phase | Fraction |
|---|---|
| As(V) | 1.0 |
Fit basis (paper's reference spectra):
- As(-I) (arsenopyrite)
- As(III)
- As(V)
Source evidence: Page 6, text and Figure 4B
Key reasoning: High-resolution nano-XANES mapping reveals morphologically distinct regions with different oxidation states after reaction with synthetic gastric fluid. The larger submicron crystalline-like aggregates (200-500 nm) are dominated by As(V). This contrasts with the smaller nanoparticle clusters (<200 nm) and the particle corona, which are enriched in labile As(III) due to localized reduction or readsorption mechanisms during the dissolution process.
Reasoning source: Page 6, right column and Page 7, left column (Chemical Speciation of Arsenopyrite Reacted in In Vitro Bioassay)
Scoring Rubric (total: 100 pts)
| Q | Type | Max | Question | Reference Answer | Scoring Criteria |
|---|---|---|---|---|---|
| q1 | identification | 20 | What candidate reference spectra are necessary to perform linear combination fitting on this reacted arsenopyrite sample to fully capture its potential oxidation states? | To perform linear combination fitting on this sample, the necessary candidate reference spectra are As(-I) (arsenopyrite), As(III), and As(V). These specific references are required because the arsenopyrite particles undergo dissolution and oxidation when reacted with synthetic gastric fluid for 1 hour. High-resolution nano-XANES mapping reveals that this reaction produces morphologically distinct regions with different oxidation states, including unreacted As(-I) from the parent material, oxidized As(V) in larger aggregates, and labile As(III) formed via localized reduction or readsorption. Therefore, capturing the full range of potential oxidation states across these different morphological fractions necessitates this specific three-component basis set. | Full points for identifying As(-I) (or unreacted arsenopyrite), As(III), and As(V) as the necessary reference spectra. |
| q2 | prediction | 30 | Based on the provided sample conditions (200-500 nm submicron aggregates of arsenopyrite reacted in synthetic gastric fluid), what is the dominant arsenic oxidation state expected in this specific morphological fraction? | The dominant arsenic oxidation state expected in the 200-500 nm submicron crystalline-like aggregates is As(V), which accounts for a fraction of 1.0 (100%) with an uncertainty of 10%. This specific composition results from the 1-hour reaction of arsenopyrite with synthetic gastric fluid, which causes morphologically distinct regions of the sample to develop different oxidation states. In these larger 200-500 nm submicron aggregates, the dissolution and oxidation processes drive the arsenic entirely to the highly oxidized As(V) state. This complete oxidation in the larger aggregates contrasts with other regions of the reacted sample, where different localized mechanisms dictate the speciation. | Full points for correctly identifying As(V) as the dominant (or sole) phase in this specific size fraction. |
| q3 | reasoning | 50 | Explain the geochemical reasoning for why this specific morphological fraction (200-500 nm aggregates) exhibits this dominant oxidation state, and contrast it with the speciation expected in smaller (<200 nm) nanoparticle clusters or surface coronas under the same in vitro bioassay conditions. | When arsenopyrite is reacted with synthetic gastric fluid for 1 hour, the dissolution process creates morphologically distinct regions with varying oxidation states. The larger submicron crystalline-like aggregates (200-500 nm) become completely dominated by As(V) due to extensive oxidation during the in vitro bioassay reaction. In contrast, the smaller nanoparticle clusters (<200 nm) and the particle corona exhibit a distinctly different speciation, becoming enriched in labile As(III). This enrichment of As(III) in the smaller clusters and corona is driven by localized reduction or readsorption mechanisms occurring at the particle surfaces during the dissolution process. | Full points for explaining that the larger submicron aggregates are dominated by As(V) due to oxidation, while contrasting this with the smaller nanoparticles/corona which become enriched in labile As(III) due to localized reduction or readsorption mechanisms during dissolution. |
Review
Multi-Stage Structural Transformations in Zero-Strain Lithium Titanate Unveiled by in Situ X-ray Absorption Fingerprints
Original-17
Electrochemistry
Wei Zhang et al.
DOI: 10.1021/jacs.7b07628
4 scenarios
PDF
▶
Key Paper Evidence2b, 3, p.3, p.4, p.5, p.7, p.8, p.11, p.17▶
Page 11 (PDF page 11)
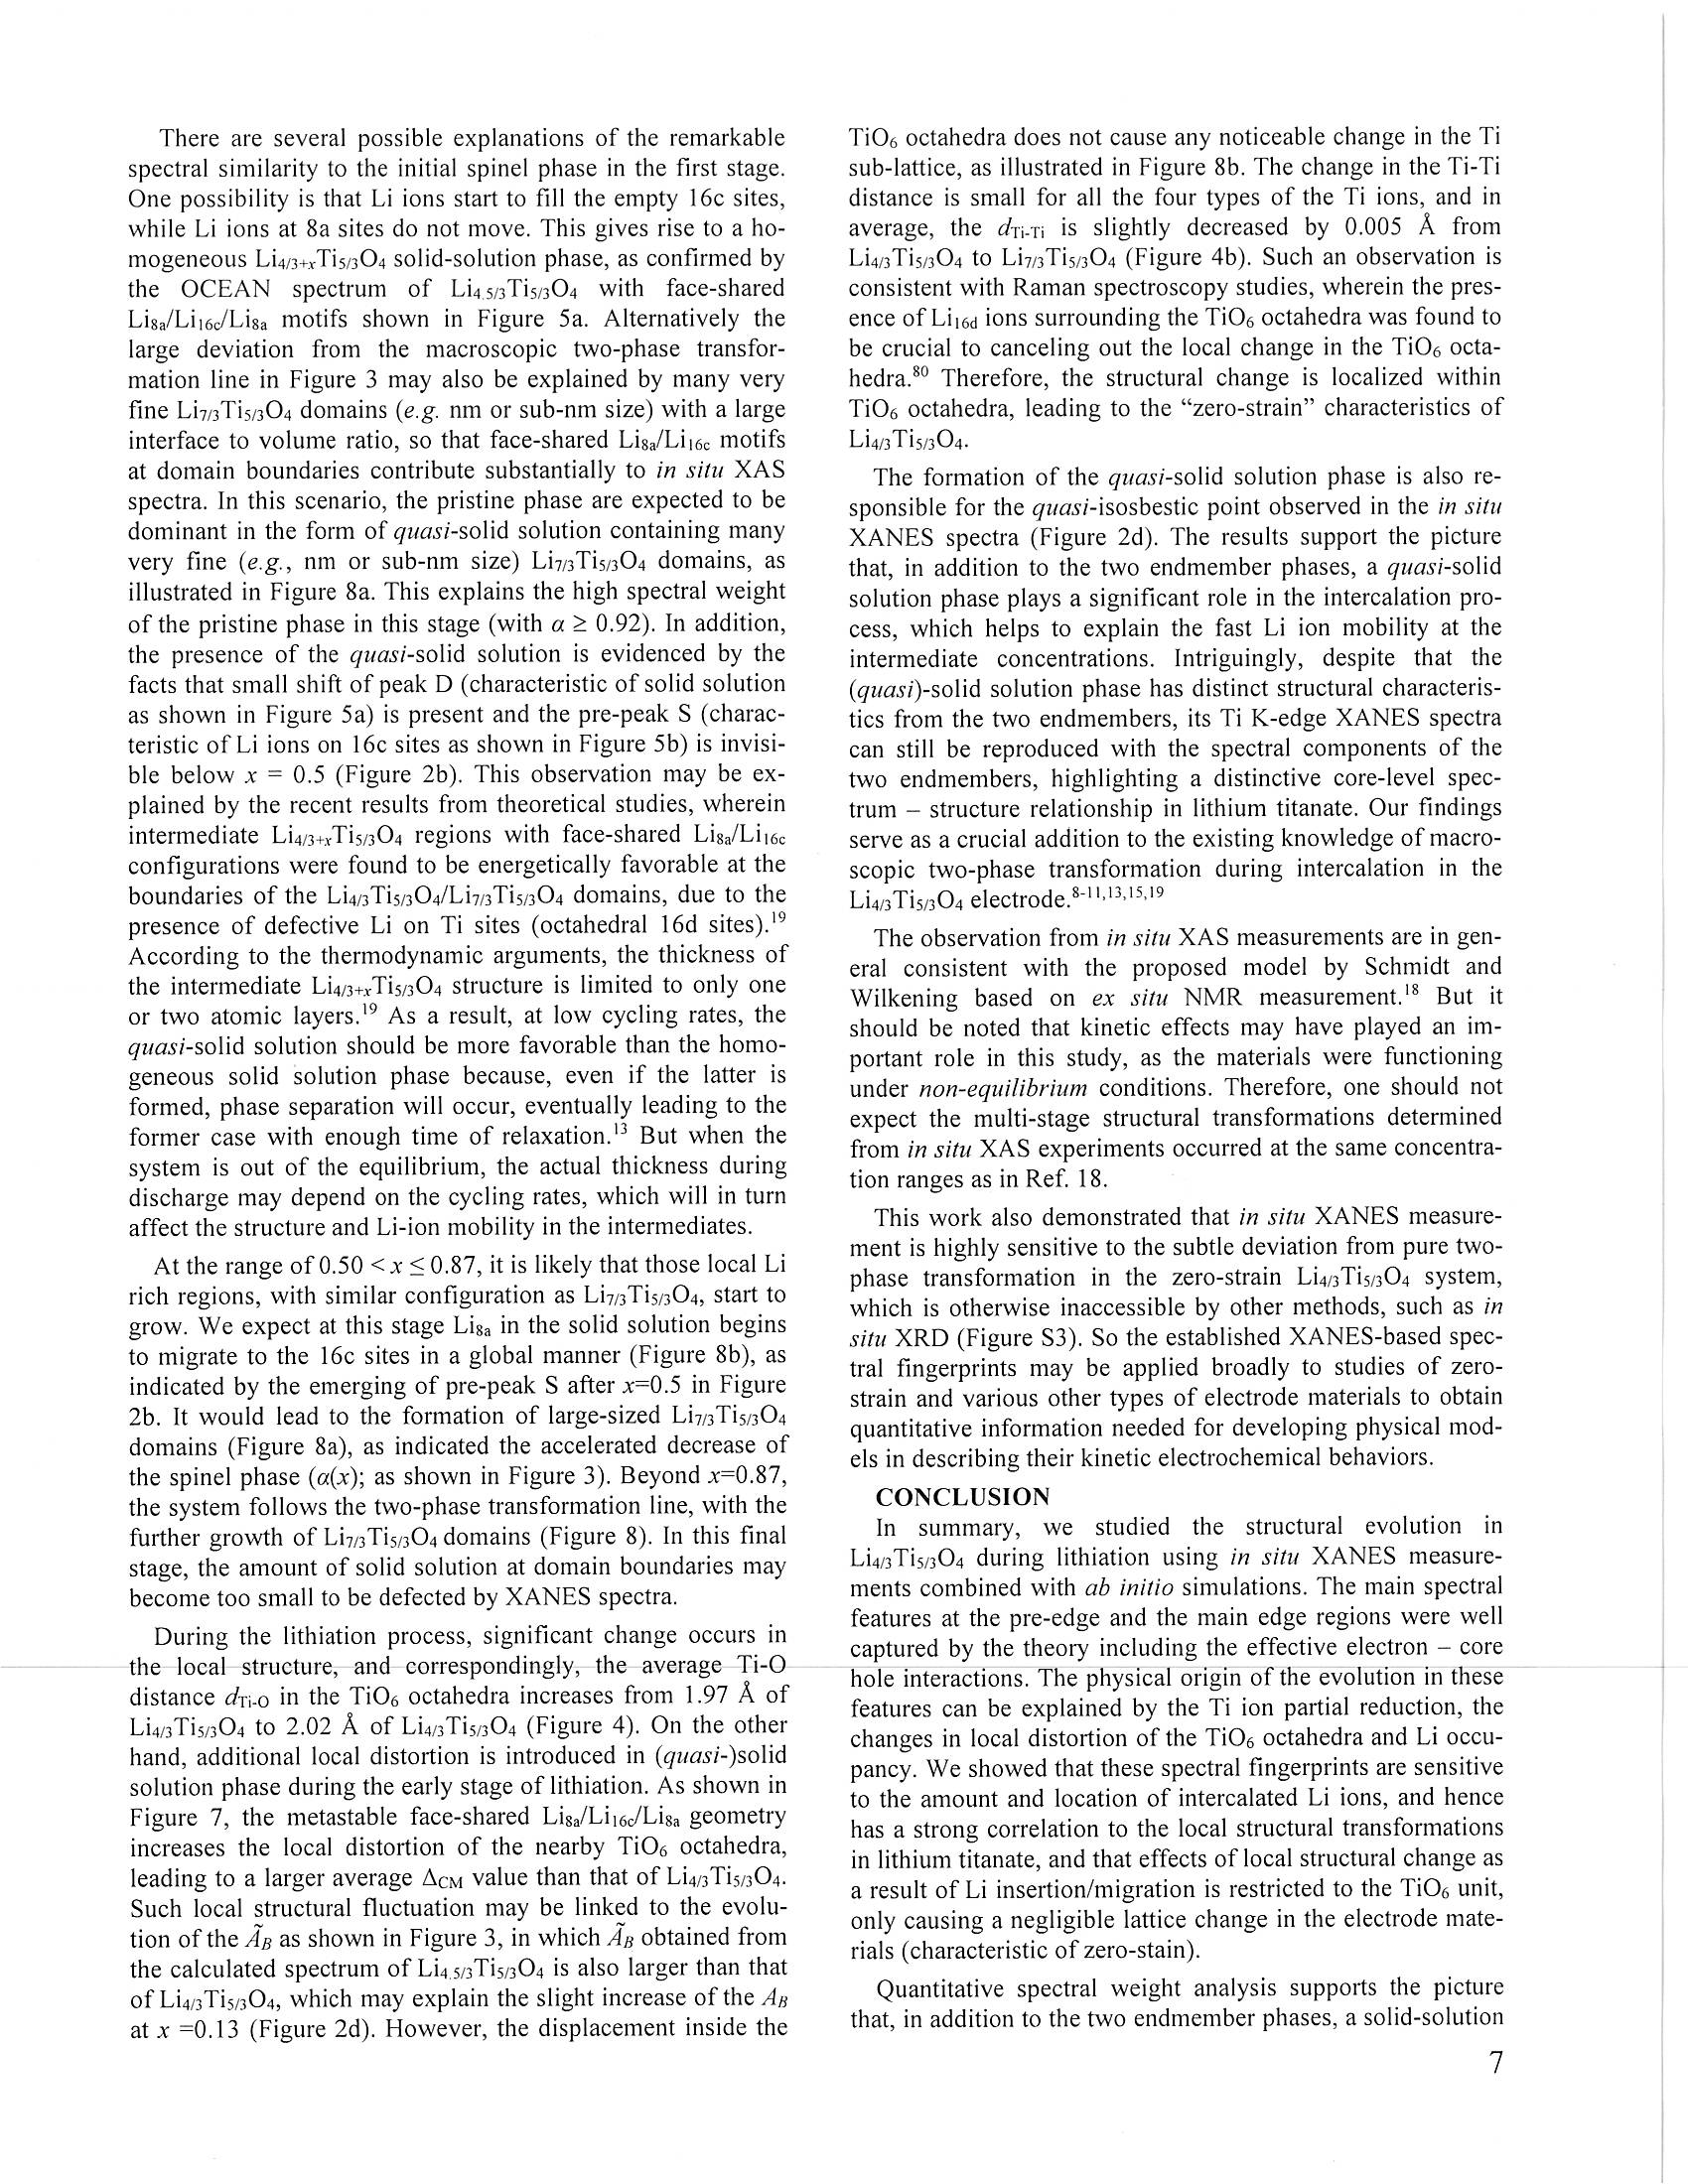
Page 17 (PDF page 17)
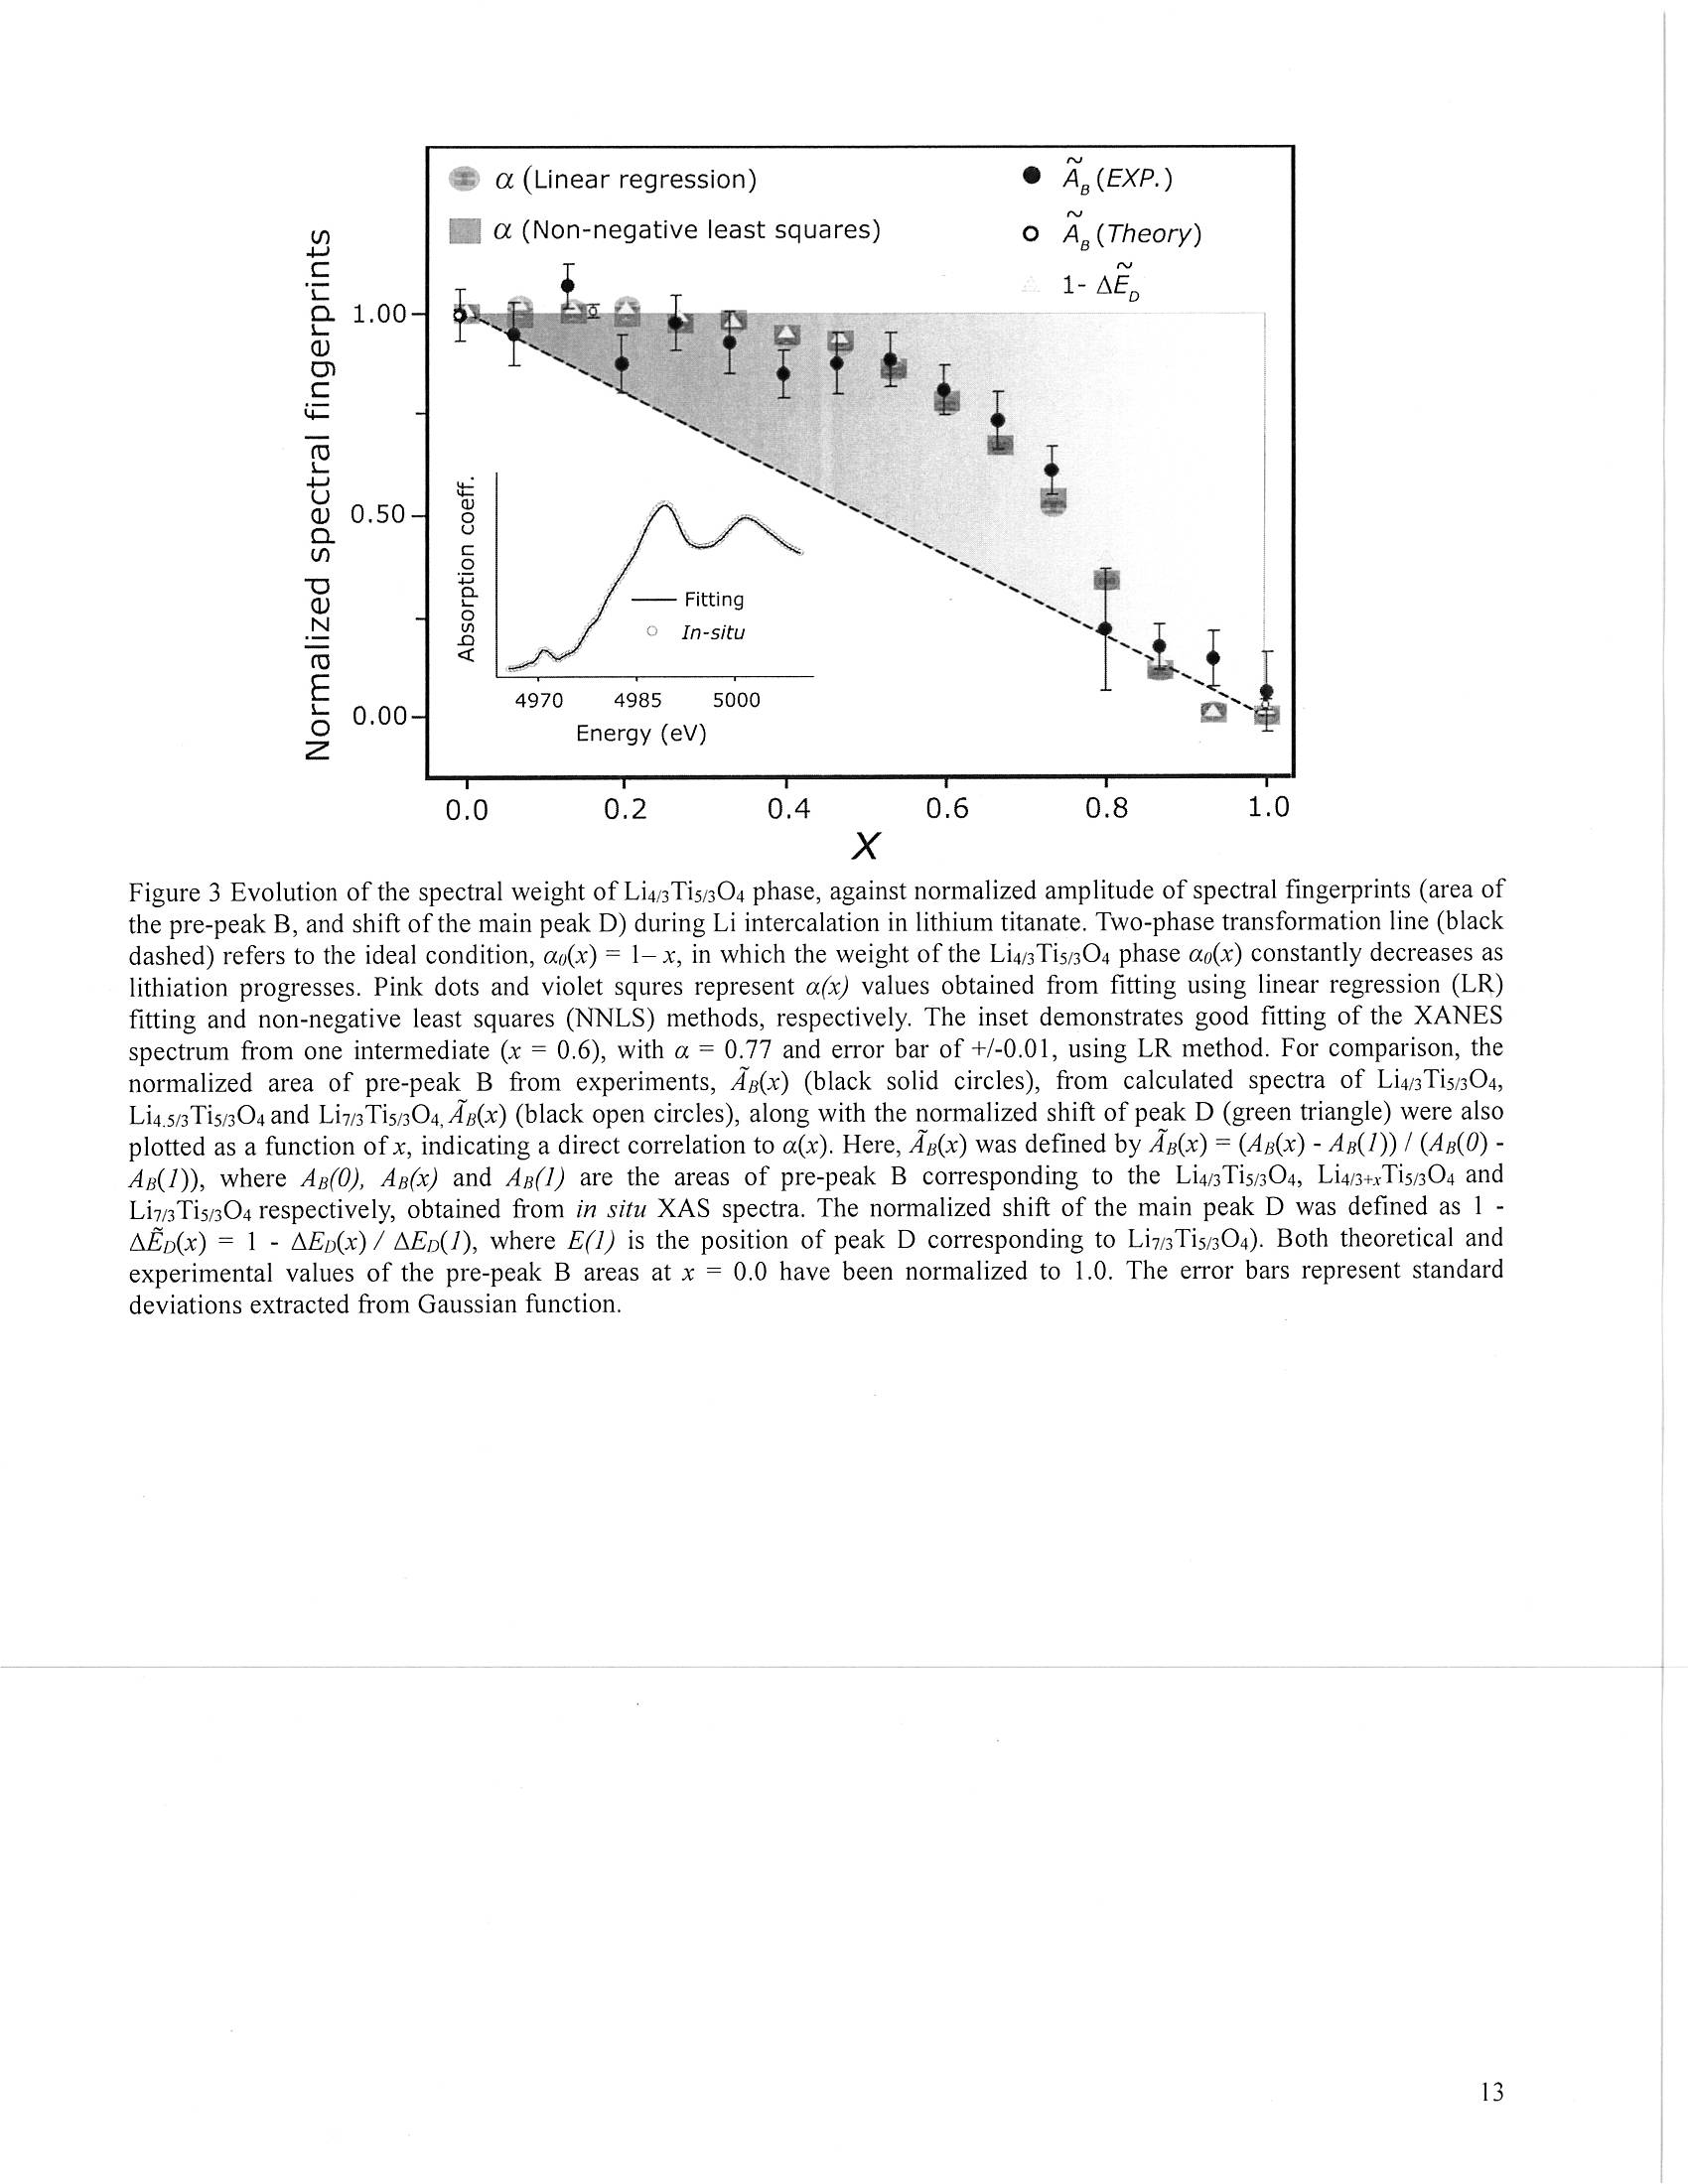
Page 3 (PDF page 3)
Page 4 (PDF page 4)

Page 5 (PDF page 5)
Page 7 (PDF page 7)
Page 8 (PDF page 8)
#14
Li4/3Ti5/3O4
Ti K
▶
LLM Prompt
Sample Information
Material: Li4/3Ti5/3O4
Electrode Type: working electrode
Electrolyte: EC/DMC/LiPF6 (1:1:1)
Cell Type: in-situ coin cell
Charge Discharge: OCV
Voltage V: 2.50
State Of Charge: 0.0
Cycle Number: 1
Sample-Specific Conditions
- Li concentration x: 0.0
- Pristine electrode before discharge
Measurement
We plan to measure the Ti K XANES spectrum of this sample.
Questions
Based on all the information above:
1. Describe the expected spectral shape and list the key peak positions (pre-edge and main edge) for the pristine Li4/3Ti5/3O4 electrode at the Ti K-edge.
2. What electronic transitions are responsible for the pre-edge peaks (A, B, C) in this spectrum, and what specific structural information does pre-peak B convey?
Ground Truth
Material: Li4/3Ti5/3O4
Measurement: Ti K-edge in-situ fluorescence mode at NSLS beamline X18A
Source evidence: Page 3, 'RESULTS AND DISCUSSION', Figure 2b; Page 5 'Spectral Interpretation via First Principles Calculations'
Key reasoning: In the pristine state (x=0), the material is pure spinel Li4/3Ti5/3O4. All Ti ions are in the 4+ oxidation state. The local structure consists of TiO6 octahedra with specific distortions that give rise to the characteristic pre-edge peak B.
Reasoning source: Page 3, Page 5
Scoring Rubric (total: 100 pts)
| Q | Type | Max | Question | Reference Answer | Scoring Criteria |
|---|---|---|---|---|---|
| q1 | spectral | 50 | Describe the expected spectral shape and list the key peak positions (pre-edge and main edge) for the pristine Li4/3Ti5/3O4 electrode at the Ti K-edge. | The expected Ti K-edge spectrum exhibits three distinct pre-edge peaks (A, B, and C) and two strong main edge peaks (D and E). The pre-edge peaks are located at 4968 eV (weak), 4971 eV (strongest pre-peak), and 4974 eV (weak), while the main edge peaks appear at 4990 eV and 5002 eV. These specific spectral features arise because the sample is a pristine, uncycled electrode at a state of charge of 0.0 (x=0.0 Li concentration). Under these initial conditions, the material is pure spinel Li4/3Ti5/3O4 where all titanium ions are in the Ti4+ oxidation state, which dictates the main edge position at 4990 eV, while the specific local distortions of the TiO6 octahedra in this pristine structure generate the characteristic pre-edge profile. | Full points for mentioning three pre-edge peaks and two main edge peaks, and providing energies close to 4968, 4971, 4974, 4990, and 5002 eV. |
| q2 | reasoning | 50 | What electronic transitions are responsible for the pre-edge peaks (A, B, C) in this spectrum, and what specific structural information does pre-peak B convey? | The pre-edge peaks (A, B, and C) originate primarily from dipole-forbidden Ti 1s to 3d (t2g and eg) electronic transitions that are hybridized with O 2p states, with peak C additionally exhibiting dipolar character from Ti-p states. Pre-peak B specifically conveys critical structural information regarding the local distortion of the TiO6 octahedra, as its high intensity is highly sensitive to these structural deviations. These features are observed because the sample is in its pristine state at 0.0 state of charge (x=0.0 Li concentration) and an open circuit voltage of 2.50 V. In this uncycled condition, the material exists as pure spinel Li4/3Ti5/3O4 with all Ti ions in the 4+ oxidation state, and the inherent local distortions of the TiO6 octahedra in this specific crystal structure directly enable the strong pre-peak B transition. | Full points for identifying the transitions as dipole-forbidden Ti 1s->3d hybridized with O 2p, and stating that peak B is sensitive to the local distortion of the TiO6 octahedron. |
Review
#15
Li4/3Ti5/3O4
Ti K
▶
LLM Prompt
Sample Information
Material: Li4/3Ti5/3O4
Electrode Type: working electrode
Electrolyte: EC/DMC/LiPF6 (1:1:1)
Cell Type: in-situ coin cell
Charge Discharge: discharging
C Rate: C/10
State Of Charge: 0.5
Cycle Number: 1
Sample-Specific Conditions
- Li concentration x: 0.5
- Electrode discharged to x=0.5, end of quasi-solid solution regime
Measurement
We plan to measure the Ti K XANES spectrum of this sample.
Questions
Based on all the information above:
1. For the Li4/3Ti5/3O4 electrode discharged to x=0.5, what reference spectra should be used as the basis for linear combination fitting, and what are the expected phase fractions?
2. At a discharge state of x=0.5, the ideal macroscopic two-phase transformation model predicts a 50% phase fraction for the pristine phase. Explain the physical reasoning for why the actual measured fraction of the pristine phase deviates so significantly from this ideal value.
3. Based on the phase fractions observed at x=0.5, what does this indicate about the kinetic pathway of Li intercalation in this zero-strain material compared to a standard two-phase reaction?
Ground Truth
Material: Li4/3Ti5/3O4
Measurement: Ti K-edge in situ X-ray absorption spectroscopy (fluorescence mode) at beamline X18A of the National Synchrotron Light Source
Fit method: Linear regression (LR) and non-negative least squares (NNLS) to a linear combination of endmember spectra
Phase fractions:
| Phase | Fraction |
|---|---|
| Li4/3Ti5/3O4 | 0.92 |
| Li7/3Ti5/3O4 | 0.08 |
Fit basis (paper's reference spectra):
- pristine Li4/3Ti5/3O4 (x=0)
- fully lithiated Li7/3Ti5/3O4 (x=1)
Source evidence: Page 4 (text) and Figure 3
Key reasoning: During early lithiation (x <= 0.5), the system undergoes a quasi-solid solution reaction rather than a macroscopic two-phase transformation. Lithium ions fill 16c sites locally, forming very fine (nm or sub-nm size) domains with face-shared Li8a/Li16c motifs. Because these regions have a large interface-to-volume ratio, the spectral weight of the pristine-like phase remains highly dominant (alpha ~ 0.92), deviating significantly from the ideal two-phase line which would predict a fraction of 0.5.
Reasoning source: Page 4 (Results and Discussion: Kinetic Transformation Pathway) and Page 7 (Discussion: Multi-stage Structural Transformations)
Scoring Rubric (total: 100 pts)
| Q | Type | Max | Question | Reference Answer | Scoring Criteria |
|---|---|---|---|---|---|
| q1 | quantification | 35 | For the Li4/3Ti5/3O4 electrode discharged to x=0.5, what reference spectra should be used as the basis for linear combination fitting, and what are the expected phase fractions? | For the linear combination fitting of the electrode discharged to x=0.5, the reference spectra should be pristine Li4/3Ti5/3O4 (x=0) and fully lithiated Li7/3Ti5/3O4 (x=1). The expected phase fractions are 0.92 for the pristine Li4/3Ti5/3O4 phase and 0.08 for the fully lithiated Li7/3Ti5/3O4 phase. These specific values result from the sample conditions (discharging at C/10 to x=0.5) because the system undergoes a quasi-solid solution reaction during early lithiation rather than a macroscopic two-phase transformation. Lithium ions locally fill 16c sites to form very fine, nanometer or sub-nanometer domains with face-shared Li8a/Li16c motifs, and the large interface-to-volume ratio of these domains causes the spectral weight of the pristine-like phase to remain highly dominant. | Full points if the answer identifies the two endmembers (pristine Li4/3Ti5/3O4 and fully lithiated Li7/3Ti5/3O4) as the basis and correctly estimates the fractions as ~0.92 for the pristine phase and ~0.08 for the lithiated phase. |
| q2 | reasoning | 40 | At a discharge state of x=0.5, the ideal macroscopic two-phase transformation model predicts a 50% phase fraction for the pristine phase. Explain the physical reasoning for why the actual measured fraction of the pristine phase deviates so significantly from this ideal value. | The measured fraction of the pristine phase deviates significantly from the ideal 50%, remaining highly dominant at 0.92, because the material does not undergo a macroscopic two-phase transformation at this stage. Under the sample conditions of early lithiation (discharged to x=0.5 at C/10), the system instead undergoes a quasi-solid solution reaction where lithium ions locally fill 16c sites. This creates very fine (nanometer or sub-nanometer size) domains characterized by face-shared Li8a/Li16c motifs. Because these extremely small regions possess a large interface-to-volume ratio, the local structural environment probed by XANES remains predominantly pristine-like, causing the spectral weight to heavily favor the pristine phase rather than the 50% predicted by an ideal two-phase line. | Full points if the answer explains that the system undergoes a quasi-solid solution reaction at this stage, forming very fine (nm or sub-nm) domains with face-shared Li motifs, which causes the spectral weight of the pristine phase to remain dominant due to the large interface-to-volume ratio. |
| q3 | reasoning | 25 | Based on the phase fractions observed at x=0.5, what does this indicate about the kinetic pathway of Li intercalation in this zero-strain material compared to a standard two-phase reaction? | The observed phase fractions of 0.92 for pristine Li4/3Ti5/3O4 and 0.08 for fully lithiated Li7/3Ti5/3O4 indicate that the kinetic pathway of Li intercalation proceeds via a quasi-solid solution reaction rather than a standard macroscopic two-phase reaction. At the sample condition of x=0.5 during C/10 discharge, a standard two-phase reaction would yield a 0.5 phase fraction for the pristine phase. Instead, lithium ions fill 16c sites locally to form very fine (nanometer or sub-nanometer) domains with face-shared Li8a/Li16c motifs. The large interface-to-volume ratio of these fine domains causes the spectral weight of the pristine-like phase to remain highly dominant, demonstrating that early lithiation occurs through localized, nanoscale structural changes rather than the growth of bulk secondary phases. | Full points if the answer notes that the intercalation follows a multi-stage kinetic process where a quasi-solid solution precedes macroscopic phase separation, delaying the onset of the two-phase transformation until higher Li concentrations. |
Review
#16
Li4/3Ti5/3O4
Ti K
▶
LLM Prompt
Sample Information
Material: Li4/3Ti5/3O4
Electrode Type: working electrode
Electrolyte: EC/DMC/LiPF6 (1:1:1)
Cell Type: in-situ coin cell
Charge Discharge: discharging
C Rate: C/10
State Of Charge: 0.6
Cycle Number: 1
Sample-Specific Conditions
- Li concentration x: 0.6
- Electrode discharged to x=0.6 during two-phase transformation
Measurement
We plan to measure the Ti K XANES spectrum of this sample.
Questions
Based on all the information above:
1. What reference spectra (endmembers) are appropriate for performing a linear combination fit of the Ti K-edge XANES spectrum for this intermediate lithiation state?
2. Estimate the phase fractions of the endmembers at this state of charge (x=0.6). Note that this system exhibits non-ideal two-phase behavior during kinetic in-situ measurements.
3. Explain why the phase fraction of the pristine material at x=0.6 deviates significantly from the ideal two-phase transformation line (which would predict 40% pristine phase).
Ground Truth
Material: Li4/3Ti5/3O4
Measurement: Ti K-edge in-situ fluorescence mode at beamline X18A
Fit method: Linear regression (LR)
Phase fractions: (±1%)
| Phase | Fraction |
|---|---|
| Li4/3Ti5/3O4 | 0.77 |
| Li7/3Ti5/3O4 | 0.23 |
Fit basis (paper's reference spectra):
- Li4/3Ti5/3O4
- Li7/3Ti5/3O4
Source evidence: Figure 3 caption, page 17
Key reasoning: During lithiation, the system undergoes a multi-stage kinetic process. At x=0.6, the system is in an intermediate stage (0.50 < x <= 0.87) where macroscopic phase separation begins to occur. However, the transformation deviates significantly from an ideal two-phase reaction (where the pristine phase fraction would be 1-x = 0.4). Instead, the spectral weight of the pristine Li4/3Ti5/3O4 phase remains high (0.77) due to the presence of a quasi-solid solution or fine domains with a large interface-to-volume ratio before full macroscopic phase separation.
Reasoning source: RESULTS AND DISCUSSION, Kinetic Transformation Pathway (pages 7-8) and Figure 3 caption (page 17)
Scoring Rubric (total: 100 pts)
| Q | Type | Max | Question | Reference Answer | Scoring Criteria |
|---|---|---|---|---|---|
| q1 | identification | 20 | What reference spectra (endmembers) are appropriate for performing a linear combination fit of the Ti K-edge XANES spectrum for this intermediate lithiation state? | The appropriate reference spectra for the linear combination fit are the pristine Li4/3Ti5/3O4 phase and the fully lithiated Li7/3Ti5/3O4 phase. These endmembers are expected because the working electrode is undergoing an in-situ discharging process at a C/10 rate, driving lithium insertion into the material. At a lithium concentration of x=0.6, the system enters an intermediate kinetic stage (0.50 < x <= 0.87) where macroscopic phase separation between the initial Li4/3Ti5/3O4 and the lithiated Li7/3Ti5/3O4 begins to occur. Using these two phases accounts for the quasi-solid solution or fine domain structures present before full macroscopic phase separation is complete. | Full points for identifying the fully delithiated (Li4/3Ti5/3O4) and fully lithiated (Li7/3Ti5/3O4) phases. |
| q2 | quantification | 40 | Estimate the phase fractions of the endmembers at this state of charge (x=0.6). Note that this system exhibits non-ideal two-phase behavior during kinetic in-situ measurements. | At a lithium concentration of x=0.6, the estimated phase fractions are 0.77 for the pristine Li4/3Ti5/3O4 phase and 0.23 for the lithiated Li7/3Ti5/3O4 phase. These specific values result from the multi-stage kinetic process occurring during the C/10 in-situ discharge, which deviates significantly from an ideal two-phase reaction. While an ideal reaction would predict a pristine fraction of 0.40 (1-x), the measured fraction remains anomalously high at 0.77. This occurs because, at this intermediate stage, the system forms a quasi-solid solution or fine domains with a large interface-to-volume ratio rather than undergoing immediate, full macroscopic phase separation. | Full points for estimating ~77% Li4/3Ti5/3O4 and ~23% Li7/3Ti5/3O4. Partial credit for values reflecting a significant deviation from the ideal 1-x (40%) rule, showing higher retention of the pristine phase. |
| q3 | reasoning | 40 | Explain why the phase fraction of the pristine material at x=0.6 deviates significantly from the ideal two-phase transformation line (which would predict 40% pristine phase). | The phase fraction of the pristine material deviates from the ideal 40% prediction because the in-situ discharging of the Li4/3Ti5/3O4 electrode at C/10 follows a multi-stage kinetic transformation pathway rather than an ideal two-phase reaction. At the specific state of charge of x=0.6, the system is in an intermediate stage (0.50 < x <= 0.87) where macroscopic phase separation is only just beginning. Instead of forming distinct bulk phases, the material exists as a quasi-solid solution or as fine domains with a large interface-to-volume ratio. As a result of this delayed macroscopic phase separation, the spectral weight of the pristine Li4/3Ti5/3O4 phase remains disproportionately high at 0.77. | Full points for explaining that the system undergoes a multi-stage kinetic process involving a quasi-solid solution or fine domains with large interfaces, which delays the macroscopic phase separation and keeps the spectral weight of the pristine-like local structure higher than expected. |
Review
#17
Li4/3Ti5/3O4
Ti K
▶
LLM Prompt
Sample Information
Material: Li4/3Ti5/3O4
Electrode Type: working electrode
Electrolyte: EC/DMC/LiPF6 (1:1:1)
Cell Type: in-situ coin cell
Charge Discharge: discharging
C Rate: C/10
State Of Charge: 0.87
Cycle Number: 1
Sample-Specific Conditions
- Li concentration x: 0.87
- Electrode discharged to x=0.87, intersection with ideal two-phase line
Measurement
We plan to measure the Ti K XANES spectrum of this sample.
Questions
Based on all the information above:
1. What candidate reference spectra are needed to perform Linear Combination Fitting (LCF) for this lithium titanate electrode at a discharge state of x=0.87?
2. Estimate the phase fractions of the endmembers at a state of charge of x=0.87, given that this point represents the intersection with the ideal two-phase line.
3. Explain the physical reasoning for why the phase fractions at x=0.87 align with the ideal two-phase transformation line, in contrast to the deviations observed at earlier stages of lithiation in this material.
Ground Truth
Material: Li4/3Ti5/3O4
Measurement: Ti K-edge in situ fluorescence mode at beamline X18A
Fit method: Linear regression (LR) and Non-negative least squares (NNLS)
Phase fractions:
| Phase | Fraction |
|---|---|
| Li4/3Ti5/3O4 | 0.13 |
| Li7/3Ti5/3O4 | 0.87 |
Fit basis (paper's reference spectra):
- Li4/3Ti5/3O4 (pristine endmember)
- Li7/3Ti5/3O4 (fully lithiated endmember)
Source evidence: Page 8 text and Figure 3
Key reasoning: During lithiation, the system initially forms a quasi-solid solution, causing the phase fraction to deviate from the ideal two-phase line. However, at x = 0.87, the system rapidly segregates into macroscopic two phases, and the spectral weight of the pristine phase intersects with the ideal two-phase line (1-x). Beyond this point, the system follows the two-phase transformation line because the amount of solid solution at domain boundaries becomes too small to be detected by XANES.
Reasoning source: Page 8 (Results and Discussion) and Page 11 (Multi-stage Structural Transformations)
Scoring Rubric (total: 100 pts)
| Q | Type | Max | Question | Reference Answer | Scoring Criteria |
|---|---|---|---|---|---|
| q1 | identification | 20 | What candidate reference spectra are needed to perform Linear Combination Fitting (LCF) for this lithium titanate electrode at a discharge state of x=0.87? | To perform Linear Combination Fitting (LCF) for this electrode, the required reference spectra are the pristine endmember Li4/3Ti5/3O4 and the fully lithiated endmember Li7/3Ti5/3O4. These specific phases are expected because, during the C/10 discharge process to a lithium concentration of x=0.87, the material undergoes lithiation and rapidly segregates into macroscopic two phases. While the system initially forms a quasi-solid solution during earlier discharge stages, at x=0.87 the amount of solid solution at the domain boundaries becomes too small to be detected by XANES. Consequently, the system's state is entirely defined by these two endmember phases. | Full points for identifying the two endmembers: pristine Li4/3Ti5/3O4 and fully lithiated Li7/3Ti5/3O4. |
| q2 | quantification | 40 | Estimate the phase fractions of the endmembers at a state of charge of x=0.87, given that this point represents the intersection with the ideal two-phase line. | The estimated phase fractions for this sample are 0.13 for the pristine Li4/3Ti5/3O4 endmember and 0.87 for the fully lithiated Li7/3Ti5/3O4 endmember. These specific values result from the electrode being discharged to a lithium concentration of x=0.87, where the system intersects with the ideal two-phase line. At this exact point, the spectral weight of the pristine phase strictly follows the (1-x) relationship, yielding 1 - 0.87 = 0.13. This precise quantification occurs because the material has rapidly segregated into macroscopic two phases, and any quasi-solid solution previously present at the domain boundaries has become too small to be detected by XANES. | Full points for estimating ~0.13 (or 13%) for Li4/3Ti5/3O4 and ~0.87 (or 87%) for Li7/3Ti5/3O4. Partial credit for identifying that it follows the 1-x relationship. |
| q3 | reasoning | 40 | Explain the physical reasoning for why the phase fractions at x=0.87 align with the ideal two-phase transformation line, in contrast to the deviations observed at earlier stages of lithiation in this material. | During the initial stages of the C/10 discharge, the lithiation of the Li4/3Ti5/3O4 electrode causes the system to form a quasi-solid solution, resulting in phase fractions that deviate from ideal behavior. However, upon reaching a lithium concentration of x=0.87, the system rapidly segregates into macroscopic two phases consisting of the pristine and fully lithiated endmembers. At this specific state of charge, the spectral weight of the pristine phase intersects with the ideal two-phase line (1-x). The fractions align perfectly with this line from x=0.87 onward because the volume of the solid solution at the domain boundaries becomes too small to be detected by XANES measurements. | Full points for explaining that the system rapidly segregates into macroscopic two phases at this concentration, and that the amount of the intermediate quasi-solid solution at domain boundaries becomes too small to be detected by XANES, causing the system to follow the ideal two-phase (1-x) line. |
Review
Prediction of the Cu oxidation state from EELS and XAS spectra using supervised machine learning
Original-17
Pure Phase
Samuel P. Gleason, Deyu Lu, Jim Ciston
DOI: 10.1038/s41524-024-01408-1
3 scenarios
PDF
▶
Key Paper Evidence3a, 3b, 3c, 3d, 3e, 3f, p.4, p.8▶
Figure 3a (PDF page 4)
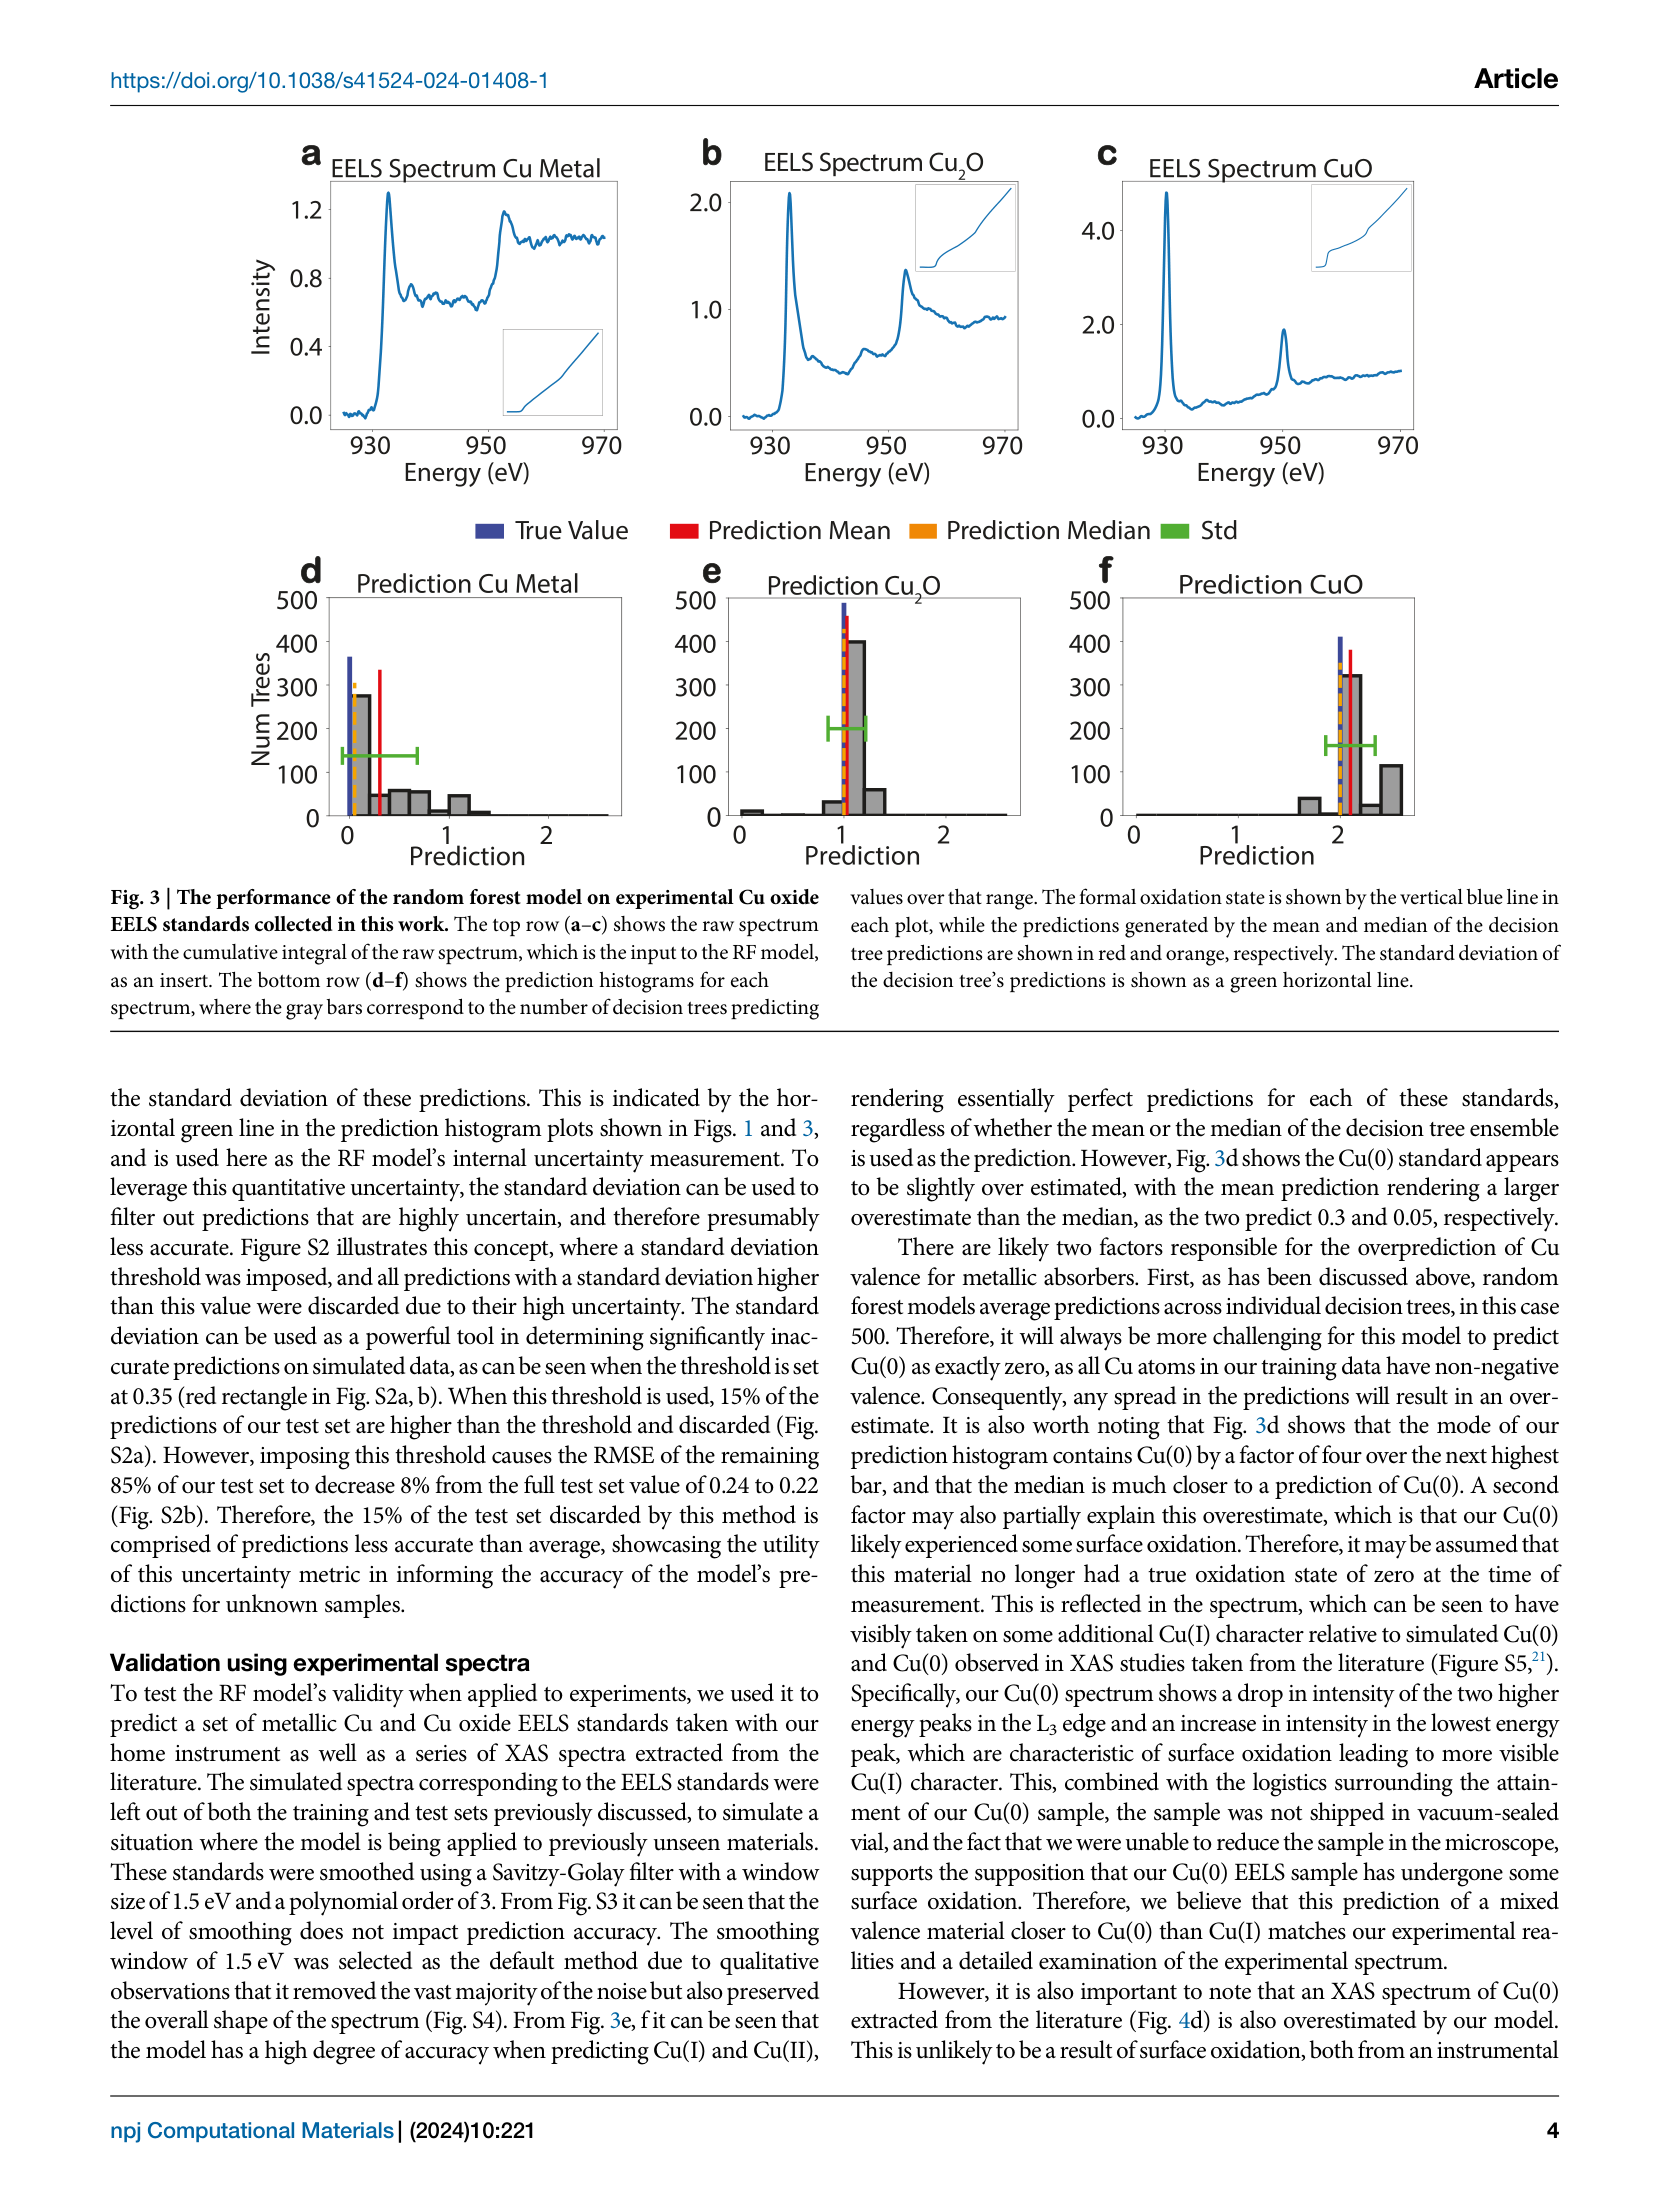
Page 8 (PDF page 8)
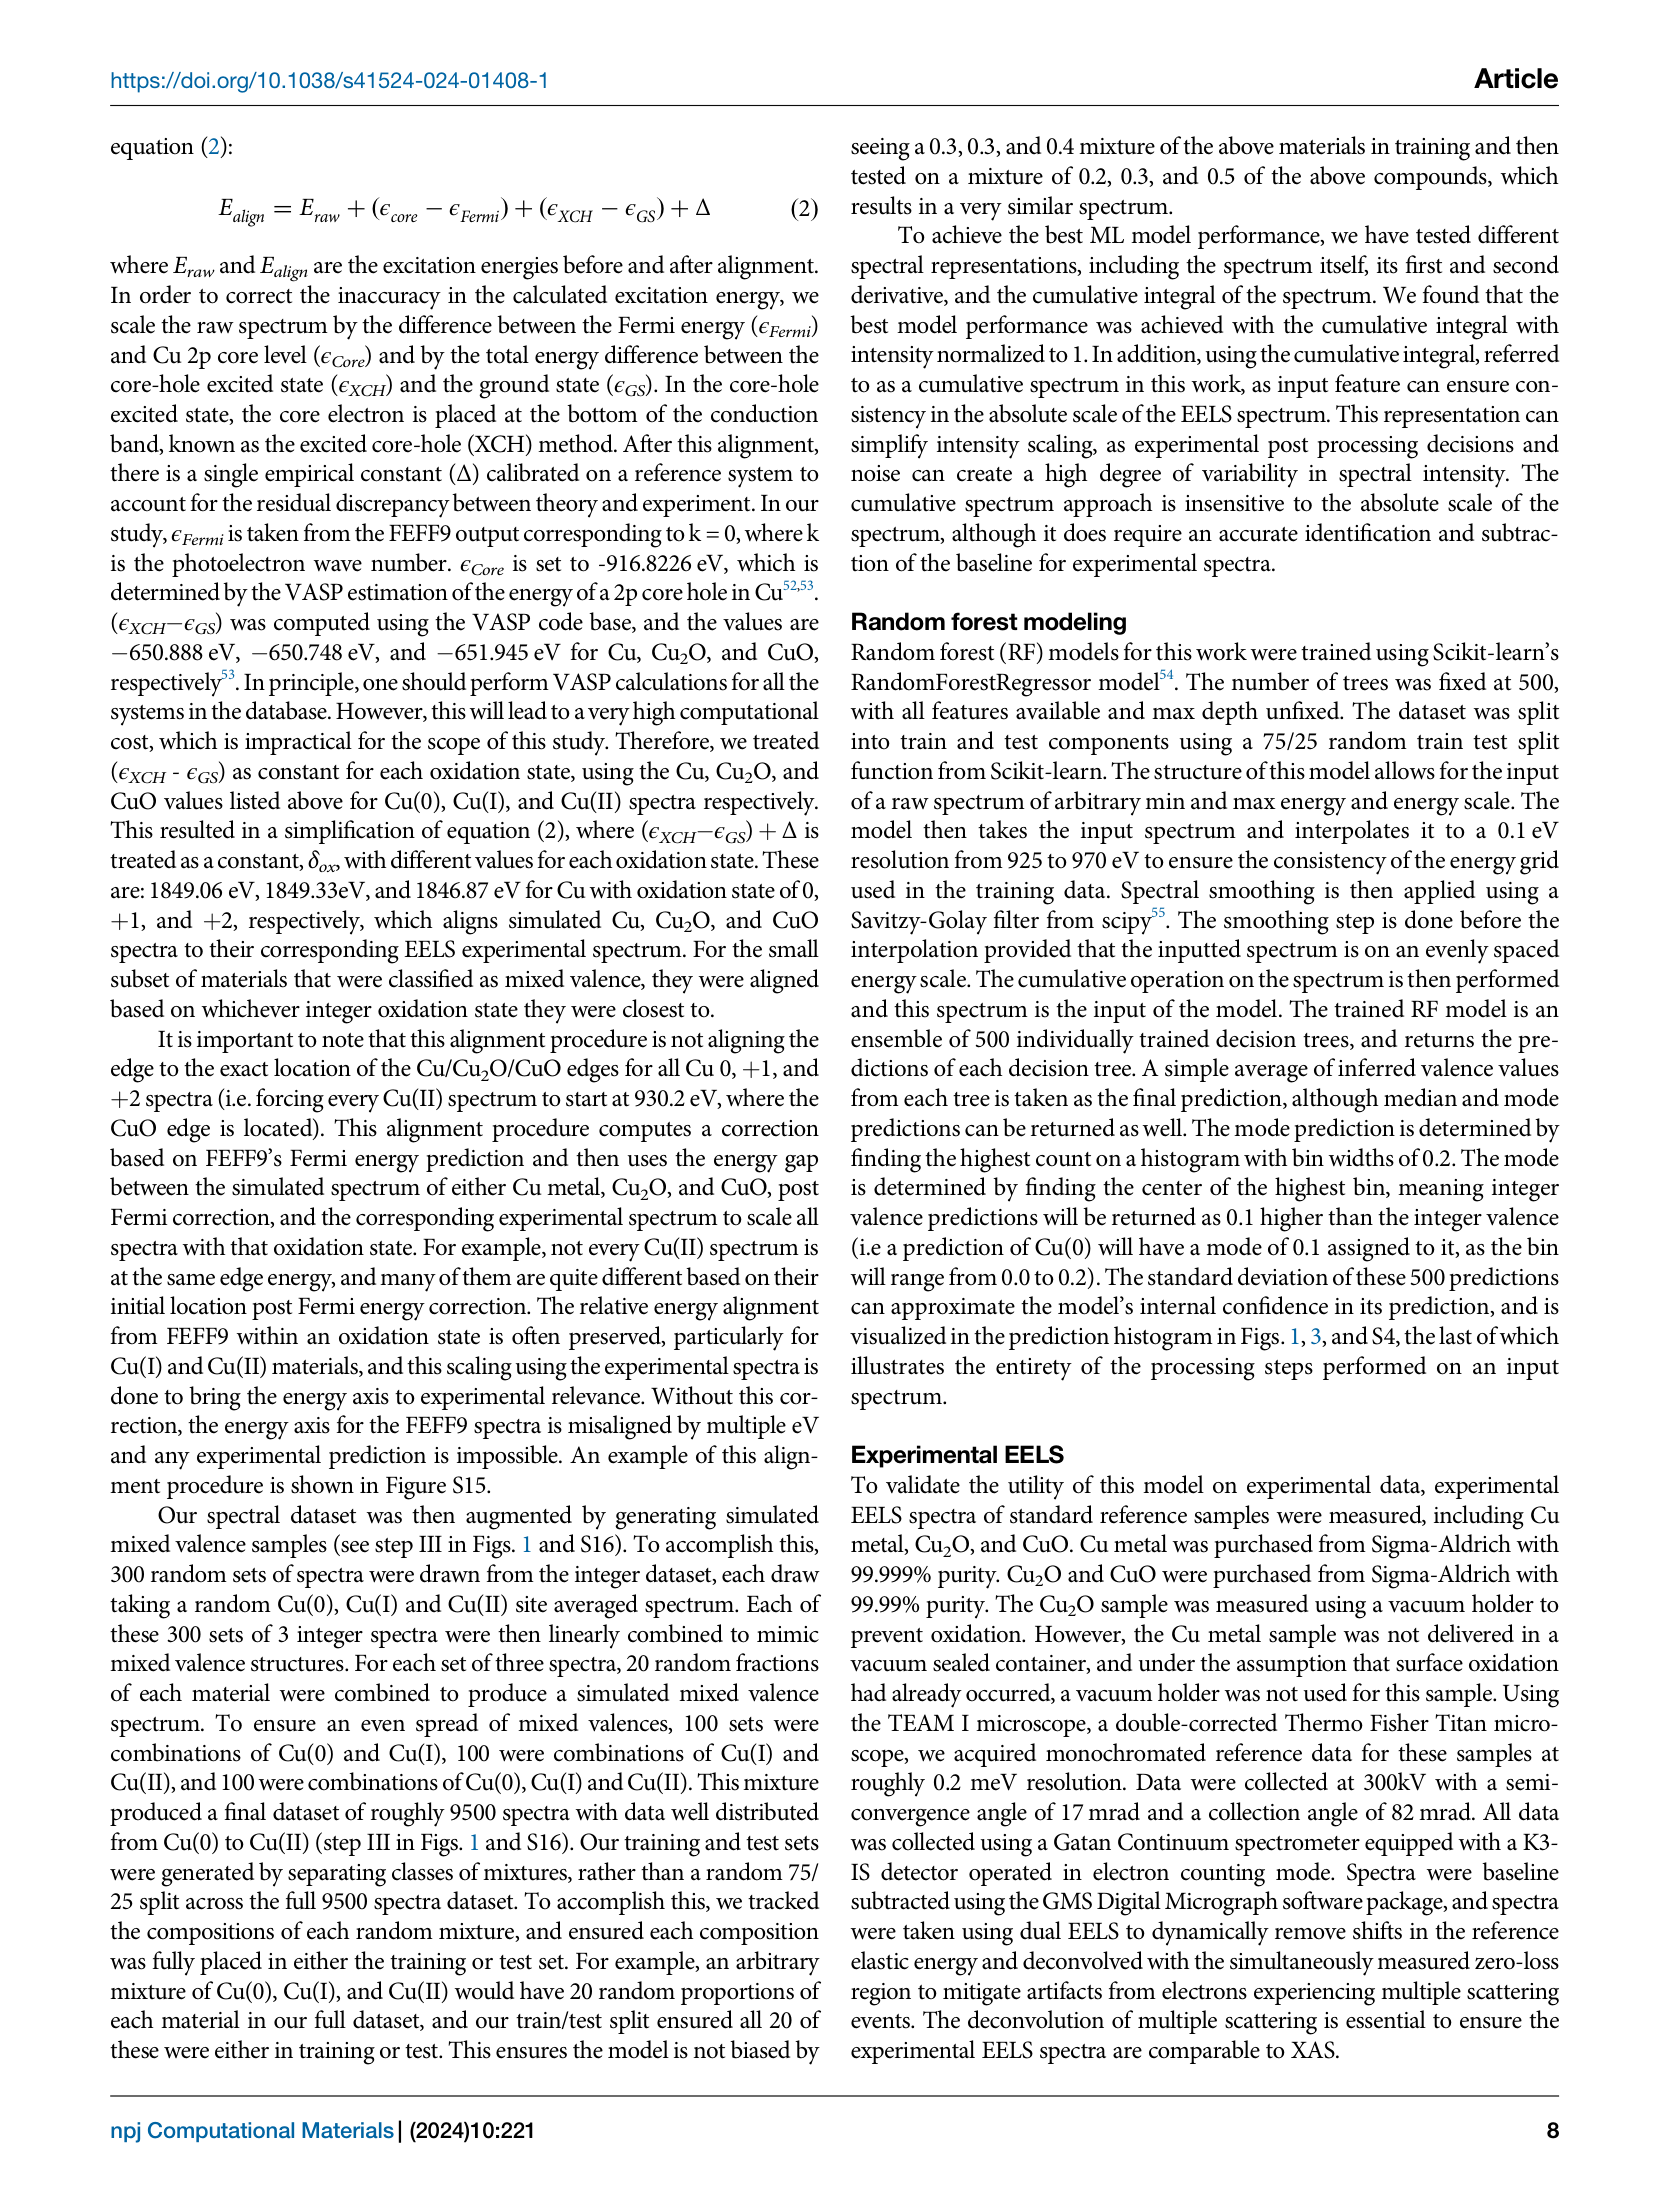
#18
Cu
Cu L
▶
LLM Prompt
Sample Information
Material: Cu
Oxidation State: 0
Sample Form: powder
Measurement Mode: EELS
- Experimental EELS standard for Cu metal
Measurement
We plan to measure the Cu L XANES spectrum of this sample.
Questions
Based on all the information above:
1. Based on the sample conditions (Cu metal powder, not vacuum sealed), what specific spectral features would you expect to observe in the Cu L-edge EELS spectrum compared to a pristine Cu(0) reference?
2. Why might an experimental EELS standard for Cu metal (99.999% purity) exhibit an apparent mixed valence state rather than a pure oxidation state of 0, and what physical factors contribute to this?
3. How does the L3/L2 edge intensity and peak structure of a pristine Cu(0) sample differ from one that has undergone surface oxidation?
Ground Truth
Compound: Cu metal
Oxidation state: 0 (nominal, but exhibits Cu(I) character)
Measurement: Cu L-edge EELS
Edge position: ~930 eV (L3 edge onset)
Spectral shape: The spectrum exhibits an L3 edge starting around 930 eV and an L2 edge around 950 eV. Compared to a pristine Cu(0) spectrum, this sample shows an increase in the lowest energy peak of the L3 edge and a drop in the two higher energy peaks, indicating Cu(I) character from surface oxidation.
Labeled peaks:
| Label | Energy (eV) | Intensity | Origin | Source |
|---|---|---|---|---|
| L3 edge lowest energy peak | ~932 eV | increased relative to pure Cu(0) | surface oxidation leading to Cu(I) character | paper_data |
| L3 edge higher energy peaks | ~935-940 eV | decreased relative to pure Cu(0) | not discussed in this paper | paper_data |
| L2 edge | ~950 eV | higher than L3 in pure Cu(0) | not discussed in this paper | paper_data |
Distinguishing features: A pristine Cu(0) spectrum typically has relatively equal heights of the three L3 edge peaks and the L3 is lower in intensity than the L2 edge. This experimental sample deviates by showing increased intensity in the lowest energy L3 peak due to surface oxidation.
Key reasoning: The Cu(0) sample was not shipped in a vacuum-sealed vial and could not be reduced in the microscope, supporting the supposition that it underwent surface oxidation. This is reflected in the spectrum taking on additional Cu(I) character, specifically a drop in intensity of the two higher energy peaks in the L3 edge and an increase in intensity in the lowest energy peak.
Reasoning source: Page 4, 'Validation using experimental spectra'
Scoring Rubric (total: 100 pts)
| Q | Type | Max | Question | Reference Answer | Scoring Criteria |
|---|---|---|---|---|---|
| q1 | prediction | 40 | Based on the sample conditions (Cu metal powder, not vacuum sealed), what specific spectral features would you expect to observe in the Cu L-edge EELS spectrum compared to a pristine Cu(0) reference? | I would expect the spectrum to exhibit an L3 edge onset around 930 eV and an L2 edge around 950 eV, but with distinct deviations from a pristine Cu(0) reference. Specifically, the lowest energy peak of the L3 edge (~932 eV) will show an increase in intensity, while the two higher energy peaks (~935-940 eV) will decrease in intensity. These spectral changes occur because the Cu(0) powder sample was not shipped in a vacuum-sealed vial and could not be reduced in the microscope. Consequently, the sample undergoes surface oxidation, causing the spectrum to take on additional Cu(I) character rather than remaining purely metallic. | The answer must mention the emergence of Cu(I) character due to surface oxidation, specifically noting an increase in the intensity of the lowest energy peak of the L3 edge and a drop in the intensity of the two higher energy peaks. |
| q2 | reasoning | 30 | Why might an experimental EELS standard for Cu metal (99.999% purity) exhibit an apparent mixed valence state rather than a pure oxidation state of 0, and what physical factors contribute to this? | The experimental EELS standard for Cu metal exhibits an apparent mixed valence state, specifically taking on additional Cu(I) character, due to surface oxidation. This occurs because the Cu(0) powder sample was not shipped in a vacuum-sealed vial, exposing it to the environment, and it could not be reduced in the microscope prior to measurement. As a result, the physical surface of the powder oxidizes, leading to a spectrum that reflects a 1.0 fraction of Cu metal with surface oxidation rather than a pure oxidation state of 0. This oxidation manifests physically in the spectrum as a drop in the intensity of the two higher energy L3 peaks and an increase in the lowest energy L3 peak. | The answer must explain that the sample likely underwent surface oxidation (forming Cu(I)) because it was not kept in a vacuum-sealed environment and could not be reduced in the microscope. |
| q3 | spectral | 30 | How does the L3/L2 edge intensity and peak structure of a pristine Cu(0) sample differ from one that has undergone surface oxidation? | A pristine Cu(0) spectrum typically features an L3 edge (onset ~930 eV) that is lower in overall intensity than the L2 edge (~950 eV), and it possesses three L3 edge peaks of relatively equal heights. In contrast, a sample that has undergone surface oxidation exhibits an increased intensity in the lowest energy L3 peak (~932 eV) and a decreased intensity in the two higher energy L3 peaks (~935-940 eV). These structural differences in the peaks arise because the unsealed Cu powder sample oxidizes in the environment and cannot be reduced in the microscope. This environmental exposure introduces Cu(I) character to the nominally Cu(0) sample, fundamentally altering the electronic structure and resulting in the observed shifts in L3 peak intensities. | The answer must state that pristine Cu(0) has relatively equal heights for the three L3 edge peaks and the L3 edge is lower in intensity than the L2 edge, whereas surface oxidation increases the intensity of the lowest energy L3 peak. |
Review
#19
Cu2O
Cu L
▶
LLM Prompt
Sample Information
Material: Cu2O
Oxidation State: +1
Sample Form: powder
Measurement Mode: EELS
- Experimental EELS standard for Cu2O
Measurement
We plan to measure the Cu L XANES spectrum of this sample.
Questions
Based on all the information above:
1. Based on the provided text, how does the Cu L-edge spectrum of Cu(I) in Cu2O distinguish itself from the spectra of Cu(0) and Cu(II)?
2. Why is it expected that this specific Cu2O experimental standard maintains a pure +1 oxidation state during measurement, avoiding the mixed-valence issues observed in the Cu(0) sample?
Ground Truth
Compound: Cu2O
Oxidation state: +1
Measurement: Cu L-edge EELS
Edge position: not reported exactly, but L3 peak is at almost exactly the same energy as Cu(0)
Spectral shape: The spectrum features a sharp, high-intensity L3 peak and a distinct L2 peak. In its cumulative integral representation, the higher intensity of Cu(I) is very noticeable as a sharply increasing region in the L3 edge region.
Labeled peaks:
| Label | Energy (eV) | Intensity | Origin | Source |
|---|---|---|---|---|
| L3 edge | ~932 eV (estimated from Fig 3b) | high, sharp peak | not discussed in this paper | paper_data |
| L2 edge | ~952 eV (estimated from Fig 3b) | lower than L3 | not discussed in this paper | paper_data |
Distinguishing features: Cu(I) has an L3 peak at almost exactly the same energy as Cu(0), making them hard to differentiate by position alone. However, Cu(I) is distinguished from Cu(0) by having higher maximum intensity and sharper peaks. It is distinguished from Cu(II) because the Cu(II) L3 edge is red-shifted by roughly 3 eV.
Key reasoning: The sample is a commercial standard of 99.99% purity. It was measured using a vacuum holder specifically to prevent surface oxidation, ensuring it remained a pure Cu(I) phase. The Random Forest model predicts its oxidation state as exactly +1, matching the formal oxidation state of Cu(I) in Cu2O.
Reasoning source: Methods (Experimental EELS, page 8) and Results (Validation using experimental spectra, page 4)
Scoring Rubric (total: 100 pts)
| Q | Type | Max | Question | Reference Answer | Scoring Criteria |
|---|---|---|---|---|---|
| q1 | spectral | 57 | Based on the provided text, how does the Cu L-edge spectrum of Cu(I) in Cu2O distinguish itself from the spectra of Cu(0) and Cu(II)? | The Cu L-edge spectrum of Cu(I) in Cu2O features a sharp, high-intensity L3 peak at ~932 eV and a distinct L2 peak at ~952 eV. It distinguishes itself from Cu(0) by exhibiting higher maximum intensity and sharper peaks, even though their L3 peaks occur at almost exactly the same energy. Furthermore, it is easily differentiated from Cu(II), which has an L3 edge red-shifted by roughly 3 eV. These distinct spectral features are observed because the sample is a 99.99% pure Cu2O powder measured using a vacuum holder to prevent surface oxidation. This ensures the electronic structure remains a pure +1 oxidation state, yielding a sharply increasing cumulative integral at the L3 edge that perfectly matches the formal Cu(I) state. | Full credit requires noting that Cu(I) shares almost the exact same L3 peak energy as Cu(0) but has higher maximum intensity and sharper peaks, and that it differs from Cu(II) because Cu(II) is red-shifted by roughly 3 eV. |
| q2 | reasoning | 43 | Why is it expected that this specific Cu2O experimental standard maintains a pure +1 oxidation state during measurement, avoiding the mixed-valence issues observed in the Cu(0) sample? | The Cu2O experimental standard is expected to maintain a pure +1 oxidation state because it is a highly pure (99.99%) commercial powder. To avoid the mixed-valence or surface oxidation issues often seen in copper samples, this specific sample was measured using a vacuum holder during the EELS measurement. By isolating the sample from environmental oxygen, any further oxidation to Cu(II) is prevented. As a result, the sample's structural and electronic integrity is preserved, allowing the Random Forest model to predict an oxidation state of exactly +1, which perfectly matches the formal Cu(I) state of pure Cu2O. | Full credit requires mentioning that the sample was 99.99% pure and was measured using a vacuum holder specifically to prevent surface oxidation. |
Review
#20
CuO
Cu L
▶
LLM Prompt
Sample Information
Material: CuO
Oxidation State: +2
Sample Form: powder
Measurement Mode: EELS
- Experimental EELS standard for CuO
Measurement
We plan to measure the Cu L XANES spectrum of this sample.
Questions
Based on all the information above:
1. What is the primary distinguishing feature of the Cu L3 edge position for CuO (Cu(II)) compared to Cu(0) and Cu(I) species?
2. Describe the expected overall spectral shape of the CuO L-edge EELS spectrum, specifically regarding the relative intensities of the L3 and L2 peaks.
3. How do the peak intensities and shapes of this Cu(II) standard compare to lower oxidation state copper standards (like Cu(0)), and how does this manifest in the cumulative spectrum?
Ground Truth
Compound: CuO
Oxidation state: +2
Measurement: Cu L-edge EELS
Edge position: 930.2 eV
Spectral shape: The spectrum features a sharp, high-intensity L3 peak followed by a lower-intensity L2 peak. The cumulative integral of the spectrum shows a sharply increasing region at the L3 edge.
Labeled peaks:
| Label | Energy (eV) | Intensity | Origin | Source |
|---|---|---|---|---|
| L3 edge | 930.2 eV | High/sharp | not discussed in this paper | paper_data |
| L2 edge | ~950 eV | Lower than L3 | not discussed in this paper | paper_data |
Distinguishing features: The Cu(II) L3 edge is red-shifted (lower in energy) by roughly 2 to 3 eV compared to Cu(I) and Cu(0). It also exhibits higher maximum intensity and sharper peaks compared to Cu(0).
Key reasoning: The CuO sample is a 99.99% pure commercial standard used to validate the model's ability to predict the +2 oxidation state. The model accurately predicts the +2 state for this sample, relying heavily on the location and shape of the L3 peak, which is distinctly red-shifted compared to lower oxidation states.
Reasoning source: Validation using experimental spectra (Page 4) and Experimental EELS (Page 8)
Scoring Rubric (total: 100 pts)
| Q | Type | Max | Question | Reference Answer | Scoring Criteria |
|---|---|---|---|---|---|
| q1 | spectral | 40 | What is the primary distinguishing feature of the Cu L3 edge position for CuO (Cu(II)) compared to Cu(0) and Cu(I) species? | The primary distinguishing feature of the Cu L3 edge position for CuO is that it is distinctly red-shifted (lower in energy) by roughly 2 to 3 eV compared to Cu(I) and Cu(0) species. This occurs because the sample is a 99.99% pure commercial powder standard of CuO, which consists entirely of copper in the +2 oxidation state. The specific electronic structure of the +2 oxidation state in this pure CuO powder dictates this characteristic red-shift of the L3 peak to 930.2 eV. Consequently, this distinct peak location allows models like Random Forest regression to accurately predict and validate the +2 oxidation state directly from the EELS measurement. | The answer must state that the Cu(II) L3 edge is red-shifted (or lower in energy) by approximately 2 to 3 eV compared to Cu(0) and Cu(I). |
| q2 | spectral | 30 | Describe the expected overall spectral shape of the CuO L-edge EELS spectrum, specifically regarding the relative intensities of the L3 and L2 peaks. | The expected overall spectral shape of the CuO L-edge EELS spectrum features a sharp, high-intensity L3 peak at 930.2 eV followed by a lower-intensity L2 peak at approximately 950 eV. Because the sample is a pure CuO powder standard containing exclusively Cu(II), its specific electronic configuration inherently produces this distinct spectral profile with a dominant L3 edge. The +2 oxidation state dictates these structural and electronic properties, yielding a sharply increasing region at the L3 edge in the cumulative integral of the spectrum. This distinct shape, with the L3 peak being much sharper and more intense than the L2 peak, serves as the primary basis for validating the +2 oxidation state in the experimental EELS measurement. | The answer must note that the spectrum features a sharp L3 peak that has a significantly higher intensity than the subsequent L2 peak. |
| q3 | spectral | 30 | How do the peak intensities and shapes of this Cu(II) standard compare to lower oxidation state copper standards (like Cu(0)), and how does this manifest in the cumulative spectrum? | The Cu(II) standard exhibits a higher maximum intensity and sharper peaks compared to lower oxidation states like Cu(0). In the cumulative integral of the spectrum, this manifests as a sharply increasing region specifically at the L3 edge. These features arise directly from the sample being a 99.99% pure CuO powder, which exclusively contains copper in the +2 oxidation state. The specific electronic structure of the +2 state in this experimental EELS standard produces this distinctly red-shifted and sharper L3 peak, which the Random Forest regression model heavily relies upon to accurately validate and predict the +2 oxidation state. | The answer must mention that Cu(II) has higher maximum intensity and sharper peaks than Cu(0), which results in a sharply increasing region at the L3 edge in the cumulative spectrum. |
Review
Simulated sulfur K-edge X-ray absorption spectroscopy database of lithium thiophosphate solid electrolytes
Original-17
Pure Phase
Haoyue Guo et al.
DOI: 10.1038/s41597-023-02262-4
4 scenarios
PDF
▶
Key Paper Evidence3a, 3b, 3c, 3d, p.2, p.5, p.6▶
Figure 3a (PDF page 5)
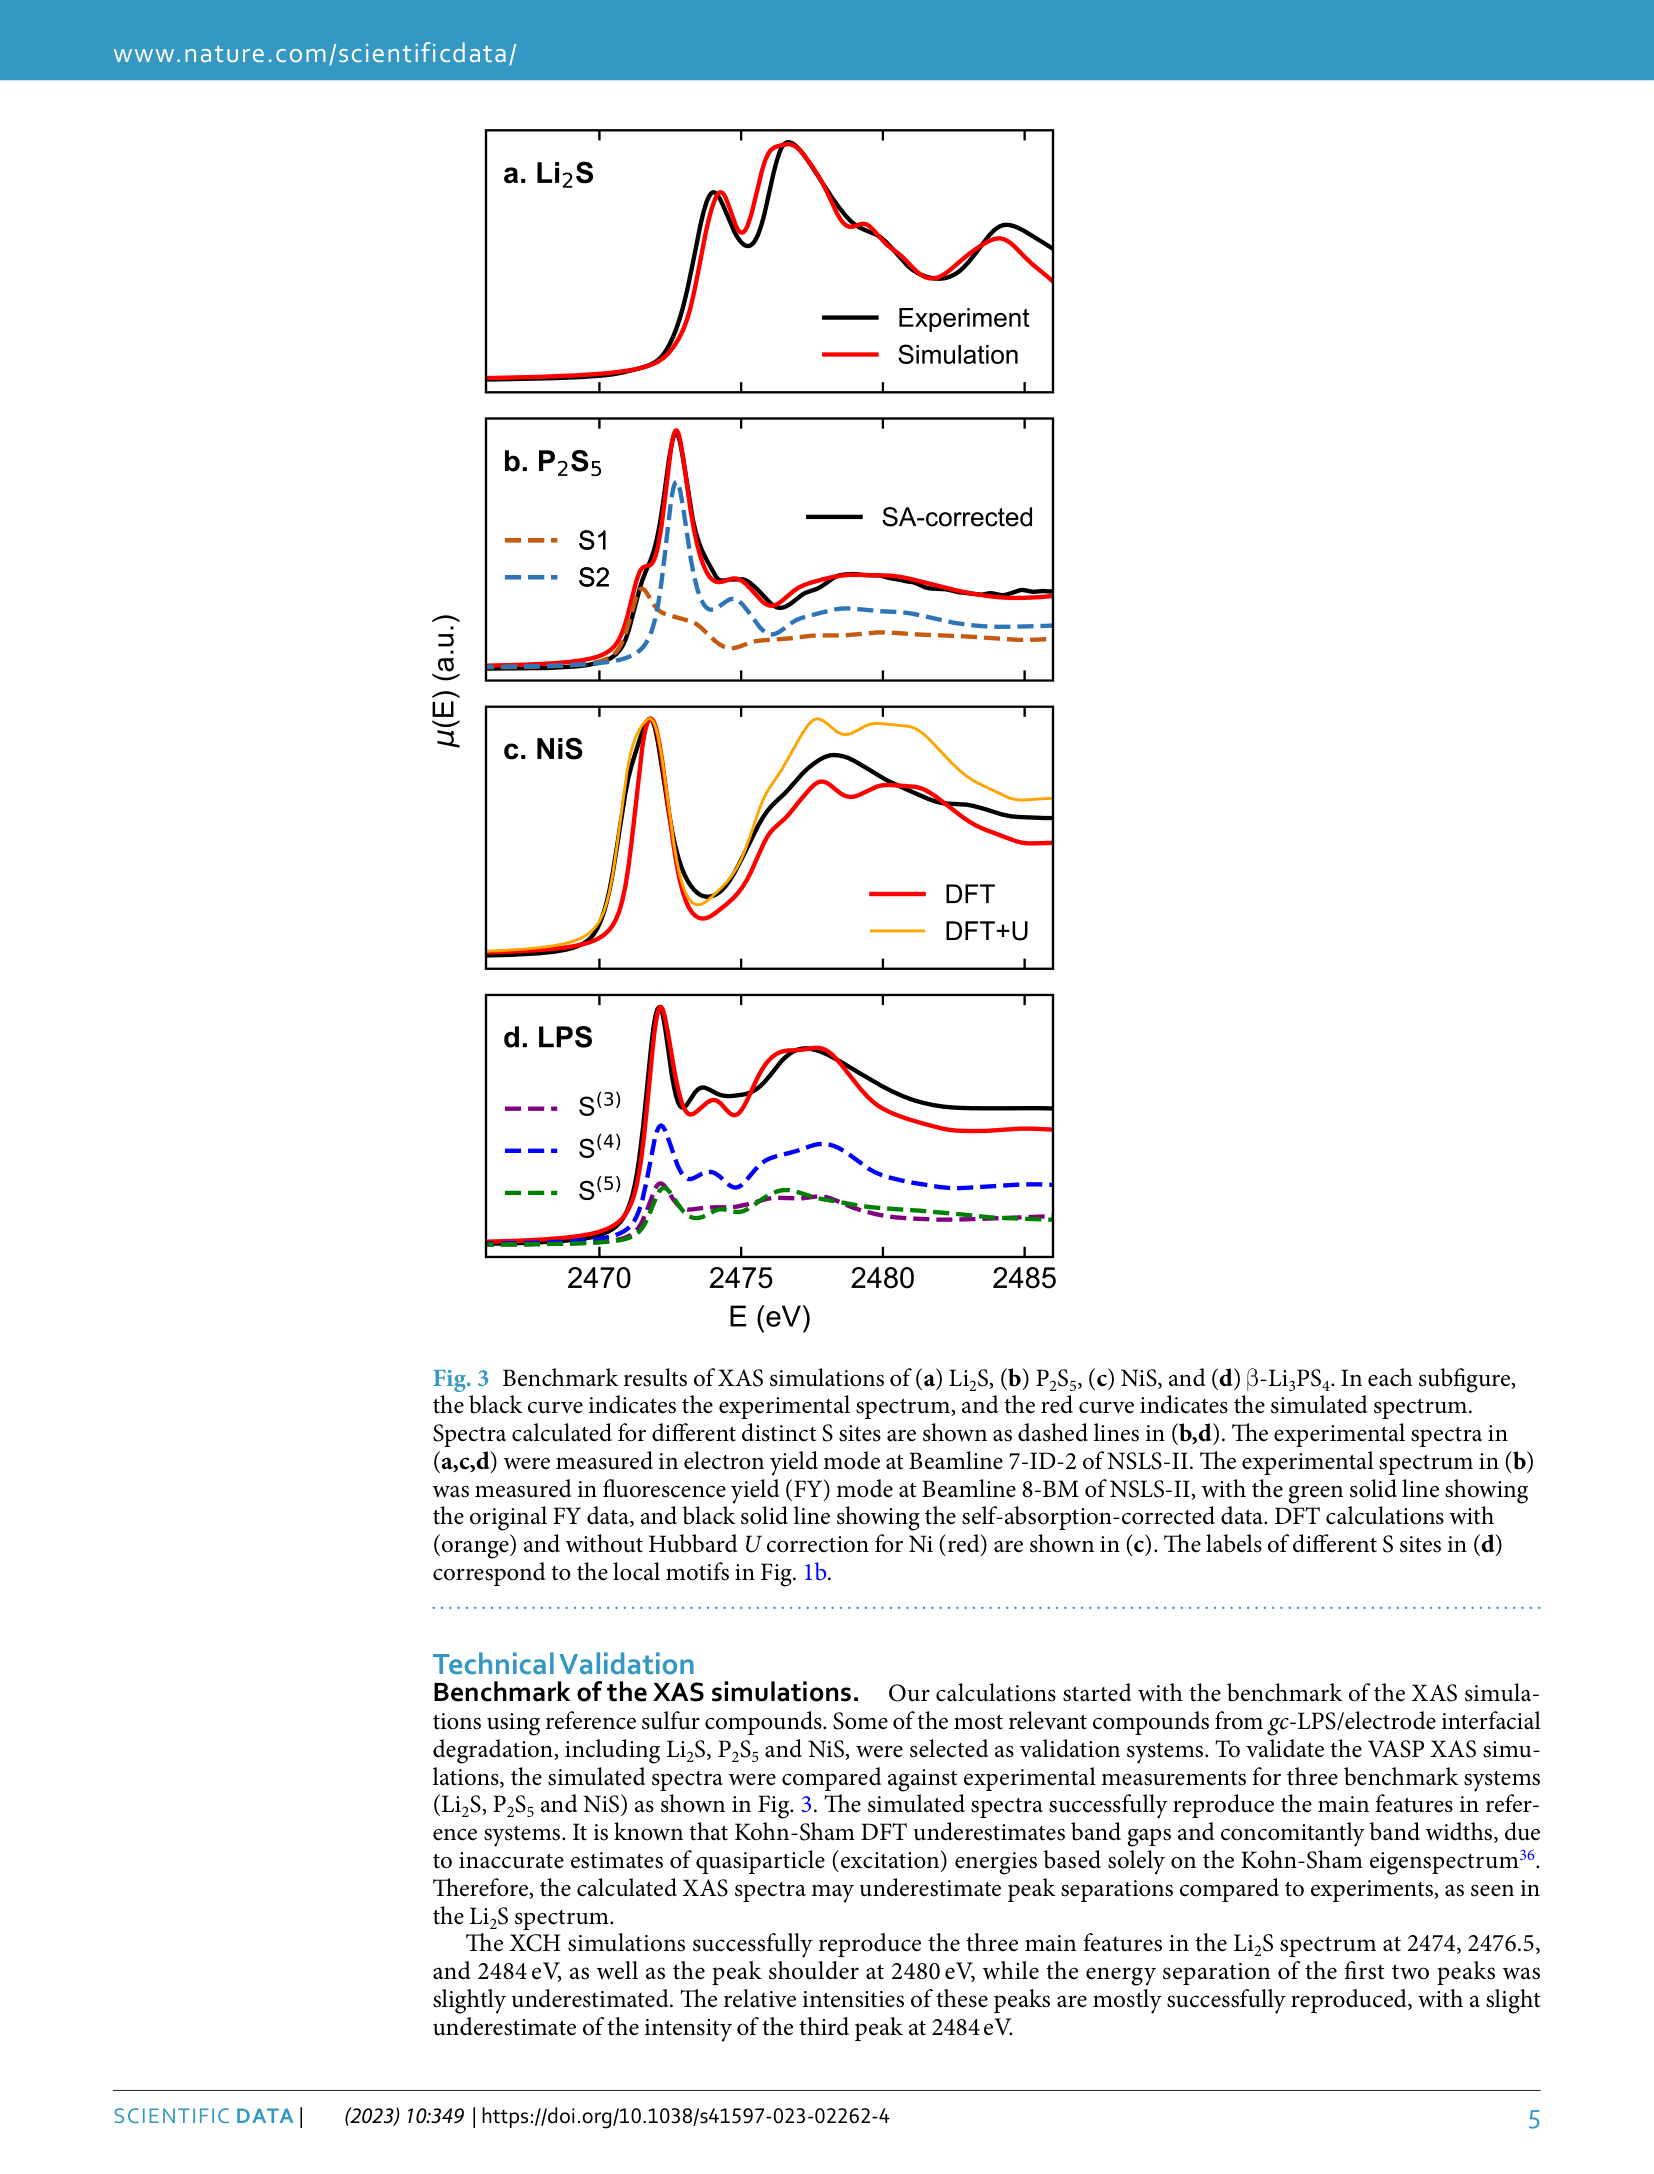
Page 2 (PDF page 2)
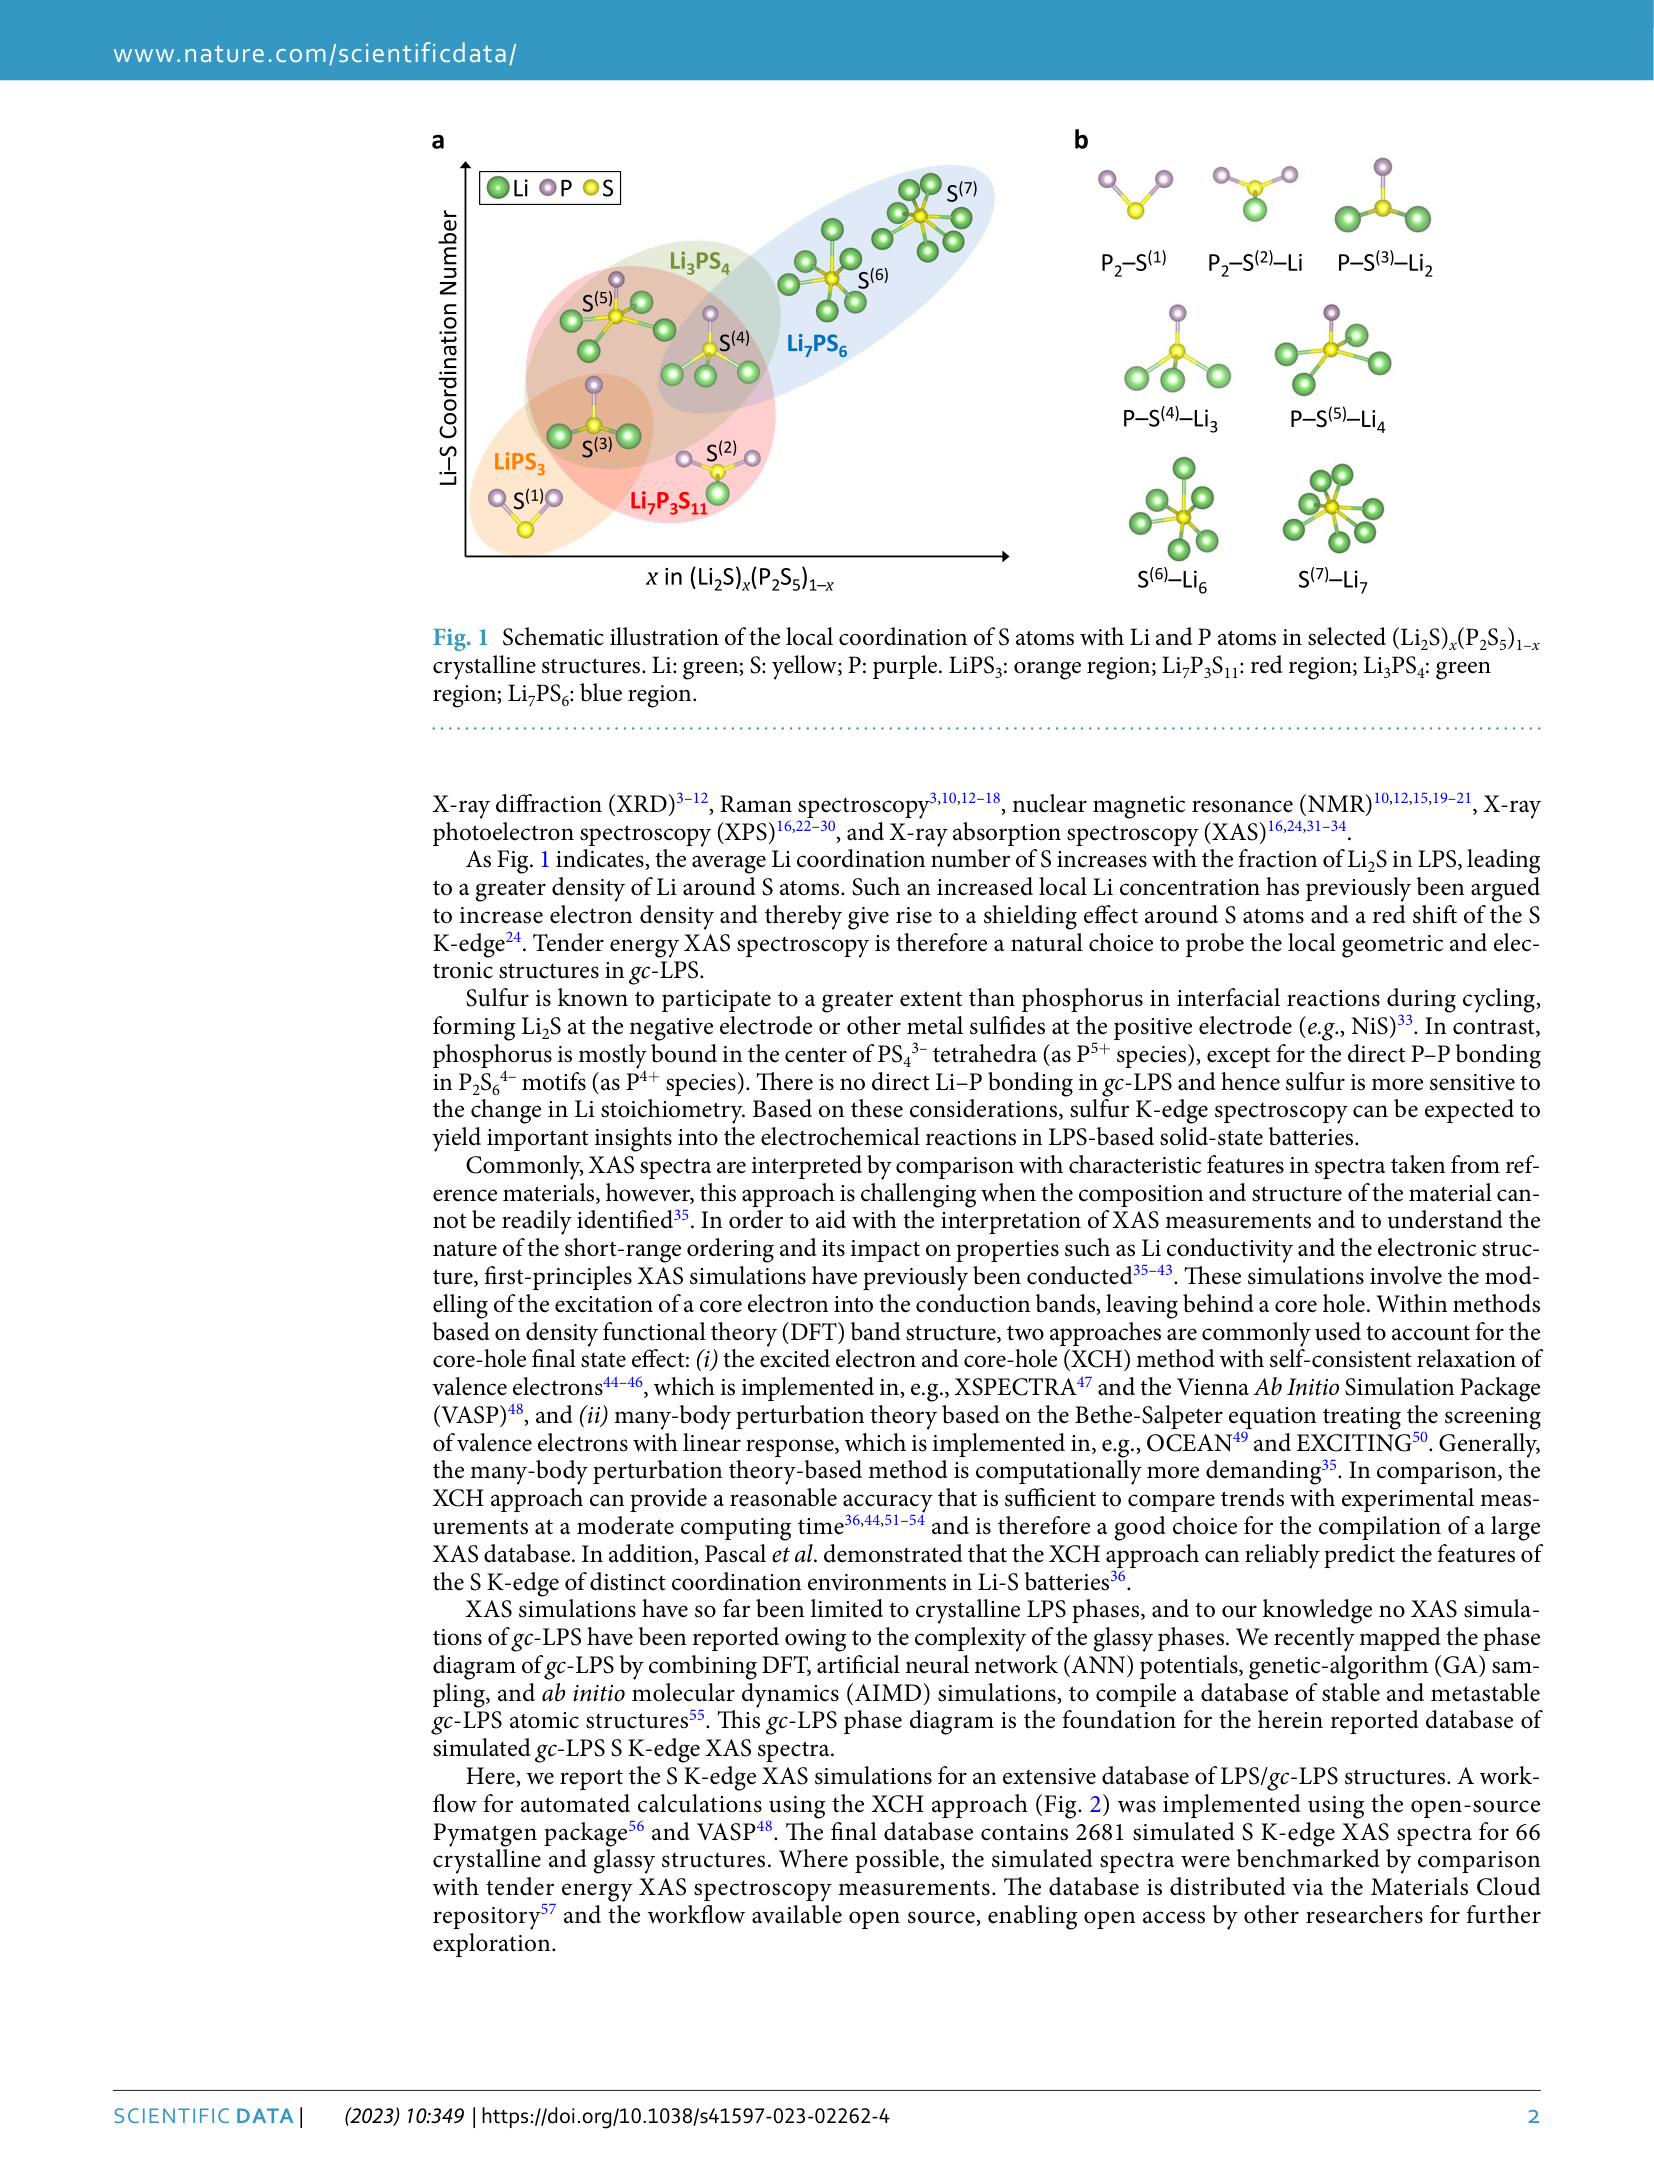
Page 6 (PDF page 6)
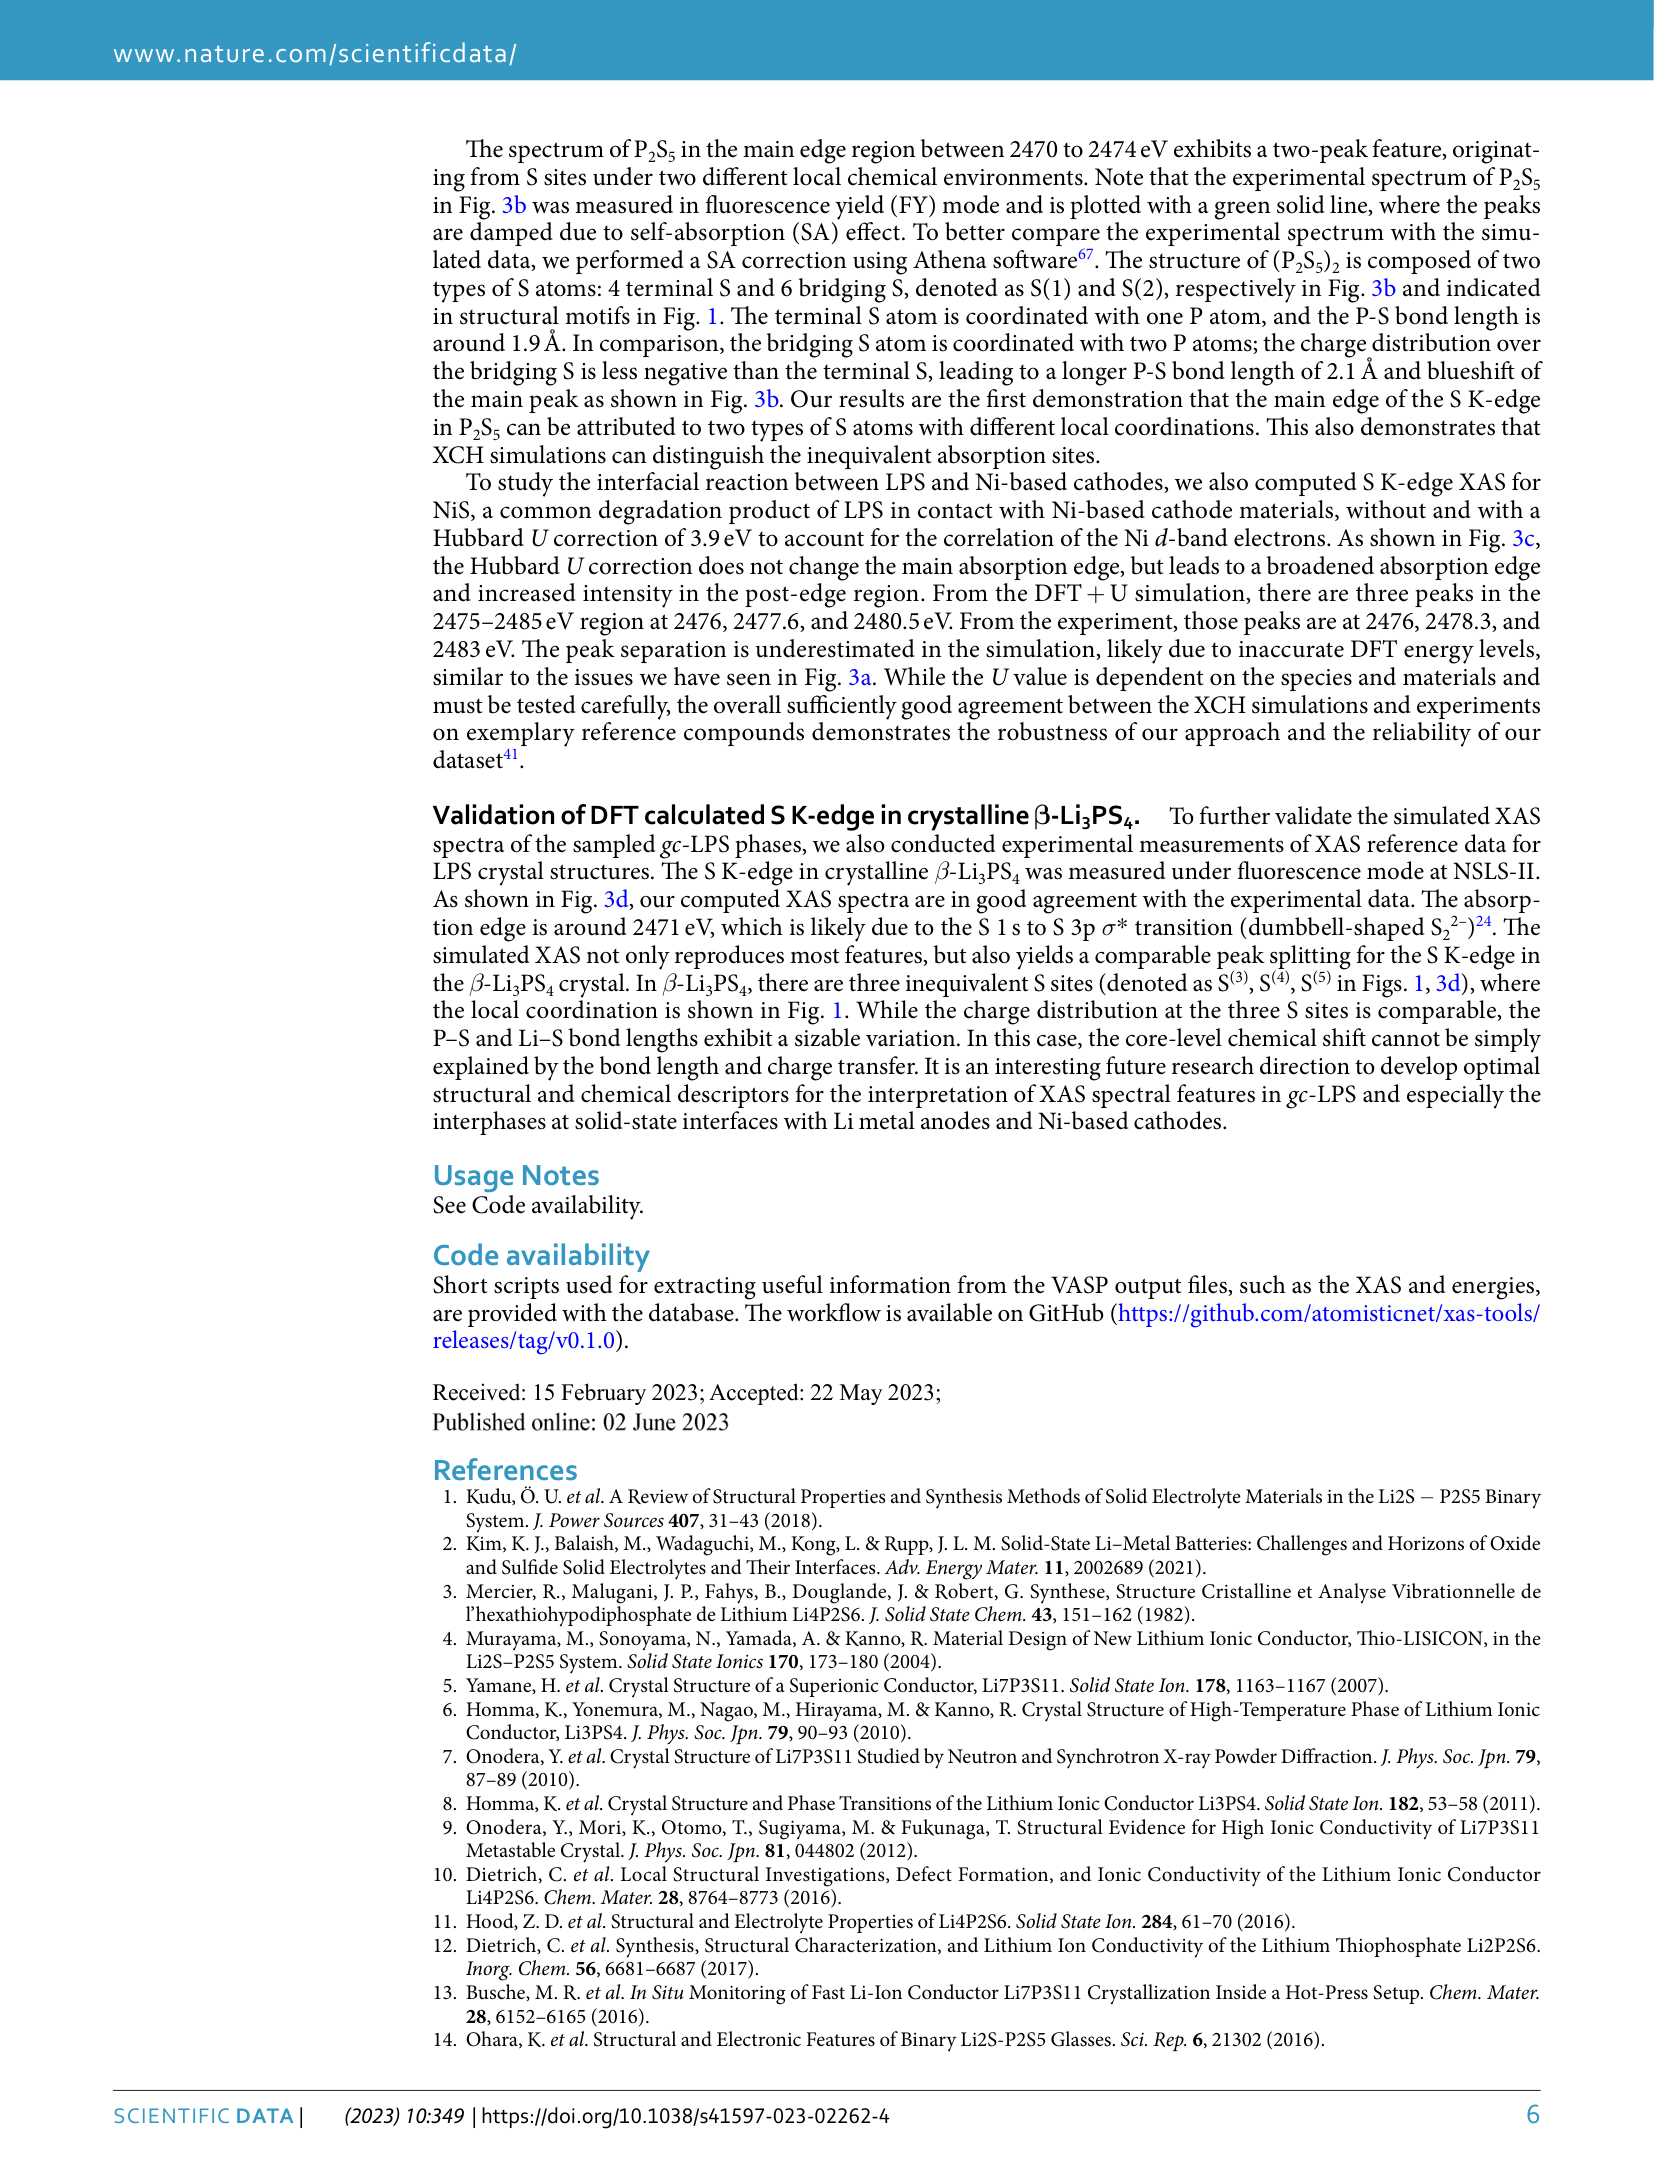
#21
Li2S
S K
▶
LLM Prompt
Sample Information
Material: Li2S
Sample Form: pellet
Measurement Mode: electron yield
- Experimental benchmark measurement of lithium sulfide
Measurement
We plan to measure the S K XANES spectrum of this sample.
Questions
Based on all the information above:
1. What are the specific peak positions and features that characterize the experimental S K-edge XANES spectrum of pure Li2S?
2. Why is Li2S considered a critical reference compound for understanding interfacial reactions in lithium thiophosphate solid-state batteries?
Ground Truth
Compound: Li2S
Oxidation state: not reported
Measurement: S K-edge XAS, electron yield (EY) mode, Beamline 7-ID-2 at NSLS-II
Edge position: not reported
Spectral shape: The S K-edge spectrum of Li2S features three main peaks at 2474, 2476.5, and 2484 eV, along with a distinct peak shoulder at 2480 eV.
Labeled peaks:
| Label | Energy (eV) | Intensity | Origin | Source |
|---|---|---|---|---|
| Main feature 1 | 2474 | not explicitly quantified | not discussed in this paper | paper_data |
| Main feature 2 | 2476.5 | not explicitly quantified | not discussed in this paper | paper_data |
| Peak shoulder | 2480 | not explicitly quantified | not discussed in this paper | paper_data |
| Main feature 3 | 2484 | not explicitly quantified | not discussed in this paper | paper_data |
Distinguishing features: Three main features at 2474, 2476.5, and 2484 eV, and a peak shoulder at 2480 eV.
Key reasoning: Li2S is a highly relevant reference compound because it is a common product of gc-LPS/electrode interfacial degradation, specifically forming at the negative electrode during cycling. Its experimental spectrum exhibits three main features and a peak shoulder. Theoretical simulations based on Kohn-Sham DFT tend to underestimate the energy separation of the first two peaks due to the underestimation of band gaps and quasiparticle energies.
Reasoning source: Page 2 (Background) and Page 5 (Technical Validation)
Scoring Rubric (total: 100 pts)
| Q | Type | Max | Question | Reference Answer | Scoring Criteria |
|---|---|---|---|---|---|
| q1 | spectral | 57 | What are the specific peak positions and features that characterize the experimental S K-edge XANES spectrum of pure Li2S? | The experimental S K-edge XANES spectrum of pure Li2S is characterized by three main peaks located at 2474 eV, 2476.5 eV, and 2484 eV, along with a distinct peak shoulder at 2480 eV. Because the sample is prepared as a pure Li2S pellet and measured as an experimental benchmark in electron yield mode, it yields a spectrum consisting of a 1.0 fraction of Li2S without interference from other phases. These specific spectral features reflect the intrinsic electronic structure of the pure lithium sulfide phase. Obtaining this pure experimental benchmark is crucial, as theoretical simulations using Kohn-Sham DFT often underestimate the energy separation between the first two peaks due to the underestimation of band gaps and quasiparticle energies. | The answer must correctly identify the three main peaks at 2474, 2476.5, and 2484 eV, as well as the peak shoulder at 2480 eV. |
| q2 | reasoning | 43 | Why is Li2S considered a critical reference compound for understanding interfacial reactions in lithium thiophosphate solid-state batteries? | Li2S is considered a critical reference compound because it is a common product of gc-LPS/electrode interfacial degradation, specifically forming at the negative electrode during battery cycling. Because the sample measured here is a pure Li2S pellet evaluated in electron yield mode, it provides an accurate, 100% pure experimental benchmark spectrum for identifying this specific degradation product in complex battery systems. Having this pure experimental reference is essential for accurate phase identification. Furthermore, experimental benchmarks are necessary because theoretical simulations based on Kohn-Sham DFT struggle to accurately model its electronic structure, often underestimating the energy separation of the first two spectral peaks due to underestimated band gaps and quasiparticle energies. | The answer must explain that Li2S is a common interfacial degradation product that forms at the negative electrode during battery cycling. |
Review
#22
P2S5
S K
▶
LLM Prompt
Sample Information
Material: P2S5
Sample Form: pellet
Measurement Mode: fluorescence yield
- Experimental benchmark measurement of phosphorus pentasulfide
Measurement
We plan to measure the S K XANES spectrum of this sample.
Questions
Based on all the information above:
1. Describe the expected spectral shape of the S K-edge XANES for P2S5 in the main edge region. What is its most distinguishing feature?
2. The main edge of P2S5 exhibits a split, two-peak feature. Explain the structural and chemical origins of these two peaks based on the local coordination environments of sulfur in the material.
3. Given that this sample is measured in fluorescence yield (FY) mode as a pellet, what experimental artifact is expected to affect the raw spectral shape, and how does it alter the appearance of the peaks?
Ground Truth
Compound: P2S5
Oxidation state: not reported
Measurement: S K-edge XAS, fluorescence yield (FY) mode, Beamline 8-BM at NSLS-II
Edge position: 2470 to 2474 eV (main edge region)
Spectral shape: The main edge region between 2470 to 2474 eV exhibits a two-peak feature. In raw fluorescence yield (FY) mode, the peaks are damped due to the self-absorption (SA) effect, but self-absorption correction reveals the distinct peaks clearly.
Labeled peaks:
| Label | Energy (eV) | Intensity | Origin | Source |
|---|---|---|---|---|
| Lower energy main peak | between 2470 and 2474 eV | not explicitly quantified | Terminal S atoms coordinated with one P atom | paper_data |
| Higher energy main peak (blueshifted) | between 2470 and 2474 eV | not explicitly quantified | Bridging S atoms coordinated with two P atoms | paper_data |
Distinguishing features: A distinct two-peak feature in the main edge region (2470-2474 eV) originating from two inequivalent S sites (terminal vs. bridging).
Key reasoning: The structure of (P2S5)2 is composed of two types of S atoms: 4 terminal S and 6 bridging S. The terminal S is coordinated with one P atom (P-S bond ~1.9 Å), while the bridging S is coordinated with two P atoms (P-S bond ~2.1 Å). The charge distribution over the bridging S is less negative than the terminal S, leading to a blueshift of the main peak, which creates a distinct two-peak feature in the main edge region.
Reasoning source: Page 6, first paragraph
Scoring Rubric (total: 100 pts)
| Q | Type | Max | Question | Reference Answer | Scoring Criteria |
|---|---|---|---|---|---|
| q1 | spectral | 30 | Describe the expected spectral shape of the S K-edge XANES for P2S5 in the main edge region. What is its most distinguishing feature? | The expected spectral shape of the S K-edge XANES for the P2S5 sample exhibits a distinct two-peak feature in the main edge region between 2470 and 2474 eV. This split-peak profile is the most distinguishing feature of the spectrum. This shape arises directly from the pure P2S5 composition of the sample, which structurally consists of two inequivalent sulfur sites: terminal sulfur atoms and bridging sulfur atoms. Because the terminal S atoms are coordinated to one P atom while the bridging S atoms are coordinated to two P atoms, they possess different charge distributions. The less negative charge on the bridging S atoms causes a blueshift in their absorption, resulting in the higher-energy peak and creating the characteristic two-peak structure. | Full points if the answer mentions the main edge region is between 2470-2474 eV and explicitly identifies the distinguishing two-peak feature. |
| q2 | reasoning | 40 | The main edge of P2S5 exhibits a split, two-peak feature. Explain the structural and chemical origins of these two peaks based on the local coordination environments of sulfur in the material. | The split, two-peak feature in the main edge region (2470-2474 eV) originates from the two distinct types of sulfur atoms present in the pure (P2S5)2 structure. Specifically, the material contains 4 terminal S atoms and 6 bridging S atoms. The lower energy peak corresponds to the terminal S atoms, which are coordinated to a single P atom with a shorter P-S bond of ~1.9 Å. The higher energy, blueshifted peak corresponds to the bridging S atoms, which are coordinated to two P atoms with a longer P-S bond of ~2.1 Å. Because the charge distribution over the bridging S atoms is less negative than that of the terminal S atoms, their absorption shifts to a higher energy, producing the observed two-peak feature. | Full points if the answer correctly attributes the two peaks to the two types of S atoms: terminal S (coordinated to 1 P atom) and bridging S (coordinated to 2 P atoms), and notes that the bridging S leads to a blueshifted peak due to a less negative charge distribution/longer P-S bond. |
| q3 | prediction | 30 | Given that this sample is measured in fluorescence yield (FY) mode as a pellet, what experimental artifact is expected to affect the raw spectral shape, and how does it alter the appearance of the peaks? | Because the pure P2S5 sample is measured as a solid pellet in fluorescence yield (FY) mode, the raw spectral shape is expected to be strongly affected by the self-absorption (SA) effect. This experimental artifact alters the appearance of the spectrum by damping or suppressing the intensity of the peaks in the main edge region. The self-absorption occurs because the concentrated P2S5 pellet absorbs some of its own emitted fluorescence photons before they can escape and reach the detector. Consequently, the distinct two-peak feature between 2470 and 2474 eV will appear flattened in the raw FY data, and a self-absorption correction is required to clearly reveal the true peak intensities originating from the terminal and bridging sulfur sites. | Full points if the answer identifies self-absorption (SA) as the artifact and states that it causes the peaks to be damped in the raw FY spectrum. |
Review
#23
NiS
S K
▶
LLM Prompt
Sample Information
Material: NiS
Sample Form: pellet
Measurement Mode: electron yield
- Experimental benchmark measurement of nickel sulfide
Measurement
We plan to measure the S K XANES spectrum of this sample.
Questions
Based on all the information above:
1. In the context of solid-state batteries, why is the S K-edge XANES spectrum of NiS relevant to the study of lithium thiophosphate (LPS) solid electrolytes?
2. Describe the expected spectral shape of the S K-edge XANES spectrum for pure NiS in the 2475-2485 eV region.
3. What are the specific energy positions (in eV) of the three main peaks observed in the experimental S K-edge spectrum of NiS?
Ground Truth
Compound: NiS
Oxidation state: not reported
Measurement: S K-edge, electron yield (EY) mode, Beamline 7-ID-2 at NSLS-II
Edge position: not reported
Spectral shape: The spectrum features three distinct peaks in the 2475-2485 eV region.
Labeled peaks:
| Label | Energy (eV) | Intensity | Origin | Source |
|---|---|---|---|---|
| Peak 1 | 2476 | not explicitly quantified | not discussed in this paper | paper_data |
| Peak 2 | 2478.3 | not explicitly quantified | not discussed in this paper | paper_data |
| Peak 3 | 2483 | not explicitly quantified | not discussed in this paper | paper_data |
Distinguishing features: Three peaks located at 2476, 2478.3, and 2483 eV.
Key reasoning: NiS is a common degradation product of lithium thiophosphate (LPS) solid electrolytes in contact with Ni-based cathode materials. It was measured as a benchmark reference system to validate the XAS simulations. The experimental spectrum exhibits three distinct peaks in the 2475-2485 eV region.
Reasoning source: Page 6, Technical Validation section
Scoring Rubric (total: 100 pts)
| Q | Type | Max | Question | Reference Answer | Scoring Criteria |
|---|---|---|---|---|---|
| q1 | reasoning | 30 | In the context of solid-state batteries, why is the S K-edge XANES spectrum of NiS relevant to the study of lithium thiophosphate (LPS) solid electrolytes? | The S K-edge XANES spectrum of NiS is highly relevant because NiS is a common degradation product that forms when lithium thiophosphate (LPS) solid electrolytes come into contact with Ni-based cathode materials. In this study, a pure NiS pellet was measured in electron yield mode to serve as an experimental benchmark reference system. This benchmark measurement is necessary to validate XAS simulations of the degradation products. By establishing the exact spectral signature of 100% pure NiS, researchers can accurately identify this specific degradation phase in complex solid-state battery systems. | Full credit if the answer identifies NiS as a common degradation product of LPS when in contact with Ni-based cathode materials. |
| q2 | spectral | 30 | Describe the expected spectral shape of the S K-edge XANES spectrum for pure NiS in the 2475-2485 eV region. | The expected spectral shape of the S K-edge XANES spectrum for pure NiS features three distinct peaks located within the 2475-2485 eV region. These specific spectral features arise directly from the structural and electronic properties of the pure NiS pellet sample measured in electron yield mode. Because the sample is a 100% pure NiS benchmark reference, the spectrum exclusively reflects the intrinsic electronic transitions of sulfur in the nickel sulfide lattice without interference from other phases. This distinct three-peak shape serves as a reliable fingerprint to validate XAS simulations of NiS when it forms as a degradation product of LPS solid electrolytes. | Full credit if the answer states that the spectrum exhibits three distinct peaks in this energy region. |
| q3 | spectral | 40 | What are the specific energy positions (in eV) of the three main peaks observed in the experimental S K-edge spectrum of NiS? | The experimental S K-edge spectrum of NiS exhibits three main peaks located at 2476 eV, 2478.3 eV, and 2483 eV. These specific energy positions are produced by the unique electronic structure of the pure NiS pellet sample measured in electron yield mode. Because the sample is prepared as a 100% pure benchmark reference, these peak positions accurately represent the intrinsic sulfur K-edge transitions of nickel sulfide. Establishing these exact energy positions is crucial because NiS is a common degradation product of lithium thiophosphate (LPS) solid electrolytes in contact with Ni-based cathodes, and these values are used to validate XAS simulations. | Full credit if the answer correctly identifies the three peak positions at 2476, 2478.3, and 2483 eV. Deduct points for missing or incorrect values. |
Review
#24
beta-Li3PS4
S K
▶
LLM Prompt
Sample Information
Material: beta-Li3PS4
Crystal Structure: beta
Sample Form: pellet
Measurement Mode: electron yield
- Experimental benchmark measurement of beta-phase lithium thiophosphate
Measurement
We plan to measure the S K XANES spectrum of this sample.
Questions
Based on all the information above:
1. Based on the crystal structure of beta-Li3PS4, what distinct spectral feature is expected at the S K-edge main absorption resonance, and what structural characteristic is it associated with?
2. What is the energy position of the absorption edge for beta-Li3PS4, and what specific electronic transition is it attributed to in this context?
3. How do the local structural properties (charge distribution and bond lengths) of the inequivalent S sites in beta-Li3PS4 relate to the observed core-level chemical shifts and peak splitting?
Ground Truth
Compound: beta-Li3PS4
Oxidation state: not explicitly reported
Measurement: S K-edge XAS, electron yield (EY) mode, Beamline 7-ID-2 at NSLS-II
Edge position: 2471
Spectral shape: The spectrum features an absorption edge around 2471 eV and exhibits distinct peak splitting at the main edge.
Labeled peaks:
| Label | Energy (eV) | Intensity | Origin | Source |
|---|---|---|---|---|
| Absorption edge | 2471 | not explicitly quantified | S 1s to S 3p sigma* transition (dumbbell-shaped S2(2-)) | paper_data |
Distinguishing features: Peak splitting at the S K-edge associated with three inequivalent S sites, where the chemical shifts cannot be simply explained by local bond length and charge transfer.
Key reasoning: The absorption edge around 2471 eV is attributed to the S 1s to S 3p sigma* transition. The spectrum exhibits peak splitting, which corresponds to the presence of three inequivalent S sites (S(3), S(4), S(5)) in the crystal structure. While these sites have comparable charge distributions and sizable variations in P-S and Li-S bond lengths, the core-level chemical shift cannot be simply explained by bond length and charge transfer alone.
Reasoning source: Page 6, Section: Validation of DFT calculated S K-edge in crystalline beta-Li3PS4
Scoring Rubric (total: 100 pts)
| Q | Type | Max | Question | Reference Answer | Scoring Criteria |
|---|---|---|---|---|---|
| q1 | spectral | 35 | Based on the crystal structure of beta-Li3PS4, what distinct spectral feature is expected at the S K-edge main absorption resonance, and what structural characteristic is it associated with? | The S K-edge main absorption resonance of this sample is expected to exhibit distinct peak splitting. Because the sample is an experimental benchmark pellet of pure beta-phase lithium thiophosphate (beta-Li3PS4), its specific crystal structure inherently contains three inequivalent sulfur sites, designated as S(3), S(4), and S(5). The presence of these three distinct structural environments within the beta-phase lattice directly causes the core-level chemical shifts that produce this distinguishing split spectral feature. | The answer must mention peak splitting at the main edge and attribute it to the presence of three inequivalent S sites in the beta-Li3PS4 crystal structure. |
| q2 | spectral | 30 | What is the energy position of the absorption edge for beta-Li3PS4, and what specific electronic transition is it attributed to in this context? | The absorption edge for the beta-Li3PS4 sample is located at approximately 2471 eV. This spectral feature is attributed to the S 1s to S 3p sigma* electronic transition, which is associated with dumbbell-shaped S2(2-). Because the sample is a pure phase benchmark of beta-lithium thiophosphate measured in electron yield mode, its specific electronic structure dictates that the excitation of core S 1s electrons to unoccupied S 3p sigma* states occurs at this exact energy, accompanied by peak splitting due to the inequivalent sulfur sites in the lattice. | The answer must state the edge is around 2471 eV and attribute it to the S 1s to S 3p sigma* transition (specifically noting the dumbbell-shaped S2(2-) motif as cited in the text). |
| q3 | reasoning | 35 | How do the local structural properties (charge distribution and bond lengths) of the inequivalent S sites in beta-Li3PS4 relate to the observed core-level chemical shifts and peak splitting? | In beta-Li3PS4, the observed core-level chemical shifts and resulting peak splitting cannot be simply explained by local bond lengths and charge transfer alone. Because the sample is a pure beta-phase pellet, its crystal structure contains three inequivalent sulfur sites (S(3), S(4), and S(5)) that exhibit comparable charge distributions but sizable variations in their P-S and Li-S bond lengths. Despite these distinct local structural variations, the complex electronic environment of the beta-phase lattice means that these basic structural properties are insufficient to fully account for the chemical shifts that cause the peak splitting at the 2471 eV absorption edge. | The answer must note that while the three inequivalent S sites have comparable charge distributions but varying P-S and Li-S bond lengths, the core-level chemical shift cannot be simply explained by these bond length and charge transfer variations alone. |
Review
Towards calibration-invariant spectroscopy using deep learning
Original-17
Pure Phase
M. Chatzidakis, G. A. Botton
DOI: 10.1038/s41598-019-38482-1
3 scenarios
PDF
▶
Key Paper Evidence2a, 2b, 2c, p.2, p.4, p.6, p.9▶
Figure 2a (PDF page 2)
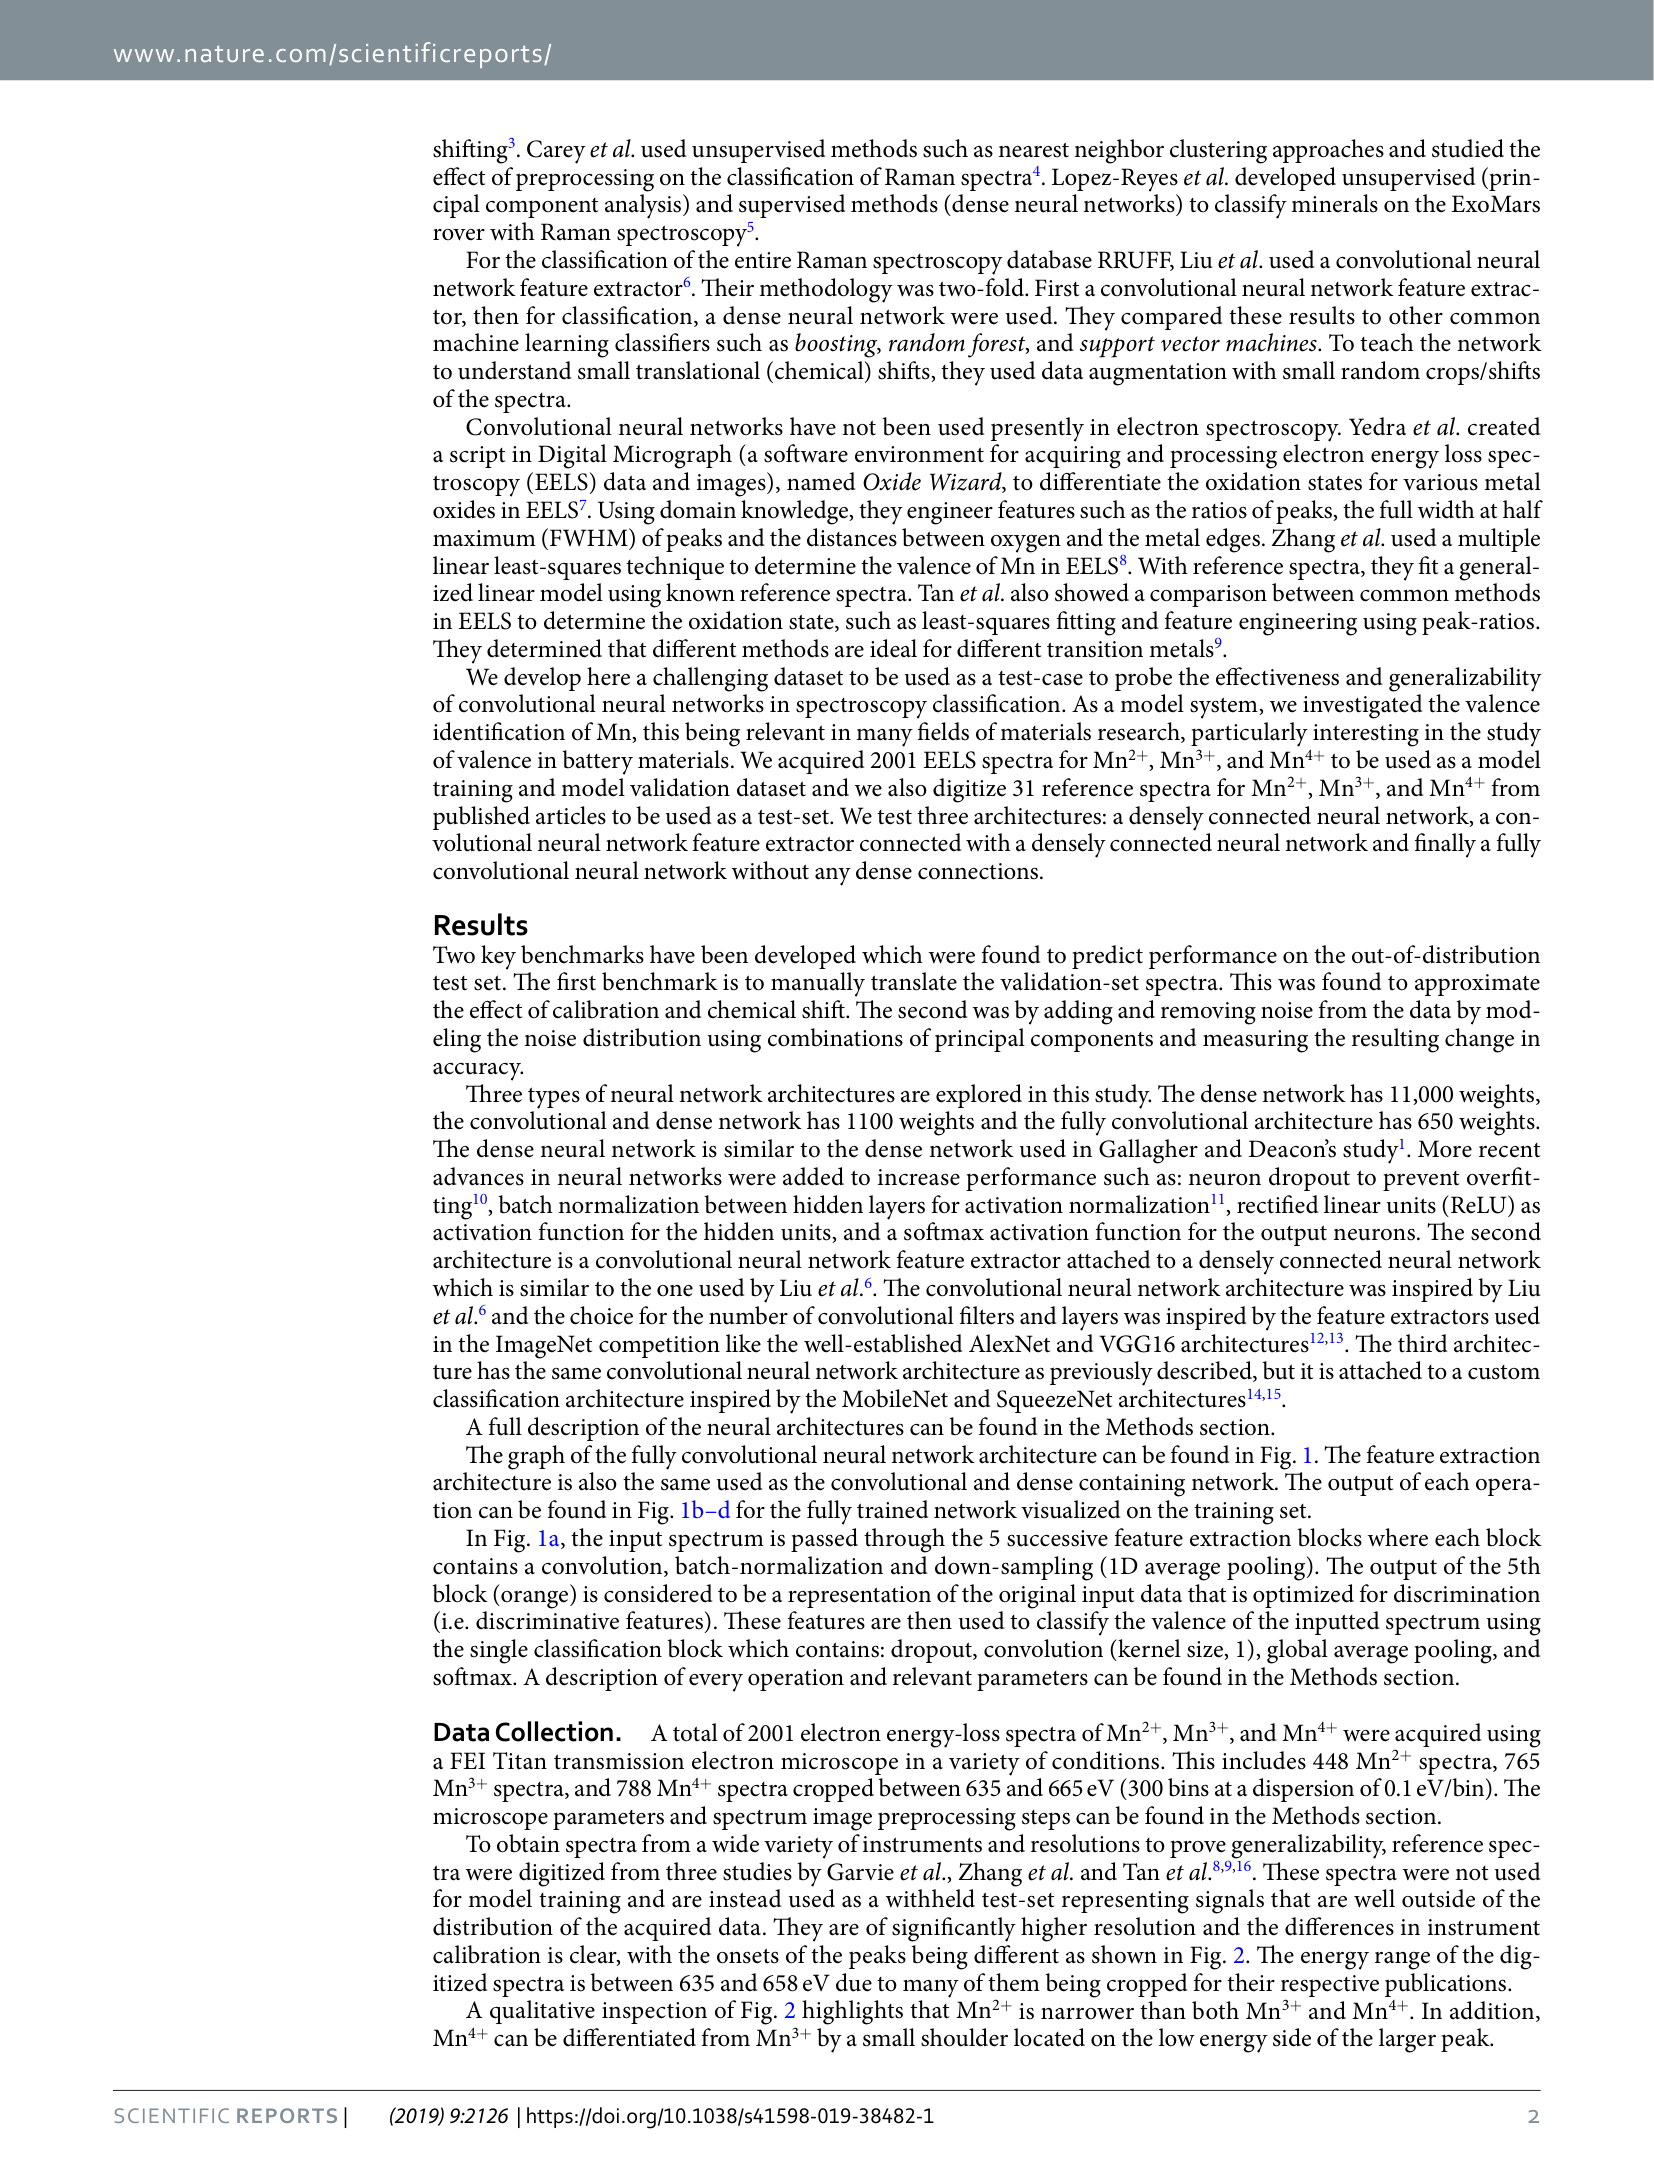
Figure 2a (PDF page 4)
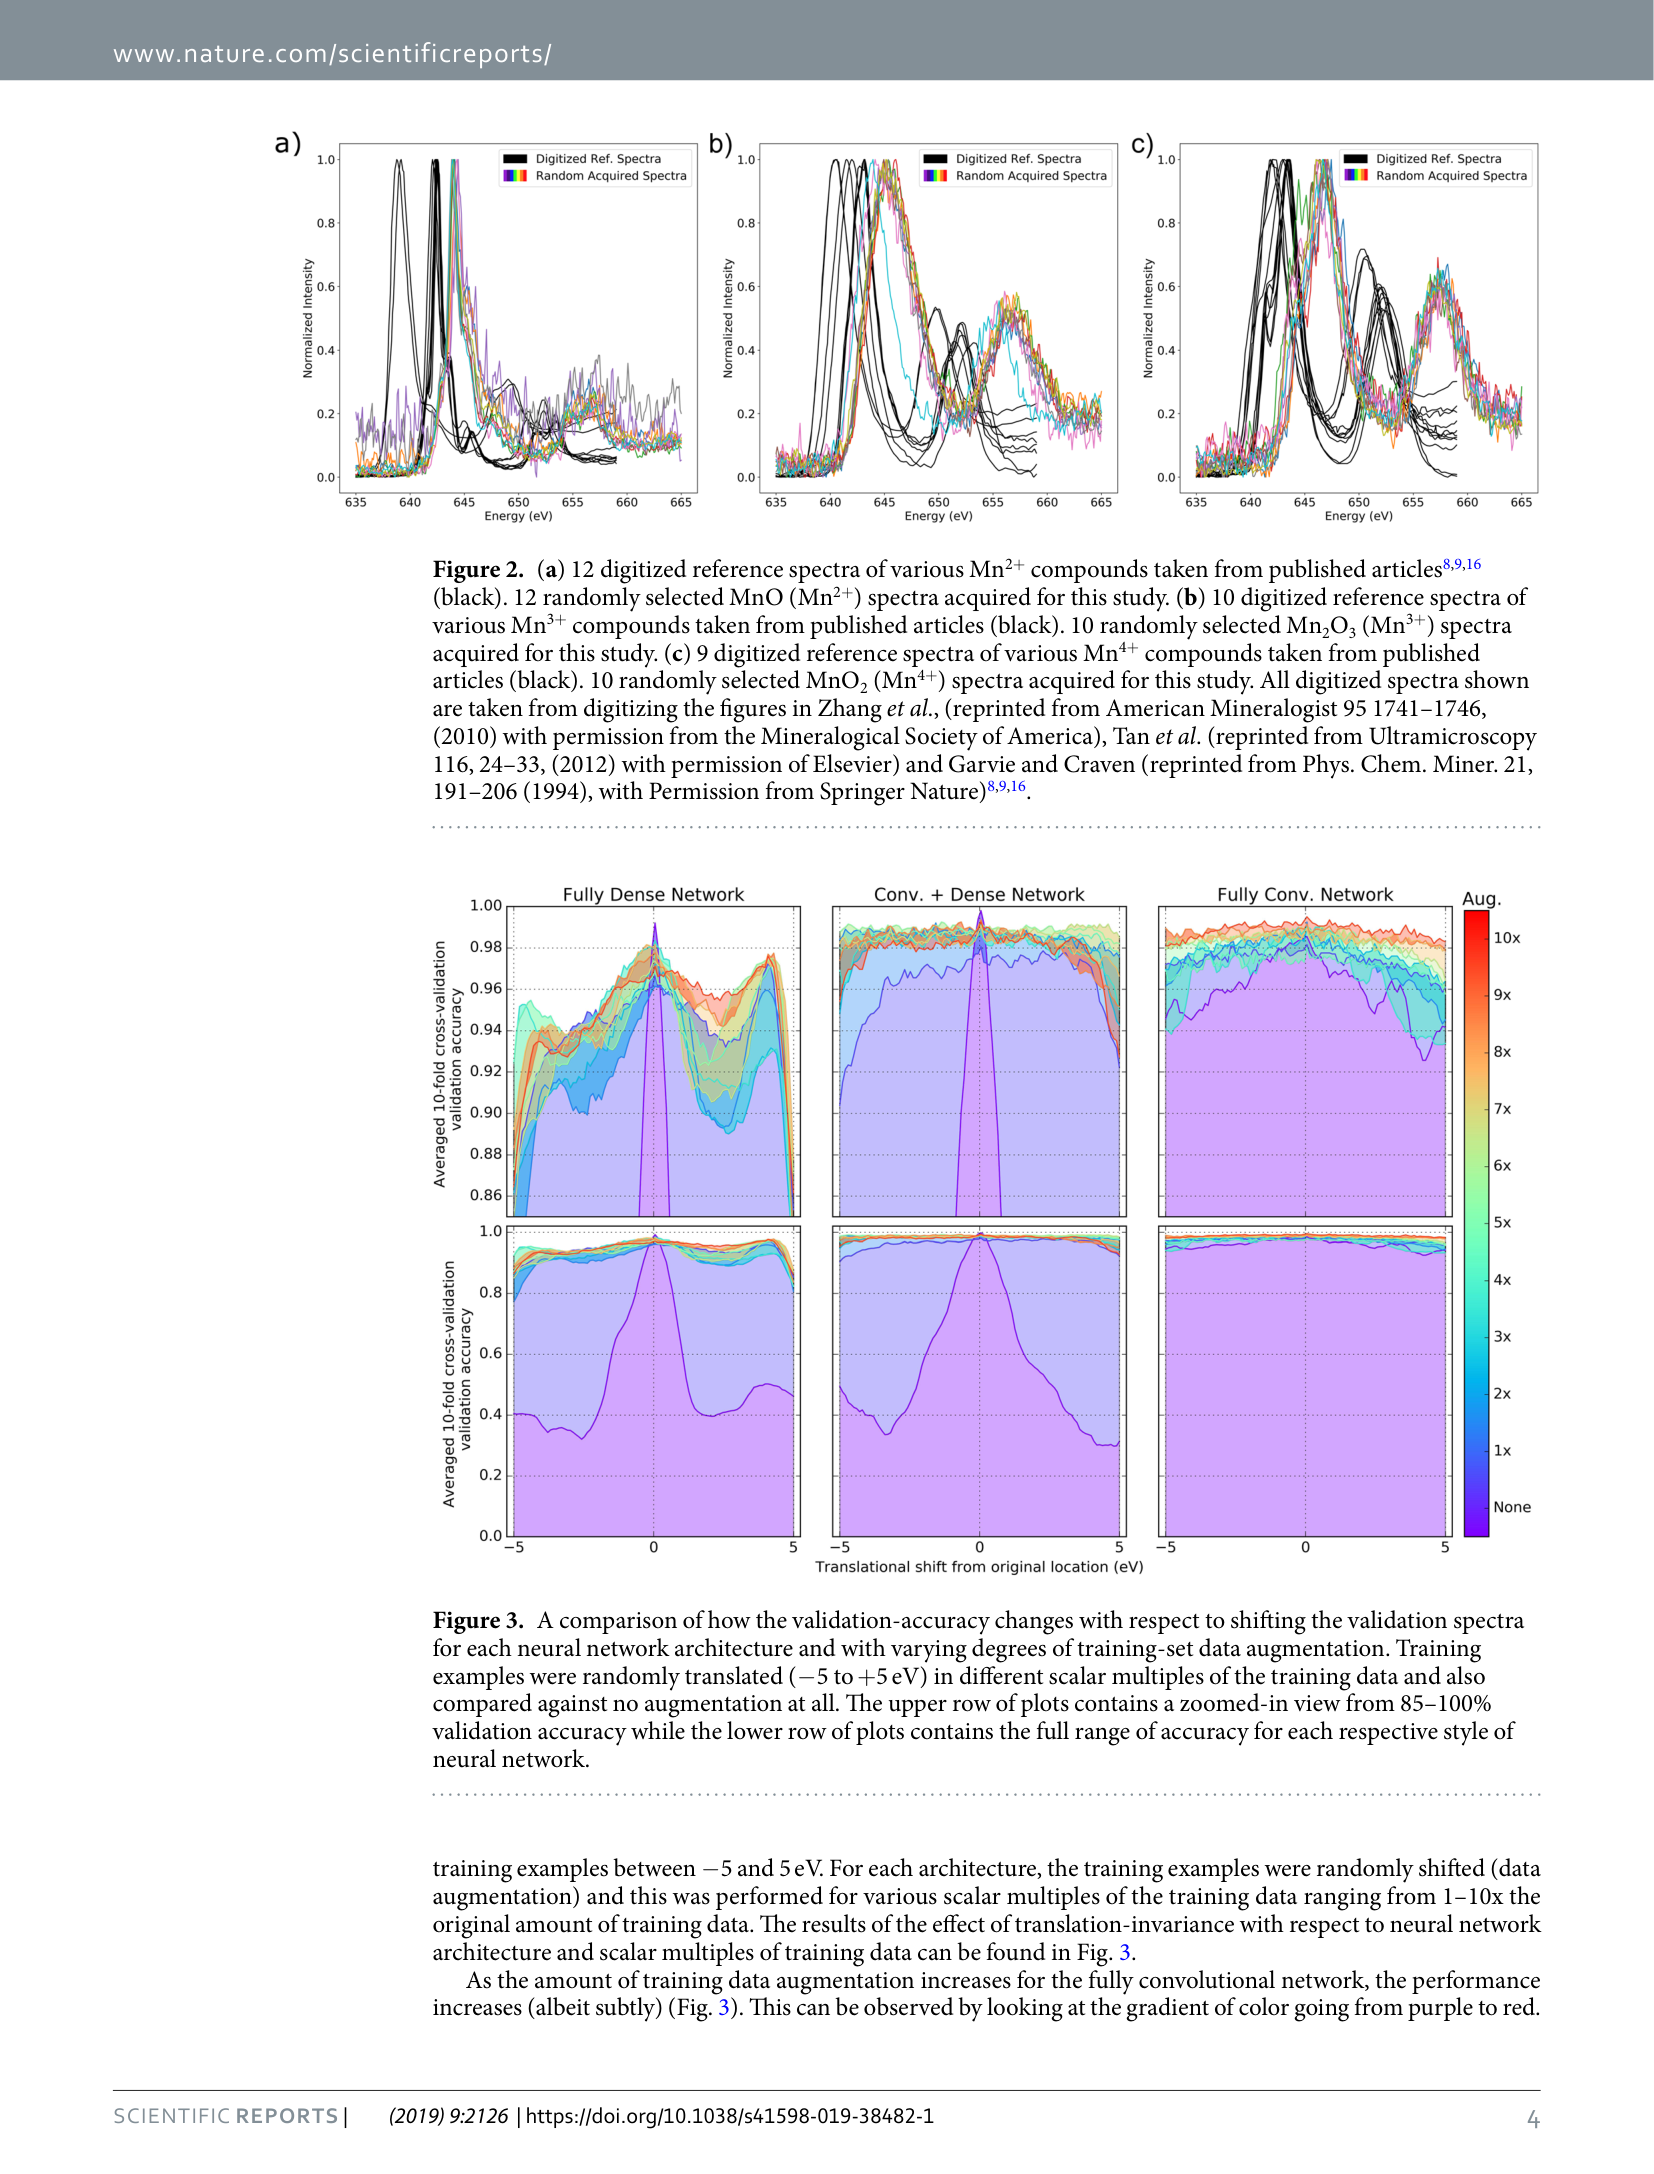
Page 6 (PDF page 6)
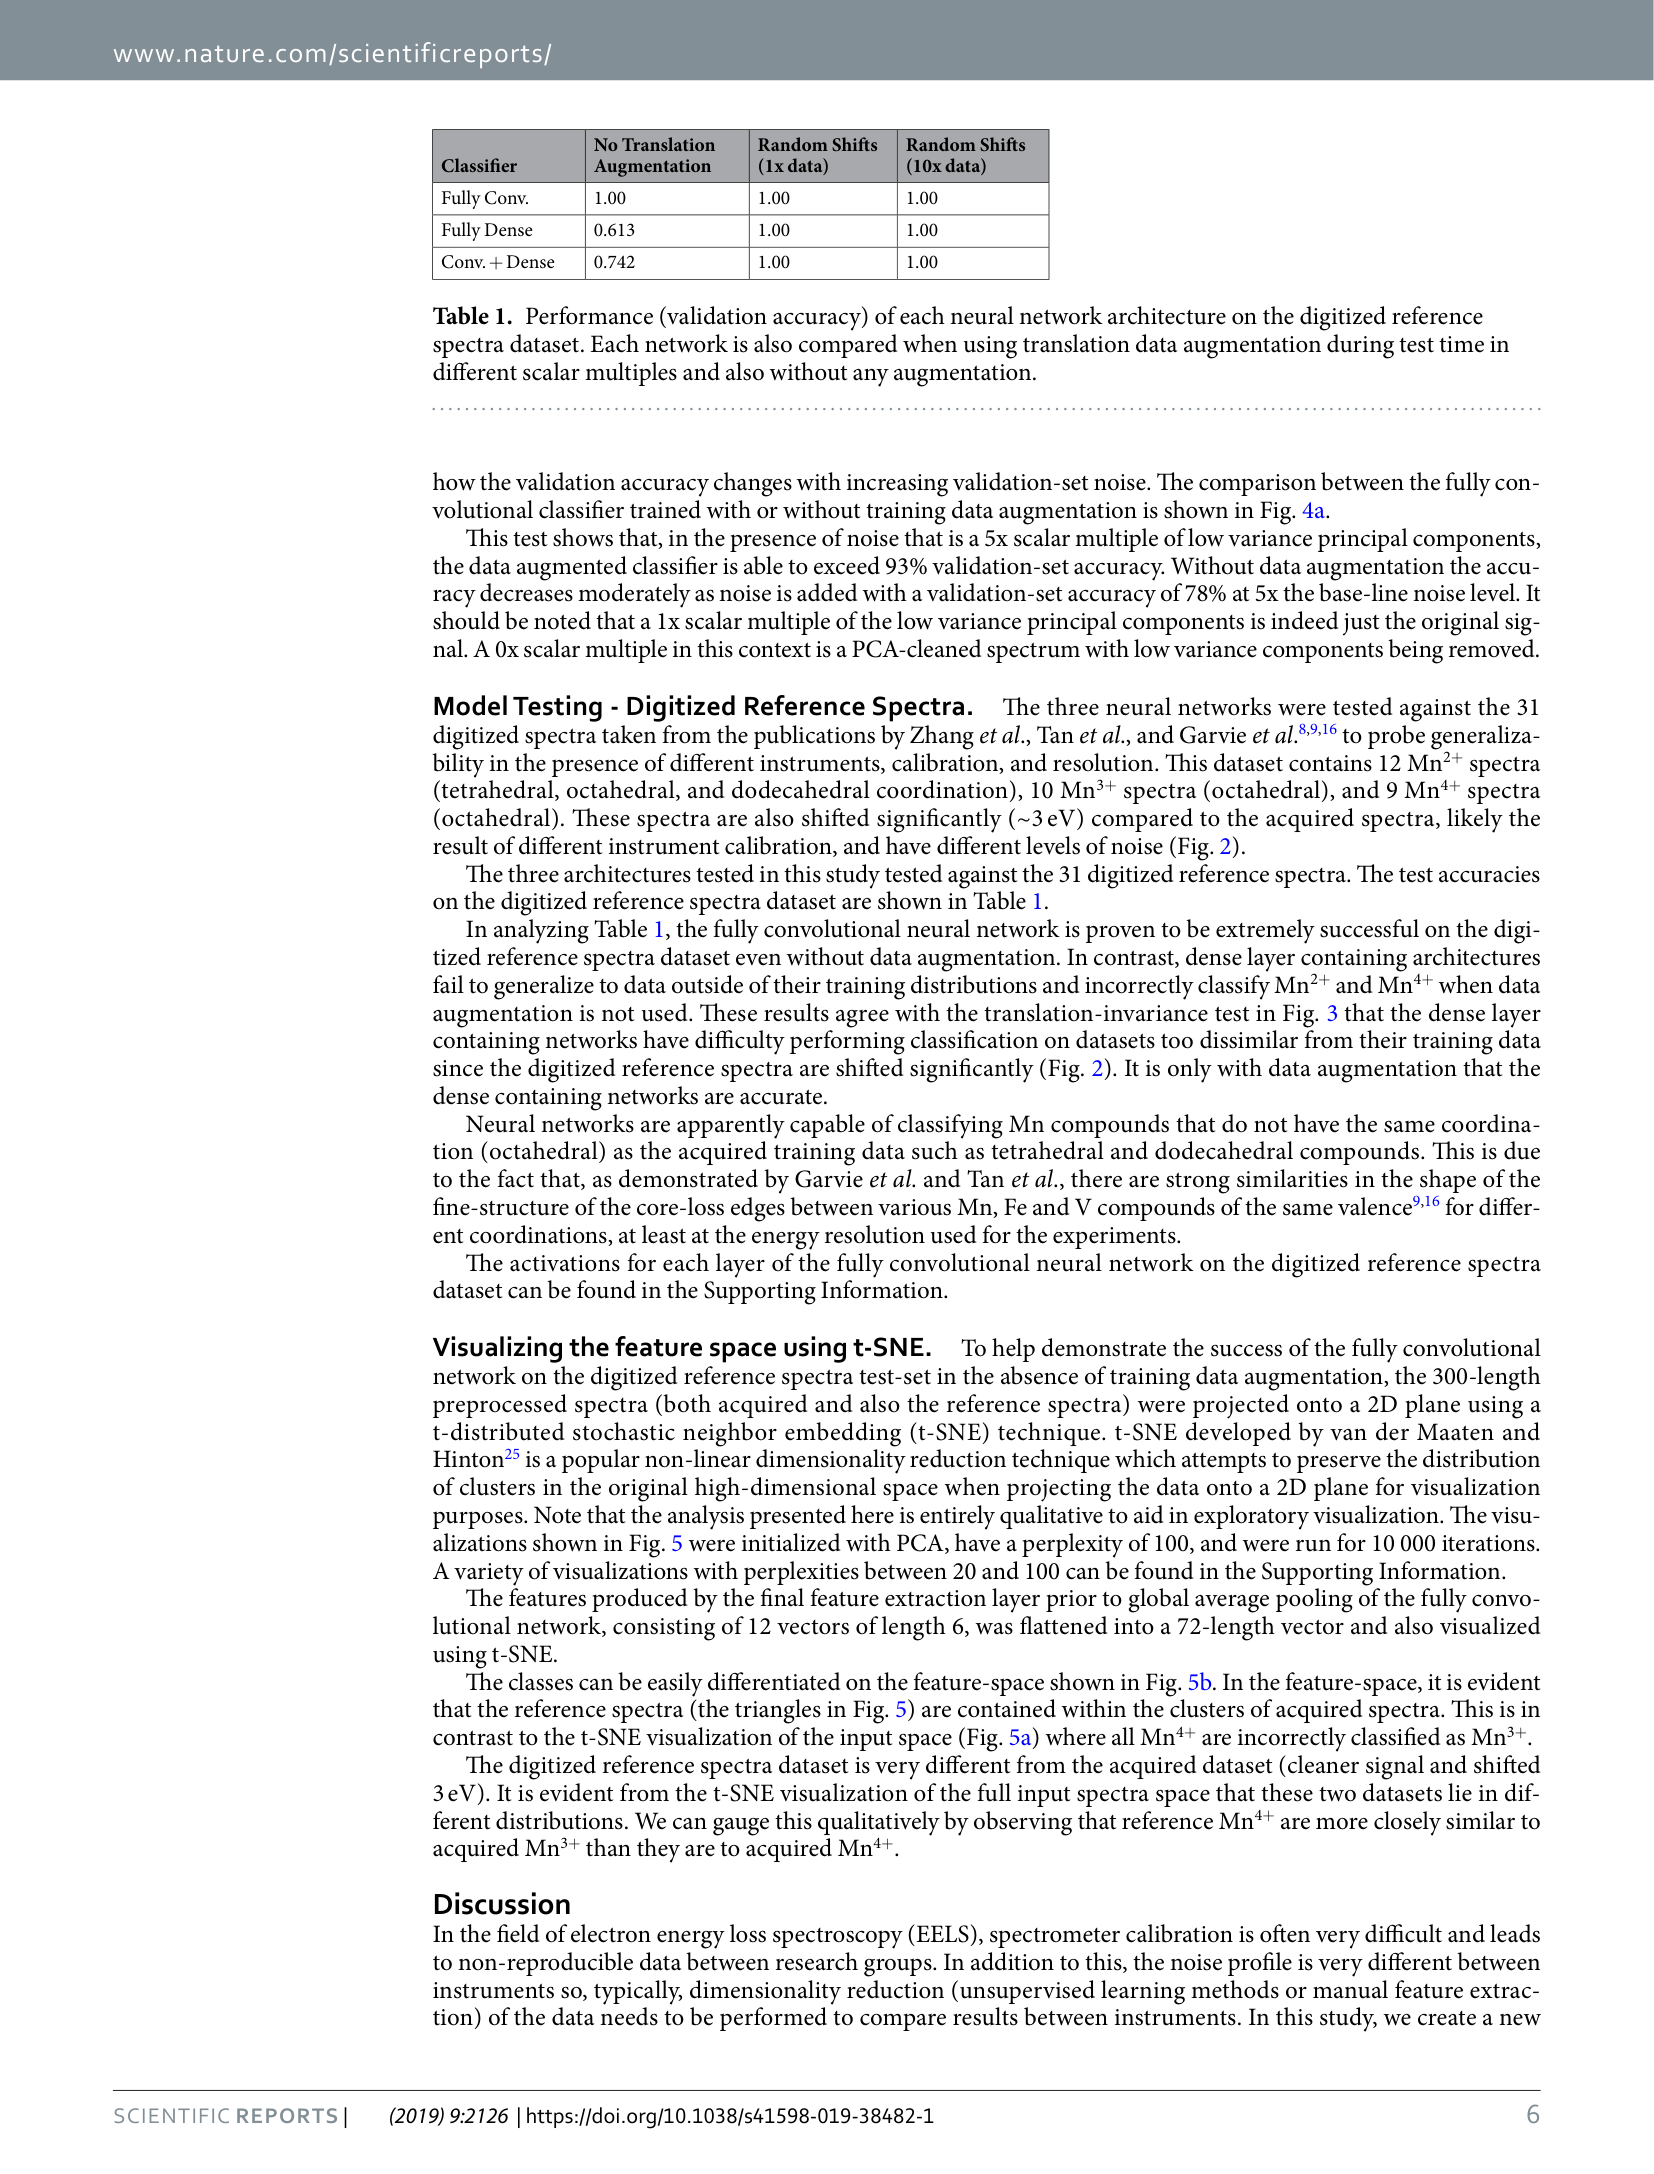
Page 9 (PDF page 9)

#25
MnO
Mn L
▶
LLM Prompt
Sample Information
Material: MnO
Oxidation State: 2+
Sample Form: powder
Measurement Mode: transmission
- Manganese(II) oxide reference powder
Measurement
We plan to measure the Mn L XANES spectrum of this sample.
Questions
Based on all the information above:
1. Describe the expected spectral shape and distinguishing features of the Mn L2,3 edge for this MnO (Mn2+) sample compared to higher oxidation states like Mn3+ and Mn4+.
2. In what energy range are the primary Mn L2,3 core-loss features observed for this sample, and what are the approximate positions of the main peaks?
Ground Truth
Compound: MnO
Oxidation state: 2+
Measurement: Mn L2,3 edge EELS in transmission mode
Edge position: Spectra cropped between 635 and 665 eV
Spectral shape: The spectrum exhibits a sharp, narrow L3 white line peak followed by a broader, lower intensity L2 peak.
Labeled peaks:
| Label | Energy (eV) | Intensity | Origin | Source |
|---|---|---|---|---|
| L3 peak | ~640 eV | high (maximum) | not discussed in this paper | paper_data |
| L2 peak | ~651 eV | moderate | not discussed in this paper | paper_data |
Distinguishing features: The Mn2+ peak is narrower than both Mn3+ and Mn4+. It also lacks the small shoulder located on the low energy side of the larger peak that is characteristic of Mn4+.
Key reasoning: The sample is a >99% pure MnO reference powder used to acquire baseline Mn2+ spectra. The acquired spectra represent octahedral coordination. The fine-structure of the core-loss edges is primarily determined by the valence state, showing strong similarities across different coordinations (e.g., tetrahedral, dodecahedral) for the same valence.
Reasoning source: Results (Model Testing - Digitized Reference Spectra, page 6) and Methods (Sample Preparation, page 9)
Scoring Rubric (total: 100 pts)
| Q | Type | Max | Question | Reference Answer | Scoring Criteria |
|---|---|---|---|---|---|
| q1 | spectral | 57 | Describe the expected spectral shape and distinguishing features of the Mn L2,3 edge for this MnO (Mn2+) sample compared to higher oxidation states like Mn3+ and Mn4+. | The Mn L2,3 edge spectrum for this sample exhibits a sharp, narrow L3 white line peak followed by a broader, lower intensity L2 peak. Compared to higher oxidation states, the Mn2+ L3 peak is distinctly narrower than those of Mn3+ and Mn4+, and it lacks the small low-energy shoulder characteristic of Mn4+. These specific spectral features arise because the sample is a highly pure (>99%) MnO reference powder containing exclusively Mn2+ in octahedral coordination. The fine-structure of these core-loss edges is primarily determined by this 2+ valence state rather than the specific coordination environment, resulting in the characteristic narrow baseline Mn2+ spectral shape. | Full points if the answer states that the Mn2+ peak is narrower than both Mn3+ and Mn4+, and notes the absence of the low-energy shoulder that characterizes Mn4+. |
| q3 | spectral | 43 | In what energy range are the primary Mn L2,3 core-loss features observed for this sample, and what are the approximate positions of the main peaks? | The primary Mn L2,3 core-loss features for this sample are observed in the energy range between 635 and 665 eV. Within this window, the spectrum displays a high-intensity L3 peak at approximately 640 eV and a moderate-intensity L2 peak at approximately 651 eV. These peak positions and energy ranges are expected because the sample is a pure MnO reference powder measured to acquire baseline Mn2+ spectra. Because the fine-structure of the core-loss edges is primarily dictated by the Mn2+ valence state, the electronic transitions specific to this oxidation state in an octahedral coordination consistently produce these characteristic L3 and L2 peak energies. | Full points if the answer mentions the 635-665 eV range and identifies the L3 peak at approximately 640 eV and the L2 peak at approximately 651 eV. |
Review
#26
Mn2O3
Mn L
▶
LLM Prompt
Sample Information
Material: Mn2O3
Oxidation State: 3+
Sample Form: powder
Measurement Mode: transmission
- Manganese(III) oxide reference powder
Measurement
We plan to measure the Mn L XANES spectrum of this sample.
Questions
Based on all the information above:
1. What specific spectral features distinguish the Mn L-edge of this Mn3+ sample (Mn2O3) from Mn2+ and Mn4+ oxides?
2. What is the relevant energy range for observing the Mn L2,3 core-loss edges as described for this sample?
Ground Truth
Compound: Mn2O3
Oxidation state: 3+
Measurement: EELS Mn L2,3 core-loss edges, transmission mode (TEM)
Edge position: not reported (spectra cropped between 635 and 665 eV)
Spectral shape: The Mn L2,3 core-loss edge spectrum for Mn3+ is broader than that of Mn2+.
Distinguishing features: Mn3+ can be differentiated from Mn4+ because it lacks the small shoulder located on the low energy side of the larger peak that is present in Mn4+. It is also broader than Mn2+.
Key reasoning: The sample is a >99% pure reference Mn oxide powder (Mn2O3) used to acquire ground-truth Mn3+ spectra. The Mn atoms in this specific reference compound exhibit an octahedral coordination environment.
Reasoning source: Sample Preparation and Microscope Parameters section, page 9; Model Testing section, page 6
Scoring Rubric (total: 100 pts)
| Q | Type | Max | Question | Reference Answer | Scoring Criteria |
|---|---|---|---|---|---|
| q1 | spectral | 57 | What specific spectral features distinguish the Mn L-edge of this Mn3+ sample (Mn2O3) from Mn2+ and Mn4+ oxides? | The Mn L2,3 core-loss edge spectrum for this Mn3+ sample is broader than that of Mn2+ and lacks the small shoulder on the low-energy side of the main peak, which is characteristic of Mn4+. These distinct spectral features arise because the sample is a >99% pure reference Mn2O3 powder specifically used to acquire ground-truth Mn3+ spectra. In this pure reference compound, the Mn atoms exhibit a specific octahedral coordination environment that dictates its unique electronic structure. Consequently, this specific 3+ oxidation state and coordination geometry produce the broader peak and prevent the formation of the low-energy shoulder seen in higher oxidation states. | Full credit for stating that Mn3+ is broader than Mn2+ and lacks the small shoulder on the low energy side of the larger peak that is characteristic of Mn4+. |
| q3 | spectral | 43 | What is the relevant energy range for observing the Mn L2,3 core-loss edges as described for this sample? | The relevant energy range for observing the Mn L2,3 core-loss edges in this sample is between 635 and 665 eV, as the spectra are specifically cropped to this region. This specific energy window is utilized because the sample is a >99% pure Mn2O3 reference powder measured in transmission mode to acquire ground-truth Mn3+ spectra. Within this pure octahedral coordination environment, the core-loss transitions characteristic of the Mn3+ oxidation state occur precisely within this cropped region. Therefore, focusing on the 635 to 665 eV range captures the essential broadened spectral shape required to characterize this pure Mn3+ phase. | Full credit for stating the energy range is between 635 and 665 eV. |
Review
#27
MnO2
Mn L
▶
LLM Prompt
Sample Information
Material: MnO2
Oxidation State: 4+
Sample Form: powder
Measurement Mode: transmission
- Manganese(IV) oxide reference powder
Measurement
We plan to measure the Mn L XANES spectrum of this sample.
Questions
Based on all the information above:
1. Describe the expected distinguishing spectral feature of the Mn L-edge spectrum for MnO2 (Mn4+) that allows it to be differentiated from Mn3+ compounds.
Ground Truth
Compound: MnO2
Oxidation state: 4+
Measurement: Mn L2,3-edge EELS in transmission mode
Edge position: Spectra cropped between 635 and 665 eV
Spectral shape: The spectrum consists of the Mn L2,3 core-loss edges located within the 635 to 665 eV energy range, featuring a larger peak (L3) at lower energy and a secondary peak (L2) at higher energy.
Labeled peaks:
| Label | Energy (eV) | Intensity | Origin | Source |
|---|---|---|---|---|
| Mn L2,3 core-loss edges | 635 - 665 eV (cropped range) | Normalized between 0.0 and 1.0 | core-loss ionization | paper_data |
Distinguishing features: Mn4+ can be differentiated from Mn3+ by a small shoulder located on the low energy side of the larger peak.
Key reasoning: MnO2 powder samples (>99% purity) were used as the pure reference standard for the Mn4+ oxidation state. To acquire valid transmission spectra, the samples must be electron transparent (typically under 100 nm thick), otherwise no ionization edge is visible. Therefore, spectra were collected specifically on the edges of the nanoparticulate MnO2 to capture the thinnest areas.
Reasoning source: Page 9, Sample Preparation and Microscope Parameters
Scoring Rubric (total: 100 pts)
| Q | Type | Max | Question | Reference Answer | Scoring Criteria |
|---|---|---|---|---|---|
| q1 | spectral | 100 | Describe the expected distinguishing spectral feature of the Mn L-edge spectrum for MnO2 (Mn4+) that allows it to be differentiated from Mn3+ compounds. | The expected distinguishing spectral feature of the Mn L-edge spectrum for MnO2 is a small shoulder located on the low energy side of the larger L3 peak. The overall spectrum features the Mn L2,3 core-loss edges between 635 and 665 eV, characterized by this larger L3 peak at lower energy and a secondary L2 peak at higher energy. These specific features arise because the sample is a highly pure (>99%) MnO2 reference powder that exclusively contains manganese in the 4+ oxidation state. Because the measurement is performed in transmission mode, the nanoparticulate powder must be electron transparent (typically under 100 nm thick) for the ionization edge to be visible. Consequently, by collecting data on the thinnest edges of the particles, a pure Mn4+ spectrum is obtained, allowing its unique low-energy shoulder to be clearly differentiated from Mn3+ compounds. | Full credit if the answer explicitly mentions the presence of a small shoulder located on the low energy side of the larger peak. |
Review
Solving local structure around dopants in metal nanoparticles with ab initio modeling of X-ray absorption near edge structure
Original-17
Catalyst
Janis Timoshenko et al.
DOI: 10.1039/c6cp04030f
4 scenarios
PDF
▶
Key Paper Evidence2, p.7, p.9, p.10▶
Table 2 (PDF page 9)
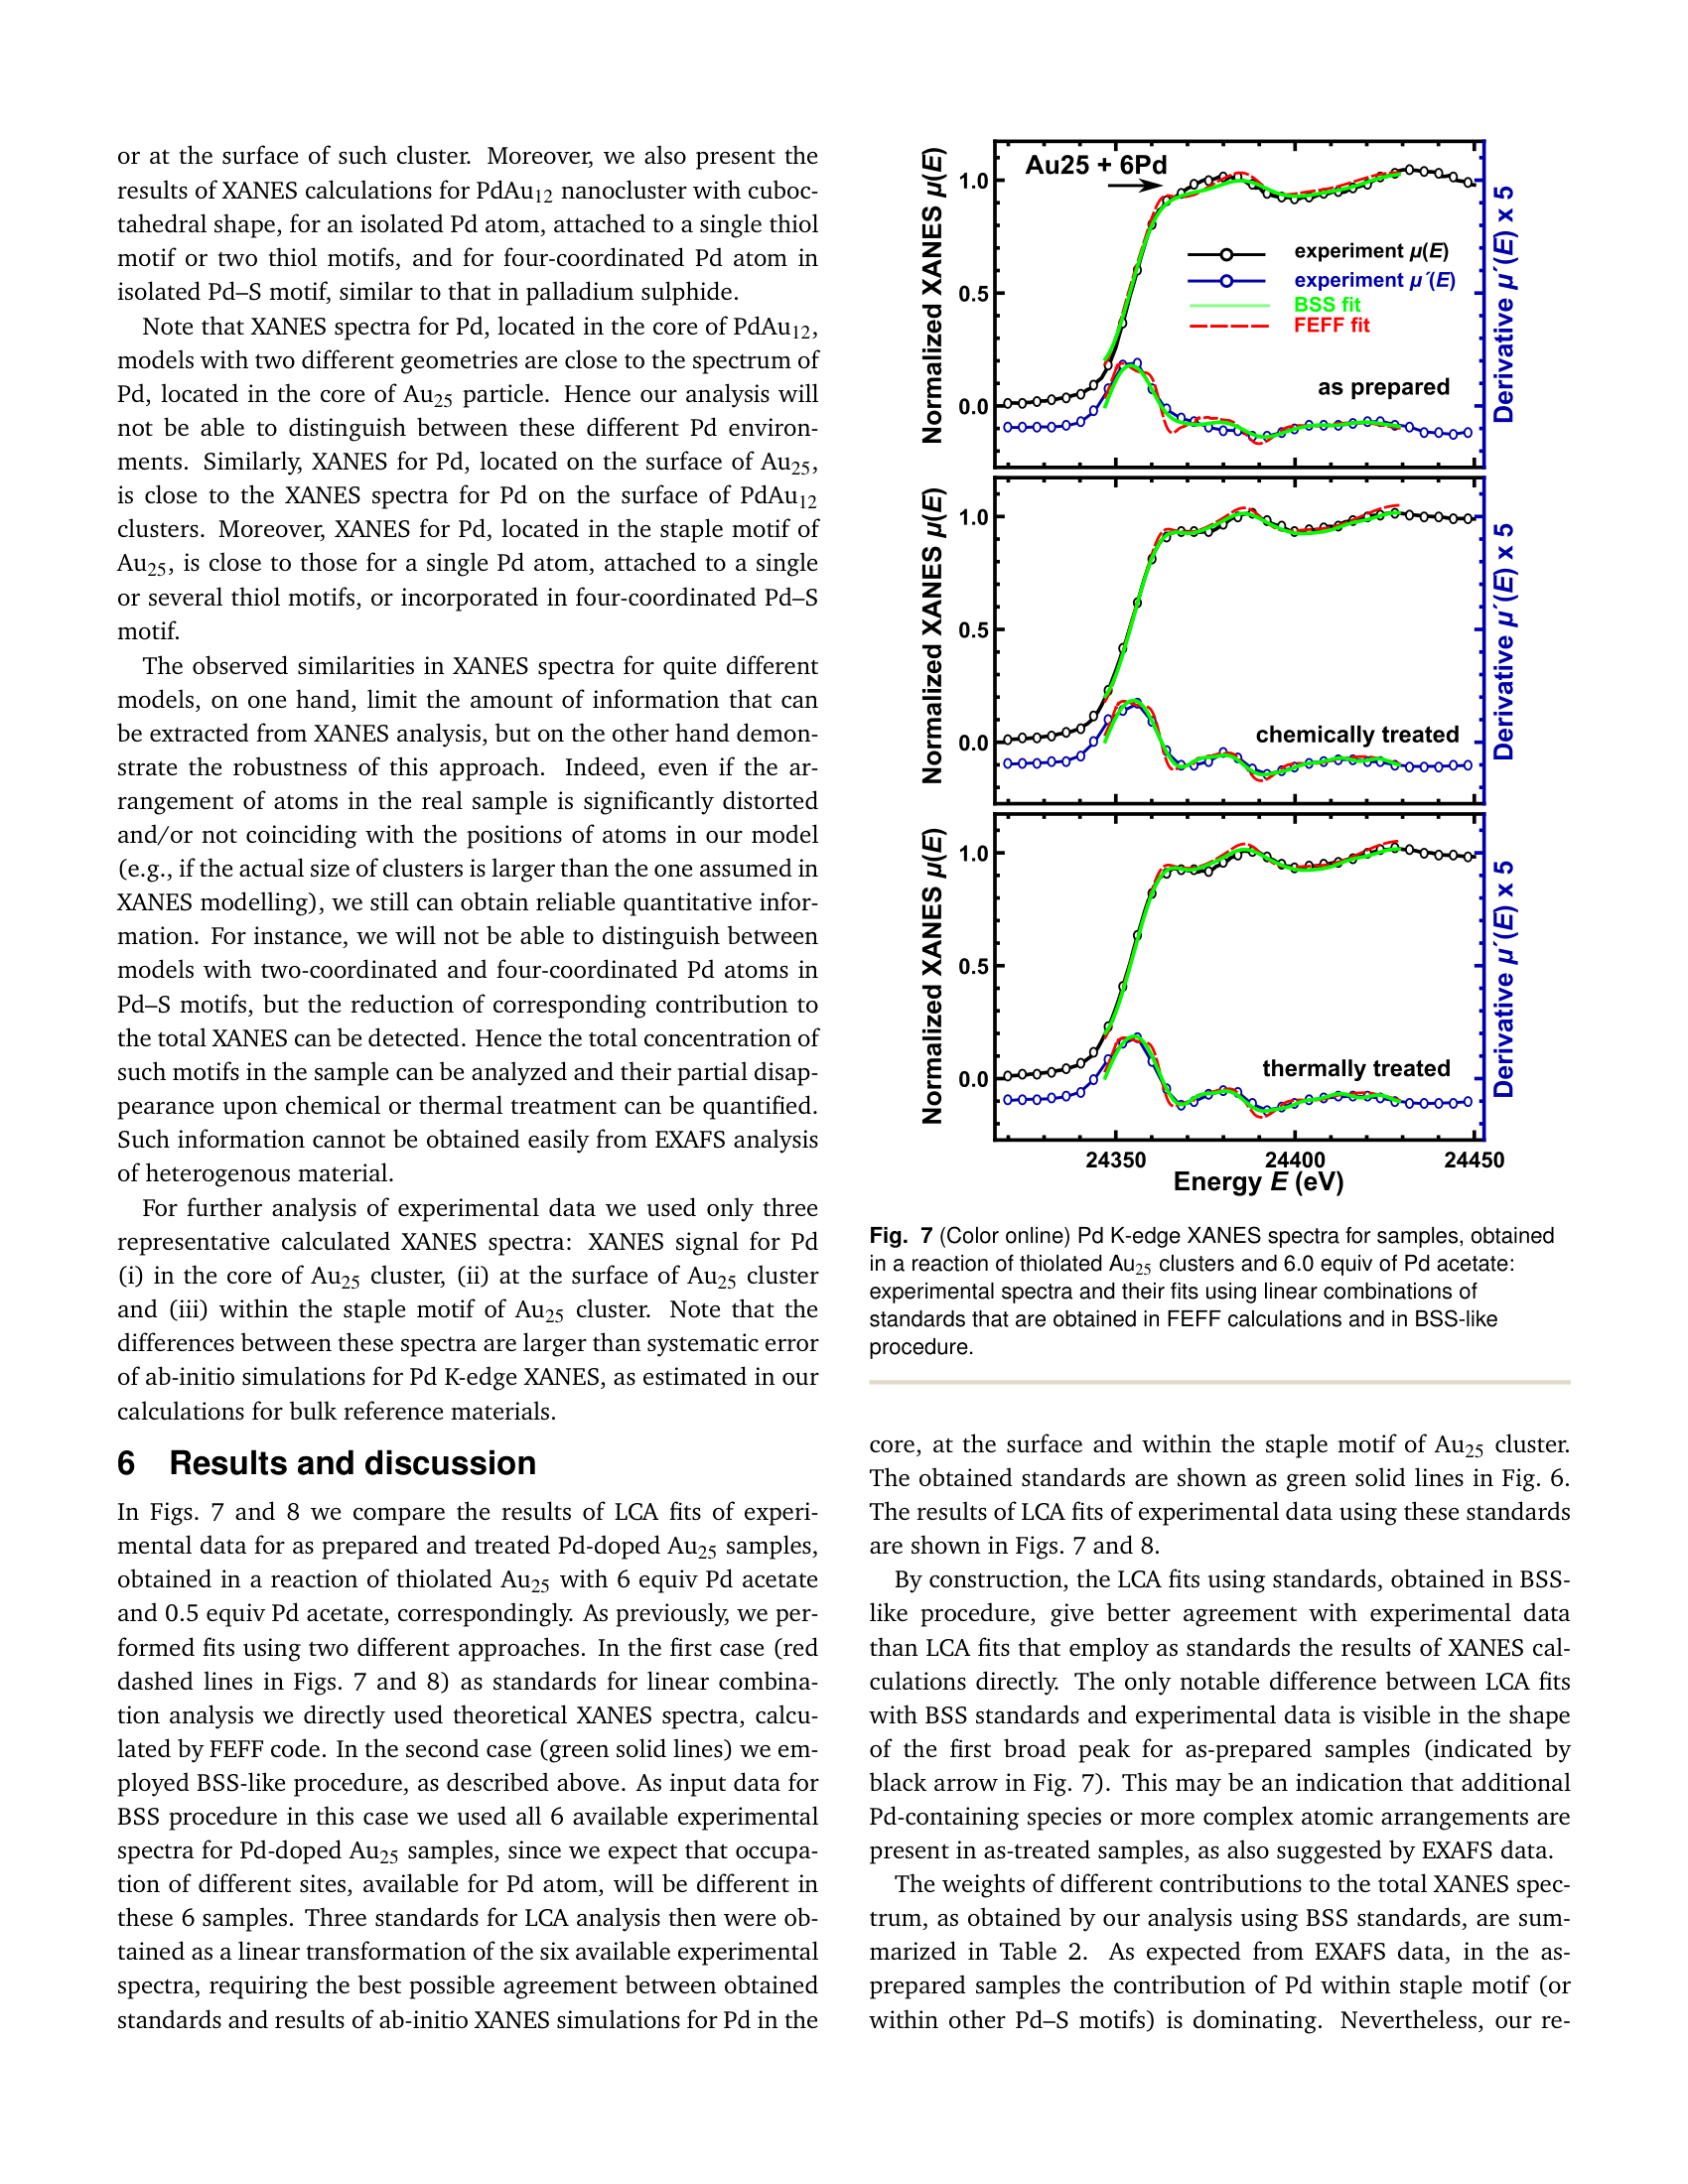
Page 10 (PDF page 10)
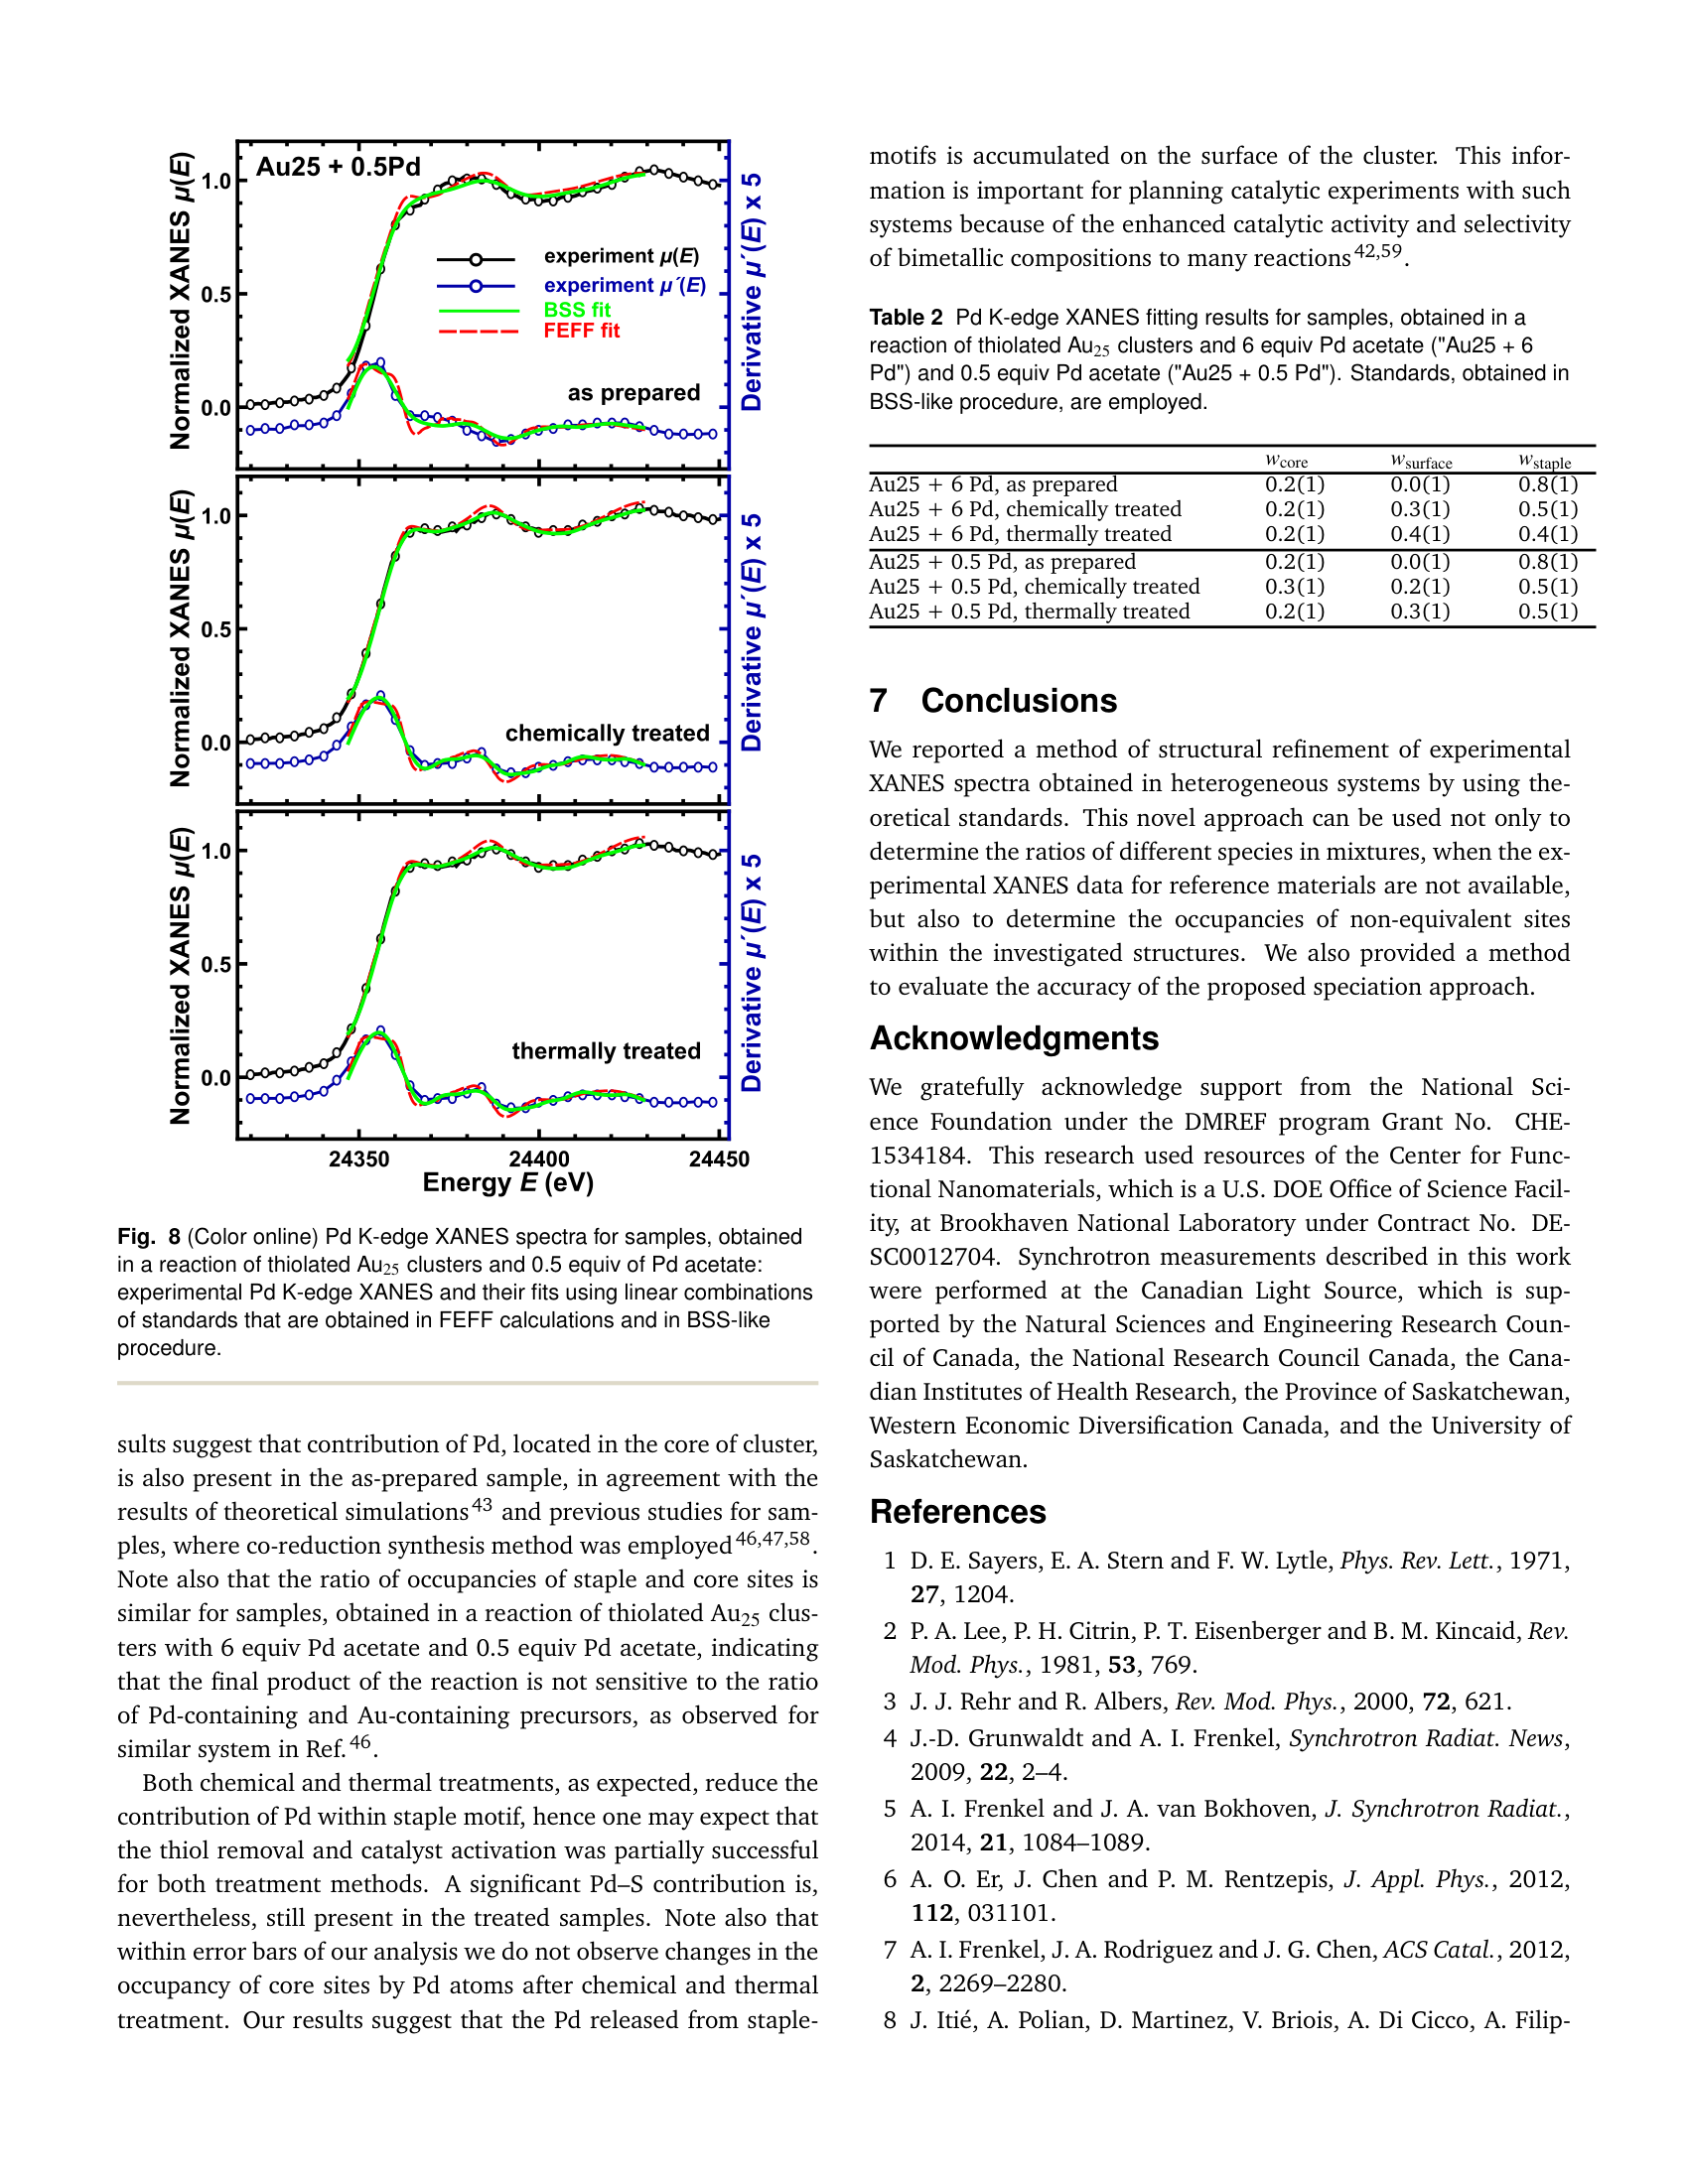
Page 7 (PDF page 7)
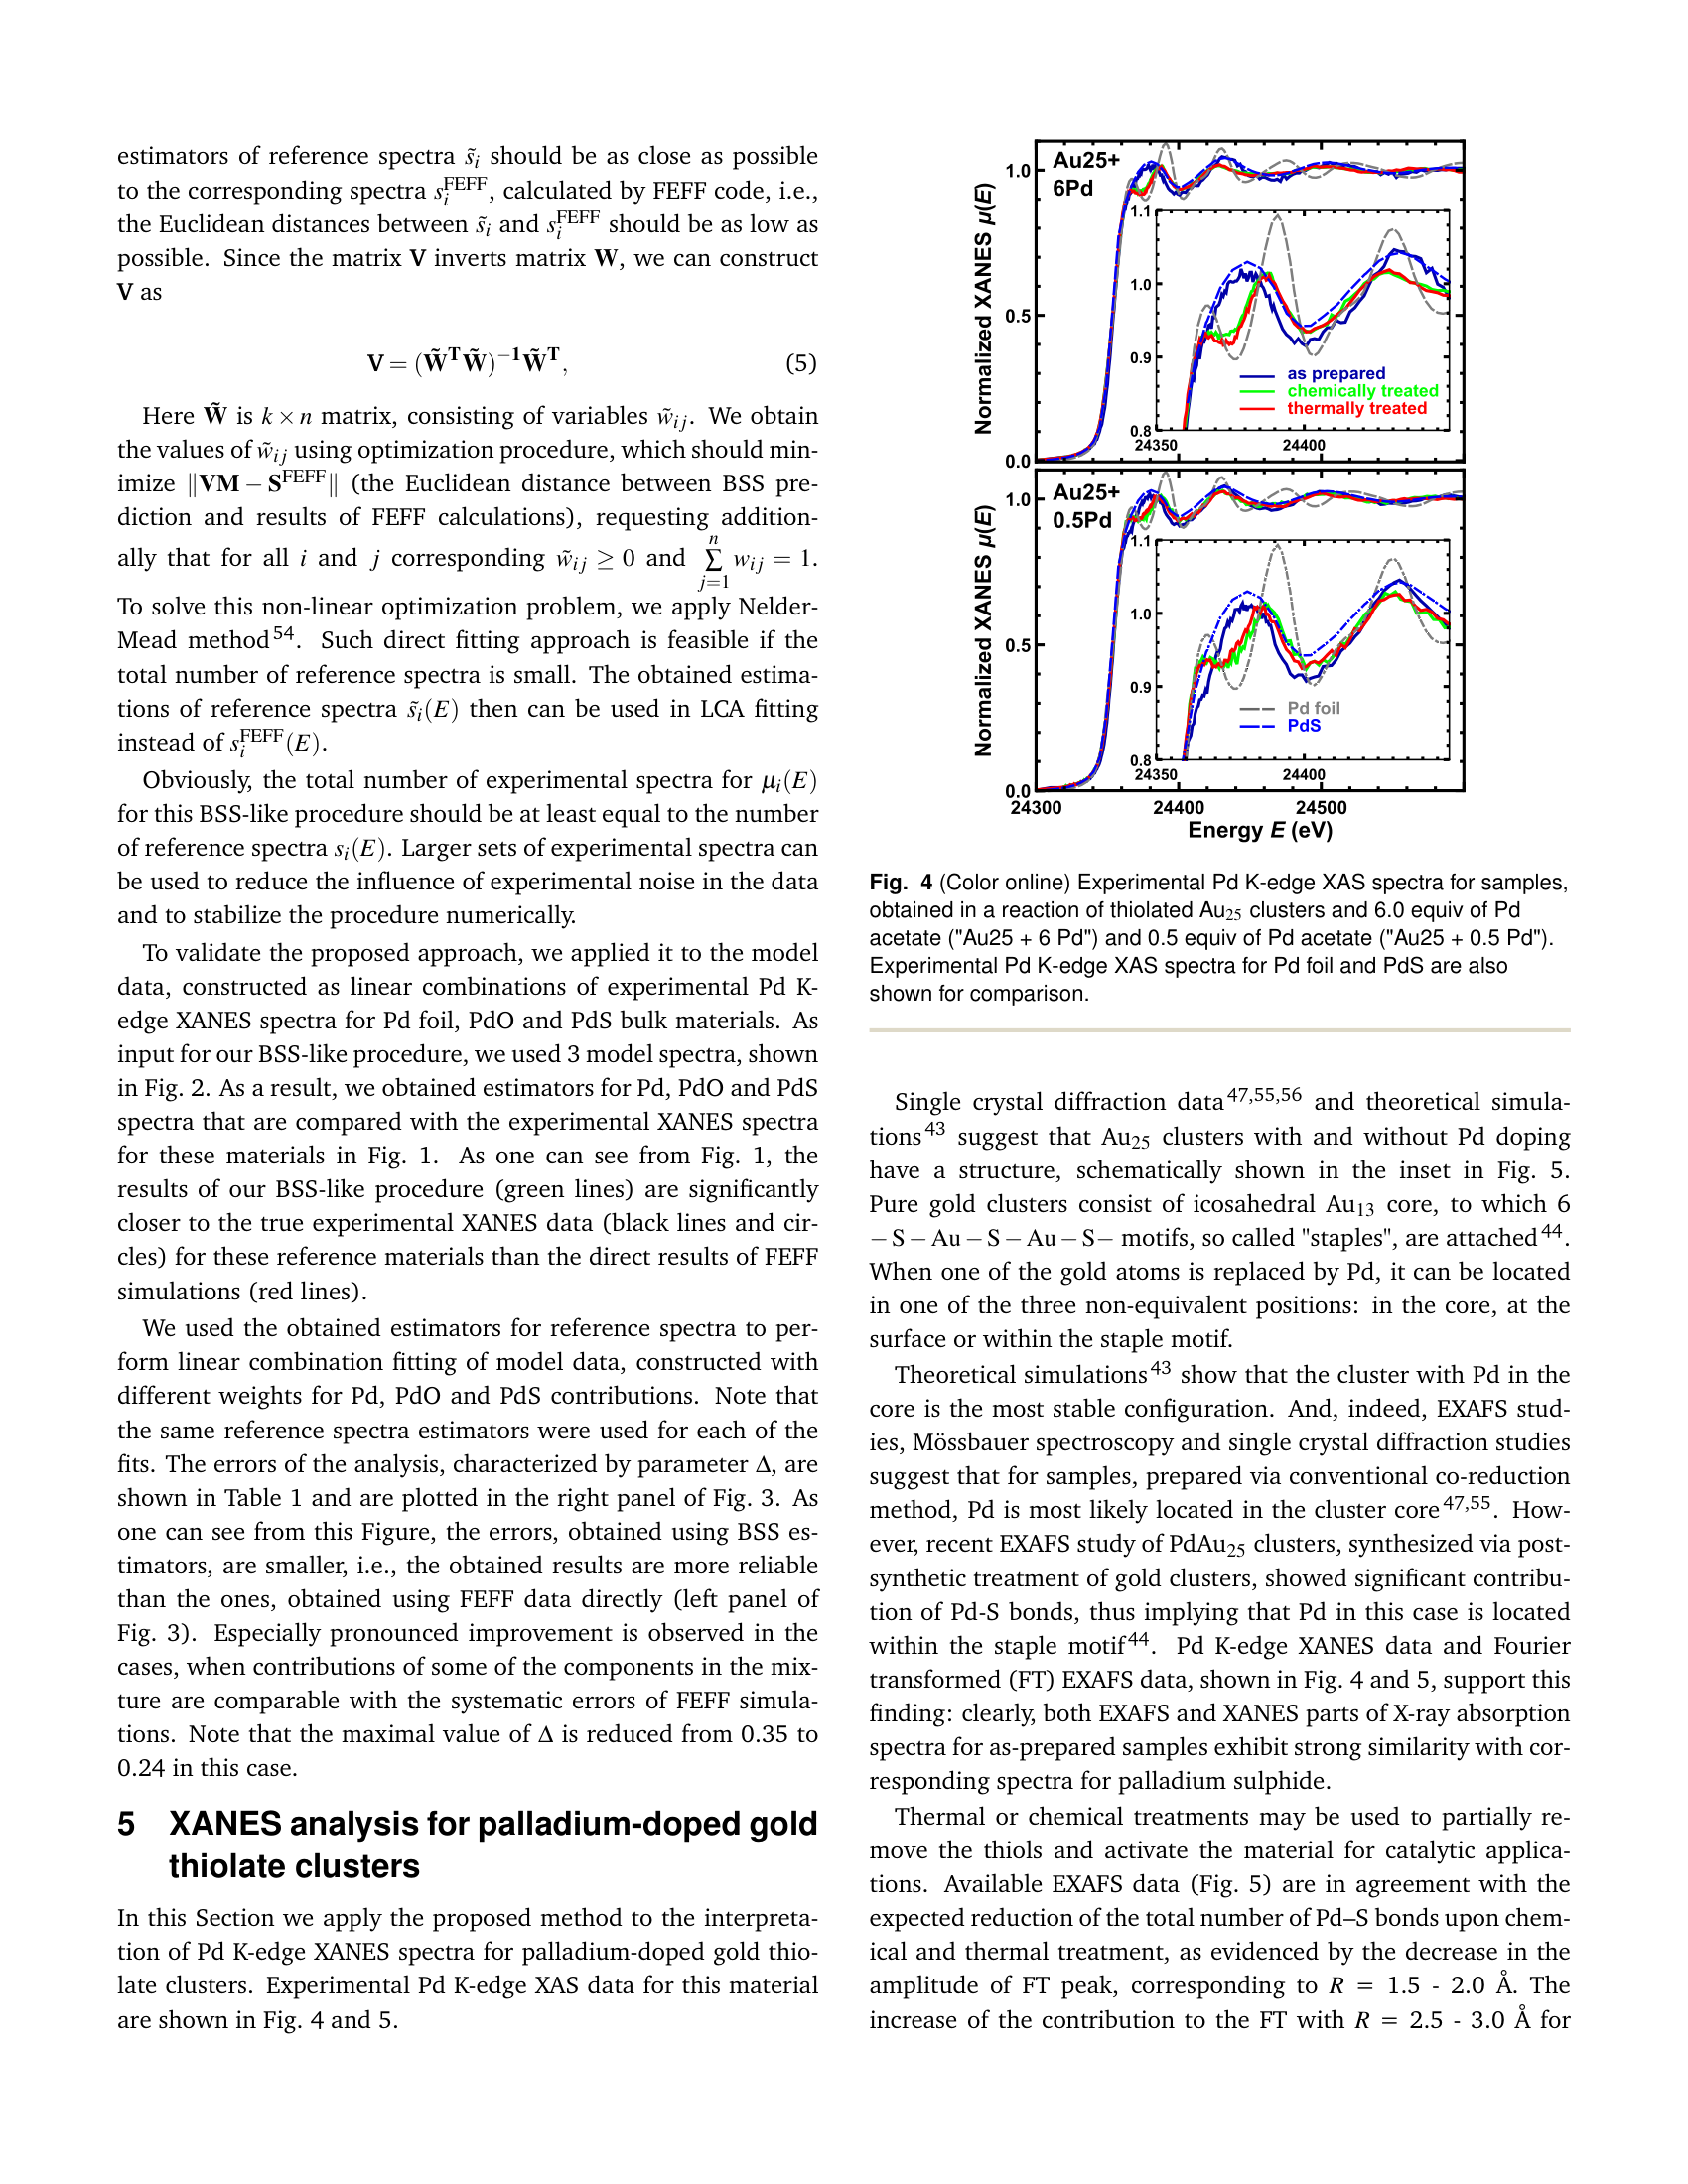
#28
Pd-doped Au25(SC8H9)18
Pd K
▶
LLM Prompt
Sample Information
Material: Pd-doped Au25(SC8H9)18
Sample-Specific Conditions
- treatment: none
- Pd-doped gold thiolate cluster prepared with 6.0 equiv Pd acetate
Measurement
We plan to measure the Pd K XANES spectrum of this sample.
Questions
Based on all the information above:
1. What are the possible structural sites (reference states) for the Pd dopant in the thiolate-protected Au25 cluster that should be considered as basis functions for Linear Combination Analysis of the XANES spectrum?
2. For the as-prepared Pd-doped Au25 cluster synthesized with 6.0 equiv Pd acetate, estimate the relative fractions of Pd in the different structural sites.
3. Explain the physical reasoning behind the observed distribution of Pd dopants in the as-prepared sample.
Ground Truth
Material: Pd-doped Au25(SC8H9)18
Measurement: Pd K-edge XANES
Fit method: Linear Combination Analysis (LCA) using BSS-derived standards
Phase fractions: (±10%)
| Phase | Fraction |
|---|---|
| core site | 0.2 |
| surface site | 0.0 |
| staple site | 0.8 |
Fit basis (paper's reference spectra):
- Pd in the core of Au25 cluster
- Pd at the surface of Au25 cluster
- Pd within the staple motif of Au25 cluster
Source evidence: Table 2, page 10
Key reasoning: In the as-prepared samples synthesized via post-synthetic treatment, the contribution of Pd within the staple motif (or other Pd-S motifs) is dominating, which is consistent with EXAFS data showing significant Pd-S bonds. A smaller contribution of Pd located in the core of the cluster is also present, in agreement with theoretical simulations showing the core site is the most thermodynamically stable configuration.
Reasoning source: Section 5 (page 7) and Section 6 (pages 9-10)
Scoring Rubric (total: 100 pts)
| Q | Type | Max | Question | Reference Answer | Scoring Criteria |
|---|---|---|---|---|---|
| q1 | identification | 30 | What are the possible structural sites (reference states) for the Pd dopant in the thiolate-protected Au25 cluster that should be considered as basis functions for Linear Combination Analysis of the XANES spectrum? | For the Linear Combination Analysis of the Pd K-edge XANES spectrum, the basis functions should include Pd in the core of the Au25 cluster, Pd at the surface of the Au25 cluster, and Pd within the staple motif of the Au25 cluster. These specific reference states must be considered because the sample is a Pd-doped Au25(SC8H9)18 cluster prepared via post-synthetic treatment with Pd acetate. During this synthesis process, the Pd dopant can substitute into distinct structural environments within the cluster architecture. The inclusion of these specific sites is justified by theoretical simulations showing the core site is the most thermodynamically stable configuration, while EXAFS data indicates significant Pd-S bonding characteristic of the staple motifs. | Full points for identifying the core, surface, and staple motif sites. |
| q2 | quantification | 40 | For the as-prepared Pd-doped Au25 cluster synthesized with 6.0 equiv Pd acetate, estimate the relative fractions of Pd in the different structural sites. | For the as-prepared Pd-doped Au25 cluster synthesized with 6.0 equivalents of Pd acetate, the estimated relative fractions are 0.8 for the staple site, 0.2 for the core site, and 0.0 for the surface site, with an uncertainty of 10%. These specific values result directly from the post-synthetic treatment method used to prepare the sample. Under these untreated, as-prepared conditions, Pd incorporation within the staple motif dominates, which is consistent with EXAFS data showing significant Pd-S bonds. The smaller 20% fraction of Pd located in the core is present because it represents the most thermodynamically stable configuration, even though the synthesis method primarily drives Pd into the staple motifs. | Full points for estimating ~80% in the staple site, ~20% in the core site, and ~0% on the surface. |
| q3 | reasoning | 30 | Explain the physical reasoning behind the observed distribution of Pd dopants in the as-prepared sample. | The observed distribution of Pd dopants is driven by the specific post-synthetic treatment using 6.0 equivalents of Pd acetate without any subsequent treatment. In this as-prepared state, the incorporation of Pd within the staple motif (or other Pd-S motifs) dominates the structure, yielding an 80% fraction that is consistent with EXAFS data showing significant Pd-S bonds. Concurrently, a smaller 20% fraction of Pd is located in the core of the cluster. This core incorporation occurs because, as shown by theoretical simulations, the core site represents the most thermodynamically stable configuration for the Pd dopant within the Au25(SC8H9)18 architecture. | Full points for explaining that the staple motif dominates due to the post-synthetic treatment method (supported by Pd-S bonds in EXAFS), while a minor core fraction exists as it is the most thermodynamically stable configuration. |
Review
#29
Pd-doped Au25(SC8H9)18
Pd K
▶
LLM Prompt
Sample Information
Material: Pd-doped Au25(SC8H9)18
Sample-Specific Conditions
- treatment: chemical (LiBH4)
- Pd-doped gold thiolate cluster prepared with 6.0 equiv Pd acetate, chemically treated
Measurement
We plan to measure the Pd K XANES spectrum of this sample.
Questions
Based on all the information above:
1. What are the expected local environments or structural sites for Pd dopants in this chemically treated thiolate-protected gold cluster that should be used as reference states for XANES linear combination analysis?
2. Based on the chemical treatment (LiBH4) applied to the Pd-doped Au25 cluster prepared with 6.0 equiv Pd acetate, estimate the relative fractions of Pd in the different structural sites.
3. Explain the physical reasoning for the expected distribution of Pd atoms among the different sites in this chemically treated sample, particularly how the treatment alters the Pd distribution compared to an untreated sample.
Ground Truth
Material: Pd-doped Au25(SC8H9)18
Measurement: Pd K-edge XANES, transmission mode, Canadian Light Source
Fit method: LCA with BSS-derived standards
Phase fractions: (±10%)
| Phase | Fraction |
|---|---|
| core site | 0.2 |
| surface site | 0.3 |
| staple site | 0.5 |
Fit basis (paper's reference spectra):
- Pd in the core of Au25 cluster
- Pd at the surface of Au25 cluster
- Pd within the staple motif of Au25 cluster
Source evidence: Table 2, page 10
Key reasoning: Chemical treatment with LiBH4 partially removes thiols from the cluster, which is intended to activate the material for catalysis. This treatment reduces the contribution of Pd located within the staple motifs (Pd-S bonds) compared to the as-prepared sample. The Pd atoms released from the staple motifs accumulate on the surface of the cluster, increasing the surface site fraction, while the occupancy of the core sites by Pd atoms remains unchanged.
Reasoning source: Section 6 (Results and discussion), page 10
Scoring Rubric (total: 100 pts)
| Q | Type | Max | Question | Reference Answer | Scoring Criteria |
|---|---|---|---|---|---|
| q1 | identification | 30 | What are the expected local environments or structural sites for Pd dopants in this chemically treated thiolate-protected gold cluster that should be used as reference states for XANES linear combination analysis? | The expected local environments for Pd dopants to be used as reference states in XANES linear combination analysis are Pd in the core of the Au25 cluster, Pd at the surface of the Au25 cluster, and Pd within the staple motif of the Au25 cluster. These specific sites are expected because the sample is a Pd-doped Au25(SC8H9)18 cluster that has undergone chemical treatment with LiBH4. This treatment partially removes thiols to activate the material for catalysis, which releases some Pd atoms from the staple motifs (Pd-S bonds). Consequently, the released Pd atoms accumulate on the cluster surface, while the core sites remain occupied, necessitating reference states for all three distinct structural environments. | Full credit for identifying the three distinct Pd sites: in the cluster core, on the cluster surface, and within the staple motif (or Pd-S motif). |
| q2 | quantification | 40 | Based on the chemical treatment (LiBH4) applied to the Pd-doped Au25 cluster prepared with 6.0 equiv Pd acetate, estimate the relative fractions of Pd in the different structural sites. | The estimated relative fractions of Pd in the different structural sites are 0.2 (20%) in the core site, 0.3 (30%) in the surface site, and 0.5 (50%) in the staple site, with an uncertainty of 10%. These specific values result from the chemical treatment of the Pd-doped Au25(SC8H9)18 cluster with LiBH4, which is designed to activate the material for catalysis by partially removing thiols. This thiol removal reduces the fraction of Pd located within the staple motifs (Pd-S bonds) compared to the as-prepared state. The Pd atoms released from these staple motifs migrate and accumulate on the surface of the cluster, thereby increasing the surface site fraction to 30%, while the core site occupancy remains unchanged at 20%. | Full credit for estimating fractions close to 0.2 for the core site, 0.3 for the surface site, and 0.5 for the staple site (within the ~10% uncertainty). |
| q3 | reasoning | 30 | Explain the physical reasoning for the expected distribution of Pd atoms among the different sites in this chemically treated sample, particularly how the treatment alters the Pd distribution compared to an untreated sample. | The distribution of Pd atoms in the Pd-doped Au25(SC8H9)18 cluster is directly altered by the chemical treatment with LiBH4. This treatment is intended to activate the material for catalysis by partially removing protective thiols from the cluster. As thiols are removed, the contribution of Pd located within the staple motifs (characterized by Pd-S bonds) is reduced compared to the as-prepared sample. The Pd atoms that are released from these staple motifs subsequently accumulate on the surface of the cluster, leading to an increased fraction of surface sites. Meanwhile, the chemical treatment does not affect the interior of the cluster, meaning the occupancy of the core sites by Pd atoms remains unchanged. | Full credit for explaining that chemical treatment partially removes thiols, which releases Pd from the staple motifs and causes it to accumulate on the cluster surface, while the core occupancy remains stable. |
Review
#30
Pd-doped Au25(SC8H9)18
Pd K
▶
LLM Prompt
Sample Information
Material: Pd-doped Au25(SC8H9)18
Sample-Specific Conditions
- treatment: thermal (250C air, then H2)
- Pd-doped gold thiolate cluster prepared with 6.0 equiv Pd acetate, thermally treated
Measurement
We plan to measure the Pd K XANES spectrum of this sample.
Questions
Based on all the information above:
1. What are the distinct structural sites for Pd dopants in the thiolate-protected Au25 cluster that should be considered as reference components for XANES linear combination analysis?
2. Explain the physical reasoning for the observed distribution of Pd sites following the thermal treatment, specifically regarding the movement of Pd atoms compared to an as-prepared sample.
Ground Truth
Material: Pd-doped Au25(SC8H9)18
Measurement: Pd K-edge XANES, transmission mode
Fit method: LCA using BSS-derived standards guided by ab-initio simulations
Phase fractions: (±10%)
| Phase | Fraction |
|---|---|
| core site | 0.2 |
| surface site | 0.4 |
| staple site | 0.4 |
Fit basis (paper's reference spectra):
- Pd in the core of Au25 cluster
- Pd at the surface of Au25 cluster
- Pd within the staple motif of Au25 cluster
Source evidence: Table 2, page 10
Key reasoning: Thermal treatment partially removes thiols, which reduces the contribution of Pd within the staple motif. The Pd atoms released from these staple motifs accumulate on the surface of the cluster. Meanwhile, the occupancy of core sites by Pd atoms remains stable and does not change significantly after the thermal treatment.
Reasoning source: Section 6 (Results and discussion), page 10
Scoring Rubric (total: 100 pts)
| Q | Type | Max | Question | Reference Answer | Scoring Criteria |
|---|---|---|---|---|---|
| q1 | identification | 50 | What are the distinct structural sites for Pd dopants in the thiolate-protected Au25 cluster that should be considered as reference components for XANES linear combination analysis? | For the linear combination analysis of the Pd-doped Au25(SC8H9)18 cluster, the distinct structural sites to consider as reference components are Pd in the core, Pd at the surface, and Pd within the staple motif of the Au25 cluster. These specific sites are expected because the sample is a Pd-doped gold thiolate cluster that has undergone thermal treatment at 250°C in air followed by H2. Under these thermal conditions, thiols are partially removed, causing Pd atoms to be released from the staple motifs and accumulate on the cluster surface. Meanwhile, the Pd atoms occupying the core sites remain stable during this thermal treatment, necessitating the inclusion of all three distinct environments in the fit basis. | Full points for identifying the three key sites: core, surface, and staple (or thiol-bound) motifs. |
| q3 | reasoning | 50 | Explain the physical reasoning for the observed distribution of Pd sites following the thermal treatment, specifically regarding the movement of Pd atoms compared to an as-prepared sample. | Following the thermal treatment at 250°C in air and then H2, the observed distribution of Pd sites is 20% in the core, 40% on the surface, and 40% in the staple motifs. This specific distribution occurs because the thermal treatment partially removes the protective thiols from the Pd-doped Au25(SC8H9)18 cluster. As a result of this thiol removal, the contribution of Pd within the staple motif is reduced, and the released Pd atoms migrate to and accumulate on the surface of the cluster. In contrast, the occupancy of the core sites by Pd atoms remains stable and does not change significantly after the thermal treatment, leading to the final observed fractions. | Full points for explaining that thermal treatment removes thiols, causing Pd to be released from staple motifs and migrate to the cluster surface, while the core occupancy remains stable. |
Review
#31
Pd-doped Au25(SC8H9)18
Pd K
▶
LLM Prompt
Sample Information
Material: Pd-doped Au25(SC8H9)18
Sample-Specific Conditions
- treatment: chemical (LiBH4)
- Pd-doped gold thiolate cluster prepared with 0.5 equiv Pd acetate, chemically treated
Measurement
We plan to measure the Pd K XANES spectrum of this sample.
Questions
Based on all the information above:
1. When performing Linear Combination Analysis (LCF) on the Pd K-edge XANES spectrum of a Pd-doped Au25 thiolate cluster, what specific structural motifs or local environments should be included as candidate reference states?
2. Explain the chemical reasoning for the expected distribution of Pd sites in this chemically treated sample. Specifically, how does the LiBH4 treatment alter the Pd site distribution compared to the as-prepared state?
Ground Truth
Material: Pd-doped Au25(SC8H9)18
Measurement: Pd K-edge XANES, transmission mode, Canadian Light Source
Fit method: Linear Combination Analysis (LCA) using BSS-derived standards
Phase fractions: (±10%)
| Phase | Fraction |
|---|---|
| core site | 0.3 |
| surface site | 0.2 |
| staple site | 0.5 |
Fit basis (paper's reference spectra):
- Pd in the core of Au25 cluster
- Pd at the surface of Au25 cluster
- Pd within the staple motif of Au25 cluster
Source evidence: Table 2, page 10
Key reasoning: Chemical treatment with LiBH4 partially removes thiols to activate the catalyst, which reduces the contribution of Pd within the staple motif (Pd-S bonds) compared to the as-prepared state. The Pd released from these staple motifs accumulates on the surface of the cluster, leading to a newly formed surface site fraction. Meanwhile, the occupancy of core sites by Pd atoms remains relatively unchanged within error bars after the chemical treatment.
Reasoning source: Section 6 (Results and discussion), page 10
Scoring Rubric (total: 100 pts)
| Q | Type | Max | Question | Reference Answer | Scoring Criteria |
|---|---|---|---|---|---|
| q1 | identification | 33 | When performing Linear Combination Analysis (LCF) on the Pd K-edge XANES spectrum of a Pd-doped Au25 thiolate cluster, what specific structural motifs or local environments should be included as candidate reference states? | For the Linear Combination Analysis of the Pd K-edge XANES spectrum of the Pd-doped Au25(SC8H9)18 cluster, the candidate reference states should include Pd in the core of the Au25 cluster, Pd at the surface of the Au25 cluster, and Pd within the staple motif of the Au25 cluster. These specific structural motifs are expected because the sample was prepared with 0.5 equiv Pd acetate and subsequently treated chemically with LiBH4. The LiBH4 treatment partially removes thiols to activate the catalyst, which releases Pd from the staple motifs (Pd-S bonds) and causes it to accumulate on the cluster surface, creating the surface site reference. Meanwhile, the core sites remain relatively unchanged by the chemical treatment, necessitating references for all three distinct local environments to accurately capture the post-treatment state. | Full points for identifying the three key Pd environments: core of the cluster, surface of the cluster, and within the staple motif (or Pd-S motif). |
| q3 | reasoning | 67 | Explain the chemical reasoning for the expected distribution of Pd sites in this chemically treated sample. Specifically, how does the LiBH4 treatment alter the Pd site distribution compared to the as-prepared state? | The expected distribution of Pd sites in the LiBH4-treated Pd-doped Au25(SC8H9)18 sample is 30% core sites, 20% surface sites, and 50% staple sites. This distribution arises because the chemical treatment with LiBH4 acts to activate the catalyst by partially removing thiols from the cluster. This removal reduces the contribution of Pd within the staple motifs (Pd-S bonds) compared to the as-prepared state. The Pd atoms released from these staple motifs then accumulate on the surface of the cluster, resulting in the newly formed 20% surface site fraction. Throughout this chemical treatment, the occupancy of the core sites by Pd atoms remains relatively unchanged within error bars, maintaining the 30% core fraction. | Full points for explaining that chemical treatment partially removes thiols, which reduces the amount of Pd in the staple motifs (Pd-S bonds). The Pd released from these staples migrates/accumulates on the cluster surface, while the core Pd occupancy remains relatively stable. |
Review
Operando structural and chemical evolutions of TiS 2 in Na-ion batteries
Original-17
Electrochemistry
Cheng-Hung Lin et al.
DOI: 10.1039/d0ta00226g
3 scenarios
PDF
▶
Key Paper Evidence3C, 4, 4B, 4D, 5, S2, p.11, p.16, p.34▶
Figure 3C (PDF page 12)
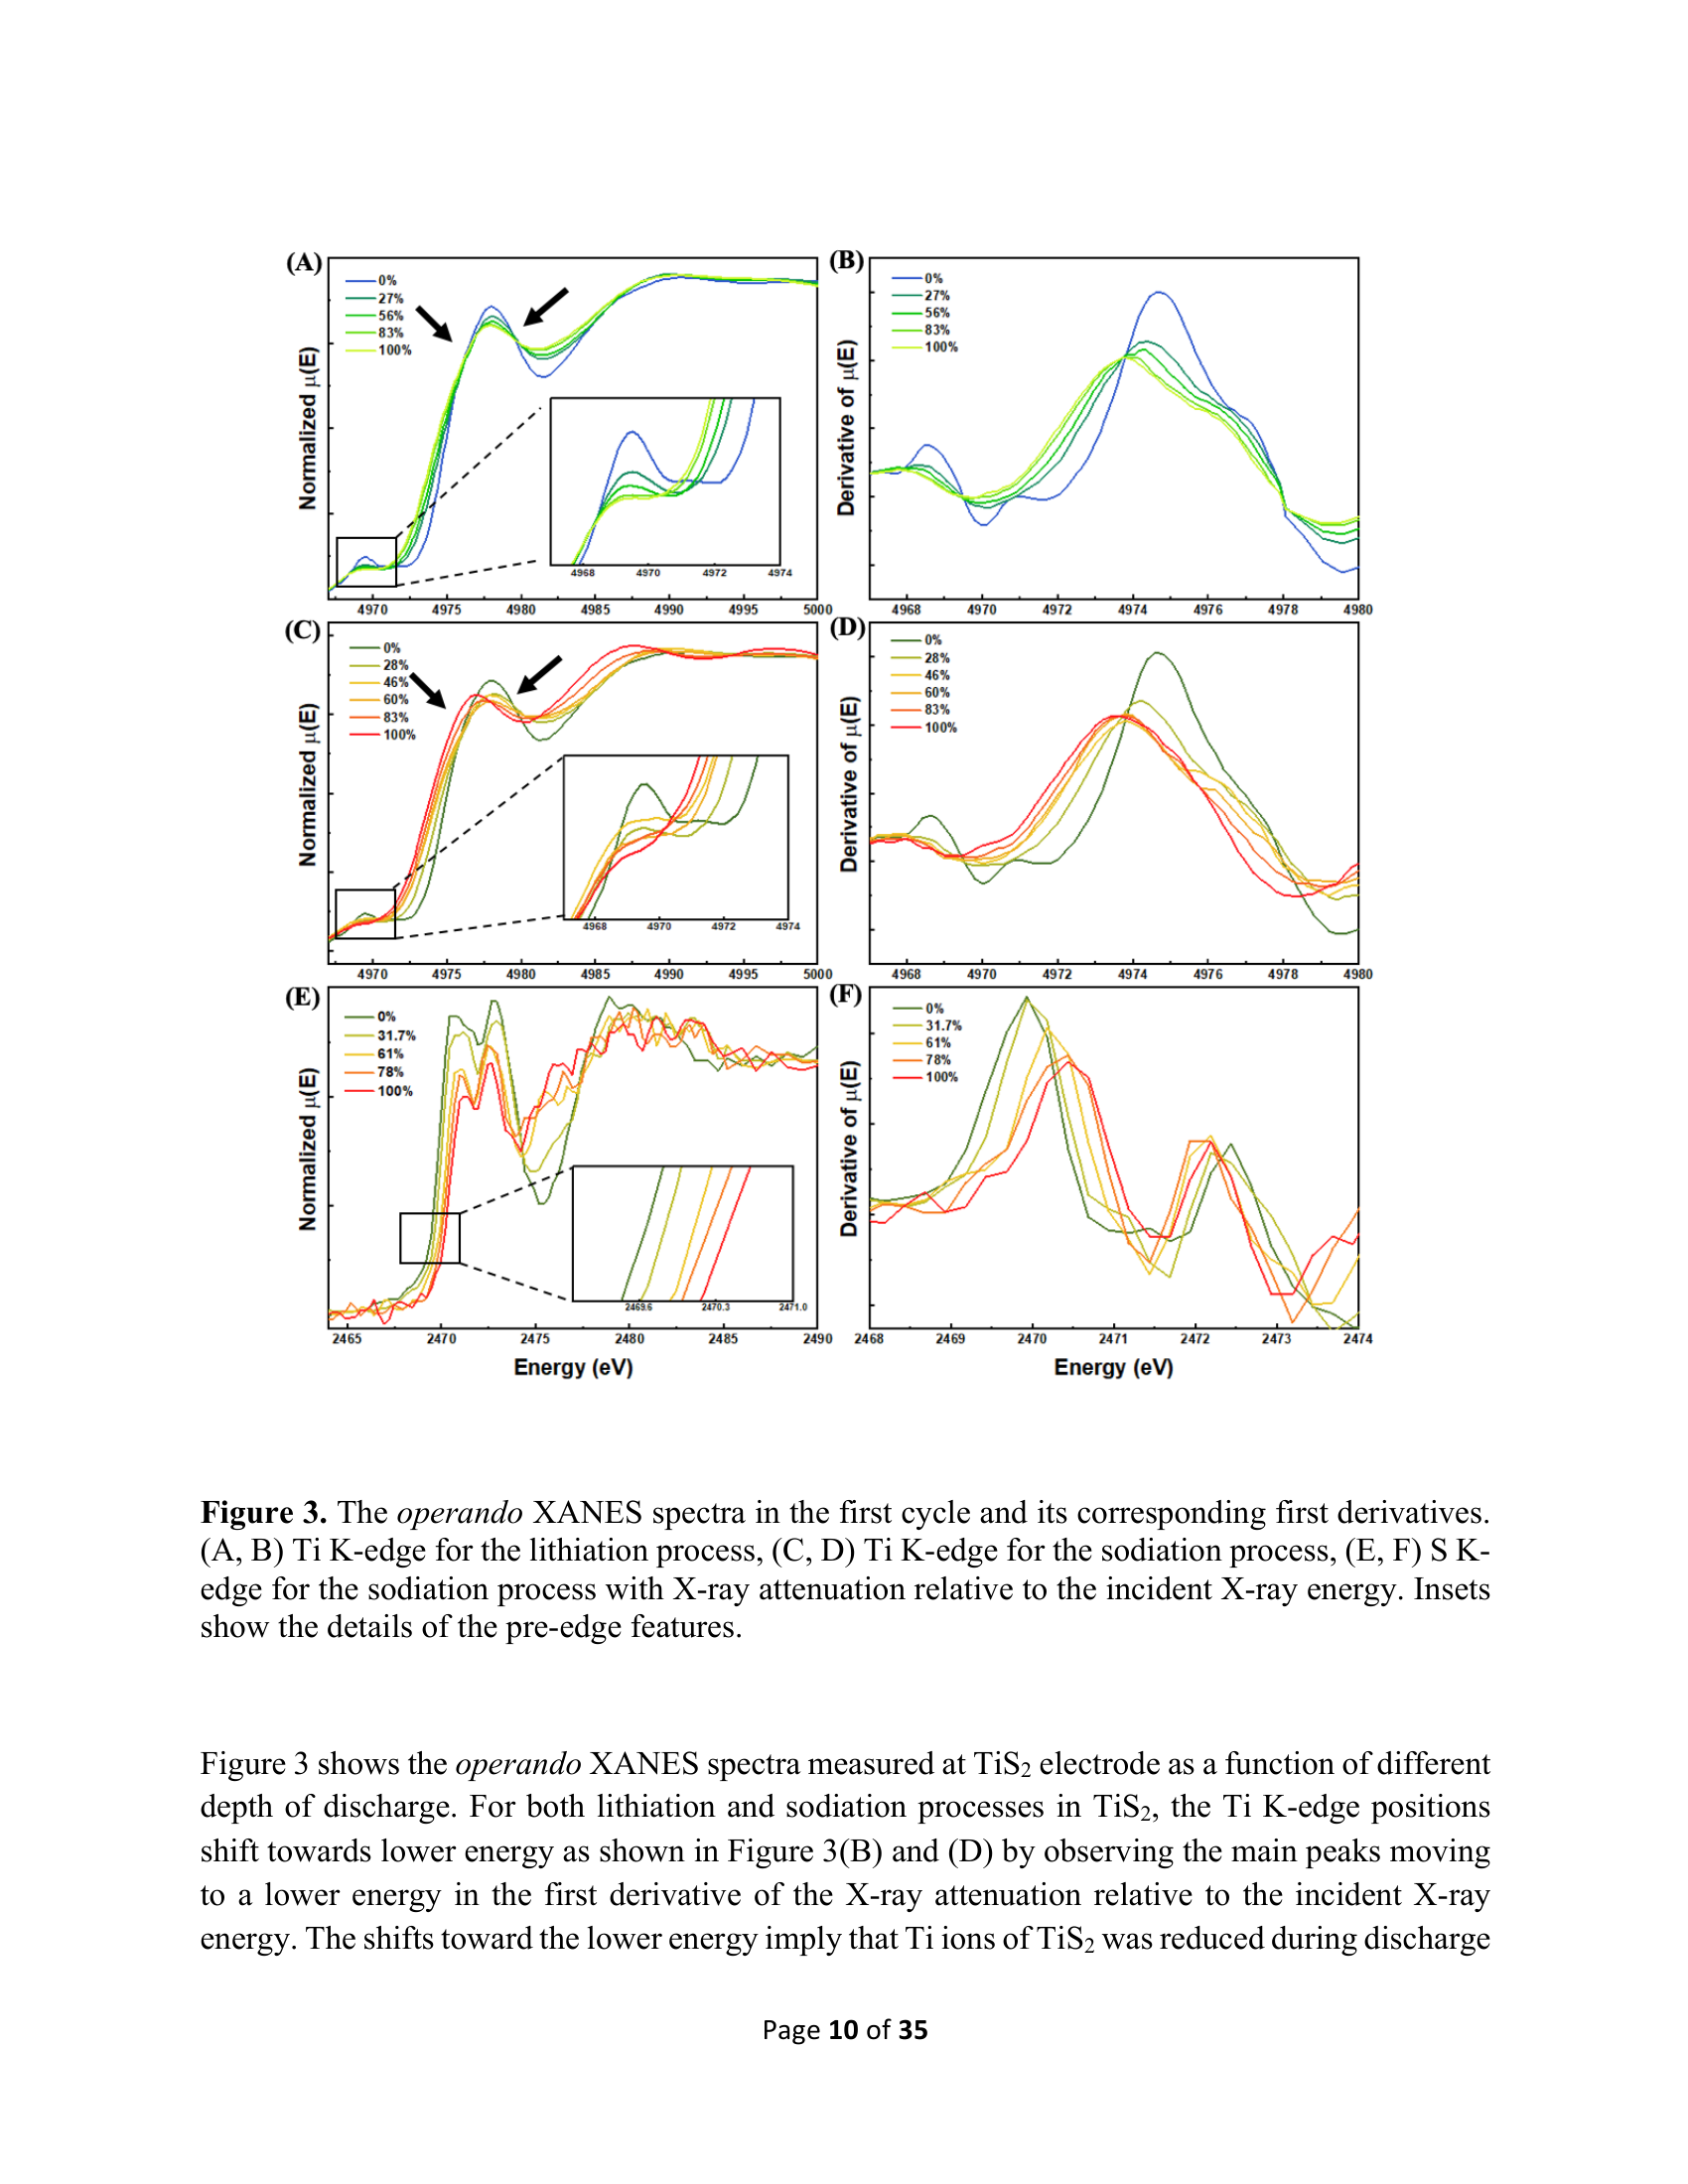
Figure 4 (PDF page 15)
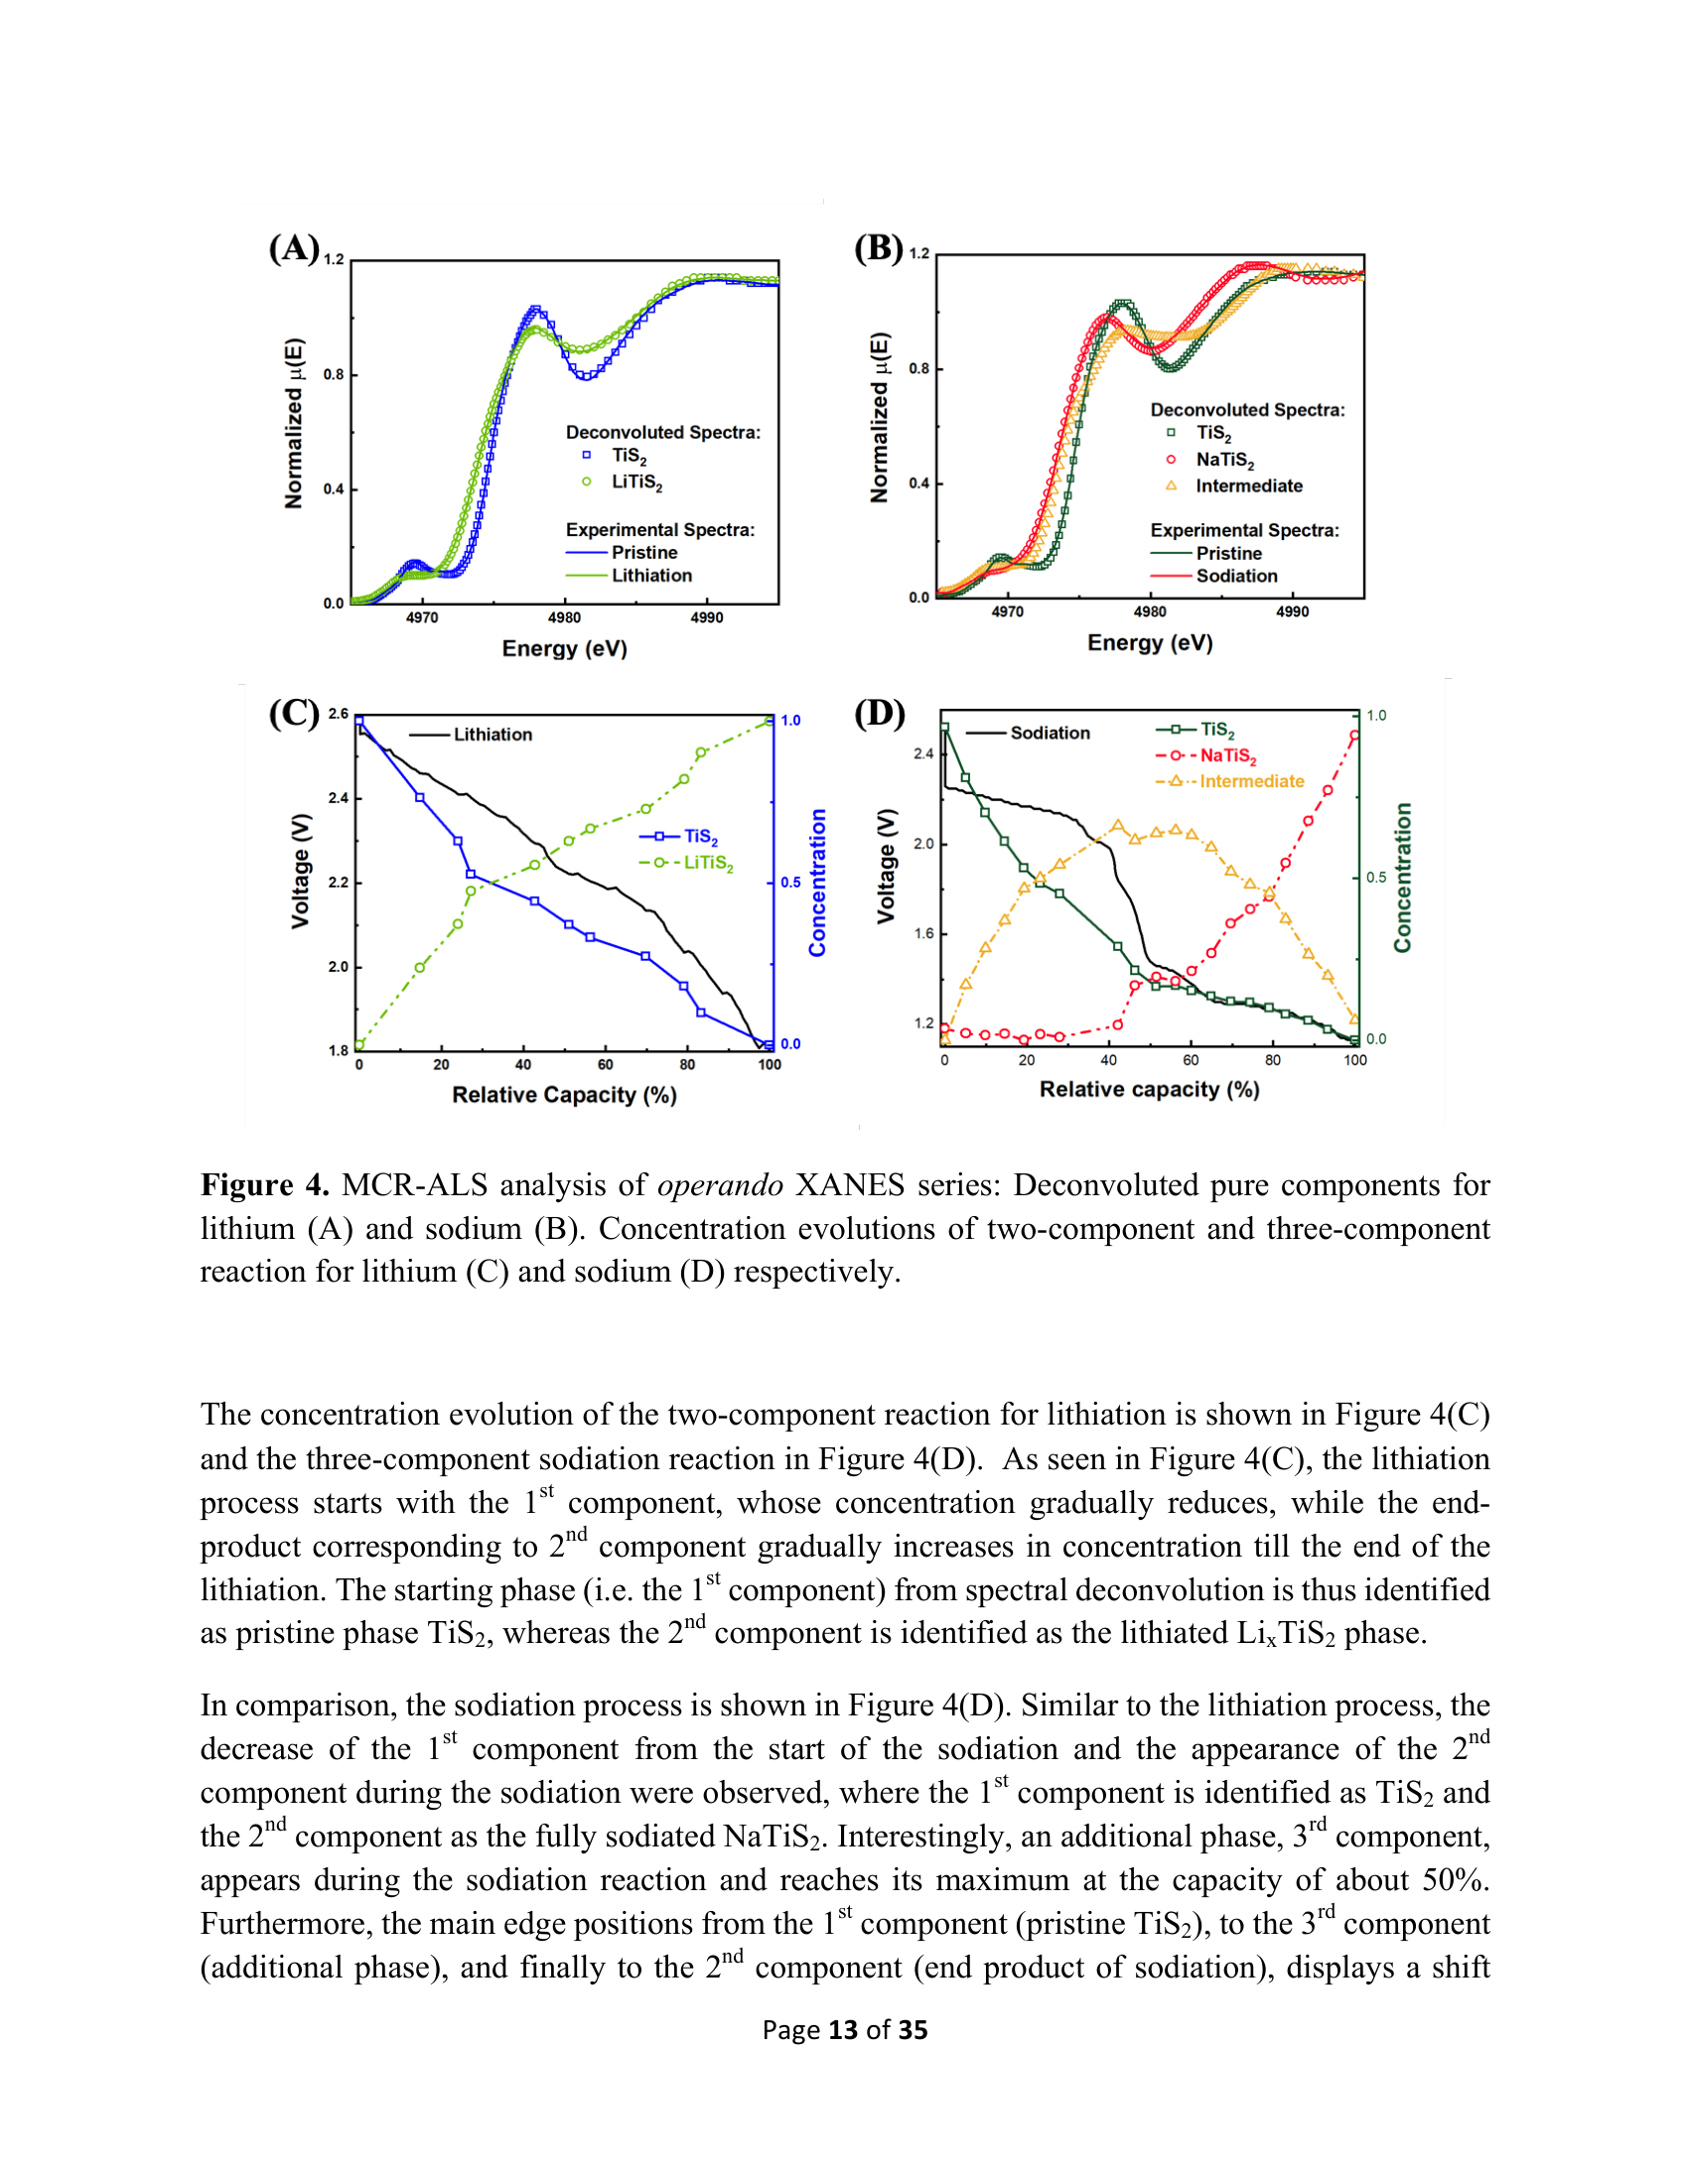
Figure 5 (PDF page 17)
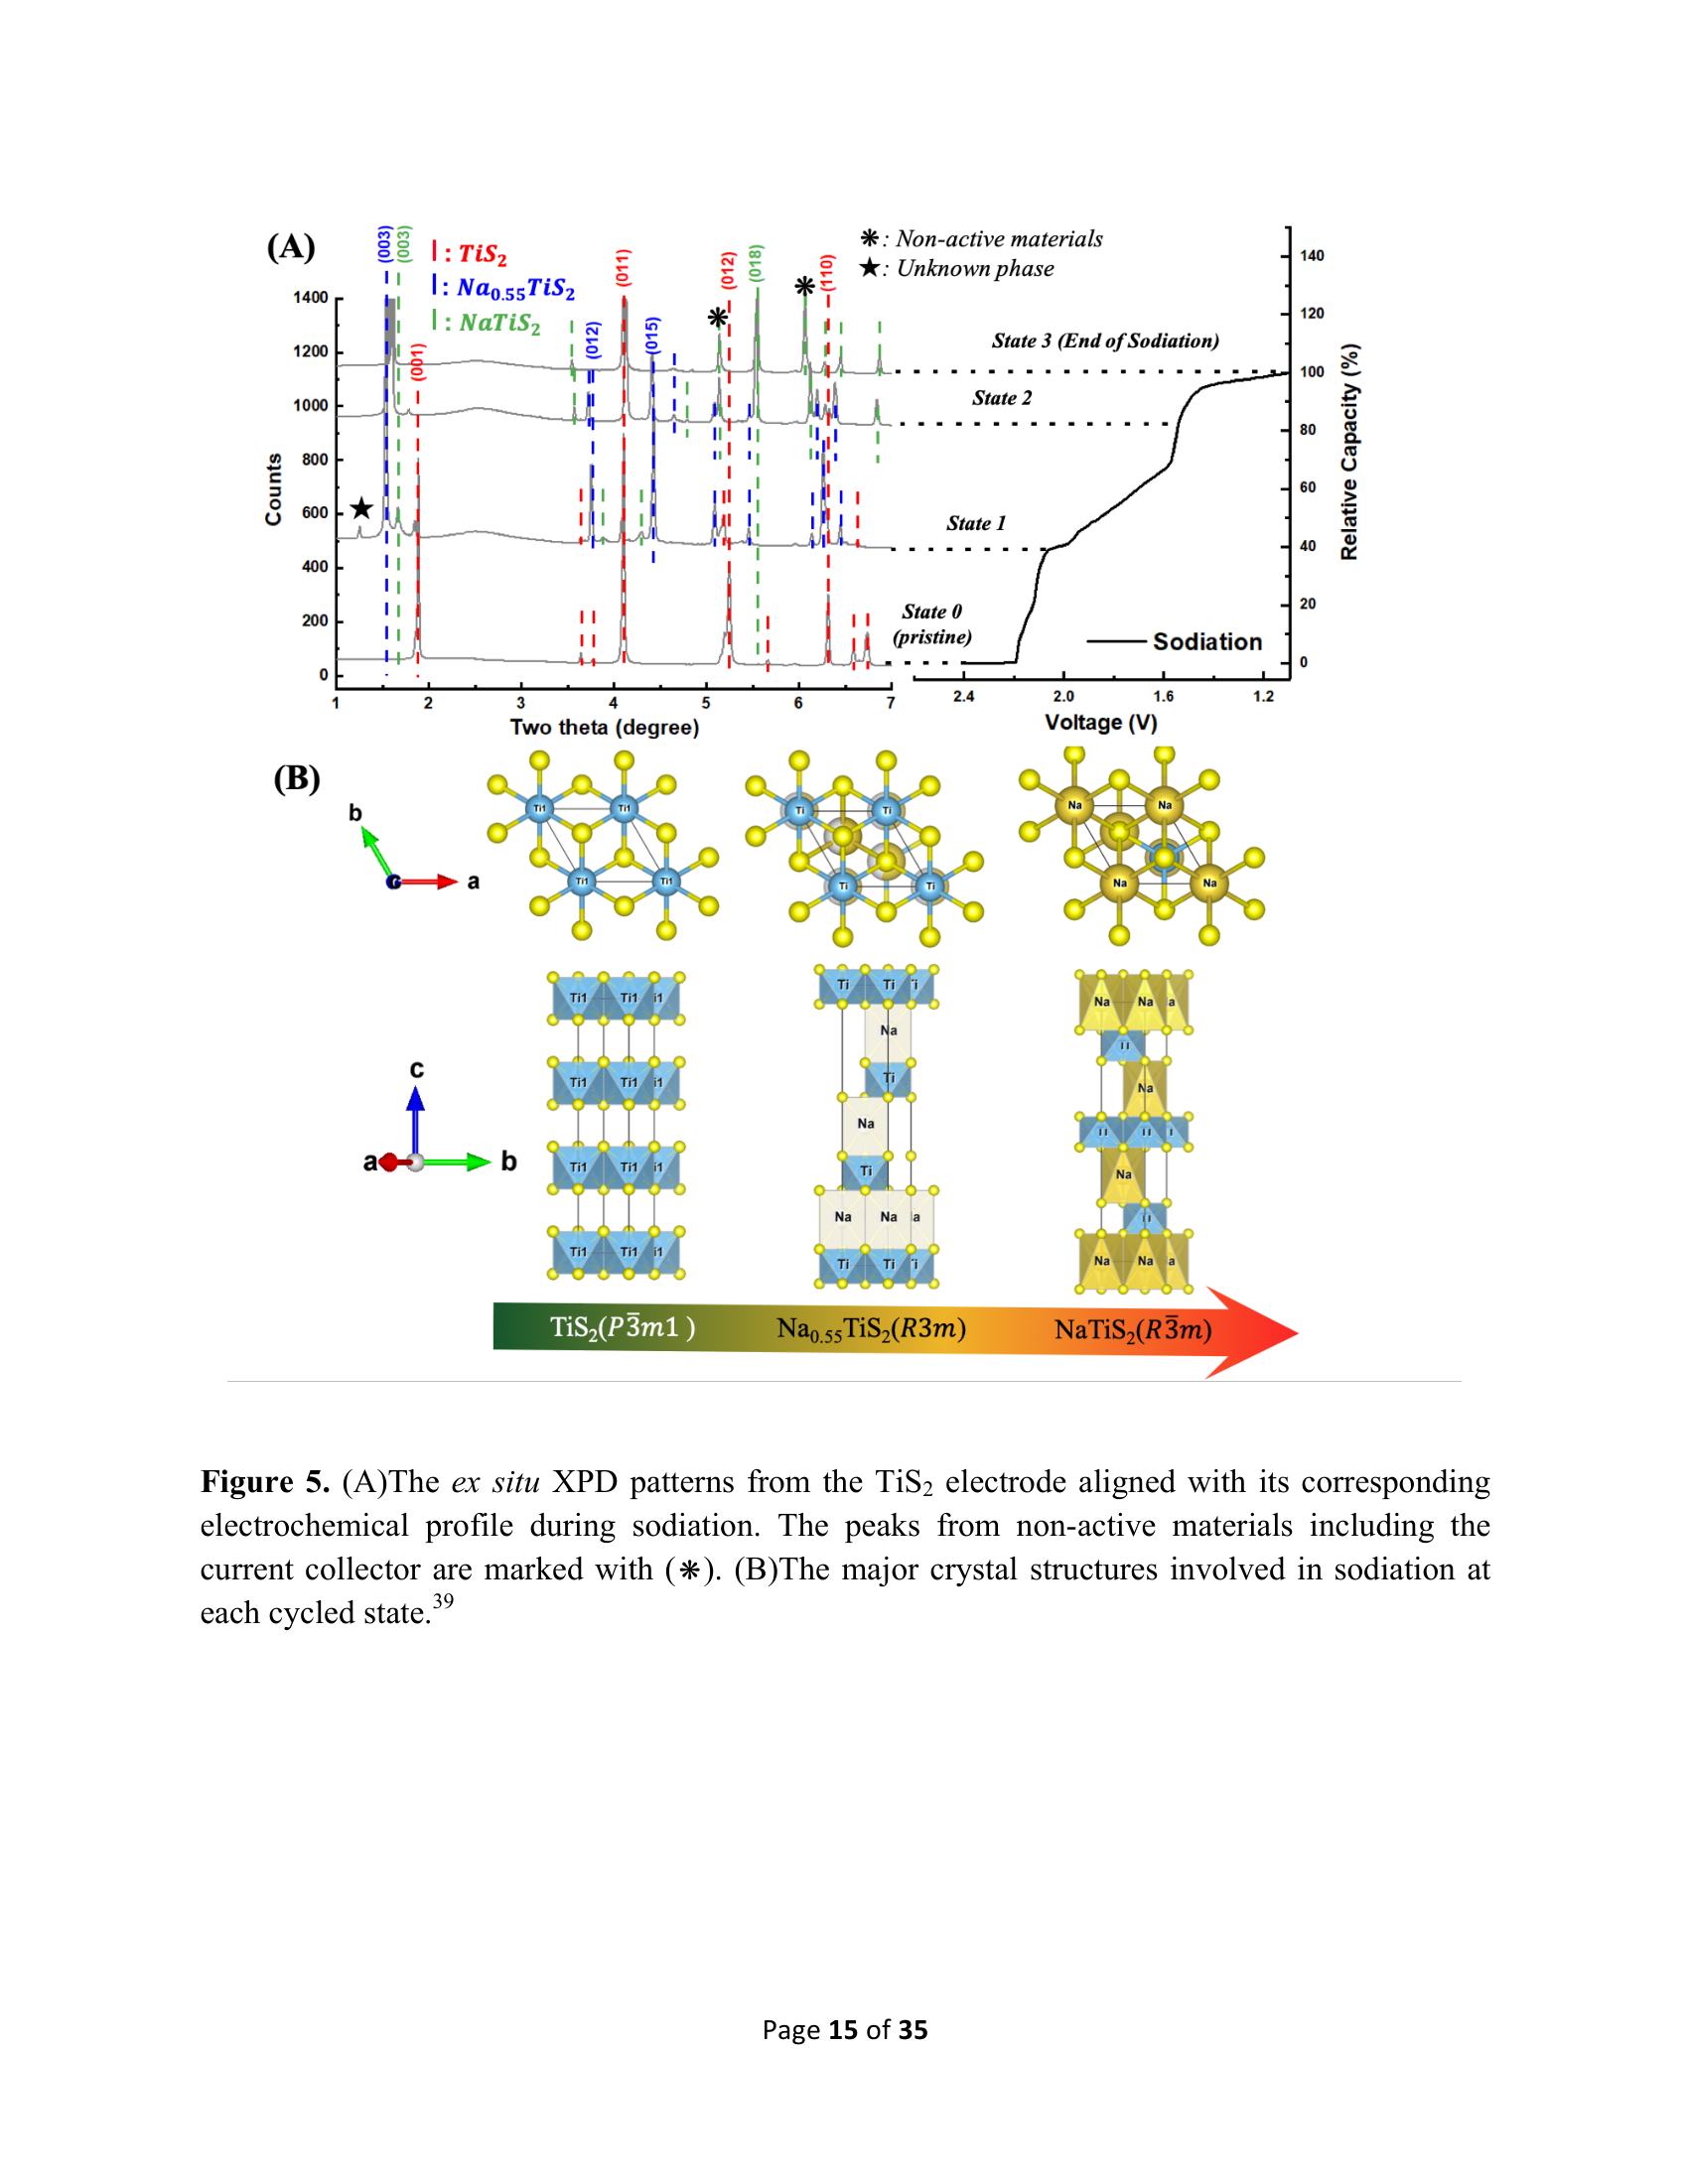
Table S2 (PDF page 36)
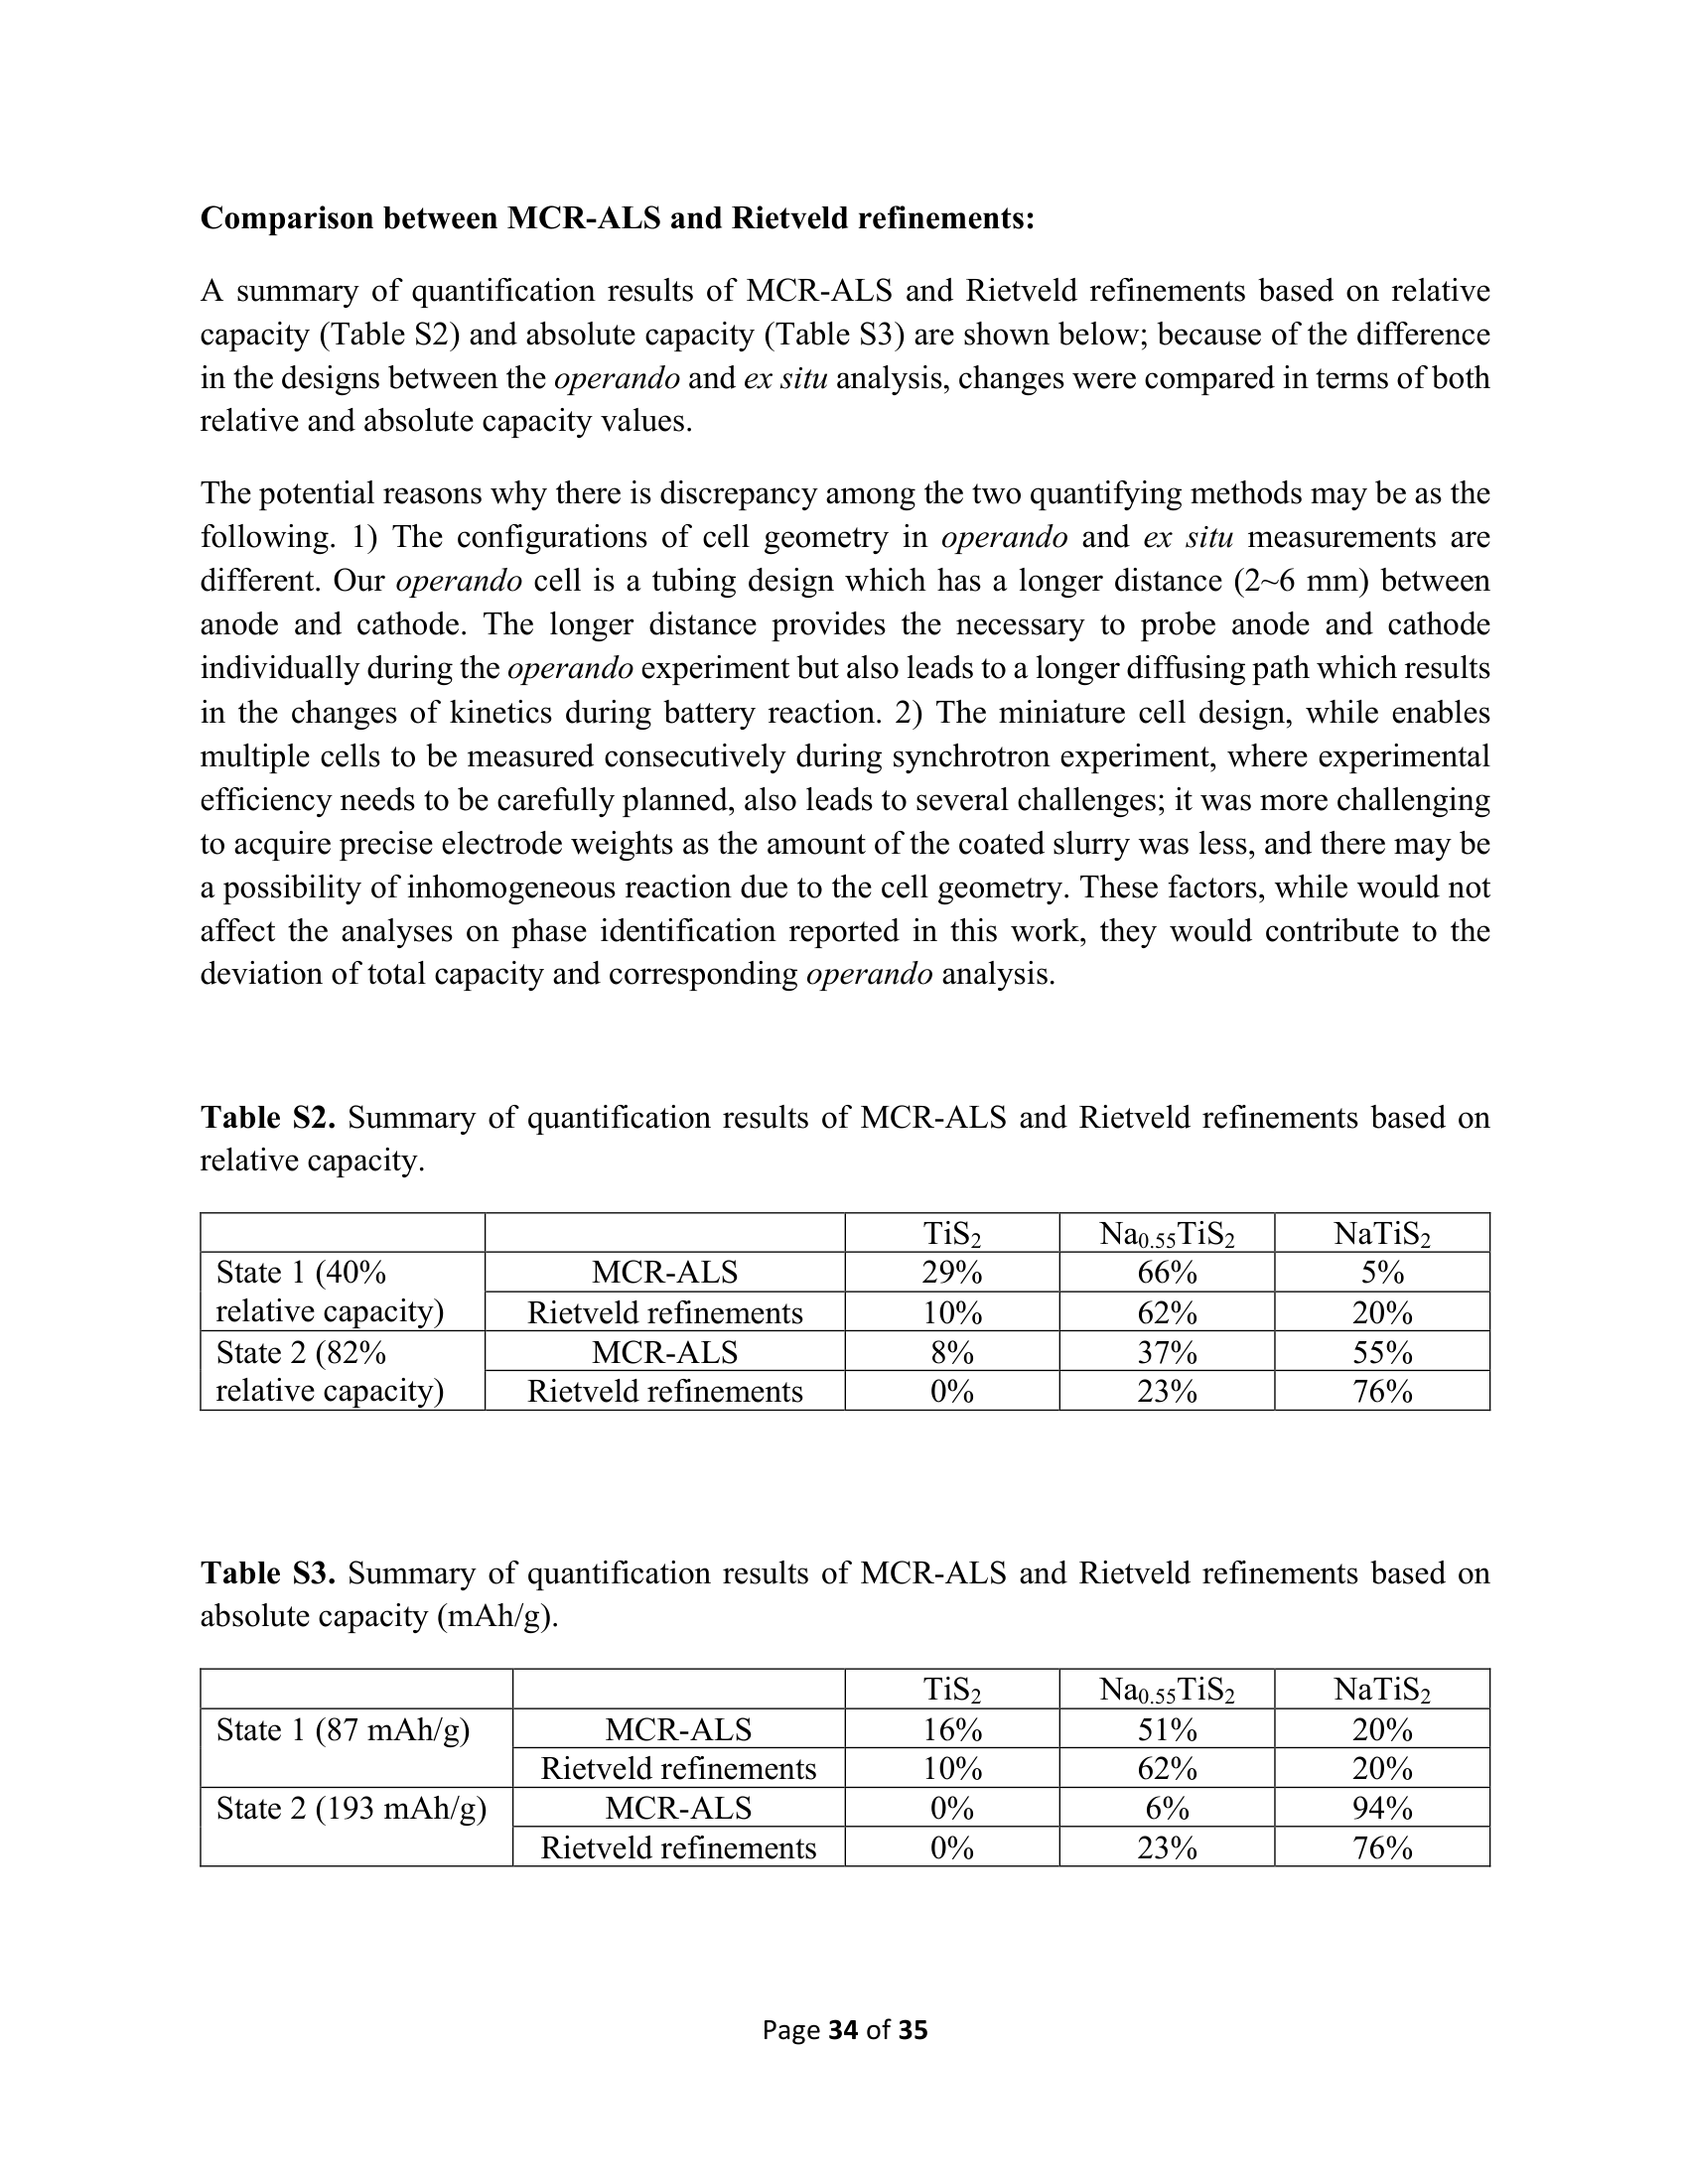
Page 11 (PDF page 11)
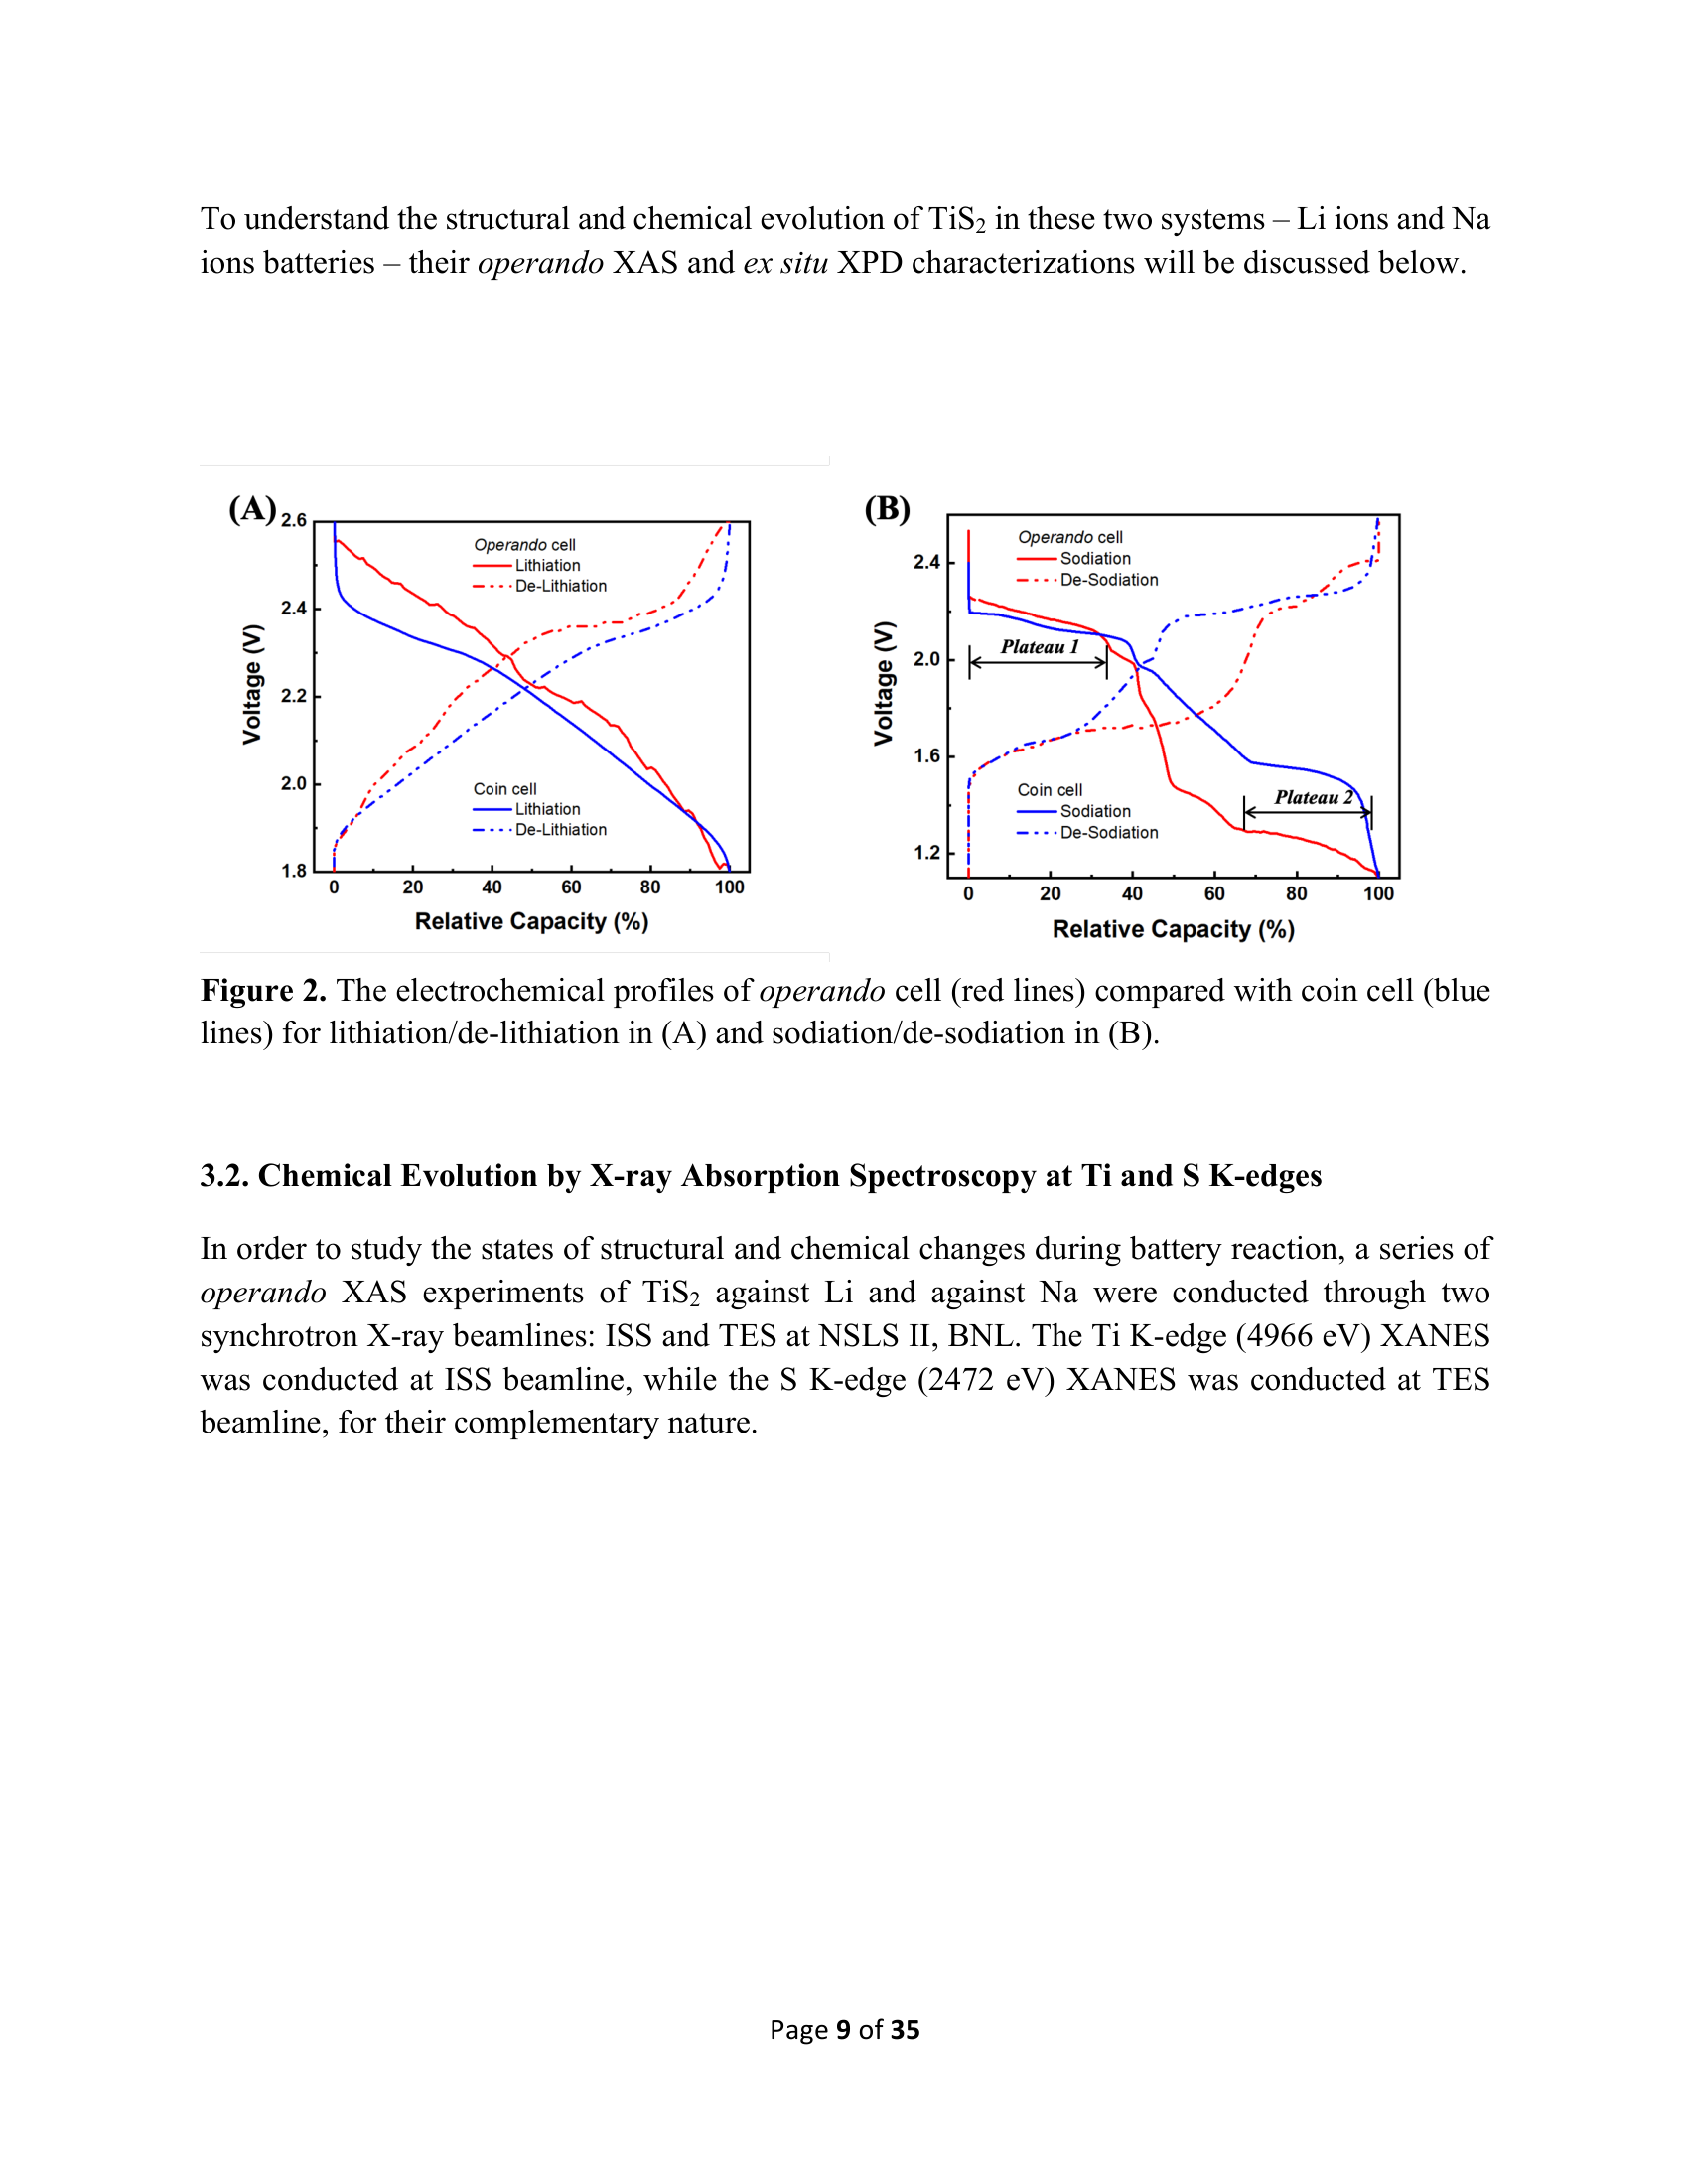
Page 16 (PDF page 16)
Page 34 (PDF page 34)
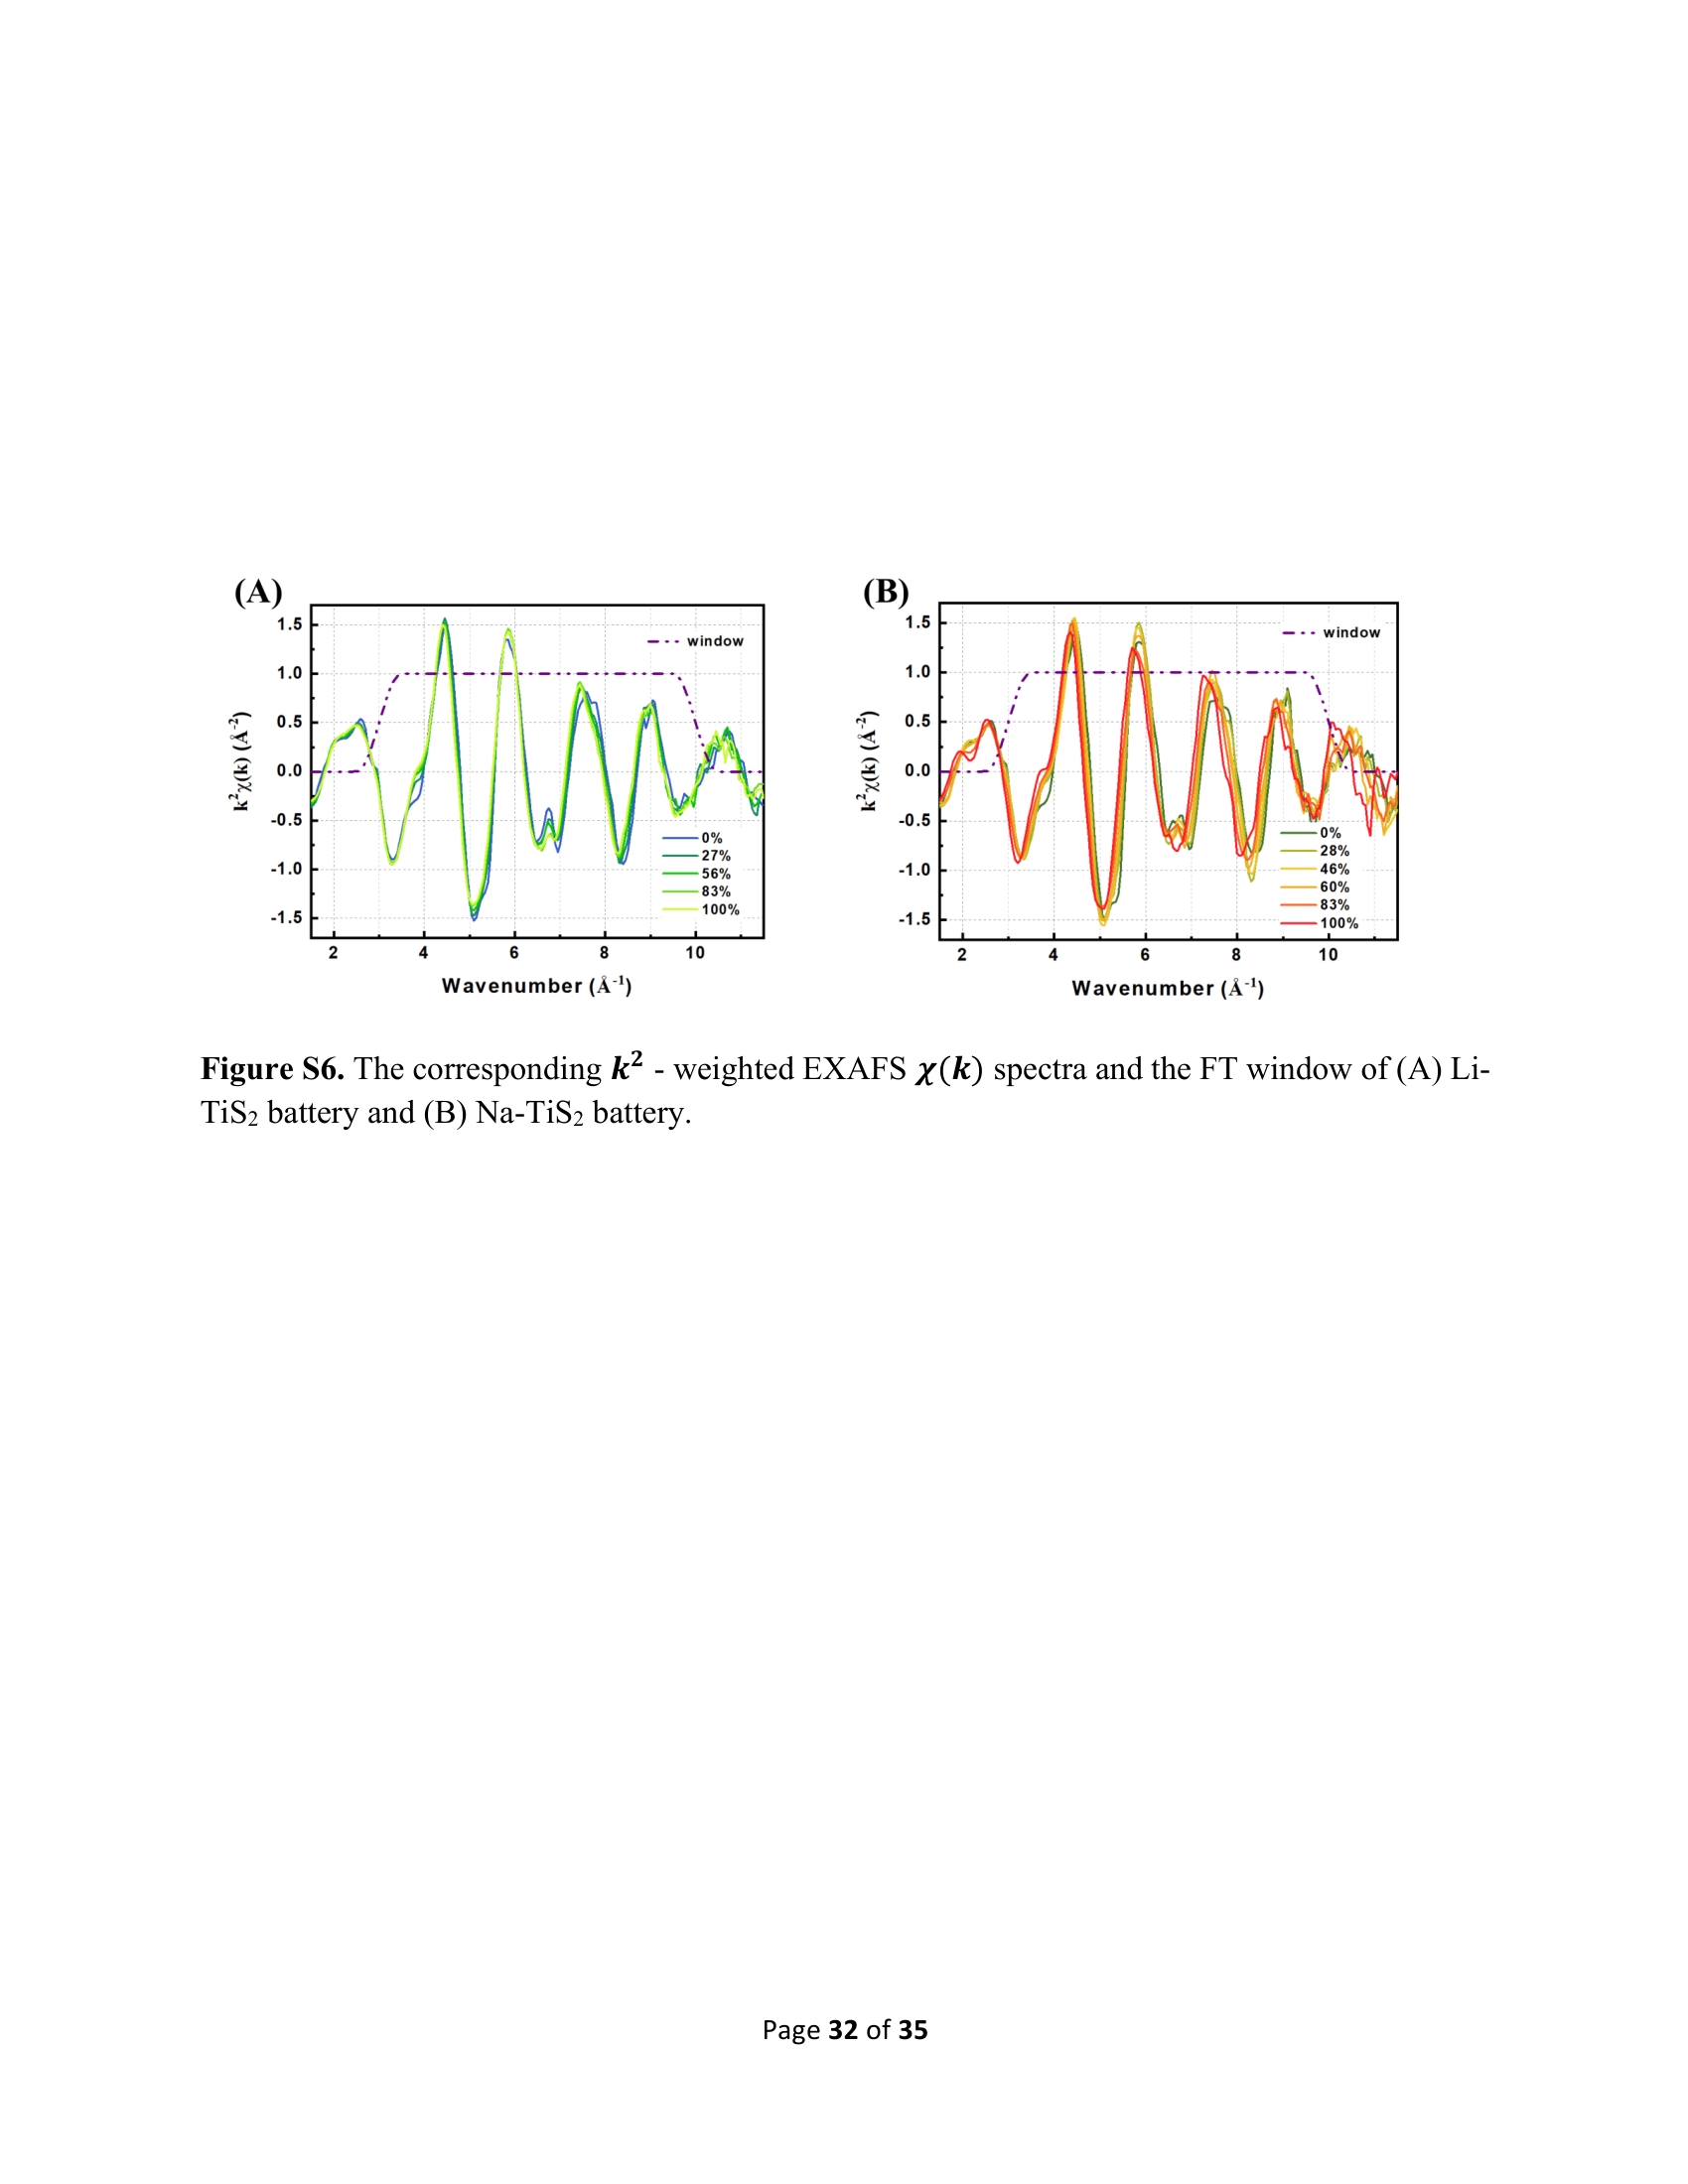
#32
TiS2
Ti K
▶
LLM Prompt
Sample Information
Material: TiS2
Electrode Type: cathode
Electrolyte: 1.0 M NaClO4
Cell Type: operando tube cell
Charge Discharge: discharging
C Rate: C/12
State Of Charge: 40% relative capacity
Cycle Number: 1
Capacity Mah G: 87
Sample-Specific Conditions
- state_of_charge: 40%
- Partially sodiated TiS2 at 40% relative capacity
Measurement
We plan to measure the Ti K XANES spectrum of this sample.
Questions
Based on all the information above:
1. Identify the structural phases that act as the pure components (basis spectra) required to deconvolute the XANES spectrum of this partially sodiated TiS2 sample.
2. Estimate the relative phase fractions of the pristine, intermediate, and fully sodiated components at 40% relative capacity during the sodiation of TiS2.
3. Explain the physical reasoning for the presence of this specific multi-phase mixture at 40% capacity, and contrast this reaction mechanism with the lithiation of TiS2.
Ground Truth
Material: TiS2
Measurement: Ti K-edge operando XANES at ISS beamline (8-ID), NSLS-II
Fit method: MCR-ALS (Multivariate Curve Resolution - Alternating Least Squares)
Phase fractions:
| Phase | Fraction |
|---|---|
| TiS2 | 0.29 |
| Na0.55TiS2 | 0.66 |
| NaTiS2 | 0.05 |
Fit basis (paper's reference spectra):
- TiS2 (pristine)
- Na0.55TiS2 (intermediate)
- NaTiS2 (fully sodiated)
Source evidence: Table S2 (Supplementary Information, page 34) and Figure 4D
Key reasoning: Sodiation of TiS2 involves a complex three-component conversion process due to the large ionic radius of Na+, which causes structural changes including an a-b plane offset and c-axis variations. At 40% relative capacity, the system has largely transitioned from the pristine TiS2 phase to an intermediate Na0.55TiS2 phase, which is the dominant component. A small fraction of the fully sodiated NaTiS2 phase has also begun to form. This contrasts with lithiation, which is a simple two-component solid-solution intercalation process.
Reasoning source: Section 3.2, Section 4 (Conclusion), and Supplementary Information (Comparison between MCR-ALS and Rietveld refinements)
Scoring Rubric (total: 100 pts)
| Q | Type | Max | Question | Reference Answer | Scoring Criteria |
|---|---|---|---|---|---|
| q1 | identification | 25 | Identify the structural phases that act as the pure components (basis spectra) required to deconvolute the XANES spectrum of this partially sodiated TiS2 sample. | The pure components required to deconvolute the XANES spectrum of this sample are pristine TiS2, an intermediate Na0.55TiS2 phase, and fully sodiated NaTiS2. These specific phases are expected because the discharging of the TiS2 cathode in a Na-ion cell involves a complex three-component conversion process. This multi-phase mechanism occurs because the large ionic radius of the intercalating Na+ ions causes significant structural changes, including an a-b plane offset and c-axis variations. At the specific sample condition of 40% relative capacity, the material is partially sodiated, meaning it is actively transitioning between these three distinct structural states. | Full points for identifying all three components: pristine TiS2, the intermediate Na0.55TiS2, and the fully sodiated NaTiS2. |
| q2 | quantification | 35 | Estimate the relative phase fractions of the pristine, intermediate, and fully sodiated components at 40% relative capacity during the sodiation of TiS2. | At 40% relative capacity, the estimated phase fractions are 0.29 for pristine TiS2, 0.66 for the intermediate Na0.55TiS2, and 0.05 for fully sodiated NaTiS2. These specific values result from the sample being in the early-to-middle stages of its first discharge cycle. Because the sodiation of TiS2 proceeds via a complex three-component conversion process driven by the large Na+ ionic radius, the system at 40% capacity has largely transitioned away from the pristine state. Consequently, the intermediate Na0.55TiS2 phase has become the dominant component, while a small fraction of the fully sodiated NaTiS2 phase has just begun to form. | Full points if the estimated fractions are within ±15% of the ground truth values (TiS2 ~29%, Na0.55TiS2 ~66%, NaTiS2 ~5%). Partial credit for correctly identifying Na0.55TiS2 as the dominant phase. |
| q3 | reasoning | 40 | Explain the physical reasoning for the presence of this specific multi-phase mixture at 40% capacity, and contrast this reaction mechanism with the lithiation of TiS2. | The presence of a three-phase mixture at 40% relative capacity during the first discharge cycle is driven by the large ionic radius of the intercalating Na+ ions from the electrolyte. As Na+ inserts into the TiS2 cathode, it induces significant structural changes, including an a-b plane offset and c-axis variations, forcing a complex three-component conversion process. At exactly 40% capacity, the reaction has progressed enough that the intermediate Na0.55TiS2 phase dominates, while residual pristine TiS2 remains and the fully sodiated NaTiS2 phase is just beginning to nucleate. This complex multi-phase conversion mechanism strongly contrasts with the lithiation of TiS2, which proceeds via a simple two-component solid-solution intercalation process. | Full points for explaining that the larger Na+ ion radius drives a complex three-component conversion process (involving structural offsets/rearrangements) with a distinct intermediate phase, whereas lithiation is a simpler two-component intercalation process without intermediate phase formation. |
Review
#33
TiS2
Ti K
▶
LLM Prompt
Sample Information
Material: TiS2
Electrode Type: cathode
Electrolyte: 1.0 M NaClO4
Cell Type: operando tube cell
Charge Discharge: discharging
C Rate: C/12
State Of Charge: 82% relative capacity
Cycle Number: 1
Capacity Mah G: 193
Sample-Specific Conditions
- state_of_charge: 82%
- Partially sodiated TiS2 at 82% relative capacity
Measurement
We plan to measure the Ti K XANES spectrum of this sample.
Questions
Based on all the information above:
1. What candidate reference spectra or pure components are required to accurately model the Ti K-edge XANES spectrum of this partially sodiated TiS2 sample at 82% relative capacity?
2. Estimate the relative phase fractions of the components present in the TiS2 cathode at 82% relative capacity during sodiation, based on XANES analysis.
3. Explain the electrochemical and structural reasoning for the specific phase composition observed at 82% relative capacity during the sodiation of TiS2.
Ground Truth
Material: TiS2
Measurement: Ti K-edge XANES, operando fluorescence mode, ISS beamline (8-ID) at NSLS-II
Fit method: MCR-ALS (Multivariate Curve Resolution - Alternating Least Squares)
Phase fractions:
| Phase | Fraction |
|---|---|
| TiS2 | 0.08 |
| Na0.55TiS2 | 0.37 |
| NaTiS2 | 0.55 |
Fit basis (paper's reference spectra):
- Pristine TiS2 (1st component)
- Fully sodiated NaTiS2 (2nd component)
- Intermediate Na0.55TiS2 (3rd component)
Source evidence: Table S2, Figure 4(D), and Supplementary Information text
Key reasoning: During sodiation, TiS2 undergoes a three-component conversion reaction rather than a simple two-component intercalation. At 82% relative capacity (State 2), the pristine TiS2 phase is nearly depleted. The intermediate phase, Na0.55TiS2, which reached its maximum concentration around 50% capacity, is actively converting into the final product. Consequently, the fully sodiated phase, NaTiS2, becomes the dominant component in the mixture.
Reasoning source: Section 3.2, Section 3.3, and Figure 4(D)
Scoring Rubric (total: 100 pts)
| Q | Type | Max | Question | Reference Answer | Scoring Criteria |
|---|---|---|---|---|---|
| q1 | identification | 25 | What candidate reference spectra or pure components are required to accurately model the Ti K-edge XANES spectrum of this partially sodiated TiS2 sample at 82% relative capacity? | To accurately model the Ti K-edge XANES spectrum of this sample, three pure components are required: pristine TiS2, an intermediate Na0.55TiS2 phase, and fully sodiated NaTiS2. These specific phases are expected because, during the first discharge cycle at C/12 in a 1.0 M NaClO4 electrolyte, the sodiation of the TiS2 cathode proceeds via a three-component conversion reaction rather than a simple two-component intercalation. At the deep discharge state of 82% relative capacity (193 mAh/g), the material is actively transitioning between the intermediate state and the final sodiated state. Therefore, the spectrum must be modeled using these three distinct structural components to capture the nearly depleted pristine phase, the converting intermediate phase, and the dominant fully sodiated product. | Full credit for identifying all three necessary components: pristine TiS2, the fully sodiated NaTiS2, and the intermediate phase Na0.55TiS2. |
| q2 | quantification | 35 | Estimate the relative phase fractions of the components present in the TiS2 cathode at 82% relative capacity during sodiation, based on XANES analysis. | Based on MCR-ALS fitting of the Ti K-edge XANES spectrum, the relative phase fractions are 8% pristine TiS2, 37% intermediate Na0.55TiS2, and 55% fully sodiated NaTiS2. These specific values result from the sample being deeply discharged to 82% relative capacity (193 mAh/g) during its first cycle. At this advanced stage of the three-component conversion reaction, the pristine TiS2 is nearly depleted, leaving only 8%. The intermediate Na0.55TiS2 phase, which peaked earlier around 50% capacity, is actively converting into the final product, reducing its fraction to 37%. Consequently, the fully sodiated NaTiS2 phase has accumulated to become the dominant component at 55%. | Full credit if the estimated fractions are within the uncertainty bounds of the ground truth (TiS2 ~8%, Na0.55TiS2 ~37%, NaTiS2 ~55%). Partial credit for correctly identifying NaTiS2 as the majority phase and Na0.55TiS2 as the secondary phase. |
| q3 | reasoning | 40 | Explain the electrochemical and structural reasoning for the specific phase composition observed at 82% relative capacity during the sodiation of TiS2. | The specific phase composition observed at 82% relative capacity arises because the first-cycle discharging of the TiS2 cathode in a Na-ion cell (1.0 M NaClO4) follows a three-component conversion reaction mechanism rather than a simple two-component intercalation. As sodiation progresses at a C/12 rate, the pristine TiS2 phase continuously converts into an intermediate Na0.55TiS2 phase, which subsequently converts into the fully sodiated NaTiS2 phase. By the time the cell reaches 82% relative capacity (193 mAh/g), the initial pristine TiS2 is almost entirely consumed, leaving only an 8% fraction. The intermediate Na0.55TiS2 phase, having already passed its maximum concentration at approximately 50% capacity, is actively being consumed (37% remaining) to form the final product. As a direct result of this sequential conversion mechanism at this deep state of charge, the fully sodiated NaTiS2 phase accumulates to become the dominant structural component (55%). | Full credit for explaining that sodiation is a three-component conversion process, that the intermediate phase (Na0.55TiS2) has passed its peak concentration, and that the system is transitioning toward the fully sodiated end-product (NaTiS2), leaving very little pristine TiS2. |
Review
#34
TiS2
Ti K
▶
LLM Prompt
Sample Information
Material: TiS2
Electrode Type: cathode
Electrolyte: 1.0 M NaClO4
Cell Type: operando tube cell
Charge Discharge: discharged
C Rate: C/12
Voltage V: 1.1
State Of Charge: 100% relative capacity
Cycle Number: 1
Sample-Specific Conditions
- state_of_charge: 100%
- Fully sodiated TiS2 at 100% relative capacity
Measurement
We plan to measure the Ti K XANES spectrum of this sample.
Questions
Based on all the information above:
1. Based on the electrochemical conditions (100% relative capacity, discharged to 1.1 V), what is the expected dominant compound, and what structural/chemical mechanism explains its formation from the pristine material?
2. Describe the expected changes to the Ti K-edge pre-edge peak intensity upon reaching this fully sodiated state compared to pristine TiS2. What electronic transition gives rise to this peak, and why does its intensity change according to the paper?
3. How does the main Ti K-edge position of this fully sodiated sample compare to pristine TiS2, and what does this indicate about the Ti oxidation state?
Ground Truth
Measurement: Ti K-edge operando XANES in fluorescence mode at ISS (8-ID) beamline, NSLS-II
Source evidence: Figure 3C, 3D (spectra); Figure 4B, 4D (MCR-ALS); Figure 5, Table S2 (Rietveld); Page 11 (pre-edge discussion)
Key reasoning: At 100% relative capacity (1.1 V), the sodiation reaction is complete, resulting in the fully sodiated NaTiS2 phase. The insertion of Na ions reduces the Ti ions, causing the main absorption edge to shift to lower energy. Additionally, the inserted Na ions symmetrize the distorted octahedral environment of the Ti atoms, which suppresses the intensity of the pre-edge peak.
Reasoning source: Section 3.2 (Chemical Evolution by X-ray Absorption Spectroscopy at Ti and S K-edges), Page 11; Section 3.3 (Phase Identification and Refinement), Page 16
Scoring Rubric (total: 100 pts)
| Q | Type | Max | Question | Reference Answer | Scoring Criteria |
|---|---|---|---|---|---|
| q1 | reasoning | 30 | Based on the electrochemical conditions (100% relative capacity, discharged to 1.1 V), what is the expected dominant compound, and what structural/chemical mechanism explains its formation from the pristine material? | Based on the electrochemical conditions of being fully discharged to 1.1 V at 100% relative capacity, the expected dominant compound is NaTiS2. This occurs because the sodiation reaction of the pristine TiS2 cathode is complete at this state of charge. The insertion of Na ions into the host structure fully reduces the material, driving the structural and chemical transition from pristine TiS2 to the fully sodiated NaTiS2 phase. | Full credit for identifying NaTiS2 as the dominant compound and explaining that full sodiation reduces Ti ions and symmetrizes the distorted octahedral environment. |
| q2 | spectral | 40 | Describe the expected changes to the Ti K-edge pre-edge peak intensity upon reaching this fully sodiated state compared to pristine TiS2. What electronic transition gives rise to this peak, and why does its intensity change according to the paper? | Upon reaching the fully sodiated state, the Ti K-edge pre-edge peak intensity is significantly decreased or suppressed compared to pristine TiS2. This pre-edge peak originates from electronic transitions from the Ti-1s orbital to the Ti-3d/S-3p hybrid orbital in a partially distorted octahedral structure. Under the sample conditions of 100% relative capacity (1.1 V), the complete insertion of Na ions symmetrizes the distorted octahedral environment of the Ti atoms. This structural symmetrization driven by full sodiation is the direct cause of the suppressed pre-edge peak intensity. | Full credit for stating the pre-edge peak is suppressed/less prominent, identifying the transition as Ti-1s to Ti-3d/S-3p hybrid orbital, and explaining the suppression is due to the symmetrization of the distorted octahedral environment of Ti atoms upon Na insertion. |
| q3 | spectral | 30 | How does the main Ti K-edge position of this fully sodiated sample compare to pristine TiS2, and what does this indicate about the Ti oxidation state? | The main Ti K-edge position of this fully sodiated sample shifts to a lower energy (~4973 eV) compared to pristine TiS2. This shift indicates that the Ti ions have been reduced, reaching an oxidation state of ~2.0. This occurs because, at the sample conditions of being fully discharged to 1.1 V (100% relative capacity), the complete insertion of Na ions into the cathode structure donates electrons to the host lattice. This chemical reduction of Ti driven by full sodiation directly causes the main absorption edge to shift to lower energy. | Full credit for stating the main edge shifts to lower energy, which indicates that the Ti ions are reduced (lower oxidation state) compared to pristine TiS2. |
Review
A high-resolution XAS study of aqueous Cu(II) in liquid and frozen solutions: Pyramidal, polymorphic, and non-centrosymmetric
Original-17
Pure Phase
Patrick Frank et al.
DOI: 10.1063/1.4908266
1 scenario
PDF
▶
Key Paper Evidence1, 8, I, p.9, p.84310▶
Figure 1 (PDF page 4)
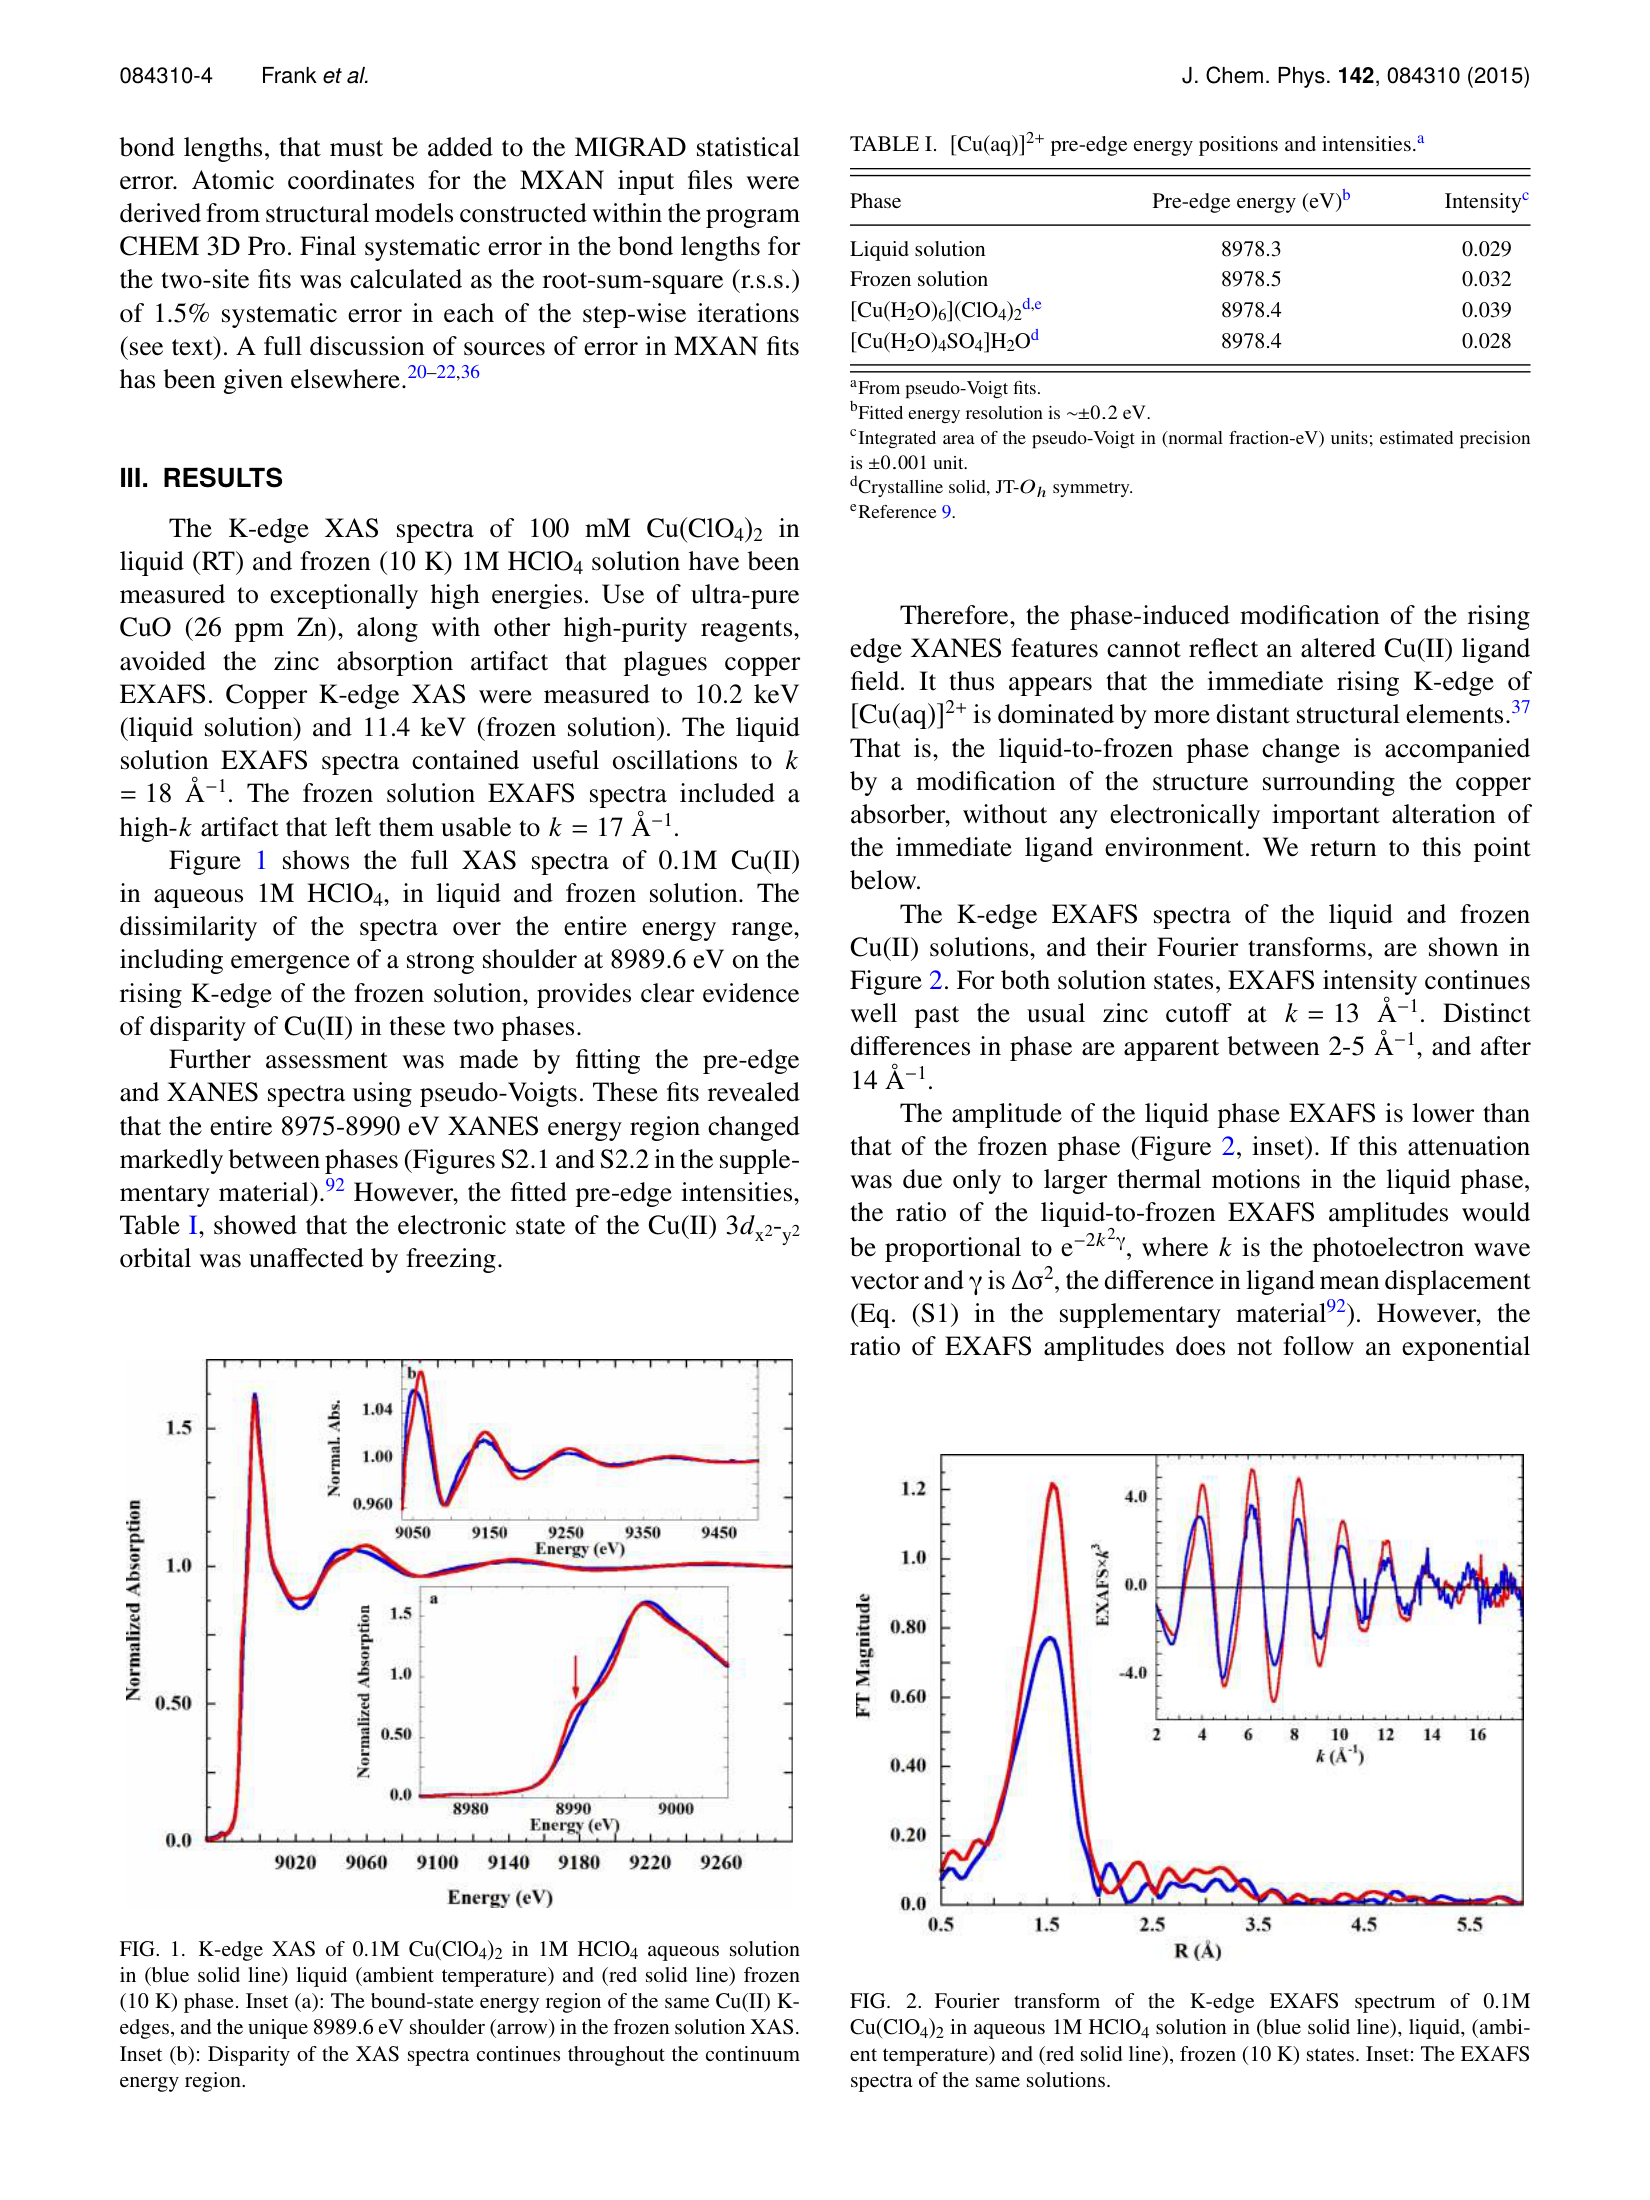
Figure 8 (PDF page 9)
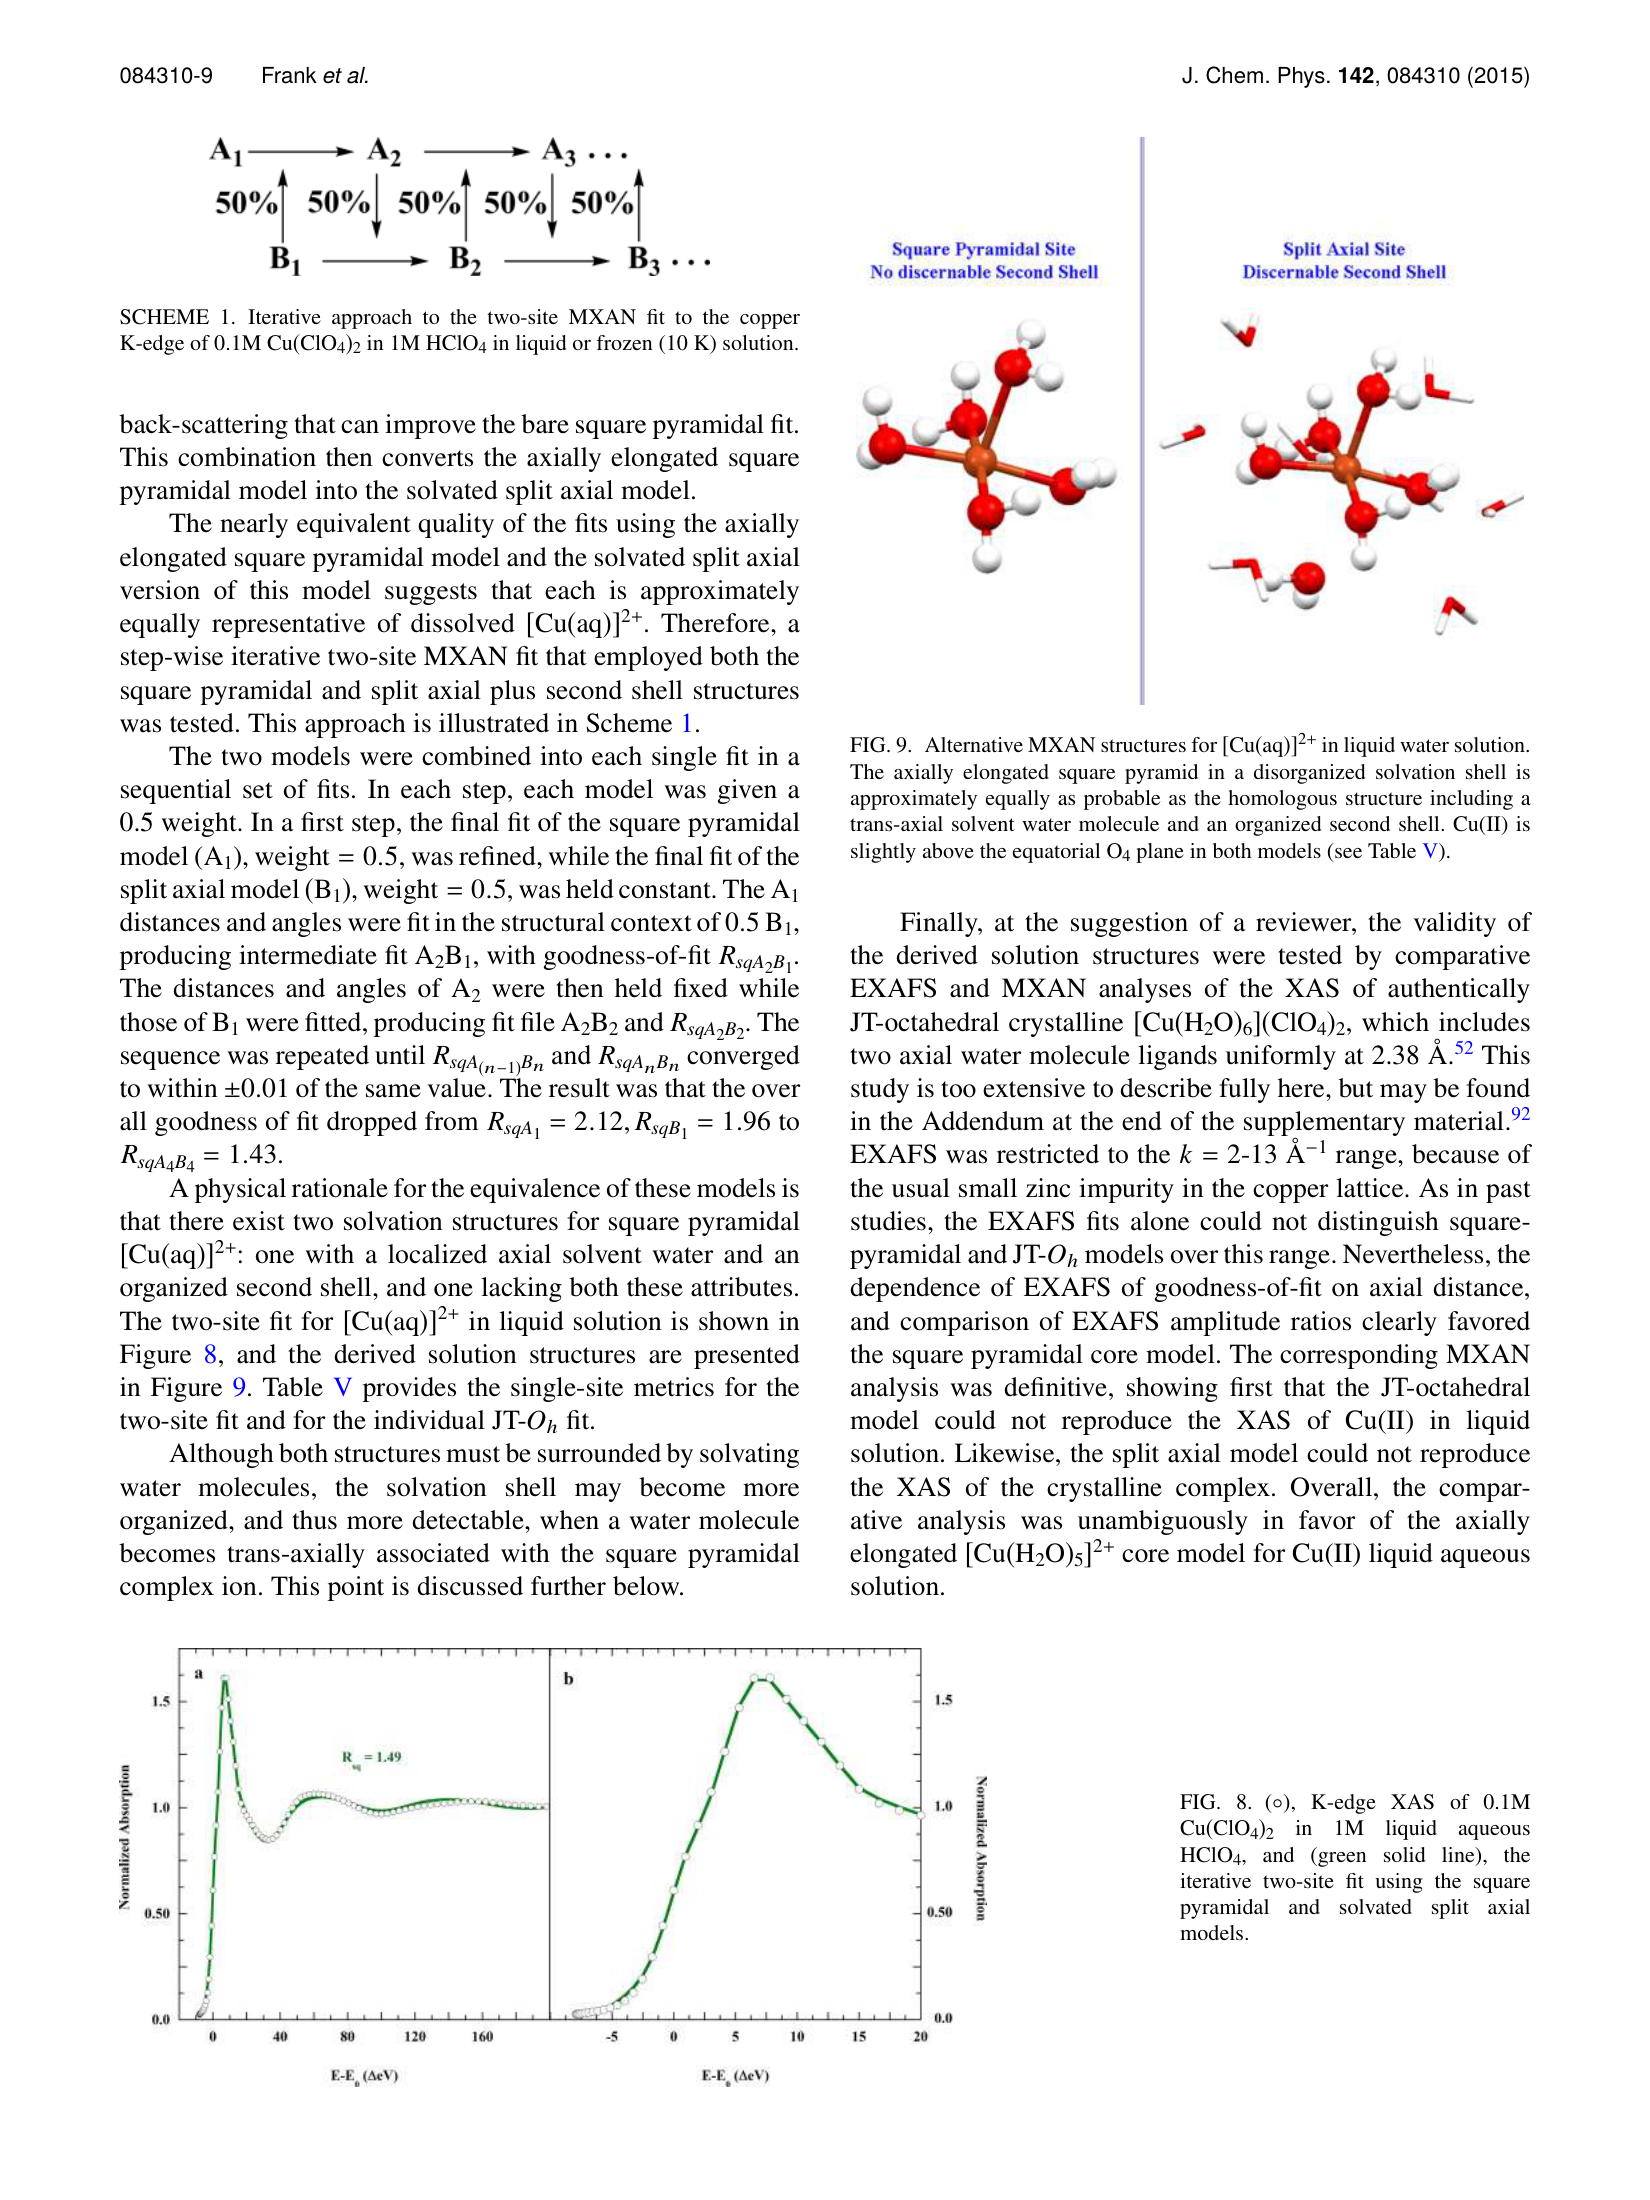
#35
[Cu(H2O)5]2+
Cu K
▶
LLM Prompt
Sample Information
Material: [Cu(H2O)5]2+
Crystal Structure: axially elongated square pyramidal
Oxidation State: 2+
Sample Form: solution
- Cu(II) in liquid aqueous solution
Measurement
We plan to measure the Cu K XANES spectrum of this sample.
Questions
Based on all the information above:
1. Based on the XANES analysis, what is the dominant coordination geometry of Cu(II) in liquid aqueous solution, and why is the traditional Jahn-Teller octahedral model rejected?
2. What are the key distinguishing spectral features of liquid aqueous Cu(II) compared to its frozen state, and what structural difference does this reflect?
3. Describe the pre-edge feature for this sample, including its energy position, intensity, and electronic origin.
4. The liquid phase is described by a two-site model. What are the two specific structural variations of the square pyramidal complex present, and in what approximate fractions do they exist?
Ground Truth
Compound: [Cu(H2O)5]2+
Oxidation state: 2+
Measurement: Cu K-edge XAS, transmission mode, SSRL beamline 7-3
Edge position: 8990.00
Spectral shape: The spectrum exhibits a pre-edge feature at 8978.3 eV and a rising K-edge that lacks the distinct 8989.6 eV shoulder observed in frozen solutions. The continuum region shows structured multiple scattering features.
Labeled peaks:
| Label | Energy (eV) | Intensity | Origin | Source |
|---|---|---|---|---|
| pre-edge | 8978.3 | 0.029 | 1s -> 3d transition | paper_data |
Distinguishing features: Absence of the strong 8989.6 eV rising K-edge shoulder, which is present in the frozen solution. The energy difference between the rising edge shoulder and absorption maximum is ~5 eV in liquid vs ~6 eV in frozen, implying less axial distortion in the liquid phase.
Key reasoning: The liquid phase XAS is best reproduced by a two-site MXAN fit combining an axially elongated square pyramidal model and a solvated split axial model (square pyramidal with a 2.9 Å trans-axial water and organized second shell) in a 50:50 ratio. The traditional JT-octahedral model could not reproduce the XAS of Cu(II) in liquid solution. The lack of a strong 8989.6 eV shoulder on the rising edge distinguishes the liquid phase from the frozen phase, indicating less axial distortion.
Reasoning source: Section III.D.1 (Liquid-phase [Cu(aq)]2+) and Section IV (Discussion)
Scoring Rubric (total: 100 pts)
| Q | Type | Max | Question | Reference Answer | Scoring Criteria |
|---|---|---|---|---|---|
| q1 | reasoning | 30 | Based on the XANES analysis, what is the dominant coordination geometry of Cu(II) in liquid aqueous solution, and why is the traditional Jahn-Teller octahedral model rejected? | The dominant coordination geometry of Cu(II) in liquid aqueous solution is an axially elongated square pyramidal structure. The traditional Jahn-Teller (JT) octahedral model is rejected because it could not reproduce the experimental XAS data for the liquid phase. Specifically, the liquid sample conditions result in a spectrum lacking the strong 8989.6 eV shoulder on the rising edge that would be expected for a highly distorted JT-octahedral geometry. Instead, the spectral features indicate less axial distortion in the liquid state, which is best modeled by a combination of bare and solvated square pyramidal geometries. | Award full points for identifying the axially elongated square pyramidal geometry as dominant and stating that the JT-octahedral model could not reproduce the experimental XAS spectrum. |
| q2 | spectral | 30 | What are the key distinguishing spectral features of liquid aqueous Cu(II) compared to its frozen state, and what structural difference does this reflect? | The key distinguishing spectral feature of liquid aqueous Cu(II) is the absence of a strong rising K-edge shoulder at 8989.6 eV, which is prominently present in the frozen solution. Additionally, the energy difference between the rising edge shoulder and the absorption maximum is approximately 5 eV in the liquid phase compared to 6 eV in the frozen phase. These spectral differences arise because the liquid sample conditions allow for less axial distortion compared to the rigid frozen state. Consequently, the reduced axial distortion in the liquid aqueous environment directly leads to the suppression of the 8989.6 eV shoulder and the narrower energy gap. | Award full points for mentioning the absence of the strong 8989.6 eV rising K-edge shoulder in the liquid phase (or the ~5 eV vs ~6 eV energy difference to the absorption maximum) and linking this to less axial distortion/disorder in the liquid phase. |
| q3 | spectral | 20 | Describe the pre-edge feature for this sample, including its energy position, intensity, and electronic origin. | The pre-edge feature for the liquid aqueous [Cu(H2O)5]2+ sample is located at 8978.3 eV with an intensity of 0.029. This feature originates from a 1s to 3d electronic transition. This specific transition is observed because the Cu(II) ion in the liquid solution possesses a 2+ oxidation state with an open 3d shell. The axially elongated square pyramidal geometry of the complex in the liquid state dictates the local electronic structure, allowing this specific 1s to 3d transition to manifest at 8978.3 eV. | Award full points for identifying the energy (~8978.3 eV), intensity (~0.029), and origin (1s -> 3d transition). |
| q4 | quantification | 20 | The liquid phase is described by a two-site model. What are the two specific structural variations of the square pyramidal complex present, and in what approximate fractions do they exist? | The liquid phase is modeled by two structural variations: a bare axially elongated square pyramidal model and a solvated split axial model. The solvated split axial model consists of the square pyramidal structure with a 2.9 Å trans-axial solvent water molecule and an organized second shell. These two variations exist in an approximate 50:50 ratio (0.5 fraction each). This specific 50:50 distribution arises because the dynamic nature of the liquid aqueous solution allows the [Cu(H2O)5]2+ complex to exist in an equilibrium between a bare five-coordinate state and a state interacting with a trans-axial water from the bulk solvent. | Award full points for identifying the bare axially elongated square pyramidal model and the solvated split axial model (with a trans-axial water), and stating they exist in approximately a 50:50 ratio. |
Review
Deciphering phase evolution in complex metal oxide thin films via high-throughput materials synthesis and characterization
Original-17
Thin Film
Ruoshui Li et al.
DOI: 10.1088/1361-6528/acad09
5 scenarios
PDF
▶
Key Paper Evidence5b, S5, p.8, p.9, p.11, p.12▶
Figure 5b (PDF page 28)
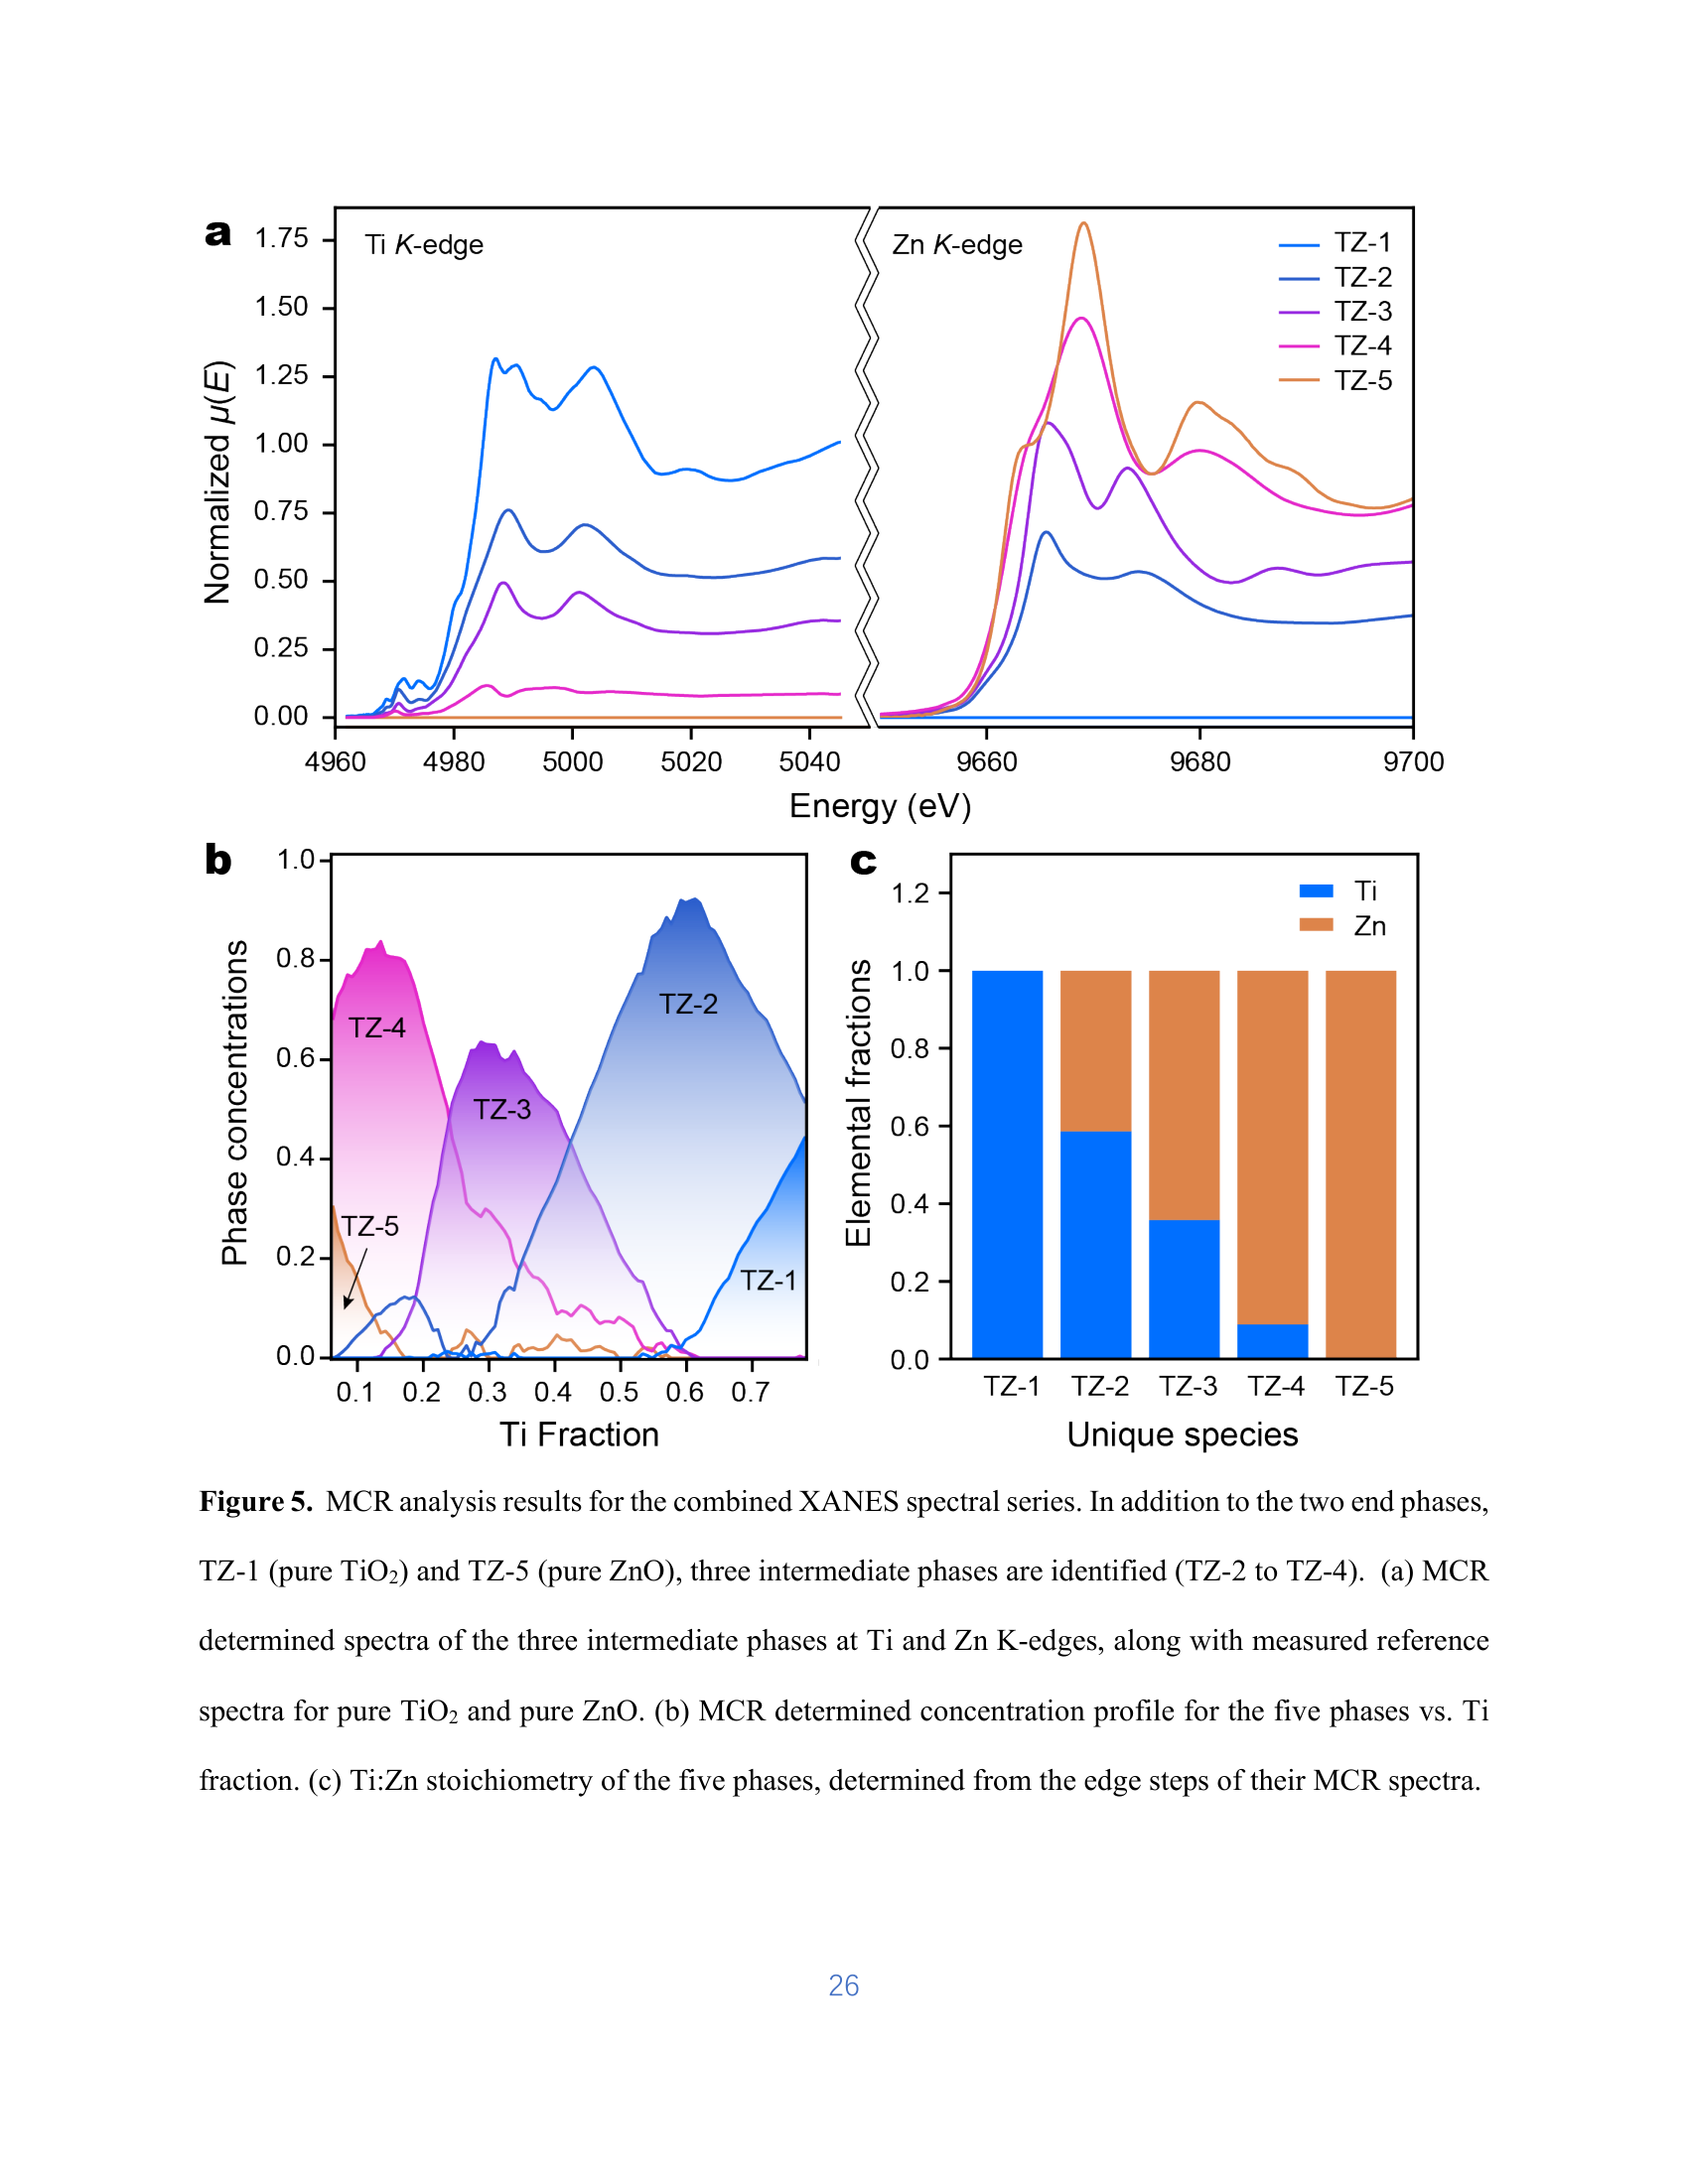
Figure S5 (PDF page 8)
Page 11 (PDF page 11)
Page 12 (PDF page 12)
Page 9 (PDF page 9)
#36
TiO2
Ti K
▶
LLM Prompt
Sample Information
Material: TiO2
Deposition Method: PLD
Substrate: fused silica
Deposition Temperature C: 600
Composition Variable: Ti fraction
Composition Value: 1.0
Sample-Specific Conditions
- Reference material: Pure TiO2
- Reference thin film of pure TiO2 deposited under identical conditions to the combinatorial film
Measurement
We plan to measure the Ti K XANES spectrum of this sample.
Questions
Based on all the information above:
1. Based on the deposition conditions (PLD at 600 °C on fused silica), what are the likely crystalline phases present in this pure TiO2 thin film, and what are their approximate fractions?
2. If you were to perform a Linear Combination Fitting (LCF) analysis on the Ti K-edge XANES spectrum of this sample, what specific reference spectra would be required to accurately model the data?
Ground Truth
Material: TiO2
Measurement: Ti K-edge XANES, fluorescence mode, ISS beamline at NSLS-II
Fit method: Linear regression
Phase fractions:
| Phase | Fraction |
|---|---|
| anatase | 0.52 |
| rutile | 0.48 |
Fit basis (paper's reference spectra):
- anatase TiO2
- rutile TiO2
Source evidence: Page 8 text, Figure S5
Key reasoning: The pure TiO2 reference film grown by PLD at 600 °C on fused silica exhibits a Ti K-edge XANES spectrum with a white line feature that is a hybrid between anatase and rutile TiO2. Linear regression analysis confirms it is a mixed-phase film containing roughly equal amounts of both polymorphs.
Reasoning source: Page 8, Results and Discussion
Scoring Rubric (total: 100 pts)
| Q | Type | Max | Question | Reference Answer | Scoring Criteria |
|---|---|---|---|---|---|
| q1 | quantification | 57 | Based on the deposition conditions (PLD at 600 °C on fused silica), what are the likely crystalline phases present in this pure TiO2 thin film, and what are their approximate fractions? | The pure TiO2 thin film consists of a mixed-phase structure containing approximately 52% anatase TiO2 and 48% rutile TiO2. When deposited via PLD at 600 °C on a fused silica substrate with a Ti fraction of 1.0, the material does not form a single pure polymorph. Instead, these specific thermal and substrate conditions produce a film that exhibits a Ti K-edge XANES white line feature that is a hybrid between anatase and rutile. Linear regression analysis confirms that these deposition conditions result in a mixed-phase film containing roughly equal amounts of both crystalline polymorphs. | Award 20 points for identifying both anatase and rutile as the constituent phases. Award another 20 points for estimating roughly equal fractions (e.g., ~52% anatase and ~48% rutile). |
| q2 | identification | 43 | If you were to perform a Linear Combination Fitting (LCF) analysis on the Ti K-edge XANES spectrum of this sample, what specific reference spectra would be required to accurately model the data? | To accurately model the Ti K-edge XANES spectrum using linear regression, you would need reference spectra for anatase TiO2 and rutile TiO2. The requirement for these specific references arises because the pure TiO2 film grown by PLD at 600 °C on fused silica produces a hybrid white line feature indicative of a mixed-phase material. Under these exact deposition conditions, the film crystallizes into roughly equal amounts of both polymorphs, specifically 52% anatase and 48% rutile. Therefore, a fit basis comprising both anatase and rutile is necessary to fully capture the structural properties of the film. | Award 30 points for explicitly stating that reference spectra for both anatase TiO2 and rutile TiO2 are needed. |
Review
#37
ZnO
Zn K
▶
LLM Prompt
Sample Information
Material: ZnO
Deposition Method: PLD
Substrate: fused silica
Deposition Temperature C: 600
Composition Variable: Ti fraction
Composition Value: 0.0
Sample-Specific Conditions
- Reference material: Pure ZnO
- Reference thin film of pure ZnO deposited under identical conditions to the combinatorial film
Measurement
We plan to measure the Zn K XANES spectrum of this sample.
Questions
Based on all the information above:
1. Describe the expected spectral shape of the Zn K-edge XANES for this sample and how it relates to known standards.
2. Why does the XANES spectrum of this PLD-grown pure ZnO film exhibit characteristics of a specific incident polarization, and what does this imply about the film's microstructure?
Ground Truth
Material: ZnO
Measurement: Zn K-edge, fluorescence mode, ISS beamline at NSLS-II
Source evidence: Page 8, Results and Discussion
Key reasoning: The pure ZnO reference film was deposited under identical conditions to the combinatorial film. Its XANES spectrum matches crystalline wurtzite ZnO with polarization normal to the c-axis, confirming its phase and preferred orientation, which is also consistent with XRD results.
Reasoning source: Page 8, Results and Discussion
Scoring Rubric (total: 100 pts)
| Q | Type | Max | Question | Reference Answer | Scoring Criteria |
|---|---|---|---|---|---|
| q2 | spectral | 50 | Describe the expected spectral shape of the Zn K-edge XANES for this sample and how it relates to known standards. | The expected spectral shape of the Zn K-edge XANES for this sample is identical to the known standard spectrum of crystalline wurtzite ZnO measured with incident polarization normal to the hexagonal c-axis. This specific spectral profile arises because the sample is a pure ZnO reference film (Ti fraction = 0.0) deposited via PLD at 600 °C on a fused silica substrate. Under these specific deposition conditions, the material crystallizes into the wurtzite phase and develops a preferred out-of-plane orientation along the c-axis. Consequently, the structural alignment of the film relative to the incident X-ray beam produces distinct polarization-dependent features that perfectly match the wurtzite ZnO standard. | Award 30 points for stating the spectrum is identical to crystalline wurtzite ZnO with incident polarization normal to the hexagonal c-axis. |
| q3 | reasoning | 50 | Why does the XANES spectrum of this PLD-grown pure ZnO film exhibit characteristics of a specific incident polarization, and what does this imply about the film's microstructure? | The XANES spectrum exhibits characteristics of incident polarization normal to the hexagonal c-axis because the film possesses a highly oriented microstructure. Specifically, depositing pure ZnO (Ti fraction = 0.0) via PLD at 600 °C on fused silica promotes the formation of crystalline wurtzite ZnO with a preferred out-of-plane orientation along the c-axis. Because XANES is sensitive to local structural symmetry and bond directionality, the uniform alignment of the c-axis in the film relative to the X-ray beam results in this strong polarization dependence. Ultimately, this implies that the film's microstructure is highly textured rather than randomly oriented, a conclusion that is also supported by XRD results for films grown under these identical conditions. | Award 15 points for explaining that the spectrum matches a specific polarization (normal to c-axis) because the film is not randomly oriented (e.g., not a powder). Award 15 points for concluding this implies a preferred out-of-plane orientation along the c-axis during film growth. |
Review
#38
Ti-Zn-O
Ti, Zn K
▶
LLM Prompt
Sample Information
Material: Ti-Zn-O
Deposition Method: PLD
Substrate: fused silica
Deposition Temperature C: 600
Film Thickness Nm: 100
Composition Variable: Ti fraction
Composition Value: 0.15
Sample-Specific Conditions
- Composition: fTi = 0.15
- Position on the combinatorial wafer where the MCR component TZ-4 reaches its maximum concentration
Measurement
We plan to measure the Ti, Zn K XANES spectrum of this sample.
Questions
Based on all the information above:
1. What candidate reference spectra or structural motifs should be included in a spectral deconvolution model for a Ti-Zn-O film at a Ti fraction of 0.15?
2. Estimate the phase fractions of the structural motifs present in this combinatorial film at fTi = 0.15.
3. Explain physically why the sample at fTi = 0.15 is a heterogeneous mixture rather than pure wurtzite ZnO or a single solid solution.
Ground Truth
Material: Ti-Zn-O
Measurement: Ti and Zn K-edge XANES, fluorescence mode, ISS beamline at NSLS-II
Fit method: MCR-ALS (Multivariate Curve Resolution with Alternating Least Squares)
Phase fractions:
| Phase | Fraction |
|---|---|
| TZ-4 | 0.8 |
| TZ-5 (pure ZnO) | 0.1 |
| TZ-3 | 0.1 |
Fit basis (paper's reference spectra):
- TZ-1 (pure TiO2)
- TZ-2
- TZ-3
- TZ-4
- TZ-5 (pure ZnO)
Source evidence: Figure 5b
Key reasoning: At a Ti fraction of 0.15, the composition exceeds the solubility limit of Ti in the wurtzite ZnO lattice (pure ZnO disappears around fTi > 0.08). The dominant phase is TZ-4, representing a Ti-doped ZnO defect motif where Ti dopants occupy sites with coordination numbers less than 6, while nearby Zn2+ ions have coordination numbers greater than 4. Because the combinatorial film growth does not reach thermodynamic equilibrium, the sample forms a heterogeneous mixture rather than a single solid solution. Alongside the dominant TZ-4 motif, minor fractions of TZ-5 (pure ZnO) persist, and TZ-3 (an inverse spinel TiZn2O4-like motif) begins to emerge as the Ti concentration increases toward the TZ-3 stoichiometry.
Reasoning source: Results and Discussion, pages 11-12, and Figure 5b
Scoring Rubric (total: 101 pts)
| Q | Type | Max | Question | Reference Answer | Scoring Criteria |
|---|---|---|---|---|---|
| q1 | identification | 25 | What candidate reference spectra or structural motifs should be included in a spectral deconvolution model for a Ti-Zn-O film at a Ti fraction of 0.15? | The spectral deconvolution model for this sample should include the structural motifs TZ-4, TZ-5 (pure ZnO), and TZ-3. These specific phases are expected because the sample's Ti fraction of 0.15 exceeds the solubility limit of Ti in the wurtzite ZnO lattice, which typically disappears around fTi > 0.08. Furthermore, because the combinatorial pulsed laser deposition (PLD) at 600 °C does not reach thermodynamic equilibrium, the film forms a heterogeneous mixture where TZ-4 (a Ti-doped ZnO defect motif) dominates, while minor amounts of TZ-5 persist and TZ-3 (an inverse spinel TiZn2O4-like motif) begins to emerge. | Full credit for identifying the dominant Ti-doped ZnO defect motif (TZ-4) along with minor contributions from pure ZnO (TZ-5) and an inverse spinel TiZn2O4-like motif (TZ-3). |
| q2 | quantification | 38 | Estimate the phase fractions of the structural motifs present in this combinatorial film at fTi = 0.15. | The estimated phase fractions for this combinatorial film are 0.8 for TZ-4, 0.1 for TZ-5 (pure ZnO), and 0.1 for TZ-3. These specific values arise because the Ti fraction of 0.15 exceeds the wurtzite ZnO solubility limit, making the Ti-doped ZnO defect motif (TZ-4) the dominant phase at 80%. The remaining 20% is split between persisting pure ZnO (TZ-5) and the emerging inverse spinel TiZn2O4-like motif (TZ-3) because the PLD growth at 600 °C fails to reach thermodynamic equilibrium, trapping these minor phases in a heterogeneous mixture rather than forming a single solid solution. | Full credit for estimating ~80% for the Ti-doped ZnO motif (TZ-4), and ~10% each for pure ZnO (TZ-5) and the TiZn2O4-like motif (TZ-3). Partial credit if the dominant phase is correctly identified with reasonable minor phase estimates. |
| q3 | reasoning | 38 | Explain physically why the sample at fTi = 0.15 is a heterogeneous mixture rather than pure wurtzite ZnO or a single solid solution. | The sample forms a heterogeneous mixture rather than pure wurtzite ZnO because the Ti fraction of 0.15 exceeds the solubility limit of Ti in the wurtzite lattice, which disappears around fTi > 0.08. Additionally, it does not form a single solid solution because the combinatorial pulsed laser deposition (PLD) process at 600 °C prevents the film from reaching thermodynamic equilibrium. As a result of these non-equilibrium conditions and high Ti content, the system separates into a dominant TZ-4 defect motif—where Ti occupies sites with coordination less than 6 and nearby Zn2+ has coordination greater than 4—alongside minor persisting TZ-5 (pure ZnO) and emerging TZ-3 (inverse spinel) phases. | Full credit for explaining that the composition exceeds the solubility limit of Ti in wurtzite ZnO (which vanishes around fTi > 0.08) and that the PLD growth conditions do not allow the material to reach thermodynamic equilibrium, resulting in a mixture of coexisting motifs. |
Review
#39
Ti-Zn-O
Ti, Zn K
▶
LLM Prompt
Sample Information
Material: Ti-Zn-O
Deposition Method: PLD
Substrate: fused silica
Deposition Temperature C: 600
Film Thickness Nm: 100
Composition Variable: Ti fraction
Composition Value: 0.33
Sample-Specific Conditions
- Composition: fTi = 0.33
- Position on the combinatorial wafer where the MCR component TZ-3 reaches its maximum concentration
Measurement
We plan to measure the Ti, Zn K XANES spectrum of this sample.
Questions
Based on all the information above:
1. What candidate reference spectra or structural motifs are needed to model the XANES spectra of this combinatorial film at fTi = 0.33?
2. Estimate the relative phase fractions of the structural motifs present in the film at this specific composition (fTi = 0.33).
3. Why does this sample exhibit a mixture of three distinct structural motifs rather than forming a single pure phase or a standard two-phase equilibrium mixture?
Ground Truth
Material: Ti-Zn-O
Measurement: Ti and Zn K-edge XANES, fluorescence mode, ISS beamline at NSLS-II
Fit method: MCR-ALS (Multivariate Curve Resolution with Alternating Least Squares)
Phase fractions:
| Phase | Fraction |
|---|---|
| TZ-3 | 0.6 |
| TZ-4 | 0.25 |
| TZ-2 | 0.15 |
Fit basis (paper's reference spectra):
- TZ-1 (pure TiO2)
- TZ-2
- TZ-3
- TZ-4
- TZ-5 (pure ZnO)
Source evidence: Figure 5b and Results and Discussion text
Key reasoning: At an average composition of fTi = 0.33, the material is dominated by the TZ-3 phase, which has a stoichiometry (fTi = 0.36) and local atomic motifs similar to inverse spinel TiZn2O4 (where Ti4+ ions exclusively occupy octahedral sites and Zn2+ ions are evenly split between octahedral and tetrahedral sites). However, because the combinatorial film grown under these PLD conditions has not completely reached thermodynamic equilibrium, it departs from the phase law. Consequently, rather than forming a single pure phase or a standard two-phase mixture, the dominant TZ-3 phase coexists with minor fractions of TZ-4 (Ti-doped ZnO motif) and TZ-2 (Ti3Zn2O8-like motif).
Reasoning source: Results and Discussion (pages 8-11)
Scoring Rubric (total: 100 pts)
| Q | Type | Max | Question | Reference Answer | Scoring Criteria |
|---|---|---|---|---|---|
| q1 | identification | 27 | What candidate reference spectra or structural motifs are needed to model the XANES spectra of this combinatorial film at fTi = 0.33? | To model the XANES spectra of this combinatorial film at fTi = 0.33, three MCR-ALS components are required: TZ-3, TZ-4, and TZ-2. At this specific composition, the sample is dominated by the TZ-3 motif, which resembles an inverse spinel TiZn2O4 structure where Ti4+ occupies octahedral sites and Zn2+ occupies both octahedral and tetrahedral sites. However, because the 100 nm Ti-Zn-O film deposited via PLD at 600 °C has not reached full thermodynamic equilibrium, it deviates from standard phase laws, requiring the inclusion of minor TZ-4 (Ti-doped ZnO) and TZ-2 (Ti3Zn2O8-like) reference motifs to account for the coexisting phases. | Full credit for identifying the three coexisting motifs: TZ-3 (TiZn2O4-like), TZ-4 (Ti-doped ZnO-like), and TZ-2 (Ti3Zn2O8-like). Partial credit if only the dominant phase is identified. |
| q2 | quantification | 40 | Estimate the relative phase fractions of the structural motifs present in the film at this specific composition (fTi = 0.33). | The relative phase fractions for this sample are 0.60 for TZ-3, 0.25 for TZ-4, and 0.15 for TZ-2. The TZ-3 fraction reaches a maximum of 60% because the sample's composition (fTi = 0.33) closely matches the stoichiometry of the inverse spinel TiZn2O4 motif (fTi = 0.36). The remaining fractions result from the PLD deposition at 600 °C, which produces a combinatorial film that has not completely reached thermodynamic equilibrium; consequently, the material departs from the phase law and forms minor amounts of TZ-4 (Ti-doped ZnO) and TZ-2 (Ti3Zn2O8-like) motifs rather than a standard two-phase mixture. | Full credit for estimating ~60% TZ-3 (TiZn2O4-like), ~25% TZ-4 (Ti-doped ZnO), and ~15% TZ-2 (Ti3Zn2O8-like). Values within ±10% of these targets are acceptable. |
| q4 | reasoning | 33 | Why does this sample exhibit a mixture of three distinct structural motifs rather than forming a single pure phase or a standard two-phase equilibrium mixture? | This sample exhibits a mixture of three distinct structural motifs (TZ-3, TZ-4, and TZ-2) because the combinatorial Ti-Zn-O film has not completely reached thermodynamic equilibrium. Although the film was deposited via PLD at 600 °C, these specific growth conditions are insufficient to achieve a fully equilibrated state, causing the material to depart from the standard phase law. Consequently, while the composition of fTi = 0.33 strongly drives the formation of the dominant inverse spinel TiZn2O4 structure (TZ-3), the lack of equilibrium forces this phase to coexist with minor fractions of TZ-4 (Ti-doped ZnO) and TZ-2 (Ti3Zn2O8-like) motifs instead of resolving into a single pure phase or a standard two-phase mixture. | Full credit for explaining that the combinatorial thin film grown under these conditions has not completely reached thermodynamic equilibrium, leading to a departure from the phase law and the coexistence of multiple minor phases alongside the dominant one. |
Review
#40
Ti-Zn-O
Ti, Zn K
▶
LLM Prompt
Sample Information
Material: Ti-Zn-O
Deposition Method: PLD
Substrate: fused silica
Deposition Temperature C: 600
Film Thickness Nm: 100
Composition Variable: Ti fraction
Composition Value: 0.60
Sample-Specific Conditions
- Composition: fTi = 0.60
- Position on the combinatorial wafer where the MCR component TZ-2 reaches its maximum concentration
Measurement
We plan to measure the Ti, Zn K XANES spectrum of this sample.
Questions
Based on all the information above:
1. What candidate reference spectra or basis components are needed to model the XANES spectra of this combinatorial film across its composition range, and which ones are most relevant at fTi = 0.60?
2. Based on the sample conditions (fTi = 0.60), estimate the phase fractions of the dominant and minor components present in the film.
Ground Truth
Material: Ti-Zn-O
Measurement: Ti and Zn K-edge XANES, fluorescence mode, ISS beamline at NSLS-II
Fit method: MCR-ALS
Phase fractions:
| Phase | Fraction |
|---|---|
| TZ-2 | 0.9 |
| TZ-1 (pure TiO2) | 0.05 |
| TZ-3 | 0.05 |
Fit basis (paper's reference spectra):
- TZ-1 (pure TiO2)
- TZ-2
- TZ-3
- TZ-4
- TZ-5 (pure ZnO)
Source evidence: Figure 5b and Page 9-11
Key reasoning: At a Ti fraction of ~0.60, the composition closely matches the stoichiometry of Ti3Zn2O8 (fTi = 0.6). The MCR-ALS analysis resolves a distinct spectral component (TZ-2) that peaks at this concentration, characterized by Ti4+ ions occupying octahedral sites and Zn2+ ions predominantly occupying tetrahedral sites. Because the combinatorial film grown under these conditions has not completely reached thermodynamic equilibrium, it does not follow the strict phase law, resulting in minor amounts of adjacent phases (TZ-1 and TZ-3) coexisting with the dominant TZ-2 phase.
Reasoning source: Page 9 (Results and Discussion) and Figure 5b
Scoring Rubric (total: 100 pts)
| Q | Type | Max | Question | Reference Answer | Scoring Criteria |
|---|---|---|---|---|---|
| q1 | identification | 50 | What candidate reference spectra or basis components are needed to model the XANES spectra of this combinatorial film across its composition range, and which ones are most relevant at fTi = 0.60? | To model the XANES spectra of this combinatorial film across its entire composition range using MCR-ALS, the required basis components are TZ-1 (pure TiO2), TZ-2, TZ-3, TZ-4, and TZ-5 (pure ZnO). At the specific sample condition of fTi = 0.60, the most relevant components are TZ-2 as the dominant phase, alongside minor contributions from TZ-1 and TZ-3. This specific phase assemblage is expected because the composition (fTi = 0.60) closely matches the stoichiometry of Ti3Zn2O8, corresponding to the TZ-2 component where Ti4+ ions occupy octahedral sites and Zn2+ ions occupy tetrahedral sites. Additionally, because the 100 nm film was deposited via PLD at 600 °C, it has not completely reached thermodynamic equilibrium and does not follow the strict phase law, which explains why adjacent phases (TZ-1 and TZ-3) coexist with the dominant TZ-2 phase. | Full credit for identifying the 5 MCR components (pure TiO2, pure ZnO, and three intermediate phases including Ti3Zn2O8-like, TiZn2O4-like, and Ti-doped ZnO) and specifying that the Ti3Zn2O8-like component (TZ-2) is most relevant at fTi = 0.60. |
| q2 | quantification | 50 | Based on the sample conditions (fTi = 0.60), estimate the phase fractions of the dominant and minor components present in the film. | Based on the sample conditions, the estimated phase fractions are 0.90 for the dominant TZ-2 component, 0.05 for the minor TZ-1 (pure TiO2) component, and 0.05 for the minor TZ-3 component. These specific values arise because the sample's composition (fTi = 0.60) perfectly matches the stoichiometry of the Ti3Zn2O8 phase, allowing the TZ-2 component to reach its maximum concentration of 90%. The remaining 10% is distributed between the adjacent TZ-1 and TZ-3 components because the film, grown via PLD at 600 °C, has not reached full thermodynamic equilibrium. As a result of this non-equilibrium state, the system does not adhere to the strict phase law, leading to the minor coexistence of these adjacent phases rather than forming a single pure phase. | Full credit for estimating the dominant TZ-2 (Ti3Zn2O8-like) phase at ~90%, with minor contributions (~5% each) from TZ-1 (pure TiO2) and TZ-3 (TiZn2O4-like). |
Review
Identification of dopant site and its effect on electrochemical activity in Mn-doped lithium titanate
Original-17
Synthesis
Harishchandra Singh et al.
DOI: 10.1103/PhysRevMaterials.2.125403
1 scenario
PDF
▶
Key Paper Evidence4, p.10, p.12▶
Figure 4 (PDF page 12)
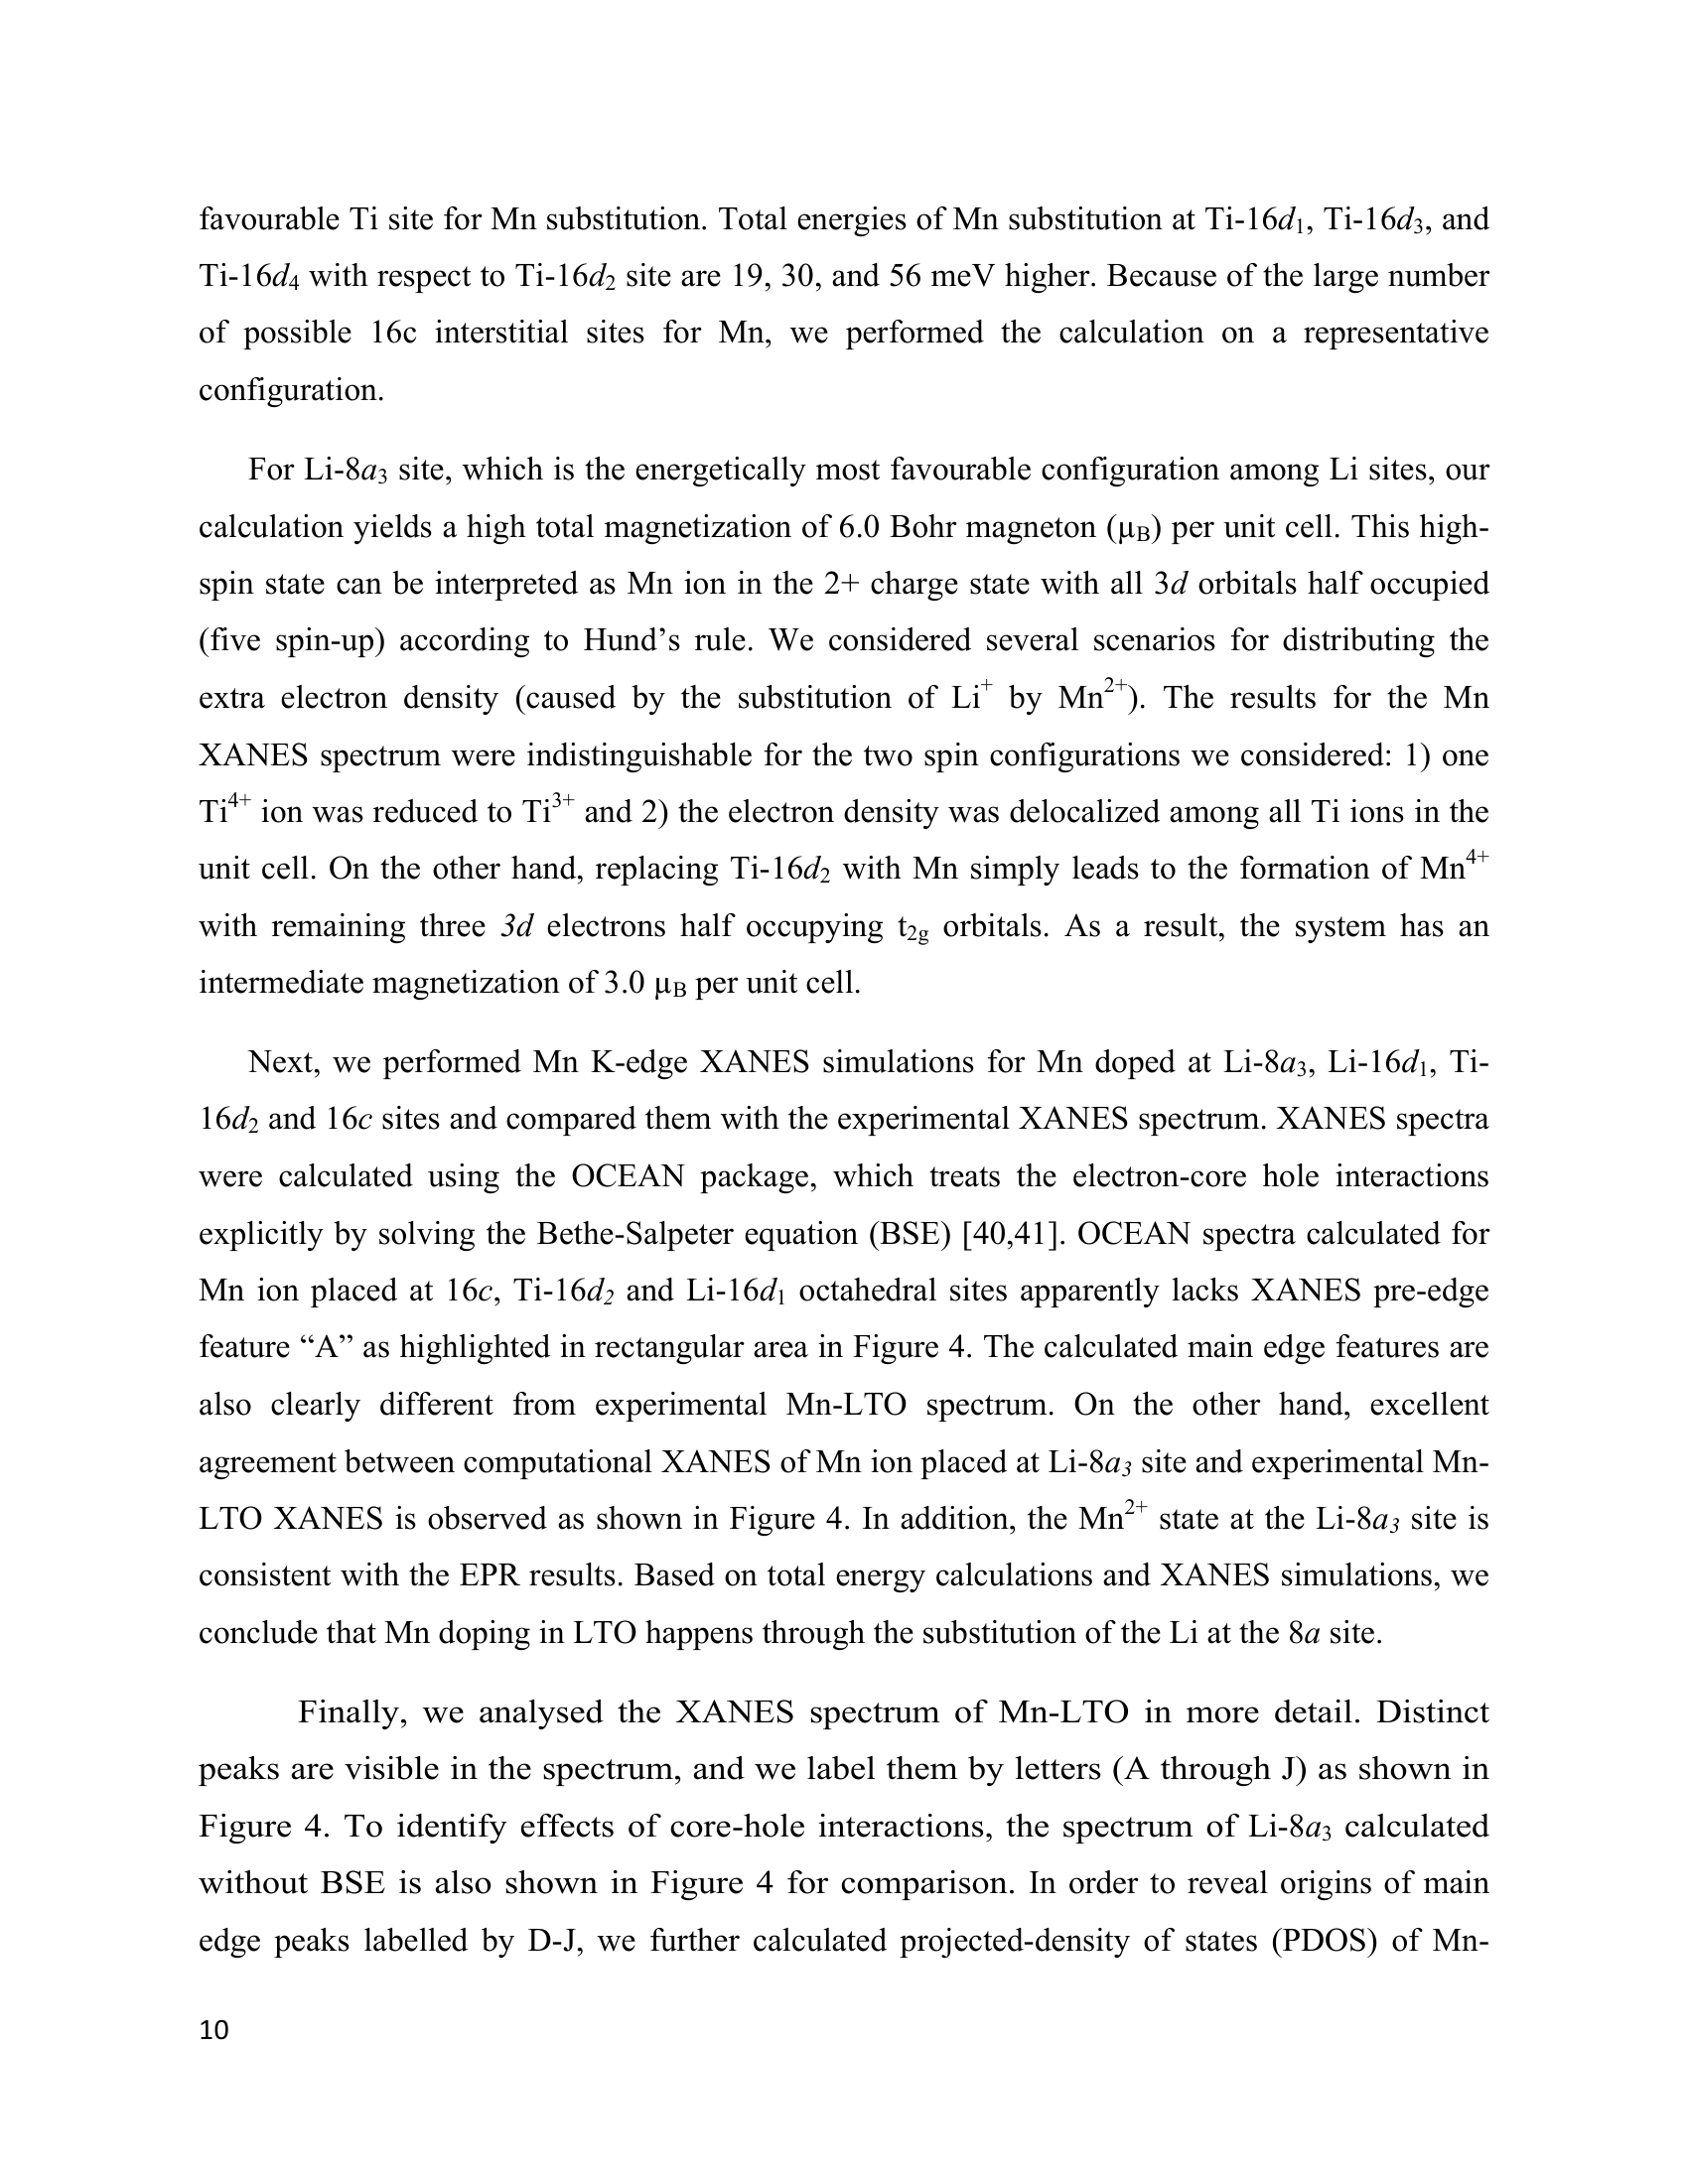
Figure 4 (PDF page 13)
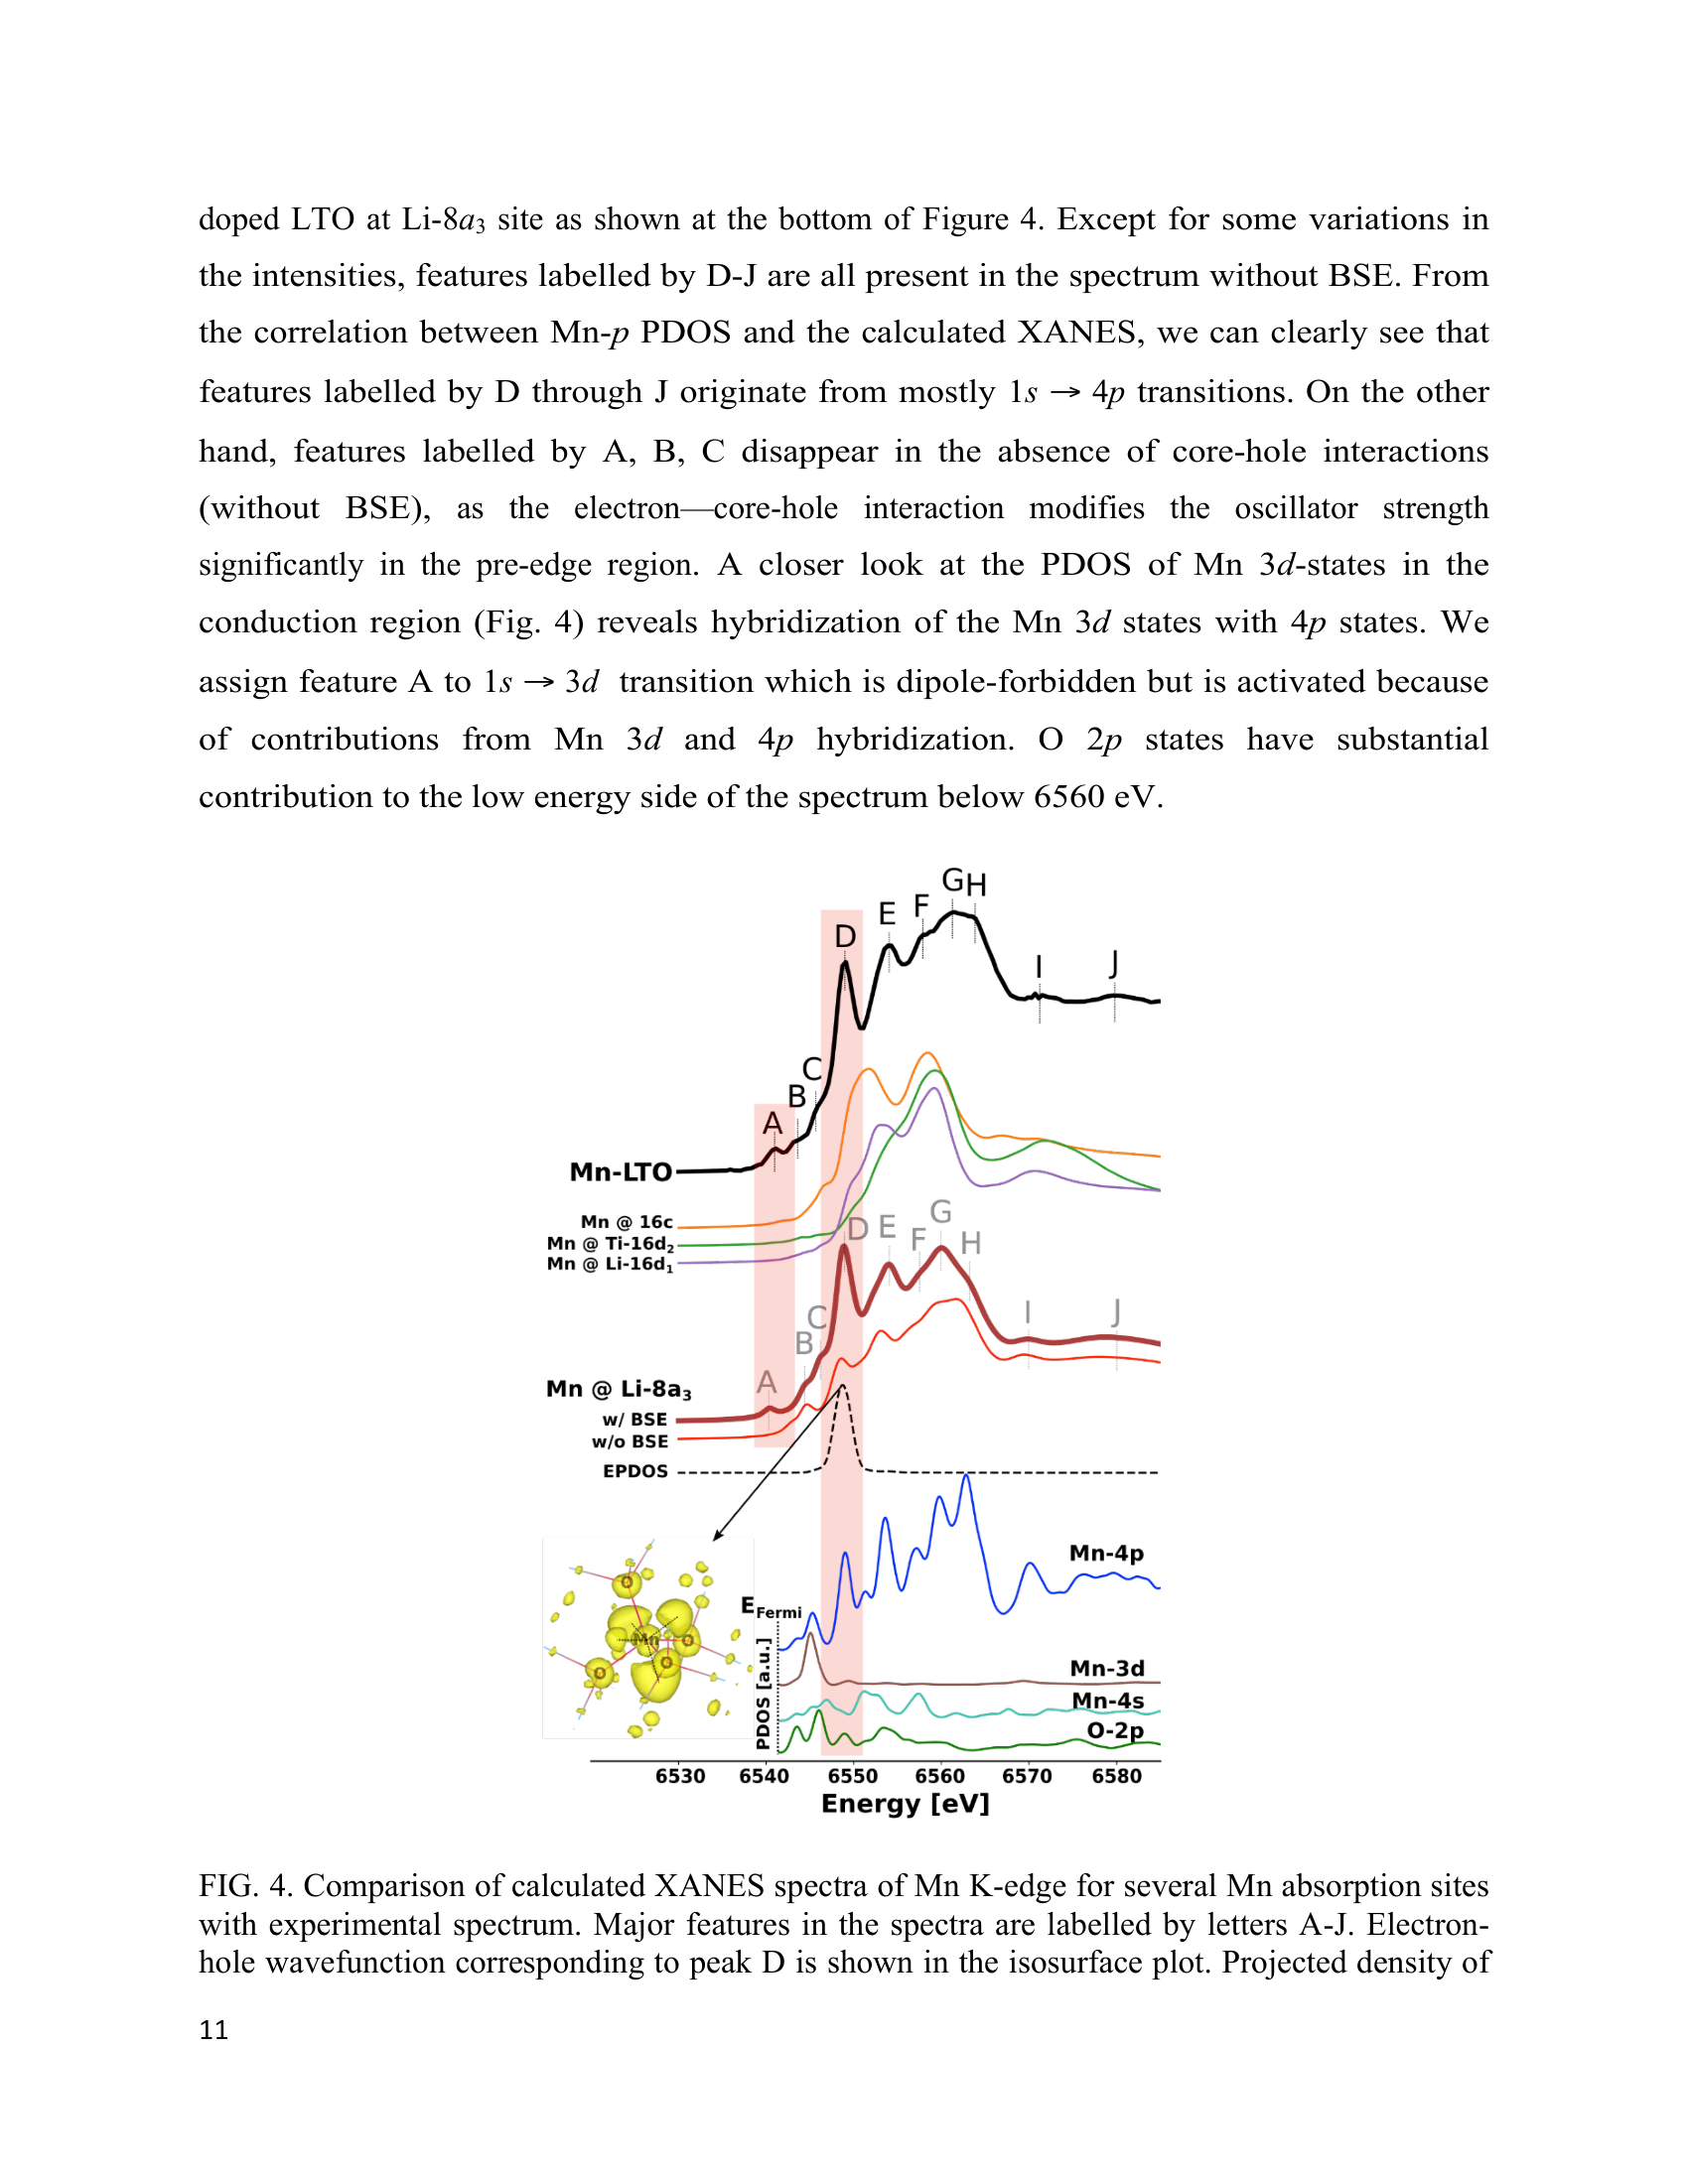
Page 10 (PDF page 10)
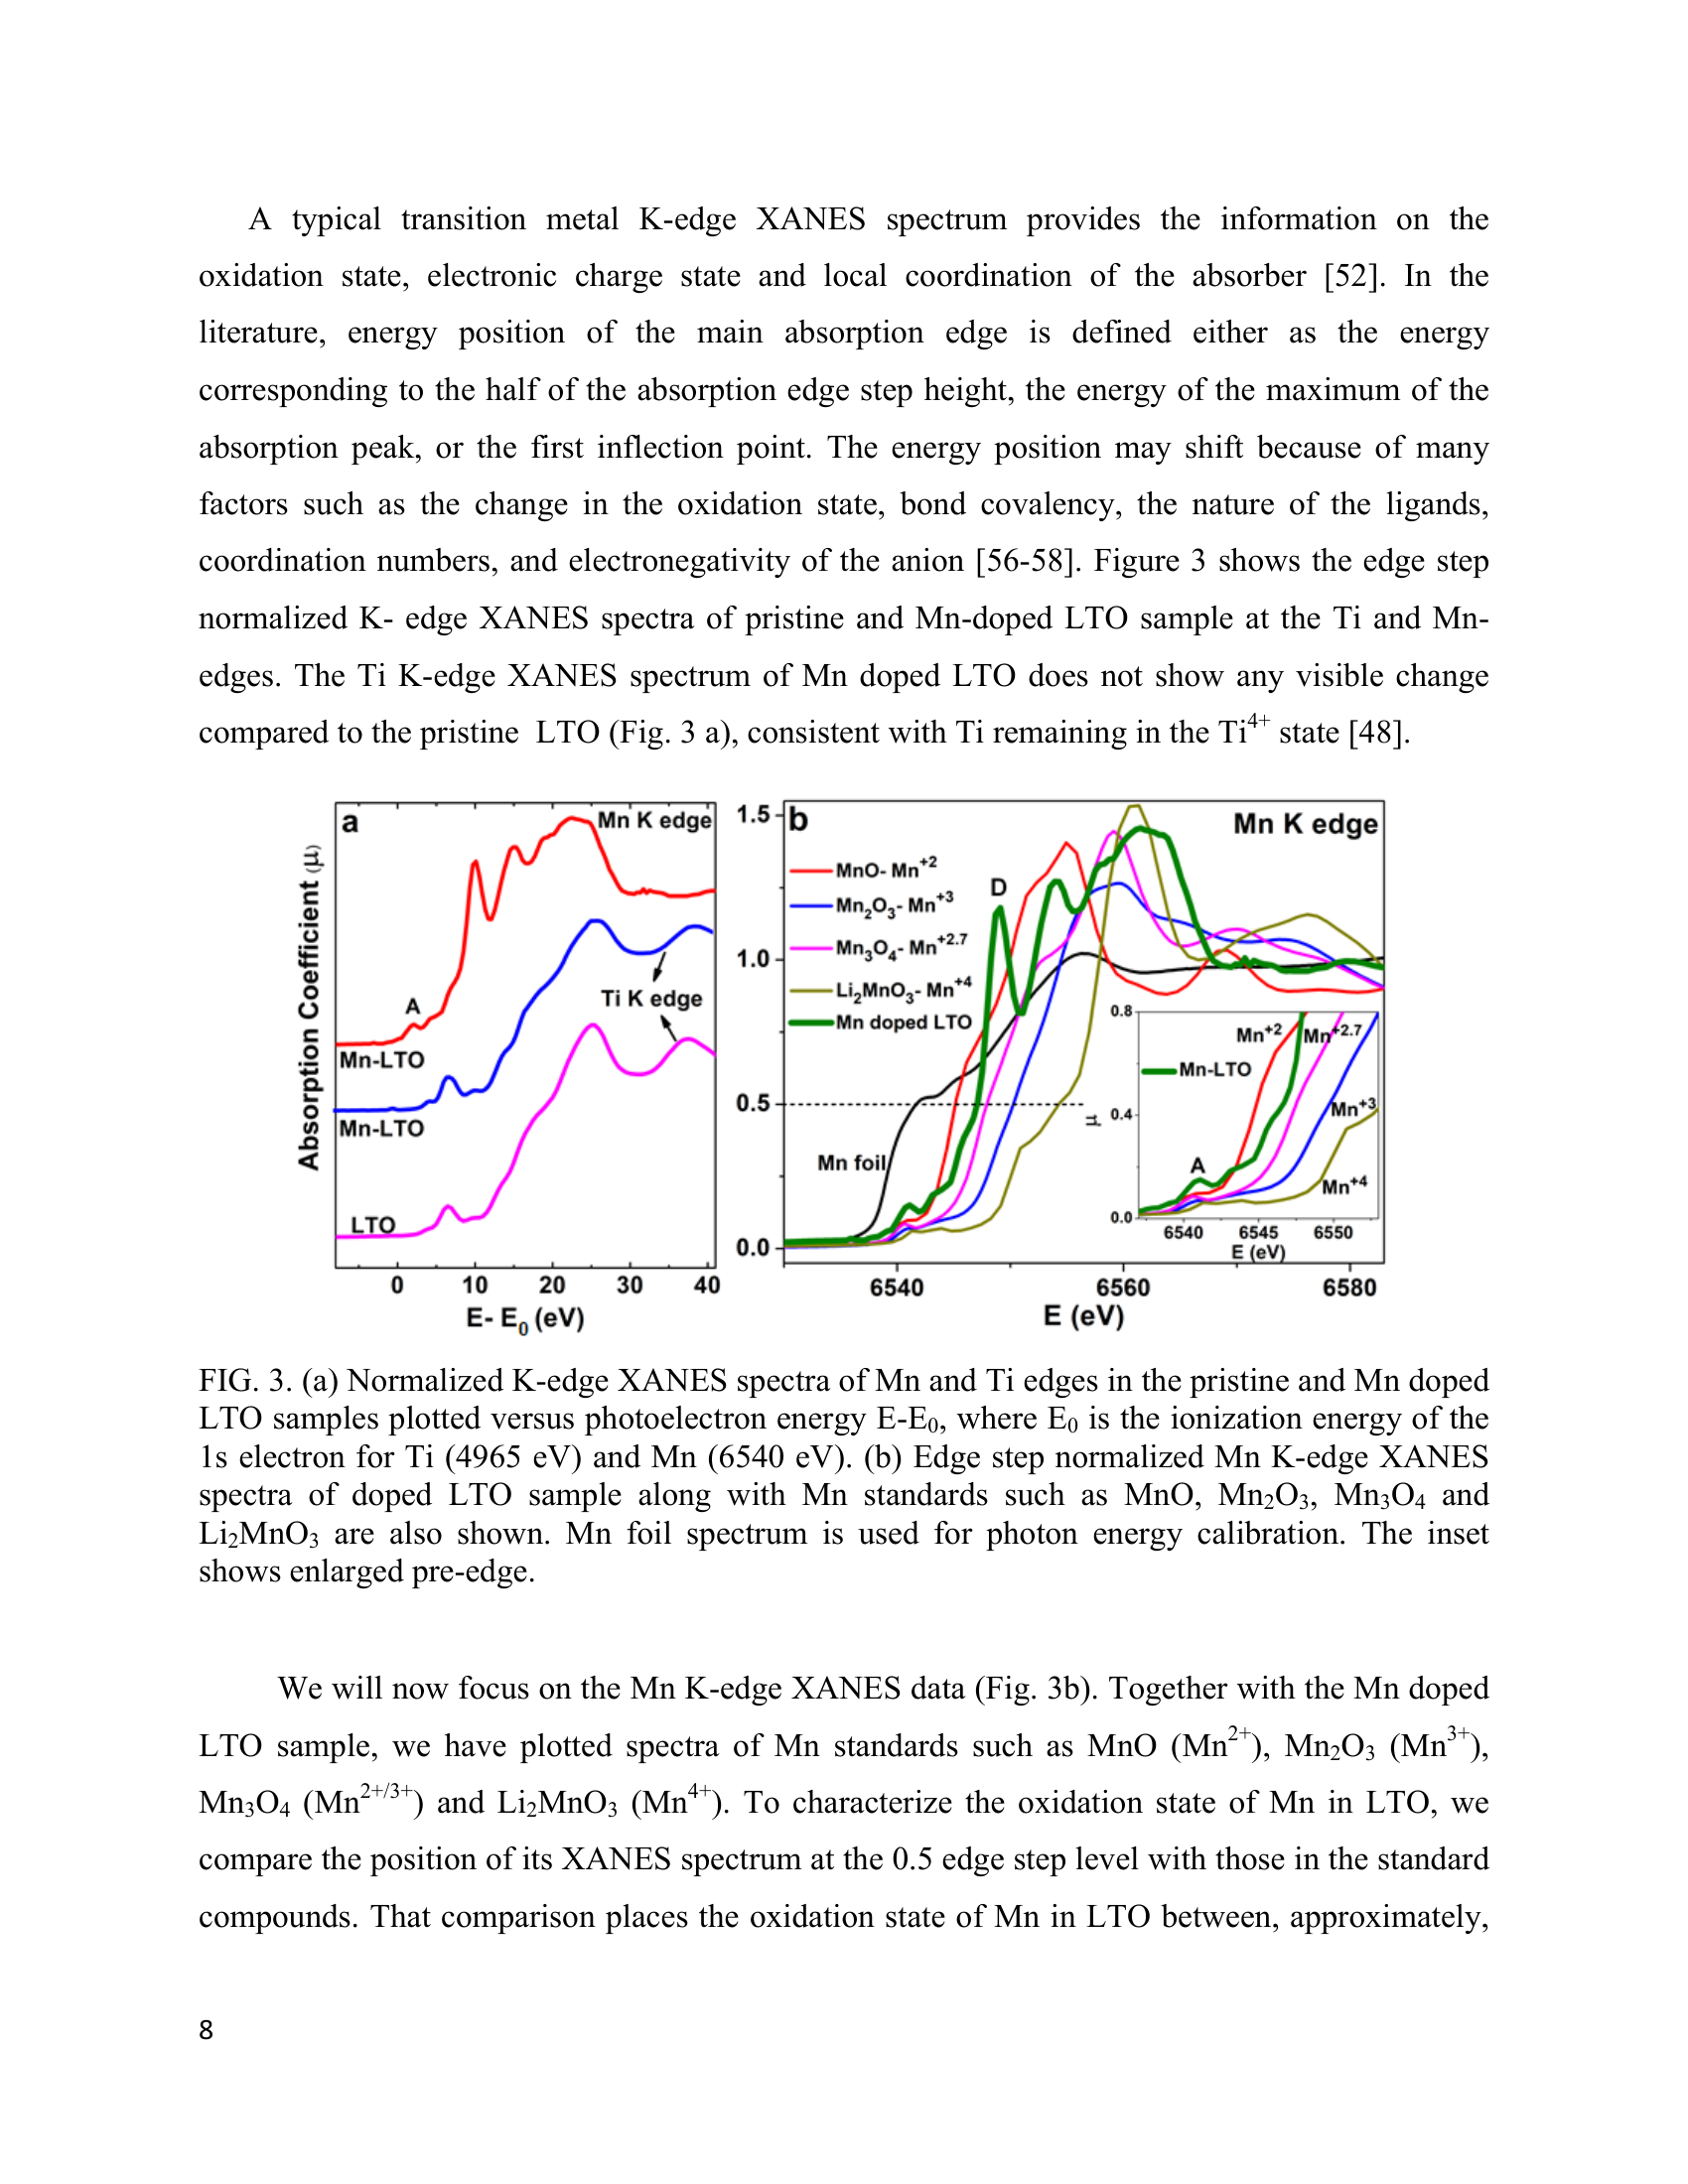
#41
Mn-doped Li4/3Ti5/3O4
Mn K
▶
LLM Prompt
Sample Information
Material: Mn-doped Li4/3Ti5/3O4
Method: solid-state
Sample-Specific Conditions
- Mn doping concentration: 1 at. %
- 1 at. % Mn doped lithium titanate
Preparation
- The samples of pristine and 1 at. % Mn doped LTO were prepared by solid state reactions as described previously [31].
Measurement
We plan to measure the Mn K XANES spectrum of this sample.
Questions
Based on all the information above:
1. Based on the solid-state synthesis of 1 at. % Mn-doped LTO, what is the dominant crystallographic site and local coordination environment for the Mn dopant, and what physical reasoning supports this assignment?
2. Describe the expected spectral shape of the Mn K-edge XANES for this sample. What specific spectral feature distinguishes it from standard octahedrally coordinated Mn compounds (e.g., MnO, Mn2O3)?
3. The XANES spectrum of this sample exhibits a distinct pre-edge feature (Peak A) and a sharp main-edge peak (Peak D). What are the specific electronic transitions responsible for these two features?
4. What is the expected oxidation state of the Mn dopant in this LTO lattice, and how does the XANES edge position relate to this state?
Ground Truth
Material: Mn-doped Li4/3Ti5/3O4
Measurement: Mn K-edge fluorescence mode at ISS beamline (NSLS-II)
Fit method: Theoretical XANES modeling (OCEAN package, Bethe-Salpeter equation) compared to experimental data
Phase fractions:
| Phase | Fraction |
|---|---|
| Mn at Li-8a site in LTO | 1.0 |
Fit basis (paper's reference spectra):
- Theoretical spectra of Mn at Li-8a3, Li-16d1, Ti-16d2, and 16c sites
Source evidence: Figure 4 and Section III (Results and Discussion), pages 10-12
Key reasoning: Density functional theory total energy calculations reveal that the Li-8a3 site is the most energetically favorable configuration for Mn substitution. Furthermore, theoretical XANES simulations of Mn placed at the tetrahedral Li-8a3 site show excellent agreement with the experimental Mn-LTO spectrum, successfully reproducing both the pre-edge feature 'A' and the distinct main edge peak 'D'. Simulations of Mn at octahedral sites (16c, Ti-16d2, Li-16d1) fail to reproduce these key spectral features.
Reasoning source: Section III. RESULTS AND DISCUSSION, pages 10-12
Scoring Rubric (total: 100 pts)
| Q | Type | Max | Question | Reference Answer | Scoring Criteria |
|---|---|---|---|---|---|
| q1 | reasoning | 30 | Based on the solid-state synthesis of 1 at. % Mn-doped LTO, what is the dominant crystallographic site and local coordination environment for the Mn dopant, and what physical reasoning supports this assignment? | In the 1 at. % Mn-doped LTO prepared via solid-state synthesis, the Mn dopant exclusively occupies the tetrahedral Li-8a crystallographic site (fraction 1.0). This site preference occurs because density functional theory total energy calculations reveal that substituting Mn into the Li-8a3 site is the most energetically favorable configuration for this composition. Additionally, theoretical XANES simulations confirm this assignment, as modeling Mn at the tetrahedral Li-8a3 site successfully reproduces the experimental spectrum. In contrast, simulations of Mn placed at octahedral sites (16c, Ti-16d2, Li-16d1) fail to reproduce the key spectral features of the synthesized sample. | Full credit requires identifying the tetrahedral Li-8a site as the dominant location and explaining that it is supported by both DFT total energy calculations (most energetically favorable) and the excellent match between theoretical XANES simulations for this site and the experimental data. |
| q2 | spectral | 30 | Describe the expected spectral shape of the Mn K-edge XANES for this sample. What specific spectral feature distinguishes it from standard octahedrally coordinated Mn compounds (e.g., MnO, Mn2O3)? | The expected Mn K-edge XANES spectrum for this sample exhibits a pronounced pre-edge peak (Peak A) at ~6540 eV and a distinct, sharp peak (Peak D) at ~6550 eV located in the middle of the main absorption edge rise. The specific feature that distinguishes this spectrum from standard octahedrally coordinated Mn compounds, such as MnO and Mn2O3, is the presence of Peak D, which is absent in pure six-coordinated Mn spectra. These distinct spectral shapes arise because the 1 at. % Mn dopant in the solid-state synthesized LTO energetically prefers to substitute at the tetrahedral Li-8a site rather than octahedral sites. This non-centrosymmetric tetrahedral environment induces specific electronic interactions, which theoretical XANES simulations confirm are responsible for generating both the enhanced pre-edge feature and the characteristic Peak D fingerprint. | Full credit requires mentioning the pronounced pre-edge peak and the distinct, sharp peak (Peak D) in the middle of the main edge rise. The answer must explicitly state that this sharp main-edge peak (Peak D) is the distinguishing fingerprint of tetrahedrally coordinated Mn, absent in pure octahedral standards. |
| q3 | spectral | 20 | The XANES spectrum of this sample exhibits a distinct pre-edge feature (Peak A) and a sharp main-edge peak (Peak D). What are the specific electronic transitions responsible for these two features? | The distinct pre-edge feature (Peak A) at ~6540 eV originates from the 1s → 3d electronic transition, while the sharp main-edge peak (Peak D) at ~6550 eV originates from the 1s → 4p transition. These specific transitions are prominent because the 1 at. % Mn dopant in the solid-state synthesized LTO energetically favors substitution at the tetrahedral Li-8a site. Because of this distorted, non-centrosymmetric tetrahedral symmetry, Mn 3d-4p hybridization occurs, which activates the otherwise dipole-forbidden 1s → 3d transition to produce a high-intensity Peak A. Furthermore, the tetrahedral coordination environment dictates the electron-core hole screened Coulomb interaction that strongly influences the 1s → 4p transition, generating the characteristic Peak D that theoretical models show is absent for octahedral sites. | Full credit requires identifying Peak A as a 1s → 3d transition (activated by 3d-4p hybridization) and Peak D as primarily a 1s → 4p transition. |
| q4 | prediction | 20 | What is the expected oxidation state of the Mn dopant in this LTO lattice, and how does the XANES edge position relate to this state? | The expected oxidation state of the Mn dopant in the LTO lattice is 2+. This is reflected in the XANES edge position, where the 0.5 edge step level is located between the Mn2+ and Mn2.7+ standards. This specific oxidation state and edge position arise because, during the solid-state synthesis of the 1 at. % Mn-doped LTO, the Mn dopant energetically prefers to substitute into the tetrahedral Li-8a site. DFT calculations and theoretical XANES simulations confirm that occupying this specific tetrahedral configuration, rather than octahedral sites, establishes the local electronic environment that stabilizes the Mn2+ state and produces the observed spectral edge. | Full credit requires stating the oxidation state is 2+ and noting that the 0.5 edge step position lies between the Mn2+ and Mn2.7+ standards. |
Review
Probing ferroelectricity by x-ray absorption spectroscopy in molecular crystals
Original-17
Pure Phase
Fujie Tang et al.
DOI: 10.1103/PhysRevMaterials.4.034401
1 scenario
PDF
▶
Key Paper Evidence2, p.3, p.4▶
Figure 2 (PDF page 3)
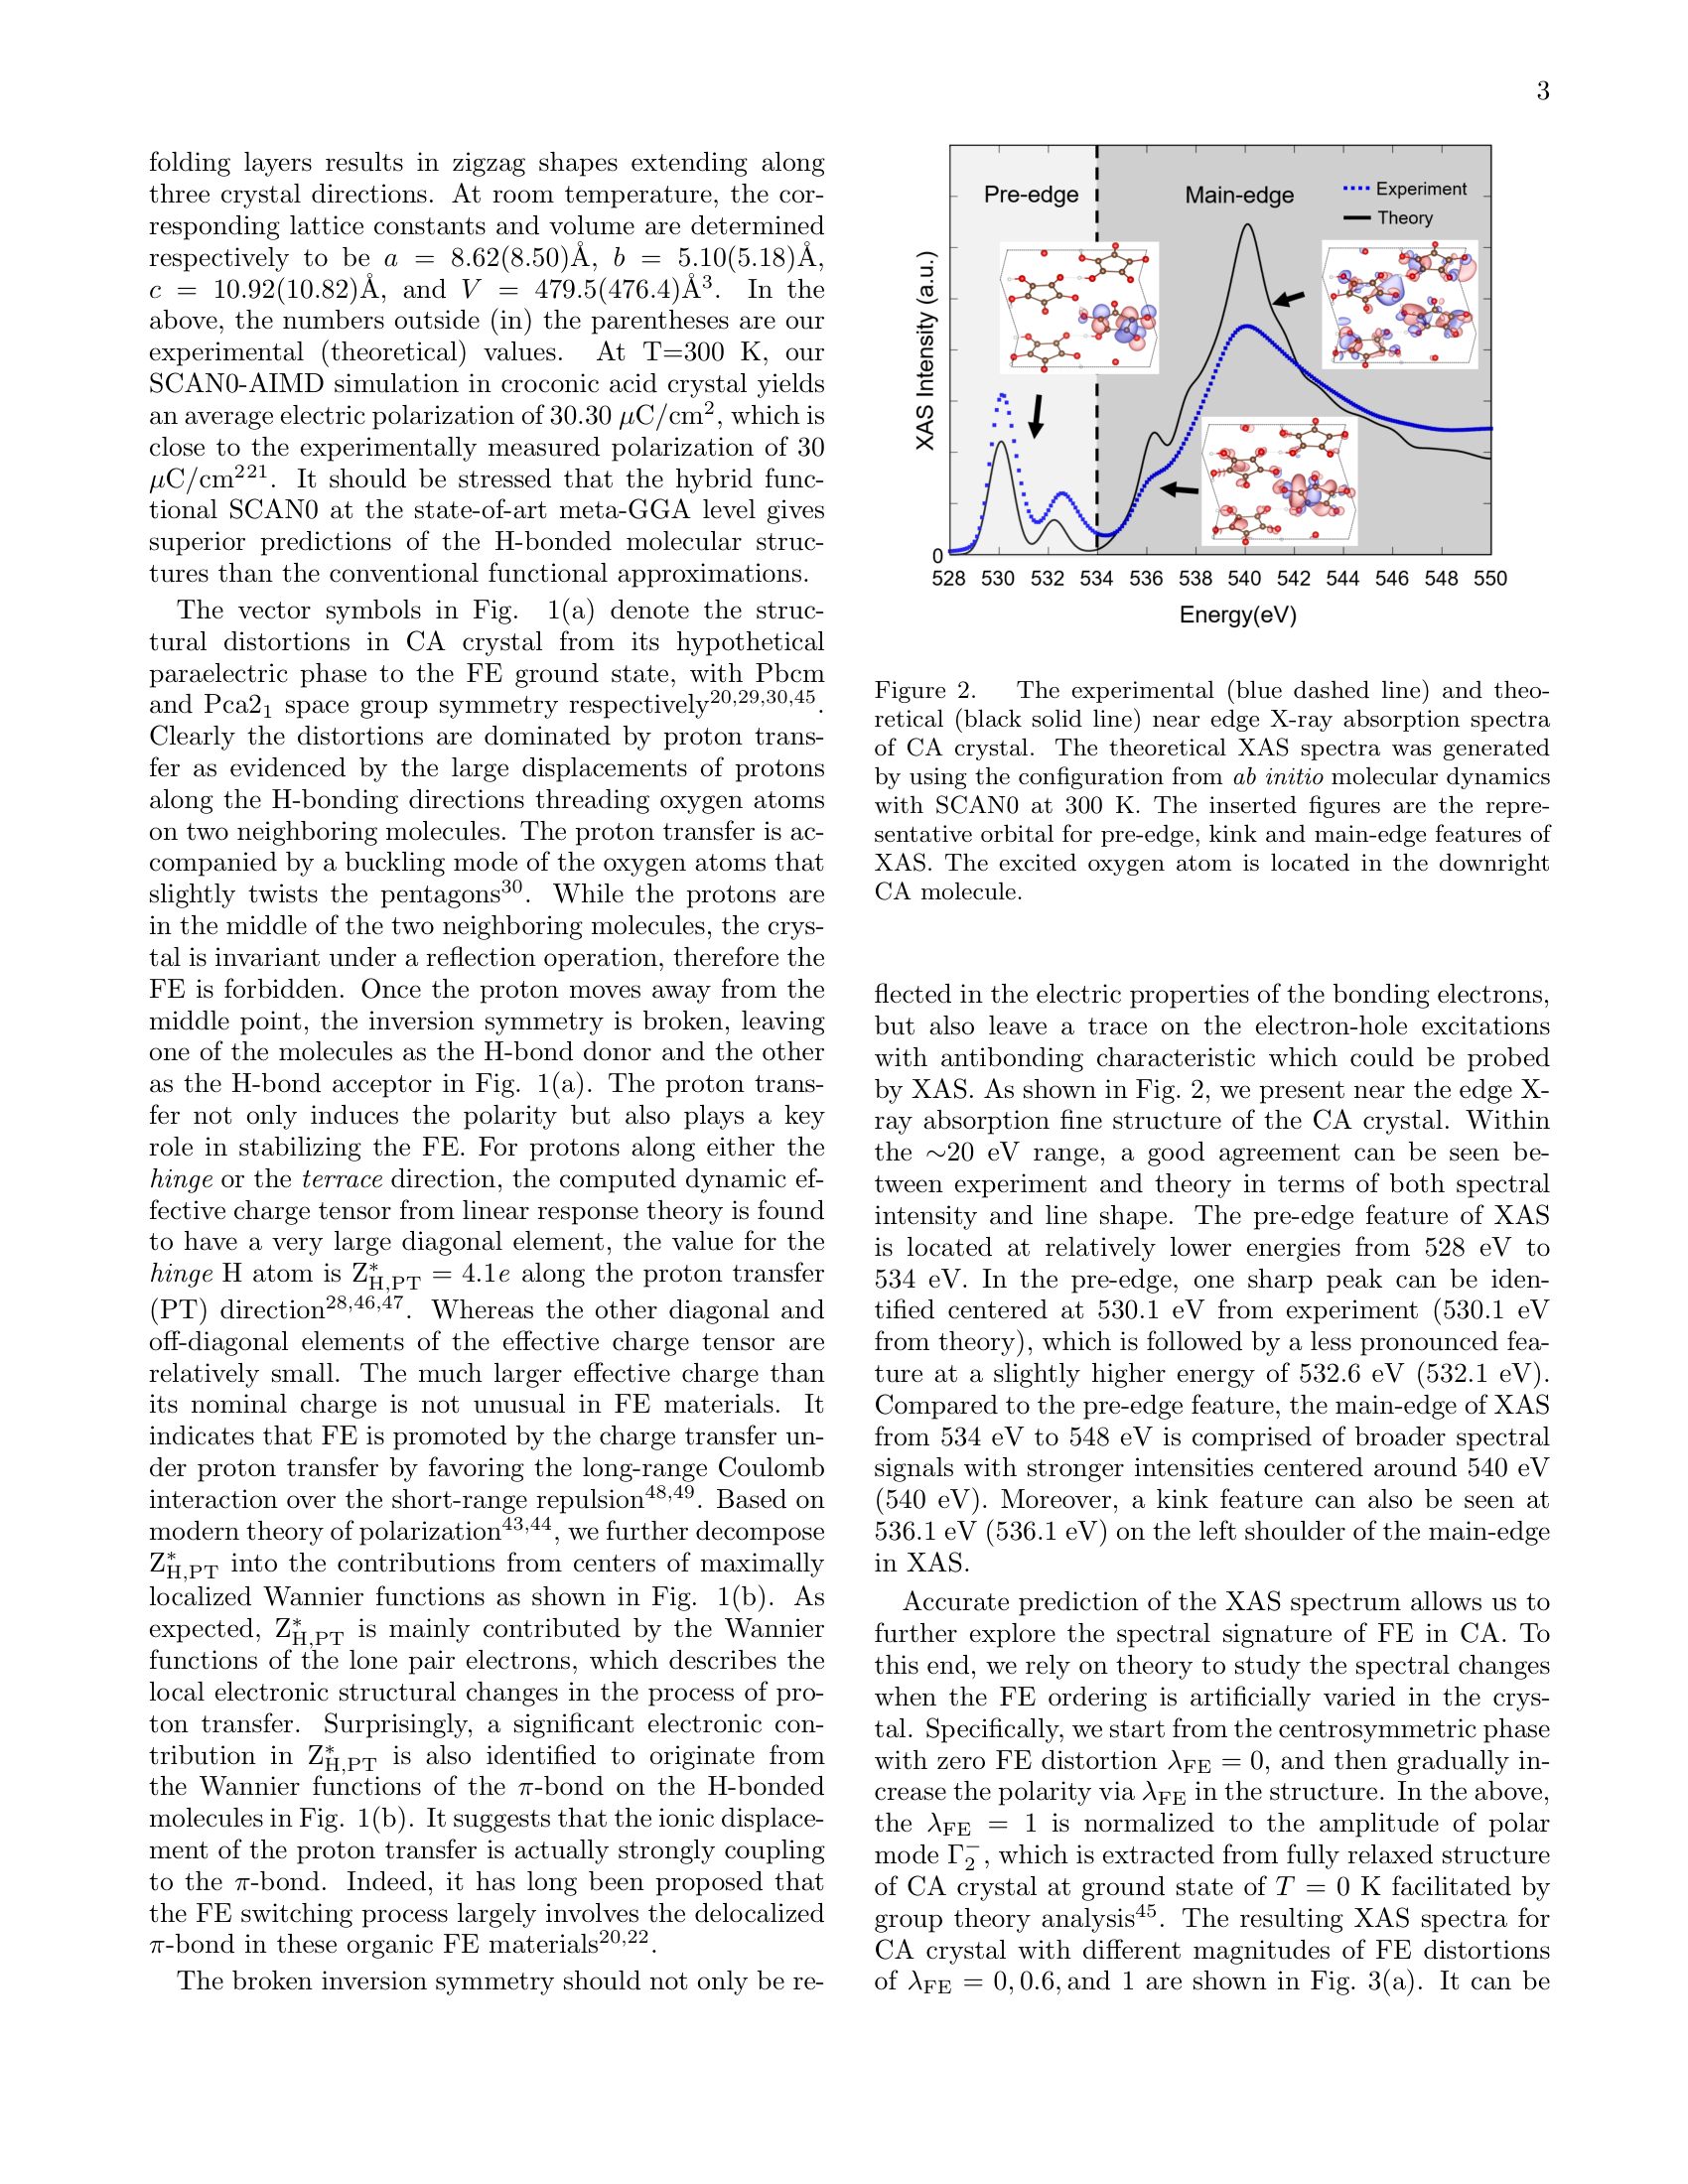
Figure 2 (PDF page 4)
#42
croconic acid (C5H2O5)
O K
▶
LLM Prompt
Sample Information
Material: croconic acid (C5H2O5)
Crystal Structure: Pca21 (ferroelectric ground state)
Sample Form: thin film
Measurement Mode: total electron yield
- polycrystalline croconic acid film
Measurement
We plan to measure the O K XANES spectrum of this sample.
Questions
Based on all the information above:
1. Describe the expected spectral shape and key peak positions for the O K-edge XANES of the ferroelectric croconic acid film.
2. What specific electronic states or transitions give rise to the sharp pre-edge peak at 530.1 eV and the broad main-edge feature around 540 eV?
3. What specific spectral feature in the O K-edge XANES serves as a signature of the ferroelectric ground state in croconic acid, and what structural/electronic phenomenon causes it?
Ground Truth
Compound: C5H2O5
Oxidation state: not reported
Measurement: O K-edge XAS in total electron yield mode at Advanced Light Source beamline 6.3.1
Edge position: not reported
Spectral shape: The spectrum features a distinct pre-edge region (528-534 eV) with a sharp peak and a higher-energy satellite peak, followed by a broader main-edge region (534-548 eV) with a kink on its left shoulder and a broad maximum around 540 eV.
Labeled peaks:
| Label | Energy (eV) | Intensity | Origin | Source |
|---|---|---|---|---|
| pre-edge main peak | 530.1 | sharp | bound exciton (pi* state) localized on the excited molecule | paper_data |
| pre-edge satellite peak | 532.6 | less pronounced | bound exciton (pi* state) on H-bond donor molecule, shifted due to broken inversion symmetry (ferroelectricity) | paper_data |
| main-edge kink | 536.1 | shoulder feature | transitions from exciton resonance states with pi* orbitals hybridized with sigma* on surrounding molecules | paper_data |
| main-edge broad peak | 540 | strong/broad | exciton resonance states with antibonding sigma* character | paper_data |
Distinguishing features: A satellite peak in the pre-edge at 532.6 eV, which serves as a clear signature of ferroelectricity (broken inversion symmetry) caused by proton transfer creating inequivalent H-bonding environments.
Key reasoning: The sample is a pure molecular crystal of croconic acid. The spectral features are assigned based on electron-hole excitation theory simulations. The pre-edge features are assigned to bound excitons with pi* character, while the main edge is assigned to exciton resonance states with sigma* character. The splitting of the pre-edge into two peaks is a direct result of broken inversion symmetry due to proton transfer in the ferroelectric state, which creates inequivalent H-bond donor and acceptor environments. In a hypothetical paraelectric (centrosymmetric) phase, only a single pre-edge feature would be present.
Reasoning source: Section III. RESULTS AND DISCUSSIONS, pages 3-4
Scoring Rubric (total: 101 pts)
| Q | Type | Max | Question | Reference Answer | Scoring Criteria |
|---|---|---|---|---|---|
| q1 | spectral | 38 | Describe the expected spectral shape and key peak positions for the O K-edge XANES of the ferroelectric croconic acid film. | The O K-edge XANES spectrum of the croconic acid film features a distinct pre-edge region (528-534 eV) and a broader main-edge region (534-548 eV). Key peak positions include a sharp pre-edge main peak at 530.1 eV, a less pronounced pre-edge satellite peak at 532.6 eV, a main-edge shoulder or kink at 536.1 eV, and a broad main-edge maximum around 540 eV. These specific features arise because the sample is a pure molecular crystal of croconic acid, where the pre-edge splitting into two peaks is a direct consequence of the ferroelectric Pca21 ground state breaking inversion symmetry. The broader main-edge features reflect the exciton resonance states with sigma* character inherent to the croconic acid molecular framework. | Full points require mentioning the pre-edge region (528-534 eV) with a sharp peak at 530.1 eV and a satellite peak at 532.6 eV, as well as the main-edge region (534-548 eV) featuring a kink at 536.1 eV and a broad maximum around 540 eV. |
| q2 | reasoning | 25 | What specific electronic states or transitions give rise to the sharp pre-edge peak at 530.1 eV and the broad main-edge feature around 540 eV? | The sharp pre-edge peak at 530.1 eV originates from bound excitons with pi* character that are localized on the excited molecule. In contrast, the strong, broad main-edge feature around 540 eV is assigned to exciton resonance states with antibonding sigma* character. These specific electronic transitions are expected because the sample is a pure molecular crystal of croconic acid, where electron-hole excitation theory dictates the spectral response. The distinct separation between the localized pi* bound excitons at lower energy and the broader sigma* resonance states at higher energy reflects the fundamental molecular orbital structure of the C5H2O5 molecules comprising the thin film. | Full points require identifying the 530.1 eV peak as a bound exciton (pi* state) localized on the excited molecule, and the 540 eV feature as exciton resonance states with antibonding sigma* character. |
| q3 | reasoning | 38 | What specific spectral feature in the O K-edge XANES serves as a signature of the ferroelectric ground state in croconic acid, and what structural/electronic phenomenon causes it? | The signature of the ferroelectric ground state in the O K-edge XANES spectrum is the presence of a pre-edge satellite peak at 532.6 eV, which splits the pre-edge region into two distinct features. This splitting is caused by broken inversion symmetry resulting from proton transfer within the crystal lattice. Because the sample is in the ferroelectric Pca21 phase rather than a centrosymmetric paraelectric phase, this proton transfer creates inequivalent hydrogen-bond donor and acceptor environments. Consequently, the bound exciton (pi* state) on the H-bond donor molecule shifts in energy, producing the distinct 532.6 eV satellite peak that would be absent in a symmetric structure. | Full points require identifying the satellite peak in the pre-edge (at 532.6 eV) as the signature of ferroelectricity, and explaining that it is caused by broken inversion symmetry due to proton transfer, which creates inequivalent H-bond donor and acceptor environments. |
Review
Resolving local structural motifs across the phase evolution of zinc titanates with computational x-ray absorption spectroscopy
Original-17
Thin Film
Xuance Jiang et al.
DOI: 10.1103/PhysRevMaterials.9.023802
13 scenarios
PDF
▶
Key Paper Evidence10b, 10c, II, p.21, p.22, p.23, p.25▶
Figure 10b (PDF page 25)
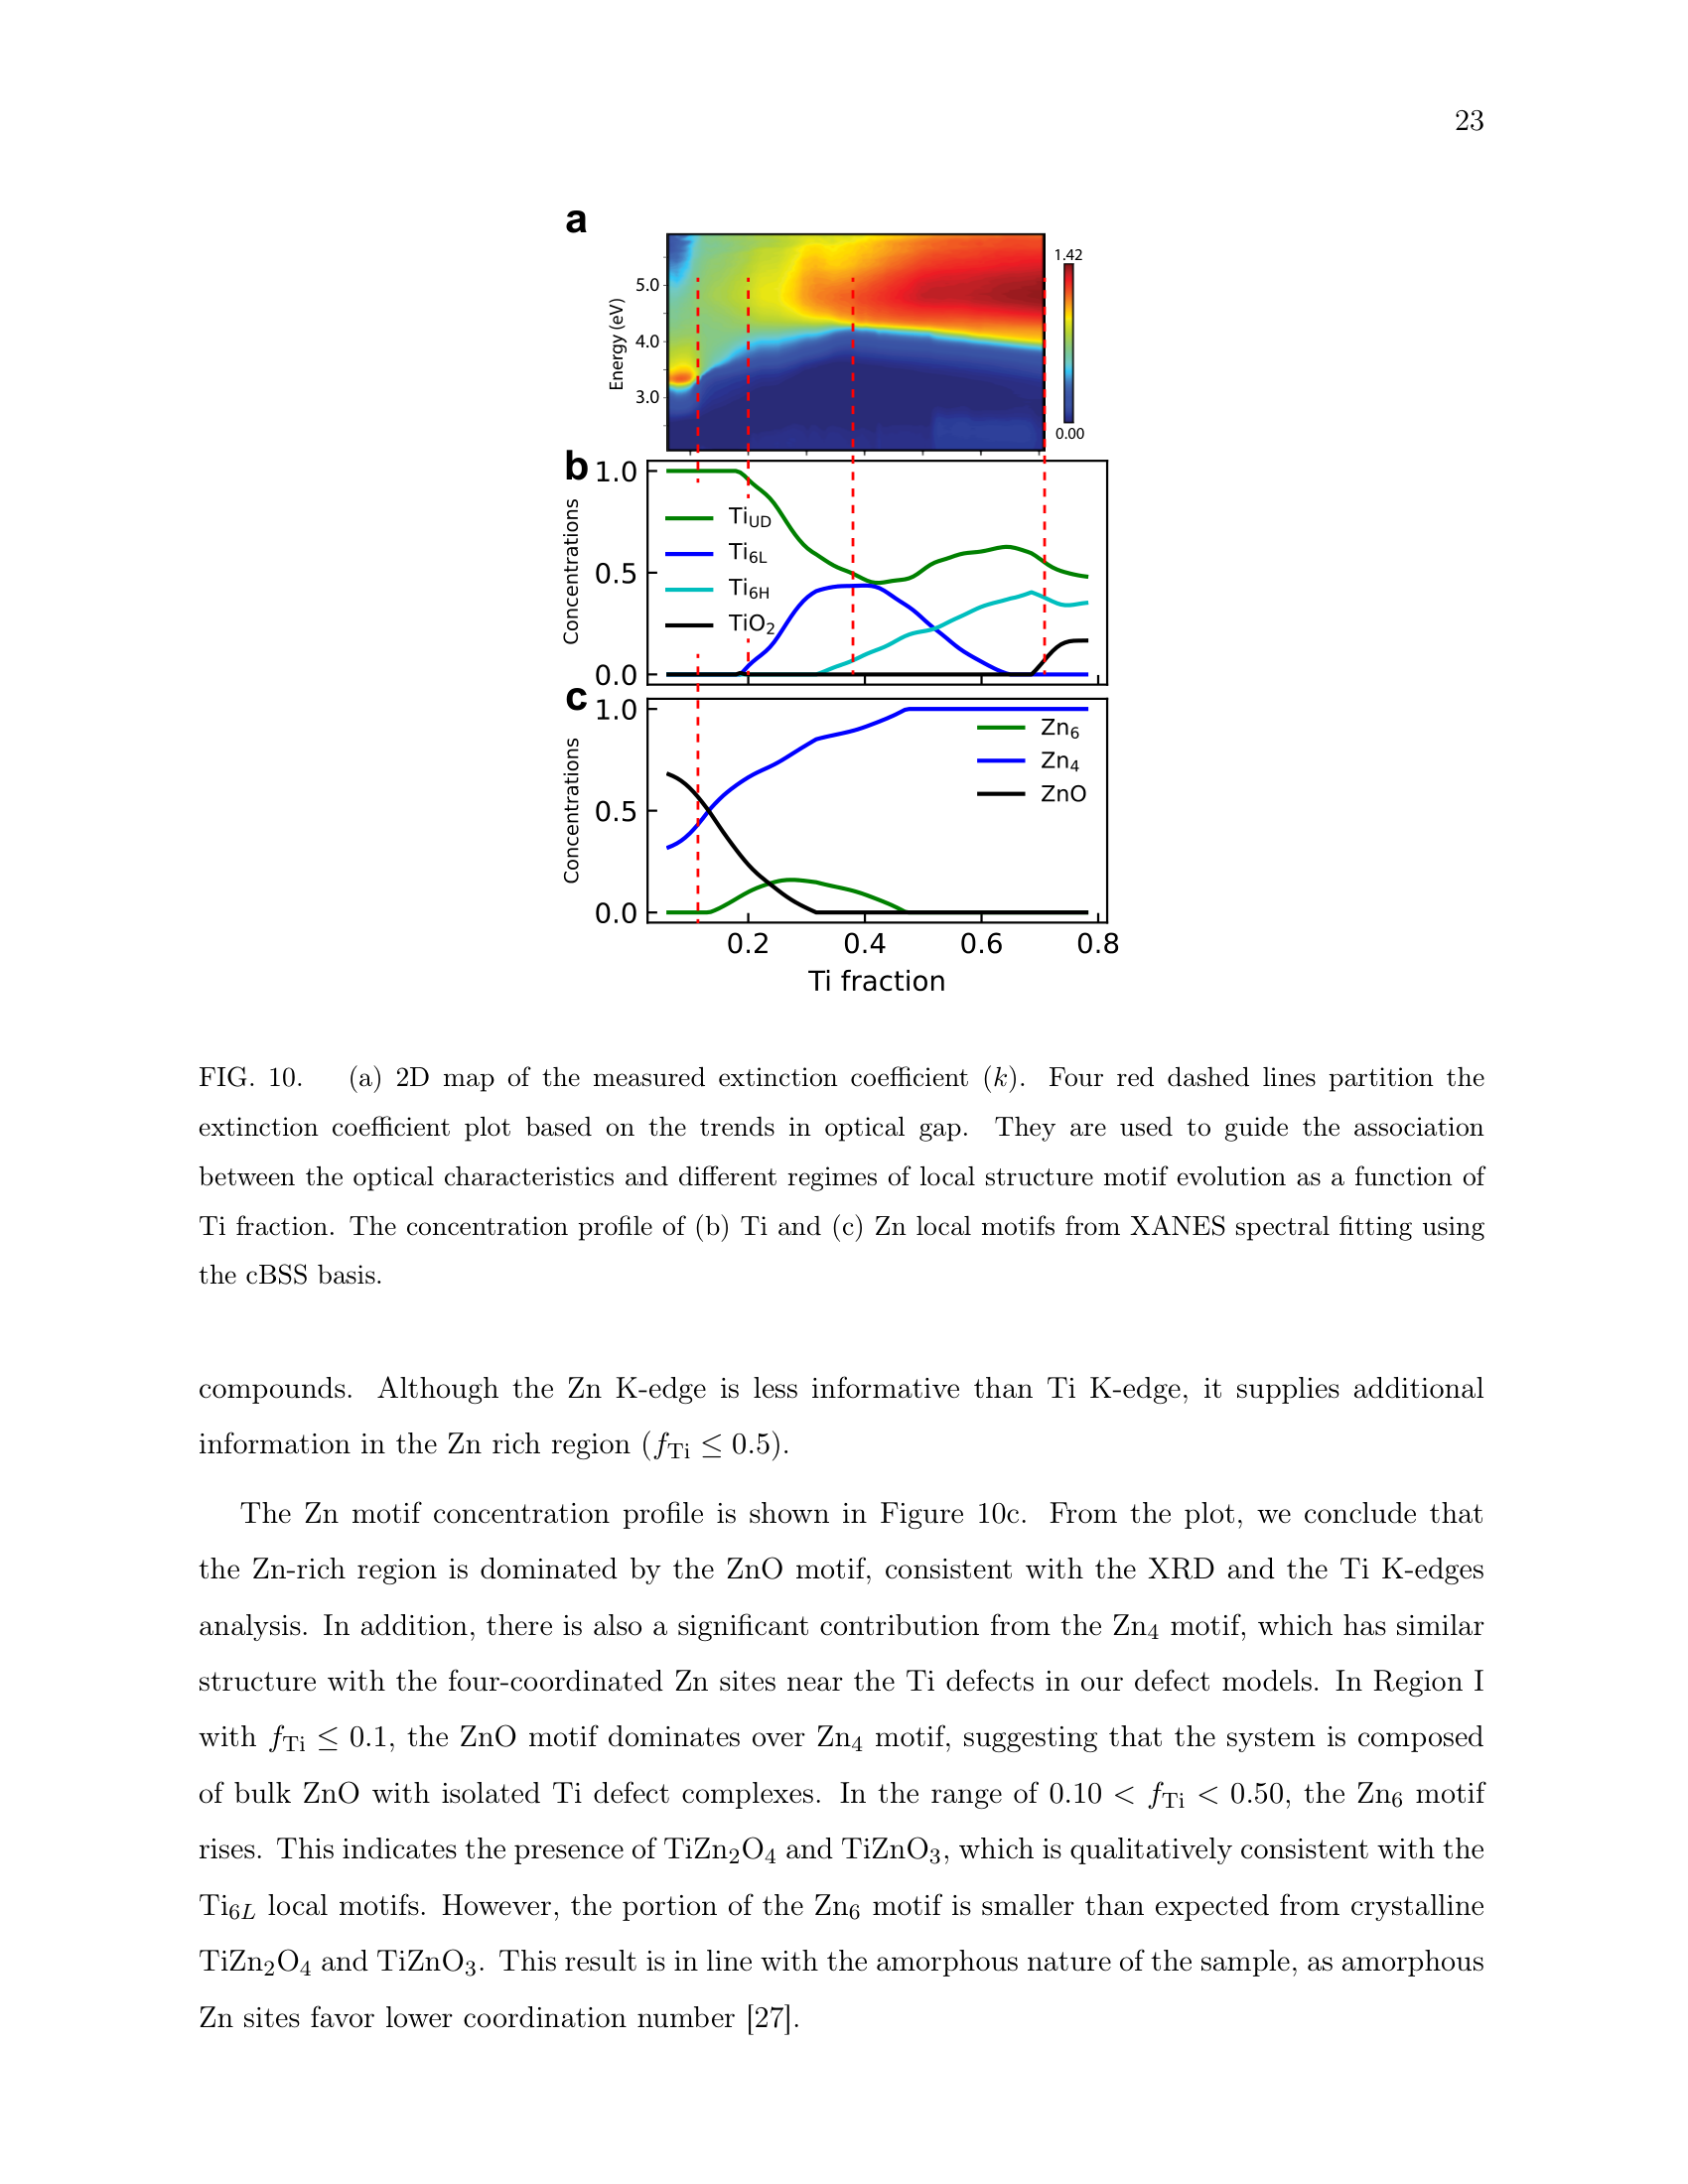
Figure 10b (PDF page 26)
Table II (PDF page 22)
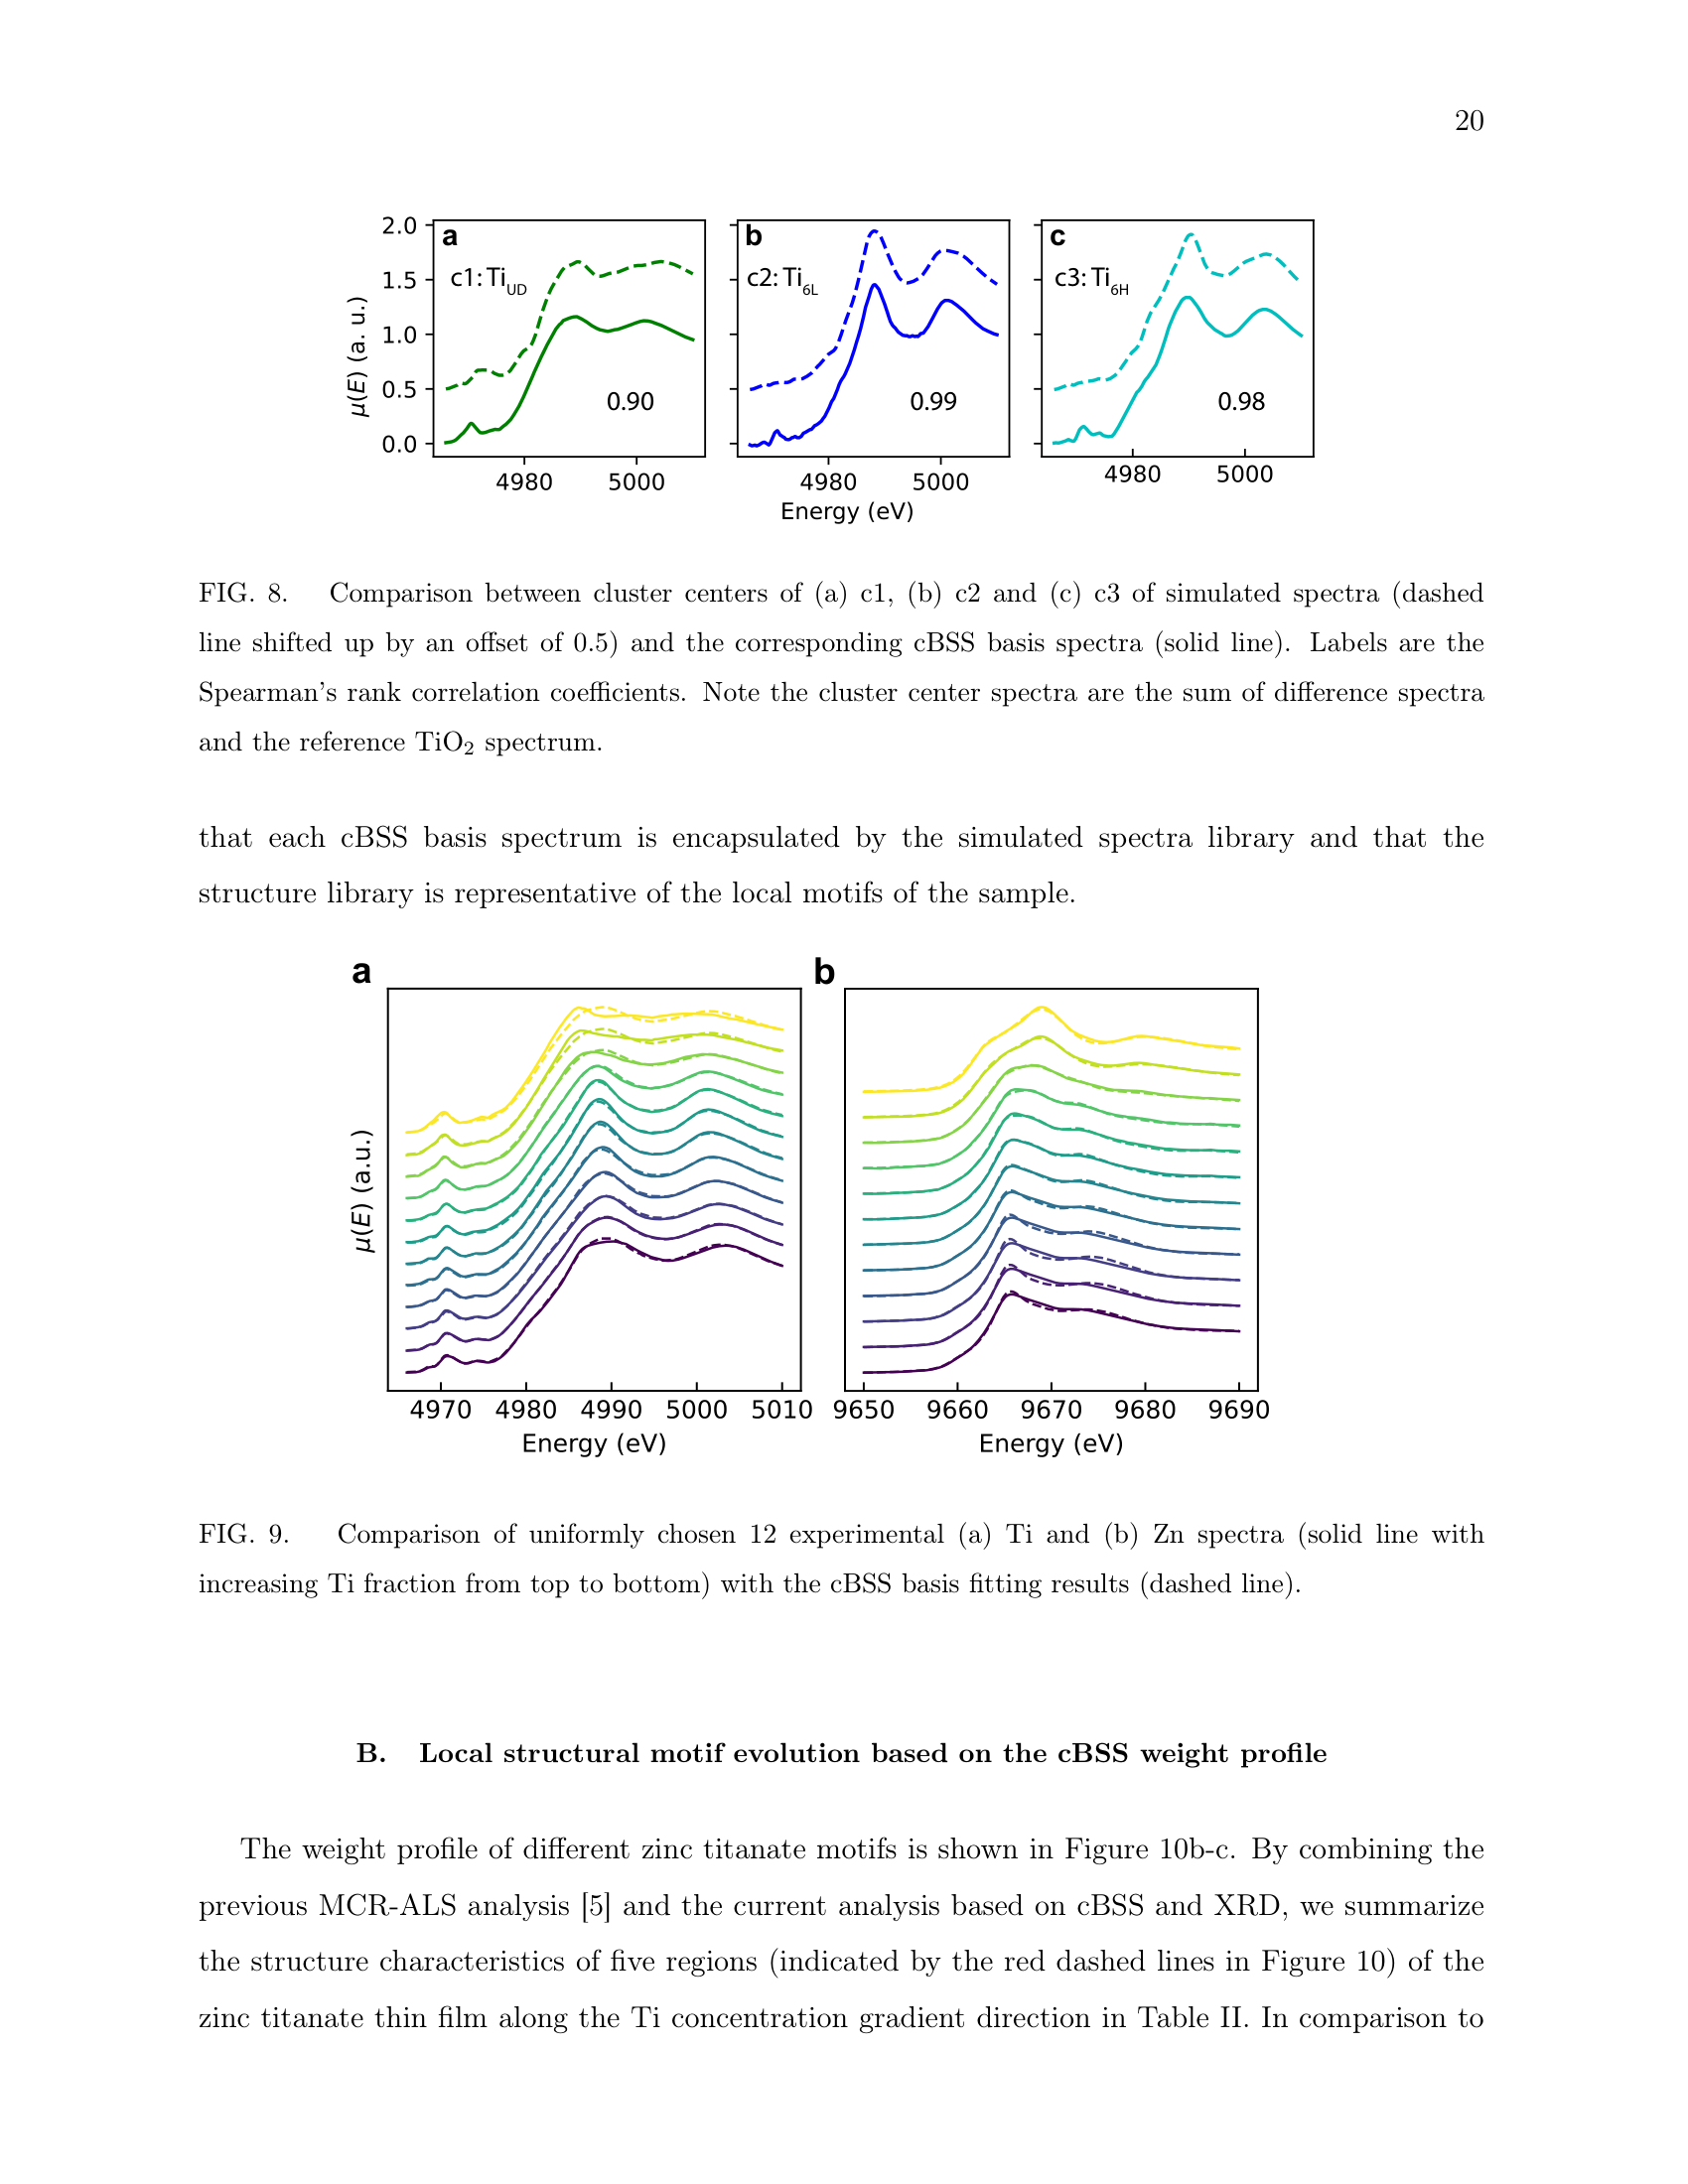
Table II (PDF page 23)
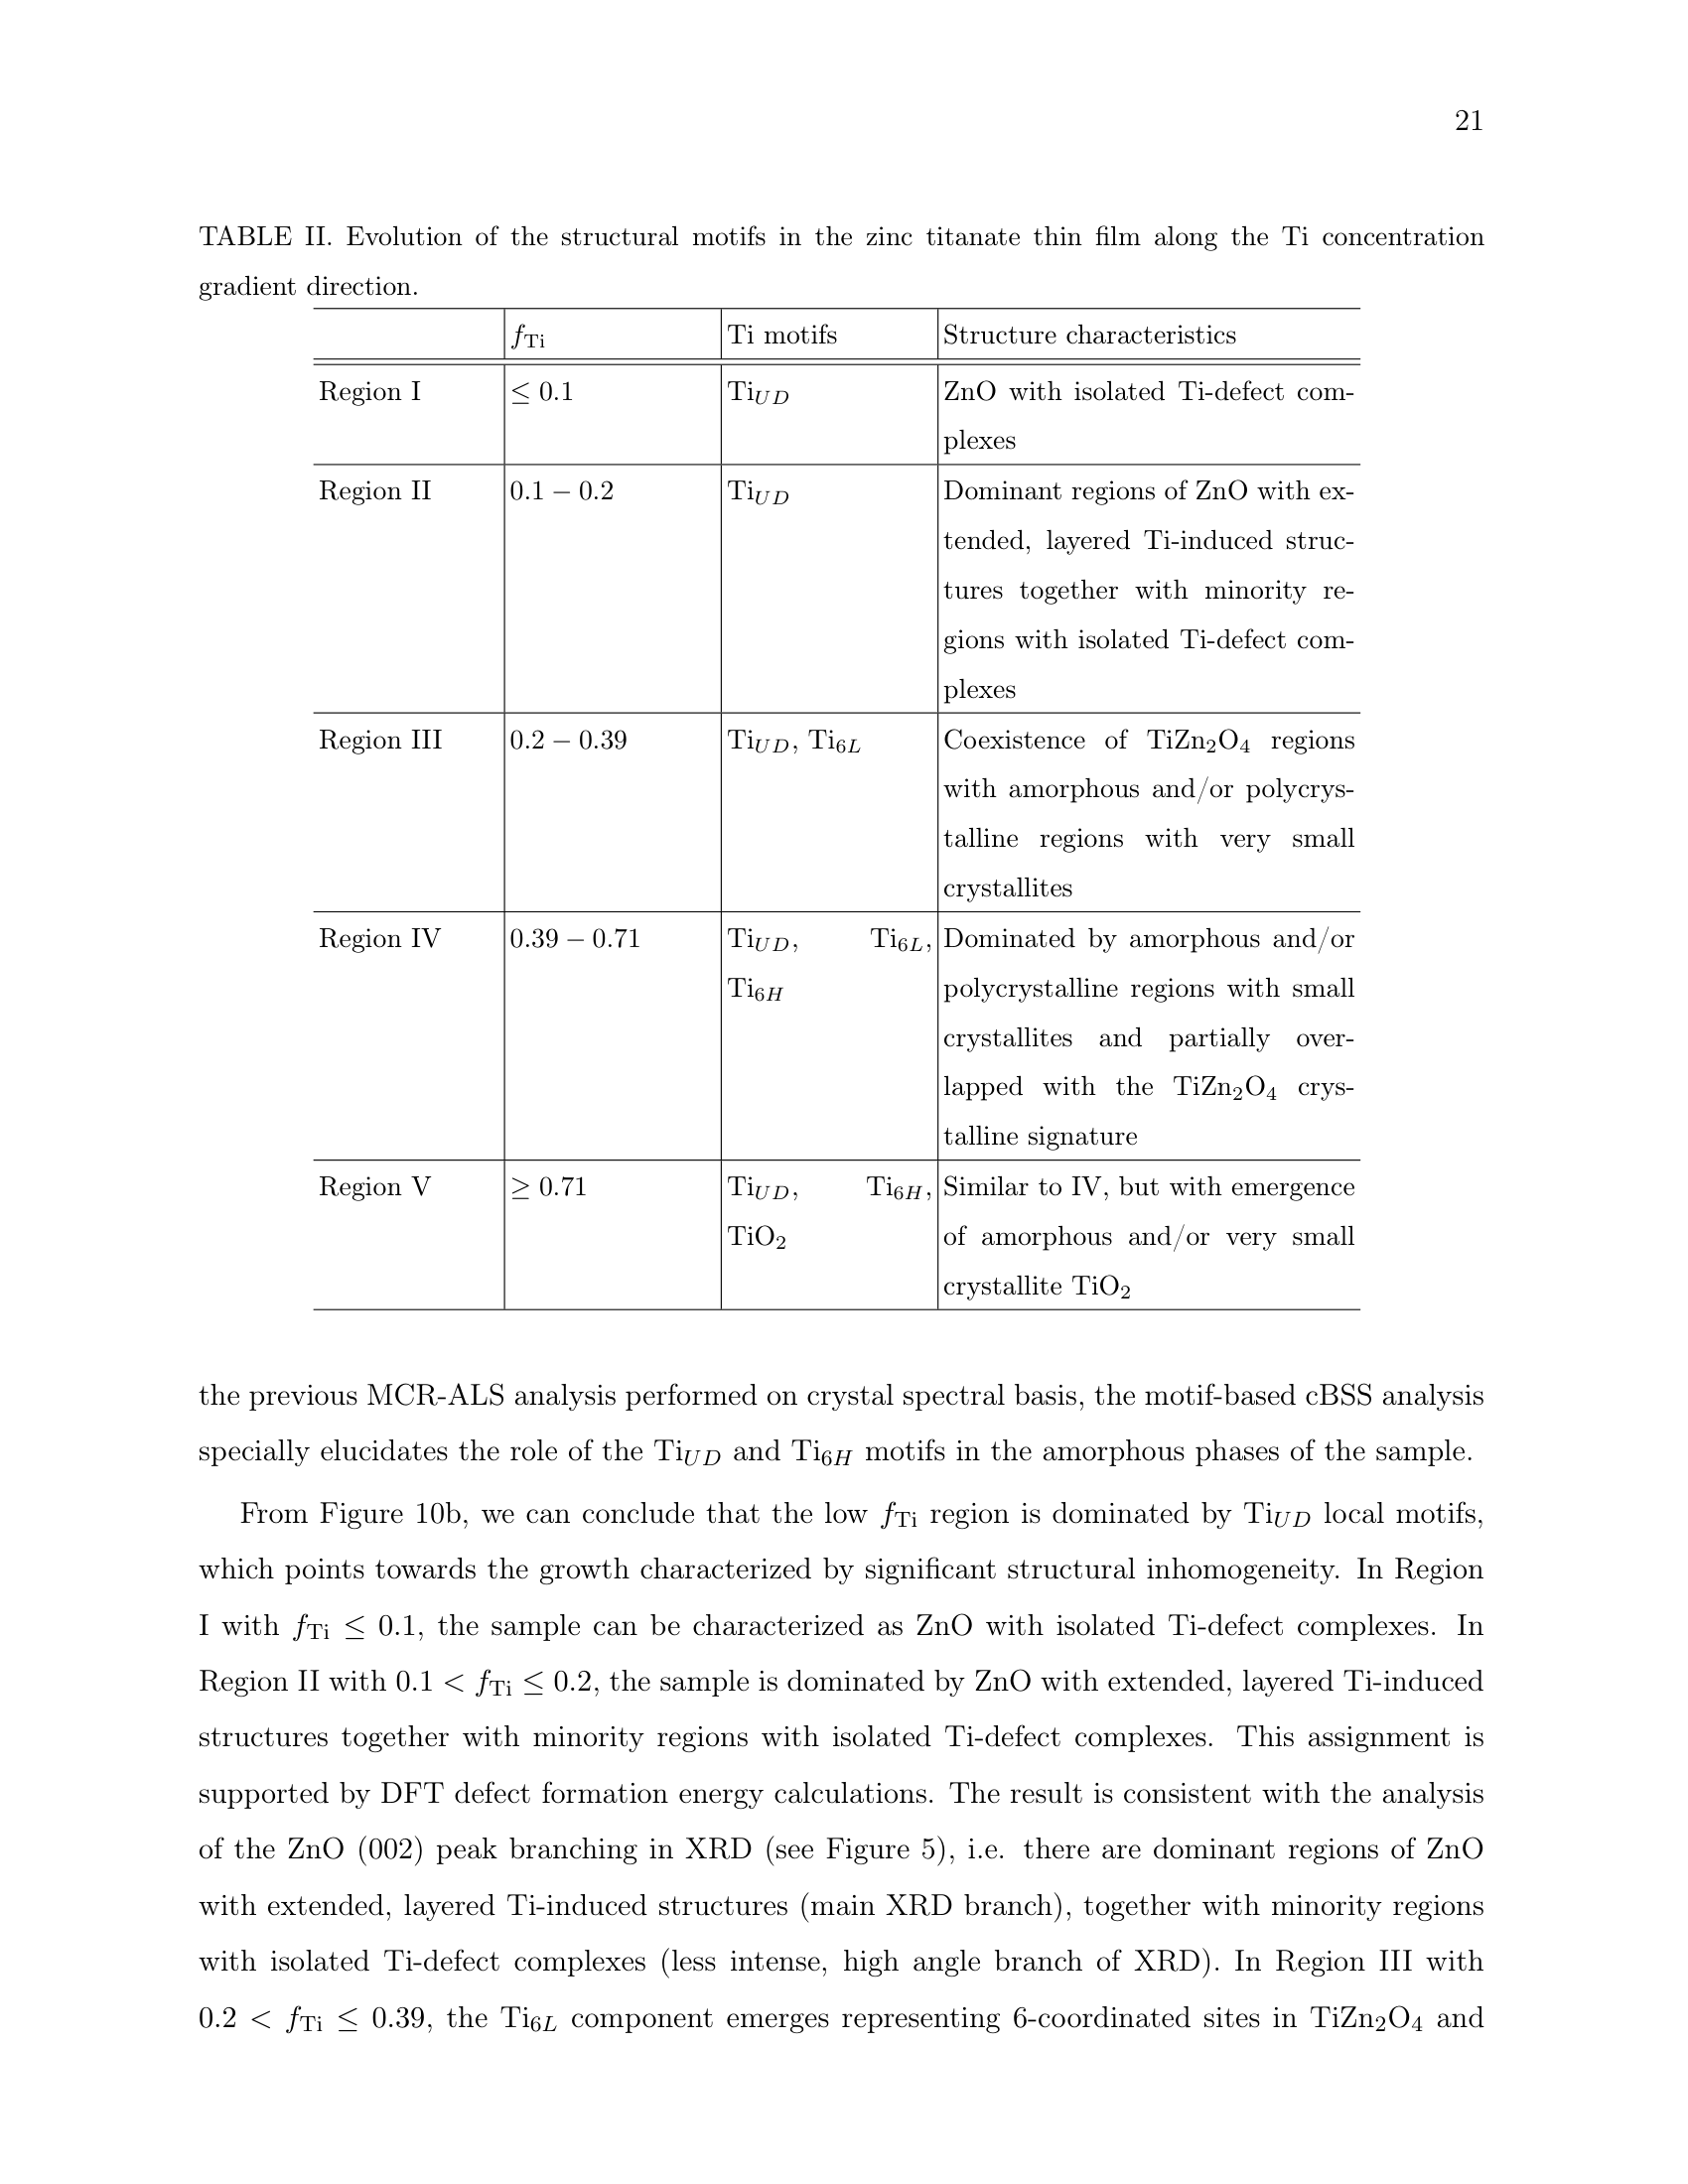
Page 21 (PDF page 21)
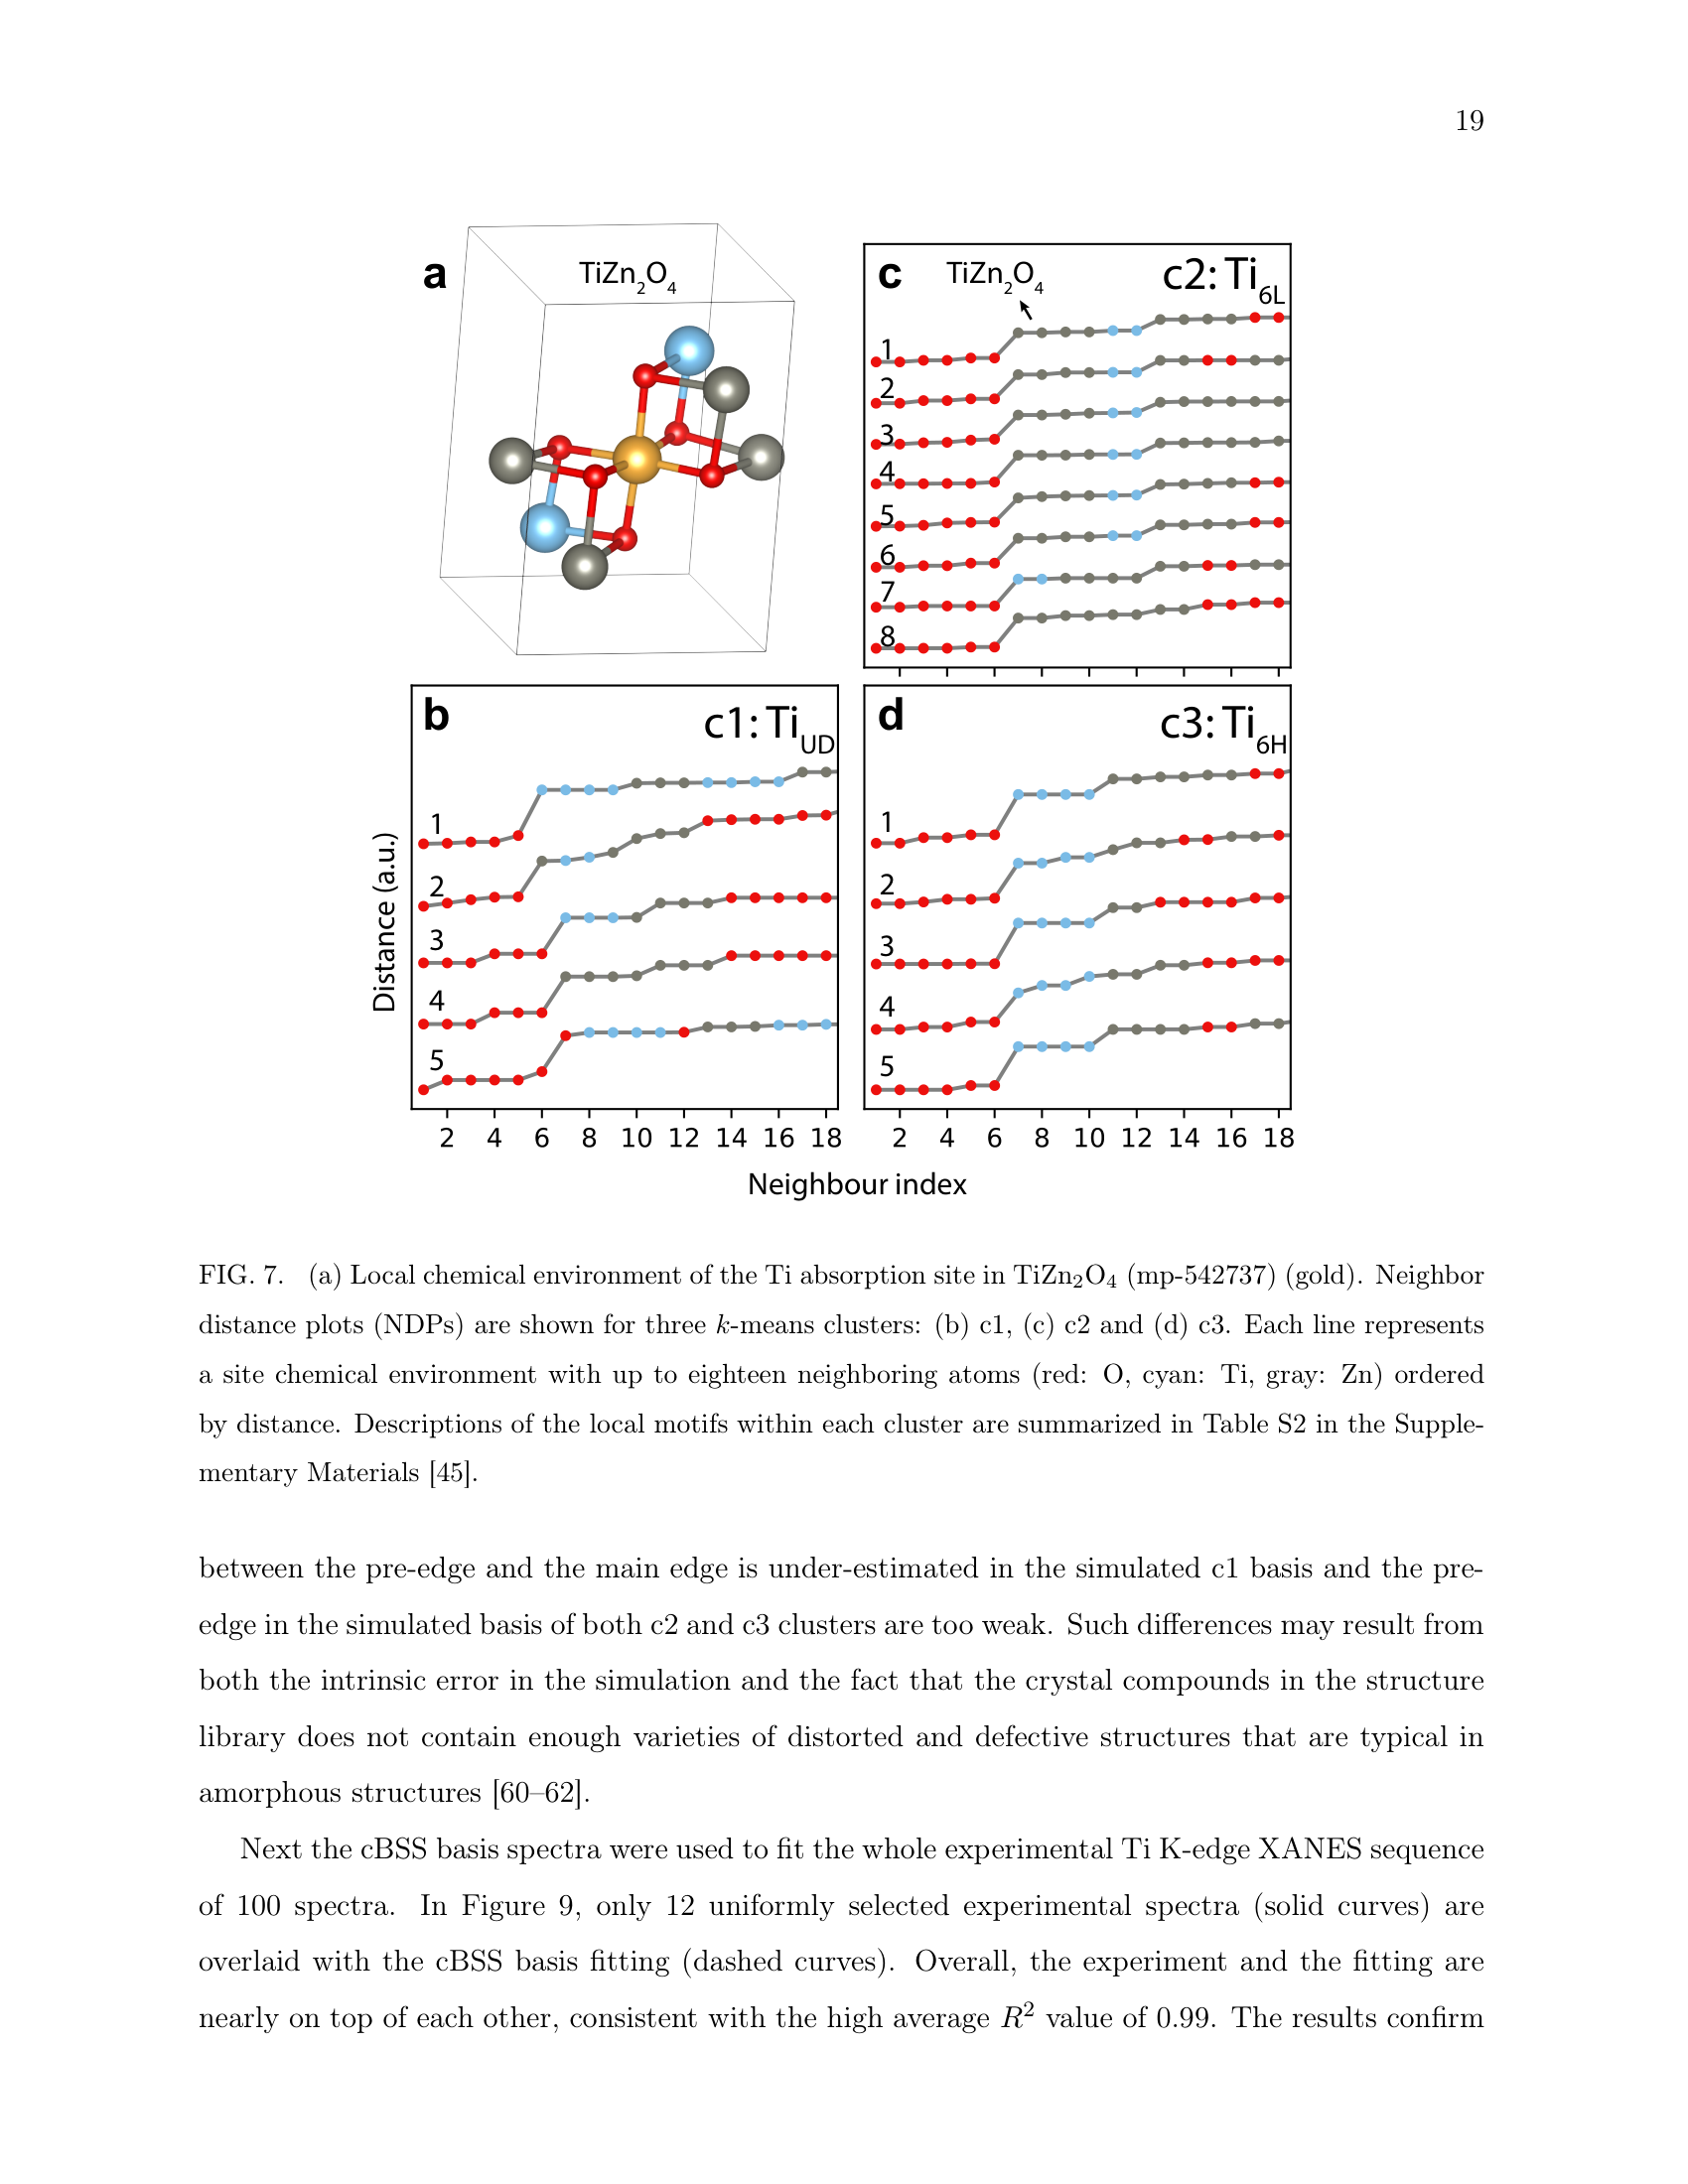
#43
Ti-Zn oxide on fused silica
Ti K-edge
▶
LLM Prompt
Sample Information
Material: Ti-Zn oxide on fused silica
Deposition Method: Pulsed laser deposition (PLD)
Substrate: Fused silica (JGS2)
Film Thickness Nm: 100
Composition Variable: Ti fraction (fTi)
Composition Value: 0.1
Sample-Specific Conditions
- Ti fraction: 0.1
- Combinatorial Ti-Zn oxide thin film at Ti fraction 0.1, Ti K-edge analysis
Preparation
- The combinatorial ZnO-TiO2 film was grown on a fused silica substrate via pulsed laser deposition (PLD) using a KrF excimer laser (248 nm). Zinc oxide and titanium oxide targets were ablated alternatively for 250 cycles under 10 mTorr oxygen ambient with the substrate heated to 600 °C.
Measurement
We plan to measure the Ti K-edge XANES spectrum of this sample.
Questions
Based on all the information above:
1. Identify the specific local structural motifs used as basis functions to model the Ti K-edge XANES spectra across this combinatorial film. Which of these motifs accounts for the entirety of the Ti speciation at fTi = 0.1?
2. Describe the physical state and local structural environment of the Ti atoms in the film at fTi = 0.1. What host matrix dominates the film, and how do the Ti atoms incorporate into it?
3. Based on the structural environment of Ti at fTi = 0.1, why would a standard linear combination fitting (LCF) approach relying solely on known crystalline zinc titanate reference spectra fail to accurately model this specific sample?
Ground Truth
Material: Ti-Zn oxide thin film
Measurement: Ti K-edge XANES
Fit method: cBSS (cluster blind-signal-separation)
Phase fractions: (±10%)
| Phase | Fraction |
|---|---|
| TiUD | 1.0 |
Fit basis (paper's reference spectra):
- TiUD (under-coordinated or distorted 6-coordinated Ti)
- Ti6L (6-coordinated Ti with low Ti fraction in the second shell)
- Ti6H (6-coordinated Ti with high Ti fraction in the second shell)
- TiO2 reference spectrum
Source evidence: Figure 10b and Table II
Key reasoning: At fTi = 0.1 (Region I), the sample is dominated by the wurtzite ZnO phase. The Ti atoms incorporate as isolated Ti-defect complexes within this ZnO matrix rather than forming distinct crystalline zinc titanate phases. Because the Ti exists as defects rather than a bulk crystal phase, standard crystalline zinc titanate references are insufficient. These isolated defects correspond exclusively to the TiUD motif, which represents under-coordinated or distorted 6-coordinated Ti sites.
Reasoning source: Section IV.B (Local structural motif evolution based on the cBSS weight profile), Table II, and Figure 10b
Scoring Rubric (total: 100 pts)
| Q | Type | Max | Question | Reference Answer | Scoring Criteria |
|---|---|---|---|---|---|
| q1 | identification | 30 | Identify the specific local structural motifs used as basis functions to model the Ti K-edge XANES spectra across this combinatorial film. Which of these motifs accounts for the entirety of the Ti speciation at fTi = 0.1? | The basis functions used to model the Ti K-edge XANES spectra via cluster blind-signal-separation (cBSS) include TiUD (under-coordinated or distorted 6-coordinated Ti), Ti6L (6-coordinated Ti with low Ti fraction in the second shell), Ti6H (6-coordinated Ti with high Ti fraction in the second shell), and a TiO2 reference spectrum. At a Ti fraction of fTi = 0.1, the TiUD motif accounts for 1.0 (100%) of the Ti speciation. This specific fraction arises because, at this low Ti concentration deposited at 600 °C via PLD, the film is dominated by the wurtzite ZnO phase. Rather than forming distinct crystalline phases, the Ti atoms incorporate as isolated Ti-defect complexes within the ZnO matrix, which correspond exclusively to the distorted TiUD motif. | Full points if the answer lists the TiUD, Ti6L, Ti6H, and TiO2 motifs/references and correctly identifies that TiUD is the sole phase/motif present at fTi = 0.1. |
| q2 | reasoning | 40 | Describe the physical state and local structural environment of the Ti atoms in the film at fTi = 0.1. What host matrix dominates the film, and how do the Ti atoms incorporate into it? | At a Ti fraction of fTi = 0.1, the combinatorial Ti-Zn oxide thin film is dominated by a wurtzite ZnO host matrix. The Ti atoms incorporate into this matrix as isolated Ti-defect complexes rather than forming distinct crystalline zinc titanate phases. This physical state occurs because the low Ti concentration (fTi = 0.1) deposited under 10 mTorr oxygen at 600 °C prevents the formation of bulk titanium crystal phases. Consequently, the local structural environment of the Ti atoms is entirely composed of under-coordinated or distorted 6-coordinated Ti sites, modeled as the TiUD motif. | Full points if the answer explains that the film is dominated by a wurtzite ZnO host matrix and that the Ti atoms are incorporated as isolated Ti-defect complexes (under-coordinated or distorted 6-coordinated sites). |
| q3 | reasoning | 30 | Based on the structural environment of Ti at fTi = 0.1, why would a standard linear combination fitting (LCF) approach relying solely on known crystalline zinc titanate reference spectra fail to accurately model this specific sample? | A standard linear combination fitting (LCF) approach relying solely on known crystalline zinc titanate reference spectra would fail because the Ti atoms in this sample do not exist in a bulk crystalline phase. Given the sample conditions of a low Ti fraction (fTi = 0.1) deposited at 600 °C, the film is dominated by a wurtzite ZnO matrix. Within this matrix, the Ti atoms incorporate exclusively as isolated Ti-defect complexes rather than forming distinct crystalline zinc titanates. Because these isolated defects lack the long-range order of bulk crystals, standard crystalline references are insufficient to accurately model the unique under-coordinated or distorted 6-coordinated Ti sites (the TiUD motif) present in the film. | Full points if the answer notes that at this low concentration, Ti forms isolated defect complexes in ZnO rather than distinct crystalline zinc titanate phases, meaning standard bulk crystal references lack the specific distorted/under-coordinated local motifs present in the sample. |
Review
#44
Ti-Zn oxide on fused silica
Ti K-edge
▶
LLM Prompt
Sample Information
Material: Ti-Zn oxide on fused silica
Deposition Method: pulsed laser deposition (PLD)
Substrate: fused silica (JGS2)
Film Thickness Nm: 100
Composition Variable: Ti fraction (fTi)
Composition Value: 0.2
Sample-Specific Conditions
- Ti fraction: 0.2
- Combinatorial Ti-Zn oxide thin film at Ti fraction 0.2, Ti K-edge analysis
Preparation
- The combinatorial ZnO-TiO2 film was grown on a fused silica substrate via pulsed laser deposition (PLD) using a KrF excimer laser. Zinc oxide and titanium oxide targets were ablated alternatively under 10 mTorr oxygen ambient with the substrate heated to 600 °C. A total of 250 cycles were executed to achieve thorough mixing and a total thickness of about 100 nm.
Measurement
We plan to measure the Ti K-edge XANES spectrum of this sample.
Questions
Based on all the information above:
1. What local structural motifs or reference basis functions should be considered when fitting the Ti K-edge XANES spectrum of this combinatorial Ti-Zn oxide film at a Ti fraction of 0.2?
2. Based on the sample conditions (fTi = 0.2), estimate the relative fractions of the dominant local Ti structural motifs present in the film.
3. Explain the physical and structural reasons why these specific local motifs dominate at a Ti fraction of 0.2, referencing the phase evolution of the Ti-Zn oxide system.
4. At this specific composition (fTi = 0.2), the material is undergoing a structural transition. Describe this transition in terms of the macroscopic phase coexistence.
Ground Truth
Material: Ti-Zn oxide thin film
Measurement: Ti K-edge XANES
Fit method: cBSS (cluster blind-signal-separation)
Phase fractions: (±10%)
| Phase | Fraction |
|---|---|
| TiUD | 0.8 |
| Ti6L | 0.2 |
Fit basis (paper's reference spectra):
- TiUD (under-coordinated or distorted 6-coordinated Ti)
- Ti6L (6-coordinated Ti with low Ti fraction in the second shell)
- Ti6H (6-coordinated Ti with high Ti fraction in the second shell)
- TiO2 reference spectrum
Source evidence: Figure 10b and Table II
Key reasoning: At fTi = 0.2, the film is at the boundary between Region II and Region III of its phase evolution. The structure is heavily dominated by energetically favorable layered TiZn+Oi defects, which correspond to the under-coordinated/distorted TiUD motif. At this specific concentration, the Ti6L motif begins to emerge, representing 6-coordinated Ti sites typical of spinel TiZn2O4. This marks the transition from a defect-dominated ZnO matrix to the coexistence of amorphous/defective regions with very small TiZn2O4 crystallites.
Reasoning source: Section IV.B (Local structural motif evolution based on the cBSS weight profile), Page 21-23
Scoring Rubric (total: 100 pts)
| Q | Type | Max | Question | Reference Answer | Scoring Criteria |
|---|---|---|---|---|---|
| q1 | identification | 20 | What local structural motifs or reference basis functions should be considered when fitting the Ti K-edge XANES spectrum of this combinatorial Ti-Zn oxide film at a Ti fraction of 0.2? | When fitting the Ti K-edge XANES spectrum using cluster blind-signal-separation (cBSS), the relevant basis functions include TiUD (under-coordinated or distorted 6-coordinated Ti), Ti6L (6-coordinated Ti with low Ti fraction in the second shell), Ti6H (6-coordinated Ti with high Ti fraction in the second shell), and a TiO2 reference spectrum. For this specific sample grown by PLD at 600 °C with a Ti fraction of 0.2, the film sits at the boundary between Region II and Region III of its phase evolution. Because of this specific composition, the structure is heavily dominated by energetically favorable layered TiZn+Oi defects, which correspond to the TiUD motif. Additionally, the Ti6L motif must be considered because, at fTi = 0.2, small spinel TiZn2O4 crystallites begin to emerge from the defect-dominated ZnO matrix. | Full credit for identifying the under-coordinated/distorted Ti motif (TiUD / defects) and the emerging 6-coordinated Ti motif with low Ti second shell (Ti6L / TiZn2O4-like). Partial credit for mentioning generic Ti-Zn-O crystalline phases without specifying the defect/distorted nature of the dominant component. |
| q2 | quantification | 30 | Based on the sample conditions (fTi = 0.2), estimate the relative fractions of the dominant local Ti structural motifs present in the film. | At a Ti fraction of 0.2, the relative fractions of the dominant local Ti structural motifs are approximately 0.8 for TiUD and 0.2 for Ti6L, with an uncertainty of about 10%. These specific values result from the film's composition placing it at the boundary between Region II and Region III of its phase evolution. At this 0.2 Ti concentration, the majority of the film (80%) consists of energetically favorable layered TiZn+Oi defects within the ZnO matrix, yielding the high TiUD fraction. The remaining 20% corresponds to the Ti6L motif, which appears exactly at this composition because the material is just beginning to form very small spinel TiZn2O4 crystallites. | Full credit for estimating approximately 80% TiUD (distorted/defect motif) and 20% Ti6L (TiZn2O4-like motif). Deduct points if the estimate deviates by more than 15% or if incorrect phases (like TiO2 or Ti6H) are assigned significant weight. |
| q3 | reasoning | 30 | Explain the physical and structural reasons why these specific local motifs dominate at a Ti fraction of 0.2, referencing the phase evolution of the Ti-Zn oxide system. | At a Ti fraction of 0.2, the Ti-Zn oxide film grown at 600 °C is positioned at the boundary between Region II and Region III of its phase evolution. The dominant TiUD motif (80%) arises because the system heavily favors the formation of layered TiZn+Oi defects within the ZnO matrix at this concentration. Meanwhile, the emergence of the Ti6L motif (20%) occurs because the local Ti concentration becomes just high enough to initiate the formation of 6-coordinated Ti sites typical of spinel TiZn2O4. Consequently, this specific composition drives a structural transition from a purely defect-dominated ZnO matrix to one that supports the nucleation of these small spinel crystallites. | Full credit for explaining that the system is dominated by energetically favorable layered TiZn+Oi defects (TiUD) in a ZnO matrix, and that fTi = 0.2 marks the onset/emergence of 6-coordinated Ti sites (Ti6L) corresponding to the formation of small TiZn2O4 crystallites. |
| q4 | reasoning | 20 | At this specific composition (fTi = 0.2), the material is undergoing a structural transition. Describe this transition in terms of the macroscopic phase coexistence. | At a Ti fraction of 0.2, the PLD-grown Ti-Zn oxide film undergoes a structural transition marking the boundary between Region II and Region III of its phase evolution. Because the Ti concentration reaches this critical 0.2 threshold, the macroscopic phase transitions from a purely defect-dominated ZnO matrix into a mixed-phase state. This coexistence is driven by the continued presence of amorphous or defective regions containing layered TiZn+Oi defects (TiUD motif) alongside the newly emerging, very small TiZn2O4 spinel crystallites (Ti6L motif). Therefore, the specific sample conditions dictate a dual-phase macroscopic structure where energetically favorable defects and nascent spinel domains coexist. | Full credit for describing the transition from a regime of ZnO with extended layered Ti-induced structures (Region II) to a regime where these amorphous/defective regions coexist with emerging TiZn2O4 regions (Region III). |
Review
#45
Ti-Zn oxide on fused silica
Ti K-edge
▶
LLM Prompt
Sample Information
Material: Ti-Zn oxide on fused silica
Deposition Method: pulsed laser deposition (PLD)
Substrate: fused silica (JGS2)
Film Thickness Nm: 100
Composition Variable: Ti fraction (fTi)
Composition Value: 0.3
Sample-Specific Conditions
- Ti fraction: 0.3
- Combinatorial Ti-Zn oxide thin film at Ti fraction 0.3, Ti K-edge analysis
Preparation
- Combinatorial ZnO-TiO2 film grown on a fused silica substrate via pulsed laser deposition (PLD) using a KrF excimer laser (248 nm). Zinc oxide and titanium oxide targets were ablated alternatively for 250 cycles under 10 mTorr oxygen ambient with the substrate heated to 600 °C.
Measurement
We plan to measure the Ti K-edge XANES spectrum of this sample.
Questions
Based on all the information above:
1. What candidate local structural motifs or reference spectra are needed to model the Ti K-edge XANES of this combinatorial Ti-Zn oxide film at a Ti fraction of 0.3?
2. Based on the sample conditions (Ti fraction = 0.3), estimate the relative fractions of the dominant local structural motifs present in the film.
3. Explain the physical reasoning for the coexistence of these specific structural motifs at this Ti fraction, rather than the formation of pure crystalline line compounds.
Ground Truth
Material: Ti-Zn oxide thin film
Measurement: Ti K-edge XANES
Fit method: cBSS (cluster blind-signal-separation)
Phase fractions: (±10%)
| Phase | Fraction |
|---|---|
| TiUD | 0.55 |
| Ti6L | 0.45 |
Fit basis (paper's reference spectra):
- TiUD (under-coordinated or distorted 6-coordinated Ti)
- Ti6L (6-coordinated Ti with low Ti fraction in the second shell)
- Ti6H (6-coordinated Ti with high Ti fraction in the second shell)
- TiO2 reference spectrum
Source evidence: Figure 10b and Table II
Key reasoning: At a Ti fraction of 0.3 (Region III, 0.2 < fTi <= 0.39), the film exhibits a coexistence of TiZn2O4-like regions and amorphous/polycrystalline regions with very small crystallites. The Ti6L motif emerges representing 6-coordinated sites in TiZn2O4 and TiZnO3, while the weight of the TiUD (under-coordinated/distorted) motifs from defects decays but remains dominant. The system does not reach perfect thermodynamics-driven phase separation under the synthesis conditions, resulting in a mixture of these local structural motifs rather than pure line compounds.
Reasoning source: Section IV.B: Local structural motif evolution based on the cBSS weight profile
Scoring Rubric (total: 100 pts)
| Q | Type | Max | Question | Reference Answer | Scoring Criteria |
|---|---|---|---|---|---|
| q1 | identification | 20 | What candidate local structural motifs or reference spectra are needed to model the Ti K-edge XANES of this combinatorial Ti-Zn oxide film at a Ti fraction of 0.3? | To model the Ti K-edge XANES of this film, the required basis components are TiUD (under-coordinated or distorted 6-coordinated Ti), Ti6L (6-coordinated Ti with low Ti fraction in the second shell), Ti6H (6-coordinated Ti with high Ti fraction in the second shell), and a TiO2 reference spectrum. These specific motifs are expected because, at a Ti fraction of 0.3, the film falls into a compositional region (0.2 < fTi <= 0.39) where perfect thermodynamics-driven phase separation is not achieved under the 600 °C PLD synthesis conditions. Instead of forming pure line compounds, the film consists of a mixture of TiZn2O4-like regions and amorphous/polycrystalline regions with very small crystallites. Consequently, the model must account for both the defect-driven under-coordinated sites (TiUD) and the 6-coordinated sites found in TiZn2O4 and TiZnO3 (Ti6L). | Full credit for identifying the need for an under-coordinated/distorted Ti motif (TiUD) and a 6-coordinated Ti motif with low Ti in the second shell (Ti6L / TiZn2O4-like). Partial credit for mentioning generic crystalline zinc titanate phases without specifying the local motif types. |
| q2 | quantification | 40 | Based on the sample conditions (Ti fraction = 0.3), estimate the relative fractions of the dominant local structural motifs present in the film. | At a Ti fraction of 0.3, the dominant local structural motifs are estimated to be 55% TiUD and 45% Ti6L, with an uncertainty of 10%. These specific fractions result from the PLD growth conditions at 600 °C, which provide insufficient thermodynamic driving force to fully crystallize the material into pure line compounds. At this exact composition, the weight of the defect-related TiUD motif decays compared to lower Ti fractions but remains dominant (55%) due to the persistence of amorphous or very small polycrystalline regions. Simultaneously, the Ti6L fraction reaches 45% as 6-coordinated sites associated with newly forming TiZn2O4 and TiZnO3 structures emerge and coexist within the film. | Full credit if the estimated fractions are within +/- 10% of TiUD = 0.55 and Ti6L = 0.45. Partial credit if the correct motifs are identified as dominant but the fractions are off by up to 20%. |
| q3 | reasoning | 40 | Explain the physical reasoning for the coexistence of these specific structural motifs at this Ti fraction, rather than the formation of pure crystalline line compounds. | The coexistence of TiUD and Ti6L motifs at a Ti fraction of 0.3 occurs because the PLD synthesis conditions (600 °C substrate temperature, 10 mTorr O2) prevent the system from reaching perfect thermodynamics-driven phase separation. Rather than forming pure crystalline line compounds, the film develops a kinetically limited mixture of TiZn2O4-like regions and amorphous or polycrystalline regions containing very small crystallites. The Ti6L motif emerges specifically to represent the 6-coordinated Ti sites within the forming TiZn2O4 and TiZnO3 structures. Meanwhile, the TiUD motif remains dominant because this incomplete crystallization leaves a significant population of under-coordinated or distorted 6-coordinated Ti defect sites throughout the material. | Full credit for explaining that the system does not reach perfect thermodynamics-driven phase separation, leading to a coexistence of TiZn2O4-like regions (Ti6L) with amorphous/defective regions containing under-coordinated/distorted Ti sites (TiUD). |
Review
#46
Ti-Zn oxide on fused silica
Ti K-edge
▶
LLM Prompt
Sample Information
Material: Ti-Zn oxide on fused silica
Deposition Method: Pulsed laser deposition (PLD)
Substrate: Fused silica (JGS2)
Film Thickness Nm: 100
Composition Variable: Ti fraction (fTi)
Composition Value: 0.4
Sample-Specific Conditions
- Ti fraction: 0.4
- Combinatorial Ti-Zn oxide thin film at Ti fraction 0.4, Ti K-edge analysis
Preparation
- Combinatorial ZnO-TiO2 film grown on a fused silica substrate via pulsed laser deposition (PLD) with a KrF excimer laser. Zinc oxide and titanium oxide targets were ablated alternatively under 10 mTorr oxygen ambient for 250 cycles.
Measurement
We plan to measure the Ti K-edge XANES spectrum of this sample.
Questions
Based on all the information above:
1. What candidate local structural motifs (reference spectra) are needed to model the Ti K-edge XANES of this Ti-Zn oxide film at a Ti fraction of 0.4?
2. Estimate the relative fractions of these structural motifs at fTi = 0.4.
Ground Truth
Material: Combinatorial Ti-Zn oxide thin film
Measurement: Ti K-edge XANES
Fit method: cBSS (cluster blind-signal-separation)
Phase fractions: (±15%)
| Phase | Fraction |
|---|---|
| TiUD | 0.45 |
| Ti6L | 0.45 |
| Ti6H | 0.1 |
Fit basis (paper's reference spectra):
- TiUD (under-coordinated or distorted 6-coordinated Ti)
- Ti6L (6-coordinated Ti with low Ti fraction in the second shell)
- Ti6H (6-coordinated Ti with high Ti fraction in the second shell)
- TiO2 reference spectrum
Source evidence: Figure 10b and Table II (Region IV)
Key reasoning: At fTi = 0.4, the sample enters Region IV (0.39 < fTi < 0.71), which is dominated by amorphous and/or polycrystalline regions with small crystallites. The Ti6L motif (TiZn2O4-like) is near its maximum but begins to decrease, while the Ti6H motif (Ti3Zn2O8-like) emerges as the network of Ti octahedra becomes more connected. The TiUD motif (under-coordinated/distorted Ti) maintains a high weight (~45-50%), indicating significant structural inhomogeneity and a departure from the thermodynamic phase law (which would dictate perfect phase separation into line compounds).
Reasoning source: Section IV.B (Local structural motif evolution based on the cBSS weight profile) and Table II
Scoring Rubric (total: 100 pts)
| Q | Type | Max | Question | Reference Answer | Scoring Criteria |
|---|---|---|---|---|---|
| q1 | identification | 50 | What candidate local structural motifs (reference spectra) are needed to model the Ti K-edge XANES of this Ti-Zn oxide film at a Ti fraction of 0.4? | To model the Ti K-edge XANES of this combinatorial Ti-Zn oxide film via cluster blind-signal-separation (cBSS), the required local structural motifs are TiUD (under-coordinated or distorted 6-coordinated Ti), Ti6L (6-coordinated Ti with low Ti fraction in the second shell), Ti6H (6-coordinated Ti with high Ti fraction in the second shell), and a TiO2 reference spectrum. These specific motifs are expected because at a Ti fraction of 0.4, the PLD-grown film enters a composition regime (Region IV) dominated by amorphous and polycrystalline regions with small crystallites. The Ti6L motif accounts for TiZn2O4-like environments, while the Ti6H motif is needed because the network of Ti octahedra begins to connect, forming Ti3Zn2O8-like structures. Furthermore, the TiUD motif is necessary because the film's growth conditions cause significant structural inhomogeneity and a departure from the thermodynamic phase law, resulting in distorted Ti sites rather than perfect phase separation. | Full credit for identifying the three key motifs: under-coordinated/distorted Ti (TiUD), 6-coordinated Ti with low Ti in the second shell (Ti6L / TiZn2O4-like), and 6-coordinated Ti with high Ti in the second shell (Ti6H / Ti3Zn2O8-like). |
| q2 | quantification | 50 | Estimate the relative fractions of these structural motifs at fTi = 0.4. | At a Ti fraction of 0.4, the estimated relative fractions of the structural motifs are 0.45 for TiUD, 0.45 for Ti6L, and 0.10 for Ti6H, with an uncertainty of 15%. These specific values arise because the sample composition places it in Region IV (0.39 < fTi < 0.71), where the Ti6L (TiZn2O4-like) motif is near its maximum but beginning to decrease. The 0.10 fraction of Ti6H reflects the initial emergence of Ti3Zn2O8-like structures as the network of Ti octahedra becomes more connected. The high 0.45 fraction of the TiUD motif persists because the PLD deposition results in significant structural inhomogeneity, preventing perfect phase separation into line compounds and maintaining a large population of under-coordinated or distorted Ti environments. | Full credit if the estimated fractions are within the uncertainty bounds (TiUD ~45%, Ti6L ~45%, Ti6H ~10%). Partial credit if the dominant phases (TiUD and Ti6L) are correctly identified as roughly equal, with Ti6H as a minor emerging component. |
Review
#47
Ti-Zn oxide on fused silica
Ti K-edge
▶
LLM Prompt
Sample Information
Material: Ti-Zn oxide on fused silica
Deposition Method: pulsed laser deposition (PLD)
Substrate: fused silica (JGS2)
Film Thickness Nm: 100
Composition Variable: Ti fraction (fTi)
Composition Value: 0.5
Sample-Specific Conditions
- Ti fraction: 0.5
- Combinatorial Ti-Zn oxide thin film at Ti fraction 0.5, Ti K-edge analysis
Preparation
- Combinatorial ZnO-TiO2 film grown on a fused silica substrate via pulsed laser deposition (PLD) with a KrF excimer laser (248 nm). The chamber was pumped to a base pressure of 10^-7 Torr, the substrate was heated to 600 °C, and deposition was performed under 10 mTorr oxygen ambient using alternating zinc oxide and titanium oxide targets for 250 cycles.
Measurement
We plan to measure the Ti K-edge XANES spectrum of this sample.
Questions
Based on all the information above:
1. Identify the specific local structural motifs (basis components) required to model the Ti K-edge XANES spectrum of the combinatorial Ti-Zn oxide thin film at a Ti fraction of 0.5.
2. Based on the sample composition (Ti fraction = 0.5), estimate the relative fractions of the different Ti local structural motifs present in the film.
3. Discuss the physical and structural reasons for the observed mixture of Ti motifs at this composition (fTi = 0.5). What does the dominant motif indicate about the film's crystallinity, and what does the presence of the other motifs suggest about the Ti network?
Ground Truth
Material: Ti-Zn oxide thin film
Measurement: Ti K-edge XANES
Fit method: cBSS (cluster blind-signal-separation)
Phase fractions: (±10%)
| Phase | Fraction |
|---|---|
| TiUD | 0.55 |
| Ti6L | 0.25 |
| Ti6H | 0.2 |
Fit basis (paper's reference spectra):
- TiUD (under-coordinated or distorted 6-coordinated Ti)
- Ti6L (6-coordinated Ti with low Ti fraction in the second shell)
- Ti6H (6-coordinated Ti with high Ti fraction in the second shell)
- TiO2 reference spectrum
Source evidence: Figure 10b and Table II
Key reasoning: At a Ti fraction of 0.5, the film is in Region IV (0.39 < fTi < 0.71), which is dominated by amorphous and/or polycrystalline regions with small crystallites. The TiUD motif remains dominant (~55%), reflecting a high degree of under-coordinated and distorted Ti sites characteristic of the amorphous phase. The Ti6L motif (~25%) corresponds to edge-sharing 1D chains of Ti octahedra (similar to TiZn2O4), while the emergence of the Ti6H motif (~20%) indicates a more connected network of Ti octahedra (similar to Ti3Zn2O8) as the Ti concentration increases. The coexistence of these motifs departs from the standard phase law, indicating the system does not reach perfect thermodynamics-driven phase separation.
Reasoning source: Section IV.B (Local structural motif evolution based on the cBSS weight profile) and Table II
Scoring Rubric (total: 100 pts)
| Q | Type | Max | Question | Reference Answer | Scoring Criteria |
|---|---|---|---|---|---|
| q1 | identification | 20 | Identify the specific local structural motifs (basis components) required to model the Ti K-edge XANES spectrum of the combinatorial Ti-Zn oxide thin film at a Ti fraction of 0.5. | To model the Ti K-edge XANES spectrum of this sample, the required basis components are TiUD (under-coordinated or distorted 6-coordinated Ti), Ti6L (6-coordinated Ti with low Ti fraction in the second shell), and Ti6H (6-coordinated Ti with high Ti fraction in the second shell). These specific motifs are expected because at a Ti fraction of 0.5, the PLD-grown film falls into a composition region (0.39 < fTi < 0.71) dominated by amorphous and polycrystalline domains with small crystallites. The TiUD motif accounts for the highly distorted sites characteristic of the amorphous phase. Meanwhile, the Ti6L and Ti6H motifs emerge because the equiatomic Ti concentration drives the formation of both edge-sharing 1D chains of Ti octahedra (similar to TiZn2O4) and a more connected network of Ti octahedra (similar to Ti3Zn2O8), respectively. | Full credit requires identifying the three main motifs: under-coordinated/distorted Ti (TiUD), 6-coordinated Ti with low Ti in the second shell (Ti6L), and 6-coordinated Ti with high Ti in the second shell (Ti6H). |
| q2 | quantification | 30 | Based on the sample composition (Ti fraction = 0.5), estimate the relative fractions of the different Ti local structural motifs present in the film. | At a Ti fraction of 0.5, the estimated relative fractions of the local structural motifs are 0.55 for TiUD, 0.25 for Ti6L, and 0.20 for Ti6H. These specific values result from the film's composition placing it in a region characterized by imperfect thermodynamics-driven phase separation, where multiple structural motifs coexist contrary to the standard phase law. The dominant 55% fraction of TiUD reflects the large proportion of amorphous material containing under-coordinated and distorted Ti sites. The 25% Ti6L and 20% Ti6H fractions arise because the 0.5 Ti concentration promotes a mixture of edge-sharing 1D chains of Ti octahedra and a more highly connected Ti octahedral network. | Full credit requires estimating the fractions within ±10% of the ground truth: ~55% for TiUD, ~25% for Ti6L, and ~20% for Ti6H. |
| q3 | reasoning | 50 | Discuss the physical and structural reasons for the observed mixture of Ti motifs at this composition (fTi = 0.5). What does the dominant motif indicate about the film's crystallinity, and what does the presence of the other motifs suggest about the Ti network? | The observed mixture of Ti motifs at a Ti fraction of 0.5 occurs because the PLD-grown film does not reach perfect thermodynamics-driven phase separation, resulting in a complex coexistence of phases that departs from the standard phase law. The dominant TiUD motif (~55%) indicates that the film is largely amorphous or consists of very small crystallites, which inherently possess a high degree of under-coordinated and distorted Ti sites. The presence of the Ti6L motif (~25%) suggests the formation of edge-sharing 1D chains of Ti octahedra within the network, similar to a TiZn2O4-like structure. Furthermore, the emergence of the Ti6H motif (~20%) indicates that as the Ti concentration reaches 0.5, the Ti network becomes more connected, forming structures similar to Ti3Zn2O8. | Full credit requires explaining that the dominance of TiUD indicates an amorphous/polycrystalline nature with structural inhomogeneity. The response must also explain that Ti6L represents isolated 1D chains of Ti octahedra, while Ti6H represents a more connected Ti octahedral network that forms as Ti concentration increases. Finally, it should note that this mixture indicates a departure from perfect thermodynamics-driven phase separation. |
Review
#48
Ti-Zn oxide on fused silica
Ti K-edge
▶
LLM Prompt
Sample Information
Material: Ti-Zn oxide on fused silica
Deposition Method: pulsed laser deposition (PLD)
Substrate: fused silica (JGS2)
Film Thickness Nm: 100
Composition Variable: Ti fraction (fTi)
Composition Value: 0.6
Sample-Specific Conditions
- Ti fraction: 0.6
- Combinatorial Ti-Zn oxide thin film at Ti fraction 0.6, Ti K-edge analysis
Preparation
- Combinatorial ZnO-TiO2 film grown via pulsed laser deposition (PLD) with a KrF excimer laser (248 nm). Zinc oxide and titanium oxide targets were ablated alternatively for 250 cycles under 10 mTorr oxygen ambient with the substrate heated to 600 °C.
Measurement
We plan to measure the Ti K-edge XANES spectrum of this sample.
Questions
Based on all the information above:
1. What candidate local structural motifs or reference spectra are needed to adequately model the Ti K-edge XANES of this combinatorial Ti-Zn oxide film at a Ti fraction of 0.6?
Ground Truth
Material: Ti-Zn oxide thin film
Measurement: Ti K-edge XANES
Fit method: cBSS (cluster blind-signal-separation)
Phase fractions: (±10%)
| Phase | Fraction |
|---|---|
| TiUD | 0.6 |
| Ti6L | 0.05 |
| Ti6H | 0.35 |
Fit basis (paper's reference spectra):
- TiUD (under-coordinated or distorted 6-coordinated Ti)
- Ti6L (6-coordinated Ti with low Ti fraction in the second shell)
- Ti6H (6-coordinated Ti with high Ti fraction in the second shell)
- TiO2 reference spectrum
Source evidence: Figure 10b and Table II (Region IV)
Key reasoning: At fTi = 0.6 (Region IV, 0.39 < fTi < 0.71), the sample is dominated by amorphous and/or polycrystalline regions with small crystallites. The Ti6H motif (representing 6-coordinated sites in a fully connected network like Ti3Zn2O8) grows significantly as the network of Ti octahedra becomes more connected. Conversely, the Ti6L motif (representing isolated 1D chains of Ti octahedra like in TiZn2O4) shrinks and nearly vanishes. The TiUD motif (under-coordinated/distorted Ti sites) remains dominant at ~60%, reflecting the highly amorphous and structurally inhomogeneous nature of the film at this composition.
Reasoning source: Section IV.B (Local structural motif evolution based on the cBSS weight profile) and Section IV.C
Scoring Rubric (total: 100 pts)
| Q | Type | Max | Question | Reference Answer | Scoring Criteria |
|---|---|---|---|---|---|
| q1 | identification | 100 | What candidate local structural motifs or reference spectra are needed to adequately model the Ti K-edge XANES of this combinatorial Ti-Zn oxide film at a Ti fraction of 0.6? | To adequately model the Ti K-edge XANES spectrum of this sample, the required basis components are TiUD (under-coordinated or distorted 6-coordinated Ti), Ti6L (6-coordinated Ti with low Ti fraction in the second shell), Ti6H (6-coordinated Ti with high Ti fraction in the second shell), and a TiO2 reference spectrum. These specific motifs are necessary because at a Ti fraction of 0.6, the PLD-grown film is dominated by amorphous and polycrystalline regions with small crystallites, making the TiUD motif essential to capture the highly structurally inhomogeneous nature of the material. Additionally, the Ti6H motif is required because the network of Ti octahedra becomes more fully connected (similar to Ti3Zn2O8) at this higher Ti concentration. Conversely, the Ti6L motif is needed to account for the remaining, though shrinking, isolated 1D chains of Ti octahedra (like in TiZn2O4) that nearly vanish at this composition. | Full credit for identifying the three main local motifs: under-coordinated/distorted Ti (TiUD), 6-coordinated Ti with low Ti in the second shell (Ti6L), and 6-coordinated Ti with high Ti in the second shell (Ti6H). Partial credit for mentioning generic amorphous/defective Ti and crystalline zinc titanate motifs. |
Review
#49
Ti-Zn oxide on fused silica
Ti K-edge
▶
LLM Prompt
Sample Information
Material: Ti-Zn oxide on fused silica
Deposition Method: Pulsed laser deposition (PLD)
Substrate: Fused silica (JGS2)
Film Thickness Nm: 70-120
Composition Variable: Ti fraction (fTi)
Composition Value: 0.7
Sample-Specific Conditions
- Ti fraction: 0.7
- Combinatorial Ti-Zn oxide thin film at Ti fraction 0.7, Ti K-edge analysis
Preparation
- Combinatorial ZnO-TiO2 film grown via pulsed laser deposition (PLD) using alternating ablation of ZnO and TiO2 targets. The chamber was pumped to a base pressure of 10^-7 Torr, substrate heated to 600 °C, and deposition performed under 10 mTorr oxygen ambient for 250 cycles.
Measurement
We plan to measure the Ti K-edge XANES spectrum of this sample.
Questions
Based on all the information above:
1. What candidate reference spectra or local structural motifs are needed to accurately model the Ti K-edge XANES of this combinatorial film at a Ti fraction of 0.7?
2. Estimate the relative phase fractions of the key structural motifs present in the sample at fTi = 0.7.
Ground Truth
Material: Ti-Zn oxide thin film
Measurement: Ti K-edge XANES
Fit method: cBSS (cluster blind-signal-separation)
Phase fractions: (±10%)
| Phase | Fraction |
|---|---|
| TiUD | 0.5 |
| Ti6H | 0.4 |
| TiO2 | 0.1 |
Fit basis (paper's reference spectra):
- TiUD (under-coordinated or distorted 6-coordinated Ti)
- Ti6L (6-coordinated Ti with low Ti fraction in the second shell)
- Ti6H (6-coordinated Ti with high Ti fraction in the second shell)
- TiO2 reference spectrum
Source evidence: Figure 10b and Table II (boundary of Region IV and Region V)
Key reasoning: At fTi = 0.7, the sample is near the boundary of Region IV and Region V. The Ti6L component (characteristic of TiZn2O4) shrinks and vanishes at fTi ~ 0.65. The structure is dominated by amorphous and/or polycrystalline regions with small crystallites, represented by a high fraction of under-coordinated/distorted Ti sites (TiUD, ~50%) and a highly connected network of Ti octahedra (Ti6H, ~40%). At this high Ti concentration, amorphous and/or very small crystallite TiO2 also begins to emerge.
Reasoning source: Section IV.B: Local structural motif evolution based on the cBSS weight profile, Table II, and Figure 10b
Scoring Rubric (total: 100 pts)
| Q | Type | Max | Question | Reference Answer | Scoring Criteria |
|---|---|---|---|---|---|
| q1 | identification | 46 | What candidate reference spectra or local structural motifs are needed to accurately model the Ti K-edge XANES of this combinatorial film at a Ti fraction of 0.7? | The required structural motifs to model the Ti K-edge XANES are TiUD (under-coordinated or distorted 6-coordinated Ti), Ti6H (6-coordinated Ti with a high Ti fraction in the second shell), and a TiO2 reference spectrum. At a high Ti fraction of fTi = 0.7, the film transitions away from Zn-rich phases, causing the Ti6L motif (characteristic of TiZn2O4) to vanish. Because the film is grown via PLD at 600 °C and 10 mTorr oxygen, this specific composition results in a structure dominated by amorphous or polycrystalline regions with small crystallites. Consequently, the local structure requires the TiUD motif to represent the highly distorted sites, the Ti6H motif to capture the highly connected network of Ti octahedra, and a TiO2 reference to account for the emergence of amorphous or small crystallite TiO2 at this high Ti concentration. | Full points for identifying the TiUD (under-coordinated/distorted Ti), Ti6H (6-coordinated Ti with high Ti in second shell), and TiO2 motifs. Deduct points if Ti6L is included as a major component, as it vanishes before fTi = 0.7. |
| q2 | quantification | 54 | Estimate the relative phase fractions of the key structural motifs present in the sample at fTi = 0.7. | The estimated relative phase fractions for this sample are approximately 50% TiUD, 40% Ti6H, and 10% TiO2, with an uncertainty of about 10%. These specific values arise because the PLD-grown film at a Ti fraction of 0.7 sits near a structural boundary where Zn-rich motifs have completely vanished. The 600 °C deposition temperature and high Ti concentration promote a predominantly amorphous or finely polycrystalline matrix, yielding the dominant 50% fraction of under-coordinated or distorted Ti sites (TiUD). Furthermore, the high Ti content drives the formation of a highly connected network of Ti octahedra, resulting in the 40% Ti6H fraction, while also triggering the initial precipitation of small TiO2 crystallites to make up the remaining 10%. | Full points for estimating ~50% TiUD, ~40% Ti6H, and ~10% TiO2. Partial credit for values within 10-15% of these targets. |
Review
#50
Ti-Zn oxide on fused silica
Ti K-edge
▶
LLM Prompt
Sample Information
Material: Ti-Zn oxide on fused silica
Deposition Method: pulsed laser deposition (PLD)
Substrate: fused silica (JGS2)
Film Thickness Nm: 70-120
Composition Variable: Ti fraction (fTi)
Composition Value: 0.8
Sample-Specific Conditions
- Ti fraction: 0.8
- Combinatorial Ti-Zn oxide thin film at Ti fraction 0.8, Ti K-edge analysis
Preparation
- Combinatorial ZnO-TiO2 film grown on a fused silica substrate via pulsed laser deposition (PLD) with a KrF excimer laser. Zinc oxide and titanium oxide targets were ablated alternatively under 10 mTorr oxygen ambient with the substrate heated to 600 °C. A total of 250 deposition cycles were executed.
Measurement
We plan to measure the Ti K-edge XANES spectrum of this sample.
Questions
Based on all the information above:
1. Identify the candidate local structural motifs or reference spectra required to model the Ti K-edge XANES spectrum of this highly Ti-rich (fTi = 0.8) combinatorial film.
Ground Truth
Material: Ti-Zn oxide on fused silica
Measurement: Ti K-edge XANES
Fit method: cBSS (cluster blind-signal-separation)
Phase fractions: (±10%)
| Phase | Fraction |
|---|---|
| TiUD | 0.4 |
| Ti6H | 0.4 |
| TiO2 | 0.2 |
Fit basis (paper's reference spectra):
- TiUD (under-coordinated or distorted 6-coordinated Ti)
- Ti6L (6-coordinated Ti with low Ti fraction in the second shell)
- Ti6H (6-coordinated Ti with high Ti fraction in the second shell)
- TiO2 reference spectrum
Source evidence: Figure 10b and Table II
Key reasoning: At high Ti fractions (fTi > 0.71, Region V), the crystalline TiZn2O4 signature (represented by the Ti6L motif) has completely vanished. The structure is instead dominated by amorphous and/or polycrystalline regions with small crystallites, represented by a mixture of highly connected Ti octahedra (Ti6H) and distorted/under-coordinated Ti motifs (TiUD). Additionally, as the composition approaches the pure Ti end-member, amorphous or very small crystallite TiO2 emerges. The system does not undergo perfect thermodynamics-driven phase separation.
Reasoning source: Section IV.B (Local structural motif evolution based on the cBSS weight profile), Pages 21-22
Scoring Rubric (total: 100 pts)
| Q | Type | Max | Question | Reference Answer | Scoring Criteria |
|---|---|---|---|---|---|
| q1 | identification | 100 | Identify the candidate local structural motifs or reference spectra required to model the Ti K-edge XANES spectrum of this highly Ti-rich (fTi = 0.8) combinatorial film. | The required local structural motifs to model the Ti K-edge XANES spectrum of this sample are TiUD (under-coordinated or distorted 6-coordinated Ti), Ti6H (6-coordinated Ti with high Ti fraction in the second shell), and a TiO2 reference spectrum. These specific motifs are expected because at this high Ti fraction (fTi = 0.8) in the PLD-grown film, the crystalline TiZn2O4 signature has completely vanished. Instead, the film's structure is dominated by amorphous and polycrystalline regions with small crystallites, leading to a mixture of highly connected Ti octahedra (Ti6H) and distorted or under-coordinated Ti environments (TiUD). Additionally, as the composition approaches the pure Ti end-member without undergoing perfect thermodynamics-driven phase separation, an amorphous or small crystallite TiO2 phase emerges. | Full points for identifying the three necessary components: distorted/under-coordinated Ti (TiUD), 6-coordinated Ti with high Ti neighbors (Ti6H), and a TiO2 reference. |
Review
#51
Ti-Zn oxide on fused silica
Zn K-edge
▶
LLM Prompt
Sample Information
Material: Ti-Zn oxide on fused silica
Deposition Method: pulsed laser deposition (PLD)
Substrate: fused silica (JGS2)
Film Thickness Nm: 100
Composition Variable: Ti fraction (fTi)
Composition Value: 0.1
Sample-Specific Conditions
- Ti fraction: 0.1
- Combinatorial Ti-Zn oxide thin film at Ti fraction 0.1, Zn K-edge analysis
Preparation
- Combinatorial ZnO-TiO2 film grown via pulsed laser deposition (PLD) with a KrF excimer laser (λ = 248 nm). Zinc oxide and titanium oxide targets were ablated alternatively under 10 mTorr oxygen ambient onto a fused silica substrate heated to 600 °C. The deposition consisted of 250 cycles to achieve thorough mixing and a composition gradient.
Measurement
We plan to measure the Zn K-edge XANES spectrum of this sample.
Questions
Based on all the information above:
1. What candidate reference spectra or local structural motifs should be included in a basis fitting analysis for the Zn K-edge XANES of this combinatorial thin film?
2. Based on the sample conditions (Ti fraction = 0.1), estimate the relative fractions of the dominant Zn local structural motifs.
3. Explain the physical reasoning for the expected phase composition at this specific Ti fraction (fTi = 0.1). Why do these specific Zn motifs dominate?
Ground Truth
Material: Ti-Zn oxide thin film
Measurement: Zn K-edge XANES
Fit method: cBSS (cluster blind-signal-separation)
Phase fractions: (±15%)
| Phase | Fraction |
|---|---|
| ZnO | 0.6 |
| Zn4 | 0.4 |
Fit basis (paper's reference spectra):
- ZnO motif
- Zn4 motif (4-coordinated Zn)
- Zn6 motif (6-coordinated Zn)
Source evidence: Figure 10c and Section IV.B (Page 25)
Key reasoning: At low Ti fractions (fTi <= 0.1), the system is primarily composed of bulk ZnO with isolated Ti defect complexes. The Zn-rich region is dominated by the ZnO motif, which is consistent with XRD data showing a wurtzite ZnO structure. There is also a significant contribution from the Zn4 motif, which corresponds to four-coordinated Zn sites located near the Ti defects in the structure.
Reasoning source: Section IV.B: Local structural motif evolution based on the cBSS weight profile (Page 25)
Scoring Rubric (total: 101 pts)
| Q | Type | Max | Question | Reference Answer | Scoring Criteria |
|---|---|---|---|---|---|
| q1 | identification | 25 | What candidate reference spectra or local structural motifs should be included in a basis fitting analysis for the Zn K-edge XANES of this combinatorial thin film? | The basis fitting analysis for the Zn K-edge XANES of this sample, using cluster blind-signal-separation (cBSS), should include the bulk ZnO motif, the Zn4 motif (4-coordinated Zn), and the Zn6 motif (6-coordinated Zn). These specific motifs are expected because the combinatorial Ti-Zn oxide thin film was deposited via PLD at 600 °C with a low Ti fraction (fTi = 0.1). Under these highly Zn-rich conditions, the film primarily crystallizes into a wurtzite ZnO structure, requiring the bulk ZnO motif. Additionally, the incorporation of the 10% Ti fraction creates isolated Ti defect complexes, which give rise to the Zn4 motif representing the 4-coordinated Zn sites located near these defects. | Full credit for identifying the ZnO motif and the 4-coordinated (Zn4) and 6-coordinated (Zn6) zinc motifs as the necessary basis components. |
| q2 | quantification | 38 | Based on the sample conditions (Ti fraction = 0.1), estimate the relative fractions of the dominant Zn local structural motifs. | At a Ti fraction of 0.1, the relative fractions of the dominant Zn local structural motifs are estimated to be 0.6 (60%) for the ZnO motif and 0.4 (40%) for the Zn4 motif, with an uncertainty of 15%. These specific values result directly from the low Ti concentration in the film grown at 600 °C. Because the system is Zn-rich (fTi <= 0.1), the majority of the material (60%) remains as bulk wurtzite ZnO. The significant 40% fraction of the Zn4 motif arises because the 10% Ti introduces isolated Ti defect complexes, which locally alter the surrounding lattice and create four-coordinated Zn sites adjacent to the defects. | Full credit for estimating approximately 60% ZnO motif and 40% Zn4 motif (accepting ranges of 50-70% for ZnO and 30-50% for Zn4), with 0% for Zn6. |
| q3 | reasoning | 38 | Explain the physical reasoning for the expected phase composition at this specific Ti fraction (fTi = 0.1). Why do these specific Zn motifs dominate? | At the specific Ti fraction of fTi = 0.1, the combinatorial thin film is highly Zn-rich, meaning the system is primarily composed of bulk ZnO with isolated Ti defect complexes. Grown via PLD at 600 °C, this composition allows the wurtzite ZnO structure to dominate the matrix, explaining why the bulk ZnO motif accounts for the majority (60%) of the phase composition. The Zn4 motif dominates the remainder of the composition (40%) because the minor addition of Ti disrupts the local lattice. Specifically, this Zn4 motif corresponds to four-coordinated Zn sites that form directly adjacent to the isolated Ti defects introduced into the structure. | Full credit for explaining that at low Ti fractions, the system is primarily bulk wurtzite ZnO (hence the dominant ZnO motif) containing isolated Ti defect complexes. |
Review
#52
Ti-Zn oxide on fused silica
Zn K-edge
▶
LLM Prompt
Sample Information
Material: Ti-Zn oxide on fused silica
Deposition Method: Pulsed laser deposition (PLD)
Substrate: Fused silica (JGS2)
Film Thickness Nm: 100
Composition Variable: Ti fraction (fTi)
Composition Value: 0.2
Sample-Specific Conditions
- Ti fraction: 0.2
- Combinatorial Ti-Zn oxide thin film at Ti fraction 0.2, Zn K-edge analysis
Preparation
- Combinatorial ZnO-TiO2 film grown on a fused silica substrate via pulsed laser deposition (PLD) with a KrF excimer laser. Zinc oxide and titanium oxide targets were ablated alternatively under 10 mTorr oxygen ambient at 600°C for 250 cycles to create a composition gradient.
Measurement
We plan to measure the Zn K-edge XANES spectrum of this sample.
Questions
Based on all the information above:
1. What local structural motifs or reference components are required to fit the Zn K-edge XANES spectrum of this combinatorial Ti-Zn oxide film?
Ground Truth
Material: Ti-Zn oxide thin film
Measurement: Zn K-edge XANES
Fit method: cBSS (cluster blind-signal-separation)
Phase fractions: (±15%)
| Phase | Fraction |
|---|---|
| ZnO | 0.15 |
| Zn4 | 0.7 |
| Zn6 | 0.15 |
Fit basis (paper's reference spectra):
- ZnO motif
- Zn4 motif (4-coordinated Zn)
- Zn6 motif (6-coordinated Zn)
Source evidence: Figure 10c and Section IV.B (page 25)
Key reasoning: At a Ti fraction of 0.2, the Zn-rich region transitions from being dominated by the ZnO motif to being dominated by the Zn4 motif. The Zn4 motif has a similar structure to the four-coordinated Zn sites near Ti defects in the defect models. The Zn6 motif, representing 6-coordinated Zn in zinc titanates like TiZn2O4 and TiZnO3, begins to rise in this region but remains a minority component because the amorphous nature of the sample favors lower coordination numbers.
Reasoning source: Section IV.B, page 25
Scoring Rubric (total: 100 pts)
| Q | Type | Max | Question | Reference Answer | Scoring Criteria |
|---|---|---|---|---|---|
| q1 | identification | 100 | What local structural motifs or reference components are required to fit the Zn K-edge XANES spectrum of this combinatorial Ti-Zn oxide film? | To fit the Zn K-edge XANES spectrum of this combinatorial Ti-Zn oxide film, three structural components are required: a ZnO motif, a Zn4 motif (4-coordinated Zn), and a Zn6 motif (6-coordinated Zn). These specific motifs arise because, at a Ti fraction of 0.2, the Zn-rich region of the PLD-grown film transitions away from being dominated by the ZnO motif. Instead, the Zn4 motif dominates, representing four-coordinated Zn sites near Ti defects introduced into the structure. The Zn6 motif, which corresponds to 6-coordinated Zn in zinc titanates like TiZn2O4 and TiZnO3, begins to emerge but remains a minority component because the amorphous nature of the sample favors lower coordination numbers. | Full points for identifying the ZnO, Zn4 (4-coordinated Zn), and Zn6 (6-coordinated Zn) motifs. |
Review
#53
Ti-Zn oxide on fused silica
Zn K-edge
▶
LLM Prompt
Sample Information
Material: Ti-Zn oxide on fused silica
Deposition Method: pulsed laser deposition (PLD)
Substrate: fused silica (JGS2)
Film Thickness Nm: 100
Composition Variable: Ti fraction (fTi)
Composition Value: 0.3
Sample-Specific Conditions
- Ti fraction: 0.3
- Combinatorial Ti-Zn oxide thin film at Ti fraction 0.3, Zn K-edge analysis
Preparation
- Combinatorial ZnO-TiO2 film grown on a fused silica substrate via pulsed laser deposition (PLD) using ZnO and TiO2 targets. The chamber was pumped to a base pressure of 10^-7 Torr, the substrate was heated to 600 °C, and deposition was performed alternatively under 10 mTorr oxygen ambient for 250 cycles.
Measurement
We plan to measure the Zn K-edge XANES spectrum of this sample.
Questions
Based on all the information above:
1. What local structural motifs or reference basis functions are required to adequately model the Zn K-edge XANES spectrum of this combinatorial Ti-Zn oxide film at a Ti fraction of 0.3?
Ground Truth
Material: Ti-Zn oxide thin film
Measurement: Zn K-edge XANES
Fit method: cBSS (cluster blind-signal-separation)
Phase fractions: (±10%)
| Phase | Fraction |
|---|---|
| ZnO | 0.05 |
| Zn4 | 0.85 |
| Zn6 | 0.1 |
Fit basis (paper's reference spectra):
- ZnO motif
- Zn4 motif (4-coordinated Zn)
- Zn6 motif (6-coordinated Zn)
Source evidence: Figure 10c and Section IV.B (Local structural motif evolution based on the cBSS weight profile)
Key reasoning: At a Ti fraction of 0.3, the sample is in a transitional region (Region III) characterized by the coexistence of TiZn2O4 regions with amorphous or polycrystalline regions. The Zn K-edge analysis shows that the 4-coordinated Zn4 motif strongly dominates over the 6-coordinated Zn6 motif. This high proportion of lower-coordinated Zn sites, which is greater than expected from purely crystalline TiZn2O4 or TiZnO3, is attributed to the amorphous nature of the sample, as amorphous Zn sites favor lower coordination numbers.
Reasoning source: Section IV.B, Page 23, and Table II
Scoring Rubric (total: 100 pts)
| Q | Type | Max | Question | Reference Answer | Scoring Criteria |
|---|---|---|---|---|---|
| q1 | identification | 100 | What local structural motifs or reference basis functions are required to adequately model the Zn K-edge XANES spectrum of this combinatorial Ti-Zn oxide film at a Ti fraction of 0.3? | To adequately model the Zn K-edge XANES spectrum of this combinatorial Ti-Zn oxide film, three reference basis functions are required: a ZnO motif, a 4-coordinated Zn (Zn4) motif, and a 6-coordinated Zn (Zn6) motif. These specific motifs are necessary because, at a Ti fraction of 0.3, the PLD-grown film deposited at 600 °C exists in a transitional region where TiZn2O4 regions coexist with amorphous or polycrystalline regions. The amorphous nature of the sample favors lower coordination numbers, leading to a structural environment that cannot be described by purely crystalline TiZn2O4 or TiZnO3 phases alone. Therefore, a combination of Zn4, Zn6, and ZnO motifs is required to fully capture the diverse local coordination environments present under these specific compositional and deposition conditions. | Full credit for identifying the three key Zn local motifs: ZnO, 4-coordinated Zn (Zn4), and 6-coordinated Zn (Zn6). |
Review
#54
Ti-Zn oxide on fused silica
Zn K-edge
▶
LLM Prompt
Sample Information
Material: Ti-Zn oxide on fused silica
Deposition Method: pulsed laser deposition (PLD)
Substrate: fused silica
Film Thickness Nm: 100
Composition Variable: Ti fraction (fTi)
Composition Value: 0.4
Sample-Specific Conditions
- Ti fraction: 0.4
- Combinatorial Ti-Zn oxide thin film at Ti fraction 0.4, Zn K-edge analysis
Preparation
- Combinatorial ZnO-TiO2 film grown via pulsed laser deposition (PLD) using a KrF excimer laser (248 nm). Zinc oxide and titanium oxide targets were ablated alternatively under 10 mTorr oxygen ambient onto a fused silica substrate heated to 600 °C. 250 cycles were executed to achieve thorough mixing and a thickness gradient.
Measurement
We plan to measure the Zn K-edge XANES spectrum of this sample.
Questions
Based on all the information above:
1. What candidate reference spectra or local structural motifs are needed to fully model the Zn K-edge XANES spectra of this combinatorial Ti-Zn oxide thin film?
2. Estimate the relative fractions of the different Zn coordination motifs present in the film at a Ti fraction of 0.4.
Ground Truth
Material: Ti-Zn oxide thin film
Measurement: Zn K-edge XANES
Fit method: cBSS (cluster blind-signal-separation)
Phase fractions: (±10%)
| Phase | Fraction |
|---|---|
| Zn4 | 0.95 |
| Zn6 | 0.05 |
Fit basis (paper's reference spectra):
- ZnO motif
- Zn4 motif (4-coordinated Zn)
- Zn6 motif (6-coordinated Zn)
Source evidence: Figure 10c and Section IV.B
Key reasoning: At a Ti fraction of 0.4, the Zn K-edge XANES is dominated by the Zn4 motif, representing 4-coordinated Zn sites found in zinc titanates like TiZn2O4 and Ti3Zn2O8. The Zn6 motif (6-coordinated Zn) is present but in a much smaller portion than would be expected from purely crystalline TiZn2O4 and TiZnO3. This preference for lower coordination numbers (Zn4 over Zn6) is characteristic of the amorphous nature of the sample in this composition range.
Reasoning source: Section IV.B (Local structural motif evolution based on the cBSS weight profile)
Scoring Rubric (total: 100 pts)
| Q | Type | Max | Question | Reference Answer | Scoring Criteria |
|---|---|---|---|---|---|
| q1 | identification | 40 | What candidate reference spectra or local structural motifs are needed to fully model the Zn K-edge XANES spectra of this combinatorial Ti-Zn oxide thin film? | To fully model the Zn K-edge XANES spectrum of this sample, the required local structural motifs are a ZnO motif, a Zn4 motif (4-coordinated Zn), and a Zn6 motif (6-coordinated Zn). These specific motifs are necessary because the combinatorial Ti-Zn oxide film, grown via pulsed laser deposition at 600 °C with a Ti fraction of 0.4, forms an amorphous structure containing zinc titanate-like local environments. In this composition range, the Zn atoms primarily adopt 4-coordinated sites (Zn4) similar to those found in TiZn2O4 and Ti3Zn2O8, alongside a minor presence of 6-coordinated sites (Zn6). The requirement for these specific motifs, particularly the dominance of lower coordination numbers over purely crystalline phases, is a direct result of the film's amorphous nature at this specific Ti fraction. | Full credit for identifying the three main Zn motifs: ZnO (defect sites), Zn4 (4-coordinated Zn), and Zn6 (6-coordinated Zn). |
| q2 | quantification | 60 | Estimate the relative fractions of the different Zn coordination motifs present in the film at a Ti fraction of 0.4. | At a Ti fraction of 0.4, the relative fractions of the Zn coordination motifs are estimated to be 0.95 for the Zn4 motif (4-coordinated Zn) and 0.05 for the Zn6 motif (6-coordinated Zn), with an uncertainty of 10%. These specific values result from the combinatorial PLD growth at 600 °C, which produces an amorphous Ti-Zn oxide film at this composition rather than purely crystalline TiZn2O4 or TiZnO3. Because of this amorphous nature, the local structure strongly prefers lower coordination numbers, leading to the overwhelming dominance of 4-coordinated Zn sites similar to those in TiZn2O4 and Ti3Zn2O8. Consequently, the 6-coordinated Zn sites are restricted to a much smaller portion (5%) than would be expected if the film had fully crystallized. | Full credit for estimating that the Zn4 motif is highly dominant (~95%) with a very small contribution from the Zn6 motif (~5%), and negligible ZnO motif. |
Review
#55
Ti-Zn oxide on fused silica
Zn K-edge
▶
LLM Prompt
Sample Information
Material: Ti-Zn oxide on fused silica
Deposition Method: pulsed laser deposition
Substrate: fused silica
Film Thickness Nm: 100
Composition Variable: Ti fraction (fTi)
Composition Value: 0.5
Sample-Specific Conditions
- Ti fraction: 0.5
- Combinatorial Ti-Zn oxide thin film at Ti fraction 0.5, Zn K-edge analysis
Preparation
- Combinatorial ZnO-TiO2 film grown on a fused silica substrate via pulsed laser deposition (PLD) using alternating zinc oxide and titanium oxide targets. The substrate was heated to 600°C and deposition occurred under 10 mTorr oxygen ambient for 250 cycles.
Measurement
We plan to measure the Zn K-edge XANES spectrum of this sample.
Questions
Based on all the information above:
1. Based on the sample conditions (Ti fraction = 0.5), what local structural motif dominates the Zn K-edge XANES, and what is the physical reason for this preference?
2. What set of spectral basis functions or motifs would be required to fit the Zn K-edge XANES spectra across the entire combinatorial Ti-Zn oxide film, including this specific composition?
Ground Truth
Material: Ti-Zn oxide thin film
Measurement: Zn K-edge XANES
Fit method: cBSS (cluster blind-signal-separation)
Phase fractions: (±10%)
| Phase | Fraction |
|---|---|
| Zn4 | 1.0 |
Fit basis (paper's reference spectra):
- ZnO motif
- Zn4 motif (4-coordinated Zn)
- Zn6 motif (6-coordinated Zn)
Source evidence: Figure 10c, page 23
Key reasoning: At a Ti fraction of 0.5, the Zn K-edge XANES is entirely dominated by the Zn4 motif (4-coordinated Zn). The portion of the 6-coordinated Zn6 motif is much smaller than expected from crystalline TiZn2O4 and TiZnO3 (effectively zero at this composition). This preference for lower coordination numbers is characteristic of the amorphous nature of the sample at this composition.
Reasoning source: Section IV.B, page 23
Scoring Rubric (total: 100 pts)
| Q | Type | Max | Question | Reference Answer | Scoring Criteria |
|---|---|---|---|---|---|
| q1 | reasoning | 57 | Based on the sample conditions (Ti fraction = 0.5), what local structural motif dominates the Zn K-edge XANES, and what is the physical reason for this preference? | For the Ti-Zn oxide thin film deposited via PLD at 600°C with a Ti fraction of 0.5, the Zn K-edge XANES spectrum is entirely dominated by the Zn4 motif (4-coordinated Zn) with a fraction of 1.0. The physical reason for this preference is the amorphous nature of the sample at this specific equimolar composition. Instead of forming expected crystalline phases like TiZn2O4 and TiZnO3 which would contain 6-coordinated zinc, the amorphous structure drives a strong preference for lower coordination numbers. Consequently, the portion of the Zn6 motif is effectively zero, leaving the 4-coordinated Zn4 motif to completely dominate the local structure. | Full credit for identifying the Zn4 (4-coordinated Zn) motif as the dominant phase (fraction ~1.0) and explaining that the amorphous nature of the sample at this composition favors lower coordination numbers for Zn. |
| q2 | identification | 43 | What set of spectral basis functions or motifs would be required to fit the Zn K-edge XANES spectra across the entire combinatorial Ti-Zn oxide film, including this specific composition? | Fitting the Zn K-edge XANES spectra across the combinatorial Ti-Zn oxide film using cluster blind-signal-separation (cBSS) requires a basis set consisting of a ZnO motif, a Zn4 motif (4-coordinated Zn), and a Zn6 motif (6-coordinated Zn). This specific basis set is necessary because the PLD growth at 600°C produces varying local structural environments depending on the Ti fraction. At a Ti fraction of 0.5, the film's amorphous nature causes a strong preference for lower coordination numbers, resulting in a pure Zn4 motif fraction of 1.0 and an effectively zero Zn6 motif. Therefore, these three motifs are required to fully capture the structural evolution from pure ZnO regions to the amorphous, low-coordination environments and any higher-coordination states across the entire combinatorial spread. | Full credit for identifying the three main Zn motifs: ZnO, Zn4 (4-coordinated), and Zn6 (6-coordinated). |
Review
High-sensitivity nanoscale chemical imaging with hard x-ray nano-XANES
Original-17
Electrochemistry
A. Pattammattel et al.
DOI: 10.1126/sciadv.abb3615
4 scenarios
PDF
▶
Key Paper Evidence3C, 3H, S6, p.3, p.4, p.5▶
Figure 3C (PDF page 4)
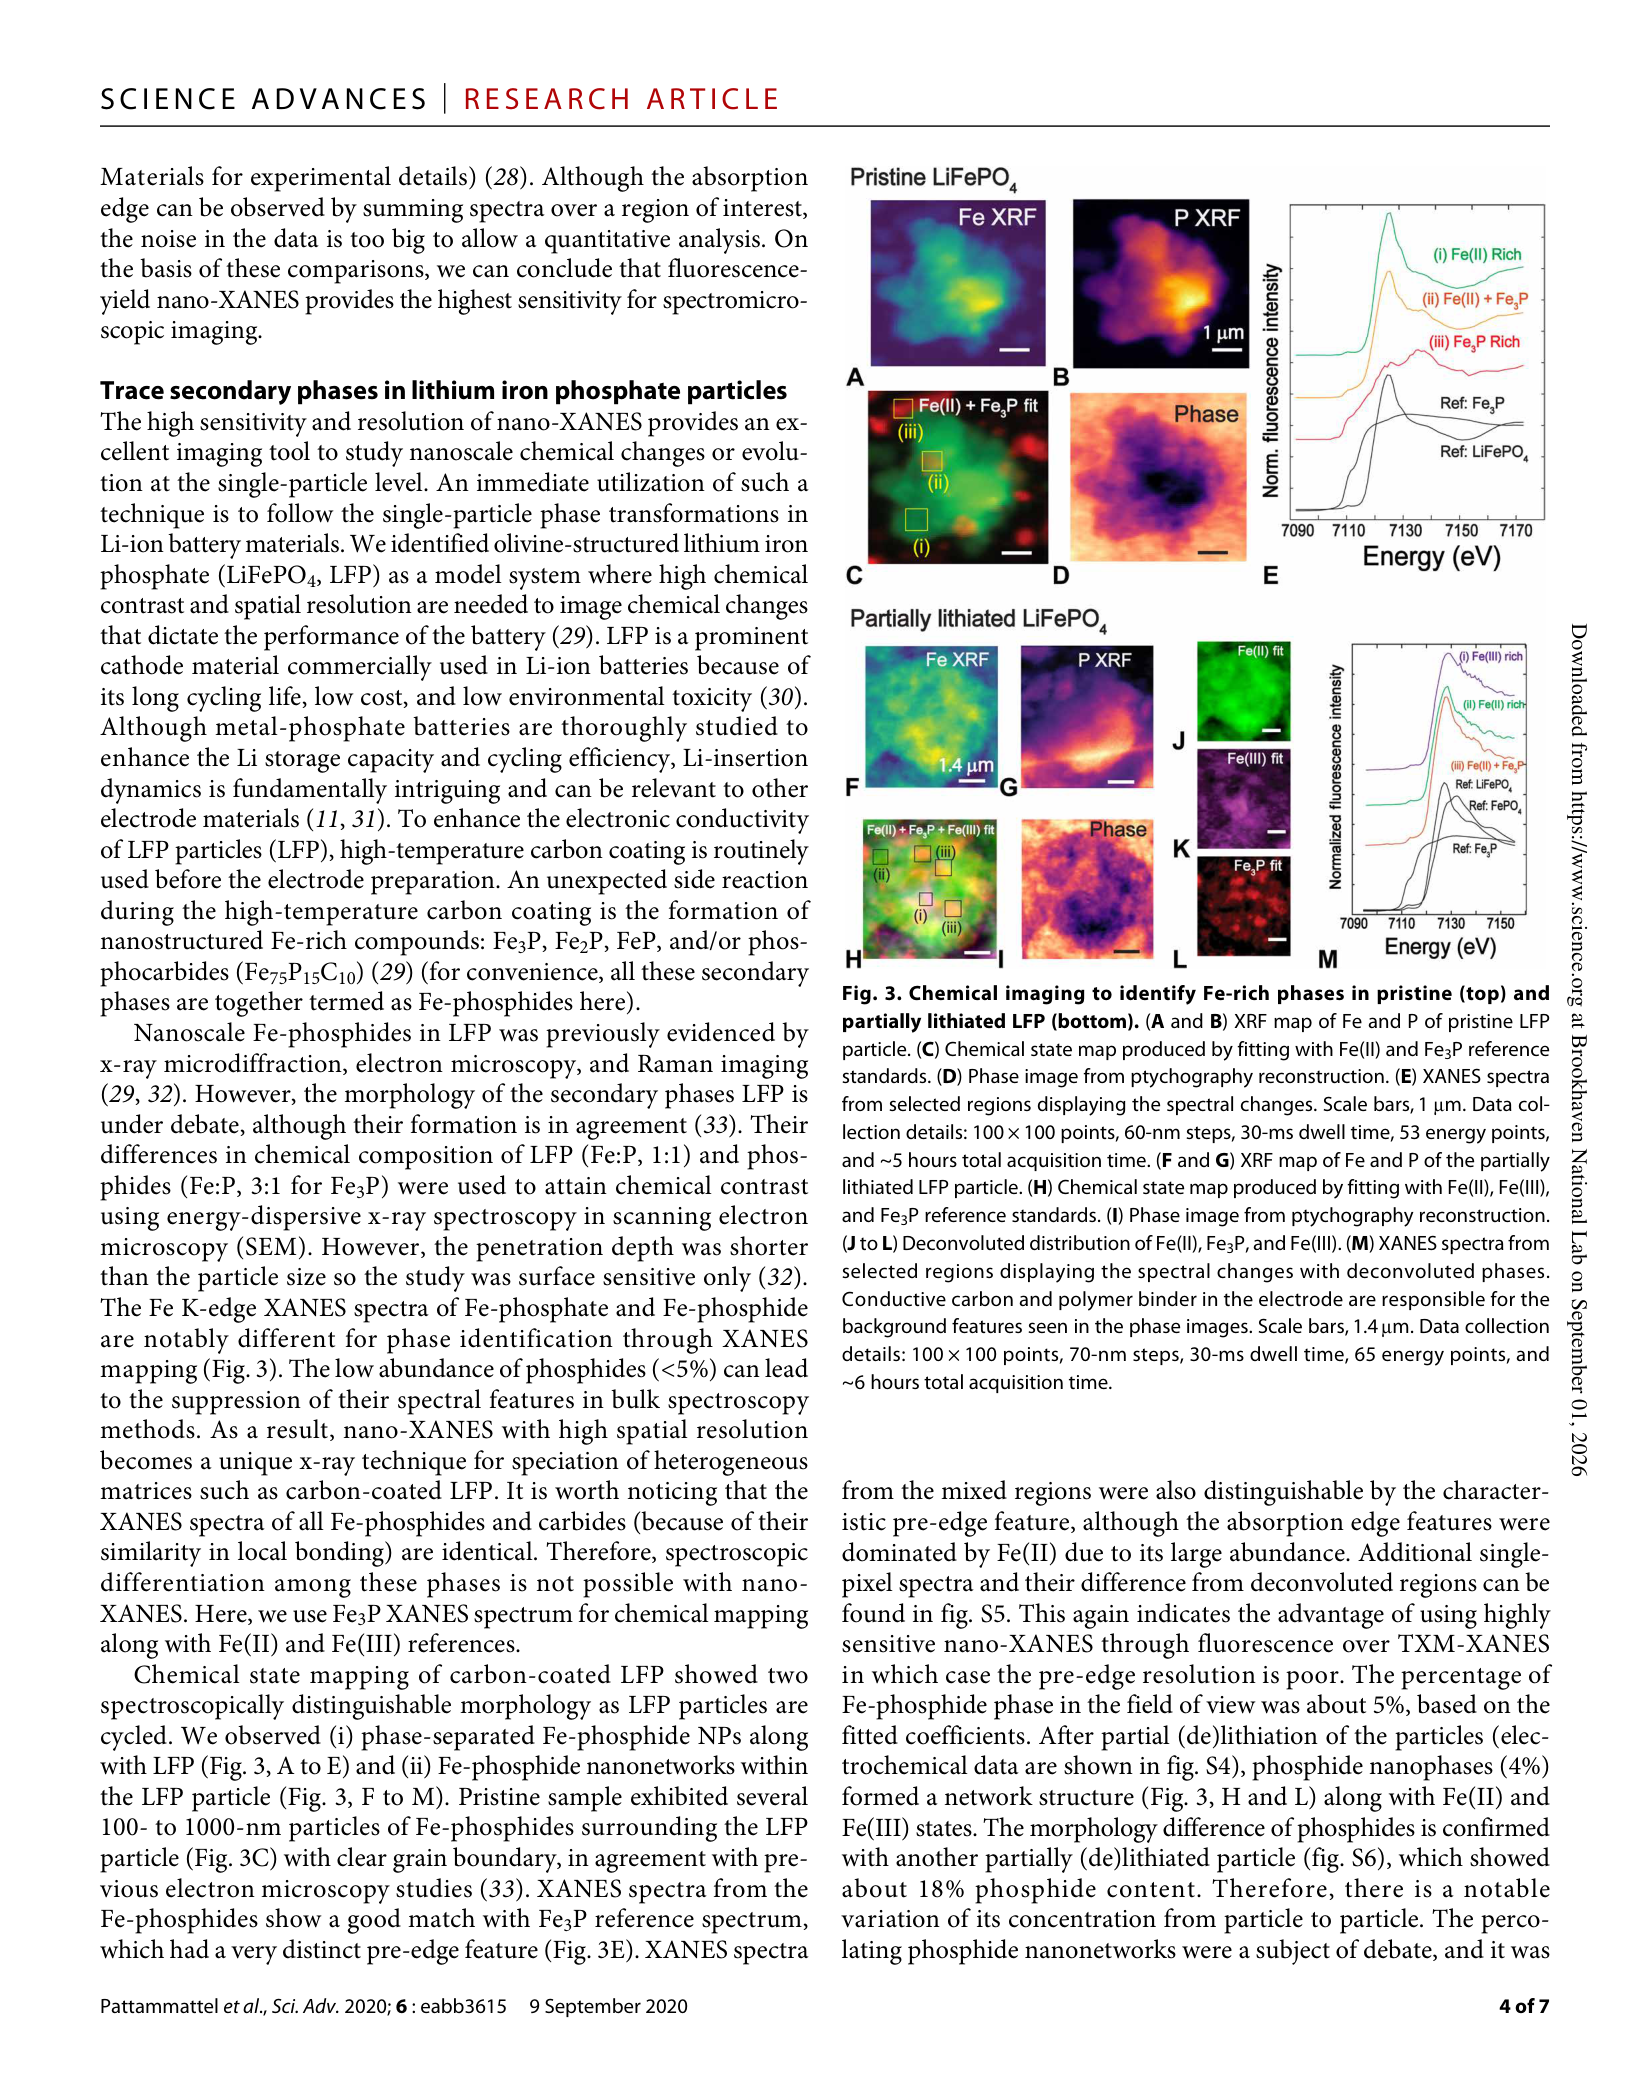
Page 3 (PDF page 3)
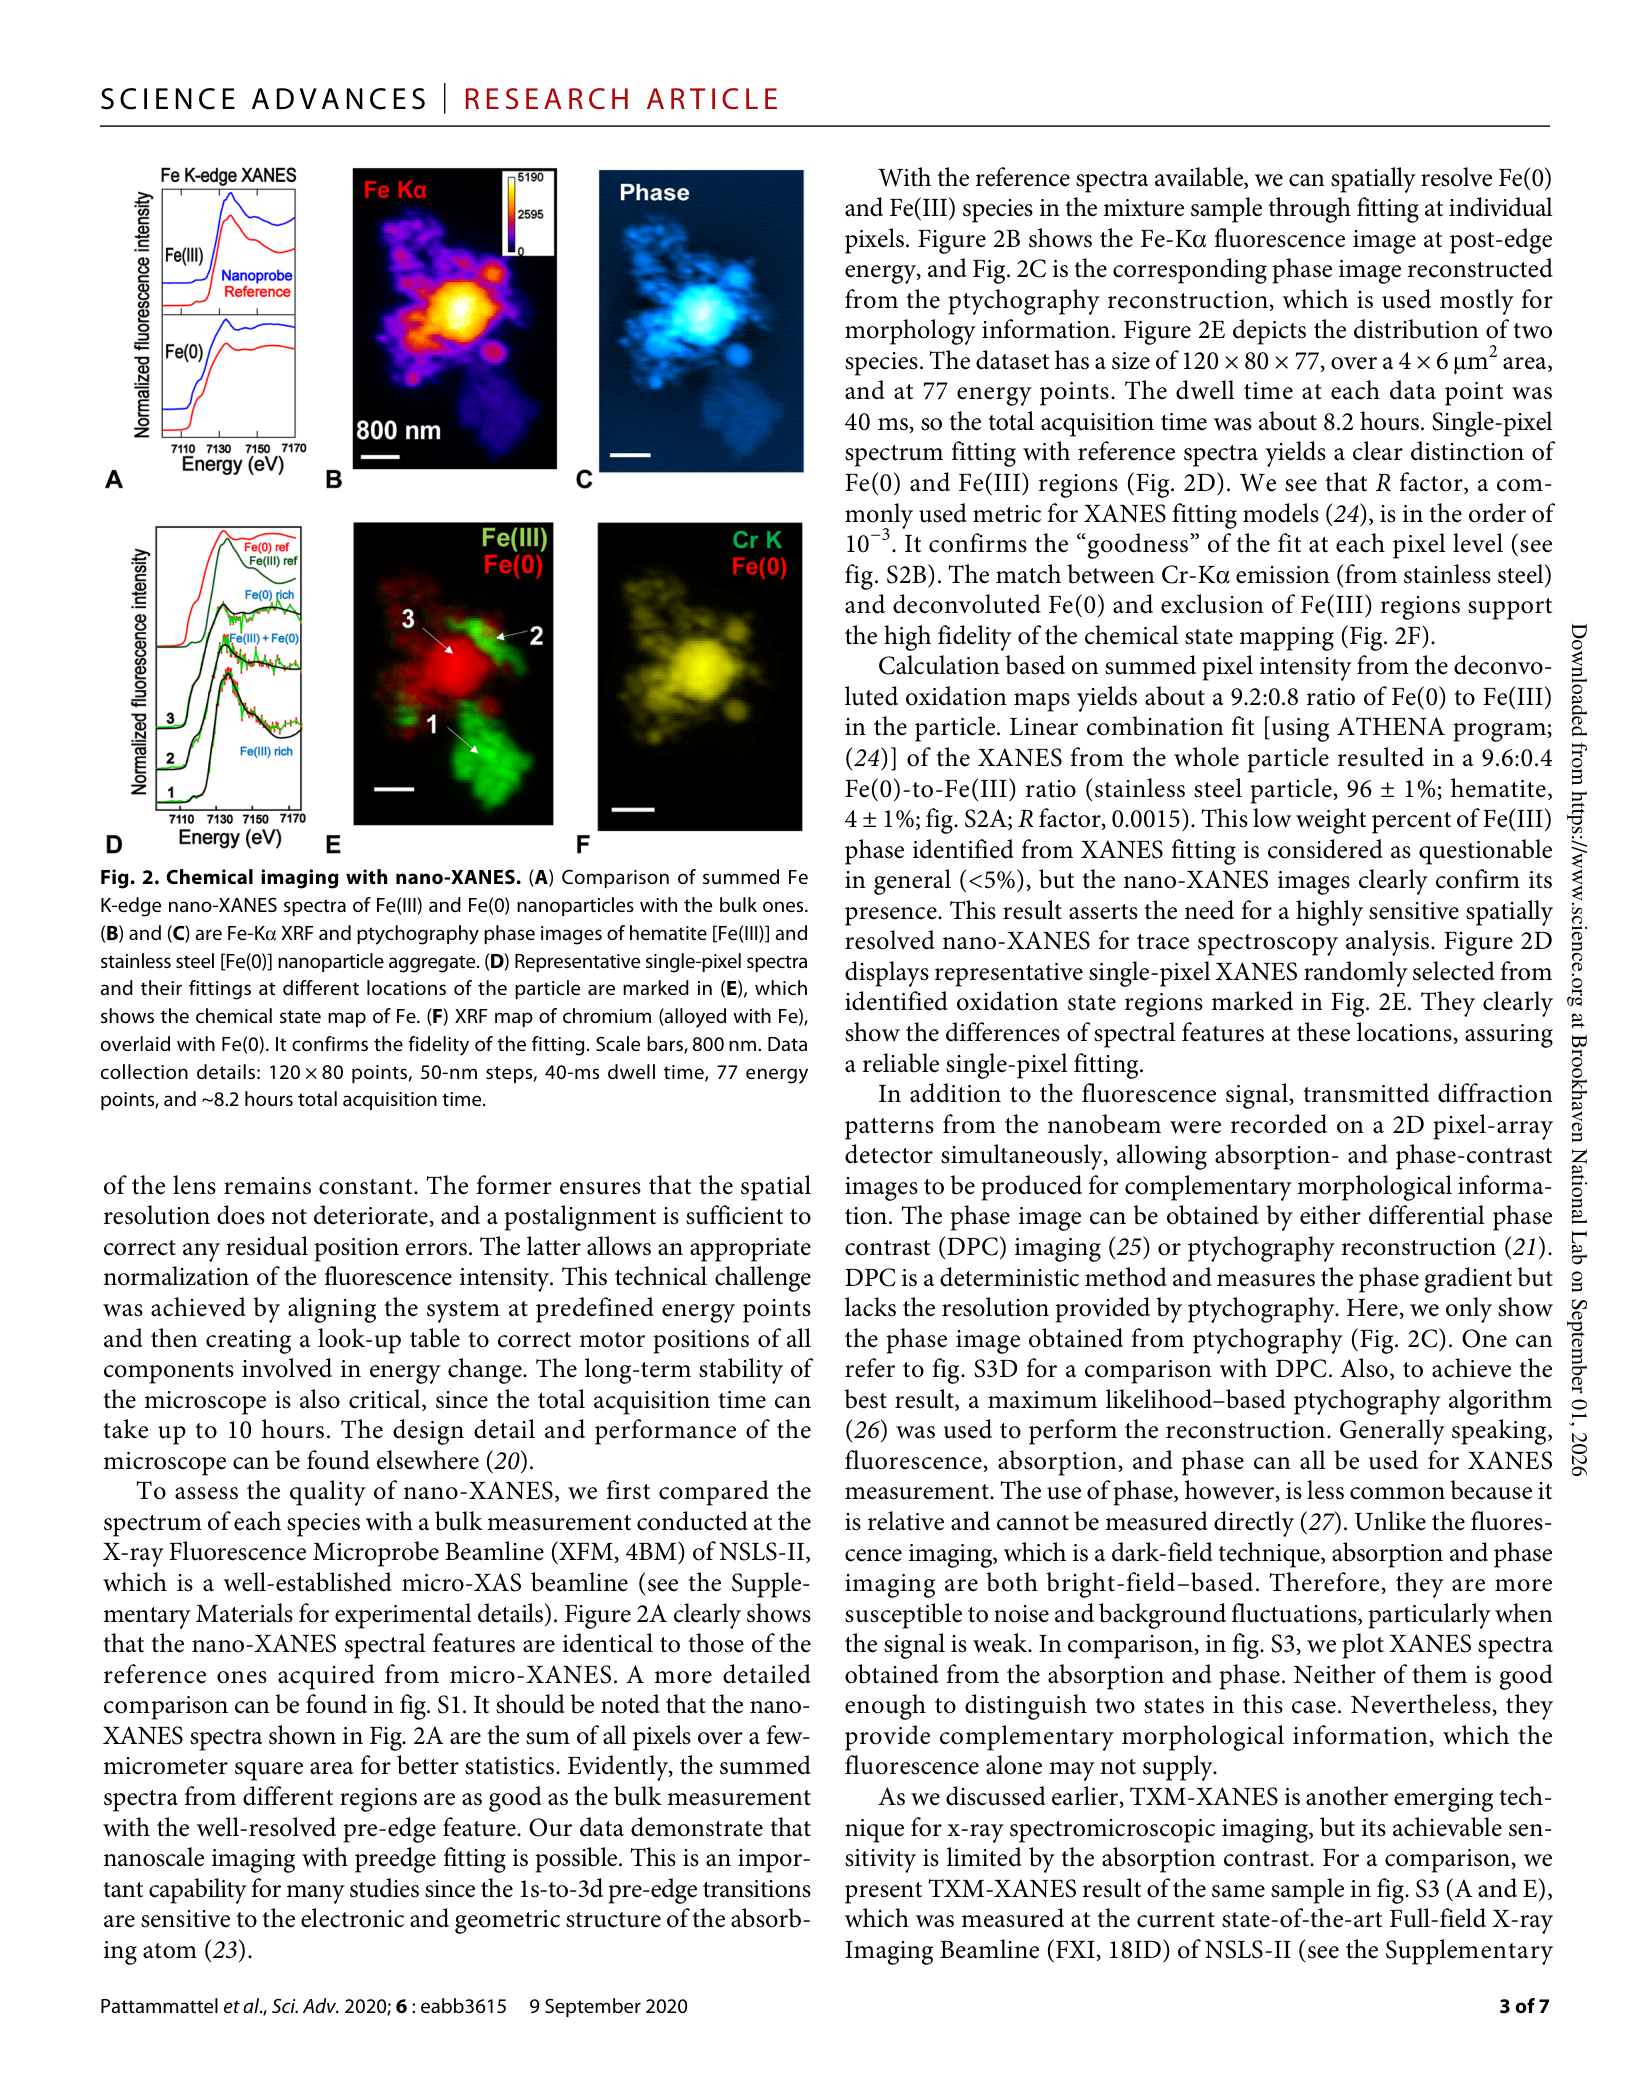
Page 5 (PDF page 5)
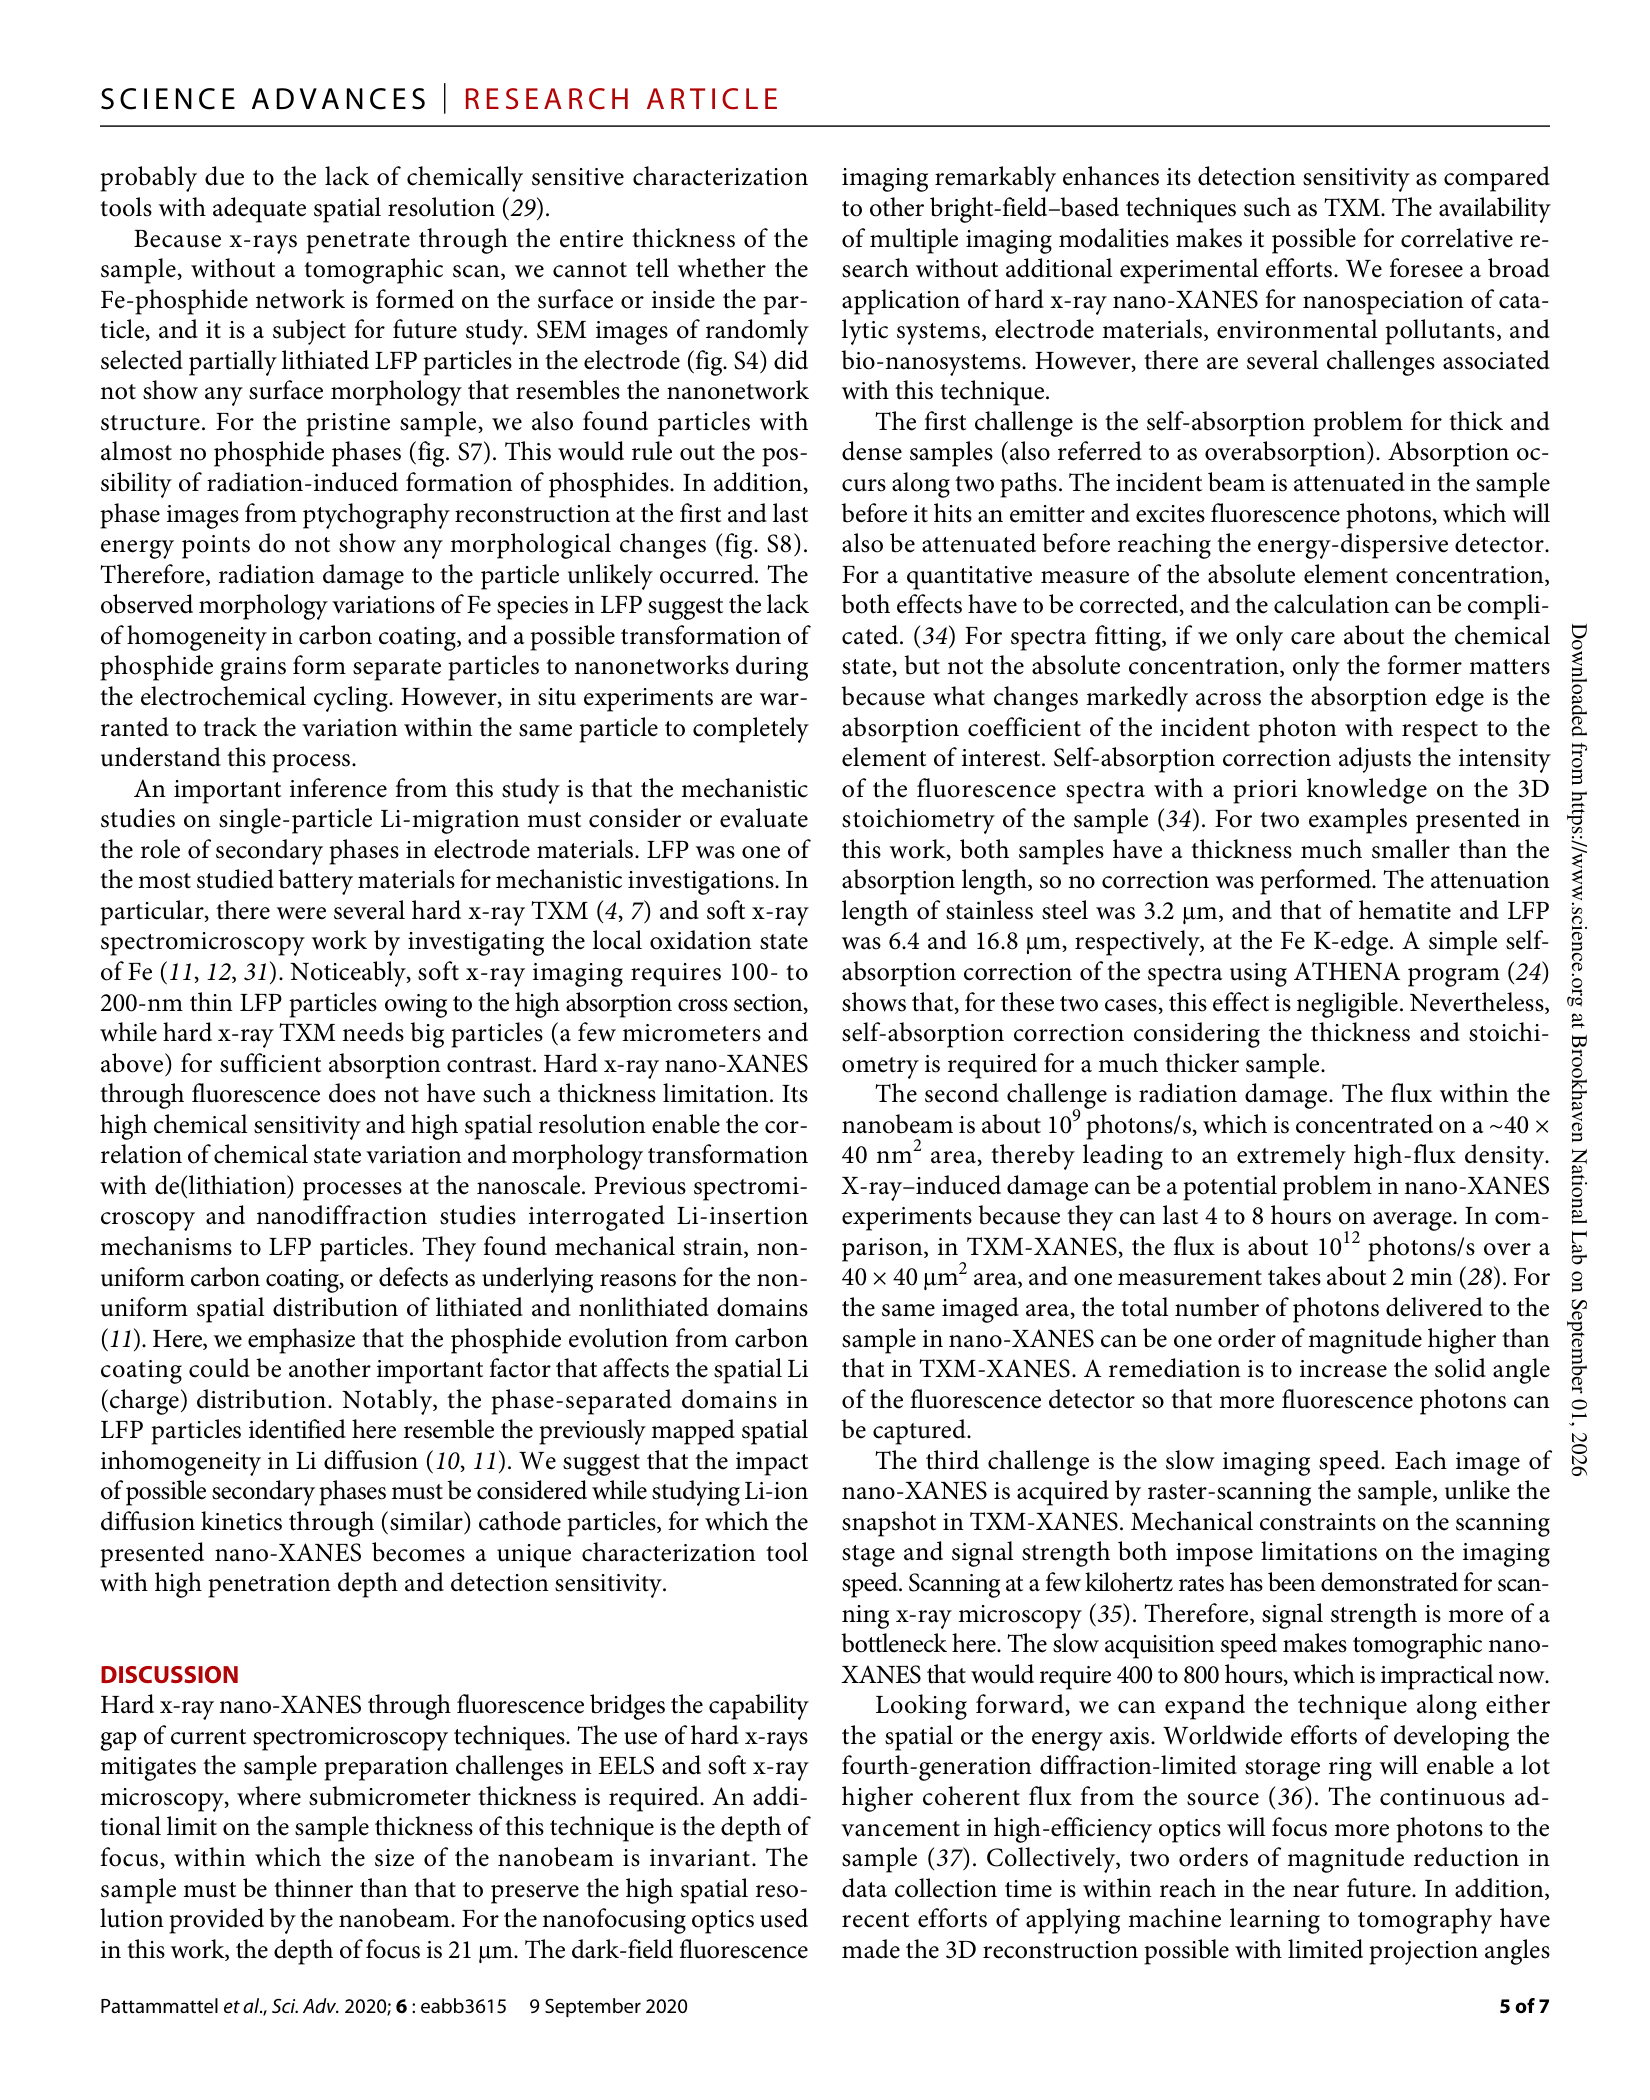
#56
stainless steel and hematite
Fe K-edge
▶
LLM Prompt
Sample Information
Material: stainless steel and hematite
Sample-Specific Conditions
- sample type: reference standard
- Physically mixed stainless steel and hematite nanoparticles used as a benchmark
Measurement
We plan to measure the Fe K-edge XANES spectrum of this sample.
Questions
Based on all the information above:
1. What candidate reference spectra are needed to perform a linear combination fit for this specific reference mixture?
2. Estimate the phase fractions of the components in this reference mixture.
3. Discuss the significance of detecting the minority phase at its specific concentration in this mixture. Why might this concentration be challenging to confirm using conventional bulk XANES fitting?
Ground Truth
Material: physically mixed stainless steel and hematite nanoparticles
Measurement: Fe K-edge fluorescence-yield nano-XANES at Hard X-ray Nanoprobe Beamline (HXN, 3ID) of NSLS-II
Fit method: Linear combination fit
Phase fractions: (±1%)
| Phase | Fraction |
|---|---|
| stainless steel (Fe(0)) | 0.96 |
| hematite (Fe(III)) | 0.04 |
Fit basis (paper's reference spectra):
- stainless steel (Fe(0))
- hematite (Fe(III))
Source evidence: Page 3, column 1, paragraph 3
Key reasoning: The sample is a physical mixture of stainless steel and hematite nanoparticles used as a reference standard. Linear combination fitting of the whole particle XANES yields a 96% Fe(0) and 4% Fe(III) composition. This low weight percent of the Fe(III) phase (4%) is typically considered questionable in standard bulk XANES fitting, which generally requires >5% for confidence. However, the spatially resolved nano-XANES images clearly confirm its presence, demonstrating the technique's high sensitivity for trace phase identification.
Reasoning source: Page 3, RESULTS section (Nano-XANES acquisition)
Scoring Rubric (total: 100 pts)
| Q | Type | Max | Question | Reference Answer | Scoring Criteria |
|---|---|---|---|---|---|
| q1 | identification | 20 | What candidate reference spectra are needed to perform a linear combination fit for this specific reference mixture? | To perform a linear combination fit for this sample, the required candidate reference spectra are stainless steel (Fe(0)) and hematite (Fe(III)). These specific reference spectra are needed because the sample was prepared as a physical mixture of stainless steel and hematite nanoparticles to serve as a benchmark reference standard. Since the sample conditions dictate that only these two distinct nanoparticle materials were physically mixed, the Fe K-edge XANES spectrum will be a direct linear combination of the metallic Fe(0) and oxidized Fe(III) states present in these starting materials. | Full points for identifying both stainless steel (or Fe(0)) and hematite (or Fe(III)) as the required reference spectra. |
| q2 | quantification | 40 | Estimate the phase fractions of the components in this reference mixture. | The estimated phase fractions for this reference mixture are 0.96 (96%) stainless steel (Fe(0)) and 0.04 (4%) hematite (Fe(III)), with a 1% uncertainty. These specific values result from the physical mixing of the stainless steel and hematite nanoparticles to create a benchmark standard containing a trace minority phase. Linear combination fitting of the whole particle XANES yields this 96:4 ratio, directly reflecting the exact proportions of the metallic and oxidized components physically combined in the sample. | Full points for stating ~96% stainless steel (Fe(0)) and ~4% hematite (Fe(III)). Deduct points if the values deviate by more than the 1% uncertainty margin. |
| q3 | reasoning | 40 | Discuss the significance of detecting the minority phase at its specific concentration in this mixture. Why might this concentration be challenging to confirm using conventional bulk XANES fitting? | Detecting the minority hematite (Fe(III)) phase at a concentration of 4% is highly significant because it demonstrates the high sensitivity of spatially resolved nano-XANES for trace phase identification. This specific concentration is challenging to confirm using conventional bulk XANES fitting because standard bulk techniques generally require a phase fraction of greater than 5% for confident identification. Because this benchmark sample was physically mixed to contain only 4% hematite nanoparticles alongside 96% stainless steel, standard bulk XANES would consider this low weight percent questionable. However, the spatially resolved nano-XANES images successfully confirm the presence of this trace Fe(III) phase within the physical mixture. | Full points for explaining that the minority phase (hematite/Fe(III)) is present at a very low weight percent (4%), which is typically considered questionable or below the reliable detection limit (<5%) for standard bulk XANES linear combination fitting, thus highlighting the need for highly sensitive spatially resolved techniques. |
Review
#57
LiFePO4
Fe K-edge
▶
LLM Prompt
Sample Information
Material: LiFePO4
Electrode Type: cathode
Charge Discharge: OCV
State Of Charge: pristine
Sample-Specific Conditions
- state of charge: pristine
- Pristine carbon-coated lithium iron phosphate particle
Measurement
We plan to measure the Fe K-edge XANES spectrum of this sample.
Questions
Based on all the information above:
1. What candidate reference spectra are needed to accurately model the Fe K-edge XANES spectrum of a pristine carbon-coated LiFePO4 particle using linear combination fitting?
2. Based on the typical synthesis and coating processes for this material, estimate the relative phase fractions of the components present in this pristine carbon-coated LiFePO4 sample.
3. Explain the chemical origin of the secondary phase in this pristine carbon-coated LiFePO4 particle. Why is this specific secondary phase present even before any electrochemical cycling (OCV state)?
Ground Truth
Material: LiFePO4
Measurement: Fe K-edge fluorescence-yield nano-XANES at Hard X-ray Nanoprobe Beamline (HXN, 3ID)
Fit method: weighted least-squares fitting algorithm with a nonnegative constraint (Linear combination fit)
Phase fractions: (±10%)
| Phase | Fraction |
|---|---|
| Fe3P | 0.05 |
| LiFePO4 (Fe(II)) | 0.95 |
Fit basis (paper's reference spectra):
- Fe(II) (LiFePO4)
- Fe3P
Source evidence: Page 4, 'Trace secondary phases in lithium iron phosphate particles' section and Figure 3C-E
Key reasoning: To enhance the electronic conductivity of LFP particles, high-temperature carbon coating is routinely used. An unexpected side reaction during this high-temperature carbon coating is the formation of nanostructured Fe-rich compounds (Fe-phosphides such as Fe3P). In the pristine sample, these secondary phases exist as phase-separated nanoparticles surrounding the LFP particle, accounting for about 5% of the phase in the field of view.
Reasoning source: Page 4, 'Trace secondary phases in lithium iron phosphate particles' section
Scoring Rubric (total: 100 pts)
| Q | Type | Max | Question | Reference Answer | Scoring Criteria |
|---|---|---|---|---|---|
| q1 | identification | 30 | What candidate reference spectra are needed to accurately model the Fe K-edge XANES spectrum of a pristine carbon-coated LiFePO4 particle using linear combination fitting? | To accurately model the Fe K-edge XANES spectrum of this pristine sample using linear combination fitting, the required candidate reference spectra are Fe(II) (LiFePO4) and Fe3P. The Fe(II) (LiFePO4) reference is needed because the sample is a pristine, uncycled (OCV) lithium iron phosphate cathode particle. The Fe3P reference is necessary due to the specific sample condition of being carbon-coated. High-temperature carbon coating is routinely used to enhance the electronic conductivity of LFP particles, which triggers an unexpected side reaction that forms nanostructured Fe-rich compounds like Fe3P. | Full credit for identifying the primary LiFePO4 (Fe(II)) phase and a secondary iron phosphide phase (such as Fe3P) that forms due to the carbon coating process. |
| q2 | quantification | 30 | Based on the typical synthesis and coating processes for this material, estimate the relative phase fractions of the components present in this pristine carbon-coated LiFePO4 sample. | The estimated relative phase fractions for this pristine sample are 95% LiFePO4 (Fe(II)) and 5% Fe3P. The dominant 95% fraction reflects the bulk active material expected in a pristine, uncycled (OCV) state prior to any electrochemical operation. The 5% fraction of Fe3P results directly from the high-temperature carbon coating process applied to the particle to enhance electronic conductivity. This thermal treatment causes an unexpected side reaction, generating secondary Fe-phosphide phases that exist as phase-separated nanoparticles surrounding the LFP particle and account for about 5% of the phase in the field of view. | Full credit for estimating approximately 95% LiFePO4 (Fe(II)) and a trace amount (~5%) of the secondary Fe-phosphide phase. |
| q3 | reasoning | 40 | Explain the chemical origin of the secondary phase in this pristine carbon-coated LiFePO4 particle. Why is this specific secondary phase present even before any electrochemical cycling (OCV state)? | The secondary phase present in this pristine LiFePO4 particle is Fe3P, which originates from the material's synthesis and coating processes rather than electrochemical cycling. To enhance the electronic conductivity of LFP cathode particles, a high-temperature carbon coating is routinely applied. During this high-temperature treatment, an unexpected side reaction occurs that leads to the formation of nanostructured Fe-rich compounds, specifically Fe-phosphides such as Fe3P. Consequently, even in the pristine OCV state before any battery operation, these secondary phases already exist as phase-separated nanoparticles surrounding the primary LFP particle. | Full credit for explaining that the high-temperature carbon coating process, which is applied to enhance electronic conductivity, causes an unexpected side reaction that reduces a small portion of the material into nanostructured Fe-phosphides (or phosphocarbides). |
Review
#58
LixFePO4
Fe K-edge
▶
LLM Prompt
Sample Information
Material: LixFePO4
Electrode Type: cathode
Electrolyte: LiPF6 in dimethyl carbonate
Cell Type: CR-2032 coin cell
Charge Discharge: partially charged/discharged
C Rate: 0.1 C
Voltage V: 3.0 - 4.0
State Of Charge: partially (de)lithiated
Sample-Specific Conditions
- state of charge: partially (de)lithiated
- LFP particle after partial (de)lithiation showing phosphide nanonetworks
Measurement
We plan to measure the Fe K-edge XANES spectrum of this sample.
Questions
Based on all the information above:
1. Estimate the relative phase fractions of the primary active material states and the trace secondary phosphide phase in this specific partially (de)lithiated particle.
2. Explain the physical origin of the trace secondary phosphide phases in this LFP sample and describe how their morphology is observed to change upon partial (de)lithiation.
Ground Truth
Material: LixFePO4
Measurement: Fe K-edge fluorescence-yield nano-XANES at Hard X-ray Nanoprobe Beamline (HXN, 3ID)
Fit method: Weighted least-squares fitting algorithm with a nonnegative constraint
Phase fractions: (±10%)
| Phase | Fraction |
|---|---|
| Fe3P | 0.04 |
| Fe(II)/Fe(III) states | 0.96 |
Fit basis (paper's reference spectra):
- Fe(II) reference standard
- Fe(III) reference standard
- Fe3P reference standard
Source evidence: Page 4, text and Figure 3H-L
Key reasoning: High-temperature carbon coating of LFP induces an unexpected side reaction that forms trace Fe-phosphide secondary phases. Upon partial (de)lithiation during electrochemical cycling, these phosphide phases (accounting for about 4% in this specific particle) evolve from isolated nanoparticles into a percolating nanonetwork structure distributed among the primary Fe(II) and Fe(III) states of the LFP particle.
Reasoning source: Page 4, 'Trace secondary phases in lithium iron phosphate particles' section and Page 5, 'Discussion' section
Scoring Rubric (total: 100 pts)
| Q | Type | Max | Question | Reference Answer | Scoring Criteria |
|---|---|---|---|---|---|
| q2 | quantification | 43 | Estimate the relative phase fractions of the primary active material states and the trace secondary phosphide phase in this specific partially (de)lithiated particle. | The relative phase fractions in this specific partially (de)lithiated LixFePO4 particle are 96% for the primary Fe(II)/Fe(III) states and 4% for the trace secondary Fe3P phase. These specific values arise because the high-temperature carbon coating process of the LFP material induces an unexpected side reaction, generating a small amount of trace Fe-phosphide secondary phases. During electrochemical cycling at 0.1 C between 3.0 and 4.0 V, the primary active material transitions between Fe(II) and Fe(III) states as it is partially (de)lithiated. Concurrently, the trace phosphide phases, which account for the remaining 4% of the particle, evolve into a percolating nanonetwork distributed among these primary states. | Full points for estimating ~4% for the Fe3P (phosphide) phase and ~96% for the combined Fe(II)/Fe(III) states. Allow a small margin of error (e.g., 1-10% for the trace phase). |
| q3 | reasoning | 57 | Explain the physical origin of the trace secondary phosphide phases in this LFP sample and describe how their morphology is observed to change upon partial (de)lithiation. | The trace secondary phosphide phases (Fe3P) in this LixFePO4 sample originate from an unexpected side reaction induced by the high-temperature carbon coating of the LFP material. Initially present as isolated nanoparticles, the morphology of these trace phases undergoes a significant transformation during electrochemical cycling. As the sample is partially (de)lithiated at 0.1 C between 3.0 and 4.0 V, these isolated phosphide nanoparticles evolve into a percolating nanonetwork structure. This resulting nanonetwork becomes distributed throughout the primary Fe(II) and Fe(III) active material states of the LFP particle. | Full points for explaining that the phosphides originate from a side reaction during high-temperature carbon coating, and that they evolve from isolated nanoparticles (in the pristine state) into a percolating nanonetwork during electrochemical cycling/partial (de)lithiation. |
Review
#59
LixFePO4
Fe K-edge
▶
LLM Prompt
Sample Information
Material: LixFePO4
Electrode Type: cathode
Electrolyte: LiPF6 in dimethyl carbonate
Cell Type: CR-2032 coin cell
Charge Discharge: partially charged/discharged
C Rate: 0.1 C
Voltage V: 3.0 - 4.0
State Of Charge: partially (de)lithiated
Sample-Specific Conditions
- state of charge: partially (de)lithiated
- Another LFP particle after partial (de)lithiation showing higher phosphide content
Measurement
We plan to measure the Fe K-edge XANES spectrum of this sample.
Questions
Based on all the information above:
1. What candidate reference spectra are required to properly model the Fe K-edge XANES spectrum of this partially (de)lithiated carbon-coated LFP particle using linear combination fitting?
2. Estimate the phase fractions of the Fe-phosphide secondary phase versus the primary Fe(II)/Fe(III) states in this specific partially (de)lithiated particle, noting that it represents a case with higher-than-average secondary phase content.
3. Explain the physical origin of the Fe-phosphide phase in this material and describe how its morphology and concentration might present in a partially (de)lithiated state.
Ground Truth
Material: LixFePO4 (carbon-coated LFP)
Measurement: Fe K-edge fluorescence-yield nano-XANES at HXN, 3ID beamline
Fit method: Linear combination fitting (weighted least-squares with nonnegative constraint)
Phase fractions: (±10%)
| Phase | Fraction |
|---|---|
| Fe3P | 0.18 |
| Fe(II)/Fe(III) states | 0.82 |
Fit basis (paper's reference spectra):
- Fe(II) reference (LiFePO4)
- Fe(III) reference (FePO4)
- Fe3P reference
Source evidence: Page 4, right column, text referencing fig. S6
Key reasoning: High-temperature carbon coating of LFP induces a side reaction that forms trace Fe-phosphide secondary phases (e.g., Fe3P). While pristine particles typically show phase-separated phosphide nanoparticles, partially (de)lithiated particles can exhibit percolating phosphide nanonetworks. The concentration of these secondary phases varies significantly between individual particles, with this specific particle exhibiting a notably higher phosphide content of 18% compared to the ~4-5% seen in other particles.
Reasoning source: Page 4, 'Trace secondary phases in lithium iron phosphate particles' section
Scoring Rubric (total: 100 pts)
| Q | Type | Max | Question | Reference Answer | Scoring Criteria |
|---|---|---|---|---|---|
| q1 | identification | 25 | What candidate reference spectra are required to properly model the Fe K-edge XANES spectrum of this partially (de)lithiated carbon-coated LFP particle using linear combination fitting? | To properly model the Fe K-edge XANES spectrum using linear combination fitting, the required candidate reference spectra are an Fe(II) reference (LiFePO4), an Fe(III) reference (FePO4), and an Fe3P reference. The Fe(II) and Fe(III) references are necessary because the sample is a partially (de)lithiated LixFePO4 cathode cycled between 3.0 and 4.0 V, meaning it contains a mixture of lithiated and delithiated active states. The Fe3P reference is required because the high-temperature carbon coating process applied to the LFP induces a side reaction that forms trace Fe-phosphide secondary phases. Since this specific particle was selected for its higher phosphide content, including the Fe3P basis is critical for an accurate fit. | Full points for identifying Fe(II) (or LiFePO4), Fe(III) (or FePO4), and an Fe-phosphide phase (such as Fe3P) as the necessary reference spectra. |
| q2 | quantification | 35 | Estimate the phase fractions of the Fe-phosphide secondary phase versus the primary Fe(II)/Fe(III) states in this specific partially (de)lithiated particle, noting that it represents a case with higher-than-average secondary phase content. | The phase fractions for this specific particle are 0.18 (18%) for the Fe3P secondary phase and 0.82 (82%) for the primary Fe(II)/Fe(III) states, with a fitting uncertainty of 10%. These specific values result from the fact that the concentration of secondary phases varies significantly between individual particles in the cathode. While typical particles in this material show about 4-5% phosphide content, this particular partially (de)lithiated particle exhibits a notably higher concentration of the Fe3P phase formed during the high-temperature carbon coating side reaction. The remaining 82% represents the bulk LixFePO4 active material that is actively participating in the partial charge/discharge process at 0.1 C. | Full points if the estimated fraction for the Fe-phosphide phase is approximately 18% (0.18) and the remaining Fe(II)/Fe(III) states are approximately 82% (0.82), within a 10% margin of error. |
| q3 | reasoning | 40 | Explain the physical origin of the Fe-phosphide phase in this material and describe how its morphology and concentration might present in a partially (de)lithiated state. | The Fe-phosphide phase, such as Fe3P, originates from a side reaction induced by the high-temperature carbon coating process applied to the LFP material. While pristine particles typically feature phase-separated phosphide nanoparticles, the morphology in partially (de)lithiated particles can evolve to exhibit percolating phosphide nanonetworks. The concentration of these secondary phases varies significantly from particle to particle within the coin cell cathode. Because this specific sample represents a particle with higher-than-average secondary phase content, it presents a phosphide concentration of 18%, which is substantially higher than the 4-5% typically observed in other particles. | Full points for explaining that the Fe-phosphide phase originates from a side reaction during high-temperature carbon coating, that its concentration can vary notably from particle to particle, and that in partially (de)lithiated states it can form a percolating nanonetwork structure. |
Review
Kinetic pathways of ionic transport in fast-charging lithium titanate
Original-17
Electrochemistry
Wei Zhang et al.
DOI: 10.1126/science.aax3520
2 scenarios
PDF
▶
Key Paper Evidence2E, S8, p.7, p.9, p.30, p.35, p.36▶
Figure 2E (PDF page 18)
Figure S8 (PDF page 47)
Page 30 (PDF page 30)
Page 35 (PDF page 35)
Page 36 (PDF page 36)
Page 7 (PDF page 7)
Page 9 (PDF page 9)
#60
Li4Ti5O12
Li K
▶
LLM Prompt
Sample Information
Material: Li4Ti5O12
Electrode Type: anode
Electrolyte: 1.0 M LiTFSI in 1-butyl-1-methylpyrrolidinium bis(trifluoromethylsulfonyl)imide
Cell Type: in-situ TEM cell
Charge Discharge: discharging
C Rate: 1C
State Of Charge: intermediate x
Cycle Number: 1
Sample-Specific Conditions
- C-rate: 1C
- Partially lithiated LTO during cycling at low rates (1C, 2C), derived from IM/IS peak ratio ~0.2
Measurement
We plan to measure the Li K XANES spectrum of this sample.
Questions
Based on all the information above:
1. What candidate structural states or phases should be considered as basis components when analyzing the Li K-edge spectrum of partially lithiated LTO at a low rate (1C)?
2. Based on the low discharge rate (1C), estimate the relative fractions of the stable configurations versus the metastable intermediate configurations in the sample.
3. Explain why the metastable intermediate phase fraction is relatively low at 1C compared to higher C-rates, and how this relates to the structural mechanism of lithiation in LTO.
Ground Truth
Material: Li4+xTi5O12
Measurement: operando Li K-edge EELS (analogous to XANES)
Fit method: Peak integration ratio (IM/IS) from deconvoluted spectra
Phase fractions:
| Phase | Fraction |
|---|---|
| stable configurations (Li4Ti5O12/Li7Ti5O12) | 0.83 |
| metastable intermediate (Li4+xTi5O12) | 0.17 |
Fit basis (paper's reference spectra):
- Pre-peak S (stable configurations in Li4Ti5O12 and Li7Ti5O12)
- Pre-peak M (metastable configurations of intermediate Li4+xTi5O12)
Source evidence: Page 7 (text) and Figure 2E
Key reasoning: At low rates (1C), the lithiation of LTO proceeds primarily via a two-phase reaction with a small amount of metastable intermediate configurations. The intensity ratio of pre-peak M (originating from distorted face-sharing Li in metastable intermediates) to pre-peak S (originating from stable Li in 8a/16c sites) is small (~0.2). This indicates that the highly distorted face-sharing Li polyhedra characteristic of the metastable solid solution are present but do not dominate the structure at low overpotentials, unlike at higher rates where their concentration increases abruptly.
Reasoning source: Page 7 and Page 30 (Supplementary Text Section 4)
Scoring Rubric (total: 101 pts)
| Q | Type | Max | Question | Reference Answer | Scoring Criteria |
|---|---|---|---|---|---|
| q1 | identification | 25 | What candidate structural states or phases should be considered as basis components when analyzing the Li K-edge spectrum of partially lithiated LTO at a low rate (1C)? | The basis components for analyzing the Li K-edge spectrum of this sample should include stable configurations (found in Li4Ti5O12 and Li7Ti5O12) and metastable configurations of the intermediate Li4+xTi5O12 phase. These specific states are expected because, at the low discharge rate of 1C, the lithiation of LTO proceeds primarily via a two-phase reaction with only a small amount of metastable intermediate configurations forming. The stable configurations correspond to Li in stable 8a/16c sites, which dominate the structure at low overpotentials. Conversely, the metastable configurations correspond to highly distorted face-sharing Li polyhedra that appear during the intermediate state of charge but do not dominate the structure at this low rate. | Full credit for identifying both the stable endmember configurations (Li4Ti5O12/Li7Ti5O12) and the metastable intermediate configurations (Li4+xTi5O12). |
| q2 | quantification | 38 | Based on the low discharge rate (1C), estimate the relative fractions of the stable configurations versus the metastable intermediate configurations in the sample. | The relative fractions in the partially lithiated LTO sample are estimated to be 0.83 (83%) for the stable configurations (Li4Ti5O12/Li7Ti5O12) and 0.17 (17%) for the metastable intermediate configurations (Li4+xTi5O12). These specific values result from the low 1C discharge rate, which dictates that lithiation occurs predominantly through a two-phase reaction rather than a solid-solution mechanism. Because the overpotential is low at 1C, the highly distorted face-sharing Li polyhedra characteristic of the metastable intermediate do not dominate the structure. This is evidenced by the small intensity ratio (~0.2) of pre-peak M (metastable) to pre-peak S (stable) in the deconvoluted spectra, which directly yields the 17% metastable fraction. | Full credit for estimating ~83% stable configurations and ~17% metastable intermediate configurations (accepting ranges within +/- 10%). |
| q3 | reasoning | 38 | Explain why the metastable intermediate phase fraction is relatively low at 1C compared to higher C-rates, and how this relates to the structural mechanism of lithiation in LTO. | At a low discharge rate of 1C, the metastable intermediate phase fraction remains relatively low (17%) because the lithiation of LTO proceeds primarily via a two-phase reaction mechanism. Under these low overpotential conditions, lithium ions predominantly occupy the stable 8a and 16c sites characteristic of the Li4Ti5O12 and Li7Ti5O12 end-members. The metastable intermediate phase requires the formation of highly distorted face-sharing Li polyhedra, which do not dominate the structure unless driven by the higher overpotentials associated with faster C-rates. Consequently, the spectral signature of these distorted sites (pre-peak M) remains small compared to the stable sites (pre-peak S), reflecting a structural mechanism that favors stable two-phase coexistence at 1C. | Full credit for explaining that at low overpotentials (low rates), lithiation proceeds primarily via a two-phase reaction, keeping the concentration of highly distorted face-sharing Li polyhedra (metastable intermediates) low. |
Review
#61
Li4Ti5O12
Li K
▶
LLM Prompt
Sample Information
Material: Li4Ti5O12
Electrode Type: anode
Electrolyte: 1.0 M LiTFSI in 1-butyl-1-methylpyrrolidinium bis(trifluoromethylsulfonyl)imide
Cell Type: in-situ TEM cell
Charge Discharge: discharging
C Rate: 8C
State Of Charge: intermediate x
Cycle Number: 1
Sample-Specific Conditions
- C-rate: 8C
- Partially lithiated LTO during cycling at high rates (3C, 8C), derived from IM/IS peak ratio ~2.0
Measurement
We plan to measure the Li K XANES spectrum of this sample.
Questions
Based on all the information above:
1. Estimate the phase fractions of the stable configurations versus the metastable intermediate configurations for this sample cycled at 8C, given that the intensity ratio of their respective pre-peaks (IM/IS) is approximately 2.0.
2. Explain the thermodynamic and structural reasoning for the emergence and dominance of the metastable intermediate phase at this high cycling rate (8C).
Ground Truth
Material: Li4+xTi5O12
Measurement: Operando Li K-edge EELS (Electron Energy-Loss Spectroscopy)
Fit method: Peak integration and intensity ratio analysis (IM/IS)
Phase fractions:
| Phase | Fraction |
|---|---|
| stable configurations (Li4Ti5O12/Li7Ti5O12) | 0.33 |
| metastable intermediate (Li4+xTi5O12) | 0.67 |
Fit basis (paper's reference spectra):
- Pre-peak M (~58.0 - 58.4 eV) representing metastable intermediates with distorted face-sharing Li polyhedra
- Pre-peak S (~58.9 eV) representing stable configurations in Li4Ti5O12 (8a sites) and Li7Ti5O12 (16c sites)
Source evidence: Figure 2E, Figure S8, and Supplementary Text Section 4 (Page 30)
Key reasoning: At high cycling rates (e.g., 8C), elevated overpotentials make higher-energy metastable configurations accessible. These metastable intermediates consist of highly distorted face-sharing Li polyhedra (Li(16c) and Li(8a)) located at phase boundaries or within an interfacial solid solution (ISS). The high degree of local distortion in these polyhedra reduces the effective coordination number of Li, which elongates Li-O bonds and splits the anti-bonding Li-O states, giving rise to a strong pre-peak M at ~58.0-58.4 eV. The intensity ratio IM/IS reaches ~2.0 at intermediate states of charge, indicating that these metastable interfacial states dominate the composition over the stable endmember configurations.
Reasoning source: Page 7 (paragraphs 2-3), Page 9 (paragraph 2), Page 30 (Section 4), Page 35-36 (Section 8)
Scoring Rubric (total: 100 pts)
| Q | Type | Max | Question | Reference Answer | Scoring Criteria |
|---|---|---|---|---|---|
| q2 | quantification | 50 | Estimate the phase fractions of the stable configurations versus the metastable intermediate configurations for this sample cycled at 8C, given that the intensity ratio of their respective pre-peaks (IM/IS) is approximately 2.0. | The estimated phase fractions for this sample are 0.67 (67%) for the metastable intermediate (Li4+xTi5O12) and 0.33 (33%) for the stable configurations (Li4Ti5O12/Li7Ti5O12). These specific values arise because the high discharging rate of 8C induces elevated overpotentials, making higher-energy metastable configurations accessible during the intermediate state of charge. These metastable states produce a distinct pre-peak M (~58.0-58.4 eV) due to distorted face-sharing Li polyhedra, while stable configurations produce pre-peak S (~58.9 eV). An observed IM/IS peak intensity ratio of approximately 2.0 directly translates to a 2:1 ratio of metastable to stable phases, demonstrating that the metastable interfacial states dominate the composition under these high-rate conditions. | Full credit requires estimating approximately 67% (or 2/3) for the metastable intermediate phase and 33% (or 1/3) for the stable configurations. |
| q3 | reasoning | 50 | Explain the thermodynamic and structural reasoning for the emergence and dominance of the metastable intermediate phase at this high cycling rate (8C). | At a high discharging rate of 8C, the system experiences elevated overpotentials that provide the thermodynamic driving force to access higher-energy metastable configurations. Structurally, these metastable intermediates consist of highly distorted face-sharing Li polyhedra (Li(16c) and Li(8a)) located at phase boundaries or within an interfacial solid solution (ISS). This high degree of local distortion reduces the effective coordination number of lithium, elongating Li-O bonds and splitting the anti-bonding Li-O states. Consequently, this structural distortion gives rise to a strong pre-peak M (~58.0-58.4 eV) in the spectrum, and its dominance (IM/IS ratio ~2.0) at intermediate states of charge confirms that these metastable interfacial states overtake the stable endmember configurations under high-rate conditions. | Full credit requires explaining that high rates cause elevated overpotentials, which make higher-energy metastable configurations accessible. The answer must also note that these configurations involve highly distorted face-sharing Li polyhedra (or an interfacial solid solution). |
Review
Tuning Bifunctional Oxygen Electrocatalysts by Changing the A‐Site Rare‐Earth Element in Perovskite Nickelates
APS
Catalyst
Le Wang et al.
DOI: 10.1002/adfm.201803712
5 scenarios
▶
#62
LaNiO3
Ni L2
▶
LLM Prompt
Sample Information
Material: LaNiO3
Support: SrTiO3
Sample-Specific Conditions
- A-site element: La
- LaNiO3 thin film on STO
Measurement
We plan to measure the Ni L2 XANES spectrum of this sample.
Questions
Based on all the information above:
1. Describe the expected spectral shape of the Ni L2-edge XANES for the LaNiO3 thin film and explain what distinguishing features separate it from other rare-earth nickelates (like GdNiO3).
2. When analyzing the X-ray absorption spectrum of LaNiO3, why is the Ni L2-edge specifically chosen for analysis rather than the more commonly analyzed Ni L3-edge?
Ground Truth
Material: LaNiO3 thin film on SrTiO3
Measurement: Ni L2-edge XAS (L3-edge omitted due to strong overlap with La M4-edge), ex-situ, Beijing Synchrotron Radiation Facility
Fit method: Gaussian peak fitting
Phase fractions: (±5%)
| Phase | Fraction |
|---|---|
| Ni3+ (beta peak) | 1.0 |
| Ni2+ (alpha peak) | 0.0 |
Fit basis (paper's reference spectra):
- Gaussian function for alpha peak (Ni2+)
- Gaussian function for beta peak (Ni3+)
Source evidence: Figure 3a and 3c, page 18; Section 2.3, page 7
Key reasoning: In LaNiO3, the large ionic radius of La results in a highly covalent Ni-O-Ni bond network without appreciable oxygen vacancies. Consequently, the Ni valence remains 3+, as evidenced by the absence of the low-energy 'alpha' peak in the Ni L2-edge spectrum, which would otherwise indicate the presence of Ni2+ caused by oxygen vacancies.
Reasoning source: Section 2.3 (page 7) and Section 2.4 (page 9)
Scoring Rubric (total: 100 pts)
| Q | Type | Max | Question | Reference Answer | Scoring Criteria |
|---|---|---|---|---|---|
| q1 | spectral | 50 | Describe the expected spectral shape of the Ni L2-edge XANES for the LaNiO3 thin film and explain what distinguishing features separate it from other rare-earth nickelates (like GdNiO3). | The expected Ni L2-edge XANES spectrum for the LaNiO3 thin film on SrTiO3 consists of a single dominant peak (the beta peak) at approximately 871.5 eV, with no visible low-energy shoulder (the alpha peak) at ~870 eV. This spectral shape arises because the large ionic radius of the La A-site cation creates a highly covalent Ni-O-Ni bond network that prevents the formation of appreciable oxygen vacancies. Consequently, the nickel remains entirely in the Ni3+ oxidation state, producing only the beta peak. This distinguishes LaNiO3 from other rare-earth nickelates with smaller A-site cations, such as GdNiO3, which exhibit an increasing low-energy alpha peak corresponding to Ni2+ generated by oxygen vacancies. | The answer must state that the spectrum features a single dominant high-energy peak (beta peak) and lacks a low-energy shoulder/peak (alpha peak). It should distinguish LNO from other nickelates by noting that smaller A-site cations exhibit the alpha peak due to the presence of Ni2+. |
| q3 | reasoning | 50 | When analyzing the X-ray absorption spectrum of LaNiO3, why is the Ni L2-edge specifically chosen for analysis rather than the more commonly analyzed Ni L3-edge? | For the LaNiO3 thin film on SrTiO3, the Ni L2-edge is specifically chosen for analysis because the Ni L3-edge exhibits strong spectral overlap with the La M4-edge. This overlap makes it impossible to accurately isolate and analyze the Ni L3-edge features for this specific compound. By measuring the Ni L2-edge instead, researchers can clearly observe the dominant beta peak (~871.5 eV) and confirm the pure Ni3+ oxidation state. This pure Ni3+ state is expected because the large ionic radius of the La A-site cation promotes a highly covalent Ni-O-Ni network without appreciable oxygen vacancies, which would otherwise produce a Ni2+ signal. | The answer must correctly identify that the La M4-edge strongly overlaps with the Ni L3-edge, making the L2-edge necessary for accurate analysis of the Ni valence state. |
Review
#63
NdNiO3
Ni L2
▶
LLM Prompt
Sample Information
Material: NdNiO3
Support: SrTiO3
Sample-Specific Conditions
- A-site element: Nd
- NdNiO3 thin film on STO
Measurement
We plan to measure the Ni L2 XANES spectrum of this sample.
Questions
Based on all the information above:
1. Based on the sample conditions (NdNiO3 thin film grown on an STO substrate), identify the expected Ni oxidation states present and estimate their relative fractions.
2. Explain the physical reasoning for the presence of the minority Ni oxidation state in this NdNiO3 thin film. How does the choice of the A-site element (Nd) and the substrate influence this?
3. What specific spectral features or basis functions are required to fit the Ni L2-edge XANES spectrum of this sample to quantify the Ni valence states?
Ground Truth
Material: NdNiO3
Measurement: Ni L2-edge XAS, ex-situ, room temperature, Beijing Synchrotron Radiation Facility
Fit method: Peak fitting using Gaussian functions
Phase fractions: (±10%)
| Phase | Fraction |
|---|---|
| Ni2+ (alpha peak) | 0.05 |
| Ni3+ (beta peak) | 0.95 |
Fit basis (paper's reference spectra):
- Gaussian function for low-energy feature α (Ni2+)
- Gaussian function for higher-energy feature β (Ni3+)
Source evidence: Figure 3a (Ni L2-edge spectra) and Figure 3c (relative intensity of peak α)
Key reasoning: Decreasing the A-site rare earth ionic radius from La to Nd increases tensile strain from the STO substrate, which lowers the energy of oxygen vacancy formation. The incorporation of these oxygen vacancies requires a portion of Ni3+ to reduce to Ni2+ to maintain charge neutrality. Consequently, the NdNiO3 film exhibits a small fraction of Ni2+ (represented by the α peak) alongside the dominant Ni3+ state (represented by the β peak).
Reasoning source: Section 2.2 (Structural Analysis) and Section 2.3 (Ni Valence and Ni-O Hybridization Changes probed by X-Ray Absorption Spectroscopy)
Scoring Rubric (total: 100 pts)
| Q | Type | Max | Question | Reference Answer | Scoring Criteria |
|---|---|---|---|---|---|
| q1 | quantification | 30 | Based on the sample conditions (NdNiO3 thin film grown on an STO substrate), identify the expected Ni oxidation states present and estimate their relative fractions. | The expected Ni oxidation states in the NdNiO3 thin film on STO are a dominant Ni3+ state and a minority Ni2+ state. Specifically, the relative fractions are estimated to be 95% Ni3+ and 5% Ni2+, with an uncertainty of 10%. These specific fractions arise because using Nd as the A-site element decreases the rare earth ionic radius, which increases the tensile strain exerted by the STO substrate. This increased tensile strain lowers the formation energy for oxygen vacancies, and to maintain charge neutrality upon their incorporation, a small portion (5%) of the native Ni3+ must reduce to Ni2+. | Full credit for identifying both Ni2+ and Ni3+ states and estimating fractions near 5% for Ni2+ and 95% for Ni3+. Partial credit for identifying the states without accurate fractions. |
| q2 | reasoning | 40 | Explain the physical reasoning for the presence of the minority Ni oxidation state in this NdNiO3 thin film. How does the choice of the A-site element (Nd) and the substrate influence this? | The minority Ni oxidation state present in this sample is Ni2+, which emerges due to the formation of oxygen vacancies within the NdNiO3 thin film. The choice of Nd as the A-site element is crucial because its smaller ionic radius increases the tensile strain imposed by the SrTiO3 (STO) substrate. This substrate-induced tensile strain lowers the energy required to form oxygen vacancies in the lattice. Consequently, as oxygen vacancies are incorporated into the film, a corresponding fraction of the native Ni3+ ions must reduce to Ni2+ to maintain overall charge neutrality. This strain-driven defect mechanism directly explains why the sample conditions yield a 5% Ni2+ minority state alongside the 95% Ni3+ majority state. | Full credit for explaining that the smaller ionic radius of Nd (compared to La) increases tensile strain on the STO substrate, which promotes the formation of oxygen vacancies. Must explicitly state that these oxygen vacancies cause the partial reduction of Ni3+ to Ni2+ to maintain charge neutrality. |
| q3 | identification | 30 | What specific spectral features or basis functions are required to fit the Ni L2-edge XANES spectrum of this sample to quantify the Ni valence states? | To fit the Ni L2-edge XANES spectrum of this sample, the required basis functions are two distinct Gaussian functions corresponding to the different Ni valence states. Specifically, a Gaussian function is needed for the low-energy feature α representing Ni2+, and another Gaussian function is needed for the higher-energy feature β representing Ni3+. These specific spectral features are required because the NdNiO3 thin film on the STO substrate experiences increased tensile strain due to the smaller Nd A-site ionic radius, which lowers the energy for oxygen vacancy formation. The incorporation of these vacancies forces a partial reduction of Ni3+ to Ni2+ to maintain charge neutrality. Therefore, the fitting model must account for both the dominant Ni3+ (β peak) and the minority Ni2+ (α peak) generated by the strain-induced oxygen vacancies. | Full credit for identifying that the fit requires Gaussian functions (or similar peak shapes) corresponding to a low-energy feature (α) for Ni2+ and a higher-energy main feature (β) for Ni3+. |
Review
#64
SmNiO3
Ni L2
▶
LLM Prompt
Sample Information
Material: SmNiO3
Support: SrTiO3
Sample-Specific Conditions
- A-site element: Sm
- SmNiO3 thin film on STO
Measurement
We plan to measure the Ni L2 XANES spectrum of this sample.
Questions
Based on all the information above:
1. Based on the sample conditions (SmNiO3 thin film on STO), what are the expected Ni oxidation states and their approximate fractions?
2. What physical mechanism drives the formation of the minority Ni oxidation state in this SmNiO3 film?
Ground Truth
Material: SmNiO3
Measurement: Ni L2-edge XANES, ex-situ, Beijing Synchrotron Radiation Facility
Fit method: Gaussian peak fitting
Phase fractions: (±10%)
| Phase | Fraction |
|---|---|
| Ni2+ | 0.1 |
| Ni3+ | 0.9 |
Fit basis (paper's reference spectra):
- Gaussian function for alpha peak (Ni2+)
- Gaussian function for beta peak (Ni3+)
Source evidence: Figure 3a and 3c, page 18
Key reasoning: The smaller rare earth radius of Sm leads to the incorporation of more oxygen vacancies under the same synthesis and processing conditions due to tensile strain from the substrate. To maintain charge neutrality, a portion of Ni ions reduces from Ni3+ to Ni2+.
Reasoning source: Section 2.3 (page 7) and Section 2.4 (page 10)
Scoring Rubric (total: 100 pts)
| Q | Type | Max | Question | Reference Answer | Scoring Criteria |
|---|---|---|---|---|---|
| q1 | quantification | 43 | Based on the sample conditions (SmNiO3 thin film on STO), what are the expected Ni oxidation states and their approximate fractions? | The expected Ni oxidation states in the SmNiO3 thin film on the SrTiO3 (STO) substrate are Ni3+ and Ni2+, with approximate fractions of 90% (0.9) and 10% (0.1), respectively. These specific values and states arise because the smaller rare earth radius of the Sm A-site element induces tensile strain from the STO substrate. This strain promotes the incorporation of oxygen vacancies into the film under the synthesis conditions. Consequently, to maintain overall charge neutrality in the material, a 10% portion of the native Ni3+ ions must reduce to the minority Ni2+ state. | Full credit for identifying Ni3+ as the dominant state (~90%) and Ni2+ as the minority state (~10%). Partial credit for identifying the correct oxidation states without accurate fractions. |
| q2 | reasoning | 57 | What physical mechanism drives the formation of the minority Ni oxidation state in this SmNiO3 film? | The minority Ni oxidation state in this sample is Ni2+, which forms due to a combination of geometric and electrostatic mechanisms. Specifically, the smaller rare earth radius of the Sm A-site element results in tensile strain when grown as a thin film on the SrTiO3 (STO) substrate. This tensile strain drives the incorporation of excess oxygen vacancies into the SmNiO3 lattice during synthesis and processing. To maintain charge neutrality in the presence of these oxygen vacancies, a portion of the native Ni3+ ions is forced to reduce to Ni2+. | Full credit for explaining that the smaller rare earth radius of Sm leads to the incorporation of oxygen vacancies (due to tensile strain), which causes a partial reduction of Ni3+ to Ni2+ to maintain charge neutrality. |
Review
#65
GdNiO3
Ni L2
▶
LLM Prompt
Sample Information
Material: GdNiO3
Support: SrTiO3
Sample-Specific Conditions
- A-site element: Gd
- GdNiO3 thin film on STO
Measurement
We plan to measure the Ni L2 XANES spectrum of this sample.
Questions
Based on all the information above:
1. Based on the sample conditions (GdNiO3 thin film on STO), what are the expected Ni oxidation states present in the film, and what are their approximate relative fractions?
2. Explain the physical mechanism that leads to the specific mixture of Ni oxidation states in this GdNiO3 thin film, considering the role of the A-site element and the substrate.
3. What mathematical or spectral basis functions are needed to quantify the relative amounts of these Ni oxidation states from the Ni L2-edge XANES data, as performed in the study?
Ground Truth
Material: GdNiO3 thin film on SrTiO3
Measurement: Ni L2-edge XAS, ex-situ, Beijing Synchrotron Radiation Facility
Fit method: Gaussian peak fitting
Phase fractions: (±10%)
| Phase | Fraction |
|---|---|
| Ni2+ (alpha peak) | 0.2 |
| Ni3+ (beta peak) | 0.8 |
Fit basis (paper's reference spectra):
- Gaussian function for alpha peak (Ni2+)
- Gaussian function for beta peak (Ni3+)
Source evidence: Figure 3a, Figure 3c, and Section 2.3 (page 7)
Key reasoning: Decreasing the A-site rare earth ionic radius from La to Gd increases the tensile strain from the STO substrate. This strain is relaxed through the formation of oxygen vacancies. To maintain charge neutrality, a portion of the Ni3+ ions are reduced to Ni2+, which is reflected in the increased intensity of the low-energy alpha peak in the Ni L2-edge spectrum.
Reasoning source: Sections 2.2 and 2.3, pages 6-7
Scoring Rubric (total: 100 pts)
| Q | Type | Max | Question | Reference Answer | Scoring Criteria |
|---|---|---|---|---|---|
| q1 | quantification | 35 | Based on the sample conditions (GdNiO3 thin film on STO), what are the expected Ni oxidation states present in the film, and what are their approximate relative fractions? | The expected Ni oxidation states in the GdNiO3 thin film are Ni2+ and Ni3+, with approximate relative fractions of 0.2 (20%) and 0.8 (80%), respectively, alongside a 10% uncertainty. These specific fractions arise because the small ionic radius of the A-site Gd element increases the tensile strain exerted by the SrTiO3 (STO) substrate. To relax this strain, oxygen vacancies form within the film. Consequently, to maintain charge neutrality, a portion of the native Ni3+ ions must be reduced to Ni2+, resulting in the observed 20% Ni2+ and 80% Ni3+ mixture. | Full credit for identifying Ni2+ and Ni3+ with fractions of approximately 20% and 80%, respectively. Partial credit for identifying the correct oxidation states without accurate fractions. |
| q2 | reasoning | 45 | Explain the physical mechanism that leads to the specific mixture of Ni oxidation states in this GdNiO3 thin film, considering the role of the A-site element and the substrate. | The mixture of Ni2+ and Ni3+ oxidation states is driven by the strain interaction between the A-site element and the substrate. Specifically, using Gd with its smaller rare earth ionic radius increases the tensile strain exerted by the SrTiO3 (STO) substrate on the GdNiO3 thin film. The film relaxes this increased tensile strain through the formation of oxygen vacancies. To maintain overall charge neutrality in the presence of these oxygen vacancies, a portion of the native Ni3+ ions are reduced to Ni2+, yielding the observed 0.2 Ni2+ and 0.8 Ni3+ fractions. | Full credit for explaining that the smaller Gd ionic radius increases tensile strain from the STO substrate, leading to the formation of oxygen vacancies, which in turn reduces a portion of Ni3+ to Ni2+ to maintain charge neutrality. |
| q3 | identification | 20 | What mathematical or spectral basis functions are needed to quantify the relative amounts of these Ni oxidation states from the Ni L2-edge XANES data, as performed in the study? | To quantify the relative amounts of the Ni oxidation states, Gaussian peak fitting is used as the mathematical basis. Specifically, the fit requires a Gaussian function for the low-energy alpha peak representing Ni2+ and a Gaussian function for the beta peak representing Ni3+. These specific basis functions are necessary because the GdNiO3 thin film on the SrTiO3 substrate contains a mixture of Ni2+ and Ni3+ states. This mixed state occurs because the small ionic radius of the A-site Gd induces tensile strain from the substrate, which is relaxed by forming oxygen vacancies that reduce some Ni3+ to Ni2+ to maintain charge neutrality, producing these distinct spectral features. | Full credit for stating that Gaussian functions (or peak fitting) corresponding to the alpha (Ni2+) and beta (Ni3+) peaks are used as the basis for quantification. |
Review
#66
GdNiO3
Ni L2
▶
LLM Prompt
Sample Information
Material: GdNiO3
Support: SrTiO3
Sample-Specific Conditions
- Growth PO2: 0.2 mTorr
- GdNiO3 thin film on STO grown at lower PO2
Measurement
We plan to measure the Ni L2 XANES spectrum of this sample.
Questions
Based on all the information above:
1. What candidate oxidation states or spectral features should be used to model the Ni L2-edge XANES spectrum of this sample?
2. Estimate the relative fractions of the Ni oxidation states in this sample grown at 0.2 mTorr.
3. Explain the physical reasoning for the expected Ni oxidation states in this sample grown at a lower PO2 of 0.2 mTorr.
Ground Truth
Material: GdNiO3 thin film on SrTiO3
Measurement: Ni L2-edge XAS, ex-situ, Beijing Synchrotron Radiation Facility
Fit method: Gaussian peak fitting
Phase fractions: (±10%)
| Phase | Fraction |
|---|---|
| Ni2+ (alpha peak) | 0.45 |
| Ni3+ (beta peak) | 0.55 |
Fit basis (paper's reference spectra):
- Ni2+ (alpha peak)
- Ni3+ (beta peak)
Source evidence: Figure 3a (bottom panel) and Figure 3c, page 18
Key reasoning: The GdNiO3 film grown at a lower PO2 of 0.2 mTorr was intentionally synthesized to introduce more oxygen vacancies. To maintain charge neutrality upon the formation of oxygen vacancies, a portion of the Ni ions must reduce from Ni3+ to Ni2+. This reduction is reflected in the XAS data by a significant increase in the low-energy feature ('alpha') corresponding to Ni2+.
Reasoning source: Section 2.3, page 7
Scoring Rubric (total: 101 pts)
| Q | Type | Max | Question | Reference Answer | Scoring Criteria |
|---|---|---|---|---|---|
| q1 | identification | 25 | What candidate oxidation states or spectral features should be used to model the Ni L2-edge XANES spectrum of this sample? | The Ni L2-edge XANES spectrum should be modeled using Ni2+ (alpha peak) and Ni3+ (beta peak) spectral features. These specific oxidation states are expected because the GdNiO3 thin film on SrTiO3 was grown at a lower oxygen partial pressure (PO2) of 0.2 mTorr, which intentionally introduces oxygen vacancies into the lattice. To maintain charge neutrality in the presence of these oxygen vacancies, a portion of the native Ni3+ ions must reduce to Ni2+. Consequently, the spectrum exhibits a low-energy 'alpha' feature corresponding to the newly formed Ni2+ alongside the 'beta' peak of the remaining Ni3+. | Full points for identifying Ni2+ and Ni3+ states (or corresponding low-energy alpha and high-energy beta peaks). |
| q2 | quantification | 38 | Estimate the relative fractions of the Ni oxidation states in this sample grown at 0.2 mTorr. | The estimated relative fractions for the Ni oxidation states are 45% Ni2+ (alpha peak) and 55% Ni3+ (beta peak), with an uncertainty of 10%. These specific values result from the synthesis of the GdNiO3 thin film on SrTiO3 at the low growth PO2 of 0.2 mTorr. This low oxygen pressure environment drives the formation of a significant concentration of oxygen vacancies in the film. To compensate for the missing oxygen anions and maintain overall charge neutrality, nearly half of the nickel ions are forced to reduce from their native Ni3+ state to Ni2+, yielding the observed 45/55 ratio. | Full points for estimating ~45% Ni2+ and ~55% Ni3+ (accept within +/- 10%). |
| q3 | reasoning | 38 | Explain the physical reasoning for the expected Ni oxidation states in this sample grown at a lower PO2 of 0.2 mTorr. | In a stoichiometric GdNiO3 film, nickel naturally exists in a Ni3+ oxidation state. However, growing the thin film on SrTiO3 at a lower PO2 of 0.2 mTorr intentionally introduces a high concentration of oxygen vacancies into the material. To maintain overall charge neutrality upon the loss of these oxygen anions, a corresponding portion of the Ni cations must undergo chemical reduction. As a result, a significant fraction of the Ni3+ ions reduce to Ni2+, which manifests in the XAS data as a prominent low-energy 'alpha' peak alongside the original Ni3+ 'beta' peak. | Full points for explaining that lower oxygen pressure during growth introduces oxygen vacancies, which forces the reduction of Ni3+ to Ni2+ to maintain charge neutrality. |
Review
High‐Voltage Charging‐Induced Strain, Heterogeneity, and Micro‐Cracks in Secondary Particles of a Nickel‐Rich Layered Cathode Material
BNL-NSLS-II-8-ID
Electrochemistry
Yuwei Mao et al.
DOI: 10.1002/adfm.201900247
3 scenarios
▶
#67
LiNi0.6Mn0.2Co0.2O2
Ni K-edge
▶
LLM Prompt
Sample Information
Material: LiNi0.6Mn0.2Co0.2O2
Electrode Type: cathode
Electrolyte: 1M LiPF6 in EC:EMC (1:2 v/v) with 2 wt.% VC
Cell Type: coin cell
Charge Discharge: discharged
C Rate: C/8
Voltage V: 3.0-4.4
State Of Charge: discharged to 3V
Cycle Number: 30
Sample-Specific Conditions
- charge cut-off voltage: 4.4V
- NMC622 secondary particles cycled 30 times between 3V and 4.4V, measured at the discharged state (3V).
Measurement
We plan to measure the Ni K-edge XANES spectrum of this sample.
Questions
Based on all the information above:
1. What distinct chemical states or spectral clusters are expected to be identified in the spatially resolved Ni K-edge XANES data for this NMC622 particle cycled between 3V and 4.4V?
2. Estimate the relative area fractions of the different Ni oxidation state clusters present in the secondary particle at the discharged state (3V) after 30 cycles to 4.4V.
3. Explain the physical origin of the coexistence of these two different average Ni oxidation states in the discharged particle, and what this indicates about the electrochemical cycling behavior within the secondary particle.
Ground Truth
Material: LiNi0.6Mn0.2Co0.2O2
Measurement: Ni K-edge transmission X-ray spectro-microscopy (TXM)
Fit method: Unsupervised machine learning (K-Means clustering) of spatially resolved spectra
Phase fractions:
| Phase | Fraction |
|---|---|
| Cluster 2# (Average-) | 0.532 |
| Cluster 3# (Average+) | 0.468 |
Fit basis (paper's reference spectra):
- Cluster 2# (Average-)
- Cluster 3# (Average+)
Source evidence: Figure 3 and text on page 8
Key reasoning: Cycling between 3V and 4.4V results in good reversibility with negligible capacity fade. However, unsupervised clustering of the spectro-microscopic data reveals two distinct clusters (2# and 3#) corresponding to more reduced and more oxidized average oxidation states of Ni. The random distribution of these two states indicates charge heterogeneity at the particle level, caused by non-uniform Li distribution within the particle even at the discharged state.
Reasoning source: Section 2. Results and Discussion, page 8
Scoring Rubric (total: 100 pts)
| Q | Type | Max | Question | Reference Answer | Scoring Criteria |
|---|---|---|---|---|---|
| q1 | identification | 25 | What distinct chemical states or spectral clusters are expected to be identified in the spatially resolved Ni K-edge XANES data for this NMC622 particle cycled between 3V and 4.4V? | The spatially resolved Ni K-edge XANES data is expected to identify two distinct spectral clusters: Cluster 2# (Average-) and Cluster 3# (Average+). These clusters correspond to more reduced and more oxidized average oxidation states of Ni, respectively. These distinct states arise despite the NMC622 cathode being fully discharged to 3V after 30 cycles between 3.0V and 4.4V at a C/8 rate. The presence of these two distinct clusters is caused by charge heterogeneity at the particle level, which results from a non-uniform lithium distribution within the secondary particle even at the discharged state. | Full points for identifying two main clusters corresponding to a more reduced average oxidation state and a more oxidized average oxidation state. |
| q2 | quantification | 35 | Estimate the relative area fractions of the different Ni oxidation state clusters present in the secondary particle at the discharged state (3V) after 30 cycles to 4.4V. | The relative area fractions for the identified clusters are 0.532 (53.2%) for Cluster 2# (Average-) and 0.468 (46.8%) for Cluster 3# (Average+). These specific values result from the electrochemical cycling conditions of the NMC622 cathode, specifically after 30 cycles between 3.0V and 4.4V at a C/8 rate. Although the cycling shows good reversibility with negligible capacity fade, the nearly equal split between more reduced and more oxidized Ni states at the 3V discharged state indicates significant charge heterogeneity. This distribution is directly caused by a non-uniform lithium distribution within the secondary particle during the discharge process. | Full points for estimating approximately 53% for the more reduced average state (Cluster 2#) and 47% for the more oxidized average state (Cluster 3#). Deduct points for estimates outside a +/- 10% range. |
| q3 | reasoning | 40 | Explain the physical origin of the coexistence of these two different average Ni oxidation states in the discharged particle, and what this indicates about the electrochemical cycling behavior within the secondary particle. | The coexistence of the more reduced (Cluster 2#) and more oxidized (Cluster 3#) Ni states originates from a non-uniform lithium distribution within the NMC622 secondary particle. After 30 cycles between 3.0V and 4.4V at a C/8 rate, the particle is in a discharged state (3V) where a uniform, fully reduced Ni state might normally be expected. However, the random distribution of these two distinct oxidation states indicates significant charge heterogeneity at the particle level. This demonstrates that even with good overall electrochemical reversibility and negligible capacity fade, the local lithiation dynamics within the secondary particle remain spatially uneven during the discharge process. | Full points for explaining that the random distribution of more reduced and more oxidized states indicates charge heterogeneity at the particle level, which is caused by non-uniform Li distribution within the particle during cycling. |
Review
#68
LiNi0.6Mn0.2Co0.2O2
Ni K-edge
▶
LLM Prompt
Sample Information
Material: LiNi0.6Mn0.2Co0.2O2
Electrode Type: cathode
Electrolyte: 1M LiPF6 in EC:EMC (1:2 v/v) with 2 wt.% VC
Cell Type: coin cell
Charge Discharge: discharged
C Rate: C/8
Voltage V: 3.0-4.6
State Of Charge: discharged to 3V
Cycle Number: 30
Sample-Specific Conditions
- charge cut-off voltage: 4.6V
- NMC622 secondary particles cycled 30 times between 3V and 4.6V, measured at the discharged state (3V).
Measurement
We plan to measure the Ni K-edge XANES spectrum of this sample.
Questions
Based on all the information above:
1. Based on spatially resolved XANES analysis, identify the distinct chemical domains (clusters) present in the NMC622 secondary particles cycled to 4.6V at the discharged state, and estimate their relative fractions.
2. In the discharged state after cycling to 4.6V, a small fraction of the material exhibits a 'more-reduced' oxidation state resembling a NiO-like rocksalt phase. Describe the spatial distribution of this phase within the secondary particles and explain the degradation mechanism responsible for its formation.
3. Spatially resolved XANES reveals the presence of 'more-oxidized' domains in the bulk of the NMC622 particles even at the fully discharged state (3V). Explain the physical origin of these domains and why they remain oxidized during discharge.
Ground Truth
Material: LiNi0.6Mn0.2Co0.2O2
Measurement: Ni K-edge transmission X-ray spectro-microscopy (SSRL beamline 6-2C)
Fit method: Hybrid supervised and unsupervised machine learning (K-Means clustering)
Phase fractions:
| Phase | Fraction |
|---|---|
| Cluster 1# (More reduced) | 0.035 |
| Cluster 2# (Average-) | 0.515 |
| Cluster 3# (Average+) | 0.44 |
| Cluster 4# (More oxidized) | 0.01 |
Fit basis (paper's reference spectra):
- Cluster 1# (More reduced)
- Cluster 2# (Average-)
- Cluster 3# (Average+)
- Cluster 4# (More oxidized)
Source evidence: Figure 3, page 16
Key reasoning: High voltage cycling induces oxidation state inhomogeneities due to non-uniform delithiation and structural degradation. The more-reduced domains (Cluster 1#) form primarily on the particle surface due to surface reconstruction into a NiO-like rocksalt phase. The more-oxidized domains (Cluster 4#) are scattered in the bulk, representing electrochemically deactivated regions isolated by intragranular cracks. At a 4.6V cut-off, the extent of this bulk deactivation (1.0%) and surface reduction (3.5%) is moderate compared to cycling at higher voltages like 4.9V.
Reasoning source: Section 2 (Results and Discussion), pages 8-9
Scoring Rubric (total: 100 pts)
| Q | Type | Max | Question | Reference Answer | Scoring Criteria |
|---|---|---|---|---|---|
| q1 | quantification | 30 | Based on spatially resolved XANES analysis, identify the distinct chemical domains (clusters) present in the NMC622 secondary particles cycled to 4.6V at the discharged state, and estimate their relative fractions. | The spatially resolved XANES analysis identifies four distinct chemical domains in the NMC622 particles: Cluster 1# (More reduced) at 3.5%, Cluster 2# (Average-) at 51.5%, Cluster 3# (Average+) at 44.0%, and Cluster 4# (More oxidized) at 1.0%. These specific fractions arise because cycling the NMC622 cathode 30 times to a high charge cut-off voltage of 4.6V induces moderate oxidation state inhomogeneities due to structural degradation. Specifically, the 3.5% more-reduced fraction results from surface reconstruction into a NiO-like rocksalt phase during cycling. Meanwhile, the 1.0% more-oxidized fraction represents electrochemically deactivated regions isolated by intragranular cracks in the bulk. The extent of these degradation-induced domains remains moderate at the 4.6V cut-off compared to cycling at higher voltages. | Award 10 points for identifying the four domains (more reduced/rocksalt, average-, average+, more oxidized). Award 20 points for providing the correct fractions (~3.5% reduced, ~51.5% avg-, ~44% avg+, ~1% oxidized). |
| q2 | reasoning | 35 | In the discharged state after cycling to 4.6V, a small fraction of the material exhibits a 'more-reduced' oxidation state resembling a NiO-like rocksalt phase. Describe the spatial distribution of this phase within the secondary particles and explain the degradation mechanism responsible for its formation. | The 'more-reduced' NiO-like rocksalt phase (Cluster 1#) is primarily distributed on the surface of the NMC622 secondary particles. This spatial distribution occurs because cycling the cathode to a high voltage of 4.6V for 30 cycles triggers structural degradation at the particle-electrolyte interface. Specifically, the high-voltage cycling induces surface reconstruction, transforming the layered structure into a more-reduced rocksalt phase. This degradation mechanism accounts for the 3.5% fraction of the more-reduced domain observed in the discharged state (3V). The extent of this surface reduction is moderate at the 4.6V cut-off compared to more extreme cycling conditions like 4.9V. | Award 15 points for stating the more-reduced phase occurs primarily on the particle surface. Award 20 points for attributing it to surface reconstruction (layered to rocksalt phase transition) induced by high-voltage cycling. |
| q3 | reasoning | 35 | Spatially resolved XANES reveals the presence of 'more-oxidized' domains in the bulk of the NMC622 particles even at the fully discharged state (3V). Explain the physical origin of these domains and why they remain oxidized during discharge. | The 'more-oxidized' domains (Cluster 4#) are scattered throughout the bulk of the NMC622 secondary particles. These domains originate from structural degradation induced by cycling the cathode 30 times to a high charge cut-off voltage of 4.6V, which causes non-uniform delithiation and intragranular cracking. Because these cracks physically isolate certain regions within the bulk, these areas become electrochemically deactivated. Consequently, they cannot be properly relithiated during the discharge process to 3V, leaving a 1.0% fraction of the material trapped in a more-oxidized state. This bulk deactivation remains relatively moderate at the 4.6V cut-off compared to the more severe cracking seen when cycling at higher voltages. | Award 15 points for identifying them as electrochemically deactivated or isolated regions. Award 20 points for explaining that high-voltage cycling induces mechanical strain and intragranular cracks, which isolate these domains from the conducting network and prevent them from being fully lithiated/reduced during discharge. |
Review
#69
LiNi0.6Mn0.2Co0.2O2
Ni K-edge
▶
LLM Prompt
Sample Information
Material: LiNi0.6Mn0.2Co0.2O2
Electrode Type: cathode
Electrolyte: 1M LiPF6 in EC:EMC (1:2 v/v) with 2 wt.% VC
Cell Type: coin cell
Charge Discharge: discharged
C Rate: C/8
Voltage V: 3.0-4.9
State Of Charge: discharged to 3V
Cycle Number: 30
Sample-Specific Conditions
- charge cut-off voltage: 4.9V
- NMC622 secondary particles cycled 30 times between 3V and 4.9V, measured at the discharged state (3V).
Measurement
We plan to measure the Ni K-edge XANES spectrum of this sample.
Questions
Based on all the information above:
1. Based on spatially resolved XANES analysis, what distinct chemical states (clusters or phases) of Ni are expected to coexist in NMC622 secondary particles after 30 cycles at a high charge cut-off voltage of 4.9V (measured at the discharged state)?
2. Estimate the relative area fractions of the distinct Ni chemical states (more reduced surface phase, average states, and more oxidized bulk domains) in the NMC622 particle cycled to 4.9V.
3. Explain the physical origin of the 'more-reduced' Ni domains observed in the 4.9V cycled sample and describe their expected spatial distribution within the secondary particle.
4. Why do isolated, 'more-oxidized' Ni domains appear in the bulk of the NMC622 particle after cycling to 4.9V, and what structural degradation mechanism is associated with their formation?
Ground Truth
Material: LiNi0.6Mn0.2Co0.2O2
Measurement: Transmission X-ray spectro-microscopy (TXM) at Ni K-edge, beamline 6-2C of SSRL
Fit method: Hybrid supervised and unsupervised machine learning (K-Means clustering)
Phase fractions:
| Phase | Fraction |
|---|---|
| Cluster 1# (More reduced) | 0.052 |
| Cluster 2# (Average-) | 0.464 |
| Cluster 3# (Average+) | 0.394 |
| Cluster 4# (More oxidized) | 0.09 |
Fit basis (paper's reference spectra):
- Cluster 1# (More reduced)
- Cluster 2# (Average-)
- Cluster 3# (Average+)
- Cluster 4# (More oxidized)
Source evidence: Figure 3 and Section 2 (Results and Discussion), pages 8-9
Key reasoning: High-voltage cycling to 4.9V induces significant oxidation state inhomogeneities and mechanical strain. The more-reduced domains (Cluster 1#) form a thin layer on the surface due to surface reconstruction from a layered structure to a NiO-like rocksalt phase, which is aggravated by the high voltage. The more-oxidized domains (Cluster 4#) are scattered in the bulk as isolated, deactivated regions, likely initiated by intragranular cracks caused by the large unit cell volume change and mechanical strain during deep delithiation.
Reasoning source: Section 2 (Results and Discussion), pages 8-9
Scoring Rubric (total: 100 pts)
| Q | Type | Max | Question | Reference Answer | Scoring Criteria |
|---|---|---|---|---|---|
| q1 | identification | 20 | Based on spatially resolved XANES analysis, what distinct chemical states (clusters or phases) of Ni are expected to coexist in NMC622 secondary particles after 30 cycles at a high charge cut-off voltage of 4.9V (measured at the discharged state)? | Based on K-Means clustering of the spatially resolved XANES data, four distinct chemical states of Ni are expected: Cluster 1# (More reduced), Cluster 2# (Average-), Cluster 3# (Average+), and Cluster 4# (More oxidized). These specific phases arise because cycling the NMC622 cathode to a high cut-off voltage of 4.9V for 30 cycles induces significant oxidation state inhomogeneities and mechanical strain. The extreme deep delithiation at 4.9V drives surface reconstruction to a NiO-like rocksalt phase, creating the more-reduced states. Simultaneously, the large unit cell volume changes cause intragranular cracking, leading to isolated, deactivated more-oxidized domains scattered in the bulk. | Full credit for identifying the presence of four distinct states: a more-reduced state (NiO-like rocksalt), two average states (average- and average+), and a more-oxidized state. |
| q2 | quantification | 30 | Estimate the relative area fractions of the distinct Ni chemical states (more reduced surface phase, average states, and more oxidized bulk domains) in the NMC622 particle cycled to 4.9V. | The relative area fractions for the Ni chemical states in the NMC622 particle are 0.052 for Cluster 1# (More reduced), 0.464 for Cluster 2# (Average-), 0.394 for Cluster 3# (Average+), and 0.09 for Cluster 4# (More oxidized). These specific values result from the severe degradation mechanisms triggered by the 4.9V high-voltage cycling over 30 cycles. The small 5.2% fraction of the more-reduced state reflects the formation of a thin surface layer due to layered-to-rocksalt surface reconstruction aggravated by the high voltage. Meanwhile, the 9% fraction of the more-oxidized state represents isolated, deactivated regions scattered in the bulk, which are caused by intragranular cracks resulting from mechanical strain and large volume changes during deep delithiation. | Full credit for estimating fractions close to: ~5% for the more-reduced state, ~85-86% combined for the average states (or ~46% average- and ~39% average+), and ~9% for the more-oxidized state. |
| q3 | reasoning | 25 | Explain the physical origin of the 'more-reduced' Ni domains observed in the 4.9V cycled sample and describe their expected spatial distribution within the secondary particle. | The 'more-reduced' Ni domains (Cluster 1#) originate from a surface reconstruction process where the original layered structure of the NMC622 material transforms into a NiO-like rocksalt phase. Spatially, these domains are expected to form a thin layer distributed on the surface of the secondary particles. This specific degradation mechanism occurs because the sample was subjected to a high charge cut-off voltage of 4.9V over 30 cycles. The extreme deep delithiation at this high voltage severely aggravates the structural instability at the particle-electrolyte interface, driving the localized reduction of nickel and the resulting surface phase transformation. | Full credit for explaining that the more-reduced domains originate from surface reconstruction (transformation from layered to NiO-like rocksalt phase) and are spatially confined to a thin layer on the surface of the secondary particle. |
| q4 | reasoning | 25 | Why do isolated, 'more-oxidized' Ni domains appear in the bulk of the NMC622 particle after cycling to 4.9V, and what structural degradation mechanism is associated with their formation? | The isolated, 'more-oxidized' Ni domains (Cluster 4#) appear scattered in the bulk of the NMC622 particle as deactivated regions that can no longer participate fully in the electrochemical reactions. The structural degradation mechanism associated with their formation is intragranular cracking. These cracks arise because cycling the cathode to a high cut-off voltage of 4.9V for 30 cycles induces extreme deep delithiation. This deep delithiation causes large unit cell volume changes and severe mechanical strain within the secondary particles, ultimately fracturing the grains and electronically isolating these oxidized bulk domains. | Full credit for linking the more-oxidized domains to local deactivation of the material caused by large mechanical strain, huge unit cell volume changes during deep delithiation, and the subsequent formation of intragranular cracks that isolate these regions. |
Review
Accelerating CO 2 Electroreduction to CO Over Pd Single‐Atom Catalyst
BNL-NSLS-II-8-ID
Electrochemistry
Qun He et al.
DOI: 10.1002/adfm.202000407
3 scenarios
▶
#70
Pd/C
Pd K-edge
▶
LLM Prompt
Sample Information
Material: Pd/C
Electrode Type: working electrode
Electrolyte: CO2-saturated 0.5 M NaHCO3
Cell Type: lab-made acryl H-cell
Voltage V: 0.3
Sample-Specific Conditions
- voltage: 0.3 V
- Commercial Pd/C catalyst at 0.3 V vs RHE before significant hydrogen evolution/hydride formation
Measurement
We plan to measure the Pd K-edge XANES spectrum of this sample.
Questions
Based on all the information above:
1. What is the expected dominant phase and oxidation state of the Pd/C catalyst at 0.3 V vs RHE in CO2-saturated 0.5 M NaHCO3?
2. Explain the physical reasoning for why this phase is present at 0.3 V and what structural transformation is avoided at this potential compared to more negative potentials during CO2 electroreduction.
3. Describe the distinguishing spectral feature in the XANES profile that confirms the absence of the hydride phase at 0.3 V.
Ground Truth
Material: Pd/C
Measurement: in-situ Pd K-edge XANES at 8-BM (QAS) NSLS-II
Fit method: not reported
Phase fractions: (±10%)
| Phase | Fraction |
|---|---|
| metallic_palladium | 1.0 |
Fit basis (paper's reference spectra):
- Pd foil
- PdO
Source evidence: Figure 3a, Section 2.3
Key reasoning: At 0.3 V vs RHE, the Pd/C catalyst remains as metallic Pd. The XANES profile does not show the shift toward lower energy that is characteristic of PdH formation, which only begins at more negative potentials (from -0.3 V).
Reasoning source: Section 2.3, page 9
Scoring Rubric (total: 100 pts)
| Q | Type | Max | Question | Reference Answer | Scoring Criteria |
|---|---|---|---|---|---|
| q1 | identification | 30 | What is the expected dominant phase and oxidation state of the Pd/C catalyst at 0.3 V vs RHE in CO2-saturated 0.5 M NaHCO3? | The expected dominant phase is metallic palladium (Pd) with an oxidation state of 0, comprising a fraction of 1.0 of the sample. This phase is expected because the applied voltage of 0.3 V vs RHE in the CO2-saturated 0.5 M NaHCO3 electrolyte is not negative enough to induce significant hydrogen evolution or hydride formation. Consequently, the commercial Pd/C catalyst remains entirely in its metallic state. The transition to palladium hydride (PdH) is avoided here, as it only begins at more negative potentials starting from -0.3 V. | Must identify metallic palladium (Pd0) as the dominant phase. |
| q2 | reasoning | 40 | Explain the physical reasoning for why this phase is present at 0.3 V and what structural transformation is avoided at this potential compared to more negative potentials during CO2 electroreduction. | At an applied potential of 0.3 V vs RHE in CO2-saturated 0.5 M NaHCO3, the Pd/C catalyst remains entirely as metallic Pd. This specific phase is present because the voltage is insufficiently negative to drive the structural transformation into palladium hydride (PdH). The formation of PdH, which involves the orbital hybridization of Pd and H during hydrogen evolution, only begins at more negative potentials, specifically from -0.3 V. Therefore, by maintaining the potential at 0.3 V, the catalyst avoids hydride formation and retains its pure metallic structure. | Must explain that at 0.3 V, the potential is not negative enough for progressive H diffusion into the Pd lattice to form palladium hydride (PdH), which typically occurs at potentials of -0.3 V and below. |
| q3 | spectral | 30 | Describe the distinguishing spectral feature in the XANES profile that confirms the absence of the hydride phase at 0.3 V. | The distinguishing spectral feature of the Pd K-edge XANES profile at 0.3 V is the absence of a shift toward lower energy, with the edge position remaining at approximately 24350 eV. The spectrum closely resembles that of pure metallic Pd. These features arise because the applied potential of 0.3 V vs RHE in the CO2-saturated electrolyte prevents significant hydrogen evolution. Without reaching more negative potentials (from -0.3 V), the orbital hybridization of Pd and H does not occur, meaning no palladium hydride (PdH) forms to cause the characteristic lower-energy shift. | Must mention the absence of a shift toward lower energy, which would otherwise indicate PdH formation and the consequent orbital hybridization of Pd and H. |
Review
#71
Pd/C
Pd K-edge
▶
LLM Prompt
Sample Information
Material: Pd/C
Electrode Type: working electrode
Electrolyte: CO2-saturated 0.5 M NaHCO3
Cell Type: lab-made acryl H-cell
Voltage V: -0.8
Sample-Specific Conditions
- voltage: -0.8 V
- Commercial Pd/C catalyst at -0.8 V vs RHE during CO2 electroreduction, showing hydride formation
Measurement
We plan to measure the Pd K-edge XANES spectrum of this sample.
Questions
Based on all the information above:
1. Based on the provided electrochemical conditions (-0.8 V vs RHE during CO2 electroreduction), what phase dominates the commercial Pd/C catalyst structure, and what is the physical driving force for this transformation?
2. Describe the expected changes in the Pd K-edge XANES spectral shape for this Pd/C catalyst as the potential is shifted from positive values down to -0.8 V vs RHE.
Ground Truth
Material: Commercial 10 wt% Pd/C
Measurement: in-situ Pd K-edge XANES at 8-BM (QAS) beamline, NSLS-II
Fit method: Qualitative spectral comparison (no explicit LCF reported for phase fractions)
Phase fractions: (±10%)
| Phase | Fraction |
|---|---|
| palladium_hydride (PdH) | 1.0 |
Fit basis (paper's reference spectra):
- Pd foil (Pd0)
- PdO (Pd2+)
Source evidence: Figure 3a and Section 2.3, page 7
Key reasoning: During CO2 electroreduction at negative potentials, typical Pd-based catalysts undergo a phase transition from Pd to PdH. The progressive H diffusion into the Pd lattice forms PdH, causing orbital hybridization of Pd and H. This is evidenced by the XANES profile showing a gradual shift toward lower energy starting from -0.3 V vs RHE, culminating at -0.8 V.
Reasoning source: Section 2.3 (Structure Evolution Based on In-Situ XAFS Analysis), page 7
Scoring Rubric (total: 100 pts)
| Q | Type | Max | Question | Reference Answer | Scoring Criteria |
|---|---|---|---|---|---|
| q1 | reasoning | 57 | Based on the provided electrochemical conditions (-0.8 V vs RHE during CO2 electroreduction), what phase dominates the commercial Pd/C catalyst structure, and what is the physical driving force for this transformation? | At an applied potential of -0.8 V vs RHE during CO2 electroreduction, the commercial Pd/C catalyst is entirely dominated by the palladium hydride (PdH) phase, representing a phase fraction of 1.0. This complete phase transition from metallic Pd to PdH is driven by the highly negative electrochemical potential. Specifically, the negative voltage promotes progressive hydrogen diffusion into the palladium lattice. This hydrogen insertion leads to orbital hybridization between Pd and H, fundamentally altering the catalyst structure to form bulk PdH under these operating conditions. | Full points for identifying palladium hydride (PdH) as the dominant phase and explaining that it forms due to progressive H diffusion into the Pd lattice and subsequent orbital hybridization of Pd and H at negative potentials. |
| q2 | spectral | 43 | Describe the expected changes in the Pd K-edge XANES spectral shape for this Pd/C catalyst as the potential is shifted from positive values down to -0.8 V vs RHE. | As the potential is shifted from positive values down to -0.8 V vs RHE, the Pd K-edge XANES spectrum exhibits a distinct and gradual shift toward lower energy. This spectral shift begins around -0.3 V vs RHE and culminates at the final -0.8 V condition. These spectral changes occur because the negative potential drives progressive hydrogen diffusion into the Pd lattice during CO2 electroreduction, resulting in orbital hybridization between Pd and H. Ultimately, this lower-energy shift serves as the primary spectral signature for the formation of bulk palladium hydride (PdH), distinguishing the Pd/C catalyst from single-atom variants that do not undergo this transformation. | Full points for stating that the XANES profile will show a gradual shift toward lower energy as the potential becomes more negative, reflecting the Pd-to-PdH phase transition. |
Review
#72
Pd-NC
Pd K-edge
▶
LLM Prompt
Sample Information
Material: Pd-NC
Electrode Type: working electrode
Electrolyte: CO2-saturated 0.5 M NaHCO3
Cell Type: lab-made acryl H-cell
Voltage V: 0.3
Sample-Specific Conditions
- voltage: 0.3 V
- Pd single-atom catalyst (Pd-NC) at 0.3 V vs RHE
Measurement
We plan to measure the Pd K-edge XANES spectrum of this sample.
Questions
Based on all the information above:
1. Based on the sample conditions (Pd single-atom catalyst at 0.3 V vs RHE), what is the expected dominant phase or structural motif of the Pd species, and why does it not undergo the phase transition to palladium hydride (PdH) typically observed in bulk Pd catalysts under CO2 reduction conditions?
2. What is the expected oxidation state of Pd in this single-atom catalyst, and what reference spectra would be appropriate to use to determine this state?
Ground Truth
Material: Pd-NC
Measurement: in-situ Pd K-edge XANES at 8-BM (QAS) beamline
Fit method: qualitative comparison of spectral shape
Phase fractions: (±10%)
| Phase | Fraction |
|---|---|
| Pd-N4 single atoms | 1.0 |
Fit basis (paper's reference spectra):
- Pd foil
- PdO
Source evidence: Figure 3c, Figure 3d, Section 2.3 (page 8)
Key reasoning: Pd-NC consists of isolated Pd atoms in a robust Pd-N4 configuration. Unlike Pd nanoparticles (Pd/C), which undergo a phase transition to palladium hydride (PdH) at negative potentials due to H diffusion into the Pd lattice, the isolated Pd atoms in Pd-NC cannot form a lattice to store H. Therefore, the Pd-N4 structure remains stable and does not form PdH.
Reasoning source: Section 2.3, page 7-8
Scoring Rubric (total: 100 pts)
| Q | Type | Max | Question | Reference Answer | Scoring Criteria |
|---|---|---|---|---|---|
| q1 | reasoning | 67 | Based on the sample conditions (Pd single-atom catalyst at 0.3 V vs RHE), what is the expected dominant phase or structural motif of the Pd species, and why does it not undergo the phase transition to palladium hydride (PdH) typically observed in bulk Pd catalysts under CO2 reduction conditions? | The expected dominant structural motif for the Pd-NC sample at 0.3 V vs RHE is 100% Pd-N4 single atoms on nitrogen-doped carbon. Under these specific electrochemical conditions in CO2-saturated 0.5 M NaHCO3, the material consists entirely of isolated Pd atoms stabilized in a robust Pd-N4 configuration. Unlike bulk Pd nanoparticles (Pd/C) that undergo a phase transition to palladium hydride (PdH) due to hydrogen diffusion into the metal lattice, this single-atom catalyst lacks a bulk lattice structure. Because the isolated Pd atoms cannot form a lattice to store hydrogen, the Pd-N4 structure remains highly stable and does not form PdH. | Full credit for identifying Pd-N4 single atoms as the dominant phase and explaining that the isolated nature of Pd atoms prevents the formation of a Pd lattice required for H storage and PdH formation. |
| q3 | identification | 33 | What is the expected oxidation state of Pd in this single-atom catalyst, and what reference spectra would be appropriate to use to determine this state? | The expected oxidation state of Pd in this single-atom catalyst is between 0 and 2+. To determine this state, Pd foil and PdO are the appropriate reference spectra to use as a fit basis for qualitative comparison of the spectral shape. Under the sample conditions of 0.3 V vs RHE in CO2-saturated 0.5 M NaHCO3, the Pd-NC material exists as isolated Pd atoms stabilized in a robust Pd-N4 configuration on nitrogen-doped carbon. Because these isolated Pd atoms are coordinated by nitrogen rather than forming a pure metallic lattice or a bulk oxide, their electronic structure reflects an intermediate oxidation state bounded by the metallic (Pd foil) and fully oxidized (PdO) references. | Full credit for stating the oxidation state is between 0 and 2+ and identifying Pd foil (Pd0) and PdO (Pd2+) as appropriate reference spectra. |
Review
Polaronic Conductivity in Cr2Ge2Te6 Single Crystals
BNL-NSLS-II-8-ID
Pure Phase
Yu Liu et al.
DOI: 10.1002/adfm.202105111
1 scenario
▶
#73
Cr2Ge2Te6
Cr K-edge
▶
LLM Prompt
Sample Information
Material: Cr2Ge2Te6
Crystal Structure: R-3h
Oxidation State: Cr3+
Sample Form: pulverized crystals
- Cr2Ge2Te6 single crystal
Measurement
We plan to measure the Cr K-edge XANES spectrum of this sample.
Questions
Based on all the information above:
1. What is the expected oxidation state of Cr in the Cr2Ge2Te6 sample, and what reference compound exhibits a similar Cr K-edge XANES spectrum?
2. What is the physical reasoning used to assign the oxidation state of Cr from the XANES data?
Ground Truth
Compound: Cr2Ge2Te6
Oxidation state: Cr3+
Measurement: Cr K-edge XANES at NSLS-II beamlines 4-ID and 8-ID
Edge position: not reported
Spectral shape: The Cr K-edge XANES spectrum is close to that of Cr2Te3, indicating a Cr3+ state.
Distinguishing features: not discussed in this paper
Key reasoning: The Cr K-edge XANES spectrum of Cr2Ge2Te6 is close to that of Cr2Te3, which confirms the presence of Cr3+ states in the material.
Reasoning source: Section II. RESULTS AND DISCUSSION, page 2
Scoring Rubric (total: 100 pts)
| Q | Type | Max | Question | Reference Answer | Scoring Criteria |
|---|---|---|---|---|---|
| q1 | spectral | 57 | What is the expected oxidation state of Cr in the Cr2Ge2Te6 sample, and what reference compound exhibits a similar Cr K-edge XANES spectrum? | The expected oxidation state of Cr in the pulverized Cr2Ge2Te6 single crystal sample is Cr3+, and its Cr K-edge XANES spectrum is very similar to that of the reference compound Cr2Te3. This specific oxidation state arises because the Cr2Ge2Te6 crystal structure (R-3h) inherently stabilizes the chromium atoms in a 3+ valence state. Consequently, the electronic structure and local coordination environment of Cr in Cr2Ge2Te6 closely mirror those found in Cr2Te3, producing a nearly identical spectral shape that confirms the Cr3+ state. | Award 20 points for identifying the oxidation state as Cr3+ and 20 points for stating the spectrum is similar to Cr2Te3. |
| q3 | reasoning | 43 | What is the physical reasoning used to assign the oxidation state of Cr from the XANES data? | The oxidation state of Cr in the Cr2Ge2Te6 sample is assigned as Cr3+ by directly comparing its Cr K-edge XANES spectrum to the known reference standard Cr2Te3. Because XANES is highly sensitive to the valence state and local electronic environment of the absorbing atom, the strong spectral similarity between the R-3h Cr2Ge2Te6 sample and Cr2Te3 confirms they share the same electronic configuration. Therefore, the inherent Cr3+ state dictated by the sample's composition and crystal structure is physically validated by this direct spectral matching. | Award 30 points for explaining that the assignment is based on the close similarity of the XANES spectrum to that of Cr2Te3, which has known Cr3+ states. |
Review
Dewetting of Pt Nanoparticles Boosts Electrocatalytic Hydrogen Evolution Due to Electronic Metal‐Support Interaction
ESRF-BM23
Catalyst
Shreyas Harsha et al.
DOI: 10.1002/adfm.202403628
1 scenario
▶
#74
Pt
Pt L3
▶
LLM Prompt
Sample Information
Material: Pt
Support: FTO
Reaction Conditions: ex-situ
Sample-Specific Conditions
- dewetting time: 0 h
- As-deposited 5 nm Pt film on FTO
Measurement
We plan to measure the Pt L3 XANES spectrum of this sample.
Questions
Based on all the information above:
1. Based on the sample conditions (as-deposited 5 nm Pt film on FTO prepared by magnetron sputtering), what is the expected chemical state and dominant phase of Pt, and why?
2. What distinguishing features in the Pt L3-edge XANES spectrum would confirm the presence of this specific phase compared to other possible Pt species?
3. If one were to perform Linear Combination Fitting (LCF) on the XANES spectrum of this sample to rule out oxidation, what reference spectra would be essential to include in the fit basis?
Ground Truth
Material: Pt
Measurement: Pt L3-edge fluorescence mode at beamline BM-23 (ESRF)
Fit method: not reported
Phase fractions: (±10%)
| Phase | Fraction |
|---|---|
| metallic_platinum | 1.0 |
Fit basis (paper's reference spectra):
- metallic Pt (Pt0)
Source evidence: Figure 6a, Page 5
Key reasoning: XANES spectra at the Pt L3-edge demonstrate that Pt is present in the metallic state (Pt0) in the as-deposited Pt5/FTO0 film. No Pt oxide phases could be detected, which is consistent with the preparation method (magnetron sputtering of a pure Pt target).
Reasoning source: Section 2. Results and Discussion, Pages 5-6
Scoring Rubric (total: 100 pts)
| Q | Type | Max | Question | Reference Answer | Scoring Criteria |
|---|---|---|---|---|---|
| q1 | identification | 35 | Based on the sample conditions (as-deposited 5 nm Pt film on FTO prepared by magnetron sputtering), what is the expected chemical state and dominant phase of Pt, and why? | The expected chemical state of Pt in the as-deposited 5 nm film on FTO is purely metallic Pt (Pt0), representing a fraction of 1.0. This dominant phase is expected because the sample was prepared via magnetron sputtering of a pure Pt target and has undergone 0 hours of dewetting. Under these specific ex-situ conditions, the preparation method directly results in a fully metallic film. Consequently, no Pt oxide phases are formed or detected in the as-deposited state. | Must identify the dominant phase as metallic Pt (Pt0) with an oxidation state of 0. Must explain that the sputtering process deposits pure metallic Pt and no oxide phases are formed. |
| q2 | spectral | 35 | What distinguishing features in the Pt L3-edge XANES spectrum would confirm the presence of this specific phase compared to other possible Pt species? | The Pt L3-edge XANES spectrum will exhibit the characteristic spectral shape of purely metallic Pt (Pt0). The primary distinguishing feature is the complete absence of spectral signatures corresponding to higher oxidation states, such as Pt(II) or Pt(IV) oxide phases. These specific spectral features arise because the sample is an as-deposited 5 nm Pt film (0 h dewetting) prepared by magnetron sputtering of a pure Pt target. This preparation method inherently prevents the formation of oxidized species, resulting in a spectrum that reflects a 100% metallic Pt0 state. | Must mention that the spectrum should show characteristic features of metallic Pt (Pt0) and lack features corresponding to higher oxidation states such as Pt(II) or Pt(IV) (e.g., no increased white line intensity typical of Pt oxides). |
| q3 | reasoning | 30 | If one were to perform Linear Combination Fitting (LCF) on the XANES spectrum of this sample to rule out oxidation, what reference spectra would be essential to include in the fit basis? | To perform Linear Combination Fitting (LCF) on this sample, the essential reference spectrum to include in the fit basis is metallic Pt (Pt0). To explicitly rule out oxidation, one would also consider Pt(II) and Pt(IV) oxide references, though the fit will ultimately yield a 1.0 fraction for metallic Pt. This result is expected because the sample is an as-deposited 5 nm Pt film on FTO (0 h dewetting time) prepared by magnetron sputtering of a pure Pt target. This specific preparation method inherently yields a pure metallic state, explaining why no oxide phases are detected and the Pt0 reference alone accounts for the entire fit. | Must state that a metallic Pt (Pt0) reference spectrum is essential, along with Pt oxide references (e.g., PtO, PtO2) to confirm the absence of higher oxidation states. |
Review
Selenium Migration and Local Structures in Cu‐Doped CdSeTe Solar Cells after Aging
APS
Thin Film
Srisuda Rojsatien et al.
DOI: 10.1002/adfm.202418977
3 scenarios
▶
#75
Cu-doped CdSeTe
Se K-edge
▶
LLM Prompt
Sample Information
Material: Cu-doped CdSeTe
Deposition Method: CSS
Substrate: glass/SnO2:F/SnO2/MZO
Film Thickness Nm: 6000
Composition Variable: Depth from TCO
Composition Value: 1.5 um
Sample-Specific Conditions
- Aging time: 0 hr
- Unaged Cu-doped CdSeTe solar cell, probed at 1.5 um from the TCO interface
Measurement
We plan to measure the Se K-edge XANES spectrum of this sample.
Questions
Based on all the information above:
1. What candidate reference spectra (defect configurations) should be included in the linear combination fitting basis to accurately model the Se K-edge XANES of this CdSeTe sample?
2. Estimate the phase fractions of the different Se local environments (defect structures) at a depth of 1.5 um from the TCO interface in the unaged (0 hr) device.
Ground Truth
Material: Cu-doped CdSeTe
Measurement: Se K-edge XANES, beamline 2-ID-D at Advanced Photon Source
Fit method: Linear combination fitting (LCF)
Phase fractions:
| Phase | Fraction |
|---|---|
| Se_i | 0.38 |
| Se_iTe_i-bipassivated V_Cd | 0.32 |
| Dislocation core Type I (1Se+5Cl) | 0.3 |
Fit basis (paper's reference spectra):
- Se antisites (SeCd)
- Se interstitials (Sei)
- Se-passivated Σ3(112) twinning
- Se-passivated dislocation cores
- Se-passivated cadmium vacancy (VCd)
- Se-Cl co-passivated dislocation cores
- strained CdSeTe
Source evidence: Page 18, text and Figure 6(c)
Key reasoning: In the Se-rich near-interface region (1.5 um depth), Se is predominantly found in interstitial configurations (Se_i) and passivating Cd vacancies (V_Cd). These Se-passivated V_Cd configurations are energetically favorable under Te-rich conditions and act as shallow-level defects that reduce hole-trapping. Additionally, significant Se-Cl co-segregation occurs at type I-dislocation cores, which is expected in this region because it tends to exhibit smaller grain sizes and higher densities of extended defects.
Reasoning source: Section 2.2, Pages 18-19
Scoring Rubric (total: 100 pts)
| Q | Type | Max | Question | Reference Answer | Scoring Criteria |
|---|---|---|---|---|---|
| q1 | identification | 33 | What candidate reference spectra (defect configurations) should be included in the linear combination fitting basis to accurately model the Se K-edge XANES of this CdSeTe sample? | To accurately model the Se K-edge XANES of this unaged Cu-doped CdSeTe sample, the linear combination fitting basis should include Se antisites (SeCd), Se interstitials (Sei), Se-passivated Σ3(112) twinning, Se-passivated dislocation cores, Se-passivated cadmium vacancies (VCd), Se-Cl co-passivated dislocation cores, and strained CdSeTe. These specific defect configurations are expected because the sample is probed at a depth of 1.5 um from the TCO interface, which corresponds to a Se-rich near-interface region. In this region, Se tends to form interstitial configurations and passivate Cd vacancies, which are energetically favorable under Te-rich conditions and act as shallow-level defects. Furthermore, the inclusion of Se-Cl co-passivated dislocation cores is necessary because this near-interface region typically exhibits smaller grain sizes and higher densities of extended defects, leading to significant Se-Cl co-segregation. | Full points if the answer lists the key Se-related defect configurations used as the basis, including Se interstitials, Se-passivated Cd vacancies, Se-Cl co-passivated dislocation cores, Se antisites, and strained CdSeTe. |
| q2 | quantification | 67 | Estimate the phase fractions of the different Se local environments (defect structures) at a depth of 1.5 um from the TCO interface in the unaged (0 hr) device. | At a depth of 1.5 um from the TCO interface in the unaged (0 hr) Cu-doped CdSeTe device, the Se local environments consist of 38% Se interstitials (Se_i), 32% Se_iTe_i-bipassivated V_Cd, and 30% Dislocation core Type I (1Se+5Cl). These specific fractions arise because this 1.5 um depth corresponds to the Se-rich near-interface region where Se predominantly forms interstitial configurations and passivates Cd vacancies. The high fraction of Se-passivated V_Cd (32%) occurs because these configurations are energetically favorable under Te-rich conditions, acting as shallow-level defects that reduce hole-trapping. Additionally, the substantial 30% fraction of Se-Cl co-passivated dislocation cores results from the smaller grain sizes and higher densities of extended defects characteristic of this near-interface region, which drives significant Se-Cl co-segregation. | Full points if the estimated fractions are within ±15% of the ground truth: ~38% Se interstitials (Se_i), ~32% Se_iTe_i-bipassivated V_Cd, and ~30% Dislocation core Type I (1Se+5Cl). |
Review
#76
Cu-doped CdSeTe
Se K-edge
▶
LLM Prompt
Sample Information
Material: Cu-doped CdSeTe
Deposition Method: CSS
Substrate: glass/SnO2:F/SnO2/MZO
Film Thickness Nm: 6000
Composition Variable: Depth from TCO
Composition Value: 4.0 um
Sample-Specific Conditions
- Aging time: 0 hr
- Unaged Cu-doped CdSeTe solar cell, probed at 4.0 um from the TCO interface
Measurement
We plan to measure the Se K-edge XANES spectrum of this sample.
Questions
Based on all the information above:
1. What candidate reference spectra or structural motifs should be included in the basis set to accurately model the Se local environments in this Cu-doped CdSeTe solar cell?
Ground Truth
Material: Cu-doped CdSeTe
Measurement: Se K-edge XANES, beamline 2-ID-D (Advanced Photon Source)
Fit method: Linear combination fitting (LCF) using simulated spectra
Phase fractions:
| Phase | Fraction |
|---|---|
| Se_Te | 0.62 |
| Se_iTe_i-bipassivated V_Cd | 0.18 |
| Dislocation core Type I (1Se) | 0.2 |
Fit basis (paper's reference spectra):
- Se antisites (SeCd)
- Se interstitials (Sei)
- Se-passivated Σ3(112) twinning
- Se-passivated dislocation cores
- Se-passivated cadmium vacancy (VCd)
- Se-Cl co-passivated dislocation cores
- strained CdSeTe (SeTe)
Source evidence: Figure 6c and text on page 20
Key reasoning: Deeper into the CdTe layer (3.0 to 4.0 um), Se readily diffuses during the CdCl2 treatment, incorporating predominantly into substitutional anionic lattice sites (SeTe) within the CdTe matrix. While extended defects enhance this diffusion, resulting in minor fractions of Se segregating to dislocation cores or forming passivated vacancy configurations (like SeiTei-bipassivated VCd), these defect environments are much less prevalent here than in the Se-rich near-interface region.
Reasoning source: Section 2.2, Page 20
Scoring Rubric (total: 100 pts)
| Q | Type | Max | Question | Reference Answer | Scoring Criteria |
|---|---|---|---|---|---|
| q1 | identification | 100 | What candidate reference spectra or structural motifs should be included in the basis set to accurately model the Se local environments in this Cu-doped CdSeTe solar cell? | To accurately model the Se local environments in this unaged Cu-doped CdSeTe solar cell, the basis set should include simulated spectra for Se antisites (SeCd), Se interstitials (Sei), Se-passivated Σ3(112) twinning, Se-passivated dislocation cores, Se-passivated cadmium vacancy (VCd), Se-Cl co-passivated dislocation cores, and strained CdSeTe (SeTe). These specific structural motifs are expected because, at a depth of 4.0 um from the TCO interface, Se readily diffuses deep into the CdTe layer during treatment. Consequently, Se predominantly incorporates into substitutional anionic lattice sites (SeTe) within the CdTe matrix. Furthermore, extended defects enhance this diffusion process, causing minor fractions of Se to segregate to dislocation cores or form passivated vacancy configurations, which necessitates the inclusion of these various defect environments in the fitting basis. | Full points if the answer identifies a comprehensive set of Se environments including substitutional Se (SeTe), Se interstitials, Se antisites, Se-passivated vacancies, and Se/Se-Cl passivated dislocation cores. |
Review
#77
Cu-doped CdSeTe
Cu K-edge
▶
LLM Prompt
Sample Information
Material: Cu-doped CdSeTe
Deposition Method: CSS
Substrate: glass/SnO2:F/SnO2/MZO
Film Thickness Nm: 6000
Composition Variable: Depth from TCO
Composition Value: bulk
Sample-Specific Conditions
- Aging time: 500 hr
- Aged Cu-doped CdSeTe solar cell, bulk region
Measurement
We plan to measure the Cu K-edge XANES spectrum of this sample.
Questions
Based on all the information above:
1. When performing a linear combination fitting (LCF) analysis on the Cu K-edge XANES spectra of this Cu-doped CdSeTe solar cell, what candidate reference spectra (including secondary phases and point defects) should be considered in the basis set?
Ground Truth
Material: Cu-doped CdSeTe
Measurement: Cu K-edge XANES, fluorescence mode, beamline 2-ID-D (Advanced Photon Source)
Fit method: Linear combination fitting (LCF)
Phase fractions:
| Phase | Fraction |
|---|---|
| metallic Cu | 1.0 |
Fit basis (paper's reference spectra):
- metallic Cu
- CuO
- Cu2O
- CuCl2
- Cu_Cd (Cu on Cd site)
- Cu_i (interstitial Cu)
Source evidence: Page 24, Page 25, Figure 7(c-d)
Key reasoning: Cu K-edge XANES spectra across the absorber in the aged device reveal dominant features consistent with a metallic Cu phase throughout the bulk of the device. The formation of metallic Cu suggests that Cu2+ ions from the CuCl2 precursor are reduced to Cu0, likely by excess Cd either at the back surface or introduced during the CdCl2 treatment. Linear combination analysis revealed no obvious spectral features associated with Cu point defects such as Cu_Cd or interstitial Cu (Cu_i).
Reasoning source: Section 2.2 (Micro-scale changes with aging), Pages 24-25
Scoring Rubric (total: 100 pts)
| Q | Type | Max | Question | Reference Answer | Scoring Criteria |
|---|---|---|---|---|---|
| q1 | identification | 100 | When performing a linear combination fitting (LCF) analysis on the Cu K-edge XANES spectra of this Cu-doped CdSeTe solar cell, what candidate reference spectra (including secondary phases and point defects) should be considered in the basis set? | When performing linear combination fitting (LCF) on the Cu K-edge XANES spectra of this sample, the candidate reference basis set should include metallic Cu, CuO, Cu2O, CuCl2, Cu on a Cd site (Cu_Cd), and interstitial Cu (Cu_i). These specific references are necessary to capture the evolution of Cu species in the bulk region of the Cu-doped CdSeTe solar cell after 500 hours of aging. CuCl2 accounts for the initial dopant precursor, while Cu_Cd and Cu_i represent potential point defects within the absorber lattice. Metallic Cu and copper oxides must be considered because, under these aging conditions, Cu2+ ions from the precursor are reduced to Cu0. This reduction is likely driven by excess Cd introduced during CdCl2 treatment or present at the back surface, ultimately resulting in metallic Cu becoming the dominant phase throughout the bulk of the aged device. | Full credit for identifying metallic Cu, copper oxides (CuO/Cu2O), copper chlorides (CuCl2), and Cu point defects (Cu_Cd, Cu_i). Partial credit for missing 1-2 minor components. |
Review
Oxygen Diode Formed in Nickelate Heterostructures by Chemical Potential Mismatch
APS
Thin Film
Er‐Jia Guo et al.
DOI: 10.1002/adma.201705904
4 scenarios
▶
#78
LaNiO3
Ni L2
▶
LLM Prompt
Sample Information
Material: LaNiO3
Deposition Method: PLD
Substrate: SrTiO3
Deposition Temperature C: 700
Composition Variable: Capping layer
Composition Value: None
Sample-Specific Conditions
- Capping layer: None
- Uncapped LaNiO3 thin film on STO substrate
Measurement
We plan to measure the Ni L2 XANES spectrum of this sample.
Questions
Based on all the information above:
1. Based on the sample conditions (uncapped LaNiO3 thin film on STO), what is the expected dominant oxidation state of Ni, and why?
2. Describe the expected spectral shape of the Ni L2-edge XANES for this sample, including any specific peak positions.
3. What spectral feature would distinguish this stoichiometric LaNiO3 film from an oxygen-deficient LaNiO3 film?
Ground Truth
Material: LaNiO3
Measurement: Ni L2-edge XAS, fluorescence yield (FY) mode, beamline 4-ID-C of the Advanced Photon Source
Fit method: Gaussian deconvolution
Phase fractions: (±5%)
| Phase | Fraction |
|---|---|
| Ni3+ | 1.0 |
| Ni2+ | 0.0 |
Fit basis (paper's reference spectra):
- Three Gaussian functions
Source evidence: Page 4, Figure 3a and 3f
Key reasoning: The LNO single layer spectrum reveals a single peak at 871.3 eV, representative of octahedrally coordinated Ni3+. This confirms the film is nearly stoichiometric without detectable oxygen vacancies. The absence of a capping layer prevents the chemical potential mismatch that drives oxygen vacancy formation in the heterostructures.
Reasoning source: Page 4, Section discussing Figure 3
Scoring Rubric (total: 99 pts)
| Q | Type | Max | Question | Reference Answer | Scoring Criteria |
|---|---|---|---|---|---|
| q1 | reasoning | 33 | Based on the sample conditions (uncapped LaNiO3 thin film on STO), what is the expected dominant oxidation state of Ni, and why? | The expected dominant oxidation state of Ni in this sample is 3+, with a fraction of 1.0 and no detectable Ni2+. This pure oxidation state is expected because the sample is an uncapped LaNiO3 thin film grown on an STO substrate. The absence of a capping layer prevents the chemical potential mismatch that typically drives oxygen vacancy formation in heterostructures. As a result, the film remains nearly stoichiometric, stabilizing the octahedrally coordinated Ni3+ state without reduction. | 10 points for identifying Ni3+ as the dominant state. 15 points for explaining that the uncapped film remains nearly stoichiometric without detectable oxygen vacancies, as there is no capping layer to induce a chemical potential mismatch. |
| q2 | spectral | 33 | Describe the expected spectral shape of the Ni L2-edge XANES for this sample, including any specific peak positions. | The expected spectral shape of the Ni L2-edge XANES features a single main peak, labeled 'beta', located at 871.3 eV. This specific spectral feature originates from octahedrally coordinated Ni3+ ions in the lattice. Because the sample is an uncapped LaNiO3 film, it avoids the chemical potential mismatch that causes oxygen vacancies, maintaining a nearly stoichiometric composition. Consequently, the spectrum reflects a pure Ni3+ electronic state and lacks any lower energy shoulders associated with oxygen deficiency. | 10 points for mentioning a single main peak. 15 points for specifying the peak position at approximately 871.3 eV. |
| q3 | spectral | 33 | What spectral feature would distinguish this stoichiometric LaNiO3 film from an oxygen-deficient LaNiO3 film? | This stoichiometric LaNiO3 film is distinguished by the complete absence of a low-energy peak, labeled 'alpha', located around 869.5 eV. The 'alpha' peak is indicative of the Ni2+ electronic state, which emerges when oxygen vacancies disrupt the lattice. Because this specific sample is an uncapped LaNiO3 film, it does not experience the chemical potential mismatch that drives oxygen vacancy formation in capped heterostructures. Therefore, the film remains stoichiometric, and the spectrum only exhibits the single 871.3 eV peak corresponding to pure, octahedrally coordinated Ni3+. | 25 points for identifying the absence of a lower energy peak (around 869.5 eV) that would indicate the presence of Ni2+ in oxygen-deficient samples. |
Review
#79
BaTiO3/LaNiO3
Ni L2
▶
LLM Prompt
Sample Information
Material: BaTiO3/LaNiO3
Deposition Method: PLD
Substrate: SrTiO3
Deposition Temperature C: 700
Composition Variable: Capping layer
Composition Value: BaTiO3
Sample-Specific Conditions
- Capping layer: BaTiO3
- BaTiO3 capped LaNiO3 thin film on STO substrate
Measurement
We plan to measure the Ni L2 XANES spectrum of this sample.
Questions
Based on all the information above:
1. Based on the sample conditions (BaTiO3-capped LaNiO3 thin film), what candidate oxidation states of Ni are expected to be present, and what are their estimated relative fractions?
2. Explain the physical and thermodynamic mechanism that leads to the appearance of the minor Ni oxidation state in this heterostructure, despite the nominal stoichiometry of LaNiO3.
Ground Truth
Material: BaTiO3/LaNiO3
Measurement: Ni L2-edge XAS in fluorescence yield (FY) mode at beamline 4-ID-C of the Advanced Photon Source
Fit method: Gaussian deconvolution
Phase fractions: (±15%)
| Phase | Fraction |
|---|---|
| Ni3+ | 0.99 |
| Ni2+ | 0.01 |
Fit basis (paper's reference spectra):
- NiO bulk reference (for Ni2+ peak position)
- Gaussian functions at ~869.5 eV (peak α, Ni2+) and ~870.5 eV (peak β, Ni3+)
Source evidence: Figure 3b, Figure 3f, and Figure 3 caption, page 4
Key reasoning: Capping LaNiO3 with BaTiO3 creates a chemical potential mismatch that drives the formation of oxygen vacancies in the LNO layer. To maintain charge balance, the formation of oxygen vacancies causes the Ni valence to shift from Ni3+ toward Ni2+. Because the difference in oxygen vacancy formation energy between BTO and LNO is relatively small, only a slight reduction (around 1% Ni2+) occurs compared to other capping layers with larger formation energy differences.
Reasoning source: Page 4 (XAS analysis) and Page 5 (Thermodynamic consideration of oxygen activation)
Scoring Rubric (total: 100 pts)
| Q | Type | Max | Question | Reference Answer | Scoring Criteria |
|---|---|---|---|---|---|
| q1 | quantification | 43 | Based on the sample conditions (BaTiO3-capped LaNiO3 thin film), what candidate oxidation states of Ni are expected to be present, and what are their estimated relative fractions? | The expected oxidation states of Ni in the BaTiO3-capped LaNiO3 thin film are Ni3+ and Ni2+. The estimated relative fractions are 0.99 (99%) for Ni3+ and 0.01 (1%) for Ni2+, with an uncertainty of 15%. These specific fractions arise because capping the LaNiO3 film with BaTiO3 creates a chemical potential mismatch that drives the formation of oxygen vacancies in the LaNiO3 layer. To maintain charge balance, these oxygen vacancies force a slight shift in the Ni valence from the nominal Ni3+ toward Ni2+, but because the difference in oxygen vacancy formation energy between BaTiO3 and LaNiO3 is relatively small, only a minimal 1% reduction occurs. | Full credit for identifying Ni3+ as the dominant phase (~99%) and Ni2+ as a minor phase (~1%). |
| q2 | reasoning | 57 | Explain the physical and thermodynamic mechanism that leads to the appearance of the minor Ni oxidation state in this heterostructure, despite the nominal stoichiometry of LaNiO3. | The minor Ni2+ oxidation state appears in the nominally Ni3+ LaNiO3 film due to a chemical potential mismatch introduced by the BaTiO3 capping layer. This thermodynamic mismatch drives the formation of oxygen vacancies within the LaNiO3 layer. To maintain overall charge balance in the heterostructure, the creation of these oxygen vacancies necessitates a compensatory reduction of the nickel valence, shifting it from Ni3+ toward Ni2+. Because the difference in oxygen vacancy formation energy between the BaTiO3 cap and the LaNiO3 film is relatively small, this driving force is weak, resulting in only a minor 1% fraction of the Ni2+ state. | Full credit requires explaining that the BaTiO3 capping layer creates a chemical potential mismatch that drives oxygen vacancy formation in the LNO layer, which in turn forces a reduction of Ni3+ to Ni2+ to maintain charge balance. |
Review
#80
LaAlO3/LaNiO3
Ni L2
▶
LLM Prompt
Sample Information
Material: LaAlO3/LaNiO3
Deposition Method: PLD
Substrate: SrTiO3
Deposition Temperature C: 700
Composition Variable: Capping layer
Composition Value: LaAlO3
Sample-Specific Conditions
- Capping layer: LaAlO3
- LaAlO3 capped LaNiO3 thin film on STO substrate
Measurement
We plan to measure the Ni L2 XANES spectrum of this sample.
Questions
Based on all the information above:
1. Based on the sample conditions (LaAlO3 capped LaNiO3 thin film on STO), what are the expected Ni oxidation states and their approximate fractions?
2. What physical mechanism drives the appearance of the minority Ni oxidation state in this capped heterostructure?
Ground Truth
Material: LaAlO3/LaNiO3
Measurement: Ni L2-edge XAS in fluorescence yield (FY) mode at beamline 4-ID-C of the Advanced Photon Source
Fit method: Gaussian deconvolution
Phase fractions: (±15%)
| Phase | Fraction |
|---|---|
| Ni3+ | 0.97 |
| Ni2+ | 0.03 |
Fit basis (paper's reference spectra):
- Three Gaussian functions
- NiO bulk reference (for Ni2+ comparison)
Source evidence: Figure 3f, page 4
Key reasoning: The LaAlO3 capping layer induces a chemical potential mismatch with the underlying LaNiO3 film. This mismatch drives the formation and migration of oxygen vacancies across the heterointerface. Because the oxygen vacancy formation energy in LaAlO3 is higher than in LaNiO3, oxygen vacancies preferentially form in the LNO layer. The creation of oxygen vacancies in LNO reduces the Ni valence from Ni3+ towards Ni2+ to maintain charge balance. The Ni2+ state is identified by the appearance of a low-energy peak, which is compared to a NiO reference.
Reasoning source: Pages 4-6, discussion of thermodynamic consideration of oxygen activation and chemical potential mismatch
Scoring Rubric (total: 100 pts)
| Q | Type | Max | Question | Reference Answer | Scoring Criteria |
|---|---|---|---|---|---|
| q1 | quantification | 43 | Based on the sample conditions (LaAlO3 capped LaNiO3 thin film on STO), what are the expected Ni oxidation states and their approximate fractions? | For the LaAlO3 capped LaNiO3 thin film on an STO substrate, the expected Ni oxidation states are predominantly Ni3+ at a fraction of 0.97, with a minority Ni2+ fraction of 0.03 (with a 15% uncertainty). These specific fractions arise because the LaAlO3 capping layer creates a chemical potential mismatch with the underlying LaNiO3 film. This mismatch drives the formation and migration of oxygen vacancies across the heterointerface. Since the oxygen vacancy formation energy is higher in LaAlO3 than in LaNiO3, the vacancies preferentially form in the LaNiO3 layer. Consequently, a small portion of the Ni reduces from Ni3+ to Ni2+ to maintain charge balance, resulting in the observed 3% Ni2+ fraction. | Full points for identifying Ni3+ as the dominant phase (~97%) and a small amount of Ni2+ (~3%). Partial points for identifying both oxidation states without accurate fractions. |
| q2 | reasoning | 57 | What physical mechanism drives the appearance of the minority Ni oxidation state in this capped heterostructure? | The appearance of the minority Ni2+ oxidation state in the LaAlO3 capped LaNiO3 thin film is driven by a chemical potential mismatch between the capping layer and the underlying film. This mismatch induces the formation and migration of oxygen vacancies across the heterointerface. Because the formation energy for oxygen vacancies is higher in the LaAlO3 capping layer than in the LaNiO3 film, these vacancies preferentially accumulate in the LaNiO3 layer. To maintain charge balance in the presence of these newly formed oxygen vacancies, the nickel in the LaNiO3 layer is partially reduced from its native Ni3+ state to Ni2+. This reduction manifests spectrally as a low-energy peak in the Ni L2 XANES spectrum, which is identified by comparison to a NiO bulk reference. | Full points for explaining that the chemical potential mismatch (or difference in oxygen vacancy formation energies) between the LaAlO3 capping layer and LaNiO3 drives the formation of oxygen vacancies in the LNO layer, which reduces Ni3+ to Ni2+. |
Review
#81
SrTiO3/LaNiO3
Ni L2
▶
LLM Prompt
Sample Information
Material: SrTiO3/LaNiO3
Deposition Method: PLD
Substrate: SrTiO3
Deposition Temperature C: 700
Composition Variable: Capping layer
Composition Value: SrTiO3
Sample-Specific Conditions
- Capping layer: SrTiO3
- SrTiO3 capped LaNiO3 thin film on STO substrate
Measurement
We plan to measure the Ni L2 XANES spectrum of this sample.
Questions
Based on all the information above:
1. Based on the sample conditions (STO-capped LaNiO3 thin film), what are the expected Ni oxidation states present in the film, and what are their approximate fractions?
2. Explain the physical mechanism that leads to the emergence of the minor Ni oxidation state in this STO/LNO bilayer heterostructure.
3. To properly quantify the Ni oxidation states in the Ni L2-edge XANES spectrum of this sample, what specific reference spectra or basis states should be utilized?
Ground Truth
Material: SrTiO3/LaNiO3
Measurement: Ni L2-edge XAS in fluorescence yield (FY) mode at beamline 4-ID-C of the Advanced Photon Source
Fit method: Gaussian deconvolution
Phase fractions: (±10%)
| Phase | Fraction |
|---|---|
| Ni3+ | 0.948 |
| Ni2+ | 0.052 |
Fit basis (paper's reference spectra):
- NiO bulk reference (for Ni2+)
- Stoichiometric LNO single layer (for Ni3+)
Source evidence: Page 4, Figure 3d, Figure 3f, and text ('We roughly estimated that there is a reduction of Ni3+ to Ni2+ by ≈5.2% for the STO/LNO bilayer.')
Key reasoning: The STO capping layer induces oxygen vacancies (VO) in the underlying LNO film due to a chemical potential mismatch. The VO formation energy in LNO is lower than in STO, and STO's low oxygen migration energy facilitates oxygen diffusion out of the LNO layer. To maintain charge balance upon VO formation, the Ni valence in LNO shifts from Ni3+ toward Ni2+.
Reasoning source: Page 1 (Introduction) and Page 5 (Discussion of mechanisms)
Scoring Rubric (total: 100 pts)
| Q | Type | Max | Question | Reference Answer | Scoring Criteria |
|---|---|---|---|---|---|
| q1 | quantification | 30 | Based on the sample conditions (STO-capped LaNiO3 thin film), what are the expected Ni oxidation states present in the film, and what are their approximate fractions? | The expected Ni oxidation states in the STO-capped LaNiO3 thin film are Ni3+ and Ni2+, with approximate fractions of 94.8% and 5.2%, respectively (with a 10% uncertainty). These specific fractions arise because the SrTiO3 capping layer induces oxygen vacancies in the underlying LaNiO3 film due to a chemical potential mismatch. Specifically, the oxygen vacancy formation energy is lower in LaNiO3 than in SrTiO3, and SrTiO3's low oxygen migration energy allows oxygen to diffuse out of the LaNiO3 layer. Consequently, to maintain charge balance upon the formation of these oxygen vacancies, a small fraction (5.2%) of the Ni valence in the LaNiO3 film reduces from its native Ni3+ state to Ni2+. | Full points for identifying Ni3+ as the dominant phase (~95%) and Ni2+ as the minor phase (~5%). |
| q2 | reasoning | 40 | Explain the physical mechanism that leads to the emergence of the minor Ni oxidation state in this STO/LNO bilayer heterostructure. | The minor Ni2+ oxidation state emerges in the STO/LNO bilayer due to the formation of oxygen vacancies in the LaNiO3 layer, which is driven by a chemical potential mismatch with the SrTiO3 capping layer. Because the oxygen vacancy formation energy is lower in LaNiO3 compared to SrTiO3, vacancies preferentially form in the LaNiO3 film. Furthermore, the low oxygen migration energy of the SrTiO3 capping layer facilitates the diffusion of oxygen out of the LaNiO3 layer. To maintain overall charge balance in the heterostructure following this oxygen loss, a portion of the native Ni3+ ions must be reduced to Ni2+, resulting in the observed minor oxidation state. | Must explain that the STO capping layer causes oxygen vacancy (VO) formation in the LNO layer due to a chemical potential mismatch. Must mention that STO facilitates oxygen diffusion out of the LNO, and that the Ni valence reduces to maintain charge balance. |
| q3 | identification | 30 | To properly quantify the Ni oxidation states in the Ni L2-edge XANES spectrum of this sample, what specific reference spectra or basis states should be utilized? | To properly quantify the Ni oxidation states in the Ni L2-edge XANES spectrum, the fit basis should utilize a NiO bulk reference to represent the Ni2+ state and a stoichiometric LaNiO3 single layer to represent the Ni3+ state. These specific references are required because the SrTiO3 capping layer on the LaNiO3 thin film induces oxygen vacancies due to a chemical potential mismatch. The lower oxygen vacancy formation energy in LaNiO3 and the high oxygen mobility in SrTiO3 cause oxygen to diffuse out of the LaNiO3 layer. This oxygen loss forces a partial reduction of the native Ni3+ to Ni2+ to maintain charge balance, necessitating basis states for both Ni3+ and Ni2+ to accurately model the resulting mixed-valence spectrum. | Must identify the need for a Ni3+ reference (such as a stoichiometric LNO single layer) and a Ni2+ reference (such as bulk NiO). |
Review
High‐Performance, Long‐Life, Rechargeable Li–CO2 Batteries based on a 3D Holey Graphene Cathode Implanted with Single Iron Atoms
APS
Catalyst
Chuangang Hu et al.
DOI: 10.1002/adma.201907436
2 scenarios
▶
#82
Fe-ISA/N,S-HG
Fe K-edge
▶
LLM Prompt
Sample Information
Material: Fe-ISA/N,S-HG
Support: N,S-codoped holey graphene
Sample-Specific Conditions
- absorption edge: Fe K-edge
- Single iron atoms implanted into 3D porous N,S-codoped holey graphene
Measurement
We plan to measure the Fe K-edge XANES spectrum of this sample.
Questions
Based on all the information above:
1. Based on the synthesis method involving complexation, annealing at 900 °C in Ar/NH3, and subsequent acid leaching, what is the dominant Fe phase in the Fe-ISA/N,S-HG sample, and what is its expected oxidation state?
2. Describe the expected overall spectral profile and key distinguishing features of the Fe K-edge XANES for this single-atom catalyst sample.
3. How do the X-ray absorption data (both XANES and EXAFS) confirm the atomic dispersion of Fe and rule out the presence of metallic Fe clusters or nanoparticles?
Ground Truth
Material: Fe-ISA/N,S-HG
Measurement: Fe K-edge XANES, ex-situ, Advanced Photon Source (9-BM and 12-BM)
Fit method: Not applicable for XANES (least-square fitting used for EXAFS)
Phase fractions: (±10%)
| Phase | Fraction |
|---|---|
| Fe2+ single atoms (Fe-N4) | 1.0 |
Fit basis (paper's reference spectra):
- Fe foil
Source evidence: Page 9, Figure 2h (XANES) and Figure 2i (EXAFS)
Key reasoning: The XANES spectrum shows an E0 characteristic of Fe2+ with a high white line intensity, matching the profile of single atom catalysts embedded in a doped-graphene matrix. EXAFS confirms this by showing only a main peak for the Fe-N first coordination shell at ~1.5 Å and the complete absence of an Fe-Fe peak around 2.2 Å, indicating no metallic Fe clusters are present. The synthesis involved complexation and annealing followed by acid leaching to remove FeSx impurities, leaving only atomically dispersed Fe-Nx moieties.
Reasoning source: Page 5 (synthesis/leaching) and Page 9 (XANES/EXAFS analysis)
Scoring Rubric (total: 100 pts)
| Q | Type | Max | Question | Reference Answer | Scoring Criteria |
|---|---|---|---|---|---|
| q1 | identification | 30 | Based on the synthesis method involving complexation, annealing at 900 °C in Ar/NH3, and subsequent acid leaching, what is the dominant Fe phase in the Fe-ISA/N,S-HG sample, and what is its expected oxidation state? | The dominant Fe phase in the Fe-ISA/N,S-HG sample is atomically dispersed Fe single atoms coordinated as Fe-N4 moieties, representing a 1.0 fraction of the iron, with an expected oxidation state of Fe2+. This specific phase and oxidation state arise because the synthesis process implants single iron atoms into the 3D porous N,S-codoped holey graphene support. Furthermore, the subsequent acid leaching step specifically removes any formed FeSx impurities, leaving behind only the stable, atomically dispersed Fe-Nx moieties embedded in the doped-graphene matrix. | Full credit for identifying atomically dispersed Fe single atoms (or Fe-N4 moieties) and an oxidation state of Fe2+. Partial credit if only one is identified correctly. |
| q2 | spectral | 30 | Describe the expected overall spectral profile and key distinguishing features of the Fe K-edge XANES for this single-atom catalyst sample. | The expected Fe K-edge XANES spectral profile for the Fe-ISA/N,S-HG sample features an absorption edge position (E0) characteristic of Fe2+ and a high white line intensity. Its overall shape closely matches the profile of single atom catalysts embedded in a doped-graphene matrix. These spectral features arise directly from the sample conditions, where single iron atoms are implanted into the 3D porous N,S-codoped holey graphene to form isolated Fe-N4 moieties. Because the synthesis and subsequent acid leaching remove all FeSx impurities and prevent clustering, the spectrum exhibits a complete absence of metallic Fe-Fe coordination features, distinguishing it entirely from bulk or clustered iron. | Full credit for mentioning an E0 characteristic of Fe2+, a high white line intensity, and an overall profile matching single atom catalysts in doped graphene. |
| q3 | reasoning | 40 | How do the X-ray absorption data (both XANES and EXAFS) confirm the atomic dispersion of Fe and rule out the presence of metallic Fe clusters or nanoparticles? | The XANES spectrum confirms atomic dispersion by displaying an absorption edge characteristic of Fe2+ with a high white line intensity, which matches the profile of single atom catalysts embedded in a doped-graphene matrix rather than metallic iron. EXAFS data further rule out metallic clusters by showing only a main peak for the Fe-N first coordination shell at approximately 1.5 Å and a complete absence of an Fe-Fe peak around 2.2 Å. These results directly reflect the sample conditions and synthesis process, where single iron atoms are implanted into the N,S-codoped holey graphene and acid leaching removes any FeSx impurities. Consequently, the structural and electronic properties of the sample are entirely dominated by isolated Fe-N4 moieties, preventing the formation of any metallic Fe-Fe bonds. | Full credit for explaining that EXAFS shows only a first coordination shell peak for Fe-N (at ~1.5 Å) and completely lacks an Fe-Fe peak (around 2.2 Å), which rules out metallic Fe clusters. |
Review
#83
Fe-ISA/N,S-HG
Fe K-edge
▶
LLM Prompt
Sample Information
Material: Fe-ISA/N,S-HG
Support: N,S-codoped holey graphene
Sample-Specific Conditions
- absorption edge: S K-edge
- Single iron atoms implanted into 3D porous N,S-codoped holey graphene
Measurement
We plan to measure the Fe K-edge XANES spectrum of this sample.
Questions
Based on all the information above:
1. Based on the synthesis of Fe-ISA/N,S-HG, what is the expected dominant oxidation state and local bonding environment of sulfur, and what physical property explains this bonding?
2. Describe the expected main features in the S K-edge XANES spectrum for the Fe-ISA/N,S-HG sample, including the relative intensities and origins of the peaks.
3. What distinguishes the S K-edge XANES spectrum of this sample from one that is heavily oxidized?
Ground Truth
Material: Fe-ISA/N,S-HG
Measurement: S K-edge XANES, ex-situ, Advanced Photon Source
Fit method: qualitative analysis
Phase fractions: (±10%)
| Phase | Fraction |
|---|---|
| S in C-S-C | 1.0 |
Source evidence: Figure 2j, page 9-10
Key reasoning: The S K-edge XANES spectrum reveals a usual valence of nearly 0 for sulfur. This is consistent with the presence of '-C-S-' covalent bonding in the sample, as sulfur has a very similar electronegativity (2.58) to that of carbon (2.55).
Reasoning source: Page 9-10
Scoring Rubric (total: 100 pts)
| Q | Type | Max | Question | Reference Answer | Scoring Criteria |
|---|---|---|---|---|---|
| q1 | reasoning | 35 | Based on the synthesis of Fe-ISA/N,S-HG, what is the expected dominant oxidation state and local bonding environment of sulfur, and what physical property explains this bonding? | The expected dominant oxidation state of sulfur in the Fe-ISA/N,S-HG sample is nearly 0. The local bonding environment consists entirely of -C-S- covalent bonds (fraction of 1.0) within the N,S-codoped holey graphene support. This specific bonding environment arises because sulfur is doped directly into the carbon framework during the synthesis of the support. The formation of these covalent bonds with a near-zero valence is driven by the physical property of electronegativity, as sulfur (2.58) has a very similar electronegativity to that of carbon (2.55). | Identify the oxidation state as ~0, the bonding as -C-S- covalent bonds, and explain this is due to the similar electronegativity of S (2.58) and C (2.55). |
| q2 | spectral | 35 | Describe the expected main features in the S K-edge XANES spectrum for the Fe-ISA/N,S-HG sample, including the relative intensities and origins of the peaks. | The S K-edge XANES spectrum for the Fe-ISA/N,S-HG sample features a dominant, sharp main peak labeled CSx at approximately 2473 eV, alongside a minor, weak, and broad peak labeled SOx at roughly 2480 eV. The strong CSx peak originates from the -C-S- covalent bonding, reflecting a sulfur valence of nearly 0, while the weak SOx peak originates from a small amount of oxidized sulfur species. These specific spectral features arise because the sample consists of a 3D porous N,S-codoped carbon framework where sulfur is directly integrated into the lattice. Because sulfur and carbon have nearly identical electronegativities, the synthesis strongly favors the formation of unoxidized -C-S- bonds over oxidized species, resulting in the dominant low-energy peak. | Mention a dominant sharp peak for CSx species (valence ~0) at lower energy (~2473 eV) and a minor, weaker broad peak for SOx species at higher energy (~2480 eV). |
| q3 | prediction | 30 | What distinguishes the S K-edge XANES spectrum of this sample from one that is heavily oxidized? | The S K-edge XANES spectrum of this sample is distinguished by a dominant sharp peak at ~2473 eV indicating a sulfur valence of nearly 0, characteristic of -C-S- covalent bonding. In contrast, a heavily oxidized sample would exhibit a much stronger, dominant SOx peak at higher energies (~2480 eV) corresponding to oxidized sulfur species. This distinction occurs because the sulfur in the Fe-ISA/N,S-HG sample is primarily integrated into the N,S-codoped holey graphene support rather than existing as surface oxides. This unoxidized state is thermodynamically favored and maintained due to the nearly identical electronegativities of sulfur (2.58) and carbon (2.55) within the doped carbon framework. | Note that this sample is distinguished by a dominant peak indicating a valence of nearly 0 (-C-S- bonding). A heavily oxidized sample would instead be dominated by the higher-energy SOx peak (~2480 eV). |
Review
Hole‐Trapping‐Induced Stabilization of Ni4 + in SrNiO3/LaFeO3 Superlattices
APS
Thin Film
Le Wang et al.
DOI: 10.1002/adma.202005003
2 scenarios
▶
#84
(SrNiO3)1/(LaFeO3)1
Fe L3
▶
LLM Prompt
Sample Information
Material: (SrNiO3)1/(LaFeO3)1
Deposition Method: OPA-MBE
Substrate: LSAT
Composition Variable: n (LaFeO3 unit cells)
Composition Value: 1
Sample-Specific Conditions
- LaFeO3 layer thickness: 1 u.c.
- n=1 superlattice film
Measurement
We plan to measure the Fe L3 XANES spectrum of this sample.
Questions
Based on all the information above:
1. Based on the sample conditions (n=1 superlattice of (SrNiO3)1/(LaFeO3)1), what is the expected dominant oxidation state of Fe, and what reference compound's spectrum would it most closely resemble?
2. Explain the physical mechanism that leads to the expected Fe oxidation state in this n=1 superlattice, contrasting it with the nominal valence of Fe in bulk LaFeO3.
3. Describe the expected spectral shape of the Fe L3 edge for this sample. How does it differ from the spectrum of a pure LaFeO3 film?
4. If you were to perform a qualitative comparison or linear combination fit to confirm the Fe valence in this sample, what specific reference spectra would be most appropriate to include?
Ground Truth
Material: (SrNiO3)1/(LaFeO3)1 superlattice
Measurement: Fe L-edge XAS in total electron yield (TEY) mode
Fit method: Qualitative comparison
Phase fractions:
| Phase | Fraction |
|---|---|
| SrFeO3 (Fe4+) | 1.0 |
Fit basis (paper's reference spectra):
- SrFeO3 (Fe4+)
- LaFeO3 (Fe3+)
Source evidence: Figure 2b, Page 6
Key reasoning: In the n = 1 superlattice, electron transfer occurs from Fe to Ni across the interface. This charge reconstruction (Fe3+ -> Fe4+ and Ni4+ -> Ni3+) is driven by the energy balance and the lack of significant octahedral rotations in the n=1 case, leading to a partially depleted Fe 3d5 shell. Consequently, the Fe valence becomes 4+, matching the spectral signature of SrFeO3.
Reasoning source: Page 6, Page 10, Page 12
Scoring Rubric (total: 100 pts)
| Q | Type | Max | Question | Reference Answer | Scoring Criteria |
|---|---|---|---|---|---|
| q1 | prediction | 25 | Based on the sample conditions (n=1 superlattice of (SrNiO3)1/(LaFeO3)1), what is the expected dominant oxidation state of Fe, and what reference compound's spectrum would it most closely resemble? | The expected dominant oxidation state of Fe in the n=1 (SrNiO3)1/(LaFeO3)1 superlattice is 4+, with a phase fraction of 1.0. Its spectrum would most closely resemble the reference compound SrFeO3. This 4+ state arises because, at a LaFeO3 layer thickness of exactly 1 unit cell, an interfacial charge reconstruction occurs where electrons transfer from Fe to Ni. This transfer is driven by the energy balance and the lack of significant octahedral rotations in the n=1 case, which partially depletes the Fe 3d5 shell and shifts the valence from nominal Fe3+ to Fe4+. | Full points for identifying Fe4+ and stating it resembles SrFeO3. Partial points for just the oxidation state. |
| q2 | reasoning | 30 | Explain the physical mechanism that leads to the expected Fe oxidation state in this n=1 superlattice, contrasting it with the nominal valence of Fe in bulk LaFeO3. | In bulk LaFeO3, the nominal valence of Fe is 3+, but in this n=1 superlattice, the Fe oxidation state shifts entirely to 4+. This change is driven by an interfacial charge reconstruction mechanism where electron transfer occurs from Fe to Ni across the interface, resulting in Fe3+ converting to Fe4+ and Ni4+ converting to Ni3+. This specific electron transfer is thermodynamically favored by the energy balance and the lack of significant octahedral rotations in the 1 unit cell thick LaFeO3 layer. Consequently, the Fe 3d5 shell becomes partially depleted, stabilizing the Fe4+ state. | Full points for explaining interfacial electron transfer from Fe to Ni (Fe3+ -> Fe4+ and Ni4+ -> Ni3+) due to the specific superlattice structure (n=1) and lack of significant octahedral rotations. |
| q3 | spectral | 25 | Describe the expected spectral shape of the Fe L3 edge for this sample. How does it differ from the spectrum of a pure LaFeO3 film? | The Fe L3 edge spectrum for this sample will exhibit a broad peak width and lack the well-separated double peak structure. This differs significantly from a pure LaFeO3 film, which displays a characteristic, well-separated double peak structure indicative of Fe3+. These spectral features emerge because the n=1 superlattice conditions (1 unit cell LaFeO3 thickness) prevent significant octahedral rotations and alter the energy balance, driving an electron transfer from Fe to Ni. This charge reconstruction partially depletes the Fe 3d5 shell, shifting the Fe valence to 4+ and producing a broader, less distinct peak shape that aligns with fully oxidized SrFeO3. | Full points for mentioning the lack of a well-separated double peak structure and a peak width similar to SrFeO3, distinguishing it from the clear double peak of Fe3+ in LaFeO3. |
| q4 | identification | 20 | If you were to perform a qualitative comparison or linear combination fit to confirm the Fe valence in this sample, what specific reference spectra would be most appropriate to include? | For a qualitative comparison or linear combination fit, the most appropriate reference spectra to include are SrFeO3 (representing Fe4+) and LaFeO3 (representing Fe3+). The fit would yield a 1.0 fraction for the SrFeO3 (Fe4+) reference. These specific references are required because the n=1 (SrNiO3)1/(LaFeO3)1 superlattice undergoes an interfacial charge reconstruction driven by energy balance and a lack of significant octahedral rotations in the 1 unit cell layer. This mechanism causes an electron transfer from Fe to Ni, completely converting the nominal Fe3+ state (LaFeO3) into a partially depleted Fe4+ state (SrFeO3). | Full points for listing SrFeO3 (as the Fe4+ reference) and LaFeO3 (as the Fe3+ reference for comparison). |
Review
#85
(SrNiO3)1/(LaFeO3)5
Fe L3
▶
LLM Prompt
Sample Information
Material: (SrNiO3)1/(LaFeO3)5
Deposition Method: OPA-MBE
Substrate: LSAT
Composition Variable: n (LaFeO3 unit cells)
Composition Value: 5
Sample-Specific Conditions
- LaFeO3 layer thickness: 5 u.c.
- n=5 superlattice film
Measurement
We plan to measure the Fe L3 XANES spectrum of this sample.
Questions
Based on all the information above:
1. What is the expected dominant oxidation state of Fe in the (SrNiO3)1/(LaFeO3)5 superlattice, and what physical mechanism dictates this state?
2. Describe the expected spectral shape of the Fe L3-edge XAS for this n=5 superlattice sample.
3. How does the Fe L3-edge spectrum of this n=5 superlattice distinguish it from an n=1 superlattice or a pure SrFeO3 film?
4. If one were to analyze the Fe L-edge spectrum of this superlattice series to determine the Fe valence, what reference spectra would be most appropriate to use as a basis?
Ground Truth
Material: (SrNiO3)1/(LaFeO3)5 superlattice
Measurement: Fe L-edge XAS in total electron yield (TEY) mode
Fit method: Visual comparison to reference spectra
Phase fractions:
| Phase | Fraction |
|---|---|
| LaFeO3 (Fe3+) | 1.0 |
Fit basis (paper's reference spectra):
- LaFeO3 (Fe3+)
- SrFeO3 (Fe4+)
Source evidence: Figure 2b, Page 6
Key reasoning: In the n = 5 superlattice, electron transfer from Fe to Ni is strongly suppressed compared to the n = 1 superlattice. As a result, the Fe cations retain their nominal 3+ valence state from the LaFeO3 layers, while Ni remains 4+.
Reasoning source: Page 4, Page 6
Scoring Rubric (total: 100 pts)
| Q | Type | Max | Question | Reference Answer | Scoring Criteria |
|---|---|---|---|---|---|
| q1 | reasoning | 30 | What is the expected dominant oxidation state of Fe in the (SrNiO3)1/(LaFeO3)5 superlattice, and what physical mechanism dictates this state? | The expected dominant oxidation state of Fe in the (SrNiO3)1/(LaFeO3)5 superlattice is 3+, corresponding to a 1.0 fraction of LaFeO3-like Fe3+. This specific oxidation state arises because the sample contains a relatively thick LaFeO3 layer of 5 unit cells (n=5). In this n=5 configuration, the electron transfer from Fe to Ni is strongly suppressed compared to thinner (e.g., n=1) superlattices. Consequently, the Fe cations retain their nominal 3+ valence state inherent to the LaFeO3 layers, while the Ni remains 4+. | Award 15 points for identifying Fe3+ as the dominant oxidation state. Award 15 points for explaining that electron transfer from Fe to Ni is strongly suppressed in the thicker n=5 superlattice (unlike in the n=1 case), preserving the Fe3+ state. |
| q2 | spectral | 25 | Describe the expected spectral shape of the Fe L3-edge XAS for this n=5 superlattice sample. | The expected Fe L3-edge XAS spectrum for this sample will exhibit a well-separated double peak structure at approximately 710 eV. Both the overall line shape and the peak width will closely match those of pure LaFeO3 (Fe3+). These specific spectral features appear because the sample is an n=5 superlattice with 5 unit cells of LaFeO3, a thickness that strongly suppresses electron transfer from Fe to Ni. Because this transfer is suppressed, the Fe cations retain their nominal 3+ valence state, resulting in an electronic structure that produces the characteristic well-separated double peak of LaFeO3-like Fe3+. | Award 25 points for mentioning that the Fe L3 edge exhibits a well-separated double peak structure that matches the line shape and peak width of pure LaFeO3 (Fe3+). |
| q3 | spectral | 25 | How does the Fe L3-edge spectrum of this n=5 superlattice distinguish it from an n=1 superlattice or a pure SrFeO3 film? | The Fe L3-edge spectrum of the n=5 superlattice is distinguished by a well-separated double peak structure at ~710 eV that matches pure LaFeO3 (Fe3+). In contrast, this double peak structure becomes less obvious in an n=1 superlattice or a pure SrFeO3 (Fe4+) film. This spectral difference occurs because the 5 unit cell thickness of the LaFeO3 layer in the n=5 sample strongly suppresses electron transfer from Fe to Ni. As a result, the Fe cations in the n=5 sample retain their nominal 3+ valence state, whereas thinner n=1 samples or pure SrFeO3 films experience different electronic environments that alter the Fe valence and blur the double peak. | Award 25 points for stating that the n=5 superlattice has a well-separated double peak structure, whereas the n=1 superlattice or SrFeO3 (Fe4+) has a less obvious double peak structure. |
| q4 | identification | 20 | If one were to analyze the Fe L-edge spectrum of this superlattice series to determine the Fe valence, what reference spectra would be most appropriate to use as a basis? | The most appropriate reference spectra to use as a fit basis for visual comparison are LaFeO3 (Fe3+) and SrFeO3 (Fe4+). For this specific (SrNiO3)1/(LaFeO3)5 sample, the analysis will yield a 1.0 fraction of LaFeO3 (Fe3+). These specific reference phases are necessary because the superlattice series explores the valence shift between the nominal 3+ state of the LaFeO3 layers and the 4+ state of SrFeO3. In this n=5 sample, the 5 unit cell thickness strongly suppresses electron transfer from Fe to Ni, meaning the Fe cations fully retain their nominal 3+ valence state and perfectly match the LaFeO3 (Fe3+) reference. | Award 10 points for mentioning LaFeO3 (or a similar Fe3+ reference). Award 10 points for mentioning SrFeO3 (or a similar Fe4+ reference). |
Review
Underpotential Deposition of 3D Transition Metals: Versatile Electrosynthesis of Single‐Atom Catalysts on Oxidized Carbon Supports
BNL-NSLS-II-8-ID
Catalyst
Aidan Francis Meese et al.
DOI: 10.1002/adma.202311341
5 scenarios
▶
#86
Cu/OCPaper
Cu K-edge
▶
LLM Prompt
Sample Information
Material: Cu/OCPaper
Support: Oxidized carbon paper (OCPaper)
Reaction Conditions: In 0.05 M CuSO4 + 5 mM H2SO4 electrolyte, open circuit potential
Sample-Specific Conditions
- Time during UPD: 0 min
- In-situ XAS of oxidized carbon paper electrode in Cu electrolyte prior to application of UPD potential (open circuit potential)
Measurement
We plan to measure the Cu K-edge XANES spectrum of this sample.
Questions
Based on all the information above:
1. What candidate reference spectra or basis components are needed to model the in-situ Cu K-edge XANES data of this electrode system during the underpotential deposition process?
2. At t=0 min (open circuit potential, prior to applying the UPD potential), what phase dominates the Cu K-edge XANES signal and why?
Ground Truth
Material: Cu/OCPaper
Measurement: Cu K-edge in-situ fluorescence mode at Beamline 8-ID (ISS)
Fit method: Singular value decomposition (SVD) and linear combination fitting
Phase fractions: (±10%)
| Phase | Fraction |
|---|---|
| Cu2+(aq) | 1.0 |
| Cu_UPD | 0.0 |
Fit basis (paper's reference spectra):
- Cu2+(aq)
- Cu_UPD
Source evidence: Figure 5d, page 12
Key reasoning: At open circuit potential (OCP), prior to application of the underpotential (E_UPD), a strong background signal corresponding to hydrated Cu2+ near the electrode is observed. Because the deposition potential has not yet been applied, no underpotential deposition has occurred, and the signal is entirely from the dissolved precursor.
Reasoning source: Section 'In-Situ XAS of Cu UPD', page 12
Scoring Rubric (total: 100 pts)
| Q | Type | Max | Question | Reference Answer | Scoring Criteria |
|---|---|---|---|---|---|
| q1 | identification | 43 | What candidate reference spectra or basis components are needed to model the in-situ Cu K-edge XANES data of this electrode system during the underpotential deposition process? | To model the in-situ Cu K-edge XANES data of the Cu/OCPaper electrode system, the required basis components are Cu2+(aq) and Cu_UPD. These specific reference spectra are needed because the sample is measured in a 0.05 M CuSO4 + 5 mM H2SO4 electrolyte, meaning dissolved Cu2+ precursor is present near the electrode. Furthermore, the system is designed to undergo underpotential deposition (UPD), necessitating a Cu_UPD reference to capture the deposited phase once the potential is applied. At the initial open circuit potential (0 min), the signal is entirely from the hydrated Cu2+ precursor since no deposition has occurred yet. | Full points for identifying hydrated Cu2+(aq) and the newly formed Cu_UPD (or Cu1-in-situ) species as the necessary components. |
| q2 | reasoning | 57 | At t=0 min (open circuit potential, prior to applying the UPD potential), what phase dominates the Cu K-edge XANES signal and why? | At t=0 min under open circuit potential, the Cu K-edge XANES signal is entirely dominated by the Cu2+(aq) phase, which accounts for a 1.0 (100%) fraction of the spectrum. This occurs because the measurement is taken prior to the application of the underpotential (E_UPD) required for deposition. Consequently, no underpotential deposition of copper has taken place on the oxidized carbon paper support. The observed signal therefore originates exclusively from the strong background of hydrated Cu2+ dissolved in the 0.05 M CuSO4 electrolyte near the electrode. | Full points for stating that Cu2+(aq) dominates (fraction ~1.0) because the underpotential has not yet been applied, meaning no deposition has occurred and only the dissolved precursor is present. |
Review
#87
Cu/OCPaper
Cu K-edge
▶
LLM Prompt
Sample Information
Material: Cu/OCPaper
Support: Oxidized carbon paper (OCPaper)
Reaction Conditions: In 0.05 M CuSO4 + 5 mM H2SO4 electrolyte, applied UPD potential (+25 mV vs Cu2+/Cu0 SRP)
Sample-Specific Conditions
- Time during UPD: 2 min
- In-situ XAS of oxidized carbon paper electrode during application of UPD potential
Measurement
We plan to measure the Cu K-edge XANES spectrum of this sample.
Questions
Based on all the information above:
1. What candidate reference spectra or basis components are needed to model the in-situ XANES data for this sample during the underpotential deposition process?
2. Estimate the relative phase fractions of the components present after 2 minutes of applied UPD potential.
3. Explain the physical reasoning behind the expected phase composition at this specific time point (2 minutes) during the in-situ measurement.
Ground Truth
Material: Cu/OCPaper
Measurement: Cu K-edge in-situ fluorescence mode at Beamline 8-ID (ISS) of NSLS-II
Fit method: Singular value decomposition (SVD) and linear combination fitting
Phase fractions: (±10%)
| Phase | Fraction |
|---|---|
| Cu2+(aq) | 0.95 |
| Cu_UPD | 0.05 |
Fit basis (paper's reference spectra):
- Cu2+(aq)
- Cu_UPD
Source evidence: Figure 5d, page 12
Key reasoning: During the in-situ XAS experiment, the applied UPD potential initiates the transformation of aqueous Cu ions to oxygen-coordinated single-atoms. Because the measurement is performed in-situ in the precursor-containing electrolyte, the total signal is a combination of the background hydrated Cu2+ and the newly formed Cu1 species. At 2 minutes into the deposition, the process has just begun, so the relative concentration of the deposited Cu_UPD species is still very low (approx. 5%), while the bulk of the signal (approx. 95%) comes from the unreacted Cu2+(aq) precursor near the electrode.
Reasoning source: Section 'In-Situ XAS of Cu UPD', pages 12-13
Scoring Rubric (total: 100 pts)
| Q | Type | Max | Question | Reference Answer | Scoring Criteria |
|---|---|---|---|---|---|
| q1 | identification | 30 | What candidate reference spectra or basis components are needed to model the in-situ XANES data for this sample during the underpotential deposition process? | To model the in-situ XANES data for this sample, the required basis components are Cu2+(aq) and Cu_UPD. These specific phases are expected because the measurement is performed in-situ within a 0.05 M CuSO4 precursor-containing electrolyte while applying a UPD potential (+25 mV vs Cu2+/Cu0 SRP). The applied potential initiates the transformation of the aqueous Cu2+ ions into oxygen-coordinated single-atom Cu_UPD (Cu1) species on the oxidized carbon paper support. Therefore, the total XANES signal must account for both the newly formed Cu_UPD species and the background hydrated Cu2+ precursor present near the electrode. | Full points for identifying both the dissolved/hydrated Cu2+ precursor and the newly formed deposited Cu species (Cu_UPD or Cu1-in-situ). |
| q2 | quantification | 30 | Estimate the relative phase fractions of the components present after 2 minutes of applied UPD potential. | After 2 minutes of applied UPD potential, the estimated relative phase fractions are 0.95 (95%) for Cu2+(aq) and 0.05 (5%) for Cu_UPD, with an uncertainty of 10%. These specific values result from the very short reaction time of 2 minutes during the in-situ measurement in the 0.05 M CuSO4 electrolyte. At this early stage, the deposition process has just begun, meaning the relative concentration of the newly deposited Cu_UPD species on the oxidized carbon paper is still very low. Consequently, the bulk of the measured signal (95%) originates from the unreacted Cu2+(aq) precursor remaining in the electrolyte near the electrode. | Full points for estimating ~95% Cu2+(aq) and ~5% Cu_UPD. Deduct points proportionally for deviations greater than the 10% uncertainty margin. |
| q3 | reasoning | 40 | Explain the physical reasoning behind the expected phase composition at this specific time point (2 minutes) during the in-situ measurement. | The expected phase composition of 95% Cu2+(aq) and 5% Cu_UPD is driven by the early stage of the electrochemical deposition process. When the UPD potential (+25 mV vs Cu2+/Cu0 SRP) is applied to the oxidized carbon paper in the 0.05 M CuSO4 electrolyte, it initiates the transformation of aqueous Cu ions into oxygen-coordinated single-atoms (Cu_UPD). Because the measurement is conducted in-situ at only 2 minutes into the reaction, the deposition has just begun. As a result, only a small fraction (5%) of the Cu1 species has formed on the support, while the vast majority of the signal (95%) still comes from the unreacted, background hydrated Cu2+ precursor surrounding the electrode. | Full points for explaining that the in-situ measurement captures both the background electrolyte (hydrated Cu2+) and the growing deposited species, and that at an early time point (2 min), the signal is heavily dominated by the unreacted precursor before significant deposition has occurred. |
Review
#88
Cu/OCPaper
Cu K-edge
▶
LLM Prompt
Sample Information
Material: Cu/OCPaper
Support: Oxidized carbon paper (OCPaper)
Reaction Conditions: In 0.05 M CuSO4 + 5 mM H2SO4 electrolyte, applied UPD potential (+25 mV vs Cu2+/Cu0 SRP)
Sample-Specific Conditions
- Time during UPD: 4 min
- In-situ XAS of oxidized carbon paper electrode during application of UPD potential
Measurement
We plan to measure the Cu K-edge XANES spectrum of this sample.
Questions
Based on all the information above:
1. Based on the provided reaction conditions (in-situ XAS during Cu UPD at 4 minutes), identify the expected Cu phases present in the probed region and estimate their relative fractions.
2. What reference spectra or basis functions would be required to properly fit the XANES spectrum of this sample using linear combination fitting?
3. Explain the physical reasoning behind the expected phase composition at this specific time (4 minutes) during the in-situ measurement.
Ground Truth
Material: Cu/OCPaper
Measurement: Cu K-edge in-situ XANES in fluorescence mode at Beamline 8-ID (ISS) of NSLS-II
Fit method: Singular value decomposition (SVD) followed by linear combination fitting
Phase fractions: (±10%)
| Phase | Fraction |
|---|---|
| Cu2+(aq) | 0.9 |
| Cu_UPD | 0.1 |
Fit basis (paper's reference spectra):
- Cu2+(aq)
- Cu_UPD
Source evidence: Figure 5d, page 12
Key reasoning: During the in-situ XAS measurement of Cu underpotential deposition (UPD), the initial signal at open circuit potential is dominated by hydrated Cu2+ from the electrolyte. Upon applying the UPD potential, a new species (Cu_UPD) begins to form, corresponding to atomically dispersed Cu bonded to surface oxygen groups. At 4 minutes into the deposition, the transformation is still ongoing; the majority of the probed volume still consists of unreacted Cu2+(aq) precursor (~90%), while the newly deposited Cu_UPD species accounts for approximately 10% of the signal.
Reasoning source: Section 'In-Situ XAS of Cu UPD', pages 12-13
Scoring Rubric (total: 100 pts)
| Q | Type | Max | Question | Reference Answer | Scoring Criteria |
|---|---|---|---|---|---|
| q1 | quantification | 40 | Based on the provided reaction conditions (in-situ XAS during Cu UPD at 4 minutes), identify the expected Cu phases present in the probed region and estimate their relative fractions. | The expected Cu phases in the probed region are Cu2+(aq) and Cu_UPD, with relative fractions of 90% and 10%, respectively. These specific values arise because the measurement is taken in-situ at only 4 minutes into the application of the underpotential deposition (UPD) potential (+25 mV vs Cu2+/Cu0 SRP). At this early stage, the deposition process is still ongoing, meaning the majority of the probed volume consists of the unreacted Cu2+(aq) precursor from the 0.05 M CuSO4 electrolyte. The 10% fraction represents the newly forming Cu_UPD species, which consists of atomically dispersed Cu bonding to the surface oxygen groups of the oxidized carbon paper support. | Full credit for identifying unreacted Cu2+(aq) and a newly formed Cu_UPD (or single-atom Cu) species, with fractions of approximately 90% and 10%, respectively. Partial credit if the phases are identified but fractions are significantly off. |
| q2 | identification | 30 | What reference spectra or basis functions would be required to properly fit the XANES spectrum of this sample using linear combination fitting? | To properly fit the XANES spectrum of this sample using linear combination fitting, the required basis functions are Cu2+(aq) and Cu_UPD. These specific references are necessary because the in-situ measurement is performed in a 0.05 M CuSO4 electrolyte during the application of a UPD potential (+25 mV vs Cu2+/Cu0 SRP). The Cu2+(aq) reference accounts for the unreacted hydrated copper precursor that dominates the electrolyte signal in the probed volume. The Cu_UPD reference is required to capture the newly formed species, which corresponds to atomically dispersed Cu bonded to the surface oxygen groups of the oxidized carbon paper electrode after 4 minutes of applied potential. | Full credit for stating that the fit requires the spectrum of the hydrated Cu2+ precursor (collected at open circuit potential) and the spectrum of the newly formed Cu_UPD species (which can be extracted via techniques like SVD or isolated from later stages of deposition). |
| q3 | reasoning | 30 | Explain the physical reasoning behind the expected phase composition at this specific time (4 minutes) during the in-situ measurement. | At 4 minutes into the in-situ measurement, the phase composition is expected to be 90% Cu2+(aq) and 10% Cu_UPD. This composition occurs because the initial signal before deposition is entirely dominated by hydrated Cu2+ from the 0.05 M CuSO4 electrolyte. Upon applying the UPD potential (+25 mV vs Cu2+/Cu0 SRP), atomically dispersed Cu begins to deposit and bond to the surface oxygen groups of the oxidized carbon paper. Because only 4 minutes have elapsed, this deposition process is still ongoing and incomplete. Consequently, the newly deposited Cu_UPD species accounts for only a small fraction (10%) of the signal, while the bulk of the probed volume remains unreacted Cu2+(aq) precursor (90%). | Full credit for explaining that the UPD process is a time-dependent transformation from dissolved/adsorbed Cu2+ to surface-bound Cu single atoms. At 4 minutes, the reaction is incomplete, so the X-ray beam probes a mixture dominated by the abundant unreacted precursor in the electrolyte near the electrode, with a growing minority contribution from the deposited Cu_UPD species. |
Review
#89
Cu/OCPaper
Cu K-edge
▶
LLM Prompt
Sample Information
Material: Cu/OCPaper
Support: Oxidized carbon paper (OCPaper)
Reaction Conditions: In 0.05 M CuSO4 + 5 mM H2SO4 electrolyte, applied UPD potential (+25 mV vs Cu2+/Cu0 SRP)
Sample-Specific Conditions
- Time during UPD: 6 min
- In-situ XAS of oxidized carbon paper electrode during application of UPD potential
Measurement
We plan to measure the Cu K-edge XANES spectrum of this sample.
Questions
Based on all the information above:
1. What candidate reference spectra or basis functions are needed to model the in-situ XANES data for this sample during the underpotential deposition (UPD) process?
2. Based on the reaction conditions (in-situ UPD at +25 mV vs Cu2+/Cu0 SRP for 6 minutes), estimate the relative phase fractions of the components present in the XAS detection volume.
3. Explain the physical reasoning for the presence and evolution of these specific phases during the in-situ underpotential deposition process.
Ground Truth
Material: Cu/OCPaper
Measurement: Cu K-edge in-situ fluorescence mode at Beamline 8-ID (ISS) of NSLS-II
Fit method: Singular value decomposition (SVD) and linear combination fitting
Phase fractions: (±10%)
| Phase | Fraction |
|---|---|
| Cu2+(aq) | 0.85 |
| Cu_UPD | 0.15 |
Fit basis (paper's reference spectra):
- Cu2+(aq)
- Cu_UPD
Source evidence: Figure 5d, page 12
Key reasoning: In-situ XAS tracks the transformation of aqueous Cu2+ ions to oxygen-coordinated single-atoms during underpotential deposition (UPD). Singular value decomposition (SVD) confirmed the presence of only two spectral components throughout the experiment. Fitting the spectral series with the extracted spectra of the newly formed species (Cu_UPD) and hydrated Cu2+ allowed estimation of their relative concentrations, showing a gradual increase in the Cu_UPD fraction over the 10-minute period as Cu atoms undergo electrosorption onto the oxidized carbon support.
Reasoning source: Section 'In-Situ XAS of Cu UPD', pages 12-13
Scoring Rubric (total: 100 pts)
| Q | Type | Max | Question | Reference Answer | Scoring Criteria |
|---|---|---|---|---|---|
| q1 | identification | 25 | What candidate reference spectra or basis functions are needed to model the in-situ XANES data for this sample during the underpotential deposition (UPD) process? | To model the in-situ Cu K-edge XANES data for this sample, the required basis functions are hydrated Cu2+(aq) and the newly formed Cu_UPD species. These specific references are needed because the sample is measured in-situ within a 0.05 M CuSO4 electrolyte, meaning unreacted aqueous Cu2+ ions will naturally be present in the detection volume. Simultaneously, the application of a UPD potential (+25 mV vs Cu2+/Cu0 SRP) drives the electrosorption of Cu atoms onto the oxidized carbon paper support. This applied potential transforms the aqueous Cu2+ ions into oxygen-coordinated single-atoms (Cu_UPD), resulting in a two-component system that is confirmed by singular value decomposition. | Full credit for identifying both the unreacted precursor (hydrated Cu2+ / Cu2+(aq)) and the newly deposited single-atom species (Cu_UPD / Cu1-in-situ). |
| q2 | quantification | 40 | Based on the reaction conditions (in-situ UPD at +25 mV vs Cu2+/Cu0 SRP for 6 minutes), estimate the relative phase fractions of the components present in the XAS detection volume. | After 6 minutes of applied UPD potential, the estimated relative phase fractions in the XAS detection volume are 0.85 (85%) Cu2+(aq) and 0.15 (15%) Cu_UPD, with an uncertainty of 10%. These specific values result from the gradual electrosorption of Cu atoms onto the oxidized carbon support over time. Because the measurement is taken in-situ at 6 minutes into a 10-minute transformation process, only a small portion of the abundant aqueous Cu2+ from the 0.05 M CuSO4 electrolyte has converted into the oxygen-coordinated Cu_UPD single-atom species. Consequently, the majority of the XANES signal still originates from the unreacted hydrated Cu2+ ions surrounding the electrode. | Full credit for estimating ~85% Cu2+(aq) and ~15% Cu_UPD. Partial credit for recognizing that the unreacted aqueous precursor still dominates the signal at this intermediate time point, with a minor but growing fraction of the deposited species. |
| q3 | reasoning | 35 | Explain the physical reasoning for the presence and evolution of these specific phases during the in-situ underpotential deposition process. | The presence and evolution of the Cu2+(aq) and Cu_UPD phases are directly driven by the applied electrochemical conditions during the in-situ measurement. Initially, the XAS detection volume is dominated by hydrated Cu2+ ions from the 0.05 M CuSO4 + 5 mM H2SO4 electrolyte. Upon applying the UPD potential (+25 mV vs Cu2+/Cu0 SRP), a gradual electrosorption mechanism is triggered, causing aqueous Cu2+ ions to transform into oxygen-coordinated single-atoms on the oxidized carbon paper support. Over the 10-minute period, this mechanism leads to a continuous increase in the Cu_UPD fraction as more Cu atoms deposit onto the support, while the remaining signal reflects the unreacted Cu2+(aq) background. | Full credit for explaining that the in-situ measurement captures the transformation of aqueous Cu2+ ions into oxygen-coordinated single-atoms (Cu_UPD) on the electrode surface, resulting in a two-component system where the deposited fraction gradually increases over time as electrosorption proceeds. |
Review
#90
Cu/OCPaper
Cu K-edge
▶
LLM Prompt
Sample Information
Material: Cu/OCPaper
Support: Oxidized carbon paper (OCPaper)
Reaction Conditions: In 0.05 M CuSO4 + 5 mM H2SO4 electrolyte, applied UPD potential (+25 mV vs Cu2+/Cu0 SRP)
Sample-Specific Conditions
- Time during UPD: 8 min
- In-situ XAS of oxidized carbon paper electrode during application of UPD potential
Measurement
We plan to measure the Cu K-edge XANES spectrum of this sample.
Questions
Based on all the information above:
1. What reference spectra or basis functions are required to model the in-situ Cu K-edge XANES data for this sample during the underpotential deposition (UPD) process?
2. Based on the applied UPD potential and a reaction time of 8 minutes, estimate the relative phase fractions of the Cu species present in the XAS measurement volume.
3. Explain the physical reasoning for the observed phase composition at 8 minutes, including the nature of the newly formed species compared to the initial state.
Ground Truth
Material: Cu/OCPaper
Measurement: Cu K-edge in-situ XAS in fluorescence mode at Beamline 8-ID (ISS)
Fit method: Singular value decomposition (SVD) followed by linear combination fitting
Phase fractions: (±10%)
| Phase | Fraction |
|---|---|
| Cu2+(aq) | 0.8 |
| Cu_UPD | 0.2 |
Fit basis (paper's reference spectra):
- Cu2+(aq)
- Cu_UPD
Source evidence: Figure 5d, page 12
Key reasoning: In-situ XAS tracks the transformation of Cu atoms from aqueous ions to oxygen-coordinated single-atoms under UPD conditions. SVD confirmed only two spectral components were present throughout the 10-minute experiment. Fitting the spectral series with the extracted spectra of the newly formed species (Cu1-in-situ) and hydrated Cu2+ allowed estimation of their relative concentrations. At 8 minutes, the transformation is ongoing, with the newly formed Cu_UPD species reaching approximately 20% relative concentration while the background hydrated Cu2+ remains dominant at 80%. The newly formed Cu1-in-situ species possesses notably more Cu+ character, suggesting UPD proceeds via reduction of Cu2+(aq) to a partially reduced intermediate Cu-O species.
Reasoning source: Section 'In-Situ XAS of Cu UPD', pages 12-13
Scoring Rubric (total: 100 pts)
| Q | Type | Max | Question | Reference Answer | Scoring Criteria |
|---|---|---|---|---|---|
| q1 | identification | 25 | What reference spectra or basis functions are required to model the in-situ Cu K-edge XANES data for this sample during the underpotential deposition (UPD) process? | To model the in-situ Cu K-edge XANES data for this sample, the required basis functions are Cu2+(aq) and Cu_UPD (also referred to as Cu1-in-situ). These specific phases are expected because, under the applied UPD potential (+25 mV vs Cu2+/Cu0 SRP) in the CuSO4/H2SO4 electrolyte, aqueous copper ions transform into oxygen-coordinated single-atoms on the oxidized carbon paper support. Singular value decomposition (SVD) confirms that only these two components are present during the process. Consequently, the spectral series can be fully described by the initial hydrated Cu2+ state and the newly formed, partially reduced Cu-O intermediate species. | Full credit for identifying both the hydrated Cu2+ (or dissolved Cu2+ precursor) and the newly formed Cu_UPD (or Cu1-in-situ) species as the necessary basis functions. |
| q2 | quantification | 35 | Based on the applied UPD potential and a reaction time of 8 minutes, estimate the relative phase fractions of the Cu species present in the XAS measurement volume. | At a reaction time of 8 minutes under the applied UPD potential, the estimated relative phase fractions are 80% Cu2+(aq) and 20% Cu_UPD, with an uncertainty of 10%. These specific values arise because the electrochemical transformation of aqueous copper ions into oxygen-coordinated single-atoms on the oxidized carbon paper is still ongoing at the 8-minute mark. The background hydrated Cu2+ from the 0.05 M CuSO4 electrolyte remains the dominant signal in the measurement volume, accounting for 80% of the composition. Meanwhile, the newly formed Cu_UPD species has accumulated on the electrode surface to reach a relative concentration of approximately 20%. | Full credit for estimating approximately 80% Cu2+(aq) and 20% Cu_UPD species. Deduct points proportionally for estimates outside a +/- 10% absolute error margin. |
| q3 | reasoning | 40 | Explain the physical reasoning for the observed phase composition at 8 minutes, including the nature of the newly formed species compared to the initial state. | The observed phase composition at 8 minutes reflects an incomplete, ongoing transformation driven by the applied UPD potential (+25 mV vs Cu2+/Cu0 SRP). Initially, the system is dominated by hydrated Cu2+ ions from the 0.05 M CuSO4 electrolyte. As the reaction progresses on the oxidized carbon paper (OCPaper) support, these aqueous ions are converted into oxygen-coordinated single-atoms (Cu_UPD). This newly formed Cu1-in-situ species possesses notably more Cu+ character than the initial state, demonstrating that the UPD mechanism proceeds via the reduction of Cu2+(aq) to a partially reduced Cu-O intermediate species. | Full credit for explaining that the measurement captures an ongoing transformation from aqueous Cu2+ ions to oxygen-coordinated single-atoms, where the background hydrated Cu2+ still dominates the signal. Must mention that the newly formed species exhibits partially reduced (Cu+) character, indicating reduction of Cu2+(aq) to an intermediate Cu-O species during UPD. |
Review
A Triphasic Bifunctional Oxygen Electrocatalyst with Tunable and Synergetic Interfacial Structure for Rechargeable Zn‐Air Batteries
APS
Catalyst
Jianbing Zhu et al.
DOI: 10.1002/aenm.201903003
1 scenario
▶
#91
Fe2Ni@NC
Ni K
▶
LLM Prompt
Sample Information
Material: Fe2Ni@NC
Support: N-doped graphitic carbon and carbon nanotubes (CNTs)
Sample-Specific Conditions
- Fe/Ni ratio: 2:1
- Fe2Ni alloy-Fe oxide-nitrogen doped graphitic carbon tri-phase interfacial structure
Measurement
We plan to measure the Ni K XANES spectrum of this sample.
Questions
Based on all the information above:
1. Based on the synthesis conditions and the formation of the Fe2Ni alloy-Fe oxide-carbon tri-phase structure, what is the expected oxidation state and dominant phase of Ni in the Fe2Ni@NC sample? Explain the physical reasoning for why Ni adopts this state while Fe partially oxidizes.
2. Describe the expected spectral shape of the Ni K-edge XANES for the Fe2Ni@NC sample. What specific reference spectrum is required to confirm this phase?
Ground Truth
Material: Fe2Ni@NC
Measurement: Ni K-edge XANES, ex-situ, 9BM-C beam line at Advanced Photon Sources at Argonne National Laboratory
Fit method: Qualitative comparison
Phase fractions: (±10%)
| Phase | Fraction |
|---|---|
| metallic_nickel | 1.0 |
Fit basis (paper's reference spectra):
- Ni foil
Source evidence: Page 8 (text) and Figure 3d (page 19)
Key reasoning: The Ni K-edge XANES spectrum of Fe2Ni@NC displays a curve similar to Ni foil, demonstrating the metallic state of Ni in the as-prepared catalyst. DFT calculations reveal that it is much more difficult to form a Ni vacancy compared to an Fe vacancy on the Fe2Ni surface, which corresponds to the formation of a Ni-free oxide on the surface and leaves the Ni in a metallic alloy state.
Reasoning source: Page 8 (XANES discussion) and Page 9 (DFT calculations discussion)
Scoring Rubric (total: 100 pts)
| Q | Type | Max | Question | Reference Answer | Scoring Criteria |
|---|---|---|---|---|---|
| q1 | reasoning | 57 | Based on the synthesis conditions and the formation of the Fe2Ni alloy-Fe oxide-carbon tri-phase structure, what is the expected oxidation state and dominant phase of Ni in the Fe2Ni@NC sample? Explain the physical reasoning for why Ni adopts this state while Fe partially oxidizes. | The expected oxidation state of Ni in the Fe2Ni@NC sample is 0, with the dominant phase being a metallic Fe2Ni alloy (fraction of 1.0). This metallic state is maintained within the Fe2Ni alloy-Fe oxide-carbon tri-phase interfacial structure because it is significantly more difficult to form a Ni vacancy than an Fe vacancy on the Fe2Ni surface. Consequently, a Ni-free iron oxide forms on the surface of the catalyst. This selective surface oxidation leaves the underlying nickel entirely in a metallic alloy state, preventing the formation of any oxidized Ni species. | Full points for identifying Ni as metallic (oxidation state 0) in an alloy phase, and explaining that DFT shows it is harder to form Ni vacancies than Fe vacancies, leading to selective Fe oxidation and a Ni-free oxide surface. |
| q2 | spectral | 43 | Describe the expected spectral shape of the Ni K-edge XANES for the Fe2Ni@NC sample. What specific reference spectrum is required to confirm this phase? | The expected Ni K-edge XANES spectrum for the Fe2Ni@NC sample will display a curve that is nearly identical to metallic Ni foil, with no distinguishable peaks corresponding to oxidized Nin+ species. To confirm this phase, a metallic Ni foil reference spectrum is required for qualitative comparison. This specific spectral shape results from the sample's Fe2Ni alloy-Fe oxide-carbon tri-phase structure, where Ni remains entirely in a metallic state (oxidation state 0). Because it is much more difficult to form a Ni vacancy compared to an Fe vacancy on the Fe2Ni surface, a Ni-free oxide forms on the surface, leaving the Ni atoms in a purely metallic alloy state that perfectly mirrors the Ni foil reference. | Full points for stating the spectral shape is similar/identical to metallic Ni and identifying Ni foil as the necessary reference spectrum. |
Review
A High‐Rate Aqueous Proton Battery Delivering Power Below −78 °C via an Unfrozen Phosphoric Acid
APS
Electrochemistry
Heng Jiang et al.
DOI: 10.1002/aenm.202000968
3 scenarios
▶
#92
MoO3
Mo K-edge
▶
LLM Prompt
Sample Information
Material: MoO3
Electrode Type: anode
Electrolyte: 9.5 m H3PO4
Cell Type: Swagelok half-cell
Charge Discharge: OCV
State Of Charge: pristine
Sample-Specific Conditions
- state of charge: pristine
- Pristine MoO3 electrode before electrochemical cycling
Measurement
We plan to measure the Mo K-edge XANES spectrum of this sample.
Questions
Based on all the information above:
1. Identify the dominant phase in this pristine electrode and state which reference spectrum is required to confirm its initial state via Mo K-edge XANES.
2. Based on the pristine state of the MoO3 electrode, what is the expected oxidation state of Mo, and what local structural features (coordination distances) characterize this initial state before proton insertion?
3. Describe the expected Mo K-edge XANES spectral shape of the pristine electrode and how it compares to standard reference materials.
Ground Truth
Material: MoO3
Measurement: Mo K-edge XAS (ex situ) at APS bending-magnet beamline 9-BM-B
Fit method: Qualitative comparison
Phase fractions:
| Phase | Fraction |
|---|---|
| MoO3 | 1.0 |
Fit basis (paper's reference spectra):
- Standard MoO3 powder
Source evidence: Figure S4G, Figure 3F, Page 10, Page 32
Key reasoning: The pristine sample is the starting material prior to electrochemical cycling. Its XANES spectrum matches that of standard MoO3, confirming the Mo(VI) oxidation state. EXAFS shows three main correlations at ~1.2 Å, ~1.8 Å, and ~3.2 Å corresponding to Mo-O terminal, Mo-O bridging, and Mo-Mo distances, characteristic of the pristine MoO3 structure.
Reasoning source: Page 10, Page 32
Scoring Rubric (total: 100 pts)
| Q | Type | Max | Question | Reference Answer | Scoring Criteria |
|---|---|---|---|---|---|
| q1 | identification | 30 | Identify the dominant phase in this pristine electrode and state which reference spectrum is required to confirm its initial state via Mo K-edge XANES. | The dominant phase in this pristine electrode is MoO3, accounting for a 1.0 fraction of the material. To confirm its initial state via Mo K-edge XANES, a standard MoO3 powder reference spectrum is required. This phase composition is expected because the sample is in a pristine state at open circuit voltage (OCV) prior to any electrochemical cycling. Without any proton insertion or electrochemical reactions having occurred, the starting material remains entirely unreacted and structurally identical to the standard MoO3 reference. | Full credit for identifying MoO3 as the dominant (pure) phase and stating that a standard MoO3 powder reference spectrum is needed for comparison. |
| q2 | reasoning | 40 | Based on the pristine state of the MoO3 electrode, what is the expected oxidation state of Mo, and what local structural features (coordination distances) characterize this initial state before proton insertion? | The expected oxidation state of Mo in this electrode is +6 (Mo(VI)). The local structural features characterizing this initial state include three main EXAFS correlations: Mo-O terminal distances at ~1.2 Å, Mo-O bridging distances at ~1.8 Å, and Mo-Mo distances at ~3.2 Å. These specific structural and electronic properties are expected because the sample is the pristine starting material prior to any electrochemical cycling. Since no proton insertion has occurred yet, the material retains the characteristic, unperturbed coordination environment and full oxidation state of pristine MoO3. | Full credit for stating the Mo oxidation state is +6 (or VI) and mentioning the three main structural correlations: Mo-O terminal (~1.2 Å), Mo-O bridging (~1.8 Å), and Mo-Mo (~3.2 Å). |
| q3 | spectral | 30 | Describe the expected Mo K-edge XANES spectral shape of the pristine electrode and how it compares to standard reference materials. | The normalized Mo K-edge XANES spectral shape of the pristine electrode closely matches that of standard MoO3 powder and is distinctly different from standard MoS2. This specific spectral signature is expected because the sample is in a pristine state at open circuit voltage (OCV) before any electrochemical cycling. As the unreacted starting material, it retains its initial Mo(VI) oxidation state and characteristic local structure. Consequently, the electronic properties producing these spectral features are identical to those of the standard MoO3 reference. | Full credit for stating that the normalized XANES spectrum closely matches that of standard MoO3 powder and is distinct from other standards like MoS2. |
Review
#93
MoO3
Mo K-edge
▶
LLM Prompt
Sample Information
Material: MoO3
Electrode Type: anode
Electrolyte: 9.5 m H3PO4
Cell Type: Swagelok half-cell
Charge Discharge: discharged
Voltage V: -0.5 V vs Ag/AgCl
State Of Charge: fully discharged
Cycle Number: 1
Sample-Specific Conditions
- state of charge: fully discharged
- MoO3 electrode fully discharged (protonated) in the first cycle
Measurement
We plan to measure the Mo K-edge XANES spectrum of this sample.
Questions
Based on all the information above:
1. What phase dominates the MoO3 electrode when fully discharged to -0.5 V in 9.5 m H3PO4, and what is the expected oxidation state of Mo in this state?
2. Describe the expected changes in the local coordination environment and the corresponding distinguishing features in the Fourier-transformed Mo K-edge EXAFS spectrum for the fully discharged MoO3 compared to the pristine state.
3. Explain the physical reasoning behind the structural changes observed in the Mo-O bonds (terminal, corner-sharing, and edge-sharing) upon full discharge.
Ground Truth
Material: MoO3
Measurement: Mo K-edge ex situ XAS at APS bending-magnet beamline 9-BM-B
Fit method: not reported
Phase fractions:
| Phase | Fraction |
|---|---|
| HxMoO3 | 1.0 |
Source evidence: Page 9 (XPS data), Page 10 (EXAFS data), Figure 3E, Figure 3F
Key reasoning: Upon full discharge to -0.5 V, protons insert into the MoO3 lattice, reducing the Mo oxidation state from +6 to +4.55. The inserted protons bind to terminal oxygen atoms, forming O-H bonds. This causes structural changes including the elongation of terminal Mo-O bonds, contraction of corner-sharing Mo-O bonds, and elongation of edge-sharing Mo-O bonds.
Reasoning source: Section 2. Results and discussion, Pages 9-10
Scoring Rubric (total: 100 pts)
| Q | Type | Max | Question | Reference Answer | Scoring Criteria |
|---|---|---|---|---|---|
| q1 | identification | 30 | What phase dominates the MoO3 electrode when fully discharged to -0.5 V in 9.5 m H3PO4, and what is the expected oxidation state of Mo in this state? | The MoO3 electrode is entirely dominated by the HxMoO3 (protonated MoO3) phase, representing a fraction of 1.0, with an expected Mo oxidation state of +4.55. This complete phase transformation occurs because fully discharging the cell to -0.5 V vs Ag/AgCl in the 9.5 m H3PO4 electrolyte drives protons to insert into the MoO3 lattice. The insertion of these protons reduces the molybdenum atoms from their pristine +6 oxidation state down to +4.55, resulting in the fully protonated HxMoO3 structure. | Full credit for identifying protonated MoO3 (HxMoO3) and stating the Mo oxidation state is reduced to +4.55. |
| q2 | spectral | 40 | Describe the expected changes in the local coordination environment and the corresponding distinguishing features in the Fourier-transformed Mo K-edge EXAFS spectrum for the fully discharged MoO3 compared to the pristine state. | The Fourier-transformed Mo K-edge EXAFS spectrum of the fully discharged sample is distinguished by a new O-H bond peak below 1 Å, a broad merged Mo-O peak at ~1.47 Å, a new edge-sharing Mo-O peak at 2.2 Å, and a rightward shift of the Mo-Mo peak. These spectral changes occur because discharging the electrode to -0.5 V causes protons from the electrolyte to insert into the lattice and bind to terminal oxygen atoms. This protonation forms Mo-O-H bonds and inserted H2O molecules, which structurally forces the terminal Mo-O bonds to elongate and the corner-sharing Mo-O bonds to contract until their signals merge. Furthermore, the reduction of Mo to +4.55 causes the edge-sharing Mo-O bonds to elongate, producing the new distinct peak at 2.2 Å. | Full credit for mentioning the appearance of an O-H peak below 1 Å, a broad merged Mo-O peak at ~1.47 Å (from corner-sharing and terminal Mo-O), a new edge-sharing Mo-O peak at 2.2 Å, and a right-shifted Mo-Mo peak. |
| q3 | reasoning | 30 | Explain the physical reasoning behind the structural changes observed in the Mo-O bonds (terminal, corner-sharing, and edge-sharing) upon full discharge. | The structural changes in the Mo-O bonds are driven by the electrochemical insertion of protons into the MoO3 lattice during the full discharge to -0.5 V. Once inserted from the 9.5 m H3PO4 electrolyte, these protons bind directly to the terminal oxygen atoms to form O-H bonds. This protonation, coupled with the reduction of the Mo oxidation state from +6 to +4.55, alters the local bonding environment within the lattice. Consequently, this mechanism forces the terminal Mo-O bonds to elongate, the corner-sharing Mo-O bonds to contract, and the edge-sharing Mo-O bonds to elongate. | Full credit for explaining that inserted protons bind to terminal oxygen atoms, which elongates the terminal Mo-O bonds, contracts the structure along the a-axis (decreasing corner-sharing Mo-O distance), and elongates the edge-sharing Mo-O bonds. |
Review
#94
MoO3
Mo K-edge
▶
LLM Prompt
Sample Information
Material: MoO3
Electrode Type: anode
Electrolyte: 9.5 m H3PO4
Cell Type: Swagelok half-cell
Charge Discharge: charged
Voltage V: 0.3 V vs Ag/AgCl
State Of Charge: fully charged
Cycle Number: 1
Sample-Specific Conditions
- state of charge: fully charged
- MoO3 electrode fully charged (deprotonated) in the first cycle
Measurement
We plan to measure the Mo K-edge XANES spectrum of this sample.
Questions
Based on all the information above:
1. Based on the electrochemical conditions (fully charged to 0.3 V vs Ag/AgCl after the first cycle), what is the expected oxidation state of Mo in this sample, and what physical phenomenon does this indicate about the proton storage mechanism?
2. Describe the expected changes in the local coordination environment of Mo for this fully charged sample compared to pristine MoO3, specifically regarding the Mo-O and Mo-Mo scattering paths in the EXAFS region.
Ground Truth
Material: MoO3
Measurement: Mo K-edge XAS (ex situ) at APS bending-magnet beamline 9-BM-B
Fit method: not reported
Phase fractions:
| Phase | Fraction |
|---|---|
| HxMoO3 (trapped protons) | 1.0 |
Source evidence: Figure 3E, Figure 3F, Page 9, Page 10
Key reasoning: After a full charge, Mo's oxidation state is only raised to +5.5 (compared to +6 in pristine MoO3), which suggests the trapping of protons inside the structure in the first cycle. In EXAFS, after deprotonation, the elimination of the hydrogen bond causes the corner-sharing Mo-O to elongate and the edge-sharing Mo-O bond to shorten, merging these two peaks into a single peak, while the low oxidation state of Mo induces a remained right shift of the Mo-Mo peak.
Reasoning source: Page 9 (XPS discussion) and Page 10 (EXAFS discussion)
Scoring Rubric (total: 100 pts)
| Q | Type | Max | Question | Reference Answer | Scoring Criteria |
|---|---|---|---|---|---|
| q1 | reasoning | 57 | Based on the electrochemical conditions (fully charged to 0.3 V vs Ag/AgCl after the first cycle), what is the expected oxidation state of Mo in this sample, and what physical phenomenon does this indicate about the proton storage mechanism? | The expected oxidation state of Mo in this fully charged sample is +5.5. This indicates the physical phenomenon of proton trapping inside the MoO3 structure during the first cycle, resulting in a 100% HxMoO3 phase. Even though the electrode is fully charged (deprotonated) to 0.3 V vs Ag/AgCl in the 9.5 m H3PO4 electrolyte, the Mo oxidation state fails to return to the +6 state found in pristine MoO3. This incomplete re-oxidation occurs because some protons remain irreversibly trapped within the host structure after the initial cycle, preventing a full return to the pristine state. | The answer must state that the Mo oxidation state is +5.5 (or lower than the pristine +6 state) and explain that this indicates the irreversible trapping of protons inside the MoO3 structure during the first cycle. |
| q2 | spectral | 43 | Describe the expected changes in the local coordination environment of Mo for this fully charged sample compared to pristine MoO3, specifically regarding the Mo-O and Mo-Mo scattering paths in the EXAFS region. | In the EXAFS region, the corner-sharing and edge-sharing Mo-O bonds merge into a single peak, and the Mo-Mo peak exhibits a persistent right shift compared to pristine MoO3. These spectral features arise directly from the structural and electronic state of the sample after being fully charged (deprotonated) to 0.3 V vs Ag/AgCl in the first cycle. The elimination of hydrogen bonds during deprotonation causes the corner-sharing Mo-O bonds to elongate and the edge-sharing Mo-O bonds to shorten, merging the two oxygen scattering paths. Additionally, because protons from the electrolyte remain trapped in the structure (forming HxMoO3), the Mo oxidation state only reaches +5.5 instead of +6.0, and this persistently lower oxidation state induces the right shift of the Mo-Mo peak. | The answer must mention that the corner-sharing and edge-sharing Mo-O peaks merge into a single peak, and that the Mo-Mo peak remains right-shifted due to the lower oxidation state. |
Review
Sustainedly High‐Rate Electroreduction of CO 2 to Multi‐Carbon Products on Nickel Oxygenate/Copper Interfacial Catalysts
APS
Catalyst
Xuejiao Mao et al.
DOI: 10.1002/aenm.202400827
3 scenarios
▶
#95
NiCu-OP
Cu K-edge
▶
LLM Prompt
Sample Information
Material: NiCu-OP
Support: carbon paper
Reaction Conditions: 1 M KOH
Sample-Specific Conditions
- Potential: OCV
- Ni-Cu oxygenate precursor at open circuit voltage
Measurement
We plan to measure the Cu K-edge XANES spectrum of this sample.
Questions
Based on all the information above:
1. What is the dominant Cu phase and its oxidation state in the NiCu-OP sample at OCV, and what reference spectra would be appropriate to compare against to confirm this state?
2. Describe the key spectral feature expected in the Cu K-edge XANES spectrum for this sample at OCV and explain how it distinguishes this state from the reduced state observed at negative potentials.
3. Based on the physical conditions, explain why this specific Cu oxidation state is observed at OCV and how the phase composition is expected to change when a negative potential (e.g., -0.8 V) is applied.
Ground Truth
Material: NiCu-OP
Measurement: in situ Cu K-edge XANES
Fit method: not reported
Phase fractions: (±10%)
| Phase | Fraction |
|---|---|
| Cu(II) species | 1.0 |
Fit basis (paper's reference spectra):
- Cu
- Cu2O
- CuO
Source evidence: Page 7, lines 130-131; Figure 2c
Key reasoning: Under the initial open circuit voltage (OCV) condition, the NiCu-OP precursor remains in its initial oxidized state. The XRD pattern of the NiCu-OP is almost identical to that of pure Cu2(OH)3Cl, and the XANES spectrum exhibits a characteristic Cu(II) peak, indicating that the copper centers have not yet been reduced by an applied cathodic potential.
Reasoning source: Page 7, lines 130-131; Page 4, lines 73-74
Scoring Rubric (total: 100 pts)
| Q | Type | Max | Question | Reference Answer | Scoring Criteria |
|---|---|---|---|---|---|
| q1 | identification | 30 | What is the dominant Cu phase and its oxidation state in the NiCu-OP sample at OCV, and what reference spectra would be appropriate to compare against to confirm this state? | The dominant phase in the NiCu-OP sample on carbon paper at OCV is a Cu(II) species, specifically a Cu2(OH)3Cl-like phase, which accounts for a fraction of 1.0. To confirm this state, appropriate reference spectra for fitting include Cu, Cu2O, and CuO. This specific Cu(II) phase is expected because, under the initial open circuit voltage (OCV) conditions in 1 M KOH, the Ni-Cu oxygenate precursor remains in its initial oxidized state. Since no cathodic potential has been applied to the system, the copper centers have not yet been reduced, preserving the fully oxidized Cu(II) composition. | Full points for identifying Cu(II) species (or a Cu2(OH)3Cl-like phase) as the dominant phase (fraction 1.0) and mentioning appropriate standards such as CuO or Cu2O. |
| q2 | spectral | 40 | Describe the key spectral feature expected in the Cu K-edge XANES spectrum for this sample at OCV and explain how it distinguishes this state from the reduced state observed at negative potentials. | The Cu K-edge XANES spectrum for this sample at OCV is expected to exhibit a characteristic Cu(II) peak at approximately 8,985 eV. This feature clearly distinguishes the oxidized Cu(II) state from a reduced Cu(0) state, which would instead show a peak at approximately 8,980 eV. These spectral features directly reflect the sample conditions, as the NiCu-OP precursor is held at open circuit voltage in 1 M KOH. Because no cathodic potential has been applied, the copper centers remain in their initial oxidized Cu2(OH)3Cl-like state, thereby producing the higher-energy ~8,985 eV peak characteristic of Cu(II) rather than the lower-energy peak of reduced copper. | Full points for mentioning the characteristic Cu(II) peak at ~8,985 eV and noting that it distinguishes the sample from reduced Cu(0), which has a peak at ~8,980 eV. |
| q3 | reasoning | 30 | Based on the physical conditions, explain why this specific Cu oxidation state is observed at OCV and how the phase composition is expected to change when a negative potential (e.g., -0.8 V) is applied. | At OCV in 1 M KOH, the NiCu-OP sample is observed exclusively as a Cu(II) species (Cu2(OH)3Cl-like) because the precursor remains in its initial oxidized state. Under these open circuit conditions, there is no applied cathodic potential to drive the reduction of the copper centers. If a negative potential were applied, the phase composition would be expected to change as the cathodic potential reduces the copper centers from the oxidized Cu(II) state to a reduced Cu(0) state. This structural and electronic transformation would be evidenced by the characteristic XANES peak shifting from ~8,985 eV to approximately 8,980 eV. | Full points for explaining that at OCV the precursor remains in its initial oxidized Cu(II) state, and that applying a negative potential will reduce the Cu(II) centers to lower oxidation states like Cu(0). |
Review
#96
NiOOH/Cu
Cu K-edge
▶
LLM Prompt
Sample Information
Material: NiOOH/Cu
Support: carbon paper
Reaction Conditions: 1 M KOH, -0.8 V to -1.4 V vs RHE
Sample-Specific Conditions
- Potential: -0.8 V to -1.4 V vs RHE
- NiOOH/Cu electrocatalyst under CO2RR conditions
Measurement
We plan to measure the Cu K-edge XANES spectrum of this sample.
Questions
Based on all the information above:
1. Under the specified reaction conditions (-0.8 V to -1.4 V vs RHE), what is the dominant oxidation state and phase of copper in the NiOOH/Cu electrocatalyst, and what physical transformation drives this?
2. Describe the key spectral feature expected in the Cu K-edge XANES spectrum for this sample at negative potentials. How does this feature distinguish the active catalyst from its initial open-circuit voltage (OCV) state?
Ground Truth
Material: NiOOH/Cu
Measurement: In situ Cu K-edge XANES
Fit method: not reported
Phase fractions: (±10%)
| Phase | Fraction |
|---|---|
| metallic_copper (Cu) | 1.0 |
Fit basis (paper's reference spectra):
- Cu
- Cu2O
- CuO
Source evidence: Page 7, Lines 131-138; Figure 2c
Key reasoning: As the potential is decreased to -0.8 V and maintained down to -1.4 V, the initial Cu(II) centers from the precursor are reduced. The stable retention of a peak at approximately 8,980 eV indicates the conversion of nearly all Cu(II) centers to metallic Cu(0) under these low potential conditions.
Reasoning source: Page 7, Lines 131-138
Scoring Rubric (total: 100 pts)
| Q | Type | Max | Question | Reference Answer | Scoring Criteria |
|---|---|---|---|---|---|
| q1 | reasoning | 47 | Under the specified reaction conditions (-0.8 V to -1.4 V vs RHE), what is the dominant oxidation state and phase of copper in the NiOOH/Cu electrocatalyst, and what physical transformation drives this? | Under the specified reaction conditions of -0.8 V to -1.4 V vs RHE in 1 M KOH, the dominant oxidation state of copper is 0, corresponding to a 100% metallic copper (Cu) phase. This phase composition arises because the highly negative applied potentials drive the electrochemical reduction of the initial Cu(II) centers present in the precursor. As the potential is decreased and maintained in this cathodic regime during CO2 reduction, nearly all Cu(II) centers are completely converted to stable metallic Cu(0). This physical transformation is confirmed by the stable retention of the metallic copper phase throughout the entire -0.8 V to -1.4 V potential range. | Full points if the answer identifies metallic Cu (Cu(0)) as the dominant phase and explains that the applied negative potentials drive the reduction of nearly all initial Cu(II) centers to lower oxidation states. |
| q2 | spectral | 53 | Describe the key spectral feature expected in the Cu K-edge XANES spectrum for this sample at negative potentials. How does this feature distinguish the active catalyst from its initial open-circuit voltage (OCV) state? | The in situ Cu K-edge XANES spectrum for this sample exhibits a characteristic peak at approximately 8,980 eV, which matches the metallic Cu standard. This specific spectral feature arises because the applied negative potentials (-0.8 V to -1.4 V vs RHE) under CO2RR conditions completely reduce the initial Cu(II) centers in the NiOOH/Cu electrocatalyst to metallic Cu(0). This ~8,980 eV peak clearly distinguishes the active catalyst from its initial open-circuit voltage (OCV) state, which instead displays a characteristic Cu(II) peak at approximately 8,985 eV. The shift in peak position from ~8,985 eV to ~8,980 eV directly reflects the electrochemical reduction of the copper species driven by the low potential conditions. | Full points if the answer mentions the appearance of a peak at approximately 8,980 eV corresponding to Cu(0), and contrasts it with the characteristic Cu(II) peak at ~8,985 eV present under initial OCV conditions. |
Review
#97
NiCu-OP
Ni K-edge
▶
LLM Prompt
Sample Information
Material: NiCu-OP
Support: carbon paper
Reaction Conditions: 1 M KOH
Sample-Specific Conditions
- Potential: OCV
- Ni-Cu oxygenate precursor at open circuit voltage
Measurement
We plan to measure the Ni K-edge XANES spectrum of this sample.
Questions
Based on all the information above:
1. Based on the sample conditions (NiCu-OP at OCV in 1 M KOH), what is the expected dominant Ni-containing phase and its corresponding oxidation state?
2. Describe the expected spectral shape and the specific energy of the edge position for the Ni K-edge XANES spectrum of this sample.
3. Explain the reasoning for the expected phase composition of the Ni species at open circuit voltage (OCV) and how the X-ray absorption data supports this assignment.
4. If performing linear combination fitting (LCF) or EXAFS fitting to analyze the structural evolution of this catalyst, what reference standard spectra would be appropriate to include as a basis?
Ground Truth
Material: NiCu-OP
Measurement: in situ Ni K-edge XANES
Fit method: not reported for XANES
Phase fractions: (±10%)
| Phase | Fraction |
|---|---|
| NiOOH | 1.0 |
Fit basis (paper's reference spectra):
- Ni
- NiO
- β-NiOOH
Source evidence: Page 7, lines 118-120; Figure 2a
Key reasoning: Under the initial OCV condition, the catalyst shows a characteristic Ni(III) peak at the edge position in the normalized Ni K-edge XANES spectrum. Extended X-ray absorption fine structure (EXAFS) spectra display characteristic Ni-O and Ni-Ni bond peaks, demonstrating that Ni species exist in a NiOOH structure under all conditions.
Reasoning source: Page 7, lines 118-125
Scoring Rubric (total: 100 pts)
| Q | Type | Max | Question | Reference Answer | Scoring Criteria |
|---|---|---|---|---|---|
| q1 | identification | 25 | Based on the sample conditions (NiCu-OP at OCV in 1 M KOH), what is the expected dominant Ni-containing phase and its corresponding oxidation state? | The expected dominant Ni-containing phase is NiOOH, with an oxidation state of Ni(III), comprising 100% (fraction of 1.0) of the sample. This phase arises because the Ni-Cu oxygenate precursor (NiCu-OP) supported on carbon paper in 1 M KOH naturally exists in this oxidized state at open circuit voltage (OCV). Under these initial OCV conditions, the catalyst exhibits a characteristic Ni(III) peak at the edge position in the XANES spectrum. Furthermore, EXAFS data confirms the presence of characteristic Ni-O and Ni-Ni bonds, demonstrating that the Ni species structurally exist as NiOOH under these specific conditions. | Full credit for identifying NiOOH as the dominant phase and Ni(III) as the oxidation state. |
| q2 | spectral | 25 | Describe the expected spectral shape and the specific energy of the edge position for the Ni K-edge XANES spectrum of this sample. | The expected Ni K-edge XANES spectrum exhibits a characteristic edge position peak at approximately 8343 eV. This spectral shape is indicative of a Ni(III) oxidation state. These specific features arise because the NiCu-OP catalyst in 1 M KOH at open circuit voltage (OCV) exists entirely as a NiOOH phase. The structural and electronic properties of this Ni-Cu oxygenate precursor under these initial OCV conditions produce this distinct 8343 eV edge position, which is corroborated by EXAFS showing characteristic Ni-O and Ni-Ni bonds of the NiOOH structure. | Full credit for mentioning the characteristic peak at the edge position and specifying the energy at approximately 8,343 eV. |
| q3 | reasoning | 30 | Explain the reasoning for the expected phase composition of the Ni species at open circuit voltage (OCV) and how the X-ray absorption data supports this assignment. | At open circuit voltage (OCV) in 1 M KOH, the NiCu-OP catalyst is expected to be composed entirely of NiOOH (fraction of 1.0). This composition occurs because the initial state of the Ni-Cu oxygenate precursor naturally adopts a Ni(III) oxidation state under these alkaline conditions. The X-ray absorption data supports this assignment through the normalized Ni K-edge XANES spectrum, which shows a characteristic Ni(III) peak at an edge position of 8343 eV. Additionally, EXAFS spectra display characteristic Ni-O and Ni-Ni bond peaks, definitively demonstrating that the Ni species exist in a NiOOH structure under these OCV conditions. | Full credit for explaining that the XANES edge position indicates Ni(III) and that EXAFS confirms the presence of Ni-O and Ni-Ni bonds characteristic of a NiOOH structure. |
| q4 | identification | 20 | If performing linear combination fitting (LCF) or EXAFS fitting to analyze the structural evolution of this catalyst, what reference standard spectra would be appropriate to include as a basis? | Appropriate reference standard spectra to include as a fit basis are metallic Ni, NiO, and β-NiOOH. These specific references are chosen because they represent the relevant oxidation states and structural phases for the NiCu-OP catalyst in 1 M KOH. Under the initial open circuit voltage (OCV) conditions, the catalyst exists entirely as NiOOH (fraction of 1.0) with a Ni(III) oxidation state, as evidenced by the 8343 eV edge position and characteristic Ni-O and Ni-Ni bonds. Including Ni, NiO, and β-NiOOH allows for accurate tracking of any structural or electronic evolution from this initial Ni-Cu oxygenate precursor state. | Full credit for listing Ni, NiO, and β-NiOOH as the reference standards. |
Review
Engineering Atomically Dispersed FeN4 Active Sites for CO2 Electroreduction
APS
Catalyst
Nadia Mohd Adli et al.
DOI: 10.1002/ange.202012329
2 scenarios
▶
#98
Fe-N-C precursor
Fe K-edge
▶
LLM Prompt
Sample Information
Material: Fe-N-C precursor
Support: N-doped carbon (N-C)
Sample-Specific Conditions
- Thermal activation temperature: Untreated
- Fe3+ ions adsorbed onto 200 nm N-C host before thermal activation
Measurement
We plan to measure the Fe K-edge XANES spectrum of this sample.
Questions
Based on all the information above:
1. Based on the synthesis conditions (adsorption of Fe3+ ions onto an N-C host without subsequent thermal activation), what is the expected dominant oxidation state of Fe, and what reference material would its XANES absorption edge most closely match?
2. Describe the expected distinguishing features of the Fe K-edge XANES spectrum for this untreated sample compared to standard Fe/FeO references and samples that have undergone thermal activation at >400 °C.
3. What physical reasoning explains the presence of this specific Fe phase in the untreated sample, and what complementary structural evidence (e.g., EXAFS or microscopy) supports this assignment?
Ground Truth
Material: Fe-N-C precursor (thermally untreated)
Measurement: ex-situ Fe K-edge XANES at beamline 5-BM-D of DND-CAT and 9-BM-C at Argonne National Laboratory
Fit method: Qualitative comparison of absorption edge position
Phase fractions:
| Phase | Fraction |
|---|---|
| unstable single sites and oxide clusters | 1.0 |
Fit basis (paper's reference spectra):
- Fe
- FeO
- Fe2O3
Source evidence: Page 7, Section 2.2.3; Figure 4a
Key reasoning: The absorption edge of the thermally untreated sample matches very well with that of the Fe2O3 reference, indicating an oxidation state close to 3+. This is consistent with the use of Fe3+ salts (Fe(III) nitrate) during the adsorption process. EXAFS and STEM/EELS further confirm that before thermal activation, Fe exists as unstable single sites or oxide clusters with Fe-Fe distances typical of Fe oxides.
Reasoning source: Page 7, Section 2.2.3 'Intrinsic activity improvement by tuning Fe-N bonds via thermal activation'
Scoring Rubric (total: 100 pts)
| Q | Type | Max | Question | Reference Answer | Scoring Criteria |
|---|---|---|---|---|---|
| q1 | prediction | 30 | Based on the synthesis conditions (adsorption of Fe3+ ions onto an N-C host without subsequent thermal activation), what is the expected dominant oxidation state of Fe, and what reference material would its XANES absorption edge most closely match? | The expected dominant oxidation state of Fe in this sample is 3+, and its XANES absorption edge will most closely match the Fe2O3 reference. This occurs because the synthesis involves the direct adsorption of Fe3+ salts (such as Fe(III) nitrate) onto the 200 nm N-doped carbon host without any subsequent thermal activation. Because the sample remains thermally untreated, the initial 3+ oxidation state of the precursor is preserved, preventing the chemical reduction that typically occurs at higher temperatures. Consequently, the Fe exists entirely (fraction 1.0) as unstable single sites and Fe2O3-like oxide clusters. | Full credit if the answer correctly identifies the oxidation state as 3+ and states that the absorption edge matches Fe2O3, linking it to the use of Fe3+ precursor salts. |
| q2 | spectral | 40 | Describe the expected distinguishing features of the Fe K-edge XANES spectrum for this untreated sample compared to standard Fe/FeO references and samples that have undergone thermal activation at >400 °C. | The Fe K-edge XANES spectrum for this untreated sample will exhibit an absorption edge located at a higher energy corresponding to Fe3+, matching the Fe2O3 reference. Additionally, its pre-edge intensity will be lower compared to samples that undergo high-temperature thermal activation. These spectral features arise because the lack of thermal treatment preserves the initial Fe3+ state from the adsorbed precursor salts, leaving the iron as unstable single sites and Fe2O3-like oxide clusters. In contrast, standard Fe foil and FeO references, as well as samples activated at >400 °C, undergo chemical reduction to form atomically dispersed Fe sites with lower oxidation states, which shifts their absorption edges to lower energies. | Full credit if the answer notes that the absorption edge is at a higher energy (matching Fe3+/Fe2O3) compared to Fe foil and FeO, and mentions that it lacks the chemical reduction (shift to lower energy) and increased pre-edge intensity seen in samples activated at higher temperatures. |
| q3 | reasoning | 30 | What physical reasoning explains the presence of this specific Fe phase in the untreated sample, and what complementary structural evidence (e.g., EXAFS or microscopy) supports this assignment? | The presence of Fe2O3-like oxide clusters and unstable single sites in the untreated sample is directly due to the synthesis conditions, specifically the adsorption of Fe3+ salts onto the N-C host without any thermal activation. Without the heat treatment required to drive chemical reduction and stable Fe-N bond formation, the iron remains in its initial 3+ oxidation state. Complementary structural evidence from EXAFS and STEM/EELS confirms this assignment by showing that before thermal activation, the Fe-Fe distances are typical of iron oxides. This demonstrates that the unactivated Fe3+ ions remain as oxide clusters or unstable single sites rather than forming the chemically reduced, atomically dispersed sites seen in high-temperature activated samples. | Full credit if the answer explains that the Fe3+ state is retained from the unactivated precursor salts, and cites EXAFS evidence of Fe-Fe distances typical of Fe oxides (2-3 Å) or STEM/EELS evidence showing unstable single sites or oxide clusters. |
Review
#99
Fe-N-C
Fe K-edge
▶
LLM Prompt
Sample Information
Material: Fe-N-C
Support: N-doped carbon (N-C)
Sample-Specific Conditions
- Thermal activation temperature: 400 °C
- Fe-N-C catalyst thermally activated at 400 °C
Measurement
We plan to measure the Fe K-edge XANES spectrum of this sample.
Questions
Based on all the information above:
1. Based on the provided sample conditions (Fe-N-C thermally activated at 400 °C), what is the expected dominant phase and how does its oxidation state compare to the untreated precursor and samples activated at higher temperatures (e.g., 900 °C)?
2. Describe the expected relative edge position of the Fe K-edge XANES spectrum for this 400 °C activated sample compared to the thermally untreated sample.
3. How would the pre-edge intensity of this 400 °C sample compare to a sample activated at 900 °C, and what structural change does this difference indicate according to the paper?
Ground Truth
Material: Fe-N-C
Measurement: Fe K-edge ex-situ XANES at beamline 5-BM-D of DND-CAT and 9-BM-C at Argonne National Laboratory
Fit method: not reported
Fit basis (paper's reference spectra):
- Fe
- FeO
- Fe2O3
Source evidence: Figure 4a, page 9
Key reasoning: As the thermal activation temperature is increased to 400 °C, the Fe species are chemically reduced, which is evident by the shifting of the XANES edge towards lower energy compared to the untreated sample. At temperatures over 400 °C, FeOx species decompose to form atomically dispersed Fe sites. The 400 °C sample represents a state with a higher oxidation state and lower pre-edge intensity than samples activated at higher temperatures like 900 °C.
Reasoning source: Section 2.2.3, page 8
Scoring Rubric (total: 100 pts)
| Q | Type | Max | Question | Reference Answer | Scoring Criteria |
|---|---|---|---|---|---|
| q1 | reasoning | 30 | Based on the provided sample conditions (Fe-N-C thermally activated at 400 °C), what is the expected dominant phase and how does its oxidation state compare to the untreated precursor and samples activated at higher temperatures (e.g., 900 °C)? | For the Fe-N-C catalyst thermally activated at 400 °C, the expected species include FeOx and FeN4 sites, as temperatures above 400 °C are required to fully decompose FeOx into atomically dispersed Fe sites. The oxidation state of this 400 °C sample is chemically reduced compared to the untreated Fe3+ precursor, but it remains higher than that of samples activated at 900 °C. This intermediate state arises because the 400 °C thermal activation provides enough energy to initiate the chemical reduction of the initial iron species. However, the temperature is not high enough to completely decompose the iron oxides into the fully dispersed, lower-oxidation-state Fe sites that form at higher temperatures. | Full points for identifying FeN4 (or atomically dispersed Fe sites) as the dominant phase, and stating that the oxidation state is reduced compared to the untreated precursor (Fe3+) but remains higher than samples activated at 900 °C. |
| q2 | spectral | 30 | Describe the expected relative edge position of the Fe K-edge XANES spectrum for this 400 °C activated sample compared to the thermally untreated sample. | The Fe K-edge position for the 400 °C activated sample is expected to shift to a lower energy compared to the thermally untreated sample, which resembles an Fe2O3 reference. This spectral shift to lower energy directly reflects a decrease in the oxidation state of the iron atoms. Specifically, the thermal activation at 400 °C provides sufficient energy to chemically reduce the initial Fe3+ species present in the untreated Fe-N-C catalyst. Consequently, this reduced oxidation state lowers the core electron binding energy, causing the XANES absorption edge to appear at a lower energy. | Full points for stating the edge position shifts to lower energy compared to the thermally untreated sample, indicating chemical reduction of the Fe species. |
| q3 | spectral | 40 | How would the pre-edge intensity of this 400 °C sample compare to a sample activated at 900 °C, and what structural change does this difference indicate according to the paper? | The pre-edge intensity of the 400 °C activated sample is expected to be lower than that of a sample activated at 900 °C. According to the provided data, this lower pre-edge intensity indicates that the 400 °C sample possesses higher symmetry around the Fe atom or longer Fe-N bond lengths. This structural difference arises because the 400 °C thermal activation is insufficient to fully decompose FeOx species into the highly distorted, atomically dispersed FeN4 sites that form at higher temperatures. As a result, the iron sites at 400 °C retain a more symmetric coordination environment, which inherently suppresses the intensity of the pre-edge transitions compared to the 900 °C sample. | Full points for stating the pre-edge intensity is lower for the 400 °C sample compared to the 900 °C sample, and that this indicates higher symmetry around the Fe atom or longer Fe-N bond lengths in the 400 °C sample. |
Review
Enhanced Carbon Dioxide Electroreduction to Carbon Monoxide over Defect‐Rich Plasma‐Activated Silver Catalysts
BNL-NSLS-II-8-ID
Catalyst
Hemma Mistry et al.
DOI: 10.1002/anie.201704613
1 scenario
▶
#100
Ag
Ag K
▶
LLM Prompt
Sample Information
Material: Ag
Reaction Conditions: in air
Sample-Specific Conditions
- plasma gas: Ar
- Ag foil treated with Ar plasma, measured as prepared
Measurement
We plan to measure the Ag K XANES spectrum of this sample.
Questions
Based on all the information above:
1. Based on the sample conditions (Ar plasma treatment of Ag foil), what is the expected dominant phase in the Ag K-edge XAS spectrum, and what reference spectrum should be used for comparison?
2. Explain the physical reasoning for why the Ar plasma-treated sample remains in this specific phase state, and contrast this with the expected chemical effect of an O2 plasma treatment.
3. What key spectral characteristics would distinguish the XAS spectrum of this Ar plasma-treated sample from one treated with O2 plasma?
Ground Truth
Material: Ag
Measurement: Ag K-edge EXAFS (grazing incidence)
Fit method: EXAFS comparison to reference
Phase fractions:
| Phase | Fraction |
|---|---|
| metallic Ag | 1.0 |
Fit basis (paper's reference spectra):
- untreated Ag foil (metallic Ag)
Source evidence: Page 4, text: 'In their initial state, the Ar and H2 plasma-treated foils appear similar in EXAFS to an untreated Ag foil (that is, in their metallic state)'
Key reasoning: Ar plasma treatment introduces physical defects (pore formation) on and below the surface but does not chemically oxidize the silver. STEM-EDS indicates only trace oxygen (1 atomic weight %) in the top 500 nm. Therefore, the sample remains entirely in its metallic state.
Reasoning source: Page 4, paragraphs 2 and 3
Scoring Rubric (total: 100 pts)
| Q | Type | Max | Question | Reference Answer | Scoring Criteria |
|---|---|---|---|---|---|
| q1 | identification | 30 | Based on the sample conditions (Ar plasma treatment of Ag foil), what is the expected dominant phase in the Ag K-edge XAS spectrum, and what reference spectrum should be used for comparison? | The expected dominant phase for the Ar plasma-treated Ag foil is metallic Ag (oxidation state 0), accounting for a fraction of 1.0. The appropriate reference spectrum for comparison is an untreated metallic Ag foil. This specific phase is expected because the Ar plasma treatment only introduces physical defects, such as pore formation on and below the surface, rather than causing chemical oxidation. Because STEM-EDS indicates only trace oxygen (1 atomic weight %) in the top 500 nm, the sample remains entirely in its metallic state despite the plasma treatment. | Full points for identifying metallic Ag as the dominant phase and untreated Ag foil (or metallic Ag) as the necessary reference spectrum. |
| q2 | reasoning | 40 | Explain the physical reasoning for why the Ar plasma-treated sample remains in this specific phase state, and contrast this with the expected chemical effect of an O2 plasma treatment. | The Ar plasma-treated sample remains entirely in a metallic Ag phase because the argon plasma does not chemically oxidize the silver. Instead, the treatment solely introduces physical defects, specifically pore formation on and below the surface of the foil. STEM-EDS confirms this lack of chemical reaction by showing only trace amounts of oxygen (1 atomic weight %) in the top 500 nm. In contrast, an O2 plasma treatment would chemically oxidize the silver, leading to the formation of Ag-O bonds and distinct oxide phases that are completely absent in the Ar-treated sample. | Full points for explaining that Ar plasma causes physical nanostructuring/defects (pores) without chemical oxidation, leaving the sample metallic, whereas an O2 plasma would heavily oxidize the silver. |
| q3 | spectral | 30 | What key spectral characteristics would distinguish the XAS spectrum of this Ar plasma-treated sample from one treated with O2 plasma? | The XAS spectrum of the Ar plasma-treated sample will appear similar in overall shape to an untreated metallic Ag foil. The key distinguishing characteristic of this spectrum is the complete lack of Ag-O bonds or oxide-related spectral features. These spectral characteristics arise because the Ar plasma treatment only causes physical defects like pore formation without chemically oxidizing the silver, leaving the sample entirely in a metallic state (oxidation state 0). Consequently, the spectrum lacks the distinct oxide features that would emerge in an O2 plasma-treated sample due to chemical oxidation. | Full points for stating the spectrum will match metallic Ag and lack any Ag-O bond features or oxide characteristics that would be present in an O2-treated sample. |
Review
Atomically Dispersed Molybdenum Catalysts for Efficient Ambient Nitrogen Fixation
BNL-NSLS-II-8-ID
Catalyst
Lili Han et al.
DOI: 10.1002/anie.201811728
1 scenario
▶
#101
Mo/N-doped porous carbon
Mo K
▶
LLM Prompt
Sample Information
Material: Mo/N-doped porous carbon
Support: N-doped porous carbon
Sample-Specific Conditions
- catalyst state: as-prepared
- Single Mo atoms anchored on N-doped porous carbon
Measurement
We plan to measure the Mo K XANES spectrum of this sample.
Questions
Based on all the information above:
1. What candidate reference spectra should be used as the basis to fit the Mo K-edge XANES spectrum of this as-prepared single-atom catalyst?
2. Estimate the relative phase fractions of the Mo species (or corresponding reference phases) present in this as-prepared catalyst.
Ground Truth
Material: Mo/N-doped porous carbon
Measurement: Mo K-edge XANES
Fit method: LCF
Phase fractions:
| Phase | Fraction |
|---|---|
| MoO3 | 0.825 |
| MoO2 | 0.175 |
Fit basis (paper's reference spectra):
- MoO3
- MoO2
Source evidence: Page 4, right column, paragraph 2
Key reasoning: The Mo K-edge XANES spectrum of SA-Mo/NPC shifts to a higher energy compared to Mo foil and Mo2C, indicating a valence greater than +2. Comparison with MoO3 and MoO2 references reveals the single site is predominantly +6. Linear combination fitting using MoO3 and MoO2 reference spectra determines the specific component ratio of Mo6+ to Mo4+.
Reasoning source: Page 4, right column, paragraph 2
Scoring Rubric (total: 100 pts)
| Q | Type | Max | Question | Reference Answer | Scoring Criteria |
|---|---|---|---|---|---|
| q1 | identification | 33 | What candidate reference spectra should be used as the basis to fit the Mo K-edge XANES spectrum of this as-prepared single-atom catalyst? | The candidate reference spectra that should be used as the basis for fitting are MoO3 and MoO2. In this as-prepared catalyst consisting of single Mo atoms anchored on N-doped porous carbon, the Mo K-edge XANES spectrum shifts to a higher energy compared to Mo foil and Mo2C. This shift indicates that the Mo single sites have an oxidation state greater than +2. Comparing the spectrum with these references reveals that the single Mo sites are predominantly in a +6 valence state, making MoO3 and MoO2 the appropriate basis to model the oxidized state of these anchored atoms. | Full points for identifying MoO3 and MoO2 (or Mo6+ and Mo4+ oxide references). |
| q2 | quantification | 67 | Estimate the relative phase fractions of the Mo species (or corresponding reference phases) present in this as-prepared catalyst. | The relative phase fractions for the Mo species in this catalyst are estimated to be 82.5% MoO3 and 17.5% MoO2. For this as-prepared sample of single Mo atoms anchored on N-doped porous carbon, the XANES absorption edge shifts to higher energy, indicating an oxidation state greater than +2. Linear combination fitting using the MoO3 and MoO2 reference spectra determines this specific component ratio of Mo6+ to Mo4+. The dominant fraction of the MoO3 reference (0.825) arises because the single Mo sites in the as-prepared state are predominantly in the +6 valence state. | Full points for estimating ~82.5% MoO3 (or Mo6+) and ~17.5% MoO2 (or Mo4+). Partial credit for identifying that Mo6+ is the dominant species (>75%). |
Review
From Copper to Basic Copper Carbonate: A Reversible Conversion Cathode in Aqueous Anion Batteries
APS
Electrochemistry
Trenton C. Gallagher et al.
DOI: 10.1002/anie.202203837
1 scenario
▶
#102
Cu
Cu K-edge
▶
LLM Prompt
Sample Information
Material: Cu
Electrode Type: working electrode
Electrolyte: 4.5 m K2CO3 + 9 m KOH
Cell Type: three-electrode cell
Charge Discharge: charged
C Rate: 500 mA/g
State Of Charge: 100%
Sample-Specific Conditions
- state of charge: fully charged
- Copper electrode fully charged in a saturated mixed aqueous electrolyte
Measurement
We plan to measure the Cu K-edge XANES spectrum of this sample.
Questions
Based on all the information above:
1. What candidate reference spectra are needed to perform Linear Combination Fitting (LCF) on the ex situ Cu K-edge XANES spectrum of this fully charged electrode?
2. Based on the sample conditions (fully charged in 4.5 m K2CO3 + 9 m KOH), estimate the phase fractions of the components present in the electrode.
Ground Truth
Material: Cu
Measurement: ex situ Cu K-edge XANES
Fit method: LCF
Phase fractions:
| Phase | Fraction |
|---|---|
| Cu2CO3(OH)2 | 0.421 |
| CuO | 0.578 |
Fit basis (paper's reference spectra):
- Cu2CO3(OH)2
- CuO
Source evidence: Page 5, text and Figure S3
Key reasoning: In the mixed electrolyte (4.5 m K2CO3 + 9 m KOH), the fully charged copper electrode oxidizes to form basic copper carbonate, Cu2CO3(OH)2, which is confirmed by a major peak at 8998 eV corresponding to cupric phases. Linear combination fitting identifies Cu2CO3(OH)2 as the primary charged product. However, a significant fraction of CuO is also present, which is attributed to the native oxide layer on the copper and sample handling rather than the direct electrochemical charging mechanism.
Reasoning source: Page 5, Results and Discussion
Scoring Rubric (total: 100 pts)
| Q | Type | Max | Question | Reference Answer | Scoring Criteria |
|---|---|---|---|---|---|
| q1 | identification | 33 | What candidate reference spectra are needed to perform Linear Combination Fitting (LCF) on the ex situ Cu K-edge XANES spectrum of this fully charged electrode? | To perform Linear Combination Fitting (LCF) on the ex situ Cu K-edge XANES spectrum of this fully charged electrode, the required candidate reference spectra are Cu2CO3(OH)2 and CuO. These specific phases are expected because, when fully charged at 500 mA/g in the mixed 4.5 m K2CO3 + 9 m KOH electrolyte, the copper oxidizes to form basic copper carbonate (Cu2CO3(OH)2) as the primary electrochemical product, characterized by a major cupric peak at 8998 eV. Furthermore, CuO is needed as a reference because a significant amount of it is present on the electrode. This CuO phase arises from the native oxide layer on the copper and ex situ sample handling, rather than the direct electrochemical charging mechanism. | Full credit for identifying both Cu2CO3(OH)2 (basic copper carbonate) and CuO as the necessary reference spectra. |
| q2 | quantification | 67 | Based on the sample conditions (fully charged in 4.5 m K2CO3 + 9 m KOH), estimate the phase fractions of the components present in the electrode. | Based on the sample conditions, the estimated phase fractions for the electrode are 0.421 (42.1%) Cu2CO3(OH)2 and 0.578 (57.8%) CuO. This specific composition results from the copper electrode being fully charged to a 100% state of charge in the saturated mixed aqueous electrolyte (4.5 m K2CO3 + 9 m KOH). The 42.1% fraction of Cu2CO3(OH)2 represents the primary oxidized product formed directly by the electrochemical charging mechanism in this carbonate-rich environment. Meanwhile, the larger 57.8% fraction of CuO is attributed to the native oxide layer present on the copper material and effects from ex situ sample handling, rather than the charging process itself. | Full credit for estimating approximately 42% Cu2CO3(OH)2 and 58% CuO. Partial credit for identifying that both phases are present in significant, roughly comparable amounts. |
Review
Atomically Dispersed Dual‐Metal Site Catalysts for Enhanced CO2 Reduction: Mechanistic Insight into Active Site Structures
APS
Catalyst
Yi Li et al.
DOI: 10.1002/anie.202205632
3 scenarios
▶
#103
Ni-Fe-N-C
Ni K-edge
▶
LLM Prompt
Sample Information
Material: Ni-Fe-N-C
Support: ZIF-8 derived N-doped carbon (ZIF-NC)
Sample-Specific Conditions
- Metal pair: Ni-Fe
- Optimal diatomic Ni-Fe catalyst on N-doped carbon
Measurement
We plan to measure the Ni K-edge XANES spectrum of this sample.
Questions
Based on all the information above:
1. What is the dominant local coordination environment (phase/structure) of Ni in this optimal ZIF-NC-Ni-Fe catalyst, and what is its expected oxidation state based on the XANES pre-edge?
2. Describe the expected distinguishing features in the Ni K-edge XANES spectrum of this diatomic catalyst compared to a standard nickel phthalocyanine (NiPc) reference.
Ground Truth
Material: ZIF-NC-Ni-Fe
Measurement: Ni K-edge XANES, ex-situ, beamline 9-BM-C at Argonne National Laboratory
Fit method: EXAFS fitting combined with DFT modeling
Phase fractions: (±10%)
| Phase | Fraction |
|---|---|
| 2N-bridged (Fe-Ni)N6 | 1.0 |
Fit basis (paper's reference spectra):
- Theoretical DFT models (e.g., 2N-bridged (Fe-Ni)N6, non-bridged (Fe-Ni)N6, 1N-bridged (Fe-Ni)N7)
Source evidence: Figure 2a, 2d, 2g, 2i; Page 3-4
Key reasoning: The Ni K-pre-edge position is adjacent to but on the low-energy side of NiPc, indicating an oxidation state close to Ni2+. The absence of the 8338 eV pre-edge peak and the distinct white line peaks at 8348 eV and 8358 eV show the local configuration is more complex than standard NiPc. EXAFS fitting combined with DFT modeling confirms the structure is a 2N-bridged (Fe-Ni)N6 site, with Ni coordinated to 4 N atoms and 1 Fe atom, lacking strong metal-metal scattering from nanoparticles.
Reasoning source: Results and Discussion, Pages 5-6
Scoring Rubric (total: 100 pts)
| Q | Type | Max | Question | Reference Answer | Scoring Criteria |
|---|---|---|---|---|---|
| q1 | identification | 43 | What is the dominant local coordination environment (phase/structure) of Ni in this optimal ZIF-NC-Ni-Fe catalyst, and what is its expected oxidation state based on the XANES pre-edge? | The dominant local coordination environment of Ni in this optimal ZIF-NC-Ni-Fe catalyst is a 2N-bridged (Fe-Ni)N6 moiety embedded in the N-doped carbon support, with an expected oxidation state close to Ni2+. This specific diatomic structure arises because the ZIF-8 derived N-doped carbon support effectively stabilizes isolated Ni-Fe pairs, preventing the formation of metallic nanoparticles that would otherwise exhibit strong metal-metal scattering. The oxidation state is determined to be close to Ni2+ because the Ni K-pre-edge position is adjacent to, but on the low-energy side of, a standard NiPc reference. EXAFS fitting combined with DFT modeling confirms this optimal configuration, showing that Ni is coordinated to four N atoms and one Fe atom in a 2N-bridged geometry. | Full points for identifying the 2N-bridged (Fe-Ni)N6 structure and an oxidation state close to Ni2+. |
| q2 | spectral | 57 | Describe the expected distinguishing features in the Ni K-edge XANES spectrum of this diatomic catalyst compared to a standard nickel phthalocyanine (NiPc) reference. | The Ni K-edge XANES spectrum of this catalyst is distinguished by the absence of the 8338 eV pre-edge peak typically seen in NiPc, alongside distinct white line peaks located at approximately 8348 eV and 8358 eV. These spectral differences arise because the optimal diatomic Ni-Fe catalyst possesses a more complex local configuration than standard mononuclear NiPc. Specifically, the Ni atoms are embedded within the ZIF-8 derived N-doped carbon as a 2N-bridged (Fe-Ni)N6 moiety, coordinating with four N atoms and one adjacent Fe atom. This unique heteronuclear diatomic structure alters the local symmetry and electronic environment of the Ni sites, directly resulting in the shifted white line peaks and the missing pre-edge feature. | Full points for mentioning the absence of the 8338 eV pre-edge peak found in NiPc and the presence of distinct white line peaks around 8348 eV and 8358 eV. |
Review
#104
Ni-Co-N-C
Ni K-edge
▶
LLM Prompt
Sample Information
Material: Ni-Co-N-C
Support: ZIF-8 derived N-doped carbon (ZIF-NC)
Sample-Specific Conditions
- Metal pair: Ni-Co
- Diatomic Ni-Co catalyst on N-doped carbon
Measurement
We plan to measure the Ni K-edge XANES spectrum of this sample.
Questions
Based on all the information above:
1. Based on the synthesis conditions (diatomic Ni-Co on N-doped carbon, 900 °C activation), what is the dominant local coordination structure of the Ni sites, and what is the expected oxidation state?
2. Describe the expected Ni K-edge XANES spectral features for this sample, specifically focusing on the pre-edge and white line regions.
3. How does the Ni K-edge XANES spectrum of this diatomic Ni-Co catalyst distinguish itself from standard monoatomic references like Ni phthalocyanine (NiPc)?
Ground Truth
Material: ZIF-NC-Ni-Co
Measurement: Ni K-edge XANES, ex-situ, beamline 9-BM-C at Argonne National Laboratory
Fit method: EXAFS fitting combined with DFT modeling
Phase fractions: (±10%)
| Phase | Fraction |
|---|---|
| 2N-bridged (Co-Ni)N6 | 1.0 |
Fit basis (paper's reference spectra):
- NiPc
- Ni foil
Source evidence: Figure 2a, Page 5; Page 6 text
Key reasoning: The Ni K-pre-edge position is adjacent to but on the low-energy side of NiPc, indicating an oxidation state close to Ni2+. The white line peak position and shape differ from standard metal-Pc references, suggesting a more complex local configuration. EXAFS fitting combined with DFT modeling confirms the bimetal-nitrogen 2N-bridged (Co-Ni)N6 structure.
Reasoning source: Results and Discussion, Pages 5-6
Scoring Rubric (total: 100 pts)
| Q | Type | Max | Question | Reference Answer | Scoring Criteria |
|---|---|---|---|---|---|
| q1 | identification | 30 | Based on the synthesis conditions (diatomic Ni-Co on N-doped carbon, 900 °C activation), what is the dominant local coordination structure of the Ni sites, and what is the expected oxidation state? | The dominant local coordination structure of the Ni sites is a 100% fraction of a bimetal-nitrogen 2N-bridged (Co-Ni)N6 configuration, and the expected oxidation state is close to Ni2+. These specific structural and electronic properties arise because the sample is synthesized as a diatomic Ni-Co catalyst supported on a ZIF-8 derived N-doped carbon matrix, which facilitates the formation of complex bimetallic sites rather than isolated single atoms. EXAFS fitting combined with DFT modeling confirms that this specific diatomic Ni-Co pairing on the N-doped carbon support stabilizes the 2N-bridged (Co-Ni)N6 architecture. Furthermore, the near Ni2+ oxidation state is a direct result of this specific coordination environment, as evidenced by the Ni K-pre-edge position being adjacent to but on the low-energy side of a NiPc reference. | Award 15 points for identifying the 2N-bridged (Co-Ni)N6 structure. Award 15 points for stating the oxidation state is close to Ni2+. |
| q2 | spectral | 40 | Describe the expected Ni K-edge XANES spectral features for this sample, specifically focusing on the pre-edge and white line regions. | The expected Ni K-edge XANES spectrum exhibits a pre-edge feature located adjacent to, but on the low-energy side of, a NiPc reference. In the white line region, the spectrum displays two distinct peaks located at approximately 8348 eV and 8358 eV. These specific spectral features arise directly from the sample's composition as a diatomic Ni-Co catalyst on N-doped carbon, which creates a more complex local configuration than isolated metal sites. The pre-edge position reflects an oxidation state close to Ni2+ stabilized by the nitrogen-doped carbon support, while the distinct white line peak positions and shape reflect the unique electronic structure of the bimetal-nitrogen 2N-bridged (Co-Ni)N6 architecture. | Award 20 points for mentioning the pre-edge position is adjacent to or on the low-energy side of NiPc. Award 20 points for identifying the white line peaks around 8348 eV and 8358 eV. |
| q3 | reasoning | 30 | How does the Ni K-edge XANES spectrum of this diatomic Ni-Co catalyst distinguish itself from standard monoatomic references like Ni phthalocyanine (NiPc)? | The Ni K-edge XANES spectrum of this catalyst distinguishes itself from standard monoatomic references like NiPc through both its pre-edge position and its unique white line profile. Specifically, the pre-edge position is adjacent to but on the low-energy side of NiPc, while the white line exhibits distinct peaks around 8348 eV and 8358 eV with a shape that differs significantly from standard metal-Pc references. These spectral differences arise because the sample is synthesized as a diatomic Ni-Co catalyst on a ZIF-8 derived N-doped carbon support, which forms a more complex local configuration than an isolated single-metal site. EXAFS and DFT modeling confirm this configuration is a 2N-bridged (Co-Ni)N6 structure, and this unique bimetal-nitrogen coordination alters the electronic environment compared to monoatomic NiPc, resulting in the distinct XANES features. | Award 15 points for noting that the white line peak position and shape are different from NiPc. Award 15 points for explaining that this difference indicates a more complex local configuration (diatomic site) compared to single metal sites. |
Review
#105
Fe-Co-N-C
Fe K-edge
▶
LLM Prompt
Sample Information
Material: Fe-Co-N-C
Support: ZIF-8 derived N-doped carbon (ZIF-NC)
Sample-Specific Conditions
- Metal pair: Fe-Co
- Diatomic Fe-Co catalyst on N-doped carbon
Measurement
We plan to measure the Fe K-edge XANES spectrum of this sample.
Questions
Based on all the information above:
1. What is the expected dominant structural motif for the Fe sites in this ZIF-NC-Fe-Co catalyst, and what physical reasoning explains the formation of this specific structure?
2. Describe the expected spectral shape and distinguishing features of the Fe K-edge XANES spectrum for this sample, particularly in comparison to a single-metal FePc reference.
3. What is the expected oxidation state of Fe in this sample, and what specific pre-edge feature distinguishes it from the FePc reference?
Ground Truth
Material: Fe-Co-N-C (ZIF-NC-Fe-Co)
Measurement: Fe K-edge XANES, ex-situ, beamline 9-BM-C at Argonne National Laboratory
Fit method: Qualitative comparison and EXAFS fitting coupled with DFT
Phase fractions: (±10%)
| Phase | Fraction |
|---|---|
| non-bridged (Fe-Co)N6 | 1.0 |
Fit basis (paper's reference spectra):
- Theoretical DFT models (e.g., non-bridged (Fe-Co)N6)
Source evidence: Figure 2b, Figure 2e, Page 5-6
Key reasoning: The Fe K-edge XANES shows an oxidation state close to FePc (~2+). EXAFS spectra show an evident metal-metal bond (Fe-Co peak around 2.4 Å). DFT modeling and EXAFS fitting confirm that Fe and Co atoms tend to thermodynamically form non-bridged (Fe-Co)N6 coordination structures, where Fe and Co directly coordinate with each other and connect to three N atoms.
Reasoning source: Page 5-6, Results and Discussion
Scoring Rubric (total: 100 pts)
| Q | Type | Max | Question | Reference Answer | Scoring Criteria |
|---|---|---|---|---|---|
| q1 | reasoning | 40 | What is the expected dominant structural motif for the Fe sites in this ZIF-NC-Fe-Co catalyst, and what physical reasoning explains the formation of this specific structure? | The expected dominant structural motif for the Fe sites is a non-bridged (Fe-Co)N6 coordination structure, which accounts for 100% of the fitted fraction. This specific structure arises because the sample is designed as a diatomic Fe-Co catalyst supported on ZIF-8 derived N-doped carbon. Under these synthesis conditions, Fe and Co atoms thermodynamically prefer to directly coordinate with each other, forming an evident metal-metal bond with an Fe-Co distance of around 2.4 Å. Consequently, the paired Fe and Co atoms each connect to three N atoms from the carbon support, resulting in the stable non-bridged (Fe-Co)N6 dual-metal configuration. | Full points if the answer identifies the non-bridged (Fe-Co)N6 structure and explains that Fe and Co atoms tend to thermodynamically form this coordination structure with direct metal-metal bonds. |
| q2 | spectral | 30 | Describe the expected spectral shape and distinguishing features of the Fe K-edge XANES spectrum for this sample, particularly in comparison to a single-metal FePc reference. | The Fe K-edge XANES spectrum is expected to show an absorption edge indicating an oxidation state close to that of FePc (~2+), but with a distinctly different white line peak position and shape. A key distinguishing feature is the complete absence of the pre-edge peak at 7116 eV, which is typically present in the single-metal FePc reference. These spectral differences arise directly from the sample's composition as a diatomic Fe-Co catalyst on N-doped carbon. Because the Fe atoms thermodynamically form a non-bridged (Fe-Co)N6 structure with direct Fe-Co bonding rather than isolated single-metal sites, this complex dual-metal local configuration alters the electronic structure and eliminates the 7116 eV pre-edge feature. | Full points if the answer notes that the white line peak position and shape differ from FePc, indicating a more complex dual-metal local configuration. |
| q3 | spectral | 30 | What is the expected oxidation state of Fe in this sample, and what specific pre-edge feature distinguishes it from the FePc reference? | The expected oxidation state of Fe in this sample is approximately 2+, which is similar to the oxidation state of the FePc reference. However, the spectrum is distinguished from FePc by the complete absence of the pre-edge peak at 7116 eV. This specific spectral outcome occurs because the sample is a diatomic Fe-Co catalyst on a ZIF-8 derived N-doped carbon support, rather than an isolated single-metal system. In this specific environment, Fe and Co thermodynamically form a non-bridged (Fe-Co)N6 dual-metal site with direct metal-metal coordination, and this more complex local configuration alters the electronic transitions that would otherwise produce the 7116 eV pre-edge peak. | Full points if the answer states the oxidation state is ~2+ (close to FePc) but notes the absence of the pre-edge peak at 7116 eV that is typically found in FePc. |
Review
Active Sites of Cobalt Phthalocyanine in Electrocatalytic CO2 Reduction to Methanol
APS
Catalyst
Conor L. Rooney et al.
DOI: 10.1002/anie.202310623
3 scenarios
▶
#106
CoPc-NH2
Co K-edge
▶
LLM Prompt
Sample Information
Material: CoPc-NH2
Support: Carbon nanotubes (CNT)
Reaction Conditions: CO2-saturated 0.1 M aqueous KHCO3
Sample-Specific Conditions
- Applied potential: OCV
- Cobalt tetraamino-phthalocyanine on carbon nanotubes under CO2 reduction conditions at open circuit voltage
Measurement
We plan to measure the Co K-edge XANES spectrum of this sample.
Questions
Based on all the information above:
1. What is the expected oxidation state and dominant phase of the CoPc-NH2/CNT catalyst at open circuit voltage (OCV)?
2. Describe the expected pre-edge features in the Co K-edge XANES spectrum for this sample at OCV and their corresponding electronic transitions.
3. Based on the spectral features at OCV, what can be inferred about the coordination geometry of the Co center, and which specific feature supports this?
4. What specific spectral feature distinguishes this OCV resting state from potential active states that might have axially bound molecules (such as CO)?
Ground Truth
Material: CoPc-NH2/CNT
Measurement: in situ Co K-edge XANES
Fit method: not reported
Phase fractions:
| Phase | Fraction |
|---|---|
| Co(II)Pc | 1.0 |
Source evidence: Figure 4a, 4c, 4d, Figure 5d, Page 9-10
Key reasoning: At open circuit voltage (OCV), the catalyst is in its resting state prior to any electrochemical reduction. The XANES spectrum exhibits an edge position consistent with Co(II). The presence of the 7715 eV pre-edge feature indicates a square planar coordination environment without strong axial ligands, which would otherwise suppress this feature.
Reasoning source: Page 9-10
Scoring Rubric (total: 100 pts)
| Q | Type | Max | Question | Reference Answer | Scoring Criteria |
|---|---|---|---|---|---|
| q1 | identification | 20 | What is the expected oxidation state and dominant phase of the CoPc-NH2/CNT catalyst at open circuit voltage (OCV)? | The expected oxidation state of the CoPc-NH2/CNT catalyst is Co(II), and the dominant phase is 100% Co(II)Pc. Because the sample is held at open circuit voltage (OCV) in the CO2-saturated 0.1 M KHCO3 electrolyte, the catalyst remains in its resting state prior to any electrochemical reduction. Under these non-reducing conditions, the cobalt center retains its initial +2 oxidation state, which is structurally supported by a main absorption edge position at approximately 7720 eV. | Full points for identifying the oxidation state as Co(II) and the dominant phase as Co(II)Pc (or Co(II)Pc-NH2). |
| q2 | spectral | 30 | Describe the expected pre-edge features in the Co K-edge XANES spectrum for this sample at OCV and their corresponding electronic transitions. | The Co K-edge XANES spectrum is expected to exhibit two distinct pre-edge peaks located at 7710 eV and 7715 eV. The low-intensity peak at 7710 eV originates from the Co 1s → 3d electronic transition, while the moderate-intensity peak at 7715 eV corresponds to the 1s → 4pz transition. These specific spectral features arise because the catalyst is held at open circuit voltage (OCV) in the CO2-saturated electrolyte, keeping it in a resting state. In this unreduced state, the cobalt center maintains a square planar coordination environment without strong axial ligands, allowing the 1s → 4pz transition to remain prominent. | Full points for identifying two distinct pre-edge features: one at 7710 eV corresponding to the Co 1s -> 3d transition, and another at 7715 eV corresponding to the 1s -> 4pz transition. |
| q3 | reasoning | 25 | Based on the spectral features at OCV, what can be inferred about the coordination geometry of the Co center, and which specific feature supports this? | Based on the spectral features, it can be inferred that the Co center possesses a square planar coordination geometry without strong axial ligands. This geometry is specifically supported by the presence of the moderate-intensity pre-edge feature at 7715 eV, corresponding to the 1s → 4pz transition. Because the measurement is taken at open circuit voltage (OCV) prior to any electrochemical reduction, the catalyst remains in its resting state. Under these specific conditions, the lack of axial coordination preserves the square planar geometry, preventing the suppression of the 7715 eV pre-edge feature. | Full points for stating a square planar geometry (or lack of strong axial coordination) and linking it to the presence of the 7715 eV (1s -> 4pz) pre-edge feature. |
| q4 | spectral | 25 | What specific spectral feature distinguishes this OCV resting state from potential active states that might have axially bound molecules (such as CO)? | The distinguishing spectral feature of this OCV resting state is the distinct, moderate-intensity pre-edge peak at 7715 eV. At open circuit voltage, the CoPc-NH2/CNT catalyst is in a resting state prior to electrochemical reduction, meaning it lacks strong axial coordination from molecules like CO. Because the cobalt center remains in a square planar geometry under these non-reducing conditions, the 1s → 4pz transition at 7715 eV is clearly visible. If the catalyst were under applied potential and bound to strong axial ligands, this specific 7715 eV feature would be suppressed. | Full points for identifying the 7715 eV pre-edge feature, explaining that it is characteristic of square planar complexes and is sensitive to (and would be suppressed by) axial coordination. |
Review
#107
CoPc-NH2
Co K-edge
▶
LLM Prompt
Sample Information
Material: CoPc-NH2
Support: Carbon nanotubes (CNT)
Reaction Conditions: CO2-saturated 0.1 M aqueous KHCO3
Sample-Specific Conditions
- Applied potential: -0.3 V vs RHE
- Cobalt tetraamino-phthalocyanine on carbon nanotubes under CO2 reduction conditions at -0.3 V vs RHE
Measurement
We plan to measure the Co K-edge XANES spectrum of this sample.
Questions
Based on all the information above:
1. Based on the applied potential of -0.3 V vs RHE, what is the expected oxidation state of the cobalt center in the CoPc-NH2/CNT catalyst, and what is the physical reasoning for this state?
2. Describe the expected changes in the 1s -> 3d pre-edge feature (at ~7710 eV) for this sample at -0.3 V compared to its resting state at open circuit voltage (OCV). What electronic transition or orbital occupancy change explains this observation?
3. What is the expected behavior of the 1s -> 4pz pre-edge feature (at ~7715 eV) at -0.3 V, and what does this imply about the geometric structure or axial coordination of the cobalt site compared to more negative, catalytically active potentials?
Ground Truth
Material: CoPc-NH2/CNT
Measurement: in situ Co K-edge XANES
Fit method: not reported
Phase fractions:
| Phase | Fraction |
|---|---|
| Co(I)Pc | 1.0 |
Source evidence: Figure 4, page 9-10
Key reasoning: At -0.3 V, the applied potential is past the first reduction of CoPc-NH2 (Co(II) to Co(I)) but before the onset of catalytic current. The XANES edge shifts to lower energy, confirming a metal-based reduction. The 1s -> 3d pre-edge feature at 7710 eV is almost completely quenched due to an electron being added to the 3dz2 orbital, while the 1s -> 4pz feature at 7715 eV remains, indicating the square planar geometry is maintained without axial coordination.
Reasoning source: Page 9-10, discussion of Figure 4
Scoring Rubric (total: 100 pts)
| Q | Type | Max | Question | Reference Answer | Scoring Criteria |
|---|---|---|---|---|---|
| q1 | reasoning | 30 | Based on the applied potential of -0.3 V vs RHE, what is the expected oxidation state of the cobalt center in the CoPc-NH2/CNT catalyst, and what is the physical reasoning for this state? | The expected oxidation state of the cobalt center is Co(I), which accounts for a 1.0 fraction of the sample. This state arises because the applied potential of -0.3 V vs RHE in the CO2-saturated 0.1 M KHCO3 electrolyte is past the first reduction potential of CoPc-NH2 (from Co(II) to Co(I)) but before the onset of catalytic current. The transition to Co(I) is confirmed by the XANES edge shifting to a lower energy compared to the open circuit voltage (OCV), indicating a metal-based reduction. Consequently, an electron is added to the Co 3dz2 orbital, reducing the metal center while maintaining the overall square planar geometry. | Full points for identifying Co(I) and explaining that -0.3 V is past the first metal-based reduction potential (Co(II) to Co(I)) but before the onset of catalytic CO2 reduction. |
| q2 | spectral | 35 | Describe the expected changes in the 1s -> 3d pre-edge feature (at ~7710 eV) for this sample at -0.3 V compared to its resting state at open circuit voltage (OCV). What electronic transition or orbital occupancy change explains this observation? | At an applied potential of -0.3 V vs RHE, the 1s -> 3d pre-edge feature at 7710 eV is expected to be almost completely quenched compared to the OCV state. This quenching occurs because the -0.3 V potential drives the first metal-based reduction of the CoPc-NH2 catalyst from Co(II) to Co(I). During this reduction, an electron is added directly into the Co 3dz2 orbital, which increases the density of states in the Co 3d orbitals. The filling of this orbital prevents the 1s -> 3d electronic transition that normally produces the 7710 eV pre-edge peak in the resting state. | Full points for stating the peak is almost completely quenched and explaining this is due to an increased density of states in the Co 3d orbitals, specifically an electron being added to the 3dz2 orbital. |
| q3 | spectral | 35 | What is the expected behavior of the 1s -> 4pz pre-edge feature (at ~7715 eV) at -0.3 V, and what does this imply about the geometric structure or axial coordination of the cobalt site compared to more negative, catalytically active potentials? | At -0.3 V vs RHE, the 1s -> 4pz pre-edge feature at 7715 eV exhibits no significant change in area but becomes visibly broadened. The persistence of this feature indicates that the Co(I)Pc-NH2 catalyst maintains its square planar geometry without any axial coordination under these specific conditions. This occurs because -0.3 V is before the onset of catalytic current, meaning no intermediates have bound to the metal center yet. In contrast, at more negative, catalytically active potentials (e.g., -0.9 V to -1.1 V), this 7715 eV peak disappears due to the axial coordination of CO to the cobalt site. | Full points for noting the peak area has no significant change (though it broadens) and explaining that this indicates the square planar geometry is maintained without axial coordination, distinguishing it from more negative potentials where the peak disappears due to axial binding of CO. |
Review
#108
CoPc-NH2
Co K-edge
▶
LLM Prompt
Sample Information
Material: CoPc-NH2
Support: Carbon nanotubes (CNT)
Reaction Conditions: CO2-saturated 0.1 M aqueous KHCO3
Sample-Specific Conditions
- Applied potential: -0.7 V vs RHE
- Cobalt tetraamino-phthalocyanine on carbon nanotubes under CO2 reduction conditions at -0.7 V vs RHE
Measurement
We plan to measure the Co K-edge XANES spectrum of this sample.
Questions
Based on all the information above:
1. Based on the provided reaction conditions (-0.7 V vs RHE in CO2-saturated electrolyte), what is the expected resting state and oxidation state of the Co center in the CoPc-NH2/CNT catalyst, and what physical reasoning supports this assignment?
2. Describe the expected behavior of the pre-edge features at 7710 eV and 7715 eV for this sample at -0.7 V compared to the open circuit voltage (OCV) and -0.3 V states.
3. What specific electronic transitions are responsible for the 7710 eV and 7715 eV pre-edge features, and what structural changes cause their intensities to change at -0.7 V?
Ground Truth
Material: CoPc-NH2/CNT
Measurement: in situ Co K-edge XANES
Fit method: not reported
Phase fractions:
| Phase | Fraction |
|---|---|
| Co(I)Pc-CO | 1.0 |
Source evidence: Figure 4, Figure 5d, Page 10, Page 12
Key reasoning: At -0.7 V, the XANES edge position remains shifted to lower energy relative to OCV, indicating the Co(I) oxidation state persists after the initial reduction at -0.3 V. The pre-edge feature at 7710 eV (1s -> 3d) increases in area, which correlates to a distortion to a non-centrosymmetric coordination environment caused by axial binding of the CO intermediate. Concurrently, the 7715 eV feature (1s -> 4pz) decreases, reflecting this axial coordination change. EXAFS fitting confirms the appearance of a Co-C bond at -0.7 V, supporting a five-coordinate Co(I)Pc-CO resting state.
Reasoning source: Pages 10 and 12
Scoring Rubric (total: 100 pts)
| Q | Type | Max | Question | Reference Answer | Scoring Criteria |
|---|---|---|---|---|---|
| q1 | reasoning | 35 | Based on the provided reaction conditions (-0.7 V vs RHE in CO2-saturated electrolyte), what is the expected resting state and oxidation state of the Co center in the CoPc-NH2/CNT catalyst, and what physical reasoning supports this assignment? | Under the applied potential of -0.7 V vs RHE in CO2-saturated 0.1 M KHCO3, the expected resting state of the catalyst is a five-coordinate Co(I)Pc-CO complex with a Co(I) oxidation state (fraction 1.0). This assignment is supported by the XANES edge position, which remains shifted to a lower energy relative to the open circuit voltage (OCV), indicating that the Co(I) oxidation state persists after an initial reduction at -0.3 V. Furthermore, the presence of the CO2-saturated electrolyte allows for the axial binding of a CO intermediate at this more negative potential. This axial coordination distorts the complex into a non-centrosymmetric environment, which is confirmed by EXAFS fitting showing a Co-C bond and specific changes in the pre-edge XANES features. | Full credit requires identifying the resting state as Co(I)Pc-CO (or a five-coordinate Co(I) species with axially bound CO) and explaining that the edge position indicates a Co(I) state while changes in pre-edge features (or EXAFS Co-C bond appearance) indicate axial CO binding. |
| q2 | spectral | 35 | Describe the expected behavior of the pre-edge features at 7710 eV and 7715 eV for this sample at -0.7 V compared to the open circuit voltage (OCV) and -0.3 V states. | At -0.7 V vs RHE, the pre-edge feature at 7710 eV exhibits an increased area compared to the -0.3 V state, while the feature at 7715 eV decreases and virtually disappears compared to the OCV state. These spectral changes occur because the applied potential of -0.7 V in the presence of CO2 leads to the axial binding of a CO intermediate to the Co(I) center. This axial coordination distorts the complex into a non-centrosymmetric five-coordinate Co(I)Pc-CO resting state. Consequently, this structural distortion increases 3d + 4p orbital mixing, enhancing the 7710 eV peak, while the change in axial coordination suppresses the 7715 eV peak. | Full credit requires stating that the 7710 eV peak area increases relative to -0.3 V, and the 7715 eV peak decreases/virtually disappears compared to OCV. |
| q3 | reasoning | 30 | What specific electronic transitions are responsible for the 7710 eV and 7715 eV pre-edge features, and what structural changes cause their intensities to change at -0.7 V? | The 7710 eV pre-edge feature corresponds to the 1s -> 3d electronic transition, while the 7715 eV feature corresponds to the 1s -> 4pz transition. At the applied potential of -0.7 V vs RHE in CO2-saturated electrolyte, a CO intermediate binds axially to the Co(I) center, forming a five-coordinate Co(I)Pc-CO resting state. This axial binding causes a structural distortion from a centrosymmetric to a non-centrosymmetric coordination environment. This distortion increases the 3d + 4p orbital mixing, which directly causes the intensity of the 1s -> 3d transition at 7710 eV to increase, while the sensitivity of the 1s -> 4pz transition to this new axial coordination causes the 7715 eV feature to decrease and virtually disappear. | Full credit requires assigning the 7710 eV feature to the 1s -> 3d transition and the 7715 eV feature to the 1s -> 4pz transition. Must explain that the 7710 eV intensity increases due to distortion to a non-centrosymmetric environment (or 3d+4p mixing) from axial CO binding, and the 7715 eV feature decreases due to this same axial coordination. |
Review
Mechanocatalytic Synthesis of Ammonia: State of the Catalyst During Reaction and Deactivation Pathway
ESRF-BM23
Catalyst
Steffen Reichle et al.
DOI: 10.1002/anie.202317038
2 scenarios
▶
#109
Cs-Fe
Cs L1
▶
LLM Prompt
Sample Information
Material: Cs-Fe
Reaction Conditions: H2:N2 (3:1) at 20 bar, 20 °C, 25 Hz milling
Sample-Specific Conditions
- Milling time: 5 min
- Cs-promoted Fe catalyst milled for 5 minutes under reaction conditions
Measurement
We plan to measure the Cs L1 XANES spectrum of this sample.
Questions
Based on all the information above:
1. Based on the reaction conditions (H2:N2 at 20 bar, 20 °C) and a short milling time of 5 minutes, what are the expected Cs-containing phases in this catalyst, and what are their approximate fractions?
2. What physical and chemical processes explain the formation of these specific Cs phases after only 5 minutes of milling?
3. If you were to perform Linear Combination Fitting (LCF) on the Cs L1-edge XANES spectrum of this sample, which reference spectra would be most appropriate to include in your basis set to capture the possible chemical states of the promoter?
Ground Truth
Material: Cs-promoted Fe catalyst (2.2 mol% Cs)
Measurement: Cs L1-edge XANES, ex situ
Fit method: Linear combination fitting (LCF)
Phase fractions: (±10%)
| Phase | Fraction |
|---|---|
| CsH | 0.9 |
| CsOH | 0.1 |
Fit basis (paper's reference spectra):
- CsH
- CsOH
- CsNH2
- Cs
Source evidence: Figure 2C, page 4
Key reasoning: During the initial phase of mechanocatalytic ammonia synthesis, elemental Cs converts almost immediately to CsH due to its high reactivity under the H2/N2 atmosphere. This is accompanied by partial conversion to CsOH, which results from side-reactions with trace oxygen impurities present as a passivation layer on the Fe starting material and the milling equipment. Consequently, after 5 minutes of milling, the catalyst is dominated by CsH with a minor fraction of CsOH.
Reasoning source: Page 3 (Results and Discussion) and Page 8 (Conclusion)
Scoring Rubric (total: 100 pts)
| Q | Type | Max | Question | Reference Answer | Scoring Criteria |
|---|---|---|---|---|---|
| q1 | quantification | 40 | Based on the reaction conditions (H2:N2 at 20 bar, 20 °C) and a short milling time of 5 minutes, what are the expected Cs-containing phases in this catalyst, and what are their approximate fractions? | After 5 minutes of milling under H2:N2 (3:1) at 20 bar and 20 °C, the expected Cs-containing phases are CsH and CsOH, with approximate fractions of 90% (0.9) and 10% (0.1), respectively, with a 10% uncertainty. These specific fractions arise because the highly reactive elemental Cs converts almost immediately to CsH under the pressurized H2/N2 atmosphere during the initial phase of mechanocatalytic ammonia synthesis. The minor 10% fraction of CsOH forms due to unavoidable side-reactions with trace oxygen impurities originating from a passivation layer on the Fe starting material and the milling equipment. Consequently, the short 5-minute milling time is sufficient to completely consume the initial elemental Cs, resulting in a catalyst dominated by CsH alongside a small amount of CsOH. | Full points for identifying CsH as the dominant phase (~90%) and CsOH as a minor phase (~10%). Partial points for identifying the correct phases without accurate fractions, or for missing the minor CsOH phase. |
| q2 | reasoning | 40 | What physical and chemical processes explain the formation of these specific Cs phases after only 5 minutes of milling? | The formation of these specific Cs phases after just 5 minutes of milling at 25 Hz is driven by the extreme reactivity of elemental Cs under the mechanocatalytic ammonia synthesis conditions (20 bar H2:N2 at 20 °C). The primary chemical process is the almost immediate conversion of elemental Cs to CsH due to its rapid reaction with the pressurized H2 gas during the initial milling phase. Simultaneously, a secondary chemical process occurs where trace oxygen impurities—present as a passivation layer on the Fe starting material and the milling equipment—react with the Cs to form CsOH. These combined processes explain why the initial elemental Cs is entirely transformed into a dominant CsH phase and a minor CsOH phase within such a short timeframe. | Full points for explaining that elemental Cs rapidly converts to CsH under the H2/N2 atmosphere, and that the minor CsOH phase forms due to reactions with trace oxygen impurities from the passivation layer on the Fe metal or milling equipment. |
| q3 | identification | 20 | If you were to perform Linear Combination Fitting (LCF) on the Cs L1-edge XANES spectrum of this sample, which reference spectra would be most appropriate to include in your basis set to capture the possible chemical states of the promoter? | For Linear Combination Fitting (LCF) of the Cs L1-edge XANES spectrum, the most appropriate reference spectra to include in the basis set are CsH, CsOH, CsNH2, and elemental Cs. These specific references are required because they represent all the expected and potential chemical states of the Cs promoter under the mechanocatalytic ammonia synthesis conditions (H2:N2 at 20 bar, 20 °C). Elemental Cs is included as the starting material, which rapidly converts to CsH due to its high reactivity with the pressurized H2 gas during the 5 minutes of milling. CsOH must be included to account for side-reactions with trace oxygen impurities from the Fe passivation layer and milling equipment, while CsNH2 accounts for potential nitrogen-containing species formed under the N2 atmosphere. | Full points for listing the relevant reference spectra used for this system (CsH, CsOH, CsNH2, and metallic Cs). |
Review
#110
Cs-Fe
Cs L1
▶
LLM Prompt
Sample Information
Material: Cs-Fe
Reaction Conditions: H2:N2 (3:1) at 20 bar, 20 °C, 25 Hz milling
Sample-Specific Conditions
- Milling time: 72 h
- Cs-promoted Fe catalyst milled for 72 hours under reaction conditions
Measurement
We plan to measure the Cs L1 XANES spectrum of this sample.
Questions
Based on all the information above:
1. Based on the reaction conditions (72 h milling of Cs-promoted Fe catalyst under H2:N2), what are the expected Cs-containing phases and their approximate fractions?
2. What reference spectra should be included as basis functions in a linear combination fitting (LCF) analysis of the Cs L1-edge XANES spectrum for this sample?
3. Explain the physical and chemical reasons for the phase composition of the Cs promoter after 72 hours of milling. Why is this specific mixture of phases observed?
Ground Truth
Material: Cs-promoted Fe catalyst (2.2 mol% Cs)
Measurement: Cs L1-edge XANES, ex situ
Fit method: Linear combination fitting (LCF)
Phase fractions: (±15%)
| Phase | Fraction |
|---|---|
| CsOH | 0.65 |
| CsNH2 | 0.25 |
| CsH | 0.1 |
Fit basis (paper's reference spectra):
- CsH
- CsOH
- CsNH2
Source evidence: Figure 2D and page 4 text
Key reasoning: After 72 hours of milling, the active Cs promoter species (CsH and CsNH2) undergo significant degradation into inactive CsOH. This degradation is caused by side-reactions with trace oxygen impurities present as a passivation layer on the Fe starting material and the milling equipment. The whiteline position shifts to higher energies (around 5721.7 eV), between CsNH2 and CsOH, indicating a mixed phase composition dominated by CsOH with remaining CsNH2 and CsH.
Reasoning source: Page 4, Results and Discussion
Scoring Rubric (total: 100 pts)
| Q | Type | Max | Question | Reference Answer | Scoring Criteria |
|---|---|---|---|---|---|
| q1 | quantification | 40 | Based on the reaction conditions (72 h milling of Cs-promoted Fe catalyst under H2:N2), what are the expected Cs-containing phases and their approximate fractions? | The expected Cs-containing phases for the Cs-promoted Fe catalyst after 72 hours of milling are CsOH (65%), CsNH2 (25%), and CsH (10%), with an uncertainty of 15%. These specific fractions arise because the prolonged 72-hour milling under H2:N2 (3:1) at 20 bar and 20 °C causes the active promoter species (CsH and CsNH2) to undergo significant degradation. This degradation into the dominant, inactive CsOH phase (65%) is driven by side-reactions with trace oxygen impurities originating from the passivation layer on the Fe starting material and the milling equipment. Consequently, only a minority of the active CsNH2 (25%) and CsH (10%) phases survive the extended milling process. | 10 points for identifying CsOH as the major phase; 10 points for identifying CsNH2 and CsH as minor phases; 20 points for estimating fractions within ±15% of the ground truth (CsOH ~65%, CsNH2 ~25%, CsH ~10%). |
| q2 | identification | 30 | What reference spectra should be included as basis functions in a linear combination fitting (LCF) analysis of the Cs L1-edge XANES spectrum for this sample? | The linear combination fitting (LCF) analysis of the Cs L1-edge XANES spectrum should use CsH, CsOH, and CsNH2 as reference basis functions. These specific reference spectra are required because the 72-hour milling of the Cs-Fe catalyst under 20 bar of H2:N2 at 20 °C produces a mixed-phase composition. Specifically, the active CsH and CsNH2 phases formed during the reaction degrade over the 72-hour period into inactive CsOH due to side-reactions with trace oxygen impurities from the Fe passivation layer and milling equipment. Spectroscopically, this degradation is evidenced by the whiteline position shifting to higher energies (around 5721.7 eV) between CsNH2 and CsOH, necessitating all three references to accurately fit the resulting mixture. | 10 points for each correct reference spectrum identified (CsH, CsOH, CsNH2). |
| q3 | reasoning | 30 | Explain the physical and chemical reasons for the phase composition of the Cs promoter after 72 hours of milling. Why is this specific mixture of phases observed? | After 72 hours of milling under 20 bar of H2:N2 (3:1) at 20 °C, the Cs promoter exists as a specific mixture dominated by inactive CsOH (65%), with remaining active CsNH2 (25%) and CsH (10%). This composition is observed because the prolonged milling time allows the active CsH and CsNH2 species to undergo significant degradation. The degradation mechanism is driven by side-reactions with trace oxygen impurities that are present as a passivation layer on the Fe starting material and the milling equipment. As a result of this chemical transformation, the XANES whiteline shifts to higher energies (around 5721.7 eV), reflecting a final state that is predominantly CsOH but still retains residual amounts of the active CsNH2 and CsH phases. | 15 points for explaining the degradation of active promoter species (CsH/CsNH2) into inactive CsOH over prolonged milling; 15 points for attributing this degradation to side-reactions with trace oxygen impurities from the Fe passivation layer or milling equipment. |
Review
Cu Evolution over Bimetallic Cu‐Y/Beta Zeolite Under H 2 and Ethanol Atmospheres: Unveiling the Role of Diatomic Metal–Metal Interactions
BNL-NSLS-II-8-ID
Catalyst
Junyan Zhang et al.
DOI: 10.1002/anie.202514920
5 scenarios
▶
#111
0.41 wt% Cu, 6 wt% Y on Beta zeolite
Cu Cu K-edge
▶
LLM Prompt
Sample Information
Material: 0.41 wt% Cu, 6 wt% Y on Beta zeolite
Support: Beta zeolite
Sample-Specific Conditions
- Cu loading: 0.41 wt%
- Bimetallic Cu-Y/Beta zeolite catalyst with low Cu loading
Measurement
We plan to measure the Cu Cu K-edge XANES spectrum of this sample.
Questions
Based on all the information above:
1. What copper phase dominates the as-synthesized 0.4Cu-6Y/Beta catalyst, and what physical/chemical reasoning explains this state prior to any reduction treatments?
2. Describe the expected Cu K-edge XANES spectral features for this as-synthesized catalyst, specifically comparing its white line and charge transfer features to a bulk CuO reference.
3. If performing Linear Combination Fitting (LCF) to track the evolution of this catalyst during subsequent reduction experiments, what set of reference spectra (basis functions) would be necessary to capture the full range of possible copper oxidation states?
Ground Truth
Material: 0.41 wt% Cu, 6 wt% Y on Beta zeolite (0.4Cu-6Y/Beta)
Measurement: Cu K-edge XANES
Fit method: Linear combination fitting (LCF)
Phase fractions: (±10%)
| Phase | Fraction |
|---|---|
| Cu(II) | 1.0 |
Fit basis (paper's reference spectra):
- CuO
- Cu2O
- Cu foil
Source evidence: Figure 1a, Figure 4e, Page 2
Key reasoning: In the as-synthesized state, the copper species exist entirely as isolated Cu(II) sites. The XANES spectra exhibit a weak pre-edge feature at 8979 eV and an edge energy consistent with Cu2+. The distinct white line intensity and shifted ligand-to-metal charge transfer feature indicate a unique tetrahedral coordination environment compared to bulk CuO.
Reasoning source: Results and Discussion, Page 2
Scoring Rubric (total: 100 pts)
| Q | Type | Max | Question | Reference Answer | Scoring Criteria |
|---|---|---|---|---|---|
| q1 | identification | 33 | What copper phase dominates the as-synthesized 0.4Cu-6Y/Beta catalyst, and what physical/chemical reasoning explains this state prior to any reduction treatments? | In the as-synthesized 0.4Cu-6Y/Beta catalyst, the copper phase is entirely dominated by Cu(II), representing a fraction of 1.0. This state arises directly from the sample conditions, specifically the very low Cu loading (0.41 wt%) on the Beta zeolite support. Because of this low concentration, the copper species do not agglomerate into bulk oxides but instead disperse to exist entirely as isolated Cu(II) sites within the zeolite framework. Consequently, this specific composition forces the copper into a unique tetrahedral coordination environment prior to any reduction treatments. | The response must identify Cu(II) as the 100% dominant phase and explain that it exists as isolated Cu(II) sites in a unique tetrahedral coordination environment on the zeolite support. |
| q2 | spectral | 40 | Describe the expected Cu K-edge XANES spectral features for this as-synthesized catalyst, specifically comparing its white line and charge transfer features to a bulk CuO reference. | The expected Cu K-edge XANES spectrum for this as-synthesized catalyst features an edge energy consistent with Cu2+ and a weak pre-edge peak at 8979 eV. When compared to a bulk CuO reference, the catalyst exhibits a more intense white line and a ligand-to-metal charge transfer feature that is shifted to a higher energy. These distinct spectral features are produced because the low 0.41 wt% Cu loading on the Beta zeolite support forces the copper into isolated Cu(II) sites. This creates a unique tetrahedral coordination environment that significantly alters the ligand environment around the copper compared to a standard bulk oxide. | Must mention the weak pre-edge feature at 8979 eV, a more intense white line than bulk CuO, and a ligand-to-metal charge transfer feature that is shifted to higher energy. |
| q3 | methodology | 27 | If performing Linear Combination Fitting (LCF) to track the evolution of this catalyst during subsequent reduction experiments, what set of reference spectra (basis functions) would be necessary to capture the full range of possible copper oxidation states? | To perform Linear Combination Fitting (LCF) on this catalyst, the necessary reference spectra would be CuO, Cu2O, and Cu foil. These basis functions are required to capture the full range of copper oxidation states from Cu(II) down to fully reduced Cu(0). The necessity of these specific references is dictated by the sample's composition and initial state; the low 0.41 wt% Cu loading on the Beta zeolite initially stabilizes the copper entirely as isolated Cu(II) sites (modeled by CuO). As the bimetallic Cu-Y/Beta zeolite catalyst undergoes reduction, the copper will transition from this initial Cu(II) state through intermediate Cu(I) states (Cu2O) to metallic copper (Cu foil), requiring all three standards to accurately track its evolution. | Must identify the need for Cu(II), Cu(I), and Cu(0) reference spectra to accurately model the reduction process. |
Review
#112
0.41 wt% Cu, 6 wt% Y on Beta zeolite
Cu Cu K-edge
▶
LLM Prompt
Sample Information
Material: 0.41 wt% Cu, 6 wt% Y on Beta zeolite
Support: Beta zeolite
Sample-Specific Conditions
- Cu loading: 0.41 wt%
- Bimetallic Cu-Y/Beta zeolite catalyst with low Cu loading after H2 reduction
Measurement
We plan to measure the Cu Cu K-edge XANES spectrum of this sample.
Questions
Based on all the information above:
1. Based on the sample conditions (0.41 wt% Cu, 6 wt% Y on Beta zeolite, reduced in H2 at 350 °C), what copper phase dominates the catalyst, and what physical interactions prevent its complete reduction to the metallic state?
2. What candidate reference spectra should be included in a Linear Combination Fitting (LCF) model to quantify the Cu speciation in this bimetallic Cu-Y/Beta catalyst series during reduction?
Ground Truth
Material: 0.41 wt% Cu, 6 wt% Y on Beta zeolite (0.4Cu-6Y/Beta)
Measurement: in-situ Cu K-edge XANES
Fit method: Linear combination fitting (LCF)
Phase fractions: (±10%)
| Phase | Fraction |
|---|---|
| Cu(I) | 1.0 |
Fit basis (paper's reference spectra):
- CuO
- Cu2O
- Cu foil
Source evidence: Figure 4f and text on page 3
Key reasoning: In the bimetallic Cu-Y/Beta catalysts, diatomic interactions between isolated Cu and Y sites hinder the complete reduction of Cu to Cu(0). At low Cu loadings (≤0.4 wt%), copper preferentially forms difficult-to-reduce sites that remain as Cu(I) after H2 reduction at 350 °C. The presence of neighboring Y sites modifies the Cu d-orbital states, raising the thermodynamic energy barrier for complete reduction to metallic Cu. Further increases in Cu loading above 0.4 wt% form more easily reduced species that convert to Cu(0).
Reasoning source: Results and Discussion, pages 3, 4, and 9
Scoring Rubric (total: 100 pts)
| Q | Type | Max | Question | Reference Answer | Scoring Criteria |
|---|---|---|---|---|---|
| q1 | reasoning | 57 | Based on the sample conditions (0.41 wt% Cu, 6 wt% Y on Beta zeolite, reduced in H2 at 350 °C), what copper phase dominates the catalyst, and what physical interactions prevent its complete reduction to the metallic state? | After H2 reduction at 350 °C, the 0.41 wt% Cu, 6 wt% Y on Beta zeolite catalyst is completely dominated by the Cu(I) phase, with a fraction of 1.0. This specific speciation arises because, at low Cu loadings (≤0.4 wt%), copper preferentially forms difficult-to-reduce sites. In this bimetallic system, diatomic interactions between isolated Cu and Y sites hinder the complete reduction of Cu to Cu(0). Specifically, the presence of neighboring Y sites modifies the Cu d-orbital states, which raises the thermodynamic energy barrier and prevents complete reduction to metallic Cu. | Must identify Cu(I) as the dominant (or sole) phase (20 pts). Must explain that diatomic interactions between isolated Cu and Y sites (or proximity to Y) modify Cu d-orbital states, increasing the thermodynamic barrier and preventing complete reduction to Cu(0) (20 pts). |
| q2 | identification | 43 | What candidate reference spectra should be included in a Linear Combination Fitting (LCF) model to quantify the Cu speciation in this bimetallic Cu-Y/Beta catalyst series during reduction? | The Linear Combination Fitting (LCF) model should include CuO, Cu2O, and Cu foil as candidate reference spectra. These references are required to capture the full range of copper oxidation states that can exist during H2 reduction. For this specific sample with a low Cu loading of 0.41 wt% and 6 wt% Y, diatomic interactions between isolated Cu and Y sites modify the Cu d-orbital states, raising the thermodynamic energy barrier and arresting reduction entirely at Cu(I) (represented by the Cu2O reference). The Cu foil and CuO references must also be included because further increases in Cu loading above 0.4 wt% form more easily reduced species that successfully convert to Cu(0). | Must list Cu(II), Cu(I), and Cu(0) reference spectra. |
Review
#113
1.0 wt% Cu, 6 wt% Y on Beta zeolite
Cu Cu K-edge
▶
LLM Prompt
Sample Information
Material: 1.0 wt% Cu, 6 wt% Y on Beta zeolite
Support: Beta zeolite
Sample-Specific Conditions
- Cu loading: 1.0 wt%
- Bimetallic Cu-Y/Beta zeolite catalyst with medium Cu loading after H2 reduction
Measurement
We plan to measure the Cu Cu K-edge XANES spectrum of this sample.
Questions
Based on all the information above:
1. Based on the sample conditions (1.0 wt% Cu, 6 wt% Y on Beta zeolite, reduced at 350 °C in H2), what copper phases are expected to be present, and what are their estimated relative fractions?
2. Explain the physical reasoning for why this specific bimetallic catalyst does not fully reduce to metallic copper under these conditions, unlike monometallic Cu/Beta zeolites.
3. What reference spectra would be required to perform a Linear Combination Fitting (LCF) analysis of the XANES spectrum for this reduced sample?
Ground Truth
Material: 1.0 wt% Cu, 6 wt% Y on Beta zeolite (1Cu-6Y/Beta)
Measurement: in-situ Cu K-edge XANES
Fit method: Linear combination fitting (LCF)
Phase fractions: (±10%)
| Phase | Fraction |
|---|---|
| Cu(I) | 0.53 |
| Cu(0) | 0.47 |
Fit basis (paper's reference spectra):
- CuO
- Cu2O
- Cu foil
Source evidence: Page 3 text; Figure 2d; Figure 4f
Key reasoning: The diatomic interaction between isolated Cu and Y sites hinders the complete reduction of Cu to Cu(0). A constant mass fraction (around 0.4-0.5 wt%) of Cu forms difficult-to-reduce Cu(I) sites due to proximity to Y sites, which modify the Cu d-orbital states and increase the thermodynamic energy barrier for complete reduction. The remaining Cu (the portion above this ~0.4-0.5 wt% threshold) reduces to metallic Cu(0) nanoparticles. For a 1.0 wt% Cu loading, this results in approximately a 53% Cu(I) and 47% Cu(0) phase distribution.
Reasoning source: Page 3 (Evolution of Isolated Cu(II) Sites Under Hydrogen Environment) and Pages 7-8 (Discussions on the Interactions Between Cu and Y Sites)
Scoring Rubric (total: 100 pts)
| Q | Type | Max | Question | Reference Answer | Scoring Criteria |
|---|---|---|---|---|---|
| q1 | quantification | 40 | Based on the sample conditions (1.0 wt% Cu, 6 wt% Y on Beta zeolite, reduced at 350 °C in H2), what copper phases are expected to be present, and what are their estimated relative fractions? | The expected copper phases for this H2-reduced sample are Cu(I) and Cu(0), with estimated relative fractions of 0.53 (53%) and 0.47 (47%), respectively. These specific fractions arise because the 1.0 wt% Cu loading exceeds the threshold of isolated Cu sites that strongly interact with the 6 wt% Y on the Beta zeolite support. Specifically, a constant mass fraction of approximately 0.4-0.5 wt% Cu forms difficult-to-reduce Cu(I) sites due to diatomic interactions with Y sites, which modify the Cu d-orbital states and increase the energy barrier for complete reduction. The remaining copper in the 1.0 wt% loading reduces to metallic Cu(0) nanoparticles, resulting in the observed ~53% Cu(I) and 47% Cu(0) distribution. | Full points for identifying Cu(I) and Cu(0) (metallic Cu) with fractions around 50-55% Cu(I) and 45-50% Cu(0). Partial points for identifying the correct phases without accurate fractions. |
| q2 | reasoning | 40 | Explain the physical reasoning for why this specific bimetallic catalyst does not fully reduce to metallic copper under these conditions, unlike monometallic Cu/Beta zeolites. | The incomplete reduction of this bimetallic 1.0 wt% Cu, 6 wt% Y on Beta zeolite catalyst is driven by the strong diatomic interaction between isolated Cu and Y sites. The proximity of Cu to the Y sites modifies the Cu d-orbital states, which significantly increases the thermodynamic energy barrier for complete reduction. Consequently, a constant mass fraction of approximately 0.4-0.5 wt% Cu is stabilized as difficult-to-reduce Cu(I) sites rather than fully reducing to Cu(0) under H2. Because the sample has a medium Cu loading of 1.0 wt%, only the copper exceeding this 0.4-0.5 wt% threshold is able to fully reduce into metallic Cu(0) nanoparticles, leaving a mixed 53% Cu(I) and 47% Cu(0) state. | Full points for explaining that diatomic interactions between Cu and Y sites (proximity to Y) modify the Cu d-orbital states, increasing the thermodynamic barrier for complete reduction and stabilizing a specific amount (approx 0.4-0.5 wt%) of Cu as Cu(I). |
| q3 | identification | 20 | What reference spectra would be required to perform a Linear Combination Fitting (LCF) analysis of the XANES spectrum for this reduced sample? | To perform a Linear Combination Fitting (LCF) analysis on this reduced sample, the required reference spectra are CuO, Cu2O, and Cu foil. These specific references are necessary to capture the relevant oxidation states dictated by the sample's composition and reduction behavior. Under the specific conditions of 1.0 wt% Cu and 6 wt% Y on Beta zeolite after H2 reduction, diatomic interactions between Cu and Y modify the Cu d-orbital states and hinder complete reduction. This stabilizes approximately 0.4-0.5 wt% of the copper as Cu(I) while the remainder forms Cu(0), meaning Cu2O and Cu foil references are essential to quantify the resulting 53% Cu(I) and 47% Cu(0) fractions, while CuO serves as a basis for any unreduced Cu(II). | Full points for listing a Cu(I) reference (such as Cu2O or a Cu(I) zeolite standard) and a Cu(0) reference (such as Cu foil). |
Review
#114
1.7 wt% Cu, 6 wt% Y on Beta zeolite
Cu Cu K-edge
▶
LLM Prompt
Sample Information
Material: 1.7 wt% Cu, 6 wt% Y on Beta zeolite
Support: Beta zeolite
Sample-Specific Conditions
- Cu loading: 1.7 wt%
- Bimetallic Cu-Y/Beta zeolite catalyst with high Cu loading after H2 reduction
Measurement
We plan to measure the Cu Cu K-edge XANES spectrum of this sample.
Questions
Based on all the information above:
1. Based on the sample conditions (1.7 wt% Cu, 6 wt% Y on Beta zeolite, reduced in H2 at 350 °C), what copper phases are expected to be present, and what are their approximate fractions?
2. What reference spectra would be appropriate to use as basis functions for Linear Combination Fitting (LCF) of the XANES spectrum for this reduced bimetallic catalyst?
3. Explain the physical reasoning for why a mixture of oxidation states is observed in this sample after H2 reduction at 350 °C, and how the presence of Yttrium and the specific Cu loading (1.7 wt%) influence this final state.
Ground Truth
Material: 1.7 wt% Cu, 6 wt% Y on Beta zeolite (2Cu-6Y/Beta)
Measurement: Cu K-edge in-situ XAS
Fit method: Linear combination fitting (LCF) of XANES and EXAFS modeling
Phase fractions: (±10%)
| Phase | Fraction |
|---|---|
| Cu(I) | 0.25 |
| Cu(0) | 0.75 |
Fit basis (paper's reference spectra):
- CuO
- Cu2O
- Cu foil
Source evidence: Figure 2d, Figure 4f, and text on page 3
Key reasoning: Diatomic interactions between Cu and Y sites in the zeolite framework hinder the complete reduction of Cu. A constant mass fraction of approximately 0.4 wt% Cu forms difficult-to-reduce sites that only reduce to Cu(I) under H2 at 350 °C. Because this sample has a higher total Cu loading of 1.7 wt%, the Cu in excess of the 0.4 wt% threshold is easily reduced to metallic Cu(0). This results in a mixture of roughly 25% Cu(I) (0.43 wt% out of 1.7 wt%) and 75% Cu(0).
Reasoning source: Results and Discussion - Evolution of Isolated Cu(II) Sites Under Hydrogen Environment (Pages 3-4)
Scoring Rubric (total: 100 pts)
| Q | Type | Max | Question | Reference Answer | Scoring Criteria |
|---|---|---|---|---|---|
| q1 | quantification | 40 | Based on the sample conditions (1.7 wt% Cu, 6 wt% Y on Beta zeolite, reduced in H2 at 350 °C), what copper phases are expected to be present, and what are their approximate fractions? | After H2 reduction at 350 °C, the 1.7 wt% Cu-Y/Beta zeolite sample is expected to contain approximately 25% Cu(I) and 75% Cu(0). This specific phase distribution occurs because diatomic interactions between the Cu and Y sites in the zeolite framework hinder the complete reduction of copper. Specifically, a constant mass fraction of about 0.4 wt% Cu forms difficult-to-reduce sites that only reduce to Cu(I) under these conditions. Because the total Cu loading is 1.7 wt%, the remaining copper in excess of this 0.4 wt% threshold is easily reduced to metallic Cu(0), resulting in the observed 25:75 ratio. | Award 20 points for correctly identifying that both Cu(I) and metallic Cu(0) phases are present. Award another 20 points for estimating the fractions at approximately 25% Cu(I) and 75% Cu(0). |
| q2 | identification | 20 | What reference spectra would be appropriate to use as basis functions for Linear Combination Fitting (LCF) of the XANES spectrum for this reduced bimetallic catalyst? | Appropriate reference spectra for Linear Combination Fitting (LCF) of this sample include CuO, Cu2O, and Cu foil. These references are necessary to account for the Cu(II), Cu(I), and Cu(0) oxidation states that could be present during the reduction process. The inclusion of Cu2O and Cu foil is specifically required because the sample reduces to a mixture of Cu(I) and Cu(0) under H2 at 350 °C. This incomplete reduction is due to diatomic interactions between Cu and Y sites in the zeolite framework, which stabilize about 0.4 wt% of the copper as difficult-to-reduce Cu(I) sites, while the excess copper (up to the 1.7 wt% loading) fully reduces to metallic Cu(0). | Award 20 points for mentioning appropriate Cu(0) (e.g., Cu foil) and Cu(I) (e.g., Cu2O) reference spectra. Partial credit if only one is mentioned. |
| q3 | reasoning | 40 | Explain the physical reasoning for why a mixture of oxidation states is observed in this sample after H2 reduction at 350 °C, and how the presence of Yttrium and the specific Cu loading (1.7 wt%) influence this final state. | The mixture of oxidation states arises because diatomic interactions between the Cu and Y sites within the Beta zeolite framework hinder the complete reduction of copper. Under H2 reduction at 350 °C, these interactions cause a constant mass fraction of approximately 0.4 wt% Cu to form difficult-to-reduce sites that only reduce to the Cu(I) state. The specific Cu loading of 1.7 wt% plays a critical role because it exceeds this 0.4 wt% threshold. Consequently, the copper present in excess of the stabilized sites is easily reduced to metallic Cu(0), yielding a final mixed state of roughly 25% Cu(I) and 75% Cu(0). | Award 15 points for explaining that diatomic Cu-Y interactions hinder complete reduction. Award 15 points for noting that a constant amount (approx. 0.4 wt%) of Cu is stabilized as difficult-to-reduce Cu(I) sites. Award 10 points for explaining that the excess Cu loading (above 0.4 wt%, up to 1.7 wt%) reduces easily to metallic Cu(0), leading to the observed 1:3 ratio of Cu(I) to Cu(0). |
Review
#115
0.61-2.1 wt% Cu on Beta zeolite
Cu Cu K-edge
▶
LLM Prompt
Sample Information
Material: 0.61-2.1 wt% Cu on Beta zeolite
Support: Beta zeolite
Sample-Specific Conditions
- Catalyst type: Monometallic
- Monometallic Cu-Beta zeolite catalyst after H2 reduction (representative of all loadings)
Measurement
We plan to measure the Cu Cu K-edge XANES spectrum of this sample.
Questions
Based on all the information above:
1. Based on the sample conditions, what is the expected dominant Cu phase and its oxidation state for the monometallic Cu-Beta catalyst after reduction in H2 at 350 °C?
2. What candidate reference spectra should be included in a Linear Combination Fitting (LCF) model to quantify the oxidation states of Cu in this reduced catalyst?
Ground Truth
Material: 0.61-2.1 wt% Cu on Beta zeolite (xCu-Beta)
Measurement: Cu K-edge in-situ XANES at beamline 10-BM (APS) or 8-ID (NSLS-II)
Fit method: XANES linear combination fitting (LCF)
Phase fractions: (±5%)
| Phase | Fraction |
|---|---|
| Cu(0) | 1.0 |
Fit basis (paper's reference spectra):
- CuO
- Cu2O
- Cu foil
Source evidence: Figure 2e, Figure 2h, Figure 4h, Page 3-4
Key reasoning: In the absence of yttrium, the monometallic xCu-Beta catalysts undergo a complete transition of Cu(II) species to metallic Cu(0) after reduction in 101 kPa H2 at 350 °C. Without the diatomic Cu-Y interactions that modify the Cu d-orbital states and raise the energy barrier for reduction, there is no thermodynamic resistance to prevent complete reduction. Consequently, the Cu species fully reduce and aggregate into metallic Cu nanoparticles, as evidenced by the dominant metallic phase without detectable oxidative phases in the XAS analysis.
Reasoning source: Results and Discussion - Evolution of Isolated Cu(II) Sites Under Hydrogen Environment (Page 3-4) and Discussions on the Interactions Between Cu and Y Sites (Page 8-9)
Scoring Rubric (total: 100 pts)
| Q | Type | Max | Question | Reference Answer | Scoring Criteria |
|---|---|---|---|---|---|
| q1 | identification | 50 | Based on the sample conditions, what is the expected dominant Cu phase and its oxidation state for the monometallic Cu-Beta catalyst after reduction in H2 at 350 °C? | The expected dominant Cu phase is metallic Cu nanoparticles with an oxidation state of 0 (Cu(0)). This occurs because the sample is a monometallic 0.61-2.1 wt% Cu-Beta catalyst reduced in H2 at 350 °C. In the absence of a secondary metal like yttrium, there are no diatomic interactions to modify the Cu d-orbital states and raise the energy barrier for reduction. Without this thermodynamic resistance, the Cu species undergo a complete transition and aggregate into metallic Cu(0) nanoparticles, resulting in a 1.0 fraction of Cu(0) with no detectable oxidative phases. | Full points for identifying metallic copper / Cu(0) as the sole/dominant phase (100% fraction). |
| q3 | identification | 50 | What candidate reference spectra should be included in a Linear Combination Fitting (LCF) model to quantify the oxidation states of Cu in this reduced catalyst? | The candidate reference spectra for the Linear Combination Fitting (LCF) model should include CuO, Cu2O, and Cu foil. These references are necessary to evaluate the potential presence of Cu(II), Cu(I), and Cu(0) states in the 0.61-2.1 wt% Cu-Beta catalyst after H2 reduction. Because this monometallic catalyst lacks stabilizing interactions (such as Cu-Y) to raise the reduction energy barrier, the Cu species face no thermodynamic resistance and fully reduce to metallic nanoparticles. Consequently, while the LCF model must include CuO and Cu2O to definitively rule out remaining oxidative phases, the fit will ultimately show a 1.0 fraction for the Cu foil reference. | Full points for listing Cu foil (Cu0), Cu2O (CuI), and CuO (CuII) as the necessary reference spectra. |
Review
Step‐Associated Cu‐Ceria Interfaces Enhance Catalytic Activity and Selectivity
BNL-NSLS-II-8-ID
Catalyst
Shuxuan Feng et al.
DOI: 10.1002/anie.5628406
2 scenarios
▶
#116
Cu/CeO2
Cu K
▶
LLM Prompt
Sample Information
Material: Cu/CeO2
Support: CeO2
Sample-Specific Conditions
- Preparation method: Atom trapping
- Pristine atom-trapped Cu on CeO2
Measurement
We plan to measure the Cu K XANES spectrum of this sample.
Questions
Based on all the information above:
1. What is the expected oxidation state of Cu in the pristine atom-trapped Cu/CeO2 sample, and which standard reference compound does its XANES edge position most closely match?
2. Describe the specific pre-edge feature expected in the Cu K-edge XANES spectrum of this pristine sample, including its approximate energy.
3. Based on the XANES spectral evidence, explain how it is determined that the Cu species in the unreduced sample are in an oxidized state.
Ground Truth
Material: Cu/CeO2 (CuATCeO2-p)
Measurement: Cu K-edge XANES
Fit method: qualitative comparison
Phase fractions: (±10%)
| Phase | Fraction |
|---|---|
| CuO-like species | 1.0 |
Fit basis (paper's reference spectra):
- Cu foil
- CuO
Source evidence: Figure 1a and Section 2.1, page 2
Key reasoning: The absorption edge of the pristine CuATCeO2-p sample shifts to higher energies relative to Cu foil, closely matching that of CuO. Additionally, a distinct Cu2+ pre-edge peak is observed at ~8.9775 keV. These features indicate that the Cu species in the unreduced sample exhibit an average Cu valence similar to CuO.
Reasoning source: Section 2.1 | Preparation and Characterization of Cu/CeO2 and CuATCeO2 Samples, page 2
Scoring Rubric (total: 99 pts)
| Q | Type | Max | Question | Reference Answer | Scoring Criteria |
|---|---|---|---|---|---|
| q1 | identification | 33 | What is the expected oxidation state of Cu in the pristine atom-trapped Cu/CeO2 sample, and which standard reference compound does its XANES edge position most closely match? | The expected oxidation state of Cu in the pristine atom-trapped Cu/CeO2 sample is Cu2+, and its XANES edge position most closely matches the CuO standard reference compound. Because the sample is prepared via atom trapping on a CeO2 support and remains in its pristine, unreduced state, the copper species are fully oxidized, yielding a 1.0 fraction of CuO-like species. This oxidized state is confirmed by the absorption edge shifting to higher energies relative to Cu foil to align with the CuO reference, demonstrating that the unreduced atom-trapped Cu exists entirely as a Cu2+ species. | Full points for identifying Cu2+ and stating that the edge position matches CuO. |
| q2 | spectral | 33 | Describe the specific pre-edge feature expected in the Cu K-edge XANES spectrum of this pristine sample, including its approximate energy. | The Cu K-edge XANES spectrum of this sample is expected to exhibit a distinct pre-edge peak at approximately 8.9775 keV. This feature originates from a dipole-forbidden 1s to 3d electronic transition characteristic of Cu2+. Because the sample consists of pristine, unreduced atom-trapped Cu on a CeO2 support, the copper exists entirely as an oxidized CuO-like species. The presence of this specific pre-edge peak directly reflects this oxidized electronic structure, clearly distinguishing the pristine atom-trapped copper from metallic Cu. | Full points for mentioning a pre-edge peak at approximately 8.9775 keV. |
| q4 | reasoning | 33 | Based on the XANES spectral evidence, explain how it is determined that the Cu species in the unreduced sample are in an oxidized state. | The oxidized state of the Cu species is determined by observing two main XANES spectral features: an absorption edge shift and a specific pre-edge peak. First, the absorption edge of the pristine sample shifts to higher energies relative to a Cu foil reference, closely matching the edge position of CuO. Second, a distinct pre-edge peak appears at ~8.9775 keV, which corresponds to a dipole-forbidden 1s to 3d transition characteristic of Cu2+. Because the sample is a pristine, unreduced atom-trapped Cu/CeO2 material, these spectral features confirm that the copper species exhibit an average valence similar to CuO, existing entirely as oxidized Cu2+ rather than metallic copper. | Full points for explaining that the absorption edge shifts to higher energies matching CuO and the presence of the 1s to 3d pre-edge peak indicates a Cu2+ valence. |
Review
#117
Cu/CeO2
Cu K
▶
LLM Prompt
Sample Information
Material: Cu/CeO2
Support: CeO2
Reaction Conditions: Helium atmosphere after H2 treatment
Sample-Specific Conditions
- Preparation method: Atom trapping
- Reduced atom-trapped Cu on CeO2
Measurement
We plan to measure the Cu K XANES spectrum of this sample.
Questions
Based on all the information above:
1. Based on the sample conditions (H2 reduction followed by in situ measurement under Helium), what is the dominant Cu phase expected in the CuATCeO2 catalyst, and what is the physical reasoning for its formation?
2. Describe the expected Cu K-edge XANES spectral shape and edge position for this reduced sample. What standard reference spectrum does it most closely resemble?
3. What reference spectra should be included in the analysis to verify the oxidation state and reduction extent of this catalyst?
Ground Truth
Material: Cu/CeO2 (CuATCeO2)
Measurement: Cu K-edge in situ XANES under Helium at 8-ID beamline of NSLS-II
Fit method: Visual comparison (no formal LCF reported)
Phase fractions: (±10%)
| Phase | Fraction |
|---|---|
| metallic_copper | 1.0 |
Fit basis (paper's reference spectra):
- Cu foil
- CuO
Source evidence: Figure 1c, Section 2.1, page 2
Key reasoning: The catalyst was subjected to a H2 reduction treatment to induce the formation of metallic nanoparticles from single-atom Cu species. In situ XANES conducted immediately after H2 treatment under a Helium atmosphere shows a substantial shift in edge energy to lower values, matching a metallic Cu foil reference. This indicates complete reduction to metallic Cu, though slight spectral deviations from bulk Cu foil occur due to nanoparticle size effects.
Reasoning source: Section 2.1 | Preparation and Characterization of Cu/CeO2 and CuATCeO2 Samples, page 2
Scoring Rubric (total: 100 pts)
| Q | Type | Max | Question | Reference Answer | Scoring Criteria |
|---|---|---|---|---|---|
| q1 | reasoning | 40 | Based on the sample conditions (H2 reduction followed by in situ measurement under Helium), what is the dominant Cu phase expected in the CuATCeO2 catalyst, and what is the physical reasoning for its formation? | The dominant Cu phase expected in the CuATCeO2 catalyst is metallic Cu nanoparticles with an oxidation state of 0, representing a fraction of 1.0. This phase arises because the atom-trapped Cu/CeO2 sample was subjected to a H2 reduction treatment, which chemically reduces the initial single-atom Cu species into metallic nanoparticles. The subsequent in situ measurement under an inert Helium atmosphere preserves this fully reduced state without allowing re-oxidation. Consequently, the specific reaction conditions drive the complete reduction of copper, resulting in the formation of metallic Cu nanoparticles. | Full credit if the answer identifies metallic Cu nanoparticles (Cu 0) as the dominant phase and explains that H2 treatment induces the reduction of single-atom Cu species into metallic nanoparticles. |
| q2 | spectral | 40 | Describe the expected Cu K-edge XANES spectral shape and edge position for this reduced sample. What standard reference spectrum does it most closely resemble? | The expected Cu K-edge XANES spectrum for this sample features an edge position shifted to lower energy values, most closely resembling the spectral shape of a standard metallic Cu foil reference. However, the spectrum will also exhibit slight distinguishing deviations from the bulk Cu foil reference. These specific spectral features arise because the H2 reduction treatment converts the atom-trapped Cu species into metallic Cu nanoparticles rather than bulk metal. The resulting nanoparticle size effects induce bond contraction, which alters the local structural and electronic properties compared to bulk copper and produces these characteristic changes in the XANES features. | Full credit if the answer states the edge position shifts to lower energies and the overall spectral shape closely matches a metallic Cu foil reference. |
| q4 | identification | 20 | What reference spectra should be included in the analysis to verify the oxidation state and reduction extent of this catalyst? | The analysis should include metallic Cu foil and CuO as the primary reference spectra. These specific references are necessary because the sample conditions involve a H2 reduction treatment of atom-trapped Cu on CeO2, which is intended to reduce the copper species. The Cu foil reference is required to identify and confirm the formation of the fully reduced metallic Cu nanoparticles (oxidation state 0) driven by the H2 treatment. Meanwhile, the CuO reference serves to check for any remaining oxidized copper species, ensuring that the complete reduction achieved under the Helium atmosphere can be accurately verified. | Full credit if the answer identifies Cu foil (metallic Cu) and CuO (oxidized Cu) as the necessary reference spectra. |
Review
Intracellular transformation and disposal mechanisms of magnetosomes in macrophages and cancer cells
ESRF-BM23
Environmental
Lucía Gandarias et al.
DOI: 10.1002/biot.202300173
14 scenarios
▶
#118
biological cells
Fe K-edge
▶
LLM Prompt
Sample Information
Material: biological cells
Sample Origin: in vitro culture
Sample-Specific Conditions
- time after uptake: 2 h
- Intracellular magnetosomes in A549 human lung carcinoma cells after 2 h of uptake
Measurement
We plan to measure the Fe K-edge XANES spectrum of this sample.
Questions
Based on all the information above:
1. What iron phase is expected to completely dominate the Fe K-edge XANES spectrum of A549 cells 2 hours after magnetosome uptake, and what is the physical reasoning for this?
2. To properly model the Fe K-edge XANES spectra of these cells over a long-term time course (from initial uptake to advanced degradation), what specific reference spectra should be included in the linear combination fitting (LCF) basis set?
Ground Truth
Material: biological cells (A549 human lung carcinoma cells)
Measurement: Fe K-edge XANES in fluorescence yield mode
Fit method: Linear combination fitting (LCF)
Phase fractions: (±10%)
| Phase | Fraction |
|---|---|
| Magnetite | 1.0 |
Fit basis (paper's reference spectra):
- magnetosomes (magnetite)
- maghemite
- HoSF (ferrihydrite)
- goethite
Source evidence: Figure 4A, Figure 4B, and Figure 5; Page 6-8
Key reasoning: At 2 hours after magnetosome uptake, the Fe K-edge XANES spectra of A549 cells are coincident with the spectra of isolated magnetosomes and inorganic magnetite. This confirms that the magnetosomes are formed of magnetite crystals and remain mostly intact shortly after interaction with the cells. The subsequent intracellular degradation process, which involves a first oxidation of magnetite to maghemite and a later transformation to ferrihydrite (iron storage in ferritin), has not yet begun at this early time point.
Reasoning source: Section 3.2 Intracellular magnetosome degradation, Page 6-7
Scoring Rubric (total: 100 pts)
| Q | Type | Max | Question | Reference Answer | Scoring Criteria |
|---|---|---|---|---|---|
| q1 | identification | 54 | What iron phase is expected to completely dominate the Fe K-edge XANES spectrum of A549 cells 2 hours after magnetosome uptake, and what is the physical reasoning for this? | The Fe K-edge XANES spectrum of A549 cells 2 hours after uptake is expected to be completely dominated by magnetite, representing a fraction of 1.0. This occurs because, at this early 2-hour time point, the magnetosomes remain mostly intact shortly after their interaction with the cells. The subsequent intracellular degradation process—which involves an initial oxidation of magnetite to maghemite and a later transformation to ferrihydrite for iron storage—has not yet begun. Consequently, the spectrum perfectly coincides with that of isolated magnetosomes and inorganic magnetite. | Full points for identifying magnetite (or intact magnetosomes) as the sole/dominant phase and explaining that at this early time point (2 h), the internalized nanoparticles remain intact and have not yet undergone intracellular degradation or oxidation. |
| q2 | methodology | 46 | To properly model the Fe K-edge XANES spectra of these cells over a long-term time course (from initial uptake to advanced degradation), what specific reference spectra should be included in the linear combination fitting (LCF) basis set? | To properly model the Fe K-edge XANES spectra over a long-term time course, the linear combination fitting (LCF) basis set must include magnetosomes (magnetite), maghemite, HoSF (ferrihydrite), and goethite. These specific references are necessary because they capture the complete intracellular degradation pathway of the magnetosomes within the A549 cells. Although the initial 2-hour uptake condition yields only intact magnetite, subsequent degradation involves a first oxidation of magnetite to maghemite, followed by a later transformation to ferrihydrite as iron is stored in ferritin. Including this full basis set ensures that the progressive structural and electronic transformations occurring during long-term cellular processing can be accurately quantified. | Full points for listing the candidate phases involved in the degradation pathway: magnetite (or intact magnetosomes), maghemite, ferrihydrite (or ferritin/HoSF), and goethite. |
Review
#119
biological cells
Fe K-edge
▶
LLM Prompt
Sample Information
Material: biological cells
Sample Origin: in vitro culture
Sample-Specific Conditions
- time after uptake: 1 d
- Intracellular magnetosomes in A549 human lung carcinoma cells after 1 d of uptake
Measurement
We plan to measure the Fe K-edge XANES spectrum of this sample.
Questions
Based on all the information above:
1. What candidate reference spectra should be included in a linear combination fitting (LCF) analysis to fully capture the potential intracellular degradation phases of magnetosomes in these cells?
2. Estimate the phase fractions of the iron species present in the A549 cells 1 day after magnetosome uptake.
3. Explain the physical and biological reasoning for why the iron speciation is overwhelmingly dominated by the initial phase at this 1-day time point, considering the specific cell line used.
Ground Truth
Material: biological cells
Measurement: Fe K-edge XANES, fluorescence yield mode, BL22-CLÆSS (ALBA) and BM23 (ESRF)
Fit method: Linear combination fitting (LCF)
Phase fractions: (±10%)
| Phase | Fraction |
|---|---|
| Magnetite | 0.95 |
| Maghemite | 0.05 |
Fit basis (paper's reference spectra):
- magnetosomes (magnetite)
- maghemite
- HoSF (ferrihydrite)
- goethite
Source evidence: Figure 5, page 8
Key reasoning: Magnetosomes are initially composed of magnetite crystals. After 1 day of uptake in A549 human lung carcinoma cells, they remain mostly intact. A549 cells are less efficient at degrading magnetosomes than macrophages (like RAW 264.7), so the intracellular biotransformation (which involves a first oxidation to maghemite and later appearance of ferrihydrite) has barely begun. This results in a predominantly magnetite composition with only a minor fraction of maghemite at this early time point.
Reasoning source: Section 3.2 'Intracellular magnetosome degradation', pages 6-7
Scoring Rubric (total: 100 pts)
| Q | Type | Max | Question | Reference Answer | Scoring Criteria |
|---|---|---|---|---|---|
| q1 | identification | 25 | What candidate reference spectra should be included in a linear combination fitting (LCF) analysis to fully capture the potential intracellular degradation phases of magnetosomes in these cells? | The candidate reference spectra for the linear combination fitting (LCF) analysis should include magnetosomes (magnetite), maghemite, HoSF (ferrihydrite), and goethite. These specific references are required because the sample consists of intracellular magnetosomes taken up by A549 human lung carcinoma cells, which undergo a specific degradation pathway. The intracellular biotransformation of the initial magnetite crystals involves a first oxidation step to maghemite, followed by the later appearance of ferrihydrite and potentially other iron oxides. Including this complete set of references ensures that both the intact initial magnetite phase and all potential biological degradation products are accurately captured in the analysis. | Full credit for identifying magnetite (or intact magnetosomes), maghemite, ferrihydrite (or ferritin/HoSF), and goethite as the necessary reference phases. |
| q2 | quantification | 35 | Estimate the phase fractions of the iron species present in the A549 cells 1 day after magnetosome uptake. | The iron speciation in the A549 cells 1 day after uptake is estimated to be 95% magnetite and 5% maghemite, with an uncertainty of 10%. These specific values arise because the magnetosomes, which are initially composed of magnetite crystals, remain mostly intact at this early 1-day time point. Furthermore, the A549 human lung carcinoma cells are less efficient at degrading magnetosomes compared to macrophages. As a result, the intracellular biotransformation has barely begun, leaving a predominantly magnetite composition with only a minor fraction having undergone the initial oxidation to maghemite. | Full credit for estimating ~95% magnetite and ~5% maghemite. Partial credit if magnetite is identified as the overwhelming majority (>90%) with minor oxidation products. |
| q3 | reasoning | 40 | Explain the physical and biological reasoning for why the iron speciation is overwhelmingly dominated by the initial phase at this 1-day time point, considering the specific cell line used. | The iron speciation is overwhelmingly dominated by the initial magnetite phase because the intracellular biotransformation of the magnetosomes has barely begun after just 1 day of uptake. Magnetosomes are initially composed of intact magnetite crystals, which biologically degrade through a first oxidation to maghemite and a later conversion to ferrihydrite. However, the specific cell line used—A549 human lung carcinoma cells—is less efficient at degrading these magnetosomes compared to specialized macrophages like RAW 264.7. Due to this lower cellular degradation efficiency combined with the short 1-day timeframe, the initial magnetite crystals remain mostly intact, resulting in a 95% magnetite and 5% maghemite composition. | Full credit for explaining that magnetosomes start as magnetite and that A549 carcinoma cells are relatively inefficient at degrading them (compared to macrophages), meaning the first step of degradation (oxidation to maghemite) has only just begun after 1 day. |
Review
#120
biological cells
Fe K-edge
▶
LLM Prompt
Sample Information
Material: biological cells
Sample Origin: in vitro culture
Sample-Specific Conditions
- time after uptake: 3 d
- Intracellular magnetosomes in A549 human lung carcinoma cells after 3 d of uptake
Measurement
We plan to measure the Fe K-edge XANES spectrum of this sample.
Questions
Based on all the information above:
1. What candidate reference spectra should be considered for a linear combination fitting analysis of intracellular magnetosomes undergoing degradation?
2. Estimate the relative atomic fractions of the iron phases present in A549 cells 3 days after magnetosome uptake.
3. Explain the biological and chemical reasoning for the expected iron phase composition at this 3-day time point in A549 cells. Why are these specific phases present, and why haven't other degradation products appeared yet?
Ground Truth
Material: biological cells (A549 human lung carcinoma cells)
Measurement: Fe K-edge XANES in fluorescence yield mode at BL22-CLÆSS (ALBA) and BM23 (ESRF)
Fit method: Linear combination fitting (LCF)
Phase fractions: (±10%)
| Phase | Fraction |
|---|---|
| Magnetite | 0.9 |
| Maghemite | 0.1 |
Fit basis (paper's reference spectra):
- magnetosomes (magnetite)
- maghemite
- HoSF (ferrihydrite)
- goethite
Source evidence: Figure 5, page 8
Key reasoning: Intracellular magnetosomes undergo degradation after being internalized by cells. The degradation process begins with the oxidation of the initial magnetite cores into maghemite. After 3 days in A549 cancer cells, this process has just started, resulting in a small fraction of maghemite while the vast majority of the iron remains as intact magnetite. A549 cells are less efficient at degrading magnetosomes compared to macrophages, so further degradation products like ferrihydrite have not yet appeared at this early time point.
Reasoning source: Section 3.2, page 7
Scoring Rubric (total: 100 pts)
| Q | Type | Max | Question | Reference Answer | Scoring Criteria |
|---|---|---|---|---|---|
| q1 | identification | 30 | What candidate reference spectra should be considered for a linear combination fitting analysis of intracellular magnetosomes undergoing degradation? | The candidate reference spectra for linear combination fitting should include magnetosomes (magnetite), maghemite, HoSF (ferrihydrite), and goethite. These specific phases must be considered because intracellular magnetosomes undergo a progressive degradation process after being internalized by biological cells. The initial magnetite cores first oxidize into maghemite, which can subsequently degrade into other iron species like ferrihydrite or goethite. Therefore, this basis set is required to capture both the initial intact magnetosomes and their potential oxidation and degradation products within the cellular environment. | Full points for identifying magnetite (or magnetosomes), maghemite, ferrihydrite (or ferritin), and goethite as potential phases in the degradation pathway. |
| q2 | quantification | 30 | Estimate the relative atomic fractions of the iron phases present in A549 cells 3 days after magnetosome uptake. | The estimated relative atomic fractions are 0.9 (90%) magnetite and 0.1 (10%) maghemite, with an uncertainty of 10%. These specific values result from the fact that after 3 days of uptake in A549 human lung carcinoma cells, the degradation process of the internalized magnetosomes has only just begun. The degradation starts with the oxidation of the initial magnetite cores into maghemite. Because A549 cells are less efficient at degrading magnetosomes compared to macrophages, the vast majority of the iron remains as intact magnetite at this early 3-day time point, yielding only a small fraction of oxidized maghemite. | Full points for estimating ~90% magnetite and ~10% maghemite. Partial credit for identifying that magnetite is the overwhelmingly dominant phase with a minor contribution from an oxidized phase. |
| q3 | reasoning | 40 | Explain the biological and chemical reasoning for the expected iron phase composition at this 3-day time point in A549 cells. Why are these specific phases present, and why haven't other degradation products appeared yet? | After being internalized by A549 human lung carcinoma cells, intracellular magnetosomes undergo a chemical degradation process that begins with the oxidation of their initial magnetite cores into maghemite. At the 3-day time point, this oxidation process has just started, which explains why the composition is dominated by intact magnetite (90%) with only a minor presence of maghemite (10%). Further degradation products, such as ferrihydrite (HoSF), have not yet appeared because A549 cancer cells are less efficient at degrading magnetosomes compared to specialized cells like macrophages. Consequently, the early 3-day timeframe combined with the lower degradation efficiency of A549 cells restricts the iron phase composition to only the initial stages of oxidation. | Full points for explaining that the first step of intracellular degradation is the oxidation of magnetite to maghemite, and that A549 cells degrade magnetosomes relatively slowly, meaning at 3 days the process has only just begun and further products like ferrihydrite have not yet formed. |
Review
#121
biological cells
Fe K-edge
▶
LLM Prompt
Sample Information
Material: biological cells
Sample Origin: in vitro culture
Sample-Specific Conditions
- time after uptake: 6 d
- Intracellular magnetosomes in A549 human lung carcinoma cells after 6 d of uptake
Measurement
We plan to measure the Fe K-edge XANES spectrum of this sample.
Questions
Based on all the information above:
1. Based on the expected intracellular degradation pathway of magnetosomes, what candidate reference spectra should be included in a linear combination fitting analysis of this sample?
2. Estimate the relative fractions of the iron phases present in A549 cells after 6 days of magnetosome uptake.
3. Explain the chemical and biological reasoning for the expected phase composition at 6 days in A549 cells, specifically regarding the degradation mechanism of the magnetosomes.
Ground Truth
Material: biological cells (A549 human lung carcinoma cells)
Measurement: Fe K-edge XANES, fluorescence yield mode, BL22-CLÆSS (ALBA) and BM23 (ESRF)
Fit method: Linear combination fitting (LCF)
Phase fractions: (±10%)
| Phase | Fraction |
|---|---|
| Magnetite | 0.8 |
| Maghemite | 0.2 |
Fit basis (paper's reference spectra):
- magnetosomes (magnetite)
- maghemite
- HoSF (ferrihydrite)
- goethite
Source evidence: Figure 5, page 8
Key reasoning: Intracellular magnetosomes undergo degradation over time inside the cells. The degradation process follows a trend where there is a first oxidation of magnetite to maghemite, followed by the appearance of ferrihydrite. In A549 cells, this degradation is slower than in macrophages (RAW 264.7). After 6 days of uptake in A549 cells, the magnetosomes have partially oxidized to maghemite, but further degradation products like ferrihydrite have not yet appeared in significant amounts.
Reasoning source: Section 3.2, page 7
Scoring Rubric (total: 100 pts)
| Q | Type | Max | Question | Reference Answer | Scoring Criteria |
|---|---|---|---|---|---|
| q1 | identification | 30 | Based on the expected intracellular degradation pathway of magnetosomes, what candidate reference spectra should be included in a linear combination fitting analysis of this sample? | The candidate reference spectra for the linear combination fitting analysis should include magnetosomes (magnetite), maghemite, HoSF (ferrihydrite), and goethite. These specific phases must be included because intracellular magnetosomes undergo a time-dependent degradation process inside the A549 human lung carcinoma cells. The biological degradation pathway dictates a sequential transformation starting with the oxidation of the initial magnetite into maghemite, followed by the eventual appearance of ferrihydrite. Therefore, this basis set comprehensively covers the original material and all expected intermediate and final oxidation products that could arise during the 6-day in vitro culture period. | Full points for identifying magnetite (or intact magnetosomes) and maghemite as the primary components, and mentioning ferrihydrite or goethite as potential degradation products to include in the basis set. |
| q2 | quantification | 35 | Estimate the relative fractions of the iron phases present in A549 cells after 6 days of magnetosome uptake. | After 6 days of magnetosome uptake in A549 cells, the estimated relative fractions of the iron phases are 0.8 (80%) magnetite and 0.2 (20%) maghemite, with an uncertainty of 10%. These specific values result from the relatively slow degradation kinetics of magnetosomes in A549 human lung carcinoma cells compared to other cell types like macrophages. At the 6-day mark, the intracellular environment has only induced a partial, first-stage oxidation of the original magnetite into maghemite. Because this biological degradation is slow, further oxidation products such as ferrihydrite have not yet appeared in significant amounts, leaving the composition heavily dominated by the original magnetite. | Full points for estimating approximately 80% magnetite and 20% maghemite, reflecting partial oxidation without complete transformation. |
| q3 | reasoning | 35 | Explain the chemical and biological reasoning for the expected phase composition at 6 days in A549 cells, specifically regarding the degradation mechanism of the magnetosomes. | The expected phase composition of 80% magnetite and 20% maghemite is driven by the specific intracellular degradation mechanism of magnetosomes within A549 human lung carcinoma cells. During the 6-day in vitro culture, the cellular environment initiates a sequential degradation process that begins with the oxidation of magnetite to maghemite, which is typically followed by the formation of ferrihydrite. However, biological degradation in A549 cells is notably slower than in highly phagocytic cells like macrophages (e.g., RAW 264.7). As a result of this slower kinetic rate, after 6 days the magnetosomes have only undergone partial oxidation to maghemite. The timeframe is insufficient for further degradation products like ferrihydrite to accumulate in significant amounts, explaining the observed intermediate phase composition. | Full points for explaining that the initial step of degradation is the oxidation of magnetite to maghemite, and that in A549 cells this process is relatively slow, meaning that at 6 days the transformation is only partial and further products like ferrihydrite have not yet formed. |
Review
#122
biological cells
Fe K-edge
▶
LLM Prompt
Sample Information
Material: biological cells
Sample Origin: in vitro culture
Sample-Specific Conditions
- time after uptake: 8 d
- Intracellular magnetosomes in A549 human lung carcinoma cells after 8 d of uptake
Measurement
We plan to measure the Fe K-edge XANES spectrum of this sample.
Questions
Based on all the information above:
1. Based on the sample conditions (A549 cells, 8 days after magnetosome uptake), what iron phases are expected to be present and what are their approximate atomic fractions?
2. What reference spectra should be included in the basis set for a linear combination fitting (LCF) analysis to capture the full intracellular magnetosome degradation pathway over time?
3. Explain the biological and chemical reasoning for the observed phase composition in A549 cells after 8 days, specifically addressing the degradation pathway and the kinetics compared to other cell types.
Ground Truth
Material: biological cells
Measurement: Fe K-edge XANES in fluorescence yield mode at BL22-CLÆSS (ALBA) and BM23 (ESRF)
Fit method: Linear combination fitting (LCF)
Phase fractions: (±10%)
| Phase | Fraction |
|---|---|
| Magnetite | 0.7 |
| Maghemite | 0.3 |
Fit basis (paper's reference spectra):
- magnetosomes (magnetite)
- maghemite
- HoSF (ferrihydrite)
- goethite
Source evidence: Figure 5
Key reasoning: Intracellular magnetosomes undergo degradation in A549 cells. The degradation process begins with the oxidation of magnetite to maghemite. Because A549 are endothelial/carcinoma cells without a specific function of degradation, they process magnetosomes slower than macrophages. Thus, after 8 days, the iron is still predominantly in the form of magnetite with a partial conversion to maghemite, and ferrihydrite (the iron storage phase) has not yet appeared.
Reasoning source: Section 3.2, page 7
Scoring Rubric (total: 100 pts)
| Q | Type | Max | Question | Reference Answer | Scoring Criteria |
|---|---|---|---|---|---|
| q1 | quantification | 40 | Based on the sample conditions (A549 cells, 8 days after magnetosome uptake), what iron phases are expected to be present and what are their approximate atomic fractions? | Based on the sample conditions, the expected iron phases are magnetite at an atomic fraction of 0.7 (70%) and maghemite at 0.3 (30%), with an uncertainty of 10%. These specific fractions arise because intracellular magnetosomes undergo a degradation process in A549 cells that begins with the oxidation of magnetite to maghemite. Since A549 human lung carcinoma cells lack a specific degradation function, they process magnetosomes much slower than specialized cells like macrophages. Consequently, after 8 days of in vitro culture, the degradation is only partial, leaving the iron predominantly as magnetite with a minor conversion to maghemite, while the final iron storage phase (ferrihydrite) has not yet formed. | Award 20 points for correctly identifying Magnetite and Maghemite as the present phases. Award 20 points for estimating the fractions at approximately 70% Magnetite and 30% Maghemite (allow +/- 10% margin). |
| q2 | identification | 30 | What reference spectra should be included in the basis set for a linear combination fitting (LCF) analysis to capture the full intracellular magnetosome degradation pathway over time? | The basis set for the LCF analysis should include reference spectra for magnetosomes (magnetite), maghemite, HoSF (ferrihydrite), and goethite. These specific reference phases are required to model the complete degradation pathway of intracellular magnetosomes in biological cells. The degradation process begins with the initial oxidation of the original magnetite phase into maghemite. Over time, as the cells process the magnetosomes, the iron is eventually converted into ferrihydrite, which serves as the final iron storage phase. Although A549 cells process these slower and ferrihydrite has not yet appeared at 8 days, this full basis set is necessary to capture all potential intermediate and final states of the degradation pathway. | Award full points for listing magnetite (or magnetosomes), maghemite, ferrihydrite (or HoSF), and goethite as the necessary reference spectra. |
| q3 | reasoning | 30 | Explain the biological and chemical reasoning for the observed phase composition in A549 cells after 8 days, specifically addressing the degradation pathway and the kinetics compared to other cell types. | The observed phase composition of 70% magnetite and 30% maghemite is driven by the specific biological nature of the A549 human lung carcinoma cells. Following in vitro uptake, intracellular magnetosomes undergo a chemical degradation process that starts with the oxidation of magnetite into maghemite. However, because A549 cells are endothelial/carcinoma cells rather than specialized phagocytes, they lack a specific degradation function and process the magnetosomes much slower than macrophages. As a result of these slow kinetics, after 8 days of uptake, the degradation remains incomplete. The iron is still predominantly in its original magnetite form with only partial oxidation to maghemite, and the final ferrihydrite iron storage phase has not yet had time to appear. | Award 10 points for stating that degradation begins with the oxidation of magnetite to maghemite. Award 10 points for noting that ferrihydrite has not yet formed at this stage. Award 10 points for explaining that A549 cells degrade magnetosomes slower than macrophages because they lack a specific degradation/iron-scavenging function. |
Review
#123
biological cells
Fe K-edge
▶
LLM Prompt
Sample Information
Material: biological cells
Sample Origin: in vitro culture
Sample-Specific Conditions
- time after uptake: 10 d
- Intracellular magnetosomes in A549 human lung carcinoma cells after 10 d of uptake
Measurement
We plan to measure the Fe K-edge XANES spectrum of this sample.
Questions
Based on all the information above:
1. What candidate reference spectra should be included in a linear combination fitting analysis to model the intracellular degradation of magnetosomes in these cells?
2. Estimate the phase fractions of the iron species present in A549 cells 10 days after magnetosome uptake.
3. Explain the biological and chemical reasoning for the expected phase composition in A549 cells at 10 days, focusing on the degradation pathway and cell-type efficiency.
Ground Truth
Material: biological cells
Measurement: Fe K-edge XANES in fluorescence yield mode at BL22-CLÆSS (ALBA) and BM23 (ESRF)
Fit method: Linear combination fitting (LCF)
Phase fractions: (±10%)
| Phase | Fraction |
|---|---|
| Magnetite | 0.63 |
| Maghemite | 0.37 |
Fit basis (paper's reference spectra):
- magnetosomes (magnetite)
- maghemite
- HoSF (ferrihydrite)
- goethite
Source evidence: Page 7, text and Figure 5
Key reasoning: Intracellular magnetosomes undergo degradation in cells, starting with the oxidation of magnetite to maghemite. A549 cells (human lung carcinoma) are less efficient at degrading magnetosomes than macrophages (like RAW 264.7). After 10 days of uptake, 63% of the iron remains as magnetite, while the rest has oxidized to maghemite. At this stage in A549 cells, further transformation into ferrihydrite has not yet occurred in significant amounts.
Reasoning source: Page 7, Section 3.2
Scoring Rubric (total: 100 pts)
| Q | Type | Max | Question | Reference Answer | Scoring Criteria |
|---|---|---|---|---|---|
| q1 | identification | 30 | What candidate reference spectra should be included in a linear combination fitting analysis to model the intracellular degradation of magnetosomes in these cells? | The candidate reference spectra for the linear combination fitting analysis should include magnetosomes (magnetite), maghemite, HoSF (ferrihydrite), and goethite. These specific references are required because they represent the expected chemical stages of intracellular magnetosome degradation in biological cells. Given the sample conditions, the degradation pathway begins with the oxidation of the initial magnetite core into maghemite, which can eventually transform further into ferrihydrite or goethite, making these phases essential to model the complete transformation process. | Full points for identifying magnetite (or magnetosomes), maghemite, ferrihydrite (or ferritin), and goethite as the relevant basis set for this degradation pathway. |
| q2 | quantification | 40 | Estimate the phase fractions of the iron species present in A549 cells 10 days after magnetosome uptake. | After 10 days of uptake in A549 cells, the iron species are estimated to be 63% magnetite and 37% maghemite, with an uncertainty of 10%. These specific fractions arise because intracellular magnetosomes undergo a gradual degradation process that starts with the oxidation of magnetite to maghemite. Because A549 human lung carcinoma cells are less efficient at degrading magnetosomes compared to other cell types like macrophages, the degradation is relatively slow. Consequently, at the 10-day mark, the majority of the iron remains as unoxidized magnetite, and further transformation into ferrihydrite has not yet occurred in significant amounts. | Full points for estimating ~63% magnetite and ~37% maghemite. Partial credit if the dominant phase is correctly identified as magnetite with a significant maghemite fraction, within the 10% uncertainty. |
| q3 | reasoning | 30 | Explain the biological and chemical reasoning for the expected phase composition in A549 cells at 10 days, focusing on the degradation pathway and cell-type efficiency. | The expected phase composition of 63% magnetite and 37% maghemite is driven by the chemical degradation pathway of the magnetosomes and the specific biological processing efficiency of the host cells. Chemically, the intracellular degradation of magnetosomes initiates with the oxidation of the magnetite core into maghemite. Biologically, A549 human lung carcinoma cells are less efficient at degrading these structures than specialized phagocytes like macrophages. As a result of this lower efficiency, after 10 days of in vitro culture, the oxidation process is only partial, leaving a majority of the initial magnetite intact and preventing further downstream transformation into ferrihydrite. | Full points for explaining that degradation starts with the oxidation of magnetite to maghemite, and that A549 cells are relatively inefficient at this process compared to macrophages, resulting in a majority of the iron still remaining as magnetite at 10 days before further transformation to ferrihydrite. |
Review
#124
biological cells
Fe K-edge
▶
LLM Prompt
Sample Information
Material: biological cells
Sample Origin: in vitro culture
Sample-Specific Conditions
- time after uptake: 13 d
- Intracellular magnetosomes in A549 human lung carcinoma cells after 13 d of uptake
Measurement
We plan to measure the Fe K-edge XANES spectrum of this sample.
Questions
Based on all the information above:
1. What candidate reference spectra are needed to model the Fe K-edge XANES spectrum of magnetosomes internalized in A549 cells for 13 days using linear combination fitting?
2. Estimate the phase fractions of the iron species present in A549 cells 13 days after magnetosome uptake.
Ground Truth
Material: biological cells (A549 human lung carcinoma cells)
Measurement: Fe K-edge (7112 eV) in fluorescence yield mode at low temperatures (77 K or 10 K)
Fit method: Linear combination fitting (LCF)
Phase fractions: (±10%)
| Phase | Fraction |
|---|---|
| Magnetite | 0.55 |
| Maghemite | 0.4 |
| Ferrihydrite | 0.05 |
Fit basis (paper's reference spectra):
- magnetosomes (magnetite)
- maghemite
- HoSF (ferrihydrite)
- goethite
Source evidence: Figure 5 and Section 3.2
Key reasoning: The intracellular degradation process involves a first oxidation of magnetite to maghemite, followed by the appearance of ferrihydrite. The appearance of ferrihydrite indicates that iron released from degrading magnetite nanoparticles is locally transferred to endogenous ferritins to maintain iron homeostasis and reduce oxidative stress. A549 cells are less efficient at degrading magnetosomes than macrophages because they are endothelial/carcinoma cells with no specific function of degradation, leading to a slower transformation rate and a smaller fraction of ferrihydrite at 13 days.
Reasoning source: Section 3.2 'Intracellular magnetosome degradation', pages 6-7
Scoring Rubric (total: 100 pts)
| Q | Type | Max | Question | Reference Answer | Scoring Criteria |
|---|---|---|---|---|---|
| q1 | identification | 40 | What candidate reference spectra are needed to model the Fe K-edge XANES spectrum of magnetosomes internalized in A549 cells for 13 days using linear combination fitting? | The candidate reference spectra needed for linear combination fitting are magnetosomes (magnetite), maghemite, HoSF (ferrihydrite), and goethite. These specific phases are expected because the intracellular degradation of magnetosomes in A549 cells involves an initial oxidation of the original magnetite to maghemite. Following this oxidation, iron released from the degrading magnetite nanoparticles is locally transferred to endogenous ferritins (modeled as ferrihydrite) to maintain iron homeostasis and reduce oxidative stress. | Full points if the answer identifies magnetite (or intact magnetosomes), maghemite, and ferrihydrite (or ferritin/HoSF) as the necessary reference spectra. |
| q2 | quantification | 60 | Estimate the phase fractions of the iron species present in A549 cells 13 days after magnetosome uptake. | After 13 days of uptake, the estimated iron phase fractions are 0.55 (55%) magnetite, 0.40 (40%) maghemite, and 0.05 (5%) ferrihydrite, with an uncertainty of 10%. These specific values result from the intracellular degradation process where magnetite is first oxidized to maghemite, followed by the release of iron to form ferrihydrite (endogenous ferritin) to maintain iron homeostasis. Because A549 human lung carcinoma cells are endothelial/carcinoma cells with no specific function of degradation, they are less efficient at degrading magnetosomes, leading to a slower transformation rate and a correspondingly small fraction of ferrihydrite at 13 days. | Full points if the estimated fractions are within ±10% of the ground truth: Magnetite ~55%, Maghemite ~40%, and Ferrihydrite ~5%. |
Review
#125
biological cells
Fe K-edge
▶
LLM Prompt
Sample Information
Material: biological cells
Sample Origin: in vitro culture
Sample-Specific Conditions
- time after uptake: 20 d
- Intracellular magnetosomes in A549 human lung carcinoma cells after 20 d of uptake
Measurement
We plan to measure the Fe K-edge XANES spectrum of this sample.
Questions
Based on all the information above:
1. What candidate reference spectra are needed to model the Fe K-edge XANES spectrum of this sample using linear combination fitting?
2. Estimate the phase fractions of the iron species present in the A549 cells after 20 days of magnetosome uptake.
Ground Truth
Material: biological cells (A549 human lung carcinoma cells)
Measurement: Fe K-edge fluorescence yield mode
Fit method: Linear combination fitting (LCF)
Phase fractions: (±10%)
| Phase | Fraction |
|---|---|
| Magnetite | 0.45 |
| Maghemite | 0.41 |
| Ferrihydrite | 0.14 |
Fit basis (paper's reference spectra):
- magnetosomes (magnetite)
- maghemite
- HoSF (ferrihydrite)
- goethite
Source evidence: Figure 5 and Section 3.2, page 7
Key reasoning: Inside A549 cells, magnetosomes (magnetite) undergo a gradual intracellular degradation. The degradation process follows a sequence where magnetite first oxidizes to maghemite, and subsequently ferrihydrite starts to appear. The appearance of ferrihydrite indicates that iron released from the degrading magnetite nanoparticles is locally transferred to endogenous ferritins to maintain iron homeostasis and reduce oxidative stress. A549 cells (cancer cells) are less efficient at degrading magnetosomes compared to macrophages, which is why a significant fraction of magnetite and maghemite remains even after 20 days.
Reasoning source: Section 3.2 'Intracellular magnetosome degradation', page 7
Scoring Rubric (total: 100 pts)
| Q | Type | Max | Question | Reference Answer | Scoring Criteria |
|---|---|---|---|---|---|
| q1 | identification | 50 | What candidate reference spectra are needed to model the Fe K-edge XANES spectrum of this sample using linear combination fitting? | To model the Fe K-edge XANES spectrum of this sample, the necessary candidate reference spectra are magnetosomes (magnetite), maghemite, HoSF (ferrihydrite), and goethite. These specific phases are expected because the internalized magnetosomes undergo gradual intracellular degradation within the A549 cells over the 20-day in vitro culture period. During this degradation sequence, the initial magnetite first oxidizes to maghemite. Subsequently, ferrihydrite appears as iron released from the degrading nanoparticles is locally transferred to endogenous ferritins to maintain iron homeostasis and reduce oxidative stress. | Full credit for identifying magnetite (or magnetosomes), maghemite, and ferrihydrite (or HoSF) as the necessary reference spectra. |
| q2 | quantification | 50 | Estimate the phase fractions of the iron species present in the A549 cells after 20 days of magnetosome uptake. | After 20 days of magnetosome uptake, the estimated iron phase fractions in the A549 cells are 45% magnetite, 41% maghemite, and 14% ferrihydrite, with an uncertainty of 10%. These specific values arise because A549 cancer cells are relatively inefficient at degrading magnetosomes compared to cells like macrophages. Consequently, a large majority of the iron remains as intact magnetite or its initial oxidized degradation product, maghemite, even after a prolonged 20-day period. The 14% ferrihydrite fraction reflects the smaller portion of iron that has been fully released from the degrading nanoparticles and transferred to endogenous ferritins. | Full credit for estimating fractions close to Magnetite ~45%, Maghemite ~41%, and Ferrihydrite ~14% (allow ±10% margin of error). |
Review
#126
biological cells
Fe K-edge
▶
LLM Prompt
Sample Information
Material: biological cells
Sample Origin: in vitro culture
Sample-Specific Conditions
- time after uptake: 3 d
- Intracellular magnetosomes in RAW 264.7 murine macrophages after 3 d of uptake
Measurement
We plan to measure the Fe K-edge XANES spectrum of this sample.
Questions
Based on all the information above:
1. Based on the expected intracellular biotransformation of magnetosomes, what candidate reference spectra should be included in the basis set for linear combination fitting of the Fe K-edge XANES spectrum of this sample?
2. Estimate the relative phase fractions of the iron species present in RAW 264.7 murine macrophages 3 days after magnetosome uptake.
3. Explain the biological and physical reasoning for the specific iron phase composition observed in RAW 264.7 cells at the 3-day time point.
Ground Truth
Material: biological cells
Measurement: Fe K-edge XANES, fluorescence yield mode, BL22-CLÆSS beamline (ALBA) and BM23 beamline (ESRF)
Fit method: Linear combination fitting (LCF)
Phase fractions: (±10%)
| Phase | Fraction |
|---|---|
| Magnetite | 0.75 |
| Maghemite | 0.25 |
Fit basis (paper's reference spectra):
- magnetosomes (magnetite)
- maghemite
- HoSF (ferrihydrite)
- goethite
Source evidence: Figure 5, page 8
Key reasoning: After 3 days of uptake in RAW 264.7 macrophages, the intracellular degradation of magnetosomes has begun. The degradation process starts with the oxidation of the initial magnetite cores into maghemite. At this early time point, the transformation is partial, resulting in a mixture dominated by magnetite with a significant fraction of maghemite, before further degradation into ferrihydrite occurs at later stages.
Reasoning source: Section 3.2 Intracellular magnetosome degradation, pages 6-7
Scoring Rubric (total: 100 pts)
| Q | Type | Max | Question | Reference Answer | Scoring Criteria |
|---|---|---|---|---|---|
| q1 | identification | 20 | Based on the expected intracellular biotransformation of magnetosomes, what candidate reference spectra should be included in the basis set for linear combination fitting of the Fe K-edge XANES spectrum of this sample? | The basis set for linear combination fitting of the Fe K-edge XANES spectrum should include reference spectra for magnetosomes (magnetite), maghemite, HoSF (ferrihydrite), and goethite. These specific reference phases are required because the sample consists of intracellular magnetosomes in RAW 264.7 murine macrophages after 3 days of uptake, a condition where intracellular degradation has begun. During this in vitro biological processing, the initial magnetite cores undergo oxidation into maghemite. Including ferrihydrite and goethite is also necessary to account for the complete biotransformation pathway, as the magnetite and maghemite will further degrade into these phases at later stages of the cellular process. | Full credit for identifying magnetite (or magnetosomes), maghemite, ferrihydrite (or HoSF), and goethite as the relevant reference phases for the degradation pathway. |
| q2 | quantification | 40 | Estimate the relative phase fractions of the iron species present in RAW 264.7 murine macrophages 3 days after magnetosome uptake. | The estimated relative phase fractions for the iron species in this sample are 75% magnetite and 25% maghemite, with an uncertainty of 10%. These specific values result from the sample being exactly 3 days post-uptake in RAW 264.7 macrophages, which represents an early stage of intracellular degradation. At this specific time point, the biological environment has initiated the oxidation of the original magnetite cores into maghemite. Because this transformation is only partial after 3 days, the composition remains dominated by the initial magnetite (0.75) while exhibiting a significant, newly formed fraction of maghemite (0.25) before further degradation into ferrihydrite occurs. | Full credit for estimating approximately 75% Magnetite and 25% Maghemite. Partial credit for identifying that magnetite is the majority phase with maghemite as the secondary phase, without exact percentages. |
| q3 | reasoning | 40 | Explain the biological and physical reasoning for the specific iron phase composition observed in RAW 264.7 cells at the 3-day time point. | The observed iron phase composition of 75% magnetite and 25% maghemite is a direct result of the early-stage intracellular degradation of magnetosomes within the RAW 264.7 murine macrophages. After 3 days of in vitro culture following uptake, the biological environment of the macrophages initiates the breakdown of the internalized magnetosomes. The physical mechanism of this initial degradation step is the oxidation of the original magnetite cores into maghemite. Because 3 days represents an early time point in the cellular processing, this oxidative transformation is only partial. Consequently, the sample retains a majority of the initial magnetite phase alongside a growing fraction of maghemite, prior to any subsequent degradation into ferrihydrite at later stages. | Full credit for explaining that intracellular degradation of magnetosomes begins with the oxidation of magnetite to maghemite, and that at 3 days this process is only partially complete, leading to a mixture of the two phases before further degradation into ferrihydrite occurs. |
Review
#127
biological cells
Fe K-edge
▶
LLM Prompt
Sample Information
Material: biological cells
Sample Origin: in vitro culture
Sample-Specific Conditions
- time after uptake: 6 d
- Intracellular magnetosomes in RAW 264.7 murine macrophages after 6 d of uptake
Measurement
We plan to measure the Fe K-edge XANES spectrum of this sample.
Questions
Based on all the information above:
1. Based on the sample conditions (RAW 264.7 murine macrophages, 6 days after magnetosome uptake), what are the expected iron phases present and their approximate fractions?
2. What reference spectra should be included in the basis set to perform a Linear Combination Fitting (LCF) analysis of this sample?
3. Explain the biological and chemical reasoning behind the phase composition observed in these macrophages after 6 days of magnetosome uptake.
Ground Truth
Material: biological cells (RAW 264.7 murine macrophages)
Measurement: Fe K-edge XANES in fluorescence yield mode at low temperatures (77 K or 10 K)
Fit method: Linear combination fitting (LCF)
Phase fractions: (±10%)
| Phase | Fraction |
|---|---|
| Magnetite | 0.6 |
| Maghemite | 0.3 |
| Ferrihydrite | 0.1 |
Fit basis (paper's reference spectra):
- magnetosomes (magnetite)
- maghemite
- HoSF (ferrihydrite)
- goethite
Source evidence: Figure 5, page 8
Key reasoning: In RAW 264.7 macrophages, magnetosomes undergo intracellular degradation over time. The degradation process involves an initial oxidation of the magnetite cores to maghemite, followed by the appearance of ferrihydrite. After 6 days of uptake, macrophages show significant degradation efficiency, with ferrihydrite already present, indicating that iron released from degrading magnetite nanoparticles is being locally transferred to endogenous ferritins to maintain iron homeostasis.
Reasoning source: Section 3.2 (Intracellular magnetosome degradation), page 7
Scoring Rubric (total: 100 pts)
| Q | Type | Max | Question | Reference Answer | Scoring Criteria |
|---|---|---|---|---|---|
| q1 | quantification | 40 | Based on the sample conditions (RAW 264.7 murine macrophages, 6 days after magnetosome uptake), what are the expected iron phases present and their approximate fractions? | The expected iron phases in the sample are magnetite at approximately 0.6 (60%), maghemite at 0.3 (30%), and ferrihydrite at 0.1 (10%), with an uncertainty of 10%. These specific fractions arise because the intracellular magnetosomes undergo significant degradation within the RAW 264.7 macrophages over the 6-day in vitro culture period. The degradation mechanism involves the initial oxidation of the original magnetite cores into maghemite, accounting for the 30% fraction. Furthermore, the degrading nanoparticles release iron that is locally transferred to endogenous ferritins to maintain iron homeostasis, which explains the 10% ferrihydrite fraction alongside the 60% remaining intact magnetite. | Full points for identifying Magnetite (~60%), Maghemite (~30%), and Ferrihydrite (~10%). Partial points for identifying the correct phases without exact fractions, or if fractions are within 10-15% of the ground truth. |
| q2 | identification | 30 | What reference spectra should be included in the basis set to perform a Linear Combination Fitting (LCF) analysis of this sample? | The basis set for Linear Combination Fitting (LCF) should include reference spectra for magnetosomes (magnetite), maghemite, HoSF (ferrihydrite), and goethite. These specific references are necessary because they directly correspond to the chemical states produced during the intracellular degradation of magnetosomes in RAW 264.7 macrophages after 6 days of uptake. Magnetite accounts for the remaining intact nanoparticle cores, while maghemite is required to model the initial oxidation phase of the degradation process. Ferrihydrite (HoSF) must be included because the macrophages transfer the released iron to endogenous ferritins to maintain homeostasis, and goethite serves as an additional relevant iron oxide reference to ensure an accurate fit. | Full points for listing magnetite (or intact magnetosomes), maghemite, and ferrihydrite (or ferritin/HoSF). Mentioning goethite as a potential reference for late-stage degradation is also acceptable. |
| q3 | reasoning | 30 | Explain the biological and chemical reasoning behind the phase composition observed in these macrophages after 6 days of magnetosome uptake. | The observed phase composition is driven by the progressive intracellular degradation of magnetosomes within the RAW 264.7 murine macrophages over the 6-day uptake period. Chemically, this degradation process begins with the oxidation of the ingested magnetite cores, which converts a portion of the material into maghemite. Because these macrophages demonstrate significant degradation efficiency by day 6, iron is actively released from the degrading magnetite nanoparticles. Biologically, to maintain iron homeostasis and manage the released iron, the cells locally transfer it to endogenous ferritins, resulting in the appearance of the ferrihydrite phase. | Full points for explaining that macrophages actively degrade the magnetosomes, leading to the oxidation of magnetite to maghemite, and the subsequent transfer of released iron to endogenous ferritin (forming ferrihydrite) to maintain iron homeostasis and prevent oxidative stress. |
Review
#128
biological cells
Fe K-edge
▶
LLM Prompt
Sample Information
Material: biological cells
Sample Origin: in vitro culture
Sample-Specific Conditions
- time after uptake: 7 d
- Intracellular magnetosomes in RAW 264.7 murine macrophages after 7 d of uptake
Measurement
We plan to measure the Fe K-edge XANES spectrum of this sample.
Questions
Based on all the information above:
1. What candidate reference spectra should be included in a linear combination fitting (LCF) basis set to accurately model the Fe K-edge XANES spectrum of magnetosomes degrading in macrophages over a multi-day period?
2. Estimate the relative atomic fractions of the iron phases present in RAW 264.7 macrophages 7 days after the uptake of magnetosomes.
3. Provide the biological and chemical reasoning for the phase composition observed at 7 days. What does the emergence of the new iron phases indicate about the cellular processing of the nanoparticles?
Ground Truth
Material: biological cells (RAW 264.7 murine macrophages)
Measurement: Fe K-edge (7112 eV) XANES in fluorescence yield mode at low temperatures (77 K at ALBA, 10 K at ESRF)
Fit method: Linear combination fitting (LCF)
Phase fractions: (±15%)
| Phase | Fraction |
|---|---|
| Magnetite | 0.55 |
| Maghemite | 0.3 |
| Ferrihydrite | 0.15 |
Fit basis (paper's reference spectra):
- magnetosomes (magnetite)
- maghemite
- HoSF (ferrihydrite)
- goethite
Source evidence: Figure 5 and Section 3.2, pages 6-8
Key reasoning: Inside the macrophages, magnetosomes undergo intracellular degradation. The process begins with the oxidation of the magnetite cores into maghemite. Subsequently, ferrihydrite starts to appear, indicating that the iron released from the degrading magnetite nanoparticles is locally transferred to endogenous ferritin proteins. This transfer to ferritin (which stores iron as a ferrihydrite mineral core) is a cellular mechanism to maintain iron homeostasis and temporarily chelate redox-active labile iron, thereby reducing oxidative stress.
Reasoning source: Section 3.2 (Intracellular magnetosome degradation), page 7
Scoring Rubric (total: 100 pts)
| Q | Type | Max | Question | Reference Answer | Scoring Criteria |
|---|---|---|---|---|---|
| q1 | identification | 20 | What candidate reference spectra should be included in a linear combination fitting (LCF) basis set to accurately model the Fe K-edge XANES spectrum of magnetosomes degrading in macrophages over a multi-day period? | The linear combination fitting (LCF) basis set should include reference spectra for magnetosomes (magnetite), maghemite, HoSF (ferrihydrite), and goethite. These specific phases are required because the sample consists of intracellular magnetosomes undergoing degradation inside RAW 264.7 murine macrophages over a 7-day period. During this time, the initial magnetite cores of the magnetosomes are progressively oxidized into maghemite. Additionally, ferrihydrite must be included because iron released from the degrading nanoparticles is transferred to endogenous ferritin proteins, which store iron as a ferrihydrite mineral core to maintain cellular homeostasis. | Full credit for identifying Magnetite (or intact magnetosomes), Maghemite, and Ferrihydrite (or Ferritin/HoSF). Partial credit if only two are named. Mentioning Goethite as a potential late-stage product is also acceptable. |
| q2 | quantification | 40 | Estimate the relative atomic fractions of the iron phases present in RAW 264.7 macrophages 7 days after the uptake of magnetosomes. | At 7 days post-uptake, the estimated relative atomic fractions of the iron phases are 0.55 (55%) magnetite, 0.30 (30%) maghemite, and 0.15 (15%) ferrihydrite, with an uncertainty of 15%. These specific values result from the progressive intracellular degradation of the magnetosomes within the macrophages over the 7-day incubation period. The 55% magnetite fraction represents the remaining intact nanoparticle cores, while the 30% maghemite fraction reflects the ongoing oxidation of these cores. The 15% ferrihydrite fraction arises because the iron released from the degrading magnetite is locally transferred to endogenous ferritin proteins to safely chelate redox-active labile iron. | Full credit for estimating approximately 55% Magnetite, 30% Maghemite, and 15% Ferrihydrite (allow a ±10% margin for each phase due to reading from graphical data). |
| q3 | reasoning | 40 | Provide the biological and chemical reasoning for the phase composition observed at 7 days. What does the emergence of the new iron phases indicate about the cellular processing of the nanoparticles? | The observed phase composition at 7 days indicates that the magnetosomes are undergoing active intracellular degradation within the RAW 264.7 macrophages. Chemically, this degradation process begins with the oxidation of the original magnetite nanoparticle cores into maghemite. Biologically, the emergence of ferrihydrite indicates that iron released from the degrading magnetite is being locally transferred to endogenous ferritin proteins. This transfer to ferritin, which stores iron as a ferrihydrite mineral core, is a critical cellular mechanism to maintain iron homeostasis and temporarily chelate redox-active labile iron, thereby reducing oxidative stress in the cells. | Full credit requires explaining two key steps: 1) the initial oxidation of magnetite to maghemite, and 2) the subsequent degradation and transfer of released iron to endogenous ferritin (forming ferrihydrite) to maintain iron homeostasis and prevent oxidative stress. |
Review
#129
biological cells
Fe K-edge
▶
LLM Prompt
Sample Information
Material: biological cells
Sample Origin: in vitro culture
Sample-Specific Conditions
- time after uptake: 8 d
- Intracellular magnetosomes in RAW 264.7 murine macrophages after 8 d of uptake
Measurement
We plan to measure the Fe K-edge XANES spectrum of this sample.
Questions
Based on all the information above:
1. What candidate reference spectra should be included in a linear combination fitting (LCF) analysis to accurately model the Fe K-edge XANES spectrum of magnetosomes that have been internalized and processed by RAW 264.7 macrophages for 8 days?
2. Estimate the relative atomic fractions of the iron phases present in the RAW 264.7 macrophages after 8 days of magnetosome uptake.
3. Explain the biological and chemical mechanisms driving the transformation of the initial magnetosome mineral phase into the secondary phases observed after 8 days in RAW 264.7 cells.
Ground Truth
Material: biological cells
Measurement: Fe K-edge XANES in fluorescence yield mode
Fit method: Linear combination fitting (LCF)
Phase fractions: (±10%)
| Phase | Fraction |
|---|---|
| Magnetite | 0.5 |
| Maghemite | 0.3 |
| Ferrihydrite | 0.2 |
Fit basis (paper's reference spectra):
- magnetosomes (magnetite)
- maghemite
- HoSF (ferrihydrite)
- goethite
Source evidence: Figure 5, page 8
Key reasoning: Magnetosomes undergo intracellular degradation in macrophages, starting with the oxidation of the initial magnetite cores into maghemite. Subsequently, ferrihydrite begins to appear, indicating that the iron released from the degrading magnetic nanoparticles is being transferred to endogenous ferritin proteins to maintain iron homeostasis and prevent oxidative stress. Macrophages (RAW 264.7) are highly efficient at this degradation process due to their specialized role in clearing foreign debris and regulating iron metabolism.
Reasoning source: Section 3.2, page 7
Scoring Rubric (total: 100 pts)
| Q | Type | Max | Question | Reference Answer | Scoring Criteria |
|---|---|---|---|---|---|
| q1 | identification | 30 | What candidate reference spectra should be included in a linear combination fitting (LCF) analysis to accurately model the Fe K-edge XANES spectrum of magnetosomes that have been internalized and processed by RAW 264.7 macrophages for 8 days? | To accurately model the Fe K-edge XANES spectrum of this sample, the LCF basis should include reference spectra for magnetosomes (magnetite), maghemite, HoSF (ferrihydrite), and goethite. These specific phases are expected because, after 8 days of uptake, the RAW 264.7 murine macrophages actively degrade the internalized magnetosomes. The initial magnetite cores undergo oxidation into maghemite as part of the intracellular degradation process. Furthermore, ferrihydrite appears because the macrophages transfer the released iron to endogenous ferritin proteins to maintain iron homeostasis and prevent oxidative stress. | Full credit for identifying magnetite (or intact magnetosomes), maghemite, and ferrihydrite (or ferritin) as the necessary reference spectra. Partial credit if only two are mentioned. |
| q2 | quantification | 35 | Estimate the relative atomic fractions of the iron phases present in the RAW 264.7 macrophages after 8 days of magnetosome uptake. | After 8 days of magnetosome uptake, the estimated relative atomic fractions of the iron phases are 0.5 (50%) magnetite, 0.3 (30%) maghemite, and 0.2 (20%) ferrihydrite, with an uncertainty of 10%. These specific values result from the highly efficient intracellular degradation process characteristic of RAW 264.7 macrophages clearing foreign debris over this 8-day period. The 50% magnetite fraction represents the remaining intact magnetosome cores, while the 30% maghemite fraction reflects the ongoing oxidation of these initial cores. The 20% ferrihydrite fraction arises because the iron released from the degrading nanoparticles is progressively transferred to endogenous ferritin proteins to regulate iron metabolism. | Full credit for estimating approximately 50% magnetite, 30% maghemite, and 20% ferrihydrite. Deduct points proportionally for deviations greater than the 10% uncertainty margin. |
| q3 | reasoning | 35 | Explain the biological and chemical mechanisms driving the transformation of the initial magnetosome mineral phase into the secondary phases observed after 8 days in RAW 264.7 cells. | After 8 days of in vitro culture, the initial magnetite cores of the magnetosomes undergo intracellular degradation driven by the RAW 264.7 murine macrophages. Because these macrophages are highly efficient at clearing foreign debris and regulating iron metabolism, they chemically oxidize the magnetite into maghemite. As the magnetic nanoparticles continue to degrade, iron is released into the intracellular environment. To maintain iron homeostasis and prevent oxidative stress, the cells transfer this released iron into endogenous ferritin proteins, resulting in the formation of ferrihydrite. This biological and chemical processing ultimately yields the observed mixture of remaining magnetite, intermediate maghemite, and secondary ferrihydrite phases. | Full credit for explaining that magnetite first oxidizes to maghemite, followed by degradation that releases iron, which is then sequestered into endogenous ferritin (forming ferrihydrite) to maintain iron homeostasis and mitigate oxidative stress. Must mention the specific role of macrophages in efficiently degrading foreign material. |
Review
#130
biological cells
Fe K-edge
▶
LLM Prompt
Sample Information
Material: biological cells
Sample Origin: in vitro culture
Sample-Specific Conditions
- time after uptake: 9 d
- Intracellular magnetosomes in RAW 264.7 murine macrophages after 9 d of uptake
Measurement
We plan to measure the Fe K-edge XANES spectrum of this sample.
Questions
Based on all the information above:
1. What candidate reference spectra (iron phases) are needed to accurately model the Fe K-edge XANES spectrum of magnetosomes internalized by RAW 264.7 macrophages after 9 days of uptake?
2. Estimate the relative phase fractions of the iron species present in the RAW 264.7 macrophages after 9 days of magnetosome uptake.
Ground Truth
Material: biological cells (RAW 264.7 murine macrophages)
Measurement: Fe K-edge (7112 eV) in fluorescence yield mode at low temperatures (77 K at ALBA BL22-CLÆSS or 10 K at ESRF BM23)
Fit method: Linear combination fitting (LCF)
Phase fractions: (±10%)
| Phase | Fraction |
|---|---|
| Magnetite | 0.45 |
| Maghemite | 0.25 |
| Ferrihydrite | 0.3 |
Fit basis (paper's reference spectra):
- magnetosomes (magnetite)
- maghemite
- HoSF (ferrihydrite)
- goethite
Source evidence: Page 7, text and Figure 5 (bar chart for RAW 264.7 at 9d)
Key reasoning: Magnetosomes (magnetite) undergo intracellular degradation in macrophages. The degradation process involves a first oxidation of magnetite to maghemite, followed by the appearance of ferrihydrite. The formation of ferrihydrite indicates that iron released from the degrading magnetite nanoparticles is locally transferred to endogenous ferritins to maintain iron homeostasis and protect the cell from oxidative stress. Macrophages (RAW 264.7) are highly efficient at this degradation process because their biological function involves capturing and degrading foreign debris and regulating iron metabolism.
Reasoning source: Page 7, Section 3.2 'Intracellular magnetosome degradation'
Scoring Rubric (total: 100 pts)
| Q | Type | Max | Question | Reference Answer | Scoring Criteria |
|---|---|---|---|---|---|
| q1 | identification | 42 | What candidate reference spectra (iron phases) are needed to accurately model the Fe K-edge XANES spectrum of magnetosomes internalized by RAW 264.7 macrophages after 9 days of uptake? | To accurately model the Fe K-edge XANES spectrum of this sample, the required candidate reference spectra are magnetosomes (magnetite), maghemite, HoSF (ferrihydrite), and goethite. These specific phases are needed because intracellular magnetosomes (magnetite) undergo a degradation process within the RAW 264.7 macrophages over the 9-day uptake period. Macrophages are highly efficient at capturing and degrading foreign debris, which first causes the oxidation of the initial magnetite into maghemite. Subsequently, the released iron is transferred to endogenous ferritins to maintain iron homeostasis and prevent oxidative stress, resulting in the appearance of ferrihydrite. | Full points for identifying magnetite (or magnetosomes), maghemite, and ferrihydrite (or ferritin/HoSF) as the necessary reference spectra. |
| q2 | quantification | 58 | Estimate the relative phase fractions of the iron species present in the RAW 264.7 macrophages after 9 days of magnetosome uptake. | After 9 days of magnetosome uptake, the estimated relative iron phase fractions in the RAW 264.7 macrophages are 45% magnetite, 25% maghemite, and 30% ferrihydrite, with an uncertainty of 10%. These specific values result from the highly efficient intracellular degradation of the internalized magnetosomes by the macrophages over the 9-day period. The biological function of these cells drives the initial oxidation of the original magnetite (leaving 45%) into maghemite (accounting for 25%). As the degradation progresses, the released iron is locally transferred to endogenous ferritins to protect the cell from oxidative stress, yielding a 30% fraction of ferrihydrite to maintain iron homeostasis. | Full points for estimating approximately 45% magnetite, 25% maghemite, and 30% ferrihydrite. Deduct points proportionally for deviations greater than the 10% uncertainty margin. |
Review
#131
biological cells
Fe K-edge
▶
LLM Prompt
Sample Information
Material: biological cells
Sample Origin: in vitro culture
Sample-Specific Conditions
- time after uptake: 13 d
- Intracellular magnetosomes in RAW 264.7 murine macrophages after 13 d of uptake
Measurement
We plan to measure the Fe K-edge XANES spectrum of this sample.
Questions
Based on all the information above:
1. Based on the biological context of magnetosome degradation in macrophages over a long period (13 days), what candidate reference spectra are needed for linear combination fitting of the Fe K-edge XANES spectrum?
2. Estimate the relative atomic fractions of the iron phases present in RAW 264.7 macrophages after 13 days of magnetosome uptake.
Ground Truth
Material: biological cells
Measurement: Fe K-edge (7112 eV) in fluorescence yield mode at the BL22-CLÆSS beamline (ALBA) and BM23 beamline (ESRF)
Fit method: Linear combination fitting (LCF)
Phase fractions: (±15%)
| Phase | Fraction |
|---|---|
| Magnetite | 0.3 |
| Maghemite | 0.2 |
| Goethite | 0.5 |
Fit basis (paper's reference spectra):
- magnetosomes (magnetite)
- maghemite
- HoSF (ferrihydrite)
- goethite
Source evidence: Figure 5 and Section 3.2, page 7
Key reasoning: After 13 days of magnetosome uptake in RAW 264.7 macrophages, the degradation pathway deviates from the earlier trend of forming ferrihydrite. Instead, goethite appears as a major phase. Goethite is an iron oxyhydroxide similar to the iron mineral phase in hemosiderin, which is a lysosomal degradation product of ferritin that forms under iron overload conditions. Thus, the appearance of goethite is attributed to the degradation of ferritin into hemosiderin due to an iron excess situation in the cells caused by the extensive degradation of magnetosomes.
Reasoning source: Section 3.2, page 7
Scoring Rubric (total: 100 pts)
| Q | Type | Max | Question | Reference Answer | Scoring Criteria |
|---|---|---|---|---|---|
| q1 | identification | 50 | Based on the biological context of magnetosome degradation in macrophages over a long period (13 days), what candidate reference spectra are needed for linear combination fitting of the Fe K-edge XANES spectrum? | The candidate reference spectra needed for linear combination fitting of the Fe K-edge XANES spectrum are magnetosomes (magnetite), maghemite, HoSF (ferrihydrite), and goethite. These specific phases are expected because, after 13 days of intracellular magnetosome uptake in RAW 264.7 macrophages, the degradation pathway deviates from earlier trends of forming ferrihydrite. The extensive degradation of the magnetosomes over this prolonged period creates an iron excess situation within the cells. This iron overload causes ferritin to degrade into hemosiderin, a lysosomal degradation product whose iron mineral phase is similar to the iron oxyhydroxide goethite, necessitating its inclusion alongside the original and intermediate iron oxide phases. | Full points for identifying magnetite (or intact magnetosomes), maghemite, and goethite (or hemosiderin). Partial points if ferrihydrite is mentioned instead of goethite, but goethite is the correct late-stage product for this specific condition. |
| q2 | quantification | 50 | Estimate the relative atomic fractions of the iron phases present in RAW 264.7 macrophages after 13 days of magnetosome uptake. | The estimated relative atomic fractions of the iron phases are 0.3 (30%) magnetite, 0.2 (20%) maghemite, and 0.5 (50%) goethite, with an uncertainty of 15%. These specific values result from the prolonged 13-day intracellular degradation of magnetosomes in the in vitro macrophage culture. Over this extended period, the extensive breakdown of the initial magnetite and maghemite magnetosomes leads to a severe cellular iron overload. Consequently, the degradation pathway shifts away from forming ferrihydrite, resulting in a dominant 50% fraction of goethite, which reflects the degradation of ferritin into hemosiderin under these iron excess conditions. | Full points for estimating ~30% magnetite, ~20% maghemite, and ~50% goethite. Partial points for identifying goethite as the dominant phase and magnetite/maghemite as the remaining minor phases. |
Review
Implications of the Molybdenum Coordination Environment in MFI Zeolites on Methane Dehydroaromatisation Performance
BNL-NSLS-II-8-ID
Catalyst
Miren Agote‐Arán et al.
DOI: 10.1002/cctc.201901166
2 scenarios
▶
#132
Mo/Silicalite-1
Mo K
▶
LLM Prompt
Sample Information
Material: Mo/Silicalite-1
Support: Silicalite-1 (MFI, Si/Al = ∞)
Reaction Conditions: T <= 600 °C
Sample-Specific Conditions
- Temperature: <= 600 °C
- Mo/Silicalite-1 during in situ calcination up to 600 °C
Measurement
We plan to measure the Mo K XANES spectrum of this sample.
Questions
Based on all the information above:
1. What is the dominant Mo phase in Mo/Silicalite-1 during in situ calcination up to 600 °C, and what is the physical reasoning for this?
2. What are the key spectral features (edge and pre-edge positions) expected in the Mo K-edge XANES spectrum of this sample, and what electronic transitions give rise to them?
3. What distinguishes the XANES spectrum of this sample (<= 600 °C) from the spectrum obtained at higher calcination temperatures (> 600 °C) in terms of spectral shape and local coordination?
Ground Truth
Material: Mo/Silicalite-1
Measurement: Mo K-edge, transmission mode, B18 beamline at Diamond Light Source
Fit method: not reported
Phase fractions: (±10%)
| Phase | Fraction |
|---|---|
| MoO3 | 1.0 |
Fit basis (paper's reference spectra):
- MoO3
Source evidence: Page 2, Figure 1a and text in 'Study of Mo speciation within Mo-MFI structures - XAS during in situ calcination'
Key reasoning: The XANES spectra do not change significantly up to 600 °C, indicating that the local structure of the MoO3 precursor (comprising interconnected MoO6 octahedra) does not change significantly in this temperature range.
Reasoning source: Page 2, Results and Discussion
Scoring Rubric (total: 100 pts)
| Q | Type | Max | Question | Reference Answer | Scoring Criteria |
|---|---|---|---|---|---|
| q1 | identification | 30 | What is the dominant Mo phase in Mo/Silicalite-1 during in situ calcination up to 600 °C, and what is the physical reasoning for this? | The dominant Mo phase in Mo/Silicalite-1 during in situ calcination up to 600 °C is MoO3, which constitutes a fraction of 1.0 (100%). This occurs because, within this temperature range, the local structure of the initial MoO3 precursor remains highly stable. Specifically, the interconnected MoO6 octahedra comprising the precursor do not undergo significant structural changes or phase transformations at or below 600 °C. Consequently, the pure MoO3 phase is entirely preserved under these specific thermal conditions. | Full points for identifying MoO3 as the dominant phase and explaining that the local structure of the MoO3 precursor (interconnected MoO6 octahedra) does not change significantly up to 600 °C. |
| q2 | spectral | 40 | What are the key spectral features (edge and pre-edge positions) expected in the Mo K-edge XANES spectrum of this sample, and what electronic transitions give rise to them? | The expected Mo K-edge XANES spectrum exhibits a pre-edge peak at 20005 eV and a rising absorption edge at 20015 eV. These features are characteristic of the stable MoO3 precursor present in the Mo/Silicalite-1 sample during calcination up to 600 °C. The pre-edge peak originates from the dipole-forbidden 1s -> 4d electronic transition, while the rising edge is due to the dipole-allowed 1s -> 5p transition. Because the sample's interconnected MoO6 octahedral structure does not change significantly in this temperature range, these specific electronic transitions and their corresponding spectral signatures are maintained. | Full points for mentioning the pre-edge peak around 20005 eV (1s -> 4d transition) and the rising absorption edge at 20015 eV (1s -> 5p transition). |
| q3 | reasoning | 30 | What distinguishes the XANES spectrum of this sample (<= 600 °C) from the spectrum obtained at higher calcination temperatures (> 600 °C) in terms of spectral shape and local coordination? | The XANES spectrum of the sample at or below 600 °C is distinguished by a lower pre-edge peak intensity compared to spectra collected at higher calcination temperatures. This spectral difference is directly tied to the temperature-dependent local coordination of the Mo species. During calcination up to 600 °C, the Mo/Silicalite-1 sample maintains the interconnected MoO6 octahedral structure of the MoO3 precursor. When the temperature exceeds 600 °C, the local symmetry changes from octahedral to tetrahedral, which physically causes the observed increase in the pre-edge intensity. | Full points for stating that below 600 °C, the pre-edge intensity is lower (octahedral symmetry), whereas above 600 °C, the pre-edge intensity increases due to a change in symmetry from octahedral to tetrahedral. |
Review
#133
Mo/Silicalite-1
Mo K
▶
LLM Prompt
Sample Information
Material: Mo/Silicalite-1
Support: Silicalite-1 (MFI, Si/Al = ∞)
Reaction Conditions: T = 700 °C
Sample-Specific Conditions
- Temperature: 700 °C
- Mo/Silicalite-1 during in situ calcination at 700 °C
Measurement
We plan to measure the Mo K XANES spectrum of this sample.
Questions
Based on all the information above:
1. What phase dominates the Mo speciation in Mo/Silicalite-1 during in situ calcination at 700 °C, and what physical transformation leads to its formation?
2. Describe the expected spectral shape of the Mo K-edge XANES for this sample, specifically focusing on the pre-edge and post-edge regions, and explain what these features indicate about the Mo structure.
3. Identify the electronic transitions and their corresponding energies for the pre-edge peak and the rising absorption edge in the Mo K-edge XANES spectrum of this sample.
Ground Truth
Material: Mo/Silicalite-1
Measurement: Mo K-edge in situ transmission mode at B18 beamline
Fit method: not reported
Phase fractions: (±10%)
| Phase | Fraction |
|---|---|
| isolated Mo-oxo species | 1.0 |
Source evidence: Figure 1a and text on page 2
Key reasoning: During calcination above 600 °C, the MoO3 precursor disperses into isolated Mo-oxo species attached to the microporous framework. This is evidenced by an increase in pre-edge intensity indicating a change to tetrahedral symmetry, and the loss of post-edge features indicating a loss of long-range order.
Reasoning source: Results and Discussion, Study of Mo speciation within Mo-MFI structures - XAS during in situ calcination, page 2
Scoring Rubric (total: 100 pts)
| Q | Type | Max | Question | Reference Answer | Scoring Criteria |
|---|---|---|---|---|---|
| q1 | identification | 30 | What phase dominates the Mo speciation in Mo/Silicalite-1 during in situ calcination at 700 °C, and what physical transformation leads to its formation? | The dominant phase in the Mo/Silicalite-1 sample during in situ calcination at 700 °C is isolated Mo-oxo species, which account for a fraction of 1.0 (100%) of the Mo speciation. This complete conversion occurs because the 700 °C operating temperature exceeds the 600 °C threshold required for the initial MoO3 precursor to physically transform. Under these high-temperature calcination conditions, the MoO3 precursor fully disperses and attaches to the microporous Silicalite-1 framework. As a result, the long-range order of the precursor is lost, leaving only isolated Mo-oxo structures. | Full points for identifying 'isolated Mo-oxo species' and explaining that the MoO3 precursor disperses and loses long-range order to attach to the zeolite framework. |
| q2 | spectral | 40 | Describe the expected spectral shape of the Mo K-edge XANES for this sample, specifically focusing on the pre-edge and post-edge regions, and explain what these features indicate about the Mo structure. | The expected Mo K-edge XANES spectrum features a distinct pre-edge peak at approximately 20005 eV with increased intensity, a rising edge at 20015 eV, and a broad, featureless post-edge region above 20030 eV. These specific spectral features arise directly from the sample's structural evolution during in situ calcination at 700 °C. Because this high temperature causes the MoO3 precursor to disperse into isolated Mo-oxo species on the microporous framework, the Mo atoms adopt a tetrahedral symmetry, which is indicated by the high pre-edge intensity. Additionally, the broad, featureless post-edge region confirms the loss of long-range order resulting from this thermal dispersion process. | Full points for mentioning the increased pre-edge intensity (indicating tetrahedral symmetry) and the broad, featureless post-edge region > 20030 eV (indicating loss of long-range order). |
| q3 | spectral | 30 | Identify the electronic transitions and their corresponding energies for the pre-edge peak and the rising absorption edge in the Mo K-edge XANES spectrum of this sample. | In the Mo K-edge XANES spectrum for this sample, the pre-edge peak is located at 20005 eV and originates from the dipole-forbidden 1s → 4d electronic transition. The rising absorption edge occurs at 20015 eV and corresponds to the dipole-allowed 1s → 5p electronic transition. These transitions exhibit their specific intensities because the 700 °C in situ calcination conditions force the MoO3 precursor to fully disperse into isolated Mo-oxo species attached to the Silicalite-1 framework. This high-temperature dispersion shifts the local Mo environment into a tetrahedral symmetry, which specifically enhances the intensity of the 1s → 4d pre-edge transition. | Full points for stating the pre-edge peak is at ~20005 eV (1s -> 4d transition) and the rising absorption edge is at 20015 eV (1s -> 5p transition). |
Review
Reduction of Propanoic Acid over Pd‐Promoted Supported WOx Catalysts
BNL-NSLS-II-8-ID
Catalyst
James D. Kammert et al.
DOI: 10.1002/cctc.201901302
2 scenarios
▶
#134
PdW/SiO2
Pd K
▶
LLM Prompt
Sample Information
Material: PdW/SiO2
Support: SiO2
Reaction Conditions: ambient
Sample-Specific Conditions
- treatment: as-synthesized
- As-synthesized Pd-promoted tungsten oxide on silica
Measurement
We plan to measure the Pd K XANES spectrum of this sample.
Questions
Based on all the information above:
1. Given the synthesis procedure involving calcination in air at 773 K, what is the expected chemical state and dominant phase of palladium in the as-synthesized PdW/SiO2 catalyst?
2. Explain the physical reasoning for why the as-synthesized catalyst is expected to contain only this specific palladium phase prior to any reaction or reduction steps.
3. What candidate reference spectra should be measured to confirm the phase composition of Pd in this as-synthesized sample using XANES?
Ground Truth
Material: PdW/SiO2
Measurement: Pd K-edge XANES, in situ before treatment, NSLS-II beamline 8-ID
Fit method: Qualitative comparison
Phase fractions: (±10%)
| Phase | Fraction |
|---|---|
| palladium_oxide | 1.0 |
Fit basis (paper's reference spectra):
- PdO
- Pd foil
Source evidence: Page 9, Section 2.4: 'Analysis of the Pd K-edge XANES revealed the as-synthesized catalysts contained only PdO (Figure S.9).'
Key reasoning: The catalyst was synthesized by incipient wetness impregnation and subsequently calcined in flowing air at 773 K. This high-temperature oxidative treatment fully converts the palladium precursor into palladium oxide (PdO). Consequently, XANES analysis confirms that the as-synthesized catalyst contains only PdO prior to any reduction treatment.
Reasoning source: Page 5 (Catalyst Synthesis) and Page 9 (Section 2.4)
Scoring Rubric (total: 100 pts)
| Q | Type | Max | Question | Reference Answer | Scoring Criteria |
|---|---|---|---|---|---|
| q1 | identification | 35 | Given the synthesis procedure involving calcination in air at 773 K, what is the expected chemical state and dominant phase of palladium in the as-synthesized PdW/SiO2 catalyst? | The expected dominant phase of palladium in the as-synthesized PdW/SiO2 catalyst is palladium oxide (PdO), representing a fraction of 1.0. This phase arises because the catalyst was synthesized by incipient wetness impregnation and subsequently calcined in flowing air at 773 K. This high-temperature oxidative treatment provides the necessary environment to fully convert the palladium precursor into its oxidized state. Consequently, prior to any reduction treatment, the as-synthesized sample exists entirely as PdO. | Full credit for identifying palladium oxide (PdO) as the sole or dominant phase. |
| q2 | reasoning | 35 | Explain the physical reasoning for why the as-synthesized catalyst is expected to contain only this specific palladium phase prior to any reaction or reduction steps. | The as-synthesized PdW/SiO2 catalyst is expected to contain exclusively palladium oxide (PdO) prior to any reaction or reduction steps. This occurs because the synthesis procedure involves calcination in flowing air at a high temperature of 773 K. This specific oxidative treatment environment forces the complete conversion of the initial palladium precursor into a fully oxidized state. As a result, until the catalyst undergoes a specific reduction treatment, the palladium remains entirely stabilized as 100% PdO. | Full credit for explaining that the high-temperature calcination in an oxidizing environment (air at 773 K) fully oxidizes the Pd precursor to PdO. |
| q3 | identification | 30 | What candidate reference spectra should be measured to confirm the phase composition of Pd in this as-synthesized sample using XANES? | The candidate reference spectra that should be measured to confirm the phase composition of Pd in this sample are PdO and Pd foil. These specific references are chosen based on the sample's synthesis conditions, which included calcination in flowing air at 773 K. This high-temperature oxidative treatment is expected to fully convert the palladium precursor into palladium oxide (PdO). Therefore, the PdO reference is needed to identify the 100% oxidized phase, while the Pd foil reference is required to definitively rule out the presence of any metallic palladium prior to reduction. | Full credit for listing PdO as the primary reference, and Pd foil (or metallic Pd) to rule out the presence of reduced species. |
Review
#135
PdW/SiO2
Pd K
▶
LLM Prompt
Sample Information
Material: PdW/SiO2
Support: SiO2
Reaction Conditions: H2
Sample-Specific Conditions
- treatment: reduced at 673 K
- Reduced Pd-promoted tungsten oxide on silica
Measurement
We plan to measure the Pd K XANES spectrum of this sample.
Questions
Based on all the information above:
1. Based on the sample conditions (PdW/SiO2 reduced in H2 at 673 K), what is the expected dominant Pd phase, and why does this transformation occur compared to the as-synthesized state?
2. What reference spectra should be included in a basis set to model the Pd K-edge XANES of this catalyst before and after the reduction treatment?
Ground Truth
Material: PdW/SiO2
Measurement: Pd K edge in situ XAS at NSLS-II beamline 8-ID
Fit method: Qualitative comparison and EXAFS fitting
Phase fractions: (±10%)
| Phase | Fraction |
|---|---|
| metallic_palladium | 1.0 |
Fit basis (paper's reference spectra):
- Pd foil
- PdO
Source evidence: Page 10, Section 2.4
Key reasoning: The as-synthesized catalyst contained only PdO. Treatment in H2 at elevated temperature (673 K) fully reduced the PdO on PdW/SiO2 to metallic Pd. The resulting metallic Pd was highly dispersed (60-80%), with an approximate particle diameter of 1-2 nm, corresponding to a Pd-Pd first-shell coordination number of 8.5, which is lower than the bulk value of 12.
Reasoning source: Page 10, Section 2.4
Scoring Rubric (total: 100 pts)
| Q | Type | Max | Question | Reference Answer | Scoring Criteria |
|---|---|---|---|---|---|
| q1 | reasoning | 57 | Based on the sample conditions (PdW/SiO2 reduced in H2 at 673 K), what is the expected dominant Pd phase, and why does this transformation occur compared to the as-synthesized state? | The expected dominant Pd phase for the PdW/SiO2 catalyst is metallic palladium, comprising a fraction of 1.0. The as-synthesized catalyst initially contains only PdO. When subjected to the specific sample conditions of H2 gas at an elevated temperature of 673 K, a complete reduction of the PdO occurs. This treatment fully converts the oxide into highly dispersed (60-80%) metallic Pd nanoparticles with a diameter of 1-2 nm, which exhibit a lower first-shell coordination number (8.5) compared to bulk Pd. | Award 20 points for identifying metallic Pd as the dominant (100%) phase. Award 20 points for explaining that the as-synthesized PdO is fully reduced by the high-temperature H2 treatment. |
| q2 | identification | 43 | What reference spectra should be included in a basis set to model the Pd K-edge XANES of this catalyst before and after the reduction treatment? | The basis set to model the Pd K-edge XANES of this catalyst should include Pd foil and PdO reference spectra. These specific references are required because they represent the initial and final states of the catalyst under the given sample conditions. The as-synthesized PdW/SiO2 catalyst consists entirely of PdO, necessitating the PdO reference. Upon treatment in H2 at 673 K, the elevated temperature and reducing environment fully convert the PdO into highly dispersed metallic Pd nanoparticles (1-2 nm), requiring the Pd foil reference to model the resulting 100% metallic palladium phase. | Award 15 points for mentioning metallic Pd (or Pd foil). Award 15 points for mentioning PdO. |
Review
Effect of Oxide Support on Catalytic Performance of FeNi‐based Catalysts for CO2‐assisted Oxidative Dehydrogenation of Ethane
APS
Catalyst
Binhang Yan, Siyu Yao, Jingguang G. Chen
DOI: 10.1002/cctc.201901585
2 scenarios
▶
#136
Fe3Ni1
Ni K
▶
LLM Prompt
Sample Information
Material: Fe3Ni1
Support: ZrO2
Sample-Specific Conditions
- support: ZrO2
- Fresh Fe3Ni1 catalyst supported on ZrO2
Measurement
We plan to measure the Ni K XANES spectrum of this sample.
Questions
Based on all the information above:
1. Given the preparation conditions (calcination in air at 723 K), what is the expected dominant Ni phase in the fresh Fe3Ni1/ZrO2 catalyst, and what reference spectrum should be used to identify it?
2. Explain the physical reasoning for why this specific Ni phase is expected in the fresh sample prior to any reduction or reaction.
3. Describe the expected overall spectral shape of the Ni K-edge XANES for this fresh sample and how it compares to metallic Ni.
Ground Truth
Material: Fe3Ni1/ZrO2
Measurement: Ni K-edge XANES, in-situ, Beamline 9-BM of Advanced Photon Source (APS)
Fit method: qualitative comparison
Phase fractions: (±10%)
| Phase | Fraction |
|---|---|
| NiO | 1.0 |
Fit basis (paper's reference spectra):
- NiO
Source evidence: Page 22, Figure 7(a)
Key reasoning: The fresh catalyst was prepared by wetness co-impregnation and calcined in air at 723 K for 4 h. Under these oxidizing preparation conditions, the Ni species are fully oxidized. The Ni K-edge XANES spectrum of the fresh catalyst shows near edge features that are highly similar to the standard NiO reference, confirming the presence of NiO.
Reasoning source: Page 22 (In-situ X-ray absorption fine structure (XAFS) measurements) and Page 28 (Catalyst preparation)
Scoring Rubric (total: 100 pts)
| Q | Type | Max | Question | Reference Answer | Scoring Criteria |
|---|---|---|---|---|---|
| q1 | identification | 30 | Given the preparation conditions (calcination in air at 723 K), what is the expected dominant Ni phase in the fresh Fe3Ni1/ZrO2 catalyst, and what reference spectrum should be used to identify it? | The expected dominant Ni phase in the fresh Fe3Ni1/ZrO2 catalyst is NiO, which accounts for a fraction of 1.0. To identify this phase, a standard NiO reference spectrum should be used as the fit basis for qualitative comparison. This specific phase is expected because the fresh catalyst was prepared by wetness co-impregnation and subsequently calcined in air at 723 K for 4 hours. These highly oxidizing preparation conditions cause the Ni species to become fully oxidized, resulting entirely in the formation of NiO prior to any reduction steps. | Full credit for identifying NiO (or nickel oxide) as the dominant phase (fraction ~1.0) and stating that a standard NiO reference spectrum is needed. |
| q2 | reasoning | 40 | Explain the physical reasoning for why this specific Ni phase is expected in the fresh sample prior to any reduction or reaction. | The fresh Fe3Ni1/ZrO2 catalyst is expected to consist entirely of NiO (fraction of 1.0) prior to any reduction or reaction. This outcome is a direct result of the catalyst preparation method, which involves wetness co-impregnation followed by calcination in air at 723 K for 4 hours. Because air provides a strongly oxidizing environment at this elevated temperature, the nickel species undergo complete oxidation. Consequently, the fully oxidized NiO phase is the only stable state present in the fresh sample under these specific preparation conditions. | Full credit for connecting the oxidizing preparation conditions (calcination in air at 723 K) to the complete oxidation of Ni precursors into NiO. |
| q3 | spectral | 30 | Describe the expected overall spectral shape of the Ni K-edge XANES for this fresh sample and how it compares to metallic Ni. | The Ni K-edge XANES spectrum of the fresh Fe3Ni1/ZrO2 sample is expected to exhibit near-edge features that are highly similar to a standard NiO reference. These spectral features will be distinctly different from those of a metallic Ni foil. This specific spectral shape arises because the sample was calcined in air at 723 K for 4 hours, creating an oxidizing environment that fully oxidizes the nickel species. As a result, the structural and electronic properties of the sample reflect a pure NiO phase, producing the characteristic XANES features of fully oxidized nickel rather than metallic nickel. | Full credit for stating the spectrum will have near edge features similar to standard NiO (e.g., a strong white line) and will be distinctly different from metallic Ni foil. |
Review
#137
Fe3Ni1
Ni K
▶
LLM Prompt
Sample Information
Material: Fe3Ni1
Support: ZrO2
Reaction Conditions: 873 K, 5 mL/min C2H6 + 5 mL/min CO2 + 10 mL/min He
Sample-Specific Conditions
- state: reaction conditions
- Fe3Ni1 catalyst supported on ZrO2 under reaction conditions
Measurement
We plan to measure the Ni K XANES spectrum of this sample.
Questions
Based on all the information above:
1. What is the dominant oxidation state and phase of Ni in the Fe3Ni1/ZrO2 catalyst under reaction conditions (873 K, C2H6 + CO2), and what structural evidence from the paper supports this assignment?
2. Based on the paper's methodology, which standard reference spectra are necessary to evaluate the oxidation state changes of Ni in this sample from its fresh state to reaction conditions?
3. Describe the expected overall spectral shape of the Ni K-edge XANES for the Fe3Ni1/ZrO2 catalyst under reaction conditions and how it distinguishes itself from the fresh catalyst.
Ground Truth
Material: Fe3Ni1/ZrO2
Measurement: in-situ Ni K-edge XANES, fluorescence mode, Beamline 9-BM of APS at ANL
Fit method: qualitative comparison
Phase fractions: (±10%)
| Phase | Fraction |
|---|---|
| metallic_nickel | 1.0 |
Fit basis (paper's reference spectra):
- Ni foil
- NiO
Source evidence: Page 22, Figure 7b, Table 2
Key reasoning: For all three catalysts under reaction conditions, the oxidation state of Ni is metallic. The detailed EXAFS fittings of the Ni K-edge spectra reveal that the coordination numbers (CNs) of Ni-Ni(Fe) on the catalysts under reaction conditions are 9.8, indicating that the Ni-rich NiFe alloy resides in the form of small particles. Although XRD does not show Ni0 peaks for Fe3Ni1/ZrO2 due to sparse distribution, XANES confirms the fully reduced metallic state.
Reasoning source: Page 22, Section 'In-situ X-ray absorption fine structure (XAFS) measurements'; Page 26, Section 'Discussion of active sites'
Scoring Rubric (total: 100 pts)
| Q | Type | Max | Question | Reference Answer | Scoring Criteria |
|---|---|---|---|---|---|
| q1 | identification | 40 | What is the dominant oxidation state and phase of Ni in the Fe3Ni1/ZrO2 catalyst under reaction conditions (873 K, C2H6 + CO2), and what structural evidence from the paper supports this assignment? | Under the reaction conditions of 873 K with C2H6 and CO2, the dominant oxidation state of Ni in the Fe3Ni1/ZrO2 catalyst is 0, corresponding to a fully reduced metallic Ni phase (specifically, a Ni-rich NiFe alloy). This metallic state arises because the high temperature (873 K) and the ethane/CO2 reaction mixture drive the complete reduction of the nickel species. The structural evidence supporting this assignment comes from EXAFS fittings, which reveal a Ni-Ni(Fe) coordination number of 9.8, indicating the formation of small metallic alloy particles. Furthermore, although XRD does not detect Ni0 peaks due to the sparse distribution of the metal on the ZrO2 support, the XANES data confirms the 100% metallic nickel fraction. | The answer must identify the Ni oxidation state as 0 (metallic) and mention the formation of a Ni-rich NiFe alloy, supported by Ni-Ni(Fe) coordination numbers from EXAFS fitting. |
| q2 | reasoning | 30 | Based on the paper's methodology, which standard reference spectra are necessary to evaluate the oxidation state changes of Ni in this sample from its fresh state to reaction conditions? | To evaluate the oxidation state changes of Ni in the Fe3Ni1/ZrO2 catalyst, the necessary standard reference spectra are Ni foil and NiO. These specific references are required because the catalyst transitions from an oxidized state in the fresh sample to a fully reduced state under the reaction conditions of 873 K in a C2H6 and CO2 flow. The NiO reference is used to identify the initial oxidized state of the fresh catalyst, while the Ni foil reference is essential to confirm the 100% metallic nickel fraction (Ni0) formed during the reaction. By qualitatively comparing the sample's XANES spectra to these two bases, it is possible to track the complete reduction of nickel into a Ni-rich NiFe alloy driven by the high-temperature reaction environment. | The answer must identify Ni foil (for the metallic state under reaction conditions) and NiO (for the oxidized fresh state) as the key reference spectra. |
| q3 | spectral | 30 | Describe the expected overall spectral shape of the Ni K-edge XANES for the Fe3Ni1/ZrO2 catalyst under reaction conditions and how it distinguishes itself from the fresh catalyst. | Under the reaction conditions of 873 K with C2H6 and CO2, the near-edge features of the Ni K-edge XANES spectrum for the Fe3Ni1/ZrO2 catalyst closely match the standard Ni foil reference. This spectral shape distinguishes itself from the fresh catalyst, which exhibits near-edge features similar to standard NiO. These spectral differences arise because the fresh catalyst initially contains oxidized nickel, which is subsequently fully reduced to a metallic state (oxidation state 0) by the high-temperature (873 K) ethane and CO2 reaction mixture. Consequently, the XANES spectrum shifts from an oxide-like profile to a purely metallic profile, reflecting the formation of small, fully reduced Ni-rich NiFe alloy particles. | The answer must state that the spectrum under reaction conditions matches the metallic features of a Ni foil reference, distinguishing it from the fresh catalyst which resembles the spectrum of standard NiO. |
Review
New Role of Pd Hydride as a Sensor of Surface Pd Distributions in Pd−Au Catalysts
BNL-NSLS-II-8-ID
Catalyst
Erjia Guan et al.
DOI: 10.1002/cctc.201901847
3 scenarios
▶
#138
Pd
Pd K
▶
LLM Prompt
Sample Information
Material: Pd
Support: SiO2
Reaction Conditions: ambient
Sample-Specific Conditions
- treatment: as-prepared
- Silica supported monometallic Pd nanoparticles before treatment
Measurement
We plan to measure the Pd K XANES spectrum of this sample.
Questions
Based on all the information above:
1. Based on the sample conditions (as-prepared monometallic Pd nanoparticles on silica), what is the expected dominant phase of Pd, and why does it form this phase?
2. What primary reference spectrum would be essential to include as a basis function if you were to analyze the XANES spectrum of this as-prepared sample?
Ground Truth
Material: Pd
Measurement: Pd K-edge, fluorescence mode, 8-ID (ISS) beamline of the National Synchrotron Light Source
Fit method: not reported
Phase fractions: (±10%)
| Phase | Fraction |
|---|---|
| palladium_oxide | 1.0 |
Fit basis (paper's reference spectra):
- Pd oxide
Source evidence: Page 3, text: 'XANES at Pd K-edge showed that Pd is in the form of Pd oxides in the as-prepared silica supported Pd NPs (Figure S2A).'
Key reasoning: The as-prepared monometallic Pd nanoparticles are fully oxidized because pure Pd is susceptible to oxidation during the calcination step of catalyst preparation. This contrasts with Pd-Au alloy phases, which are more resistant to oxidation under the same conditions.
Reasoning source: Page 4, top left paragraph
Scoring Rubric (total: 100 pts)
| Q | Type | Max | Question | Reference Answer | Scoring Criteria |
|---|---|---|---|---|---|
| q1 | reasoning | 67 | Based on the sample conditions (as-prepared monometallic Pd nanoparticles on silica), what is the expected dominant phase of Pd, and why does it form this phase? | The expected dominant phase of Pd in this sample is palladium oxide, which accounts for 100% of the composition. This fully oxidized state occurs because pure monometallic Pd nanoparticles are highly susceptible to oxidation during the calcination step of catalyst preparation. Consequently, under these as-prepared, ambient conditions, the pure Pd completely oxidizes, a behavior that contrasts with more oxidation-resistant alloy phases like Pd-Au. | Full points for identifying Pd oxide as the dominant phase and explaining that pure Pd is susceptible to oxidation during the calcination step of catalyst preparation. |
| q3 | identification | 33 | What primary reference spectrum would be essential to include as a basis function if you were to analyze the XANES spectrum of this as-prepared sample? | A Pd oxide reference spectrum would be essential to include as the primary basis function for analyzing this XANES spectrum. This is necessary because the as-prepared silica-supported monometallic Pd nanoparticles exist entirely as palladium oxide (1.0 fraction). This complete oxidation is expected given the sample conditions, as pure Pd is highly susceptible to oxidation during the calcination step of catalyst preparation, unlike more resistant alloy phases. | Full points for identifying Pd oxide as the necessary reference spectrum. |
Review
#139
Pd
Pd K
▶
LLM Prompt
Sample Information
Material: Pd
Support: SiO2
Reaction Conditions: flowing He at 298 K, 1 atm
Sample-Specific Conditions
- treatment: reduced
- Silica supported monometallic Pd nanoparticles after reduction
Measurement
We plan to measure the Pd K XANES spectrum of this sample.
Questions
Based on all the information above:
1. Based on the pretreatment conditions (H2 at 573 K for 30 min followed by a He purge), what is the expected oxidation state and dominant phase of the Pd nanoparticles during the measurement under flowing He at 298 K, and what is the physical reasoning for this state?
Ground Truth
Material: Pd
Measurement: Pd K-edge XANES in fluorescence mode at 8-ID (ISS) beamline
Fit method: EXAFS fitting (used to confirm metallic state; XANES LCF not explicitly performed)
Phase fractions: (±10%)
| Phase | Fraction |
|---|---|
| metallic_palladium | 1.0 |
Fit basis (paper's reference spectra):
- Pd foil
Source evidence: Page 4, text below Figure 2 and Table 1
Key reasoning: The Pd NPs were pretreated by H2 at 573 K for 30 min, followed by a He purge, to fully reduce Pd oxides to the metallic form. The subsequent measurement under He at 298 K maintains this pure metallic state, preventing the formation of Pd hydride which occurs at room temperature under H2. EXAFS analysis confirmed a Pd-Pd coordination number of 9.2 at a distance of 2.737 Å, consistent with nanoscale metallic Pd.
Reasoning source: Page 4, text below Figure 2
Scoring Rubric (total: 100 pts)
| Q | Type | Max | Question | Reference Answer | Scoring Criteria |
|---|---|---|---|---|---|
| q1 | reasoning | 100 | Based on the pretreatment conditions (H2 at 573 K for 30 min followed by a He purge), what is the expected oxidation state and dominant phase of the Pd nanoparticles during the measurement under flowing He at 298 K, and what is the physical reasoning for this state? | The expected oxidation state of the sample is 0, with the dominant phase being 100% metallic palladium. This state arises because the pretreatment with H2 at 573 K for 30 minutes fully reduces any initial palladium oxides into the metallic form. The subsequent purge and measurement under flowing He at 298 K maintains this pure metallic state by preventing the formation of palladium hydride, which would otherwise occur at room temperature in the presence of H2. Consequently, the sample remains entirely nanoscale metallic Pd, as evidenced by a Pd-Pd coordination number of 9.2 and a bond distance of 2.737 Å. | Full credit if the answer identifies metallic Pd (oxidation state 0, fraction 1.0) and explains that the high-temperature H2 treatment fully reduces the initial oxides, while the He purge prevents the room-temperature formation of Pd hydride. |
Review
#140
Pd
Pd K
▶
LLM Prompt
Sample Information
Material: Pd
Support: SiO2
Reaction Conditions: flowing H2 at 298 K, 1 atm
Sample-Specific Conditions
- gas environment: H2
- Reduced Pd nanoparticles exposed to hydrogen at room temperature
Measurement
We plan to measure the Pd K XANES spectrum of this sample.
Questions
Based on all the information above:
1. Under the specified conditions (flowing H2 at 298 K, 1 atm), what is the dominant phase of the Pd nanoparticles, and what is the physical reasoning for its formation?
2. How does the formation of this phase manifest in the XANES spectrum compared to the spectrum of metallic Pd?
Ground Truth
Material: Pd
Measurement: Pd K-edge in fluorescence mode at 8-ID (ISS) beamline of NSLS-II
Fit method: not reported
Phase fractions: (±10%)
| Phase | Fraction |
|---|---|
| Pd hydride | 1.0 |
Source evidence: Page 4 and 5, text
Key reasoning: Exposure of reduced Pd nanoparticles to flowing H2 at 298 K and 1 bar leads to the formation of Pd hydride. This is evidenced by a significant shift in the XANES spectrum and an increase in the Pd-Pd bond distance from 2.737 Å to 2.810 Å, which is typical for lattice expansion from Pd to Pd hydride. The calculated H/Pd ratio for these nanoparticles is 0.45.
Reasoning source: Page 4 and 5, text
Scoring Rubric (total: 100 pts)
| Q | Type | Max | Question | Reference Answer | Scoring Criteria |
|---|---|---|---|---|---|
| q1 | reasoning | 57 | Under the specified conditions (flowing H2 at 298 K, 1 atm), what is the dominant phase of the Pd nanoparticles, and what is the physical reasoning for its formation? | The dominant phase of the Pd nanoparticles is Pd hydride (PdHx, with x~0.45), which constitutes a fraction of 1.0. This phase forms because the reduced Pd nanoparticles are exposed to flowing H2 gas at room temperature (298 K) and 1 atm. Under these specific conditions, hydrogen incorporates into the Pd lattice, leading to a lattice expansion where the Pd-Pd bond distance increases from 2.737 Å to 2.810 Å. This structural expansion and hydrogen uptake result in the complete conversion of the metallic nanoparticles into the Pd hydride phase. | Full points for identifying Pd hydride as the dominant phase and explaining that H2 exposure at room temperature leads to hydrogen absorption and hydride formation. |
| q2 | spectral | 43 | How does the formation of this phase manifest in the XANES spectrum compared to the spectrum of metallic Pd? | The formation of this phase manifests as a significant shift in the XANES spectrum relative to the spectrum of metallic Pd measured under He. This spectral change occurs because exposing the reduced Pd nanoparticles to flowing H2 at 298 K and 1 atm causes hydrogen to enter the metal lattice, forming Pd hydride (PdHx, x~0.45). The incorporation of hydrogen induces a lattice expansion, increasing the Pd-Pd bond distance from 2.737 Å to 2.810 Å. This structural expansion and the resulting electronic changes from hydride formation directly produce the observed significant shift in the XANES spectral features. | Full points for stating that a significant shift is observed in the XANES spectrum compared to metallic Pd. |
Review
Gold Catalysts Synthesized Using a Modified Incipient Wetness Impregnation Method for Propylene Epoxidation
APS
Catalyst
Zheng Lu et al.
DOI: 10.1002/cctc.202001053
1 scenario
▶
#141
Au/TS-1
Au L3
▶
LLM Prompt
Sample Information
Material: Au/TS-1
Support: TS-1
Sample-Specific Conditions
- preparation method: mIWI
- Gold catalyst prepared by modified incipient wetness impregnation
Measurement
We plan to measure the Au L3 XANES spectrum of this sample.
Questions
Based on all the information above:
1. What is the dominant phase of gold in this Au/TS-1 catalyst prepared by the modified incipient wetness impregnation (mIWI) method, and what reference spectrum is needed to confirm this?
2. What spectral evidence from the Au L3-edge XANES indicates the oxidation state of the gold in this catalyst?
3. Describe the expected spectral shape and distinguishing features of the Au L3-edge XANES spectrum for this sample.
Ground Truth
Material: Au/TS-1
Measurement: Au L3-edge, fluorescence mode, beamline 9-BM at Advanced Photon Source (APS)
Fit method: qualitative comparison
Phase fractions:
| Phase | Fraction |
|---|---|
| metallic Au | 1.0 |
Fit basis (paper's reference spectra):
- Au foil
Source evidence: Page 3, Figure 3(a)
Key reasoning: The Au L3 XANES spectra of the catalysts are identical to the Au foil reference spectrum, indicating that the gold in the catalysts is in the metallic state.
Reasoning source: Page 3, Results and Discussion
Scoring Rubric (total: 100 pts)
| Q | Type | Max | Question | Reference Answer | Scoring Criteria |
|---|---|---|---|---|---|
| q1 | identification | 30 | What is the dominant phase of gold in this Au/TS-1 catalyst prepared by the modified incipient wetness impregnation (mIWI) method, and what reference spectrum is needed to confirm this? | The dominant phase of gold in this sample is metallic Au, which accounts for a fraction of 1.0. To confirm this, an Au foil reference spectrum is needed for qualitative comparison. This fully metallic phase arises because the modified incipient wetness impregnation (mIWI) preparation method on the TS-1 support results in the complete reduction of gold. Consequently, these specific preparation conditions yield a fully reduced metallic state without any significant cationic Au species remaining in the catalyst. | 15 points for identifying metallic Au as the dominant phase, 15 points for stating Au foil is the necessary reference spectrum. |
| q2 | reasoning | 40 | What spectral evidence from the Au L3-edge XANES indicates the oxidation state of the gold in this catalyst? | The primary spectral evidence is that the Au L3 XANES spectrum of the catalyst is identical to the Au foil reference spectrum. This direct match indicates that the gold in the catalyst is in a metallic state with an oxidation state of 0. This specific oxidation state is achieved because the modified incipient wetness impregnation (mIWI) method used to prepare the Au/TS-1 sample fully reduces the gold. As a result of these preparation conditions, the catalyst lacks significant cationic Au species, leading to a purely metallic spectral signature. | 20 points for stating the spectrum is identical to the Au foil reference, 20 points for concluding this indicates an oxidation state of 0 (metallic state). |
| q3 | spectral | 30 | Describe the expected spectral shape and distinguishing features of the Au L3-edge XANES spectrum for this sample. | The Au L3-edge XANES spectrum for this sample exhibits an edge position at approximately 11919 eV and a spectral shape identical to that of bulk Au foil. Its distinguishing feature is the characteristic profile of metallic gold, indicating a fully reduced state without significant cationic Au species. These spectral features arise because the modified incipient wetness impregnation (mIWI) method used to synthesize the Au/TS-1 catalyst completely reduces the gold. Consequently, the electronic and structural properties of the gold deposited on the TS-1 support mirror those of bulk metallic gold, producing a spectrum that perfectly matches the Au foil reference. | 15 points for stating the spectrum is identical to bulk Au foil, 15 points for noting it indicates a fully reduced metallic state without cationic species. |
Review
In‐situ IR Spectroscopy Study of Reactions of C3 Oxygenates on Heteroatom (Sn, Mo, and W) doped BEA Zeolites and the Effect of Co‐adsorbed Water
BNL-NSLS-II-8-ID
Catalyst
Sean Najmi et al.
DOI: 10.1002/cctc.202001424
2 scenarios
▶
#142
Mo-BEA
Mo K
▶
LLM Prompt
Sample Information
Material: Mo-BEA
Support: BEA zeolite
Reaction Conditions: 10 sccm He flow, room temperature
Sample-Specific Conditions
- Temperature: 25 °C
- Mo-BEA zeolite treated in He at room temperature
Measurement
We plan to measure the Mo K XANES spectrum of this sample.
Questions
Based on all the information above:
1. For the Mo-BEA sample treated in He at room temperature, what reference spectra should be used for linear combination fitting of the Mo K-edge XANES spectrum, and what are the expected phase fractions?
2. Based on the sample conditions (Mo-BEA at room temperature in He), explain the physical state and coordination environment of the Mo species that lead to the observed average oxidation state.
Ground Truth
Material: Mo-BEA
Measurement: Mo K-edge in-situ XAS in fluorescence mode at 8-ID (ISS) beamline
Fit method: Linear combination fitting (LCF)
Phase fractions:
| Phase | Fraction |
|---|---|
| MoO3 | 0.8 |
| MoO2 | 0.2 |
Fit basis (paper's reference spectra):
- MoO3
- MoO2
Source evidence: Page 6, 'XANES and EXAFS of Mo-BEA Catalyst'
Key reasoning: The Mo-BEA sample at room temperature exhibits an edge energy (E0) of 20004.2 eV. Linear combination fitting of the XANES spectrum using MoO3 (Mo6+) and MoO2 (Mo4+) standards indicated an average oxidation state of 5.6. This corresponds to a phase fraction of 80% Mo(VI) and 20% Mo(IV). At this temperature, the majority of the Mo atoms are coordinated to OH groups in the zeolite framework.
Reasoning source: Page 6, 'XANES and EXAFS of Mo-BEA Catalyst' and Page 12, 'Tuning the strength of Lewis acid sites by incorporating metals into BEA zeolites'
Scoring Rubric (total: 100 pts)
| Q | Type | Max | Question | Reference Answer | Scoring Criteria |
|---|---|---|---|---|---|
| q1 | quantification | 57 | For the Mo-BEA sample treated in He at room temperature, what reference spectra should be used for linear combination fitting of the Mo K-edge XANES spectrum, and what are the expected phase fractions? | For the linear combination fitting of the Mo K-edge XANES spectrum, MoO3 and MoO2 should be used as reference spectra. The expected phase fractions are 80% MoO3 and 20% MoO2. These specific fractions result from the sample conditions (Mo-BEA treated in He at 25 °C), which produce an edge energy of 20004.2 eV and an average oxidation state of 5.6. This predominantly Mo(VI) state, with a minor Mo(IV) component, arises because at room temperature the majority of the Mo atoms are coordinated to OH groups within the zeolite framework. | Full points for identifying MoO3 and MoO2 as reference spectra and estimating fractions of ~0.8 for MoO3 and ~0.2 for MoO2 (or an average oxidation state of ~5.6). |
| q2 | reasoning | 43 | Based on the sample conditions (Mo-BEA at room temperature in He), explain the physical state and coordination environment of the Mo species that lead to the observed average oxidation state. | Under the sample conditions of 25 °C in a 10 sccm He flow, the Mo-BEA sample exhibits an average oxidation state of 5.6, corresponding to an edge energy of 20004.2 eV. This state is physically represented by a mixture of 80% Mo(VI) and 20% Mo(IV) species, which are modeled using MoO3 and MoO2 references. This specific oxidation state and phase distribution occur because, at room temperature, the majority of the Mo atoms are coordinated to OH groups in the BEA zeolite framework. This specific coordination environment stabilizes the predominantly high Mo(VI) oxidation state while maintaining a minor fraction of Mo(IV). | Full points for mentioning that Mo is predominantly in the +6 oxidation state (average 5.6) and that the majority of Mo atoms are coordinated to OH groups in the zeolite framework at room temperature. |
Review
#143
Mo-BEA
Mo K
▶
LLM Prompt
Sample Information
Material: Mo-BEA
Support: BEA zeolite
Reaction Conditions: 10 sccm He flow, 400 °C
Sample-Specific Conditions
- Temperature: 400 °C
- Mo-BEA zeolite treated in He at 400 °C
Measurement
We plan to measure the Mo K XANES spectrum of this sample.
Questions
Based on all the information above:
1. What candidate reference spectra are appropriate for linear combination fitting of the Mo K-edge XANES data for the Mo-BEA catalyst treated in He at 400 °C?
2. Based on the sample conditions (heating to 400 °C in an inert He flow), estimate the phase fractions of the Mo species and the resulting average oxidation state.
3. Explain the physical and structural reasons for the change in Mo oxidation state when the Mo-BEA sample is heated to 400 °C in an inert environment.
Ground Truth
Material: Mo-BEA
Measurement: Mo K-edge in-situ XAS in fluorescence mode at 8-ID (ISS) beamline
Fit method: Linear combination fitting (LCF)
Phase fractions:
| Phase | Fraction |
|---|---|
| MoO3 | 0.65 |
| MoO2 | 0.35 |
Fit basis (paper's reference spectra):
- MoO3
- MoO2
Source evidence: Page 6, Section 'XANES and EXAFS of Mo-BEA Catalyst'; Page 15, Section 'In-situ XAS experiments'
Key reasoning: Heating Mo-BEA to 400 °C in an inert He environment causes a partial reduction of the Mo species. The Mo K-edge energy decreases from 20004.2 eV at room temperature to 20002.5 eV at 400 °C. Linear combination fitting using MoO3 (Mo6+) and MoO2 (Mo4+) standards indicates the average oxidation state decreases to 5.3 at 400 °C. An average oxidation state of 5.3 corresponds to a mixture of 65% Mo(VI) and 35% Mo(IV). Structurally, this thermal activation triggers the loss of water, converting Mo-OH species into Mo=O and Mo-O-framework species.
Reasoning source: Page 6 (XANES and EXAFS of Mo-BEA Catalyst) and Page 12 (Discussion: Tuning the strength of Lewis acid sites by incorporating metals into BEA zeolites)
Scoring Rubric (total: 101 pts)
| Q | Type | Max | Question | Reference Answer | Scoring Criteria |
|---|---|---|---|---|---|
| q1 | identification | 25 | What candidate reference spectra are appropriate for linear combination fitting of the Mo K-edge XANES data for the Mo-BEA catalyst treated in He at 400 °C? | The appropriate candidate reference spectra for linear combination fitting of this sample are MoO3 and MoO2. These specific references are required because heating the Mo-BEA zeolite to 400 °C in an inert He flow causes a partial reduction of the Mo species. During this thermal activation, the loss of water converts Mo-OH species into Mo=O and Mo-O-framework species. Consequently, the sample develops a mixture of Mo(VI) and Mo(IV) oxidation states, which are accurately represented by the MoO3 and MoO2 standards, respectively. | Full credit for identifying MoO3 and MoO2 (or Mo(VI) and Mo(IV) oxides) as the necessary reference standards. |
| q2 | quantification | 38 | Based on the sample conditions (heating to 400 °C in an inert He flow), estimate the phase fractions of the Mo species and the resulting average oxidation state. | The estimated phase fractions for the Mo-BEA sample are 65% MoO3 and 35% MoO2, resulting in an average Mo oxidation state of 5.3. These specific values arise because heating the sample to 400 °C in an inert He environment induces a partial reduction of the molybdenum species. This thermal activation triggers the loss of water, converting Mo-OH species into Mo=O and Mo-O-framework species, which causes the Mo K-edge energy to decrease to 20002.5 eV. This specific edge shift reflects the formation of a 65% Mo(VI) and 35% Mo(IV) mixture, yielding the final average oxidation state of 5.3. | Full credit for estimating an average oxidation state of ~5.3, corresponding to approximately 65% MoO3 (Mo6+) and 35% MoO2 (Mo4+). |
| q3 | reasoning | 38 | Explain the physical and structural reasons for the change in Mo oxidation state when the Mo-BEA sample is heated to 400 °C in an inert environment. | When the Mo-BEA sample is heated to 400 °C in an inert He flow, the thermal activation triggers the loss of water from the material. This dehydration process structurally converts the existing Mo-OH species into Mo=O and Mo-O-framework species. This structural transformation drives a partial reduction of the molybdenum, which is evidenced by the Mo K-edge energy decreasing from 20004.2 eV at room temperature to 20002.5 eV at 400 °C. Ultimately, this mechanism results in the average oxidation state dropping to 5.3, corresponding to a mixture of 65% Mo(VI) and 35% Mo(IV). | Full credit for explaining that thermal treatment in an inert environment causes a partial reduction of Mo species, driven by the loss of water (dehydration), which converts Mo-OH species into Mo=O and Mo-O-framework species. |
Review
In‐situ XAS Study of Catalytic N2O Decomposition Over CuO/CeO2 Catalysts
ESRF-BM23
Catalyst
Maxim Zabilskiy et al.
DOI: 10.1002/cctc.202001829
8 scenarios
▶
#144
CuO/CeO2
Cu K
▶
LLM Prompt
Sample Information
Material: CuO/CeO2
Support: CeO2 nanorods
Sample-Specific Conditions
- Condition: Initial (25 °C)
- 2 wt.% Cu on CeO2 nanorods, initial state
Measurement
We plan to measure the Cu K XANES spectrum of this sample.
Questions
Based on all the information above:
1. If performing a Linear Combination Fit (LCF) to track the evolution of this sample during subsequent heating and reaction, what specific reference spectra (basis functions) should be included in the model to capture all potential Cu oxidation states?
Ground Truth
Material: 2 wt.% Cu on CeO2 nanorods (2Cu_CeO2-R)
Measurement: in-situ Cu K-edge XANES in transmission mode
Fit method: Linear combination fit (LCF)
Phase fractions:
| Phase | Fraction |
|---|---|
| Cu2+ | 1.0 |
Fit basis (paper's reference spectra):
- 2Cu_CeO2-R at RT (reference for Cu2+)
- 8Cu_CeO2-R at RT (reference for Cu2+)
- Cu2O nanoparticles (reference for Cu+)
- Cu metal nanoparticles (reference for Cu0)
Source evidence: Figure 4, Page 18; Section 3.3, Page 16
Key reasoning: At room temperature before any catalytic reaction or heating, the energy position of the Cu K-edge in all Cu-modified CeO2 catalysts coincides with the energy position of Cu2+ reference compounds. Therefore, all copper is present exclusively in the divalent form (Cu2+) as CuO nanoparticles or amorphous oxide species attached to the CeO2 surface.
Reasoning source: Section 3.3, Pages 16 and 18
Scoring Rubric (total: 100 pts)
| Q | Type | Max | Question | Reference Answer | Scoring Criteria |
|---|---|---|---|---|---|
| q2 | identification | 100 | If performing a Linear Combination Fit (LCF) to track the evolution of this sample during subsequent heating and reaction, what specific reference spectra (basis functions) should be included in the model to capture all potential Cu oxidation states? | To perform a Linear Combination Fit (LCF) tracking the evolution of this sample, the basis functions must include 2Cu_CeO2-R at RT (Cu2+ reference), 8Cu_CeO2-R at RT (Cu2+ reference), Cu2O nanoparticles (Cu+ reference), and Cu metal nanoparticles (Cu0 reference). These specific references are necessary because, at the initial 25 °C state before any heating or reaction, the 2 wt.% Cu on CeO2 nanorods exists exclusively as divalent copper (Cu2+) in the form of CuO nanoparticles or amorphous oxide species. As the sample is subjected to subsequent heating and catalytic reactions, this initial Cu2+ state can undergo reduction. Including the Cu2O (Cu+) and Cu metal (Cu0) references alongside the initial Cu2+ references ensures that all potential intermediate and fully reduced oxidation states evolving from the initial room-temperature conditions are accurately captured. | Full points for listing references for Cu2+ (e.g., initial RT samples), Cu+ (Cu2O nanoparticles), and Cu0 (Cu metal nanoparticles). |
Review
#145
CuO/CeO2
Cu K
▶
LLM Prompt
Sample Information
Material: CuO/CeO2
Support: CeO2 nanorods
Reaction Conditions: He at 400 °C
Sample-Specific Conditions
- Condition: He at 400 °C
- 2 wt.% Cu on CeO2 nanorods, heated in He
Measurement
We plan to measure the Cu K XANES spectrum of this sample.
Questions
Based on all the information above:
1. Based on the sample conditions (2 wt.% Cu on CeO2 nanorods, heated in He to 400 °C), what reference spectra should be included in a linear combination fit (LCF) analysis of the Cu K-edge XANES to capture the possible oxidation states?
2. Estimate the phase fractions of the copper species present in this sample after heating in He to 400 °C.
3. Explain the physical reasoning for why this specific sample (2 wt.% Cu on CeO2 nanorods) exhibits this specific phase composition when heated in He at 400 °C, particularly in comparison to samples with higher copper loadings.
Ground Truth
Material: 2 wt.% Cu on CeO2 nanorods (2Cu_CeO2-R)
Measurement: in-situ Cu K-edge XANES in transmission mode
Fit method: Linear combination fit (LCF)
Phase fractions:
| Phase | Fraction |
|---|---|
| Cu2+ | 0.9 |
| Cu+ | 0.1 |
Fit basis (paper's reference spectra):
- 8Cu_CeO2-R at RT (reference for Cu2+)
- 2Cu_CeO2-R at RT (reference for Cu2+)
- Cu2O nanoparticles (reference for Cu+)
- Cu metal nanoparticles (reference for Cu0)
Source evidence: Figure 4, page 18; Section 3.3, page 19
Key reasoning: During heating in He at 400 °C, the 2Cu_CeO2-R sample undergoes very limited reduction, reaching an equilibrium state with about 10% Cu+ and 90% Cu2+, without forming metallic copper. This contrasts with higher Cu loading samples (e.g., 4 wt.% and 8 wt.%) that reduce extensively to Cu0 under the same conditions. The high dispersion of Cu (1.8 nm particles) in the 2 wt.% sample results in a higher fraction of Cu-O-Ce bonds at the copper-ceria interface. These small CuO clusters are actually more difficult to reduce than larger crystallites due to strong electronic metal-support interactions (EMSI).
Reasoning source: Section 3.3, pages 19 and 26
Scoring Rubric (total: 100 pts)
| Q | Type | Max | Question | Reference Answer | Scoring Criteria |
|---|---|---|---|---|---|
| q1 | identification | 30 | Based on the sample conditions (2 wt.% Cu on CeO2 nanorods, heated in He to 400 °C), what reference spectra should be included in a linear combination fit (LCF) analysis of the Cu K-edge XANES to capture the possible oxidation states? | The linear combination fit (LCF) analysis should include reference spectra for Cu2+ (such as 8Cu_CeO2-R at RT and 2Cu_CeO2-R at RT), Cu+ (Cu2O nanoparticles), and Cu0 (Cu metal nanoparticles). These references are necessary because heating the 2 wt.% Cu on CeO2 nanorods in He at 400 °C induces a partial reduction of the copper species. Specifically, the low copper loading leads to high dispersion (1.8 nm particles) and a high fraction of Cu-O-Ce bonds at the interface. Due to strong electronic metal-support interactions (EMSI), these small CuO clusters undergo very limited reduction, requiring references for the dominant Cu2+ state, the minor Cu+ state formed, and Cu0 to confirm the absence of metallic copper. | Full credit for identifying Cu2+ (e.g., initial state CuO), Cu+ (e.g., Cu2O), and Cu0 (metallic Cu) as the necessary basis components for modeling the potential reduction states. |
| q2 | quantification | 30 | Estimate the phase fractions of the copper species present in this sample after heating in He to 400 °C. | After heating in He to 400 °C, the copper species in the sample consist of approximately 90% Cu2+ and 10% Cu+, with no metallic copper (Cu0) present. These specific fractions result from the very limited reduction that occurs for the 2 wt.% Cu loading under these thermal conditions. Because the copper is highly dispersed as 1.8 nm particles on the CeO2 nanorods, there is a high fraction of Cu-O-Ce bonds at the copper-ceria interface. This strong electronic metal-support interaction (EMSI) makes these small CuO clusters much more difficult to reduce compared to larger crystallites, halting the reduction process at a minor Cu+ fraction and preventing the formation of Cu0. | Full credit for estimating ~90% Cu2+ (CuO) and ~10% Cu+ (Cu2O), with no metallic Cu0. |
| q3 | reasoning | 40 | Explain the physical reasoning for why this specific sample (2 wt.% Cu on CeO2 nanorods) exhibits this specific phase composition when heated in He at 400 °C, particularly in comparison to samples with higher copper loadings. | When heated in He at 400 °C, the 2 wt.% Cu on CeO2 nanorods sample reaches an equilibrium state of about 90% Cu2+ and 10% Cu+, avoiding the extensive reduction to Cu0 seen in higher loading samples like 4 wt.% and 8 wt.%. This limited reduction occurs because the low 2 wt.% loading results in a very high dispersion of copper, forming ultra-small 1.8 nm particles. Consequently, a higher fraction of Cu-O-Ce bonds forms at the copper-ceria interface. The resulting strong electronic metal-support interactions (EMSI) stabilize the oxidized states, making these small CuO clusters significantly more difficult to reduce than the larger crystallites present in higher-loading samples. | Full credit for explaining that the highly dispersed small CuO clusters have a higher fraction of Cu-O-Ce bonds, making them more difficult to reduce than larger crystallites due to strong electronic metal-support interactions (EMSI), resulting in only partial reduction to Cu+ and no metallic Cu. |
Review
#146
CuO/CeO2
Cu K
▶
LLM Prompt
Sample Information
Material: CuO/CeO2
Support: CeO2 nanorods
Reaction Conditions: He at 400 °C
Sample-Specific Conditions
- Condition: He at 400 °C
- 4 wt.% Cu on CeO2 nanorods, heated in He
Measurement
We plan to measure the Cu K XANES spectrum of this sample.
Questions
Based on all the information above:
1. Based on the sample conditions (4 wt.% Cu on CeO2 nanorods, heated in He at 400 °C), what candidate reference spectra or basis functions are required to accurately model the Cu K-edge XANES spectrum using Linear Combination Fitting?
2. Explain the physical reasoning for why this specific catalyst (4 wt.% Cu on CeO2 nanorods) reaches this degree of reduction when heated in an inert atmosphere at 400 °C, and how it contrasts with lower Cu loadings or different ceria morphologies.
Ground Truth
Material: 4 wt.% Cu on CeO2 nanorods (4Cu_CeO2-R)
Measurement: in-situ Cu K-edge XANES in transmission mode
Fit method: Linear combination fit (LCF)
Phase fractions:
| Phase | Fraction |
|---|---|
| Cu2+ | 0.05 |
| Cu0 | 0.88 |
| Cu+ | 0.07 |
Fit basis (paper's reference spectra):
- 8Cu_CeO2-R at RT (reference for Cu2+)
- 2Cu_CeO2-R at RT (reference for Cu2+)
- Cu2O nanoparticles (reference for Cu+)
- Cu metal nanoparticles (reference for Cu0)
Source evidence: Figure 4, Page 18
Key reasoning: During heating in He at 400 °C, the 4Cu_CeO2-R catalyst undergoes extensive reduction, converting the vast majority of the initial Cu2+ species into metallic Cu0 nanoparticles. The CeO2 nanorod support with higher Cu loadings facilitates this significant reduction, unlike lower Cu loadings (e.g., 2 wt.%) or nanocube supports where small CuO clusters with a higher fraction of Cu-O-Ce bonds are more difficult to reduce. A small fraction of Cu+ and unreduced Cu2+ remains in the sample.
Reasoning source: Section 3.3, Pages 19 and 26
Scoring Rubric (total: 100 pts)
| Q | Type | Max | Question | Reference Answer | Scoring Criteria |
|---|---|---|---|---|---|
| q1 | identification | 33 | Based on the sample conditions (4 wt.% Cu on CeO2 nanorods, heated in He at 400 °C), what candidate reference spectra or basis functions are required to accurately model the Cu K-edge XANES spectrum using Linear Combination Fitting? | To accurately model the Cu K-edge XANES spectrum using Linear Combination Fitting, the required reference spectra include 8Cu_CeO2-R at RT (for Cu2+), 2Cu_CeO2-R at RT (for Cu2+), Cu2O nanoparticles (for Cu+), and Cu metal nanoparticles (for Cu0). These specific basis functions are necessary because heating the 4 wt.% Cu on CeO2 nanorods in He at 400 °C causes extensive reduction of the initial Cu2+ species. The higher Cu loading on the nanorod support facilitates this significant reduction into predominantly metallic Cu0 nanoparticles, while leaving behind small fractions of intermediate Cu+ and unreduced Cu2+. Therefore, references for all three oxidation states (Cu0, Cu+, and Cu2+) are required to capture the complete speciation of the sample under these thermal conditions. | Full points for identifying the need for Cu2+ (e.g., initial state CuO/CeO2), Cu+ (e.g., Cu2O), and Cu0 (metallic Cu) reference spectra. |
| q3 | reasoning | 67 | Explain the physical reasoning for why this specific catalyst (4 wt.% Cu on CeO2 nanorods) reaches this degree of reduction when heated in an inert atmosphere at 400 °C, and how it contrasts with lower Cu loadings or different ceria morphologies. | When the 4 wt.% Cu on CeO2 nanorods catalyst is heated in an inert He atmosphere at 400 °C, it undergoes extensive reduction to form predominantly metallic Cu0 nanoparticles (88%), alongside minor fractions of Cu+ (7%) and Cu2+ (5%). This high degree of reduction occurs because the CeO2 nanorod support combined with the higher 4 wt.% Cu loading facilitates the conversion of the initial Cu2+ species. In contrast, catalysts with lower Cu loadings (such as 2 wt.%) or those supported on ceria nanocubes form smaller CuO clusters that possess a higher fraction of Cu-O-Ce bonds. These strong interfacial Cu-O-Ce bonds make the copper species significantly more difficult to reduce under the same thermal conditions. Consequently, the specific combination of nanorod morphology and higher copper loading is responsible for the vast majority of the copper reducing to the metallic state. | Full points for explaining that higher Cu loadings on nanorods reduce extensively to metallic Cu, whereas lower loadings or nanocube supports contain smaller CuO clusters with a higher fraction of Cu-O-Ce bonds that are more difficult to reduce. |
Review
#147
CuO/CeO2
Cu K
▶
LLM Prompt
Sample Information
Material: CuO/CeO2
Support: CeO2 nanorods
Reaction Conditions: 2500 ppm N2O in He at 400 °C
Sample-Specific Conditions
- Condition: N2O at 400 °C
- 4 wt.% Cu on CeO2 nanorods, during N2O decomposition
Measurement
We plan to measure the Cu K XANES spectrum of this sample.
Questions
Based on all the information above:
1. Based on the reaction conditions (steady-state N2O decomposition at 400 °C), what copper oxidation states and phases are expected to be present in the 4Cu_CeO2-R catalyst, and what are their approximate fractions?
2. What reference spectra or basis functions should be included in a Linear Combination Fit (LCF) analysis to accurately model the Cu K-edge XANES spectrum of this sample across different reaction stages?
3. Explain the physical reasoning for why this specific mixture of copper oxidation states is observed during steady-state N2O decomposition at 400 °C.
Ground Truth
Material: 4 wt.% Cu on CeO2 nanorods (4Cu_CeO2-R)
Measurement: in-situ Cu K-edge XANES in transmission mode
Fit method: Linear combination fit (LCF)
Phase fractions:
| Phase | Fraction |
|---|---|
| Cu2+ | 0.87 |
| Cu+ | 0.13 |
Fit basis (paper's reference spectra):
- 8Cu_CeO2-R at RT (reference for Cu2+)
- 2Cu_CeO2-R at RT (reference for Cu2+)
- Cu2O nanoparticles (reference for Cu+)
- Cu metal nanoparticles (reference for Cu0)
Source evidence: Figure 4, page 18
Key reasoning: During the catalytic reaction of N2O decomposition at 400 °C, the previously reduced copper species are mostly re-oxidized back to the Cu2+ state by the N2O oxidant. However, a small fraction (about 13%) of Cu+ remains under steady-state conditions, confirming the dynamic participation of the Cu2+/Cu+ redox pair in the catalytic cycle.
Reasoning source: Section 3.3, page 19 and Section 3.4, page 28
Scoring Rubric (total: 100 pts)
| Q | Type | Max | Question | Reference Answer | Scoring Criteria |
|---|---|---|---|---|---|
| q1 | quantification | 40 | Based on the reaction conditions (steady-state N2O decomposition at 400 °C), what copper oxidation states and phases are expected to be present in the 4Cu_CeO2-R catalyst, and what are their approximate fractions? | Under steady-state N2O decomposition at 400 °C, the 4 wt.% Cu on CeO2 nanorods catalyst is expected to contain a mixture of Cu2+ and Cu+ oxidation states. Specifically, the approximate fractions are 87% Cu2+ and 13% Cu+. These specific values result from the reaction conditions because the 2500 ppm N2O environment acts as an oxidant at 400 °C, mostly re-oxidizing previously reduced copper species back to the Cu2+ state. However, the persistence of a 13% Cu+ fraction under these steady-state conditions occurs because the Cu2+/Cu+ redox pair dynamically participates in the catalytic cycle of N2O decomposition. | Award 20 points for identifying Cu2+ as the dominant phase and Cu+ as a minor phase. Award 20 points for estimating fractions near 85-90% for Cu2+ and 10-15% for Cu+. |
| q2 | identification | 30 | What reference spectra or basis functions should be included in a Linear Combination Fit (LCF) analysis to accurately model the Cu K-edge XANES spectrum of this sample across different reaction stages? | To accurately model the Cu K-edge XANES spectrum using a Linear Combination Fit (LCF), the basis functions should include 8Cu_CeO2-R at RT and 2Cu_CeO2-R at RT as references for Cu2+, Cu2O nanoparticles as a reference for Cu+, and Cu metal nanoparticles as a reference for Cu0. These specific reference phases are required because the 4 wt.% Cu on CeO2 nanorods catalyst undergoes dynamic redox changes during N2O decomposition at 400 °C. The N2O oxidant mostly re-oxidizes the copper to Cu2+, but a steady-state fraction of Cu+ remains due to the active Cu2+/Cu+ catalytic cycle. Including references for Cu2+, Cu+, and Cu0 ensures that all potential oxidation states involved in these dynamic redox transitions can be accurately captured and quantified. | Award 10 points each for identifying the need for a Cu2+ reference (e.g., initial state catalyst or CuO), a Cu+ reference (e.g., Cu2O), and a Cu0 reference (e.g., Cu metal foil or nanoparticles) to capture all potential states. |
| q3 | reasoning | 30 | Explain the physical reasoning for why this specific mixture of copper oxidation states is observed during steady-state N2O decomposition at 400 °C. | During steady-state N2O decomposition at 400 °C, the 4 wt.% Cu on CeO2 nanorods catalyst exhibits a specific mixture of 87% Cu2+ and 13% Cu+. This mixture arises because the 2500 ppm N2O environment acts as an oxidant, driving the re-oxidation of previously reduced copper species predominantly back to the Cu2+ state. However, complete oxidation does not occur; a small 13% fraction of Cu+ remains stable under these steady-state conditions. This specific balance of oxidation states is observed because the Cu2+/Cu+ redox pair dynamically participates in the catalytic cycle, requiring both states to be present to facilitate the continuous decomposition of N2O. | Award 15 points for explaining that N2O acts as a strong oxidant, re-oxidizing most of the copper back to Cu2+. Award 15 points for noting that the persistence of a small amount of Cu+ indicates its role as an active intermediate in the dynamic Cu2+/Cu+ redox cycle during the catalytic reaction. |
Review
#148
CuO/CeO2
Cu K
▶
LLM Prompt
Sample Information
Material: CuO/CeO2
Support: CeO2 nanorods
Reaction Conditions: He at 400 °C
Sample-Specific Conditions
- Condition: He at 400 °C
- 8 wt.% Cu on CeO2 nanorods, heated in He
Measurement
We plan to measure the Cu K XANES spectrum of this sample.
Questions
Based on all the information above:
1. What candidate reference spectra or basis functions are required to properly model the Cu K-edge XANES spectrum of this sample using linear combination fitting?
2. Explain the physical reasoning for the observed copper phase composition in this specific sample (8 wt.% Cu on CeO2 nanorods) under inert heating at 400 °C. Why does it reduce so extensively compared to samples with lower copper loadings?
Ground Truth
Material: 8 wt.% Cu on CeO2 nanorods (8Cu_CeO2-R)
Measurement: in-situ Cu K-edge XANES in transmission mode
Fit method: Linear combination fit (LCF)
Phase fractions:
| Phase | Fraction |
|---|---|
| Cu0 | 0.75 |
| Cu2+ | 0.2 |
| Cu+ | 0.05 |
Fit basis (paper's reference spectra):
- 8Cu_CeO2-R at RT (reference for Cu2+)
- 2Cu_CeO2-R at RT (reference for Cu2+)
- Cu2O nanoparticles (reference for Cu+)
- Cu metal nanoparticles (reference for Cu0)
Source evidence: Figure 4 and Section 3.3, pages 18-19
Key reasoning: During heating in an inert He atmosphere at 400 °C, the 8Cu_CeO2-R catalyst undergoes significant reduction. A major portion of Cu2+ (≈70–80 %) is reduced to metallic copper (Cu0). This extensive reduction occurs because the higher Cu loading results in larger CuO crystallites, which are easier to reduce than the highly dispersed small CuO clusters (which possess a higher fraction of Cu-O-Ce bonds) found in lower-loaded samples.
Reasoning source: Section 3.3, page 19 and page 26
Scoring Rubric (total: 100 pts)
| Q | Type | Max | Question | Reference Answer | Scoring Criteria |
|---|---|---|---|---|---|
| q1 | identification | 33 | What candidate reference spectra or basis functions are required to properly model the Cu K-edge XANES spectrum of this sample using linear combination fitting? | To properly model the Cu K-edge XANES spectrum using linear combination fitting, the required reference spectra are 8Cu_CeO2-R at RT (for Cu2+), 2Cu_CeO2-R at RT (for Cu2+), Cu2O nanoparticles (for Cu+), and Cu metal nanoparticles (for Cu0). These specific basis functions are necessary because heating the 8 wt.% Cu on CeO2 nanorods in an inert He atmosphere at 400 °C induces a significant reduction of the initial copper oxide. Specifically, the high 8 wt.% copper loading forms larger CuO crystallites that are much easier to reduce than highly dispersed clusters. Consequently, the sample transforms into a mixture dominated by metallic copper (Cu0), alongside residual Cu2+ and a minor Cu+ intermediate phase, necessitating this comprehensive set of oxidation state references. | Full credit requires identifying the need for references representing Cu2+ (e.g., the initial unreacted sample at RT), Cu+ (Cu2O nanoparticles), and Cu0 (Cu metal nanoparticles). |
| q3 | reasoning | 67 | Explain the physical reasoning for the observed copper phase composition in this specific sample (8 wt.% Cu on CeO2 nanorods) under inert heating at 400 °C. Why does it reduce so extensively compared to samples with lower copper loadings? | When the 8 wt.% Cu on CeO2 nanorods sample is heated to 400 °C in an inert He atmosphere, it undergoes extensive reduction, resulting in a final composition of 75% Cu0, 20% Cu2+, and 5% Cu+. This significant reduction to metallic copper occurs because the high 8 wt.% copper loading leads to the formation of larger CuO crystallites on the ceria support. These larger crystallites are much easier to reduce than the highly dispersed, small CuO clusters found in lower-loaded samples. The smaller clusters in low-loading samples possess a higher fraction of strong Cu-O-Ce bonds that stabilize them against reduction, whereas the larger crystallites in this 8 wt.% sample lack this extensive stabilization, allowing the majority of the Cu2+ to readily reduce to Cu0. | Full credit requires explaining that the higher Cu loading leads to larger CuO crystallites, which are easier to reduce to metallic Cu0. In contrast, lower-loaded samples contain smaller CuO clusters with a higher fraction of Cu-O-Ce bonds at the interface, making them more difficult to reduce. |
Review
#149
CuO/CeO2
Cu K
▶
LLM Prompt
Sample Information
Material: CuO/CeO2
Support: CeO2 nanorods
Reaction Conditions: 2500 ppm N2O in He at 400 °C
Sample-Specific Conditions
- Condition: N2O at 400 °C
- 8 wt.% Cu on CeO2 nanorods, during N2O decomposition
Measurement
We plan to measure the Cu K XANES spectrum of this sample.
Questions
Based on all the information above:
1. What candidate reference spectra or basis functions are needed to model the in-situ Cu K-edge XANES spectrum of this catalyst during N2O decomposition using linear combination fitting?
2. Based on the reaction conditions (2500 ppm N2O at 400 °C), estimate the phase fractions of the copper species present in the catalyst.
3. Explain why this specific mixture of copper oxidation states is observed during steady-state N2O decomposition at 400 °C, particularly in contrast to the state of the catalyst after activation in an inert atmosphere.
Ground Truth
Material: 8 wt.% Cu on CeO2 nanorods (8Cu_CeO2-R)
Measurement: in-situ Cu K-edge XANES in transmission mode
Fit method: Linear combination fit (LCF)
Phase fractions:
| Phase | Fraction |
|---|---|
| Cu2+ | 0.91 |
| Cu+ | 0.09 |
Fit basis (paper's reference spectra):
- 8Cu_CeO2-R at RT (reference for Cu2+)
- 2Cu_CeO2-R at RT (reference for Cu2+)
- Cu2O nanoparticles (reference for Cu+)
- Cu metal nanoparticles (reference for Cu0)
Source evidence: Figure 4, page 18
Key reasoning: During the catalytic reaction of N2O decomposition at 400 °C, the copper species that were reduced during the preceding activation step are re-oxidized by N2O. Almost all Cu is oxidized back to Cu2+, while a small fraction (about 9%) remains as Cu+ under steady-state conditions. The co-existence of these states confirms the active participation of the Cu+/Cu2+ redox pair in the catalytic cycle.
Reasoning source: Section 3.3 (page 19) and Section 3.4 (pages 27-28)
Scoring Rubric (total: 100 pts)
| Q | Type | Max | Question | Reference Answer | Scoring Criteria |
|---|---|---|---|---|---|
| q1 | identification | 30 | What candidate reference spectra or basis functions are needed to model the in-situ Cu K-edge XANES spectrum of this catalyst during N2O decomposition using linear combination fitting? | To model the in-situ Cu K-edge XANES spectrum using linear combination fitting, the required basis functions are 8Cu_CeO2-R at RT (Cu2+ reference), 2Cu_CeO2-R at RT (Cu2+ reference), Cu2O nanoparticles (Cu+ reference), and Cu metal nanoparticles (Cu0 reference). These specific references are necessary because the 8 wt.% Cu on CeO2 nanorods catalyst undergoes dynamic redox changes during N2O decomposition at 400 °C. Specifically, the N2O re-oxidizes previously reduced copper species back to predominantly Cu2+, while a small amount of Cu+ remains. Therefore, references covering the full range of possible oxidation states (Cu2+, Cu+, and Cu0) are needed to accurately capture the steady-state mixture of the Cu+/Cu2+ redox pair participating in the catalytic cycle. | Full points for identifying Cu2+ (e.g., CuO or the initial catalyst at RT), Cu+ (e.g., Cu2O), and Cu0 (metallic Cu) as the necessary basis components. |
| q2 | quantification | 30 | Based on the reaction conditions (2500 ppm N2O at 400 °C), estimate the phase fractions of the copper species present in the catalyst. | Under the reaction conditions of 2500 ppm N2O at 400 °C, the copper species in the catalyst consist of phase fractions of 0.91 (91%) Cu2+ and 0.09 (9%) Cu+. These specific values arise because the N2O acts as a strong oxidizing agent during the decomposition reaction at this temperature. The N2O re-oxidizes the copper species that were reduced during the preceding activation step, driving almost all of the copper back to the Cu2+ state. The remaining 9% Cu+ persists because the steady-state catalytic cycle actively utilizes the Cu+/Cu2+ redox pair, preventing complete oxidation. | Full points for estimating ~91% Cu2+ (CuO) and ~9% Cu+ (Cu2O). Partial credit if the dominant phase is correctly identified as Cu2+ with a minor Cu+ component. |
| q3 | reasoning | 40 | Explain why this specific mixture of copper oxidation states is observed during steady-state N2O decomposition at 400 °C, particularly in contrast to the state of the catalyst after activation in an inert atmosphere. | The specific mixture of 91% Cu2+ and 9% Cu+ is observed because N2O acts as an oxidizing agent during the decomposition reaction at 400 °C. While the preceding activation step reduces the copper species on the CeO2 nanorods, the introduction of N2O re-oxidizes almost all of the copper back to Cu2+. However, a small fraction remains as Cu+ under steady-state conditions rather than oxidizing completely. The co-existence of these specific states confirms the active participation of the Cu+/Cu2+ redox pair in the catalytic cycle for this 8 wt.% Cu catalyst. | Full points for explaining that N2O acts as an oxidizing agent, re-oxidizing the copper that was reduced during activation back to predominantly Cu2+. Must mention that a small fraction remains as Cu+ because the Cu+/Cu2+ redox pair actively participates in the catalytic cycle. |
Review
#150
CuO/CeO2
Cu K
▶
LLM Prompt
Sample Information
Material: CuO/CeO2
Support: CeO2 nanocubes
Reaction Conditions: He at 400 °C
Sample-Specific Conditions
- Condition: He at 400 °C
- 4 wt.% Cu on CeO2 nanocubes, heated in He
Measurement
We plan to measure the Cu K XANES spectrum of this sample.
Questions
Based on all the information above:
1. Estimate the phase fractions of the copper species present in the 4 wt.% Cu on CeO2 nanocubes catalyst after heating in He to 400 °C.
2. Explain the physical reasoning for why the copper species in this specific sample (4 wt.% Cu on CeO2 nanocubes) remain predominantly oxidized when heated in He to 400 °C, whereas other support morphologies might behave differently.
3. What candidate reference spectra should be included in the basis set to properly perform a Linear Combination Fit (LCF) analysis of the Cu K-edge XANES for this catalyst system under these conditions?
Ground Truth
Material: 4 wt.% Cu on CeO2 nanocubes (4Cu_CeO2-C)
Measurement: in-situ Cu K-edge XANES in transmission mode
Fit method: Linear combination fit (LCF)
Phase fractions:
| Phase | Fraction |
|---|---|
| Cu2+ | 0.9 |
| Cu0 | 0.1 |
Fit basis (paper's reference spectra):
- 8Cu_CeO2-R at RT (reference for Cu2+)
- 2Cu_CeO2-R at RT (reference for Cu2+)
- Cu2O nanoparticles (reference for Cu+)
- Cu metal nanoparticles (reference for Cu0)
Source evidence: Figure 4 and text on page 19
Key reasoning: During heating in He at 400 °C, the 4Cu_CeO2-C catalyst shows insignificant reduction of CuO to metallic copper (less than 20% reduced), with Cu remaining predominantly in the divalent form. This contrasts with nanorod-supported samples which reduce extensively under the same conditions. The shape of the CeO2 support and its terminating facets appear to govern the reducibility of the CuO phase, making the CuO clusters on nanocubes more difficult to reduce.
Reasoning source: Section 3.3, pages 19 and 26
Scoring Rubric (total: 100 pts)
| Q | Type | Max | Question | Reference Answer | Scoring Criteria |
|---|---|---|---|---|---|
| q1 | quantification | 30 | Estimate the phase fractions of the copper species present in the 4 wt.% Cu on CeO2 nanocubes catalyst after heating in He to 400 °C. | After heating the 4 wt.% Cu on CeO2 nanocubes catalyst in He to 400 °C, the estimated phase fractions are 0.9 (90%) Cu2+ and 0.1 (10%) Cu0. These specific values result from the fact that the CuO clusters on the CeO2 nanocube support undergo insignificant reduction under these inert heating conditions. The shape of the CeO2 support and its terminating facets govern the reducibility of the CuO phase, making it much more difficult to reduce than other morphologies. Consequently, unlike nanorod-supported samples that reduce extensively under identical conditions, the copper on these nanocubes remains predominantly in the divalent form with less than 20% reducing to metallic copper. | Full points for estimating approximately 90% Cu2+ (CuO) and 10% Cu0 (metallic Cu). Partial points for correctly identifying that Cu2+ remains the overwhelmingly dominant phase with only minor/insignificant reduction. |
| q2 | reasoning | 40 | Explain the physical reasoning for why the copper species in this specific sample (4 wt.% Cu on CeO2 nanocubes) remain predominantly oxidized when heated in He to 400 °C, whereas other support morphologies might behave differently. | When the 4 wt.% Cu on CeO2 nanocubes sample is heated in He at 400 °C, the copper remains predominantly oxidized (90% Cu2+) due to the specific morphology of the support. The shape of the CeO2 support and its terminating facets directly govern the reducibility of the supported CuO phase. Because of these specific facet interactions, the CuO clusters on nanocubes are much more difficult to reduce compared to other support shapes. As a result, while nanorod-supported samples reduce extensively under the exact same inert heating conditions, the nanocube-supported catalyst resists reduction, yielding only a minor fraction (10%) of metallic copper. | Full points for explaining that the CeO2 nanocube support morphology and its specific terminating facets govern the reducibility of the CuO phase, making these supported CuO clusters more difficult to reduce compared to those on other shapes like nanorods. |
| q3 | identification | 30 | What candidate reference spectra should be included in the basis set to properly perform a Linear Combination Fit (LCF) analysis of the Cu K-edge XANES for this catalyst system under these conditions? | To properly perform a Linear Combination Fit (LCF) analysis of the Cu K-edge XANES for this sample, the basis set should include 8Cu_CeO2-R at RT and 2Cu_CeO2-R at RT as references for Cu2+, Cu2O nanoparticles as a reference for Cu+, and Cu metal nanoparticles as a reference for Cu0. These specific reference phases are required because heating the 4 wt.% Cu on CeO2 nanocubes in He at 400 °C induces a partial, albeit insignificant, reduction of the initial CuO phase. The shape and terminating facets of the CeO2 nanocubes make the CuO clusters difficult to reduce, resulting in a final state that is predominantly divalent copper (Cu2+) with a minor amount of metallic copper (Cu0). Therefore, references covering the full range of possible oxidation states (Cu2+, Cu+, and Cu0) are necessary to accurately capture and quantify this limited reduction process. | Full points for identifying the need for references representing Cu2+ (e.g., initial unreacted CuO/CeO2), Cu+ (e.g., Cu2O nanoparticles), and Cu0 (e.g., Cu metal nanoparticles). |
Review
#151
CuO/CeO2
Cu K
▶
LLM Prompt
Sample Information
Material: CuO/CeO2
Support: CeO2 nanorods
Sample-Specific Conditions
- Condition: Initial (25 °C)
- 4 wt.% Cu on CeO2 nanorods, initial state
Measurement
We plan to measure the Cu K XANES spectrum of this sample.
Questions
Based on all the information above:
1. For the Ce L3-edge XANES of the 4Cu_CeO2-R catalyst in its initial state at 25 °C, what is the expected dominant oxidation state of Cerium, and what spectral evidence would support this assignment?
2. If you were to perform a Linear Combination Fit (LCF) analysis on the Ce L3-edge XANES spectra of this sample to track changes during subsequent in-situ heating and reaction, what specific reference spectra would be appropriate to use as a basis?
3. Why is Cerium expected to be fully oxidized in the initial state at 25 °C before any thermal or reactive treatment?
Ground Truth
Material: 4 wt.% Cu on CeO2 nanorods (4Cu_CeO2-R)
Measurement: in-situ Ce L3-edge XANES in transmission mode
Fit method: Linear combination fit (LCF)
Phase fractions:
| Phase | Fraction |
|---|---|
| Ce4+ | 1.0 |
Fit basis (paper's reference spectra):
- 4Cu_CeO2-R catalyst in initial state at RT (as reference for Ce4+)
- crystalline CeVO4 (as reference for Ce3+)
Source evidence: Figure 5, page 21
Key reasoning: In the initial state at room temperature (25 °C), cerium is present exclusively as Ce4+. The energy position and edge profile of the catalyst coincide with crystalline CeO2, indicating that the Ce cations are fully in the Ce4+ valence state prior to any thermal activation or reaction.
Reasoning source: Section 3.3, pages 19-21
Scoring Rubric (total: 100 pts)
| Q | Type | Max | Question | Reference Answer | Scoring Criteria |
|---|---|---|---|---|---|
| q1 | reasoning | 35 | For the Ce L3-edge XANES of the 4Cu_CeO2-R catalyst in its initial state at 25 °C, what is the expected dominant oxidation state of Cerium, and what spectral evidence would support this assignment? | The expected dominant oxidation state of Cerium in the 4Cu_CeO2-R catalyst is exclusively Ce4+ (a fraction of 1.0). The spectral evidence supporting this assignment is that the energy position and edge profile of the Ce L3-edge XANES spectrum coincide perfectly with those of crystalline CeO2. This occurs because the sample is in its initial state at room temperature (25 °C) prior to any thermal activation or reaction. Without applied heat or reactive conditions, the CeO2 nanorod support remains fully oxidized, leaving the Ce cations entirely in the Ce4+ valence state. | Award full points if the answer identifies Ce4+ as the exclusive/dominant oxidation state (100%) and mentions that the edge position and spectral profile should coincide with crystalline CeO2. |
| q2 | identification | 35 | If you were to perform a Linear Combination Fit (LCF) analysis on the Ce L3-edge XANES spectra of this sample to track changes during subsequent in-situ heating and reaction, what specific reference spectra would be appropriate to use as a basis? | For a Linear Combination Fit (LCF) analysis, the appropriate basis spectra are the 4Cu_CeO2-R catalyst in its initial state at room temperature (as the Ce4+ reference) and crystalline CeVO4 (as the Ce3+ reference). These specific references are chosen because the initial 25 °C condition of the 4 wt.% Cu on CeO2 nanorods ensures the cerium is exclusively in the Ce4+ state prior to any thermal activation. The crystalline CeVO4 provides the necessary Ce3+ component to track and quantify any reduction of the CeO2 support that occurs once the sample undergoes subsequent heating and reaction. | Award full points if the answer identifies a Ce4+ reference (e.g., the initial RT sample itself or crystalline CeO2) and a Ce3+ reference (e.g., crystalline CeVO4). |
| q3 | reasoning | 30 | Why is Cerium expected to be fully oxidized in the initial state at 25 °C before any thermal or reactive treatment? | Cerium is expected to be fully oxidized (100% Ce4+) because the 4 wt.% Cu on CeO2 nanorods sample is in its initial state at room temperature (25 °C). Prior to any thermal activation or chemical reaction, there are no conditions present to drive the reduction of the CeO2 support. Consequently, the Ce cations remain exclusively in the Ce4+ valence state, which is spectrally confirmed by an energy position and edge profile that coincide exactly with crystalline CeO2. | Award full points if the answer explains that at room temperature, prior to activation in He or exposure to the reaction mixture, the ceria support remains in its fully oxidized Ce4+ state as crystalline CeO2 without any induced oxygen vacancies or reduction. |
Review
Challenges and Opportunities of Fe‐based Core‐Shell Catalysts for Fischer‐Tropsch Synthesis
BNL-NSLS-II-8-ID
Catalyst
Jane N. Agwara et al.
DOI: 10.1002/cctc.202200289
1 scenario
▶
#152
Fe/H-ZSM-5
Fe K-edge
▶
LLM Prompt
Sample Information
Material: Fe/H-ZSM-5
Support: H-ZSM-5
Sample-Specific Conditions
- catalyst type: control (impregnated)
- 10 wt.% Fe impregnated on H-ZSM-5 control catalyst
Measurement
We plan to measure the Fe K-edge XANES spectrum of this sample.
Questions
Based on all the information above:
1. Based on the synthesis method (incipient wetness impregnation) and the high Fe loading (10 wt.%) on the H-ZSM-5 support, what is the expected dominant iron phase in the as-synthesized catalyst, and why does it form instead of isolated ion-exchanged species?
2. What reference spectrum would be most appropriate to verify the primary phase of this as-synthesized sample using XANES?
3. How would the EXAFS features of this supported 10 wt.% Fe catalyst compare to a bulk standard of the same phase, and what structural information does this difference provide?
Ground Truth
Material: Fe/H-ZSM-5
Measurement: Fe K-edge ex-situ XAFS at 8-ID (ISS) beamline, NSLS-II
Fit method: qualitative comparison
Phase fractions:
| Phase | Fraction |
|---|---|
| hematite (Fe2O3) | 1.0 |
Fit basis (paper's reference spectra):
- Fe2O3 standard
Source evidence: Page 6-7, Figure 5a, Figure S7a
Key reasoning: During incipient wetness impregnation, Fe3+ cations exchange with protons of Brønsted acid sites up to Fe/Al=0.5, which corresponds to ~4 wt.% Fe for Si/Al=50. Because the Fe loading is 10 wt.%, the excess Fe exceeds the exchange capacity and forms FeOx nanoparticles on the zeolite support. XAFS and Mössbauer characterization confirm these nanoparticles are primarily the hematite phase of iron oxide.
Reasoning source: Page 8 (Results and Discussion, DRIFTS section) and Page 6-7 (XAFS section)
Scoring Rubric (total: 100 pts)
| Q | Type | Max | Question | Reference Answer | Scoring Criteria |
|---|---|---|---|---|---|
| q1 | reasoning | 40 | Based on the synthesis method (incipient wetness impregnation) and the high Fe loading (10 wt.%) on the H-ZSM-5 support, what is the expected dominant iron phase in the as-synthesized catalyst, and why does it form instead of isolated ion-exchanged species? | The expected dominant iron phase in the as-synthesized catalyst is hematite (Fe2O3), which accounts for a fraction of 1.0. This phase forms instead of isolated ion-exchanged species because the 10 wt.% Fe loading significantly exceeds the exchange capacity of the H-ZSM-5 support. During incipient wetness impregnation, Fe3+ cations exchange with protons at Brønsted acid sites only up to a limit of approximately 4 wt.% Fe. Consequently, the excess iron cannot be accommodated as isolated ions and instead aggregates to form FeOx nanoparticles, primarily consisting of the hematite phase. | Full points for identifying hematite (Fe2O3) or FeOx nanoparticles and explaining that the 10 wt.% loading exceeds the ion-exchange capacity of the Brønsted acid sites (~4 wt.%), causing the excess Fe to form oxide nanoparticles. |
| q2 | identification | 30 | What reference spectrum would be most appropriate to verify the primary phase of this as-synthesized sample using XANES? | The most appropriate reference spectrum to verify the primary phase of this sample is an Fe2O3 (hematite) standard. This reference is required because the sample consists of 10 wt.% Fe impregnated on an H-ZSM-5 support, which exceeds the zeolite's ion-exchange capacity of approximately 4 wt.%. As a result of this high loading during incipient wetness impregnation, the excess iron cannot fully exchange with the Brønsted acid sites and instead forms FeOx nanoparticles on the support. Therefore, comparing the sample's XANES spectrum to a bulk Fe2O3 standard allows for the qualitative confirmation that these nanoparticles are primarily the hematite phase. | Full points for identifying a bulk Fe2O3 (hematite) standard. |
| q3 | spectral | 30 | How would the EXAFS features of this supported 10 wt.% Fe catalyst compare to a bulk standard of the same phase, and what structural information does this difference provide? | The EXAFS features of this supported 10 wt.% Fe catalyst would exhibit a decreased amplitude relative to a bulk Fe2O3 standard. This spectral difference indicates the presence of smaller iron oxide particles, which is characteristic of a supported catalyst system. This structural outcome occurs because the 10 wt.% Fe loading exceeds the ~4 wt.% ion-exchange capacity of the H-ZSM-5 support during incipient wetness impregnation. Consequently, the excess iron precipitates as nanoscale FeOx (hematite) particles on the zeolite surface, leading to lower coordination numbers and reduced EXAFS amplitudes compared to bulk hematite. | Full points for stating that the EXAFS amplitude would be decreased relative to the bulk standard, indicating the presence of smaller supported nanoparticles. |
Review
Reusable Copper Catechol‐based Porous Polymers for the Highly Efficient Heterogeneous Catalytic Oxidation of Secondary Alcohols
ESRF-BM23
Catalyst
Mickaël Henrion et al.
DOI: 10.1002/cctc.202200649
1 scenario
▶
#153
Cu(II)@10%CatMP-1
Cu K-edge
▶
LLM Prompt
Sample Information
Material: Cu(II)@10%CatMP-1
Support: CatMP-1 porous polymer
Sample-Specific Conditions
- catalyst state: fresh
- Fresh copper catechol-based porous polymer catalyst
Measurement
We plan to measure the Cu K-edge XANES spectrum of this sample.
Questions
Based on all the information above:
1. What is the expected oxidation state and local coordination geometry of the Cu species in the fresh Cu(II)@10%CatMP-1 catalyst?
2. How does the XANES absorption edge position of the fresh Cu(II)@10%CatMP-1 catalyst compare to that of the Cu(OAc)2 precursor, and what does this indicate about the copper sites?
3. Based on the XANES analysis, what evidence supports the conclusion that the copper is atomically dispersed rather than forming nanoparticles in the fresh catalyst?
Ground Truth
Material: Cu(II)@10%CatMP-1
Measurement: Cu K-edge XANES, ex-situ, BM23 at ESRF
Fit method: qualitative comparison
Phase fractions: (±10%)
| Phase | Fraction |
|---|---|
| Cu(II) single sites | 1.0 |
Fit basis (paper's reference spectra):
- Cu(OAc)2
Source evidence: Page 5, Figure 2a
Key reasoning: XANES spectra collected for fresh Cu(II)@10%CatMP-1 evidenced Cu(II) species with square planar coordination. The precise position of the absorption edge is slightly shifted to lower energy in comparison to Cu(OAc)2, indicating a slightly lower effective charge. The spectra demonstrate that there are no Cu containing clusters or nanoparticles (Cu0, Cu2O, CuO), and the Cu remains atomically dispersed in a square planar coordination by four ligand atoms.
Reasoning source: Page 5, Results and Discussion
Scoring Rubric (total: 100 pts)
| Q | Type | Max | Question | Reference Answer | Scoring Criteria |
|---|---|---|---|---|---|
| q1 | identification | 30 | What is the expected oxidation state and local coordination geometry of the Cu species in the fresh Cu(II)@10%CatMP-1 catalyst? | The expected oxidation state of the copper species is Cu(II), and the local coordination geometry is square planar, coordinated by four oxygen atoms. This configuration arises because the fresh catalyst consists of copper incorporated into a catechol-based porous polymer support (CatMP-1). The specific binding environment of the polymer matrix stabilizes the copper as 100% atomically dispersed Cu(II) single sites. Consequently, the copper atoms are coordinated by four ligand atoms from the support, maintaining the square planar geometry without forming any reduced clusters or nanoparticles. | Full credit for identifying Cu(II) oxidation state and square planar coordination by four oxygen atoms. |
| q2 | spectral | 35 | How does the XANES absorption edge position of the fresh Cu(II)@10%CatMP-1 catalyst compare to that of the Cu(OAc)2 precursor, and what does this indicate about the copper sites? | The XANES absorption edge position of the fresh catalyst is slightly shifted to a lower energy compared to the Cu(OAc)2 reference. This spectral feature indicates that the copper sites possess a slightly lower effective charge than in the precursor. This electronic modification occurs because the copper is immobilized within the fresh CatMP-1 porous polymer support. The specific coordination environment provided by the four oxygen atoms of the catechol-based polymer alters the electron density around the atomically dispersed Cu(II) single sites, leading to the observed shift in edge energy. | Full credit for stating the edge is shifted to slightly lower energy compared to Cu(OAc)2, which indicates a slightly lower effective charge on the Cu atoms. |
| q3 | reasoning | 35 | Based on the XANES analysis, what evidence supports the conclusion that the copper is atomically dispersed rather than forming nanoparticles in the fresh catalyst? | The XANES spectra demonstrate a complete absence of spectral features corresponding to copper-containing clusters or nanoparticles, such as Cu0, Cu2O, or CuO. Instead, the spectrum exhibits features characteristic solely of Cu(II) in a square planar coordination. This outcome is a direct result of synthesizing the fresh catalyst using the CatMP-1 porous polymer support, which effectively isolates the copper species. The catechol-based polymer provides specific binding sites that coordinate the copper with four ligand atoms, ensuring it remains 100% atomically dispersed as Cu(II) single sites rather than aggregating into larger particles. | Full credit for mentioning the absence of spectral features corresponding to Cu-containing clusters or nanoparticles, specifically ruling out Cu0, Cu2O, or CuO phases. |
Review
PdCu Alloy Catalyst for Inhibition‐free, Low‐temperature CO Oxidation
APS
Catalyst
Yuying Song et al.
DOI: 10.1002/cctc.202301024
2 scenarios
▶
#154
PdCu
Pd K-edge
▶
LLM Prompt
Sample Information
Material: PdCu
Support: SiO2
Reaction Conditions: operando conditions (various)
Sample-Specific Conditions
- absorption edge: Pd K-edge
- Bimetallic PdCu catalyst on silica support
Measurement
We plan to measure the Pd K-edge XANES spectrum of this sample.
Questions
Based on all the information above:
1. Under operando conditions, what is the expected oxidation state and dominant phase of the Pd species in the PdCu/SiO2 catalyst, and what is the physical justification for this?
2. Given that the catalyst remains completely reduced under operando conditions, what specific bimetallic structural arrangement (distribution of Pd and Cu) is expected to be maintained during the reaction?
3. If Linear Combination Fitting (LCF) were to be performed on the operando Pd K-edge XANES data for this catalyst, what primary reference spectrum or basis function would be required?
Ground Truth
Material: PdCu/SiO2
Measurement: Operando XAS on the Pd K-edge at beamline 2-2 of SSRL
Fit method: Not explicitly stated for XANES (EXAFS fitting was used for structural parameters)
Phase fractions:
| Phase | Fraction |
|---|---|
| metallic_phase | 1.0 |
Fit basis (paper's reference spectra):
- completely reduced metallic phase
Source evidence: Page 4, Results and Discussion section
Key reasoning: Operando XAS measurements on the Pd K-edge showed complete reduction of the catalysts, independent of the reaction conditions. This is consistent with the metallic phases being active for the reaction. EXAFS fits further support a metallic structure with Cu segregation to the surface (a Pd-rich core).
Reasoning source: Page 4, Results and Discussion section
Scoring Rubric (total: 100 pts)
| Q | Type | Max | Question | Reference Answer | Scoring Criteria |
|---|---|---|---|---|---|
| q1 | reasoning | 40 | Under operando conditions, what is the expected oxidation state and dominant phase of the Pd species in the PdCu/SiO2 catalyst, and what is the physical justification for this? | Under operando conditions, the expected oxidation state of Pd is 0, corresponding to a completely reduced metallic phase with a fraction of 1.0. This occurs because the bimetallic PdCu/SiO2 catalyst undergoes complete reduction independent of the various operando reaction conditions applied. The physical justification for this behavior is that the fully reduced metallic phase is the active state required for the reaction. Consequently, the catalyst maintains a stable metallic PdCu alloy structure throughout the operando measurements. | The response must state that the Pd is completely reduced (oxidation state 0, metallic phase) and explain that this metallic phase is maintained independent of reaction conditions because it is the active phase for the reaction. |
| q2 | identification | 30 | Given that the catalyst remains completely reduced under operando conditions, what specific bimetallic structural arrangement (distribution of Pd and Cu) is expected to be maintained during the reaction? | The specific bimetallic structural arrangement expected is a metallic alloy featuring a Pd-rich core with Cu segregation to the surface. This arrangement arises because the PdCu/SiO2 catalyst remains completely reduced (oxidation state 0) independent of the various operando reaction conditions. As supported by EXAFS fitting, this fully metallic state facilitates a specific elemental distribution where Cu segregates to the exterior while maintaining a Pd-rich core. This specific metallic structure is maintained because it constitutes the active phase for the reaction under these conditions. | The response must identify a metallic structure characterized by Cu segregation to the surface, leaving a Pd-rich core. |
| q3 | prediction | 30 | If Linear Combination Fitting (LCF) were to be performed on the operando Pd K-edge XANES data for this catalyst, what primary reference spectrum or basis function would be required? | If Linear Combination Fitting (LCF) were performed, the primary basis function required would be a completely reduced metallic phase, specifically representing a metallic PdCu alloy. This reference is required because the operando Pd K-edge XANES data yields a metallic phase fraction of 1.0, indicating an oxidation state of 0. This complete reduction occurs independently of the various operando reaction conditions because the metallic phase is the active state for the reaction. Therefore, no oxidized Pd references are needed, as the catalyst strictly maintains its fully metallic structure with a Pd-rich core and Cu-segregated surface. | The response must identify a completely reduced metallic Pd or metallic PdCu alloy reference spectrum. |
Review
#155
PdCu
Cu K-edge
▶
LLM Prompt
Sample Information
Material: PdCu
Support: SiO2
Reaction Conditions: operando conditions (various)
Sample-Specific Conditions
- absorption edge: Cu K-edge
- Bimetallic PdCu catalyst on silica support
Measurement
We plan to measure the Cu K-edge XANES spectrum of this sample.
Questions
Based on all the information above:
1. Based on the operando conditions described for the PdCu/SiO2 catalyst, what is the dominant oxidation state and phase of copper, and what specific structural arrangement does it form with palladium?
2. Why does the copper remain in this specific phase during the operando CO oxidation reaction, and how does this relate to the catalyst's overall function?
Ground Truth
Material: PdCu/SiO2
Measurement: Cu K-edge operando XAS, beamline 2-2 of SSRL and 5BM-D of APS
Fit method: qualitative observation
Phase fractions:
| Phase | Fraction |
|---|---|
| metallic_copper | 1.0 |
Source evidence: Page 4, Results and Discussion
Key reasoning: Operando XAS measurements on the Cu K-edge showed complete reduction of the catalysts, independent of the reaction conditions. This indicates that the metallic phase is stable and active for the reaction. Furthermore, EXAFS fitting confirmed Cu segregation to the surface, forming a metallic Cu-enriched surface on a Pd-rich core.
Reasoning source: Page 4, Results and Discussion
Scoring Rubric (total: 100 pts)
| Q | Type | Max | Question | Reference Answer | Scoring Criteria |
|---|---|---|---|---|---|
| q1 | identification | 57 | Based on the operando conditions described for the PdCu/SiO2 catalyst, what is the dominant oxidation state and phase of copper, and what specific structural arrangement does it form with palladium? | Under the various operando conditions, the dominant oxidation state of copper in the PdCu/SiO2 catalyst is 0, corresponding to a fully metallic copper phase (fraction 1.0). Structurally, the copper segregates to the surface to form a metallic Cu-enriched shell surrounding a Pd-rich core. These specific phases and structural arrangements arise because the catalyst undergoes complete reduction that is entirely independent of the applied operando reaction conditions. Consequently, this fully reduced, surface-segregated metallic phase remains stable and serves as the active state for the reaction. | Full credit requires identifying the dominant phase as metallic copper (oxidation state 0, complete reduction) and noting that it forms a Cu-enriched surface on a Pd-rich core. |
| q3 | reasoning | 43 | Why does the copper remain in this specific phase during the operando CO oxidation reaction, and how does this relate to the catalyst's overall function? | The copper remains entirely in a metallic phase (oxidation state 0) because the PdCu/SiO2 catalyst experiences complete reduction that is independent of the various operando reaction conditions. This complete reduction drives the segregation of copper, forming a stable metallic Cu-enriched surface on a Pd-rich core. This stability directly relates to the catalyst's overall function, as the operando XAS measurements indicate this metallic phase is the active state for the reaction. Therefore, the robust metallic copper surface is maintained to facilitate catalytic activity regardless of the specific operando conditions applied. | Full credit requires explaining that the metallic phase is stable independent of the reaction conditions and that this metallic Cu-enriched surface is the active phase responsible for the inhibition-free CO oxidation. |
Review
Highly Active Immobilized Catalyst for Ethylene Polymerization: Neutral Single Site Y(III) Complex Bearing Bulky Silylallyl Ligand
ESRF-BM23
Catalyst
Vittoria Chiari et al.
DOI: 10.1002/chem.202402427
1 scenario
▶
#156
[(≡SiO)Y{η3-1,3-C3H3(SiMe3)2}2]
Y K-edge
▶
LLM Prompt
Sample Information
Material: [(≡SiO)Y{η3-1,3-C3H3(SiMe3)2}2]
Support: SiO2-700
Sample-Specific Conditions
- Supported complex: 1
- Yttrium complex grafted on silica dehydroxylated at 700 °C
Measurement
We plan to measure the Y K-edge XANES spectrum of this sample.
Questions
Based on all the information above:
1. What is the dominant surface species formed when [Y{η3-1,3-C3H3(SiMe3)2}3] is grafted onto SiO2-700, and what specific structural features of the precursor drive this high selectivity?
Ground Truth
Material: [(≡SiO)Y{η3-1,3-C3H3(SiMe3)2}2] supported on SiO2-700
Measurement: Y K-edge X-ray absorption spectroscopy (EXAFS), ex-situ, ESRF beamline BM23
Fit method: EXAFS fitting (XANES LCF not performed)
Phase fractions: (±5%)
| Phase | Fraction |
|---|---|
| [(≡SiO)Y{η3-1,3-C3H3(SiMe3)2}2] | 1.0 |
Fit basis (paper's reference spectra):
- Theoretical scattering paths calculated for the proposed monopodal structure
Source evidence: Page 4, Figure 3, Table 1
Key reasoning: The reaction of the homoleptic yttrium allyl complex [Y{η3-1,3-C3H3(SiMe3)2}3] with SiO2-700 selectively yields the monopodal species 1. The presence of highly stable η3-allyl moieties with two bulky substituents (-SiMe3) on the carbon bonded to yttrium prevents the attack on siloxane bridges. This steric bulk and stability avoid the secondary alkyl transfer reaction (ring opening of proximate siloxane bridges) that typically leads to bipodal surface species in other rare-earth alkyl complexes.
Reasoning source: Page 3-4, Results and Discussion
Scoring Rubric (total: 100 pts)
| Q | Type | Max | Question | Reference Answer | Scoring Criteria |
|---|---|---|---|---|---|
| q1 | reasoning | 100 | What is the dominant surface species formed when [Y{η3-1,3-C3H3(SiMe3)2}3] is grafted onto SiO2-700, and what specific structural features of the precursor drive this high selectivity? | The dominant surface species formed upon grafting the precursor onto silica dehydroxylated at 700 °C (SiO2-700) is the monopodal complex [(≡SiO)Y{η3-1,3-C3H3(SiMe3)2}2], which accounts for 100% of the surface species. This high selectivity is driven by the presence of highly stable η3-allyl moieties that feature two bulky -SiMe3 substituents on the carbon bonded to the yttrium center. The significant steric bulk and stability of these ligands prevent the yttrium complex from attacking proximate siloxane bridges on the silica surface. Consequently, this avoids the secondary alkyl transfer reactions (siloxane ring opening) that typically lead to bipodal surface species in other rare-earth alkyl complexes, restricting the reaction to selectively yield the monopodal species. | Full credit for identifying the monopodal species [(≡SiO)Y{η3-1,3-C3H3(SiMe3)2}2] as the sole/dominant phase and explaining that the steric bulk of the -SiMe3 substituents on the stable η3-allyl ligands prevents secondary reactions (like siloxane bridge opening) that would lead to bipodal species. |
Review
The Role of Lewis Acid Sites in γ‐Al2O3 Oligomerization
BNL-NSLS-II-8-ID
Catalyst
Christian J. Breckner et al.
DOI: 10.1002/cphc.202300244
1 scenario
▶
#157
Sr/Al2O3
Sr K
▶
LLM Prompt
Sample Information
Material: Sr/Al2O3
Support: γ-Al2O3
Reaction Conditions: flowing He at 30 °C
Sample-Specific Conditions
- Sr loading: 0.1 wt%
- Sr oxide base poisoned γ-Al2O3 catalyst
Measurement
We plan to measure the Sr K XANES spectrum of this sample.
Questions
Based on all the information above:
1. Based on the sample conditions (0.1 wt% Sr on γ-Al2O3), what is the expected dominant Sr phase, and what physical reasoning justifies this structural assignment?
2. What is the expected Sr K-edge position (in eV) for this catalyst, and what oxidation state does this indicate?
3. How does the local structure of the Sr species in this 0.1 wt% Sr/Al2O3 catalyst differ from bulk SrO, and what distinguishing spectroscopic features confirm this difference?
Ground Truth
Material: 0.1 wt% Sr/Al2O3
Measurement: Sr K-edge XANES in flowing He at 30 °C
Fit method: Edge energy comparison
Phase fractions:
| Phase | Fraction |
|---|---|
| isolated Sr2+ single ions | 1.0 |
Fit basis (paper's reference spectra):
- Sr(NO3)2 standard
Source evidence: Table 3 and Figure 7a, page 6
Key reasoning: The XANES edge energy of 16.1155 keV indicates an oxidation state of Sr2+. The absence of Sr-O-Sr scattering in the EXAFS data confirms that SrO nanoparticles are not formed, and Sr is present as isolated ions bound to the O ions of the γ-Al2O3 surface.
Reasoning source: Section 2.4 and 3.2
Scoring Rubric (total: 100 pts)
| Q | Type | Max | Question | Reference Answer | Scoring Criteria |
|---|---|---|---|---|---|
| q1 | reasoning | 35 | Based on the sample conditions (0.1 wt% Sr on γ-Al2O3), what is the expected dominant Sr phase, and what physical reasoning justifies this structural assignment? | The expected dominant Sr phase is 100% isolated Sr2+ single ions bound to the oxygen ions of the γ-Al2O3 surface. This specific structural assignment arises because the extremely low Sr loading (0.1 wt%) on the γ-Al2O3 support prevents the agglomeration of strontium into larger clusters or bulk oxides. Under the measurement conditions of flowing He at 30 °C, the highly dispersed Sr atoms remain stabilized as isolated single ions. This is physically justified by the complete absence of Sr-O-Sr scattering in the EXAFS data, confirming that SrO nanoparticles do not form at this low concentration. | Must identify isolated Sr2+ single ions as the dominant phase (15 pts). Must explain that the low loading leads to isolated ions bound to the alumina surface rather than the formation of SrO nanoparticles, as evidenced by the lack of Sr-O-Sr scattering (20 pts). |
| q2 | spectral | 30 | What is the expected Sr K-edge position (in eV) for this catalyst, and what oxidation state does this indicate? | The expected Sr K-edge position for this catalyst is 16115.5 eV, which indicates an oxidation state of 2+. This specific oxidation state and edge position arise because, at the low 0.1 wt% loading on the γ-Al2O3 support under flowing He at 30 °C, the strontium atoms are stabilized by binding directly to the surface oxygen ions of the support. Consequently, the XANES spectrum reflects this isolated ionic state, exhibiting an edge energy characteristic of Sr2+ but with a white line that is broader and differs in shape from a bulk Sr(NO3)2 standard. | Must state the edge position is approximately 16115.5 eV (15 pts) and correctly identify that this indicates a 2+ oxidation state (15 pts). |
| q3 | reasoning | 35 | How does the local structure of the Sr species in this 0.1 wt% Sr/Al2O3 catalyst differ from bulk SrO, and what distinguishing spectroscopic features confirm this difference? | The local structure of the Sr species in this catalyst consists entirely of isolated Sr2+ single ions bound to the γ-Al2O3 surface, which fundamentally differs from the extended Sr-O-Sr coordination networks found in bulk SrO. This structural difference occurs because the very low 0.1 wt% Sr loading forces the strontium to remain highly dispersed across the support rather than aggregating into bulk nanoparticles. Spectroscopically, this is confirmed by an edge energy of 16.1155 keV that verifies the Sr2+ state, alongside a broader white line compared to bulk standards. Most importantly, the complete lack of Sr-O-Sr scattering distinguishes these isolated single ions from bulk SrO nanoparticles. | Must state that the catalyst contains isolated Sr2+ ions rather than bulk SrO (15 pts). Must mention the absence of Sr-O-Sr scattering as the distinguishing feature that rules out SrO nanoparticle formation (20 pts). |
Review
Enhanced Carbon‐Carbon Coupling at Interfaces with Abrupt Coordination Number Changes
APS
Catalyst
Xuan Wang et al.
DOI: 10.1002/cssc.202400150
3 scenarios
▶
#158
Cu2O
Cu K-edge
▶
LLM Prompt
Sample Information
Material: Cu2O
Reaction Conditions: ex-situ
Sample-Specific Conditions
- Precatalyst state: Cu2O
- Cu2O precatalyst before CO2RR
Measurement
We plan to measure the Cu K-edge XANES spectrum of this sample.
Questions
Based on all the information above:
1. Describe the expected spectral shape and the specific energy position of the characteristic peak for the Cu2O precatalyst in the Cu K-edge XANES spectrum.
2. Based on the Cu K-edge XANES spectra, what spectral features distinguish the Cu2O precatalyst from the CuPc precatalyst and the metallic Cu phase formed during CO2RR?
Ground Truth
Material: Cu2O
Measurement: Cu K-edge XANES, ex-situ
Fit method: not reported
Phase fractions:
| Phase | Fraction |
|---|---|
| Cu2O | 1.0 |
Source evidence: Figure 3e, page 5
Key reasoning: The XANES spectrum of the Cu2O precatalyst shows a characteristic Cu(I) peak at ~8982 eV, confirming its initial state before CO2RR. This observation agrees with the results from X-ray photoelectron spectroscopy (XPS).
Reasoning source: Page 4, Results and Discussion
Scoring Rubric (total: 100 pts)
| Q | Type | Max | Question | Reference Answer | Scoring Criteria |
|---|---|---|---|---|---|
| q1 | spectral | 43 | Describe the expected spectral shape and the specific energy position of the characteristic peak for the Cu2O precatalyst in the Cu K-edge XANES spectrum. | The expected spectral shape of the Cu K-edge XANES spectrum for this sample exhibits a characteristic Cu(I) peak centered at approximately 8982 eV. These spectral features arise directly from the sample conditions, specifically that it is an ex-situ measurement of the pristine Cu2O precatalyst before any CO2 reduction reaction (CO2RR) takes place. Because the material is in its initial, unreacted state, it consists entirely of pure Cu2O (fraction 1.0) with a Cu(I) oxidation state, an observation also supported by XPS results. Consequently, the spectrum exclusively displays the ~8982 eV peak characteristic of this specific Cu(I) electronic environment. | Full points for mentioning the characteristic Cu(I) peak centered at ~8982 eV. |
| q3 | spectral | 57 | Based on the Cu K-edge XANES spectra, what spectral features distinguish the Cu2O precatalyst from the CuPc precatalyst and the metallic Cu phase formed during CO2RR? | The Cu2O precatalyst is distinguished by its characteristic Cu(I) peak located at ~8982 eV. This differs from the CuPc precatalyst, which exhibits a Cu(II) peak at ~8987 eV, and the metallic Cu phase formed during CO2RR, which shows a characteristic peak at ~8980 eV. These distinct spectral features occur because the ex-situ Cu2O sample is measured in its initial precatalyst state prior to CO2RR, preserving its pure Cu(I) oxidation state (fraction 1.0). Therefore, the ~8982 eV peak reflects the specific electronic structure of the unreacted Cu2O, distinguishing it from the higher oxidation state of CuPc and the fully reduced metallic Cu phase that only forms once the reaction begins. | Full points for stating that Cu2O has a Cu(I) peak at ~8982 eV, which distinguishes it from CuPc (Cu(II) peak at ~8987 eV) and metallic Cu (peak at ~8980 eV). |
Review
#159
CuPc
Cu K-edge
▶
LLM Prompt
Sample Information
Material: CuPc
Reaction Conditions: ex-situ
Sample-Specific Conditions
- Precatalyst state: CuPc
- CuPc precatalyst before CO2RR
Measurement
We plan to measure the Cu K-edge XANES spectrum of this sample.
Questions
Based on all the information above:
1. Based on the sample conditions (CuPc precatalyst before CO2RR), what is the expected oxidation state of copper, and what specific peak position in the Cu K-edge XANES spectrum characterizes this state?
2. What distinguishing spectral features in the Cu K-edge XANES spectrum would allow you to differentiate the CuPc precatalyst from Cu2O and metallic Cu?
3. Why is the CuPc sample expected to consist entirely of the Cu(II) phase under these specific measurement conditions?
Ground Truth
Material: CuPc
Measurement: Cu K-edge XANES
Fit method: not reported
Phase fractions:
| Phase | Fraction |
|---|---|
| CuPc | 1.0 |
Source evidence: Page 4, Figure 3e
Key reasoning: The sample is the CuPc precatalyst measured ex-situ before CO2RR conditions are applied. Therefore, it remains in its initial unreduced state, exhibiting a characteristic Cu(II) peak.
Reasoning source: Page 4, Results and Discussion
Scoring Rubric (total: 100 pts)
| Q | Type | Max | Question | Reference Answer | Scoring Criteria |
|---|---|---|---|---|---|
| q1 | spectral | 30 | Based on the sample conditions (CuPc precatalyst before CO2RR), what is the expected oxidation state of copper, and what specific peak position in the Cu K-edge XANES spectrum characterizes this state? | The expected oxidation state of copper in this sample is Cu(II), which is characterized by a specific peak centered at ~8987 eV in the Cu K-edge XANES spectrum. This oxidation state and its corresponding spectral feature are observed because the sample is the CuPc precatalyst measured ex-situ before any CO2RR conditions are applied. Since the material has not yet been subjected to the reducing environment of the electrochemical reaction, it remains entirely in its initial, unreduced state. Consequently, the spectrum reflects the pure Cu(II) nature of the pristine precatalyst. | 15 points for identifying the oxidation state as Cu(II); 15 points for stating the characteristic peak is centered at ~8987 eV. |
| q2 | spectral | 40 | What distinguishing spectral features in the Cu K-edge XANES spectrum would allow you to differentiate the CuPc precatalyst from Cu2O and metallic Cu? | The CuPc precatalyst can be differentiated from other copper species by its characteristic Cu(II) peak located at ~8987 eV in the Cu K-edge XANES spectrum. In contrast, Cu2O exhibits a Cu(I) peak at ~8982 eV, and metallic Cu shows a peak at ~8980 eV. The distinct ~8987 eV peak arises in this sample because it is measured ex-situ prior to the CO2RR process. Without exposure to reducing reaction conditions, the precatalyst retains its initial unreduced Cu(II) state (fraction = 1.0) rather than forming reduced Cu(I) or metallic Cu phases. | 20 points for mentioning the CuPc peak at ~8987 eV; 10 points for noting the Cu2O peak at ~8982 eV; 10 points for noting the metallic Cu peak at ~8980 eV. |
| q3 | reasoning | 30 | Why is the CuPc sample expected to consist entirely of the Cu(II) phase under these specific measurement conditions? | The sample is expected to consist of a 1.0 fraction of the CuPc phase, which corresponds entirely to the Cu(II) oxidation state. This phase composition is expected because the measurement is performed ex-situ on the CuPc precatalyst before the CO2 reduction reaction (CO2RR) is initiated. Because no electrochemical reduction has taken place, the material remains completely in its initial, unreduced state. As a result, the sample is purely pristine CuPc, yielding a XANES spectrum with a characteristic Cu(II) peak at ~8987 eV without any reduced contributions. | 30 points for explaining that the measurement is taken ex-situ before any electrochemical CO2 reduction (CO2RR) has occurred, thus preserving the initial unreduced Cu(II) state of the precatalyst. |
Review
#160
Cu
Cu K-edge
▶
LLM Prompt
Sample Information
Material: Cu
Reaction Conditions: CO2RR
Sample-Specific Conditions
- Operando state: OD-Cu
- Cu2O-derived Cu under CO2RR conditions
Measurement
We plan to measure the Cu K-edge XANES spectrum of this sample.
Questions
Based on all the information above:
1. Based on the provided conditions (Cu2O-derived Cu under CO2RR), what is the dominant phase of the catalyst, and what physical/chemical transformation explains its formation?
2. Describe the expected key spectral feature (peak position) for this operando sample in the Cu K-edge XANES spectrum. How does this feature distinguish the active catalyst from its Cu2O precatalyst?
3. To properly track the structural evolution of this sample from its precatalyst state during operando measurements, what reference spectra should be included in the XANES analysis?
Ground Truth
Material: Cu
Measurement: Cu K-edge operando XANES
Fit method: not reported
Phase fractions:
| Phase | Fraction |
|---|---|
| metallic_copper | 1.0 |
Fit basis (paper's reference spectra):
- Cu foil
- Cu2O
- CuPc
Source evidence: Page 4, Figure 3e
Key reasoning: During CO2RR conditions, the Cu2O precatalyst undergoes electrochemical reduction. This is evidenced by the XANES spectra, where the initial Cu(I) peak characteristic of Cu2O shifts to a peak characteristic of metallic Cu. Consequently, the operando state of the OD-Cu catalyst is fully reduced metallic copper.
Reasoning source: Page 4, Results and Discussion (DESIGNING INTERFACES WITH ABRUPT Cu CN)
Scoring Rubric (total: 100 pts)
| Q | Type | Max | Question | Reference Answer | Scoring Criteria |
|---|---|---|---|---|---|
| q1 | reasoning | 35 | Based on the provided conditions (Cu2O-derived Cu under CO2RR), what is the dominant phase of the catalyst, and what physical/chemical transformation explains its formation? | The dominant phase of the OD-Cu catalyst under operando CO2RR conditions is fully reduced metallic copper (Cu(0)), present at a fraction of 1.0. This phase arises because the initial Cu2O precatalyst undergoes complete electrochemical reduction during the CO2 reduction reaction. The applied CO2RR conditions drive the chemical transformation from the initial Cu(I) oxide state to the active metallic Cu(0) state. Consequently, the operando state of the catalyst consists entirely of metallic copper. | Full points if the answer identifies metallic Cu as the dominant phase (fraction 1.0) and explains that it forms due to the complete electrochemical reduction of the Cu2O precatalyst under CO2RR conditions. |
| q2 | spectral | 40 | Describe the expected key spectral feature (peak position) for this operando sample in the Cu K-edge XANES spectrum. How does this feature distinguish the active catalyst from its Cu2O precatalyst? | The expected key spectral feature for the operando OD-Cu sample is a characteristic peak at ~8980 eV in the Cu K-edge XANES spectrum. This feature distinguishes the active catalyst from its precatalyst through the emergence of this metallic Cu peak and the simultaneous disappearance of the Cu(I) peak at ~8982 eV. These spectral changes occur because the Cu2O precatalyst undergoes electrochemical reduction under CO2RR conditions. The shift from the higher energy peak of the precatalyst to the ~8980 eV peak directly reflects the electronic and structural transformation of the sample into fully reduced metallic copper (Cu(0)). | Full points if the answer specifies the characteristic peak at ~8980 eV and notes that it distinguishes the sample from the Cu2O precatalyst by the absence/shift of the Cu(I) peak at ~8982 eV. |
| q3 | identification | 25 | To properly track the structural evolution of this sample from its precatalyst state during operando measurements, what reference spectra should be included in the XANES analysis? | To properly track the structural evolution of the sample, the XANES analysis should include Cu foil, Cu2O, and CuPc as reference spectra. These specific references are necessary because the sample starts as a Cu2O precatalyst and undergoes electrochemical reduction under CO2RR conditions to form the active OD-Cu catalyst. The Cu2O reference accounts for the initial Cu(I) state, while the Cu foil reference is required to identify the fully reduced metallic copper (Cu(0)) phase that forms during the reaction. Including this basis set allows for accurate monitoring of the complete transformation from the oxide precatalyst to the 1.0 fraction metallic Cu operando state. | Full points if the answer identifies Cu foil (or metallic Cu) and Cu2O as necessary reference spectra to track the reduction process. |
Review
Metal Doping Regulates Electrocatalysts Restructuring During Oxygen Evolution Reaction
APS
Catalyst
Maoyu Wang et al.
DOI: 10.1002/cssc.202400332
12 scenarios
▶
#161
Co9S8
Co K-edge
▶
LLM Prompt
Sample Information
Material: Co9S8
Support: carbon nanofibers
Reaction Conditions: after 20 OER cycles in 0.1 M KOH
Sample-Specific Conditions
- Co/Ni ratio: 1:0
- Pure cobalt sulfide after 20 OER cycles
Measurement
We plan to measure the Co K-edge XANES spectrum of this sample.
Questions
Based on all the information above:
1. What candidate reference spectra are needed to perform Linear Combination Fitting (LCF) on the Co K-edge XANES of this sample to quantify the extent of restructuring?
2. Estimate the phase fractions of the pristine sulfide phase and the restructured oxide/hydroxide phase for pure Co9S8 after 20 OER cycles.
3. Explain why pure Co9S8 exhibits this specific degree of restructuring after 20 OER cycles and how this extensive restructuring affects its catalytic stability.
Ground Truth
Material: Co9S8
Measurement: ex-situ Co K-edge XANES at 9-BM of APS
Fit method: Linear Combination Fitting (LCF)
Phase fractions: (±10%)
| Phase | Fraction |
|---|---|
| Pristine Co sulfide | 0.155 |
| Co oxide/hydroxide | 0.845 |
Fit basis (paper's reference spectra):
- pristine Co9S8
- standard CoO
- standard Co3O4
Source evidence: Table 1 and Figure 4c, page 9-10
Key reasoning: During the OER reaction, the Co9S8 pre-catalyst undergoes significant irreversible restructuring, converting to metal oxide/hydroxide nanoclusters. The high Co content in pure Co9S8 leads to a high degree of restructuring (84.5% conversion) into bulk metal oxide formation, which causes a loss of some available active sites and inferior stability compared to optimally Ni-doped samples.
Reasoning source: Section 2.3 Mechanistic Understanding, page 9 and Section 3 Conclusion, page 12
Scoring Rubric (total: 100 pts)
| Q | Type | Max | Question | Reference Answer | Scoring Criteria |
|---|---|---|---|---|---|
| q1 | identification | 30 | What candidate reference spectra are needed to perform Linear Combination Fitting (LCF) on the Co K-edge XANES of this sample to quantify the extent of restructuring? | The required reference spectra for Linear Combination Fitting (LCF) are pristine Co9S8, standard CoO, and standard Co3O4. These specific references are needed because, during the 20 OER cycles in 0.1 M KOH, the pure Co9S8 pre-catalyst undergoes significant irreversible restructuring. The high Co content (Co/Ni ratio of 1:0) drives a high degree of conversion from the initial sulfide phase into metal oxide/hydroxide nanoclusters. Therefore, pristine Co9S8 is required to represent the unreacted material, while CoO and Co3O4 are necessary to model the newly formed bulk metal oxide phases resulting from this extensive restructuring. | The answer must identify the need for the pristine pre-catalyst spectrum (Co9S8) and appropriate Co oxide standards (such as CoO and Co3O4) to represent the restructured phase. |
| q2 | quantification | 30 | Estimate the phase fractions of the pristine sulfide phase and the restructured oxide/hydroxide phase for pure Co9S8 after 20 OER cycles. | The estimated phase fractions for this sample are 15.5% pristine Co sulfide and 84.5% Co oxide/hydroxide, with an uncertainty of 10%. These specific values result from the sample's pure cobalt composition (Co/Ni ratio of 1:0) reacting over 20 OER cycles in 0.1 M KOH. The high Co content causes the Co9S8 pre-catalyst to undergo a severe degree of irreversible restructuring into bulk metal oxides. Consequently, only a small fraction of the original sulfide remains, while the vast majority converts to oxide/hydroxide nanoclusters, leading to a loss of available active sites. | The answer must estimate approximately 15-16% for the pristine Co sulfide phase and 84-85% for the restructured Co oxide/hydroxide phase. |
| q3 | reasoning | 40 | Explain why pure Co9S8 exhibits this specific degree of restructuring after 20 OER cycles and how this extensive restructuring affects its catalytic stability. | Pure Co9S8 exhibits a high degree of restructuring (84.5% conversion) because its pure cobalt composition (1:0 Co/Ni ratio) makes it highly susceptible to irreversible changes during 20 OER cycles in 0.1 M KOH. Under these reaction conditions, the Co9S8 pre-catalyst heavily converts into metal oxide/hydroxide nanoclusters. This extensive restructuring leads to bulk metal oxide formation rather than a stable surface-active layer. Consequently, this bulk conversion causes a loss of available active sites, resulting in inferior catalytic stability compared to optimally Ni-doped samples. | The answer must explain that the high Co content (without Ni substitution to regulate electron distribution) leads to extensive, uncontrolled restructuring (oxidation) into bulk metal oxides. This bulk formation causes aggregation and a loss of available active sites, resulting in inferior stability. |
Review
#162
Co0.83Ni0.17Sy
Co K-edge
▶
LLM Prompt
Sample Information
Material: Co0.83Ni0.17Sy
Support: carbon nanofibers
Reaction Conditions: after 20 OER cycles in 0.1 M KOH
Sample-Specific Conditions
- Co/Ni ratio: 0.83:0.17
- Ni-doped cobalt sulfide after 20 OER cycles
Measurement
We plan to measure the Co K-edge XANES spectrum of this sample.
Questions
Based on all the information above:
1. What reference spectra should be included in a Linear Combination Fitting (LCF) analysis to quantify the phases in the Co0.83Ni0.17Sy sample after 20 OER cycles?
2. Based on the sample conditions (Co0.83Ni0.17Sy after 20 OER cycles), estimate the phase fractions of the pristine sulfide phase and the restructured Co oxide/hydroxide phase.
3. Explain the physical reasoning for the expected degree of restructuring in the Co0.83Ni0.17Sy sample after 20 OER cycles. Why does it reach this specific phase composition?
Ground Truth
Material: Co0.83Ni0.17Sy on carbon nanofibers
Measurement: Co K-edge ex-situ XANES at beamline 9-BM of APS
Fit method: Linear combination fitting (LCF)
Phase fractions: (±10%)
| Phase | Fraction |
|---|---|
| Pristine Co sulfide | 0.057 |
| Co oxide/hydroxide | 0.943 |
Fit basis (paper's reference spectra):
- pristine Co0.83Ni0.17Sy
- standard CoO
- standard Co3O4
Source evidence: Table 1 and Section 2.3, Page 9
Key reasoning: The Co0.83Ni0.17 sample undergoes the largest conversion among the tested compositions, with over 90% of the original pre-catalyst converting to oxides. This high percentage indicates that not only the surface but also the core bulk materials undergo restructuring. The high Co content in this composition causes it to quickly restructure into bulk metal oxide formation.
Reasoning source: Section 2.3, Page 9 and Conclusion, Page 12
Scoring Rubric (total: 100 pts)
| Q | Type | Max | Question | Reference Answer | Scoring Criteria |
|---|---|---|---|---|---|
| q1 | identification | 30 | What reference spectra should be included in a Linear Combination Fitting (LCF) analysis to quantify the phases in the Co0.83Ni0.17Sy sample after 20 OER cycles? | To quantify the phases in the Co0.83Ni0.17Sy sample after 20 OER cycles, the LCF analysis should include reference spectra for pristine Co0.83Ni0.17Sy, standard CoO, and standard Co3O4. These specific reference phases are required because the sample undergoes significant structural transformation during the OER cycling in 0.1 M KOH. Specifically, the high cobalt content (Co/Ni ratio of 0.83:0.17) causes the initial sulfide pre-catalyst to quickly restructure into bulk metal oxides. Therefore, both the remaining pristine sulfide and the newly formed cobalt oxide/hydroxide phases (represented by the CoO and Co3O4 standards) must be included to accurately model the transformed material. | Award 10 points for identifying the pristine Co0.83Ni0.17Sy (or pristine sulfide) spectrum, and 20 points for identifying Co oxide standards (specifically CoO and Co3O4). |
| q2 | quantification | 40 | Based on the sample conditions (Co0.83Ni0.17Sy after 20 OER cycles), estimate the phase fractions of the pristine sulfide phase and the restructured Co oxide/hydroxide phase. | After 20 OER cycles, the estimated phase fractions are 0.057 (5.7%) for the pristine Co sulfide phase and 0.943 (94.3%) for the restructured Co oxide/hydroxide phase, with an uncertainty of 10%. These specific values result directly from the sample's high cobalt composition (Co0.83Ni0.17Sy), which drives the largest conversion among tested compositions during the OER process in 0.1 M KOH. Because of this high Co content, the material quickly restructures into bulk metal oxides rather than just undergoing surface modification. Consequently, over 90% of the original pre-catalyst converts to oxides, indicating that both the surface and the core bulk materials have been thoroughly restructured. | Award 20 points for estimating the restructured Co oxide/hydroxide fraction at ~94% (accept >90%), and 20 points for estimating the remaining pristine sulfide fraction at ~6% (accept <10%). |
| q3 | reasoning | 30 | Explain the physical reasoning for the expected degree of restructuring in the Co0.83Ni0.17Sy sample after 20 OER cycles. Why does it reach this specific phase composition? | The Co0.83Ni0.17Sy sample reaches a highly restructured phase composition of 94.3% Co oxide/hydroxide and only 5.7% pristine sulfide after 20 OER cycles in 0.1 M KOH due to its specific metal ratio. The high cobalt content in this Ni-doped cobalt sulfide pre-catalyst causes the material to quickly restructure into bulk metal oxides under OER conditions. This extensive conversion of over 90% demonstrates that the electrochemical reaction does not merely affect the surface of the catalyst. Instead, the high Co concentration drives a deep structural transformation where both the surface and the core bulk materials undergo complete restructuring into the active oxide phases. | Award 10 points for stating it undergoes the largest conversion/restructuring among the series, 10 points for attributing this to the high Co content, and 10 points for explaining that the high conversion indicates both surface and core bulk materials restructure into bulk metal oxides. |
Review
#163
Co0.63Ni0.37Sy
Co K-edge
▶
LLM Prompt
Sample Information
Material: Co0.63Ni0.37Sy
Support: carbon nanofibers
Reaction Conditions: after 20 OER cycles in 0.1 M KOH
Sample-Specific Conditions
- Co/Ni ratio: 0.63:0.37
- Ni-doped cobalt sulfide after 20 OER cycles
Measurement
We plan to measure the Co K-edge XANES spectrum of this sample.
Questions
Based on all the information above:
1. Based on the reaction conditions (20 OER cycles in 0.1 M KOH), what are the expected major phases present in the Co0.63Ni0.37Sy catalyst, and what are their approximate fractions as determined by Co K-edge XANES?
2. To accurately model the Co K-edge XANES spectrum of this cycled sample using linear combination fitting (LCF), what specific reference spectra should be included in the fit basis?
3. Explain the physical reasoning for why the Co0.63Ni0.37Sy sample exhibits a relatively low degree of restructuring (oxidation) compared to pure Co9S8 or low-Ni doped samples (e.g., Co0.83Ni0.17) under the same harsh OER conditions.
Ground Truth
Material: Co0.63Ni0.37Sy
Measurement: Co K-edge ex-situ XANES at beamline 9-BM of APS
Fit method: Linear combination fitting (LCF)
Phase fractions: (±10%)
| Phase | Fraction |
|---|---|
| Pristine Co sulfide | 0.717 |
| Co oxide/hydroxide | 0.283 |
Fit basis (paper's reference spectra):
- pristine Co0.63Ni0.37Sy
- standard CoO
- standard Co3O4
Source evidence: Table 1 and Figure 4c, page 9
Key reasoning: Ni substitution in Co0.63Ni0.37Sy changes the electron distribution around Co, forming a new or mixed phase. This balances the electron distribution to maintain a lower oxidation state, which improves stability. Consequently, the restructuring rate is reduced compared to Co9S8 or low-Ni doped samples (like Co0.83Ni0.17), limiting the conversion to Co oxide/hydroxide to 28.3% and preventing extensive bulk metal oxide formation.
Reasoning source: Section 2.3 Mechanistic Understanding, pages 10-11
Scoring Rubric (total: 100 pts)
| Q | Type | Max | Question | Reference Answer | Scoring Criteria |
|---|---|---|---|---|---|
| q1 | quantification | 30 | Based on the reaction conditions (20 OER cycles in 0.1 M KOH), what are the expected major phases present in the Co0.63Ni0.37Sy catalyst, and what are their approximate fractions as determined by Co K-edge XANES? | After 20 OER cycles in 0.1 M KOH, the Co0.63Ni0.37Sy catalyst consists of approximately 71.7% pristine Co sulfide and 28.3% Co oxide/hydroxide. These specific fractions result from the high level of Ni substitution (Co/Ni ratio of 0.63:0.37), which alters the electron distribution around the Co atoms. This balanced electron distribution helps maintain a lower oxidation state, significantly improving the material's stability under OER conditions. Consequently, the restructuring rate is reduced compared to pure or low-Ni doped samples, limiting the conversion to Co oxide/hydroxide to just 28.3% and preventing extensive bulk metal oxide formation. | Award full points for identifying the coexistence of pristine Co sulfide (~72%) and a restructured Co oxide/hydroxide phase (~28%). Deduct points if the fractions are significantly off or if only a single phase is predicted. |
| q2 | identification | 30 | To accurately model the Co K-edge XANES spectrum of this cycled sample using linear combination fitting (LCF), what specific reference spectra should be included in the fit basis? | To accurately model the Co K-edge XANES spectrum using linear combination fitting (LCF), the fit basis must include pristine Co0.63Ni0.37Sy, standard CoO, and standard Co3O4. These specific references are necessary because the sample undergoes partial oxidation after 20 OER cycles in 0.1 M KOH. The Ni substitution in the Co0.63Ni0.37Sy alters the electron distribution around Co, which stabilizes the lower oxidation state and reduces the overall restructuring rate. As a result, the catalyst retains a dominant pristine sulfide phase alongside a limited amount of Co oxide/hydroxide phases (represented by CoO and Co3O4), avoiding complete conversion to bulk metal oxides. | Award full points for listing the pristine uncycled material (Co0.63Ni0.37Sy or Co sulfide) and appropriate Co oxide standards (such as CoO and Co3O4) to represent the restructured phase. |
| q3 | reasoning | 40 | Explain the physical reasoning for why the Co0.63Ni0.37Sy sample exhibits a relatively low degree of restructuring (oxidation) compared to pure Co9S8 or low-Ni doped samples (e.g., Co0.83Ni0.17) under the same harsh OER conditions. | The Co0.63Ni0.37Sy sample exhibits a low degree of restructuring after 20 OER cycles in 0.1 M KOH because the specific Co/Ni ratio of 0.63:0.37 fundamentally changes the electron distribution around the Co atoms. This substitution forms a new or mixed phase that balances the electron distribution, allowing the cobalt to maintain a lower oxidation state. By maintaining this lower oxidation state, the structural stability of the catalyst is significantly improved during the electrochemical cycling. Therefore, the restructuring rate is heavily reduced compared to pure Co9S8 or low-Ni doped samples like Co0.83Ni0.17, limiting the conversion to Co oxide/hydroxide to only 28.3% and preventing extensive bulk metal oxide formation. | Award full points for explaining that the specific Ni substitution level changes the electron distribution around Co, forming a phase that maintains a lower oxidation state. This improves structural stability and reduces the restructuring rate, thereby preventing extensive conversion into bulk metal oxides. |
Review
#164
Co0.5Ni0.5Sy
Co K-edge
▶
LLM Prompt
Sample Information
Material: Co0.5Ni0.5Sy
Support: carbon nanofibers
Reaction Conditions: after 20 OER cycles in 0.1 M KOH
Sample-Specific Conditions
- Co/Ni ratio: 0.5:0.5
- Ni-doped cobalt sulfide after 20 OER cycles
Measurement
We plan to measure the Co K-edge XANES spectrum of this sample.
Questions
Based on all the information above:
1. What reference spectra are required to perform Linear Combination Fitting (LCF) on the Co K-edge XANES of this cycled catalyst to quantify the degree of restructuring?
2. Based on the sample composition (Co0.5Ni0.5Sy) and reaction conditions (20 OER cycles), estimate the phase fractions of the pristine sulfide and the newly formed oxide/hydroxide phases.
3. Explain the physical reasoning for why this specific Co/Ni ratio (0.5:0.5) results in this moderate degree of restructuring, particularly when compared to pure cobalt sulfide (Co9S8).
Ground Truth
Material: Co0.5Ni0.5Sy
Measurement: Co K-edge XANES, ex-situ, 9-BM of APS
Fit method: Linear combination fitting
Phase fractions: (±10%)
| Phase | Fraction |
|---|---|
| Pristine Co sulfide | 0.69 |
| Co oxide/hydroxide | 0.31 |
Fit basis (paper's reference spectra):
- pristine Co0.5Ni0.5Sy
- standard CoO
- standard Co3O4
Source evidence: Table 1 and Figure 4c, page 9-10
Key reasoning: The Co0.5Ni0.5Sy sample undergoes moderate restructuring (31.0%) during OER. The Ni and Co balance the electron distribution in the mixed phase, keeping it at a lower oxidation state to improve stability. This intermediate Ni substitution regulates the restructuring rate, preventing the massive conversion to bulk metal oxides seen in high-Co samples like Co9S8, while still forming enough active oxide/hydroxide nanoclusters for catalysis.
Reasoning source: Section 2.3 Mechanistic Understanding, pages 9-11
Scoring Rubric (total: 100 pts)
| Q | Type | Max | Question | Reference Answer | Scoring Criteria |
|---|---|---|---|---|---|
| q1 | identification | 30 | What reference spectra are required to perform Linear Combination Fitting (LCF) on the Co K-edge XANES of this cycled catalyst to quantify the degree of restructuring? | To perform Linear Combination Fitting (LCF) on the Co K-edge XANES of this cycled catalyst, the required reference spectra are pristine Co0.5Ni0.5Sy, standard CoO, and standard Co3O4. These specific reference phases are expected because, after 20 OER cycles in 0.1 M KOH, the catalyst undergoes partial surface restructuring into active oxide/hydroxide nanoclusters. The 0.5:0.5 Co/Ni ratio balances the electron distribution and keeps the material at a lower oxidation state, which improves stability. This prevents massive conversion to bulk metal oxides, meaning both the pristine sulfide phase and newly formed oxide phases (represented by CoO and Co3O4) must be included in the fit. | Full credit for identifying the pristine uncycled material (Co0.5Ni0.5Sy) and standard Co oxides (CoO, Co3O4) as the necessary basis spectra. |
| q2 | quantification | 35 | Based on the sample composition (Co0.5Ni0.5Sy) and reaction conditions (20 OER cycles), estimate the phase fractions of the pristine sulfide and the newly formed oxide/hydroxide phases. | Based on the sample conditions, the estimated phase fractions are 69% pristine Co sulfide and 31% Co oxide/hydroxide, with an uncertainty of 10%. These specific values result from the intermediate Ni substitution (0.5:0.5 Co/Ni ratio) regulating the restructuring rate during the 20 OER cycles in 0.1 M KOH. The presence of Ni balances the electron distribution in the mixed phase, maintaining a lower oxidation state that enhances structural stability. Consequently, the catalyst avoids massive conversion to bulk oxides, preserving 69% of the pristine phase while allowing exactly 31% to restructure into the active oxide/hydroxide nanoclusters needed for catalysis. | Full credit for estimating ~69% pristine Co sulfide and ~31% Co oxide/hydroxide. Partial credit for estimates within ±15%. |
| q3 | reasoning | 35 | Explain the physical reasoning for why this specific Co/Ni ratio (0.5:0.5) results in this moderate degree of restructuring, particularly when compared to pure cobalt sulfide (Co9S8). | The 0.5:0.5 Co/Ni ratio results in a moderate restructuring of 31.0% because the combination of Ni and Co balances the electron distribution within the mixed sulfide phase. During the 20 OER cycles in 0.1 M KOH, this balanced electron distribution keeps the catalyst at a lower oxidation state, which significantly improves its overall stability. This intermediate Ni substitution regulates the restructuring rate, directly preventing the massive conversion to bulk metal oxides that is typically observed in high-Co samples like pure Co9S8. Ultimately, this specific composition ensures the catalyst remains structurally robust while still forming enough active oxide/hydroxide nanoclusters to drive the OER process. | Full credit for explaining that Ni substitution balances the electron distribution, keeping the metals at a lower oxidation state to improve stability, which regulates the restructuring rate and prevents the massive conversion to bulk metal oxides seen in pure Co9S8. |
Review
#165
Co0.37Ni0.63Sy
Co K-edge
▶
LLM Prompt
Sample Information
Material: Co0.37Ni0.63Sy
Support: carbon nanofibers
Reaction Conditions: after 20 OER cycles in 0.1 M KOH
Sample-Specific Conditions
- Co/Ni ratio: 0.37:0.63
- Ni-doped cobalt sulfide after 20 OER cycles
Measurement
We plan to measure the Co K-edge XANES spectrum of this sample.
Questions
Based on all the information above:
1. What reference spectra are required to perform a Linear Combination Fitting (LCF) analysis of the Co K-edge XANES for this cycled Co0.37Ni0.63Sy catalyst to determine its degree of restructuring?
2. Based on the sample conditions (20 OER cycles in 0.1 M KOH) and the specific Co/Ni ratio (0.37:0.63), estimate the phase fractions of the pristine sulfide and the restructured oxide/hydroxide phases in the catalyst.
3. Explain the physical reasoning for why the Co0.37Ni0.63Sy catalyst retains a majority of its pristine sulfide phase after 20 OER cycles, in contrast to Co-rich sulfides (like Co9S8) which undergo extensive restructuring.
Ground Truth
Material: Co0.37Ni0.63Sy on carbon nanofibers
Measurement: Co K-edge XANES, ex-situ, beamline 9-BM of APS of Argonne National Laboratory
Fit method: Linear combination fitting (LCF)
Phase fractions: (±10%)
| Phase | Fraction |
|---|---|
| Pristine Co sulfide | 0.646 |
| Co oxide/hydroxide | 0.354 |
Fit basis (paper's reference spectra):
- pristine Co0.37Ni0.63Sy
- standard CoO
- standard Co3O4
Source evidence: Table 1 and Figure 4c, page 9
Key reasoning: Exposure to OER conditions induces restructuring of the pre-catalyst into Co and Ni oxides/hydroxides. However, Ni substitution regulates the electron distribution around Co, keeping it at a lower oxidation state and improving stability. Consequently, Co0.37Ni0.63Sy undergoes significantly less restructuring (35.4%) compared to Co-rich samples like Co9S8 (84.5%), retaining a majority of the pristine sulfide phase and preventing the formation of bulk metal oxides that deactivate the catalyst.
Reasoning source: Section 2.3 Mechanistic Understanding, pages 9-11
Scoring Rubric (total: 100 pts)
| Q | Type | Max | Question | Reference Answer | Scoring Criteria |
|---|---|---|---|---|---|
| q1 | identification | 20 | What reference spectra are required to perform a Linear Combination Fitting (LCF) analysis of the Co K-edge XANES for this cycled Co0.37Ni0.63Sy catalyst to determine its degree of restructuring? | To perform the Linear Combination Fitting (LCF) analysis of the Co K-edge XANES, the required reference spectra are pristine Co0.37Ni0.63Sy, standard CoO, and standard Co3O4. These specific references are necessary because exposure to the 20 OER cycles in 0.1 M KOH induces partial restructuring of the pre-catalyst into cobalt oxides and hydroxides. The pristine Co0.37Ni0.63Sy spectrum accounts for the unreacted sulfide phase, while the CoO and Co3O4 standards account for the newly formed oxidized species. This specific mixture of phases is expected because the high Ni content (0.63) regulates the electron distribution around Co, keeping it at a lower oxidation state and preventing complete conversion into bulk metal oxides during the OER process. | The answer must identify the pristine pre-catalyst (Co0.37Ni0.63Sy) and Co oxide standards (such as CoO and Co3O4) as the necessary basis spectra for the fit. |
| q2 | quantification | 40 | Based on the sample conditions (20 OER cycles in 0.1 M KOH) and the specific Co/Ni ratio (0.37:0.63), estimate the phase fractions of the pristine sulfide and the restructured oxide/hydroxide phases in the catalyst. | After 20 OER cycles in 0.1 M KOH, the catalyst consists of 64.6% pristine Co sulfide and 35.4% Co oxide/hydroxide, with an uncertainty of 10%. These specific fractions result directly from the protective effect of the high Ni content in the Co0.37Ni0.63Sy composition. The Ni substitution regulates the electron distribution around the Co atoms, maintaining them at a lower oxidation state and enhancing structural stability during the harsh OER conditions. Consequently, the sample undergoes significantly less restructuring (35.4%) compared to Co-rich sulfides, allowing it to retain a majority (64.6%) of its pristine sulfide phase and avoid deactivation. | The answer must state that the pristine sulfide phase remains the majority component (~65%) while the restructured oxide/hydroxide phase is the minority component (~35%). |
| q3 | reasoning | 40 | Explain the physical reasoning for why the Co0.37Ni0.63Sy catalyst retains a majority of its pristine sulfide phase after 20 OER cycles, in contrast to Co-rich sulfides (like Co9S8) which undergo extensive restructuring. | The retention of the pristine sulfide phase after 20 OER cycles in 0.1 M KOH is directly attributed to the specific Co/Ni ratio of 0.37:0.63 in the catalyst. While OER conditions typically drive the restructuring of sulfide pre-catalysts into metal oxides or hydroxides, the substantial Ni substitution in this sample regulates the electron distribution around the Co atoms. This electronic modulation keeps the cobalt at a lower oxidation state, which significantly improves the structural stability of the material. As a result, the Co0.37Ni0.63Sy catalyst undergoes only 35.4% restructuring, successfully preventing the formation of deactivating bulk metal oxides that typically plague Co-rich samples like Co9S8, which undergoes a much higher 84.5% restructuring. | The answer must explain that Ni substitution regulates the electron distribution around Co, keeping it at a lower oxidation state, which inhibits extensive restructuring into bulk metal oxides and improves the structural stability of the catalyst. |
Review
#166
Co0.17Ni0.83Sy
Co K-edge
▶
LLM Prompt
Sample Information
Material: Co0.17Ni0.83Sy
Support: carbon nanofibers
Reaction Conditions: after 20 OER cycles in 0.1 M KOH
Sample-Specific Conditions
- Co/Ni ratio: 0.17:0.83
- Ni-doped cobalt sulfide after 20 OER cycles
Measurement
We plan to measure the Co K-edge XANES spectrum of this sample.
Questions
Based on all the information above:
1. What candidate reference spectra should be used as the basis for Linear Combination Fitting (LCF) of the Co K-edge XANES data for this cycled catalyst?
2. Based on the sample conditions (Co0.17Ni0.83Sy after 20 OER cycles), estimate the phase fractions of the pristine sulfide phase and the newly formed oxide/hydroxide phase.
3. Explain the physical reasoning for the observed degree of Co restructuring in this specific composition (Co0.17Ni0.83Sy) and how it compares to Co-rich compositions.
Ground Truth
Material: Co0.17Ni0.83Sy
Measurement: Co K-edge XANES, ex-situ, beamline 9-BM of APS
Fit method: Linear combination fitting (LCF)
Phase fractions: (±10%)
| Phase | Fraction |
|---|---|
| Pristine Co sulfide | 0.422 |
| Co oxide/hydroxide | 0.578 |
Fit basis (paper's reference spectra):
- pristine Co0.17Ni0.83Sy
- standard CoO
- standard Co3O4
Source evidence: Table 1 and Page 9
Key reasoning: Exposure to OER conditions induces an irreversible restructuring of the pre-catalyst, converting the sulfide into metal oxide/hydroxide nanoclusters. For the Co0.17Ni0.83Sy composition, 57.8% of the Co is oxidized after 20 cycles. This moderate degree of restructuring is lower than that of Co-rich samples (e.g., Co0.83Ni0.17, which converts >90%), because the high Ni content regulates the electron distribution, keeping the metals at a lower oxidation state to improve stability and inhibit excessive bulk metal oxide formation.
Reasoning source: Section 2.3 Mechanistic Understanding, Pages 9-10
Scoring Rubric (total: 100 pts)
| Q | Type | Max | Question | Reference Answer | Scoring Criteria |
|---|---|---|---|---|---|
| q1 | identification | 30 | What candidate reference spectra should be used as the basis for Linear Combination Fitting (LCF) of the Co K-edge XANES data for this cycled catalyst? | The candidate reference spectra for Linear Combination Fitting (LCF) should include pristine Co0.17Ni0.83Sy, standard CoO, and standard Co3O4. These specific references are required because exposure to 20 OER cycles in 0.1 M KOH induces an irreversible restructuring of the pre-catalyst. During this electrochemical process, the initial sulfide phase partially converts into metal oxide/hydroxide nanoclusters. Therefore, the LCF basis must account for both the remaining unreacted pristine sulfide and the newly formed oxidized cobalt species. | Full credit for identifying the pristine uncycled material (Co0.17Ni0.83Sy) and Co oxide/hydroxide standards (such as CoO or Co3O4) as the necessary reference spectra. |
| q2 | quantification | 35 | Based on the sample conditions (Co0.17Ni0.83Sy after 20 OER cycles), estimate the phase fractions of the pristine sulfide phase and the newly formed oxide/hydroxide phase. | After 20 OER cycles, the phase fractions are estimated to be 42.2% pristine Co sulfide and 57.8% Co oxide/hydroxide, with an uncertainty of 10%. These specific values result from the irreversible restructuring of the sulfide pre-catalyst into metal oxide/hydroxide nanoclusters under OER conditions in 0.1 M KOH. This 57.8% oxidation represents a moderate degree of restructuring that is directly dictated by the high Ni content in the Co0.17Ni0.83Sy composition. The abundant nickel regulates the electron distribution, keeping the metals at a lower oxidation state to improve stability and inhibit excessive bulk metal oxide formation. | Full credit for estimating ~42% pristine Co sulfide and ~58% Co oxide/hydroxide. Partial credit for estimates within ±15% of these values. |
| q3 | reasoning | 35 | Explain the physical reasoning for the observed degree of Co restructuring in this specific composition (Co0.17Ni0.83Sy) and how it compares to Co-rich compositions. | In the Co0.17Ni0.83Sy catalyst, exposure to 20 OER cycles in 0.1 M KOH causes an irreversible restructuring where 57.8% of the sulfide converts into metal oxide/hydroxide nanoclusters. This moderate degree of restructuring is significantly lower than that observed in Co-rich samples, such as Co0.83Ni0.17, which convert more than 90% under the same conditions. The physical reasoning for this difference is that the high Ni content in Co0.17Ni0.83Sy regulates the electron distribution within the material. This electronic regulation keeps the metals at a lower oxidation state, thereby improving the structural stability of the catalyst and inhibiting excessive bulk metal oxide formation during the OER process. | Full credit for explaining that OER induces restructuring to oxide/hydroxide nanoclusters, and that the high Ni content in this sample regulates the electron distribution to keep Co at a lower oxidation state, resulting in less restructuring (~58%) compared to Co-rich samples (>90%) to improve stability. |
Review
#167
Co0.83Ni0.17Sy
Ni K-edge
▶
LLM Prompt
Sample Information
Material: Co0.83Ni0.17Sy
Support: carbon nanofibers
Reaction Conditions: after 20 OER cycles in 0.1 M KOH
Sample-Specific Conditions
- Co/Ni ratio: 0.83:0.17
- Ni-doped cobalt sulfide after 20 OER cycles
Measurement
We plan to measure the Ni K-edge XANES spectrum of this sample.
Questions
Based on all the information above:
1. What reference spectra should be included in the basis set to perform a linear combination fitting (LCF) analysis of the Ni K-edge XANES for this cycled catalyst?
2. Based on the sample conditions (after 20 OER cycles in 0.1 M KOH), estimate the phase fractions of the pristine Ni sulfide and the newly formed Ni oxide/hydroxide phase.
3. Explain the physical reasoning for why this specific composition (Co0.83Ni0.17Sy) exhibits this specific degree of Ni oxidation after 20 OER cycles.
Ground Truth
Material: Co0.83Ni0.17Sy
Measurement: Ni K-edge XANES, ex-situ, beamline 9-BM at APS
Fit method: Linear combination fitting (LCF)
Phase fractions: (±10%)
| Phase | Fraction |
|---|---|
| Pristine Ni sulfide | 0.345 |
| Ni oxide/hydroxide | 0.655 |
Fit basis (paper's reference spectra):
- pristine Co0.83Ni0.17Sy
- standard NiO
- standard NiOOH
Source evidence: Table 1 and Figure 4c, page 9
Key reasoning: During the highly oxidative OER process, the pristine metal sulfide undergoes irreversible restructuring to form metal oxide/hydroxide nanoclusters. For the Co0.83Ni0.17 composition, the high Co content drives rapid and substantial restructuring into bulk metal oxides. While Ni substitution generally inhibits this bulk oxide formation to improve stability, the small amount of Ni in this specific sample is insufficient to prevent significant restructuring, resulting in 65.5% of the Ni converting to an oxidized phase after 20 cycles.
Reasoning source: Section 2.3 Mechanistic Understanding, page 9 and Section 3 Conclusion, page 12
Scoring Rubric (total: 100 pts)
| Q | Type | Max | Question | Reference Answer | Scoring Criteria |
|---|---|---|---|---|---|
| q1 | identification | 30 | What reference spectra should be included in the basis set to perform a linear combination fitting (LCF) analysis of the Ni K-edge XANES for this cycled catalyst? | The basis set for LCF analysis of the Ni K-edge XANES should include pristine Co0.83Ni0.17Sy, standard NiO, and standard NiOOH. These specific references are necessary because the sample undergoes irreversible restructuring during the highly oxidative OER process in 0.1 M KOH. Specifically, the high cobalt content in the Co0.83Ni0.17Sy composition drives rapid restructuring into metal oxide and hydroxide nanoclusters. Since the small 17% Ni substitution is insufficient to fully inhibit this bulk oxide formation, the final cycled catalyst is a mixture of the unreacted pristine sulfide and these newly formed oxidized phases. | Full credit for identifying the pristine uncycled material (Co0.83Ni0.17Sy) and oxidized Ni standards such as NiO and NiOOH. Partial credit for mentioning only the oxidized standards or only the pristine material. |
| q2 | quantification | 35 | Based on the sample conditions (after 20 OER cycles in 0.1 M KOH), estimate the phase fractions of the pristine Ni sulfide and the newly formed Ni oxide/hydroxide phase. | After 20 OER cycles in 0.1 M KOH, the estimated phase fractions are 34.5% pristine Ni sulfide and 65.5% Ni oxide/hydroxide, with an uncertainty of 10%. These specific values arise because the highly oxidative OER process causes the pristine metal sulfide to irreversibly restructure into metal oxide/hydroxide nanoclusters. In the Co0.83Ni0.17Sy sample, the high cobalt content strongly drives this rapid restructuring into bulk metal oxides. While nickel substitution normally inhibits bulk oxide formation to improve stability, the low 17% Ni content is insufficient to prevent significant restructuring, resulting in the majority (65.5%) of the material oxidizing. | Full credit for estimating approximately 35% pristine Ni sulfide and 65% Ni oxide/hydroxide. Partial credit for indicating that a majority of the Ni has been oxidized but a significant portion of the pristine sulfide remains. |
| q3 | reasoning | 35 | Explain the physical reasoning for why this specific composition (Co0.83Ni0.17Sy) exhibits this specific degree of Ni oxidation after 20 OER cycles. | The 65.5% degree of Ni oxidation after 20 OER cycles occurs because the highly oxidative OER environment in 0.1 M KOH forces the pristine metal sulfide to irreversibly restructure into metal oxide/hydroxide nanoclusters. In the Co0.83Ni0.17Sy composition, the high cobalt content acts as a strong driver for rapid and substantial restructuring into bulk metal oxides. Although nickel substitution is known to inhibit this bulk oxide formation and improve catalyst stability, the small amount of Ni (17%) present in this specific sample is insufficient to prevent significant restructuring. As a result, the material cannot fully stabilize the sulfide phase, leading to a high degree of oxidation. | Full credit for explaining that the high Co content drives substantial restructuring into metal oxides, and the relatively small amount of Ni substitution is not sufficient to fully stabilize the sulfide structure, leading to a high degree of conversion to the oxide/hydroxide phase. |
Review
#168
Co0.63Ni0.37Sy
Ni K-edge
▶
LLM Prompt
Sample Information
Material: Co0.63Ni0.37Sy
Support: carbon nanofibers
Reaction Conditions: after 20 OER cycles in 0.1 M KOH
Sample-Specific Conditions
- Co/Ni ratio: 0.63:0.37
- Ni-doped cobalt sulfide after 20 OER cycles
Measurement
We plan to measure the Ni K-edge XANES spectrum of this sample.
Questions
Based on all the information above:
1. What candidate reference spectra should be included in a Linear Combination Fitting (LCF) analysis to quantify the phases present in this sample after 20 OER cycles?
2. Based on the sample conditions, estimate the phase fractions of the pristine Ni sulfide and the newly formed Ni oxide/hydroxide phases.
3. Explain the physical reasoning for why this specific Co/Ni ratio (Co0.63Ni0.37) exhibits this specific degree of restructuring, particularly in comparison to samples with lower Ni content (e.g., Co0.83Ni0.17).
Ground Truth
Material: Co0.63Ni0.37Sy
Measurement: Ni K-edge XANES, ex-situ, beamline 9-BM of APS
Fit method: Linear combination fitting (LCF)
Phase fractions: (±10%)
| Phase | Fraction |
|---|---|
| Pristine Ni sulfide | 0.811 |
| Ni oxide/hydroxide | 0.189 |
Fit basis (paper's reference spectra):
- pristine Co0.63Ni0.37Sy
- standard NiO
- standard NiOOH
Source evidence: Table 1 and Section 2.3, page 9
Key reasoning: Ni substitution regulates the restructuring rate by changing the electron distribution around Co. In the Co0.63Ni0.37 composition, Ni and Co balance the electron distribution in the new/mixed phase to maintain a lower oxidation state, which improves stability. This inhibits extensive bulk metal oxide formation, resulting in a relatively low degree of Ni restructuring (18.9%) compared to samples with lower Ni content like Co0.83Ni0.17.
Reasoning source: Section 2.3, pages 9-10
Scoring Rubric (total: 100 pts)
| Q | Type | Max | Question | Reference Answer | Scoring Criteria |
|---|---|---|---|---|---|
| q1 | identification | 30 | What candidate reference spectra should be included in a Linear Combination Fitting (LCF) analysis to quantify the phases present in this sample after 20 OER cycles? | The candidate reference spectra for the Linear Combination Fitting (LCF) analysis should include pristine Co0.63Ni0.37Sy, standard NiO, and standard NiOOH. These specific references are necessary because the sample begins as a pristine Ni-doped cobalt sulfide that undergoes electrochemical restructuring during the 20 OER cycles in 0.1 M KOH. The alkaline OER conditions drive the partial transformation of the sulfide into nickel oxide and hydroxide phases. However, because the specific Co0.63Ni0.37 composition balances the electron distribution to maintain a lower oxidation state, a large portion of the pristine sulfide is stabilized and remains alongside the newly formed NiO and NiOOH phases. | Full credit for identifying the pristine sample (or unreacted Ni sulfide) and oxidized Ni standards (such as NiO or NiOOH) as the necessary basis spectra. |
| q2 | quantification | 35 | Based on the sample conditions, estimate the phase fractions of the pristine Ni sulfide and the newly formed Ni oxide/hydroxide phases. | The estimated phase fractions for this sample are 81.1% pristine Ni sulfide and 18.9% newly formed Ni oxide/hydroxide, with an uncertainty of 10%. These specific values arise because the Co0.63Ni0.37 composition dictates the material's response to the 20 OER cycles in 0.1 M KOH. Specifically, the Ni substitution regulates the restructuring rate by changing the electron distribution around Co to maintain a lower oxidation state. This electronic balance improves the material's stability and inhibits extensive bulk metal oxide formation, resulting in only 18.9% of the material converting to oxide/hydroxide phases. | Full credit for estimating ~81% pristine Ni sulfide and ~19% Ni oxide/hydroxide. Partial credit for recognizing that the majority of the sample remains as the pristine sulfide phase with a minor oxidized fraction. |
| q3 | reasoning | 35 | Explain the physical reasoning for why this specific Co/Ni ratio (Co0.63Ni0.37) exhibits this specific degree of restructuring, particularly in comparison to samples with lower Ni content (e.g., Co0.83Ni0.17). | The physical reasoning for this specific degree of restructuring lies in how Ni substitution regulates the restructuring rate by altering the electron distribution around Co. In the Co0.63Ni0.37Sy composition, Ni and Co effectively balance the electron distribution in the mixed phase during the 20 OER cycles in 0.1 M KOH. This balance allows the material to maintain a lower oxidation state, which inherently improves its structural stability under OER conditions. As a result, this enhanced stability inhibits extensive bulk metal oxide formation, leading to a relatively low degree of Ni restructuring (18.9%) compared to samples with lower Ni content like Co0.83Ni0.17. | Full credit for explaining that Ni substitution changes the electron distribution, keeping the metals at a lower oxidation state to improve stability, which inhibits extensive bulk metal oxide formation and results in a lower restructuring rate. |
Review
#169
Co0.5Ni0.5Sy
Ni K-edge
▶
LLM Prompt
Sample Information
Material: Co0.5Ni0.5Sy
Support: carbon nanofibers
Reaction Conditions: after 20 OER cycles in 0.1 M KOH
Sample-Specific Conditions
- Co/Ni ratio: 0.5:0.5
- Ni-doped cobalt sulfide after 20 OER cycles
Measurement
We plan to measure the Ni K-edge XANES spectrum of this sample.
Questions
Based on all the information above:
1. What candidate reference spectra are needed to perform Linear Combination Fitting (LCF) on the Ni K-edge XANES of this cycled Co0.5Ni0.5Sy catalyst to quantify its restructuring?
2. Based on the sample conditions (Co0.5Ni0.5Sy after 20 OER cycles), estimate the phase fractions of the pristine sulfide phase and the newly formed oxidized Ni species.
3. Explain the physical reasoning for why the Co0.5Ni0.5Sy catalyst exhibits this specific degree of restructuring (phase composition) after 20 OER cycles, particularly when compared to compositions with very low or very high Ni content.
Ground Truth
Material: Co0.5Ni0.5Sy
Measurement: Ni K-edge, ex-situ, beamline 9-BM of APS
Fit method: Linear combination fitting (LCF)
Phase fractions: (±10%)
| Phase | Fraction |
|---|---|
| Pristine Ni sulfide | 0.772 |
| Ni oxide/hydroxide | 0.228 |
Fit basis (paper's reference spectra):
- pristine Co0.5Ni0.5Sy
- standard NiO
- standard NiOOH
Source evidence: Table 1 (page 9) and Figure 4b-c
Key reasoning: Ni substitution regulates the restructuring rate by balancing the electron distribution in the mixed phase, keeping the metals at a lower oxidation state to improve stability. As a result, Co0.5Ni0.5Sy undergoes significantly less restructuring (22.8% Ni oxidation) compared to high-Co or high-Ni compositions like Co0.83Ni0.17 or Ni3S2. The bulk of the material remains as the pristine sulfide phase, preventing the formation of bulky metal oxide particles that deactivate the catalyst.
Reasoning source: Section 2.3 (Mechanistic Understanding), pages 9-10
Scoring Rubric (total: 100 pts)
| Q | Type | Max | Question | Reference Answer | Scoring Criteria |
|---|---|---|---|---|---|
| q1 | identification | 20 | What candidate reference spectra are needed to perform Linear Combination Fitting (LCF) on the Ni K-edge XANES of this cycled Co0.5Ni0.5Sy catalyst to quantify its restructuring? | To perform Linear Combination Fitting (LCF) on the Ni K-edge XANES of this sample, the required reference spectra are pristine Co0.5Ni0.5Sy, standard NiO, and standard NiOOH. These specific references are necessary because the sample was subjected to 20 OER cycles in 0.1 M KOH, which induces partial oxidation of the initial sulfide material. The 0.5:0.5 Co/Ni ratio balances the electron distribution in the mixed phase, keeping the metals at a lower oxidation state and improving stability during the electrochemical cycling. Consequently, the bulk of the material remains as the pristine sulfide phase, while the restructured portion transforms into Ni oxide and hydroxide species rather than forming bulky, deactivating metal oxide particles. | Full credit for identifying the pristine uncycled material (Co0.5Ni0.5Sy) and oxidized Ni standards (NiO and/or NiOOH) as the necessary basis spectra. |
| q2 | quantification | 40 | Based on the sample conditions (Co0.5Ni0.5Sy after 20 OER cycles), estimate the phase fractions of the pristine sulfide phase and the newly formed oxidized Ni species. | After 20 OER cycles, the estimated phase fractions are 77.2% pristine Ni sulfide and 22.8% Ni oxide/hydroxide, with an uncertainty of 10%. These specific values result from the 0.5:0.5 Co/Ni ratio of the catalyst operating in 0.1 M KOH, which optimally regulates the restructuring rate during the OER process. This equimolar substitution balances the electron distribution in the mixed phase, keeping the metals at a lower oxidation state to enhance overall stability. As a result, the catalyst undergoes significantly less restructuring (only 22.8% oxidation) compared to high-Co or high-Ni compositions, allowing the bulk to remain as the pristine sulfide phase. | Full credit for estimating ~77% pristine Ni sulfide and ~23% Ni oxide/hydroxide. Deduct points proportionally for estimates deviating by more than 10%. |
| q3 | reasoning | 40 | Explain the physical reasoning for why the Co0.5Ni0.5Sy catalyst exhibits this specific degree of restructuring (phase composition) after 20 OER cycles, particularly when compared to compositions with very low or very high Ni content. | The specific degree of restructuring in the Co0.5Ni0.5Sy catalyst after 20 OER cycles in 0.1 M KOH is driven by its equimolar Co/Ni ratio. This specific level of Ni substitution regulates the restructuring rate by balancing the electron distribution within the mixed sulfide phase. This electronic balance keeps the metals at a lower oxidation state, which significantly improves the structural stability of the catalyst during the harsh OER process. Consequently, the material undergoes much less restructuring (only 22.8% Ni oxidation) compared to high-Co or high-Ni compositions like Co0.83Ni0.17 or Ni3S2. This mechanism ensures the bulk remains as the pristine sulfide phase, preventing the formation of bulky metal oxide particles that would otherwise deactivate the catalyst. | Full credit for explaining that the 1:1 Ni/Co ratio balances the electron distribution, keeping the metals at a lower oxidation state and improving stability, which limits the restructuring to a relatively low percentage (~23%) compared to high-Co or high-Ni compositions. |
Review
#170
Co0.37Ni0.63Sy
Ni K-edge
▶
LLM Prompt
Sample Information
Material: Co0.37Ni0.63Sy
Support: carbon nanofibers
Reaction Conditions: after 20 OER cycles in 0.1 M KOH
Sample-Specific Conditions
- Co/Ni ratio: 0.37:0.63
- Ni-doped cobalt sulfide after 20 OER cycles
Measurement
We plan to measure the Ni K-edge XANES spectrum of this sample.
Questions
Based on all the information above:
1. What candidate reference spectra should be used as the basis for linear combination fitting (LCF) of the Ni K-edge XANES data for the Co0.37Ni0.63Sy catalyst after 20 OER cycles?
2. Based on the sample conditions (Co0.37Ni0.63Sy after 20 OER cycles), estimate the phase fractions of the pristine Ni sulfide phase and the restructured Ni oxide/hydroxide phase.
3. Explain the physical reasoning for why the Co0.37Ni0.63Sy composition results in this specific degree of Ni restructuring (majority pristine, minority oxide/hydroxide) after 20 OER cycles, compared to compositions with lower Ni content.
Ground Truth
Material: Co0.37Ni0.63Sy on carbon nanofibers
Measurement: Ni K-edge XANES, 9-BM beamline at APS
Fit method: Linear combination fitting (LCF)
Phase fractions: (±10%)
| Phase | Fraction |
|---|---|
| Pristine Ni sulfide | 0.754 |
| Ni oxide/hydroxide | 0.246 |
Fit basis (paper's reference spectra):
- pristine Co0.37Ni0.63Sy
- standard NiO
- standard NiOOH
Source evidence: Table 1 and Page 9
Key reasoning: Ni substitution regulates the restructuring rate of the bimetallic sulfide during OER. In Co0.37Ni0.63Sy, the specific Ni/Co ratio balances the electron distribution, keeping the metals at a lower oxidation state and improving stability. Consequently, only a moderate fraction (24.6%) of the Ni restructures into oxide/hydroxide nanoclusters, while the majority remains as the pristine sulfide phase, preventing bulk metal oxide formation that would deactivate the catalyst.
Reasoning source: Section 2.3 (Mechanistic Understanding), Pages 9-11
Scoring Rubric (total: 100 pts)
| Q | Type | Max | Question | Reference Answer | Scoring Criteria |
|---|---|---|---|---|---|
| q1 | identification | 30 | What candidate reference spectra should be used as the basis for linear combination fitting (LCF) of the Ni K-edge XANES data for the Co0.37Ni0.63Sy catalyst after 20 OER cycles? | The candidate reference spectra for the linear combination fitting (LCF) should include pristine Co0.37Ni0.63Sy, standard NiO, and standard NiOOH. These specific references are required because the sample undergoes partial structural evolution during the 20 OER cycles in 0.1 M KOH. The specific Co/Ni ratio (0.37:0.63) balances the electron distribution and improves stability, meaning a large portion of the material remains as the pristine sulfide phase. Meanwhile, the standard NiO and NiOOH references are necessary to account for the moderate fraction of Ni that restructures into oxide and hydroxide nanoclusters under these electrochemical conditions. | Full credit for identifying the pristine Co0.37Ni0.63Sy material and standard Ni oxide/hydroxide phases (such as NiO and NiOOH) as the necessary reference spectra. |
| q2 | quantification | 30 | Based on the sample conditions (Co0.37Ni0.63Sy after 20 OER cycles), estimate the phase fractions of the pristine Ni sulfide phase and the restructured Ni oxide/hydroxide phase. | The estimated phase fractions are 75.4% for the pristine Ni sulfide phase and 24.6% for the restructured Ni oxide/hydroxide phase, with an uncertainty of 10%. These specific values result directly from the Co0.37Ni0.63Sy composition, where the specific Ni/Co ratio regulates the restructuring rate during the 20 OER cycles in 0.1 M KOH. This composition balances the electron distribution and keeps the metals at a lower oxidation state, thereby improving the overall stability of the catalyst. Consequently, only a moderate fraction (24.6%) restructures into oxide/hydroxide nanoclusters, while the majority (75.4%) remains as the pristine sulfide to prevent bulk metal oxide formation. | Full credit for estimating ~75% pristine Ni sulfide and ~25% Ni oxide/hydroxide. Partial credit for recognizing that the majority of the material remains pristine while a minority fraction restructures. |
| q3 | reasoning | 40 | Explain the physical reasoning for why the Co0.37Ni0.63Sy composition results in this specific degree of Ni restructuring (majority pristine, minority oxide/hydroxide) after 20 OER cycles, compared to compositions with lower Ni content. | In the Co0.37Ni0.63Sy catalyst, the specific Ni/Co ratio (0.37:0.63) plays a critical role in regulating the restructuring rate of the bimetallic sulfide during the 20 OER cycles in 0.1 M KOH. This specific degree of Ni substitution effectively balances the electron distribution within the material. As a result, the metals are maintained at a lower oxidation state, which significantly improves the structural stability of the catalyst under OER conditions. This mechanism explains why only a minority fraction (24.6%) of the Ni restructures into oxide/hydroxide nanoclusters, while the majority remains as the pristine sulfide phase, ultimately preventing the formation of bulk metal oxides that would deactivate the catalyst. | Full credit for explaining that the higher Ni substitution balances the electron distribution, keeping the metals at a lower oxidation state to improve stability, which inhibits extensive bulk metal oxide formation and limits restructuring to a moderate fraction. |
Review
#171
Co0.17Ni0.83Sy
Ni K-edge
▶
LLM Prompt
Sample Information
Material: Co0.17Ni0.83Sy
Support: carbon nanofibers
Reaction Conditions: after 20 OER cycles in 0.1 M KOH
Sample-Specific Conditions
- Co/Ni ratio: 0.17:0.83
- Ni-doped cobalt sulfide after 20 OER cycles
Measurement
We plan to measure the Ni K-edge XANES spectrum of this sample.
Questions
Based on all the information above:
1. What reference spectra should be included in a linear combination fitting (LCF) analysis to accurately quantify the Ni phases present in this sample after 20 OER cycles?
2. Based on the sample composition (high Ni content, Co0.17Ni0.83Sy), estimate the fraction of Ni that remains as the pristine sulfide phase versus the fraction that has restructured into oxide/hydroxide phases after 20 OER cycles.
3. Explain the physical reasoning for the observed degree of Ni restructuring in this high-Ni sample compared to high-Co samples (e.g., Co0.83Ni0.17Sy) under the same OER conditions.
Ground Truth
Material: Co0.17Ni0.83Sy on carbon nanofibers
Measurement: Ni K-edge ex-situ XANES
Fit method: Linear combination fitting (LCF)
Phase fractions: (±10%)
| Phase | Fraction |
|---|---|
| Pristine Ni sulfide | 0.535 |
| Ni oxide/hydroxide | 0.465 |
Fit basis (paper's reference spectra):
- pristine Co0.17Ni0.83Sy
- standard NiO
- standard NiOOH
Source evidence: Table 1 and Page 9 text
Key reasoning: During OER, the pristine sulfide pre-catalyst undergoes restructuring to form metal oxide/hydroxide species. A high amount of Ni substitution (as in Co0.17Ni0.83) improves the stability of the catalyst by inhibiting bulk metal oxide formation compared to high-Co samples. Consequently, the Ni restructuring is moderate (46.5%) after 20 cycles, leaving a significant portion (53.5%) of the pristine sulfide phase intact.
Reasoning source: Page 9, Page 10, and Conclusion (Page 12)
Scoring Rubric (total: 100 pts)
| Q | Type | Max | Question | Reference Answer | Scoring Criteria |
|---|---|---|---|---|---|
| q1 | identification | 30 | What reference spectra should be included in a linear combination fitting (LCF) analysis to accurately quantify the Ni phases present in this sample after 20 OER cycles? | The linear combination fitting (LCF) analysis for this sample should include reference spectra for pristine Co0.17Ni0.83Sy, standard NiO, and standard NiOOH. These specific references are required because the pristine sulfide pre-catalyst undergoes structural evolution during the 20 OER cycles in 0.1 M KOH to form active metal oxide and hydroxide species. The high Ni content in the Co0.17Ni0.83Sy composition improves catalyst stability and inhibits complete bulk oxidation. Consequently, the sample contains a mixture of the newly formed oxide/hydroxide phases (NiO and NiOOH) alongside a significant portion of the unreacted pristine sulfide phase. | Full credit for identifying the need for the pristine uncycled material (Co0.17Ni0.83Sy) and oxidized Ni standards (such as NiO and NiOOH) to capture the restructuring process. |
| q2 | quantification | 35 | Based on the sample composition (high Ni content, Co0.17Ni0.83Sy), estimate the fraction of Ni that remains as the pristine sulfide phase versus the fraction that has restructured into oxide/hydroxide phases after 20 OER cycles. | After 20 OER cycles, approximately 53.5% of the Ni remains as the pristine sulfide phase, while 46.5% has restructured into Ni oxide/hydroxide phases (with a 10% uncertainty). These specific fractions result from the high Ni substitution in the Co0.17Ni0.83Sy composition, which significantly improves the structural stability of the catalyst during OER in 0.1 M KOH. Because this high Ni content inhibits bulk metal oxide formation compared to high-Co samples, the restructuring process is moderated. Therefore, a substantial portion of the pristine sulfide phase is preserved intact rather than being fully converted to oxides or hydroxides. | Full credit for estimating approximately 53-54% pristine Ni sulfide and 46-47% Ni oxide/hydroxide. Partial credit for recognizing a mixed phase with a significant portion of unreacted sulfide remaining. |
| q3 | reasoning | 35 | Explain the physical reasoning for the observed degree of Ni restructuring in this high-Ni sample compared to high-Co samples (e.g., Co0.83Ni0.17Sy) under the same OER conditions. | During the 20 OER cycles in 0.1 M KOH, the pristine sulfide pre-catalyst naturally undergoes restructuring to form metal oxide and hydroxide species. However, the high amount of Ni substitution in the Co0.17Ni0.83Sy sample improves the overall stability of the catalyst compared to high-Co samples. This high Ni content physically inhibits the formation of bulk metal oxides, restricting the structural conversion. As a result, the Ni restructuring is limited to a moderate 46.5%, allowing 53.5% of the pristine sulfide phase to remain intact after the electrochemical cycling. | Full credit for explaining that a high amount of Ni substitution improves stability by inhibiting bulk metal oxide formation, leading to a lower degree of restructuring compared to high-Co samples which undergo near-complete conversion to oxides. |
Review
#172
Ni3S2
Ni K-edge
▶
LLM Prompt
Sample Information
Material: Ni3S2
Support: carbon nanofibers
Reaction Conditions: after 20 OER cycles in 0.1 M KOH
Sample-Specific Conditions
- Co/Ni ratio: 0:1
- Pure nickel sulfide after 20 OER cycles
Measurement
We plan to measure the Ni K-edge XANES spectrum of this sample.
Questions
Based on all the information above:
1. What candidate reference spectra are needed to perform a linear combination fitting (LCF) analysis of the Ni K-edge XANES for this sample after 20 OER cycles?
2. Based on the reaction conditions (20 OER cycles), estimate the phase fractions of the pristine sulfide phase and the newly formed oxide/hydroxide phase.
3. Explain the physical reasoning for the observed degree of restructuring in pure Ni3S2 compared to Co-rich sulfides, and how this impacts its catalytic stability.
Ground Truth
Material: Ni3S2
Measurement: Ni K-edge XANES at beamline 9-BM of APS
Fit method: Linear combination fitting (LCF)
Phase fractions: (±10%)
| Phase | Fraction |
|---|---|
| Pristine Ni3S2 | 0.391 |
| Ni oxide/hydroxide | 0.609 |
Fit basis (paper's reference spectra):
- pristine Ni3S2
- standard NiO
- standard NiOOH
Source evidence: Table 1 and Figure 4c, page 9-10
Key reasoning: During the OER process, the Ni3S2 pre-catalyst undergoes restructuring to form Ni oxide/hydroxide nanoclusters. Linear combination fitting of the Ni K-edge XANES indicates that 60.9% of the original material is converted to oxides after 20 cycles. This conversion is relatively low compared to Co-rich samples like Co9S8, which helps prevent the restructured nanoclusters from excessively aggregating into bulky, inactive metal oxide particles, thereby maintaining better catalytic performance.
Reasoning source: Section 2.3 Mechanistic Understanding, page 9
Scoring Rubric (total: 100 pts)
| Q | Type | Max | Question | Reference Answer | Scoring Criteria |
|---|---|---|---|---|---|
| q1 | identification | 20 | What candidate reference spectra are needed to perform a linear combination fitting (LCF) analysis of the Ni K-edge XANES for this sample after 20 OER cycles? | To perform the linear combination fitting (LCF) analysis of the Ni K-edge XANES, the required reference spectra are pristine Ni3S2, standard NiO, and standard NiOOH. These specific references are necessary because the pure Ni3S2 (Co/Ni ratio of 0:1) acts as a pre-catalyst that undergoes structural changes during the 20 OER cycles in 0.1 M KOH. Under these electrochemical conditions, the pristine sulfide partially restructures to form active Ni oxide and hydroxide nanoclusters. Therefore, the fitting basis must account for both the remaining unreacted sulfide core and the newly formed oxidized surface species. | Must identify the pristine pre-catalyst (Ni3S2) and oxidized Ni reference standards (NiO and NiOOH). |
| q2 | quantification | 40 | Based on the reaction conditions (20 OER cycles), estimate the phase fractions of the pristine sulfide phase and the newly formed oxide/hydroxide phase. | Based on the LCF analysis, the sample consists of 39.1% pristine Ni3S2 and 60.9% Ni oxide/hydroxide, with an uncertainty of 10%. These specific fractions result from the pure Ni3S2 pre-catalyst undergoing partial restructuring during the 20 OER cycles in 0.1 M KOH. This 60.9% conversion to oxides is relatively low compared to the higher conversion rates observed in Co-rich samples under identical conditions. This limited degree of conversion is critical, as it prevents the newly formed oxide/hydroxide nanoclusters from excessively aggregating into bulky, inactive particles. | Must state approximately 39% pristine Ni3S2 and 61% Ni oxide/hydroxide (restructured phase). |
| q3 | reasoning | 40 | Explain the physical reasoning for the observed degree of restructuring in pure Ni3S2 compared to Co-rich sulfides, and how this impacts its catalytic stability. | During the 20 OER cycles in 0.1 M KOH, the pure Ni3S2 (Co/Ni ratio 0:1) undergoes a relatively low degree of restructuring, converting only 60.9% of the material into Ni oxide/hydroxide nanoclusters. This contrasts with Co-rich sulfides, such as Co9S8, which experience much higher conversion rates under the same electrochemical conditions. Because the conversion in pure Ni3S2 is limited, the restructured oxide/hydroxide nanoclusters are prevented from excessively aggregating into bulky, inactive metal oxide particles. Consequently, this controlled restructuring mechanism preserves the active nanoclusters, thereby maintaining better overall catalytic stability and performance. | Must mention that Ni3S2 undergoes a relatively lower amount of conversion to oxides (~61%) compared to Co-rich samples, which prevents excessive aggregation into bulky, inactive metal oxide particles and helps maintain better catalytic performance. |
Review
Phosphorus and cover crop management practices affect phosphorus speciation in soils and eroded sediments
APS
Environmental
Kasuni H. H. Gamage et al.
DOI: 10.1002/jeq2.20677
15 scenarios
▶
#173
soil
P K
▶
LLM Prompt
Sample Information
Material: soil
Sample Origin: Kansas Agricultural Watershed field laboratory, Manhattan, Kansas, USA
Sample-Specific Conditions
- Treatment: Control, no cover crop
- Control (no P fertilizer) with no cover crops
Measurement
We plan to measure the P K XANES spectrum of this sample.
Questions
Based on all the information above:
1. Based on the environmental conditions (no-till corn-soybean rotation, control with no P fertilizer and no cover crops), what candidate reference spectra are needed to model the P K-edge XANES spectrum of this soil sample using linear combination fitting?
2. Estimate the relative fractions of the P species in this control soil sample (no P fertilizer, no cover crops).
3. Explain the physical and biogeochemical reasoning for why Fe-associated P species dominate in this specific control soil sample, and how the presence of cover crops would alter this speciation.
Ground Truth
Material: soil
Measurement: P K-edge XANES, fluorescence mode, Sector 9-BM-B, Advanced Photon Source
Fit method: linear combination fitting (LCF)
Phase fractions: (±15%)
| Phase | Fraction |
|---|---|
| Fe-adsorbed P | 0.5 |
| Fe-precipitated P | 0.1 |
| Clay-Al-adsorbed P | 0.1 |
| Apatite-like P | 0.3 |
Fit basis (paper's reference spectra):
- Fe-adsorbed P
- Fe-precipitated P
- Clay-Al-adsorbed P
- Apatite-like P
Source evidence: Figure 6, page 390
Key reasoning: The control soil (no P fertilizer) without cover crops is dominated by Fe-associated P species (Fe-adsorbed P and Fe-precipitated P), followed by apatite-like P and clay-Al-adsorbed P. Without the influence of cover crops, native soil P remains strongly associated with iron minerals. In contrast, cover crops would induce the transformation of Fe-associated P to clay-Al-adsorbed P via ligand-promoted dissolution by root exudates and competitive adsorption by organic acids.
Reasoning source: Section 3.2, page 393
Scoring Rubric (total: 100 pts)
| Q | Type | Max | Question | Reference Answer | Scoring Criteria |
|---|---|---|---|---|---|
| q1 | identification | 30 | Based on the environmental conditions (no-till corn-soybean rotation, control with no P fertilizer and no cover crops), what candidate reference spectra are needed to model the P K-edge XANES spectrum of this soil sample using linear combination fitting? | To model the P K-edge XANES spectrum of this control soil sample using linear combination fitting, the required reference spectra are Fe-adsorbed P, Fe-precipitated P, Clay-Al-adsorbed P, and Apatite-like P. These specific phases are expected because, in the absence of P fertilizer and cover crops, native soil phosphorus remains in its baseline state, which is strongly associated with iron minerals and calcium (apatite). Without the active root systems of cover crops, there is a lack of root exudates and organic acids in the soil. Consequently, the native Fe-associated P is not driven to transform into other species, necessitating a reference basis heavily weighted toward iron-bound and apatite-like phosphorus. | Full credit for identifying Fe-adsorbed P, Fe-precipitated P, Clay-Al-adsorbed P, and Apatite-like P as the primary reference components. |
| q2 | quantification | 35 | Estimate the relative fractions of the P species in this control soil sample (no P fertilizer, no cover crops). | The estimated relative fractions for this control soil sample are 0.5 (50%) Fe-adsorbed P, 0.1 (10%) Fe-precipitated P, 0.1 (10%) Clay-Al-adsorbed P, and 0.3 (30%) Apatite-like P, with an uncertainty of 15%. These specific values arise because the sample received no P fertilizer and no cover crops, meaning the native soil P remains strongly bound to iron minerals, yielding a dominant 60% combined fraction of Fe-associated P. Because there are no cover crops to release organic acids and root exudates, mechanisms like ligand-promoted dissolution and competitive adsorption are absent. As a result, the transformation of Fe-associated P to Clay-Al-adsorbed P is restricted, keeping the Clay-Al-adsorbed fraction low (10%) while native Apatite-like P remains a stable secondary component (30%). | Full credit if the estimated fractions are within ±15% of the ground truth: Fe-adsorbed P (~50%), Fe-precipitated P (~10%), Clay-Al-adsorbed P (~10%), and Apatite-like P (~30%). Partial credit for correctly identifying Fe-adsorbed P as the dominant phase. |
| q3 | reasoning | 35 | Explain the physical and biogeochemical reasoning for why Fe-associated P species dominate in this specific control soil sample, and how the presence of cover crops would alter this speciation. | In this control soil sample, Fe-associated P species (Fe-adsorbed and Fe-precipitated P) dominate because, without the addition of P fertilizer or cover crops, native soil phosphorus naturally remains strongly bound to iron minerals. The absence of cover crops means the soil environment lacks the active root systems necessary to alter this baseline biogeochemistry. If cover crops were introduced, their roots would release exudates and organic acids into the soil profile. These organic compounds would alter the speciation by driving ligand-promoted dissolution and competitive adsorption, which would induce the transformation of the dominant Fe-associated P into clay-Al-adsorbed P. | Full credit for explaining that without cover crops, native P remains strongly bound to Fe minerals. Must mention that cover crops would decrease Fe-associated P and increase clay-Al-adsorbed P due to ligand-promoted dissolution by root exudates or competitive adsorption by organic acids. |
Review
#174
soil
P K
▶
LLM Prompt
Sample Information
Material: soil
Sample Origin: Kansas Agricultural Watershed field laboratory, Manhattan, Kansas, USA
Sample-Specific Conditions
- Treatment: Fall broadcast, no cover crop
- Fall broadcast P fertilizer with no cover crops
Measurement
We plan to measure the P K XANES spectrum of this sample.
Questions
Based on all the information above:
1. Based on the environmental conditions (no-till corn-soybean rotation, fall broadcast P fertilizer, no cover crops), what are the expected major phosphorus phases in this surface soil (0-2.5 cm) and their approximate relative fractions?
2. Explain the biogeochemical reasoning for the expected phosphorus speciation in this soil, specifically focusing on why certain phases dominate in the absence of cover crops.
3. What specific reference spectra would be required as basis functions to perform a complete Linear Combination Fitting (LCF) analysis of the P K-edge XANES spectrum for this sample?
Ground Truth
Material: soil
Measurement: P K-edge XANES, fluorescence mode, Sector 9-BM-B, Advanced Photon Source
Fit method: Linear combination fitting (LCF)
Phase fractions: (±10%)
| Phase | Fraction |
|---|---|
| Fe-adsorbed P | 0.4 |
| Fe-precipitated P | 0.08 |
| Clay-Al-adsorbed P | 0.17 |
| Apatite-like P | 0.35 |
Fit basis (paper's reference spectra):
- Fe-adsorbed P
- Fe-precipitated P
- Clay-Al-adsorbed P
- Apatite-like P
Source evidence: Figure 6, page 390
Key reasoning: The soil without cover crop treatment was dominated by Fe-associated P species (Fe-adsorbed and Fe-precipitated P). The lack of cover crops means there are fewer root exudates and organic acids to cause ligand-promoted dissolution or competitive adsorption, which would otherwise reduce Fe-associated P and enhance clay-Al-adsorbed P. Additionally, the addition of P fertilizer (fall broadcast) contributes to the overall P speciation, maintaining a significant fraction of apatite-like P.
Reasoning source: Section 3.2, page 393
Scoring Rubric (total: 100 pts)
| Q | Type | Max | Question | Reference Answer | Scoring Criteria |
|---|---|---|---|---|---|
| q1 | quantification | 40 | Based on the environmental conditions (no-till corn-soybean rotation, fall broadcast P fertilizer, no cover crops), what are the expected major phosphorus phases in this surface soil (0-2.5 cm) and their approximate relative fractions? | The expected major phosphorus phases in this soil are Fe-adsorbed P (40%), Apatite-like P (35%), Clay-Al-adsorbed P (17%), and Fe-precipitated P (8%), with an estimated uncertainty of 10%. These specific fractions result directly from the fall broadcast P fertilizer treatment combined with the absence of cover crops. The lack of cover crops means there are fewer root exudates and organic acids to cause ligand-promoted dissolution or competitive adsorption, which allows Fe-associated P species to dominate (48% total) while keeping clay-Al-adsorbed P relatively low. Additionally, the fall broadcast P fertilizer application maintains the significant 35% fraction of apatite-like P in the soil. | 10 points for identifying Fe-associated P (or Fe-adsorbed/precipitated) as the dominant phase (~40-50% combined), 10 points for identifying Apatite-like P as a major secondary phase (~30-40%), 10 points for identifying Clay-Al-adsorbed P (~15-20%), and 10 points for quantitative estimates being within 10% of the ground truth values. |
| q2 | reasoning | 40 | Explain the biogeochemical reasoning for the expected phosphorus speciation in this soil, specifically focusing on why certain phases dominate in the absence of cover crops. | In this soil, the absence of cover crops leads to a dominance of Fe-associated P species, specifically Fe-adsorbed P and Fe-precipitated P. This occurs because the lack of cover crops results in fewer root exudates and organic acids in the soil environment. Without these organic acids, there is a reduction in ligand-promoted dissolution and competitive adsorption, processes that would otherwise reduce Fe-associated P and enhance clay-Al-adsorbed P. Furthermore, the fall broadcast P fertilizer treatment contributes to the overall speciation by maintaining a significant fraction of apatite-like P. | 20 points for explaining that without cover crops, Fe-associated P remains the dominant species. 20 points for detailing the mechanism: the absence of cover crops means a lack of root exudates and organic acids, which prevents the ligand-promoted dissolution or competitive adsorption that would otherwise transform Fe-associated P into Clay-Al-adsorbed P. |
| q3 | identification | 20 | What specific reference spectra would be required as basis functions to perform a complete Linear Combination Fitting (LCF) analysis of the P K-edge XANES spectrum for this sample? | To perform a complete Linear Combination Fitting (LCF) analysis of the P K-edge XANES spectrum for this soil sample, the required reference spectra are Fe-adsorbed P, Fe-precipitated P, Clay-Al-adsorbed P, and Apatite-like P. These specific phases are expected as basis functions because the sample underwent a fall broadcast P fertilizer treatment with no cover crops. The lack of cover crops minimizes root exudates and organic acids, preventing the competitive adsorption and ligand-promoted dissolution that would normally reduce Fe-associated P species and increase clay-Al-adsorbed P. Concurrently, the fall broadcast P fertilizer application ensures that apatite-like P remains a significant component of the soil's phosphorus speciation. | 5 points each for listing Fe-adsorbed P, Fe-precipitated P, Clay-Al-adsorbed P, and Apatite-like P (or equivalent calcium phosphate/apatite references). |
Review
#175
soil
P K
▶
LLM Prompt
Sample Information
Material: soil
Sample Origin: Kansas Agricultural Watershed field laboratory, Manhattan, Kansas, USA
Sample-Specific Conditions
- Treatment: Spring injected, no cover crop
- Spring injected P fertilizer with no cover crops
Measurement
We plan to measure the P K XANES spectrum of this sample.
Questions
Based on all the information above:
1. What candidate reference spectra are needed to model the P K-edge XANES spectrum of this fertilized agricultural soil sample using linear combination fitting?
2. Based on the sample conditions (spring injected P fertilizer, no cover crop), estimate the relative fractions of the dominant P species in this soil.
3. Explain the physical and chemical reasoning for why clay-Al-adsorbed P and Fe-adsorbed P are the dominant phases in this specific treatment, and how the absence of a cover crop influences this speciation.
Ground Truth
Material: soil
Measurement: P K-edge XANES, fluorescence mode, Sector 9-BM-B at Advanced Photon Source
Fit method: Linear combination fitting (LCF)
Phase fractions: (±15%)
| Phase | Fraction |
|---|---|
| Fe-adsorbed P | 0.32 |
| Clay-Al-adsorbed P | 0.48 |
| Apatite-like P | 0.2 |
Fit basis (paper's reference spectra):
- Fe-adsorbed P
- Fe-precipitated P
- Clay-Al-adsorbed P
- Apatite-like P
Source evidence: Figure 6 and Section 3.2 (Phosphorus XANES-soils and sediments), page 393
Key reasoning: The addition of P fertilizer (spring injected) contributes to a change in overall P speciation compared to the control soil, shifting the dominant species to clay-Al-adsorbed P. Because this treatment lacks cover crops, it retains a substantial proportion of Fe-adsorbed P. In treatments with cover crops, root exudates and organic acids cause ligand-promoted dissolution or competitive adsorption, which depletes Fe-associated P in favor of clay-Al-adsorbed P. Without these cover crops, the Fe-associated P remains a major component alongside the fertilizer-enhanced clay-Al-adsorbed P.
Reasoning source: Section 3.2, page 393
Scoring Rubric (total: 100 pts)
| Q | Type | Max | Question | Reference Answer | Scoring Criteria |
|---|---|---|---|---|---|
| q1 | identification | 20 | What candidate reference spectra are needed to model the P K-edge XANES spectrum of this fertilized agricultural soil sample using linear combination fitting? | To model the P K-edge XANES spectrum of this soil sample using linear combination fitting, the required candidate reference spectra are Fe-adsorbed P, Fe-precipitated P, Clay-Al-adsorbed P, and Apatite-like P. These specific phases are expected because the spring injection of P fertilizer alters the overall P speciation, shifting the dominant species toward clay-Al-adsorbed P. Furthermore, because this specific treatment lacks a cover crop, the soil retains a substantial proportion of Fe-adsorbed P. Without the root exudates and organic acids from cover crops that would otherwise deplete Fe-associated P through ligand-promoted dissolution or competitive adsorption, both Fe-adsorbed P and fertilizer-enhanced clay-Al-adsorbed P remain major components in the soil. | Full credit for identifying Fe-adsorbed P, Fe-precipitated P, Clay-Al-adsorbed P, and Apatite-like P as the primary basis components. |
| q2 | quantification | 40 | Based on the sample conditions (spring injected P fertilizer, no cover crop), estimate the relative fractions of the dominant P species in this soil. | The estimated relative fractions for the dominant P species in this soil are 0.48 (48%) Clay-Al-adsorbed P, 0.32 (32%) Fe-adsorbed P, and 0.20 (20%) Apatite-like P, with a fitting uncertainty of 15%. These specific values result from the spring injection of P fertilizer, which enhances the formation of clay-Al-adsorbed P, making it the most abundant fraction. The Fe-adsorbed P fraction remains high at 32% specifically because this treatment lacks a cover crop. In the absence of cover crops, there is a lack of root exudates and organic acids that would normally cause ligand-promoted dissolution or competitive adsorption, allowing the Fe-associated P to persist as a major component alongside the clay-Al-adsorbed P. | Full credit for estimating Clay-Al-adsorbed P at ~48%, Fe-adsorbed P at ~32%, and Apatite-like P at ~20%. Partial credit if the relative order (Clay-Al-adsorbed > Fe-adsorbed > Apatite-like) is correct. |
| q3 | reasoning | 40 | Explain the physical and chemical reasoning for why clay-Al-adsorbed P and Fe-adsorbed P are the dominant phases in this specific treatment, and how the absence of a cover crop influences this speciation. | In this soil sample, the addition of spring-injected P fertilizer fundamentally changes the overall P speciation compared to control soils, driving the dominant species to become clay-Al-adsorbed P. The persistence of Fe-adsorbed P as the second major phase is directly tied to the absence of a cover crop in this treatment. When cover crops are present, they release root exudates and organic acids that drive ligand-promoted dissolution and competitive adsorption, which actively depletes Fe-associated P in favor of clay-Al-adsorbed P. Because this specific treatment lacks cover crops, this depletion mechanism does not occur, allowing Fe-associated P to remain a major component alongside the fertilizer-enhanced clay-Al-adsorbed P. | Full credit for explaining that P fertilizer addition drives the dominance of clay-Al-adsorbed P, while the absence of cover crops allows a significant fraction of Fe-adsorbed P to persist (since cover crop root exudates/organic acids would otherwise deplete Fe-associated P via ligand-promoted dissolution). |
Review
#176
soil
P K
▶
LLM Prompt
Sample Information
Material: soil
Sample Origin: Kansas Agricultural Watershed field laboratory, Manhattan, Kansas, USA
Sample-Specific Conditions
- Treatment: Control, with cover crop
- Control (no P fertilizer) with cover crops
Measurement
We plan to measure the P K XANES spectrum of this sample.
Questions
Based on all the information above:
1. What candidate reference spectra (P species) are needed to model the P K-edge XANES spectrum of this soil sample using linear combination fitting?
2. Based on the environmental conditions (control with no P fertilizer, but with cover crops), estimate the relative fractions of the major P species in this soil sample.
3. Explain the biogeochemical reasoning for why the cover crop treatment results in this specific phase distribution, particularly regarding the dominant phase compared to a no-cover-crop control.
Ground Truth
Material: soil
Measurement: P K-edge XANES, fluorescence mode, Sector 9-BM-B, Advanced Photon Source
Fit method: Linear combination fitting (LCF)
Phase fractions: (±15%)
| Phase | Fraction |
|---|---|
| Fe-adsorbed P | 0.28 |
| Fe-precipitated P | 0.04 |
| Clay-Al-adsorbed P | 0.58 |
| Apatite-like P | 0.1 |
Fit basis (paper's reference spectra):
- Fe-adsorbed P
- Fe-precipitated P
- Clay-Al-adsorbed P
- Apatite-like P
Source evidence: Figure 6, page 390
Key reasoning: The soil with cover crop treatment was dominated by clay-Al-adsorbed P species, whereas the soil without cover crop treatment was dominated by Fe-associated P species. This suggests that the cover crop treatment enhanced the clay-Al-adsorbed P at the expense of the Fe-associated P. This redistribution of P species could be due to cover crops changing the Fe chemistry in surface soil via ligand-promoted dissolution by root exudates, competitive adsorption by organic acids, and redistribution of residual P in soil.
Reasoning source: Section 3.2, page 393
Scoring Rubric (total: 100 pts)
| Q | Type | Max | Question | Reference Answer | Scoring Criteria |
|---|---|---|---|---|---|
| q1 | identification | 30 | What candidate reference spectra (P species) are needed to model the P K-edge XANES spectrum of this soil sample using linear combination fitting? | To model the P K-edge XANES spectrum of this soil sample using linear combination fitting, the required candidate reference spectra are Fe-adsorbed P, Fe-precipitated P, Clay-Al-adsorbed P, and Apatite-like P. These specific phases are expected because the sample is an unfertilized control soil treated with cover crops, which significantly alters the soil's phosphorus speciation. Specifically, the presence of cover crops changes the iron chemistry in the surface soil through ligand-promoted dissolution by root exudates and competitive adsorption by organic acids. This biological activity redistributes the residual phosphorus, making Clay-Al-adsorbed P and Fe-associated P the primary components necessary to accurately fit the spectrum. | Full points for identifying Fe-adsorbed P, Fe-precipitated P, Clay-Al-adsorbed P, and Apatite-like P as the necessary reference spectra. |
| q2 | quantification | 35 | Based on the environmental conditions (control with no P fertilizer, but with cover crops), estimate the relative fractions of the major P species in this soil sample. | The estimated relative fractions for this unfertilized soil sample with cover crops are 0.58 for Clay-Al-adsorbed P, 0.28 for Fe-adsorbed P, 0.10 for Apatite-like P, and 0.04 for Fe-precipitated P, with an uncertainty of 15%. These specific values result from the cover crop treatment, which enhances the formation of Clay-Al-adsorbed P at the direct expense of Fe-associated P species. The high fraction of Clay-Al-adsorbed P (58%) and reduced Fe-associated P occur because cover crop root exudates promote ligand-promoted dissolution and organic acids competitively adsorb onto soil minerals. Consequently, this biological intervention alters the surface soil's iron chemistry, driving the redistribution of residual phosphorus into predominantly aluminum-associated clay phases. | Full points for estimating Clay-Al-adsorbed P as the dominant phase (~58%), followed by Fe-adsorbed P (~28%), Apatite-like P (~10%), and a minor amount of Fe-precipitated P (~4%). |
| q3 | reasoning | 35 | Explain the biogeochemical reasoning for why the cover crop treatment results in this specific phase distribution, particularly regarding the dominant phase compared to a no-cover-crop control. | In this unfertilized control soil, the cover crop treatment results in a phase distribution dominated by Clay-Al-adsorbed P, whereas a no-cover-crop control would be dominated by Fe-associated P species. This shift occurs because the cover crops actively change the iron chemistry in the surface soil. The underlying biogeochemical mechanism involves root exudates causing ligand-promoted dissolution of iron minerals, alongside organic acids engaging in competitive adsorption for phosphorus binding sites. As a result of these plant-soil interactions, the residual phosphorus is redistributed, enhancing the accumulation of Clay-Al-adsorbed P at the expense of Fe-associated P. | Full points for explaining that cover crops enhance clay-Al-adsorbed P at the expense of Fe-associated P due to root exudates and organic acids causing ligand-promoted dissolution of Fe minerals and competitive adsorption for sites. |
Review
#177
soil
P K
▶
LLM Prompt
Sample Information
Material: soil
Sample Origin: Kansas Agricultural Watershed field laboratory, Manhattan, Kansas, USA
Sample-Specific Conditions
- Treatment: Fall broadcast, with cover crop
- Fall broadcast P fertilizer with cover crops
Measurement
We plan to measure the P K XANES spectrum of this sample.
Questions
Based on all the information above:
1. What candidate reference spectra are needed to model the P K-edge XANES spectrum of this soil sample using linear combination fitting?
2. Based on the environmental conditions (fall broadcast P fertilizer with cover crops), estimate the relative fractions of the major P species in this sample.
3. Discuss the physical and chemical reasoning for the expected dominant P phase in this sample, specifically addressing the impact of the cover crop on P speciation compared to a no-cover crop scenario.
Ground Truth
Material: soil
Measurement: P K-edge, fluorescence mode, Sector 9-BM-B, Advanced Photon Source
Fit method: Linear combination fitting (LCF)
Phase fractions: (±15%)
| Phase | Fraction |
|---|---|
| Fe-adsorbed P | 0.28 |
| Fe-precipitated P | 0.17 |
| Clay-Al-adsorbed P | 0.45 |
| Apatite-like P | 0.1 |
Fit basis (paper's reference spectra):
- Fe-adsorbed P
- Fe-precipitated P
- Clay-Al-adsorbed P
- Apatite-like P
Source evidence: Figure 6, page 390
Key reasoning: The cover crop treatments were dominated by the clay-Al-absorbed P species, whereas the soil without cover crop treatment was dominated by Fe-associated P species. This suggests that the cover crop treatment enhanced the clay-Al-adsorbed P at the expense of the Fe-associated P. This could be due to cover crops changing the Fe chemistry in surface soil via ligand-promoted dissolution by root exudates, competitive adsorption by organic acids, and redistribution of residual P in soil.
Reasoning source: Section 3.2, page 393
Scoring Rubric (total: 100 pts)
| Q | Type | Max | Question | Reference Answer | Scoring Criteria |
|---|---|---|---|---|---|
| q1 | identification | 30 | What candidate reference spectra are needed to model the P K-edge XANES spectrum of this soil sample using linear combination fitting? | To model the P K-edge XANES spectrum of this soil sample using linear combination fitting, the required candidate reference spectra are Fe-adsorbed P, Fe-precipitated P, Clay-Al-adsorbed P, and Apatite-like P. These specific phases are expected because the sample is an agricultural soil treated with fall broadcast P fertilizer and cover crops. The presence of the cover crop alters the soil chemistry, specifically enhancing the formation of clay-Al-adsorbed P at the expense of Fe-associated P species. This shift occurs because root exudates from the cover crop promote ligand-promoted dissolution and competitive adsorption by organic acids, which changes the Fe chemistry in the surface soil and redistributes the residual P into these four distinct phases. | Full points for identifying Fe-adsorbed P, Fe-precipitated P, Clay-Al-adsorbed P, and Apatite-like P as the necessary reference spectra. |
| q2 | quantification | 30 | Based on the environmental conditions (fall broadcast P fertilizer with cover crops), estimate the relative fractions of the major P species in this sample. | Based on linear combination fitting, the estimated relative fractions of the major P species are 0.45 for Clay-Al-adsorbed P, 0.28 for Fe-adsorbed P, 0.17 for Fe-precipitated P, and 0.10 for Apatite-like P, with an uncertainty of 15%. These specific values result directly from the fall broadcast P fertilizer treatment combined with the use of cover crops. The cover crop treatment causes Clay-Al-adsorbed P to become the dominant fraction (45%) at the expense of the Fe-associated P fractions. This redistribution is driven by the cover crops altering the surface soil's Fe chemistry through ligand-promoted dissolution by root exudates and competitive adsorption by organic acids. | Full points if Clay-Al-adsorbed P is identified as the dominant phase (~45%), followed by Fe-associated P (adsorbed + precipitated totaling ~45%), and a minor amount of Apatite-like P (~10%). |
| q3 | reasoning | 40 | Discuss the physical and chemical reasoning for the expected dominant P phase in this sample, specifically addressing the impact of the cover crop on P speciation compared to a no-cover crop scenario. | In this soil sample treated with fall broadcast P fertilizer and cover crops, the dominant P phase is Clay-Al-adsorbed P. In contrast, soils without a cover crop treatment are typically dominated by Fe-associated P species. The shift to a Clay-Al-adsorbed P dominated system occurs because the cover crops actively change the Fe chemistry in the surface soil. Specifically, root exudates from the cover crops cause ligand-promoted dissolution and organic acids drive competitive adsorption. These chemical mechanisms reduce the availability of Fe-associated sites, thereby enhancing the formation of Clay-Al-adsorbed P and redistributing the residual P in the soil. | Full points for explaining that cover crops enhance clay-Al-adsorbed P at the expense of Fe-associated P, and attributing this to changes in Fe chemistry via ligand-promoted dissolution by root exudates and competitive adsorption by organic acids. |
Review
#178
soil
P K
▶
LLM Prompt
Sample Information
Material: soil
Sample Origin: Kansas Agricultural Watershed field laboratory, Manhattan, Kansas, USA
Sample-Specific Conditions
- Treatment: Spring injected, with cover crop
- Spring injected P fertilizer with cover crops
Measurement
We plan to measure the P K XANES spectrum of this sample.
Questions
Based on all the information above:
1. Based on the sample conditions (spring injected P fertilizer with cover crops in a no-till corn-soybean rotation), what are the expected major phosphorus phases and their approximate mass fractions?
2. What reference spectra would be most appropriate to include in a linear combination fitting (LCF) analysis for this specific soil sample?
3. Explain the physical and chemical reasoning for the observed distribution of phosphorus species in this sample, particularly the effect of the cover crop compared to a system without cover crops.
Ground Truth
Material: soil
Measurement: P K-edge XANES, fluorescence mode, Sector 9-BM-B, Advanced Photon Source
Fit method: linear combination fitting (LCF)
Phase fractions: (±15%)
| Phase | Fraction |
|---|---|
| Fe-adsorbed P | 0.4 |
| Clay-Al-adsorbed P | 0.32 |
| Apatite-like P | 0.28 |
Fit basis (paper's reference spectra):
- Fe-adsorbed P
- Clay-Al-adsorbed P
- Apatite-like P
Source evidence: Figure 6
Key reasoning: The cover crop treatment enhanced the clay-Al-adsorbed P at the expense of the Fe-associated P compared to the no cover crop treatment. This suggests that cover crops induced the transformation of Fe-associated P to other forms. This redistribution is likely due to cover crops changing the Fe chemistry in surface soil via ligand-promoted dissolution by root exudates and competitive adsorption by organic acids.
Reasoning source: Section 3.2, page 393
Scoring Rubric (total: 100 pts)
| Q | Type | Max | Question | Reference Answer | Scoring Criteria |
|---|---|---|---|---|---|
| q1 | quantification | 40 | Based on the sample conditions (spring injected P fertilizer with cover crops in a no-till corn-soybean rotation), what are the expected major phosphorus phases and their approximate mass fractions? | The expected major phosphorus phases for this soil sample are Fe-adsorbed P (40%), Clay-Al-adsorbed P (32%), and Apatite-like P (28%), with an uncertainty of 15%. These specific fractions result from the spring injected P fertilizer combined with the cover crop treatment. The presence of cover crops enhances the proportion of clay-Al-adsorbed P at the expense of Fe-associated P. This redistribution occurs because root exudates from the cover crops promote ligand-promoted dissolution and organic acids competitively adsorb, altering the Fe chemistry in the surface soil and transforming Fe-associated P into other forms. | Full points for identifying Fe-adsorbed P (~40%), Clay-Al-adsorbed P (~32%), and Apatite-like P (~28%). Partial points for identifying the correct phases without exact fractions, or for fractions within ±10%. |
| q2 | identification | 30 | What reference spectra would be most appropriate to include in a linear combination fitting (LCF) analysis for this specific soil sample? | The most appropriate reference spectra for linear combination fitting (LCF) of this soil sample are Fe-adsorbed P, Clay-Al-adsorbed P, and Apatite-like P. These specific reference phases are expected because the sample is a soil treated with spring injected P fertilizer and cover crops, which dictates its chemical makeup. The cover crop treatment actively alters the soil chemistry by releasing root exudates and organic acids. This leads to ligand-promoted dissolution and competitive adsorption that transforms Fe-associated P into other forms, specifically enhancing the formation of clay-Al-adsorbed P at the expense of Fe-adsorbed P. | Full points for listing Fe-adsorbed P, Clay-Al-adsorbed P, and Apatite-like P (or calcium phosphate/apatite). Deduct points for missing key components or including unlikely phases for this specific treatment. |
| q3 | reasoning | 30 | Explain the physical and chemical reasoning for the observed distribution of phosphorus species in this sample, particularly the effect of the cover crop compared to a system without cover crops. | In this soil sample treated with spring injected P fertilizer, the cover crop treatment significantly alters the distribution of phosphorus species compared to a system without cover crops. Specifically, the cover crops enhance the formation of clay-Al-adsorbed P (32%) while reducing the fraction of Fe-adsorbed P (40%). This transformation is driven by the cover crops changing the iron chemistry in the surface soil. Root exudates cause ligand-promoted dissolution, and organic acids lead to competitive adsorption, which together induce the redistribution of Fe-associated P into other forms like clay-Al-adsorbed P and Apatite-like P (28%). | Full points for explaining that cover crops enhance clay-Al-adsorbed P at the expense of Fe-associated P. Must mention the mechanism: cover crops change Fe chemistry via ligand-promoted dissolution by root exudates and competitive adsorption by organic acids. |
Review
#179
sediment
P K
▶
LLM Prompt
Sample Information
Material: sediment
Sample Origin: Kansas Agricultural Watershed field laboratory, Manhattan, Kansas, USA
Sample-Specific Conditions
- Treatment: Control, no cover crop
- Control (no P fertilizer) with no cover crops, sediment from time period 1
Measurement
We plan to measure the P K XANES spectrum of this sample.
Questions
Based on all the information above:
1. Based on the sample conditions (control with no P fertilizer and no cover crops, sediment from time period 1), what are the expected major P phases and their approximate mass fractions?
2. What set of reference spectra would be most appropriate to include as a basis for linear combination fitting (LCF) analysis of this agricultural runoff sediment sample?
3. Explain the physical and chemical reasoning for why Fe-adsorbed P is the dominant phase in this specific sample, and how the absence of cover crops influences this speciation.
Ground Truth
Material: sediment
Measurement: P K-edge XANES, fluorescence mode, Sector 9-BM-B, Advanced Photon Source
Fit method: Linear combination fitting (LCF)
Phase fractions: (±15%)
| Phase | Fraction |
|---|---|
| Fe-adsorbed P | 0.68 |
| Clay-Al-adsorbed P | 0.12 |
| Apatite-like P | 0.2 |
Fit basis (paper's reference spectra):
- Fe-adsorbed P
- Fe-precipitated P
- Clay-Al-adsorbed P
- CaCO3-adsorbed P
- Octacalcium phosphate
- Apatite-like P
Source evidence: Figure 7, page 391
Key reasoning: In the absence of cover crops (NC) and P fertilizer (CN), the sediment P speciation is dominated by Fe-associated P species (specifically Fe-adsorbed P). Without the root exudates and organic acids from cover crops that would otherwise cause ligand-promoted dissolution or competitive adsorption, the native Fe-bound P remains stable and dominant in the sediment.
Reasoning source: Section 3.2, page 393
Scoring Rubric (total: 100 pts)
| Q | Type | Max | Question | Reference Answer | Scoring Criteria |
|---|---|---|---|---|---|
| q1 | quantification | 40 | Based on the sample conditions (control with no P fertilizer and no cover crops, sediment from time period 1), what are the expected major P phases and their approximate mass fractions? | The expected major P phases in this sediment sample are Fe-adsorbed P at approximately 0.68 (68%), Apatite-like P at 0.20 (20%), and Clay-Al-adsorbed P at 0.12 (12%), with an estimated uncertainty of 15%. These specific fractions result directly from the control conditions lacking both P fertilizer and cover crops. Because there are no cover crops, the soil lacks root exudates and organic acids that would otherwise drive ligand-promoted dissolution or competitive adsorption. Consequently, the native Fe-bound P remains highly stable and dominates the sediment's P speciation. | Full points if the answer identifies Fe-adsorbed P as the dominant phase (~68%), with minor contributions from Apatite-like P (~20%) and Clay-Al-adsorbed P (~12%). Deduct points for missing phases or significantly inaccurate fractions. |
| q2 | identification | 30 | What set of reference spectra would be most appropriate to include as a basis for linear combination fitting (LCF) analysis of this agricultural runoff sediment sample? | The most appropriate reference spectra for linear combination fitting (LCF) include Fe-adsorbed P, Fe-precipitated P, Clay-Al-adsorbed P, CaCO3-adsorbed P, Octacalcium phosphate, and Apatite-like P. This basis set is required because it represents the primary mineral associations for native phosphorus in these agricultural sediments. Given the control conditions (no P fertilizer and no cover crops), the native Fe-associated P species are expected to be particularly stable. The absence of cover crops means there are no root exudates or organic acids to cause competitive adsorption or ligand-promoted dissolution, making references like Fe-adsorbed P essential to capture the dominant phases. | Full points if the answer lists a comprehensive set of environmentally relevant P references including Fe-adsorbed P, Fe-precipitated P, Clay-Al-adsorbed P, CaCO3-adsorbed P, calcium phosphates (e.g., octacalcium phosphate), and Apatite-like P. |
| q3 | reasoning | 30 | Explain the physical and chemical reasoning for why Fe-adsorbed P is the dominant phase in this specific sample, and how the absence of cover crops influences this speciation. | Fe-adsorbed P is the dominant phase in this sample because the sediment originates from a control plot that received no P fertilizer and no cover crops. The absence of cover crops means the soil environment lacks the root exudates and organic acids typically introduced by plant growth. Without these organic compounds, chemical mechanisms such as ligand-promoted dissolution or competitive adsorption of phosphorus are suppressed. As a result, the native Fe-bound P remains chemically stable and dominates the overall P speciation, accounting for 68% of the phosphorus in the sediment. | Full points if the answer explains that without cover crops, there is a lack of root exudates and organic acids that would normally cause ligand-promoted dissolution or competitive adsorption, allowing native Fe-associated P to remain stable and dominant. |
Review
#180
sediment
P K
▶
LLM Prompt
Sample Information
Material: sediment
Sample Origin: Kansas Agricultural Watershed field laboratory, Manhattan, Kansas, USA
Sample-Specific Conditions
- Treatment: Fall broadcast, no cover crop
- Fall broadcast P fertilizer with no cover crops, sediment from time period 1
Measurement
We plan to measure the P K XANES spectrum of this sample.
Questions
Based on all the information above:
1. What candidate reference spectra should be considered for linear combination fitting of the P K-edge XANES spectrum of this agricultural sediment sample?
2. Based on the sample conditions (fall broadcast P fertilizer, no cover crop), estimate the phase fractions of the P species present in the sediment.
3. Explain the chemical reasoning for why Fe-adsorbed P dominates the speciation in this specific sediment sample, particularly focusing on the impact of the 'no cover crop' management practice.
Ground Truth
Material: sediment
Measurement: P K-edge XANES in fluorescence mode at Sector 9-BM-B, Advanced Photon Source
Fit method: LCF
Phase fractions: (±15%)
| Phase | Fraction |
|---|---|
| Fe-adsorbed P | 0.54 |
| Clay-Al-adsorbed P | 0.18 |
| CaCO3-adsorbed P | 0.03 |
| Apatite-like P | 0.25 |
Fit basis (paper's reference spectra):
- Fe-adsorbed P
- Fe-precipitated P
- Clay-Al-adsorbed P
- CaCO3-adsorbed P
- Octacalcium phosphate
- Apatite-like
Source evidence: Figure 7, page 391
Key reasoning: In the no cover crop treatments, sediment P speciation is dominated by Fe-associated P species (Fe-adsorbed P). Without the influence of cover crop root exudates and organic acids that promote dissolution of Fe minerals or compete for adsorption sites, P remains strongly associated with Fe oxides. The fall broadcast treatment applies P to the surface, where it readily adsorbs to these available Fe sites in the sediment.
Reasoning source: Section 3.2, page 393
Scoring Rubric (total: 100 pts)
| Q | Type | Max | Question | Reference Answer | Scoring Criteria |
|---|---|---|---|---|---|
| q1 | identification | 30 | What candidate reference spectra should be considered for linear combination fitting of the P K-edge XANES spectrum of this agricultural sediment sample? | The candidate reference spectra for linear combination fitting of this sediment sample should include Fe-adsorbed P, Fe-precipitated P, Clay-Al-adsorbed P, CaCO3-adsorbed P, Octacalcium phosphate, and Apatite-like P. These specific phases are expected because the sample is an agricultural sediment subjected to a fall broadcast P fertilizer treatment with no cover crop. Under these conditions, the surface-applied P readily interacts with available soil minerals like Fe oxides, clay/Al oxides, and calcium carbonates. Without cover crops to produce root exudates and organic acids that would otherwise dissolve Fe minerals or compete for adsorption sites, P strongly associates with these inorganic mineral phases, necessitating this diverse set of reference spectra. | Full points for identifying Fe-adsorbed P, Clay-Al-adsorbed P, CaCO3-adsorbed P, and Apatite-like/calcium phosphate phases as key candidates. Partial points if only some categories (e.g., Fe-bound vs Ca-bound) are mentioned. |
| q2 | quantification | 40 | Based on the sample conditions (fall broadcast P fertilizer, no cover crop), estimate the phase fractions of the P species present in the sediment. | The estimated phase fractions for this sediment sample are 0.54 (54%) Fe-adsorbed P, 0.25 (25%) Apatite-like P, 0.18 (18%) Clay-Al-adsorbed P, and 0.03 (3%) CaCO3-adsorbed P, with an uncertainty of 15%. These specific values result directly from the fall broadcast P fertilizer treatment combined with the lack of a cover crop. Because there are no cover crops to release root exudates and organic acids, there is no competition for adsorption sites or dissolution of Fe minerals in the sediment. Consequently, the surface-applied P readily and predominantly adsorbs to available Fe sites, leading to the high 54% fraction of Fe-adsorbed P, while the remaining P distributes among other stable soil mineral phases. | Full points for estimating Fe-adsorbed P as the dominant phase (~50-60%), followed by Apatite-like P (~20-30%) and Clay-Al-adsorbed P (~15-20%), with minor CaCO3-adsorbed P. Deduct points if Fe-adsorbed P is not identified as the majority phase or if fractions deviate significantly from the ground truth. |
| q3 | reasoning | 30 | Explain the chemical reasoning for why Fe-adsorbed P dominates the speciation in this specific sediment sample, particularly focusing on the impact of the 'no cover crop' management practice. | Fe-adsorbed P dominates the speciation in this sediment sample, accounting for 54% of the total P, directly due to the 'no cover crop' management practice combined with the fall broadcast fertilizer application. In treatments without cover crops, the soil lacks root exudates and organic acids that typically promote the dissolution of Fe minerals or compete for adsorption sites. As a result, the Fe oxide minerals in the sediment remain highly stable and available for binding. When the fall broadcast treatment applies P fertilizer to the soil surface, the P readily adsorbs to these abundant, uninhibited Fe sites, resulting in the strong dominance of Fe-associated P species in the sediment. | Full points for explaining that without cover crops, there is a lack of root exudates and organic acids that would otherwise cause ligand-promoted dissolution of Fe minerals or competitive adsorption. Thus, the added P remains strongly associated with Fe oxides. |
Review
#181
sediment
P K
▶
LLM Prompt
Sample Information
Material: sediment
Sample Origin: Kansas Agricultural Watershed field laboratory, Manhattan, Kansas, USA
Sample-Specific Conditions
- Treatment: Spring injected, no cover crop
- Spring injected P fertilizer with no cover crops, sediment from time period 1
Measurement
We plan to measure the P K XANES spectrum of this sample.
Questions
Based on all the information above:
1. What candidate reference spectra (P phases) are needed to model the P K-edge XANES spectrum of this sediment sample using linear combination fitting?
2. Based on the sample conditions (spring injected P fertilizer, no cover crop), estimate the relative fractions of the major P species present in the sediment.
3. Explain why Fe-associated P species dominate this sediment sample under the 'no cover crop' and 'spring injected' management conditions, compared to systems with cover crops.
Ground Truth
Material: sediment
Measurement: P K-edge XANES, fluorescence mode, Sector 9-BM-B, Advanced Photon Source
Fit method: Linear combination fitting (LCF)
Phase fractions: (±10%)
| Phase | Fraction |
|---|---|
| Fe-adsorbed P | 0.62 |
| Fe-precipitated P | 0.1 |
| Clay-Al-adsorbed P | 0.13 |
| Apatite-like P | 0.15 |
Fit basis (paper's reference spectra):
- Fe-adsorbed P
- Fe-precipitated P
- Clay-Al-adsorbed P
- Apatite-like P
Source evidence: Figure 7, page 391
Key reasoning: In sediments, the no cover crop treatments (like SI-NC) were dominated by Fe-associated P species (Fe-adsorbed and Fe-precipitated P). Without cover crops, there is a lack of root exudates and organic acids that would otherwise cause ligand-promoted dissolution or competitive adsorption, allowing P to remain strongly bound to Fe minerals. Additionally, the spring injected treatment showed higher Fe-associated P species than the fall broadcast treatment in sediments.
Reasoning source: Section 3.2, page 393
Scoring Rubric (total: 100 pts)
| Q | Type | Max | Question | Reference Answer | Scoring Criteria |
|---|---|---|---|---|---|
| q1 | identification | 20 | What candidate reference spectra (P phases) are needed to model the P K-edge XANES spectrum of this sediment sample using linear combination fitting? | To model the P K-edge XANES spectrum of this sediment sample using linear combination fitting, the required candidate reference spectra are Fe-adsorbed P, Fe-precipitated P, Clay-Al-adsorbed P, and Apatite-like P. These specific phases are expected because the sample is a sediment from an agricultural field treated with spring-injected P fertilizer and no cover crops. Under these "no cover crop" conditions, the soil lacks root exudates and organic acids that would otherwise drive competitive adsorption or ligand-promoted dissolution. Consequently, the applied phosphorus remains strongly bound to soil minerals, resulting in a phase assemblage dominated by Fe-associated P species alongside minor clay-Al and apatite-like phases. | Full points if the answer identifies Fe-adsorbed P, Fe-precipitated P, Clay-Al-adsorbed P, and Apatite-like P as the necessary reference spectra. |
| q2 | quantification | 40 | Based on the sample conditions (spring injected P fertilizer, no cover crop), estimate the relative fractions of the major P species present in the sediment. | Based on linear combination fitting, the estimated relative fractions of P species in this sediment sample are 0.62 for Fe-adsorbed P, 0.10 for Fe-precipitated P, 0.13 for Clay-Al-adsorbed P, and 0.15 for Apatite-like P, with an uncertainty of 10%. These specific values, which show a clear dominance of Fe-associated P (totaling 72%), result directly from the spring injected and no cover crop treatments. Without cover crops, the sediment lacks the root exudates and organic acids necessary to mobilize phosphorus via competitive adsorption or ligand-promoted dissolution of iron minerals. Furthermore, the spring injection method specifically promotes a higher accumulation of Fe-associated P species in sediments compared to fall broadcast treatments, explaining the exceptionally high 0.62 fraction of Fe-adsorbed P. | Full points if the estimated fractions are within ±10% of the ground truth: Fe-adsorbed P (~62%), Fe-precipitated P (~10%), Clay-Al-adsorbed P (~13%), and Apatite-like P (~15%). Partial credit for correctly identifying Fe-adsorbed P as the dominant phase (>50%). |
| q3 | reasoning | 40 | Explain why Fe-associated P species dominate this sediment sample under the 'no cover crop' and 'spring injected' management conditions, compared to systems with cover crops. | Fe-associated P species, specifically Fe-adsorbed P and Fe-precipitated P, dominate this sediment sample due to the combined effects of the "no cover crop" and "spring injected" management practices. In the absence of cover crops, the soil environment lacks root exudates and organic acids that are typically produced by active plant roots. Without these organic compounds, there is no ligand-promoted dissolution or competitive adsorption to mobilize the phosphorus away from metal oxides. As a result, the injected P fertilizer remains strongly bound to iron minerals in the sediment. Additionally, the spring injection application method inherently leads to higher retention of Fe-associated P species in these sediments compared to alternative methods like fall broadcasting. | Full points if the explanation notes that the absence of cover crops means a lack of root exudates/organic acids, preventing ligand-promoted dissolution or competitive adsorption that would otherwise transform Fe-associated P into other forms (like Clay-Al-adsorbed P). Must also mention that spring injection tends to result in higher Fe-associated P than fall broadcast. |
Review
#182
sediment
P K
▶
LLM Prompt
Sample Information
Material: sediment
Sample Origin: Kansas Agricultural Watershed field laboratory, Manhattan, Kansas, USA
Sample-Specific Conditions
- Treatment: Control, with cover crop
- Control (no P fertilizer) with cover crops, sediment from time period 1
Measurement
We plan to measure the P K XANES spectrum of this sample.
Questions
Based on all the information above:
1. Based on the environmental conditions and sample origin (agricultural runoff sediment from a no-P fertilizer control plot with cover crops), what candidate reference spectra should be included in the linear combination fitting (LCF) basis to model the P K-edge XANES spectrum?
2. Estimate the relative fractions of the major phosphorus species in this sediment sample. Provide quantitative estimates.
3. Explain the biogeochemical reasoning for why this specific treatment (control with cover crops) results in this particular P speciation, specifically addressing the balance between Fe-associated P and Clay-Al-associated P.
Ground Truth
Material: sediment
Measurement: P K-edge XANES in fluorescence mode at Sector 9-BM-B, Advanced Photon Source
Fit method: Linear combination fitting (LCF)
Phase fractions: (±15%)
| Phase | Fraction |
|---|---|
| Fe-adsorbed P | 0.32 |
| Fe-precipitated P | 0.06 |
| Clay-Al-adsorbed P | 0.37 |
| Octacalcium phosphate | 0.05 |
| Apatite-like P | 0.2 |
Fit basis (paper's reference spectra):
- Fe-adsorbed P
- Fe-precipitated P
- Clay-Al-adsorbed P
- Octacalcium phosphate
- Apatite-like P
Source evidence: Figure 7, page 391
Key reasoning: In sediments, cover crop treatments were dominated by clay-Al-absorbed P species, whereas no cover crop treatments were dominated by Fe-associated P species. This suggests that the cover crop treatment induced the transformation of Fe-associated P to other P forms. This redistribution is likely due to cover crops changing the Fe chemistry in surface soil via ligand-promoted dissolution by root exudates and competitive adsorption by organic acids.
Reasoning source: Section 3.2, page 393
Scoring Rubric (total: 100 pts)
| Q | Type | Max | Question | Reference Answer | Scoring Criteria |
|---|---|---|---|---|---|
| q1 | identification | 30 | Based on the environmental conditions and sample origin (agricultural runoff sediment from a no-P fertilizer control plot with cover crops), what candidate reference spectra should be included in the linear combination fitting (LCF) basis to model the P K-edge XANES spectrum? | The linear combination fitting (LCF) basis for this sediment sample should include Fe-adsorbed P, Fe-precipitated P, Clay-Al-adsorbed P, Octacalcium phosphate, and Apatite-like P. These specific reference spectra are required because the sample originates from an agricultural control plot treated with cover crops. The cover crop treatment introduces root exudates and organic acids that alter the soil's iron chemistry. This biological activity induces the transformation of phosphorus from predominantly Fe-associated forms into a mixture dominated by Clay-Al-adsorbed P and calcium-bound phases. | Full points for identifying Fe-associated P (adsorbed/precipitated), Al/clay-associated P, and calcium phosphates (apatite-like, octacalcium phosphate). Partial points for missing minor phases. |
| q2 | quantification | 35 | Estimate the relative fractions of the major phosphorus species in this sediment sample. Provide quantitative estimates. | The estimated relative fractions for this sediment sample are 37% Clay-Al-adsorbed P, 32% Fe-adsorbed P, 20% Apatite-like P, 6% Fe-precipitated P, and 5% Octacalcium phosphate, with an estimated uncertainty of 15%. These specific values arise because the cover crop treatment fundamentally redistributes phosphorus speciation in the surface soil. Specifically, organic acids and root exudates from the cover crops drive competitive adsorption and ligand-promoted dissolution. This mechanism reduces the expected amount of Fe-associated P and increases the proportion of Clay-Al-adsorbed P, making it the dominant species in the sediment. | Full points if the estimated fractions are within ±15% of the ground truth (Clay-Al-adsorbed P ~37%, Fe-adsorbed P ~32%, Apatite-like P ~20%, minor Fe-precipitated and Ca-P). Partial points for correctly identifying Clay-Al-adsorbed P and Fe-adsorbed P as the dominant phases. |
| q3 | reasoning | 35 | Explain the biogeochemical reasoning for why this specific treatment (control with cover crops) results in this particular P speciation, specifically addressing the balance between Fe-associated P and Clay-Al-associated P. | The specific phosphorus speciation in this sediment is driven by the presence of the cover crop in the control plot. While treatments without cover crops are typically dominated by Fe-associated P, the addition of cover crops introduces root exudates and organic acids into the surface soil. These organic compounds change the iron chemistry via ligand-promoted dissolution and competitive adsorption at binding sites. As a result, this biogeochemical mechanism induces the transformation and redistribution of Fe-associated P into other forms, leading to a system dominated by Clay-Al-adsorbed P. | Full points for explaining that cover crops induce the transformation of Fe-associated P to other forms (like Clay-Al-adsorbed P) due to changes in Fe chemistry caused by ligand-promoted dissolution from root exudates and competitive adsorption by organic acids. |
Review
#183
sediment
P K
▶
LLM Prompt
Sample Information
Material: sediment
Sample Origin: Kansas Agricultural Watershed field laboratory, Manhattan, Kansas, USA
Sample-Specific Conditions
- Treatment: Fall broadcast, with cover crop
- Fall broadcast P fertilizer with cover crops, sediment from time period 1
Measurement
We plan to measure the P K XANES spectrum of this sample.
Questions
Based on all the information above:
1. Based on the environmental conditions (agricultural runoff sediment, fall broadcast P fertilizer, with cover crops), what candidate reference spectra (P phases) should be included in a linear combination fitting analysis of the P K-edge XANES spectrum?
2. Estimate the relative phase fractions of the P species in this sediment sample. Provide specific percentages for each major phase.
3. Explain the biogeochemical reasoning for why Clay-Al-adsorbed P is the dominant phase in this specific sample (with cover crops), and how the presence of cover crops alters the distribution of Fe-associated P compared to a system without cover crops.
Ground Truth
Material: sediment
Measurement: P K-edge XANES, fluorescence mode, Sector 9-BM-B, Advanced Photon Source
Fit method: Linear combination fitting (LCF)
Phase fractions: (±10%)
| Phase | Fraction |
|---|---|
| Fe-adsorbed P | 0.28 |
| Clay-Al-adsorbed P | 0.42 |
| CaCO3-adsorbed P | 0.18 |
| Apatite-like P | 0.12 |
Fit basis (paper's reference spectra):
- Fe-adsorbed P
- Clay-Al-adsorbed P
- CaCO3-adsorbed P
- Apatite-like P
Source evidence: Figure 7, page 391
Key reasoning: In sediments, cover crop treatments were dominated by clay-Al-adsorbed P species, whereas no cover crop treatments were dominated by Fe-associated P species. This indicates that cover crops induced the transformation of Fe-associated P to other forms. This redistribution is likely due to cover crops altering Fe chemistry in the surface soil via ligand-promoted dissolution by root exudates and competitive adsorption by organic acids.
Reasoning source: Section 3.2, page 393
Scoring Rubric (total: 100 pts)
| Q | Type | Max | Question | Reference Answer | Scoring Criteria |
|---|---|---|---|---|---|
| q1 | identification | 25 | Based on the environmental conditions (agricultural runoff sediment, fall broadcast P fertilizer, with cover crops), what candidate reference spectra (P phases) should be included in a linear combination fitting analysis of the P K-edge XANES spectrum? | The linear combination fitting analysis of the P K-edge XANES spectrum should include Fe-adsorbed P, Clay-Al-adsorbed P, CaCO3-adsorbed P, and Apatite-like P as candidate reference spectra. These specific phases are expected because the sample is an agricultural sediment subjected to fall broadcast P fertilizer and cover crop treatments. The presence of cover crops alters the surface soil chemistry through root exudates and organic acids, which promotes the transformation of Fe-associated P into other forms like Clay-Al-adsorbed P. Consequently, the fitting basis must account for this redistribution among iron, aluminum/clay, calcium carbonate, and apatite mineral surfaces typical of this altered soil environment. | Full points for identifying Fe-adsorbed P, Clay-Al-adsorbed P, CaCO3-adsorbed P, and Apatite-like P as the primary candidate phases. |
| q2 | quantification | 35 | Estimate the relative phase fractions of the P species in this sediment sample. Provide specific percentages for each major phase. | The estimated relative phase fractions for this sediment sample are 42% Clay-Al-adsorbed P, 28% Fe-adsorbed P, 18% CaCO3-adsorbed P, and 12% Apatite-like P, with an uncertainty of 10%. These specific values result directly from the fall broadcast P fertilizer treatment combined with the presence of cover crops. The cover crops induce a redistribution of phosphorus by altering Fe chemistry in the surface soil via ligand-promoted dissolution by root exudates and competitive adsorption by organic acids. As a result, the system shifts away from being dominated by Fe-associated P to being dominated by the 42% Clay-Al-adsorbed P fraction. | Full points if the estimated fractions are within ±10% of the ground truth: Clay-Al-adsorbed P (~42%), Fe-adsorbed P (~28%), CaCO3-adsorbed P (~18%), and Apatite-like P (~12%). |
| q3 | reasoning | 40 | Explain the biogeochemical reasoning for why Clay-Al-adsorbed P is the dominant phase in this specific sample (with cover crops), and how the presence of cover crops alters the distribution of Fe-associated P compared to a system without cover crops. | In this sediment sample, Clay-Al-adsorbed P is the dominant phase because the cover crop treatment actively induces the transformation of Fe-associated P to other forms. In treatments without cover crops, Fe-associated P species typically dominate the sediment. However, the presence of cover crops alters the Fe chemistry in the surface soil through ligand-promoted dissolution driven by root exudates. Additionally, organic acids from the cover crops cause competitive adsorption, which further drives the redistribution of phosphorus away from iron oxides and toward clay-aluminum surfaces. | Full points for explaining that cover crops induce the transformation of Fe-associated P to other forms (like Clay-Al-adsorbed P) due to root exudates and organic acids causing ligand-promoted dissolution of Fe minerals and competitive adsorption for binding sites. |
Review
#184
sediment
P K
▶
LLM Prompt
Sample Information
Material: sediment
Sample Origin: Kansas Agricultural Watershed field laboratory, Manhattan, Kansas, USA
Sample-Specific Conditions
- Treatment: Spring injected, with cover crop
- Spring injected P fertilizer with cover crops, sediment from time period 1
Measurement
We plan to measure the P K XANES spectrum of this sample.
Questions
Based on all the information above:
1. Based on the sample conditions (sediment from a field with spring injected P fertilizer and a cover crop), estimate the relative fractions of the major P species present.
2. Explain the physical and chemical mechanisms by which the presence of a cover crop alters the P speciation in this sediment sample, specifically regarding the balance between Fe-associated P and Clay-Al-adsorbed P.
3. What specific reference spectra would be required as a basis set to successfully model the P K-edge XANES spectrum of this sediment sample using linear combination fitting?
Ground Truth
Material: sediment
Measurement: P K-edge fluorescence mode at Sector 9-BM-B, Advanced Photon Source
Fit method: Linear combination fitting (LCF)
Phase fractions: (±15%)
| Phase | Fraction |
|---|---|
| Fe-adsorbed P | 0.32 |
| Fe-precipitated P | 0.06 |
| Clay-Al-adsorbed P | 0.4 |
| CaCO3-adsorbed P | 0.04 |
| Apatite-like P | 0.18 |
Fit basis (paper's reference spectra):
- Fe-adsorbed P
- Fe-precipitated P
- Clay-Al-adsorbed P
- CaCO3-adsorbed P
- Apatite-like P
Source evidence: Figure 7, page 391
Key reasoning: In sediments, cover crop treatments were dominated by clay-Al-adsorbed P species, whereas no cover crop treatments were dominated by Fe-associated P species. This suggests that the cover crop treatment induced the transformation of Fe-associated P to other P forms. This redistribution is likely due to cover crops changing the Fe chemistry in the surface soil via ligand-promoted dissolution by root exudates, competitive adsorption by organic acids, and redistribution of residual P.
Reasoning source: Section 3.2, page 393
Scoring Rubric (total: 100 pts)
| Q | Type | Max | Question | Reference Answer | Scoring Criteria |
|---|---|---|---|---|---|
| q1 | quantification | 40 | Based on the sample conditions (sediment from a field with spring injected P fertilizer and a cover crop), estimate the relative fractions of the major P species present. | The relative fractions of P species in this sediment sample are estimated to be 40% Clay-Al-adsorbed P, 32% Fe-adsorbed P, 18% Apatite-like P, 6% Fe-precipitated P, and 4% CaCO3-adsorbed P, with an uncertainty of 15%. These specific values result directly from the agricultural treatment conditions, specifically the presence of a cover crop alongside the spring-injected P fertilizer. The cover crop alters the iron chemistry in the surface soil, inducing a transformation and redistribution of phosphorus away from Fe-associated forms. This shift occurs because root exudates cause ligand-promoted dissolution and organic acids competitively adsorb to mineral sites, ultimately leading to the observed dominance of Clay-Al-adsorbed P (40%) over the combined Fe-associated P species. | Award full points if the predicted fractions are within ±15% of the ground truth values (Clay-Al-adsorbed P ~40%, Fe-adsorbed P ~32%, Apatite-like P ~18%, Fe-precipitated P ~6%, CaCO3-adsorbed P ~4%). Deduct points proportionally for larger deviations or missing major phases. |
| q2 | reasoning | 40 | Explain the physical and chemical mechanisms by which the presence of a cover crop alters the P speciation in this sediment sample, specifically regarding the balance between Fe-associated P and Clay-Al-adsorbed P. | In this sediment sample, the spring-injected P fertilizer and cover crop treatment fundamentally alter the soil chemistry, shifting the dominant phosphorus species from Fe-associated P to Clay-Al-adsorbed P. This redistribution is driven by the cover crop changing the iron chemistry in the surface soil through biological weathering mechanisms. Specifically, root exudates from the cover crop cause ligand-promoted dissolution of iron minerals. Furthermore, organic acids introduced by the cover crop engage in competitive adsorption, displacing phosphorus from iron binding sites. Together, these mechanisms force the redistribution of residual P, explaining why Clay-Al-adsorbed P becomes the dominant phase in cover-cropped sediments. | Award full points if the answer explains that cover crops induce the transformation of Fe-associated P to other forms (like Clay-Al-adsorbed P) due to changes in Fe chemistry caused by ligand-promoted dissolution by root exudates and competitive adsorption by organic acids. |
| q3 | identification | 20 | What specific reference spectra would be required as a basis set to successfully model the P K-edge XANES spectrum of this sediment sample using linear combination fitting? | To successfully model the P K-edge XANES spectrum of this sediment sample using linear combination fitting, the required basis set must include Fe-adsorbed P, Fe-precipitated P, Clay-Al-adsorbed P, CaCO3-adsorbed P, and Apatite-like P. These specific phases are expected because the sample is an agricultural sediment subjected to spring-injected P fertilizer and a cover crop, which creates a complex mixture of mineral-bound and adsorbed phosphorus. The cover crop treatment actively changes the soil's Fe chemistry via ligand-promoted dissolution by root exudates and competitive adsorption by organic acids. This treatment-induced redistribution of residual P necessitates a basis set that can capture the resulting dominance of Clay-Al-adsorbed P, while still accounting for the remaining Fe-associated, calcium-bound, and apatite-like P species. | Award full points if the answer lists the correct basis components: Fe-adsorbed P, Fe-precipitated P, Clay-Al-adsorbed P, CaCO3-adsorbed P, and Apatite-like P. |
Review
#185
sediment
P K
▶
LLM Prompt
Sample Information
Material: sediment
Sample Origin: Kansas Agricultural Watershed field laboratory, Manhattan, Kansas, USA
Sample-Specific Conditions
- Treatment: Fall broadcast, no cover crop
- Fall broadcast P fertilizer with no cover crops, sediment from time period 3
Measurement
We plan to measure the P K XANES spectrum of this sample.
Questions
Based on all the information above:
1. Based on the sample conditions (sediment from a fall broadcast P fertilizer treatment with no cover crops), what are the likely P phases present and their approximate fractions?
2. What reference spectra would be necessary to perform a linear combination fitting (LCF) analysis of the P K-edge XANES spectrum for this sediment sample?
3. Explain the physical reasoning for why Fe-adsorbed P remains a dominant phase in this sample (no cover crop) compared to systems where cover crops are used.
Ground Truth
Material: sediment
Measurement: P K-edge XANES, fluorescence mode, Sector 9-BM-B, Advanced Photon Source
Fit method: Linear combination fitting (LCF)
Phase fractions: (±15%)
| Phase | Fraction |
|---|---|
| Fe-adsorbed P | 0.38 |
| Clay-Al-adsorbed P | 0.32 |
| Apatite-like P | 0.3 |
Fit basis (paper's reference spectra):
- Fe-adsorbed P
- Clay-Al-adsorbed P
- CaCO3-adsorbed P
- Apatite-like P
Source evidence: Figure 8, page 392
Key reasoning: In sediments, no cover crop treatments were dominated by Fe-associated P species, whereas cover crop treatments were dominated by clay-Al-adsorbed P species. The absence of cover crops leaves Fe-associated P as a major component. When cover crops are present, they induce the transformation of Fe-associated P to other forms (like clay-Al-adsorbed P) via ligand-promoted dissolution by root exudates and competitive adsorption by organic acids.
Reasoning source: Section 3.2, page 393
Scoring Rubric (total: 100 pts)
| Q | Type | Max | Question | Reference Answer | Scoring Criteria |
|---|---|---|---|---|---|
| q1 | quantification | 40 | Based on the sample conditions (sediment from a fall broadcast P fertilizer treatment with no cover crops), what are the likely P phases present and their approximate fractions? | The likely P phases and their approximate fractions in this sediment sample are Fe-adsorbed P (0.38), Clay-Al-adsorbed P (0.32), and Apatite-like P (0.30), with a fitting uncertainty of 15%. These specific values arise because the fall broadcast P fertilizer treatment was applied without a cover crop, leaving Fe-associated P as the dominant component. Without cover crops, there is an absence of root exudates and organic acids that would normally drive the transformation of Fe-associated P into clay-Al-adsorbed P via ligand-promoted dissolution and competitive adsorption. Thus, Fe-adsorbed P remains the highest fraction, while Clay-Al-adsorbed P and Apatite-like P make up the remainder of the fitted species. | Full points for identifying Fe-adsorbed P, Clay-Al-adsorbed P, and Apatite-like P with fractions around 30-40% each. Partial points for missing one phase or being off by >15%. |
| q2 | identification | 30 | What reference spectra would be necessary to perform a linear combination fitting (LCF) analysis of the P K-edge XANES spectrum for this sediment sample? | To perform a linear combination fitting (LCF) analysis on this sediment sample, the necessary reference spectra in the fit basis are Fe-adsorbed P, Clay-Al-adsorbed P, CaCO3-adsorbed P, and Apatite-like P. These specific phases are expected because the sample is an agricultural sediment treated with fall broadcast P fertilizer without a cover crop. In the absence of cover crops, Fe-associated P remains a major component because there are no root exudates or organic acids to drive its transformation via ligand-promoted dissolution or competitive adsorption. Therefore, the LCF basis must account for this dominant Fe-adsorbed P phase, alongside the other expected sediment components like Clay-Al-adsorbed P, CaCO3-adsorbed P, and Apatite-like P. | Full points for listing Fe-adsorbed P, Clay-Al-adsorbed P, and Apatite-like P (or similar calcium phosphate/iron phosphate/aluminum phosphate references). |
| q3 | reasoning | 30 | Explain the physical reasoning for why Fe-adsorbed P remains a dominant phase in this sample (no cover crop) compared to systems where cover crops are used. | Fe-adsorbed P remains a dominant phase in this sediment sample (comprising 38% of the P species) because the fall broadcast P fertilizer treatment was applied with no cover crops. When cover crops are present, they release root exudates and organic acids that induce the transformation of Fe-associated P to other forms, such as clay-Al-adsorbed P, through ligand-promoted dissolution and competitive adsorption. The absence of cover crops in this specific treatment means these organic-driven transformation mechanisms do not occur. Consequently, the Fe-associated P is not dissolved or outcompeted, allowing it to persist as the major P component in the sediment. | Full points for explaining that without cover crops, there is a lack of root exudates and organic acids that would otherwise cause ligand-promoted dissolution or competitive adsorption, which typically transforms Fe-associated P into other forms like clay-Al-adsorbed P. |
Review
#186
sediment
P K
▶
LLM Prompt
Sample Information
Material: sediment
Sample Origin: Kansas Agricultural Watershed field laboratory, Manhattan, Kansas, USA
Sample-Specific Conditions
- Treatment: Spring injected, no cover crop
- Spring injected P fertilizer with no cover crops, sediment from time period 3
Measurement
We plan to measure the P K XANES spectrum of this sample.
Questions
Based on all the information above:
1. What candidate reference spectra should be included in a linear combination fitting (LCF) analysis of the P K-edge XANES spectrum for this sediment sample?
2. Estimate the relative phase fractions of the P species in this sediment sample under the spring injected, no cover crop treatment.
3. Explain the physical and chemical reasoning for why Fe-associated P species dominate this sample, considering the specific agricultural management practices (no cover crop, spring injected fertilizer).
Ground Truth
Material: sediment
Measurement: P K-edge XANES, fluorescence mode, Sector 9-BM-B, Advanced Photon Source
Fit method: linear combination fitting (LCF)
Phase fractions: (±15%)
| Phase | Fraction |
|---|---|
| Fe-adsorbed P | 0.6 |
| Clay-Al-adsorbed P | 0.05 |
| Octacalcium phosphate | 0.05 |
| Apatite-like P | 0.3 |
Fit basis (paper's reference spectra):
- Fe-adsorbed P
- Clay-Al-adsorbed P
- Octacalcium phosphate
- Apatite-like P
Source evidence: Figure 8, page 392
Key reasoning: In sediments, the no cover crop treatments were dominated by Fe-associated P species. The absence of cover crops means there is less ligand-promoted dissolution by root exudates and less competitive adsorption by organic acids, which would otherwise transform Fe-associated P to other forms like clay-Al-adsorbed P. Additionally, the spring injected treatment showed higher Fe-associated P species than the fall broadcast treatment, which could lead to less exchangeable P.
Reasoning source: Section 3.2, page 393
Scoring Rubric (total: 100 pts)
| Q | Type | Max | Question | Reference Answer | Scoring Criteria |
|---|---|---|---|---|---|
| q1 | identification | 20 | What candidate reference spectra should be included in a linear combination fitting (LCF) analysis of the P K-edge XANES spectrum for this sediment sample? | The candidate reference spectra for the linear combination fitting (LCF) analysis of this sediment sample should include Fe-adsorbed P, Clay-Al-adsorbed P, Octacalcium phosphate, and Apatite-like P. These specific phases are expected because the sample originates from an agricultural sediment subjected to a spring injected P fertilizer treatment with no cover crops. The absence of cover crops prevents ligand-promoted dissolution by root exudates and competitive adsorption by organic acids, which favors the retention of Fe-associated P over its transformation into other forms like clay-Al-adsorbed P. Furthermore, the spring injected treatment specifically promotes higher levels of Fe-associated P species compared to other application methods, leading to this distinct mixture of iron, aluminum, and calcium-bound phosphates. | Full points for identifying Fe-adsorbed P, Clay-Al-adsorbed P, a calcium phosphate phase (such as Octacalcium phosphate), and Apatite-like P. |
| q2 | quantification | 40 | Estimate the relative phase fractions of the P species in this sediment sample under the spring injected, no cover crop treatment. | The estimated relative phase fractions for this sediment sample are 60% Fe-adsorbed P, 30% Apatite-like P, 5% Clay-Al-adsorbed P, and 5% Octacalcium phosphate, with a fitting uncertainty of 15%. These specific values, heavily dominated by Fe-adsorbed P, result directly from the spring injected, no cover crop treatment. Without cover crops, the system lacks the root exudates and organic acids that would normally cause ligand-promoted dissolution and competitive adsorption, thereby preventing the transformation of Fe-associated P into clay-Al-adsorbed P (which remains low at 5%). Additionally, the spring injection of P fertilizer inherently leads to a higher accumulation of Fe-associated P species and less exchangeable P, explaining the dominant 60% fraction of this specific phase. | Full points for estimating Fe-adsorbed P as the dominant phase (~60%), Apatite-like P as the secondary phase (~30%), and minor contributions (~5% each) from Clay-Al-adsorbed P and Octacalcium phosphate. |
| q3 | reasoning | 40 | Explain the physical and chemical reasoning for why Fe-associated P species dominate this sample, considering the specific agricultural management practices (no cover crop, spring injected fertilizer). | Fe-associated P species dominate this sediment sample due to the combined chemical and physical effects of the no cover crop and spring injected fertilizer treatments. The absence of a cover crop means there are no root exudates to drive ligand-promoted dissolution, nor are there organic acids to cause competitive adsorption. Without these organic interactions, the chemical transformation of Fe-associated P into other forms, such as clay-Al-adsorbed P, is significantly inhibited. Furthermore, the physical practice of spring injecting the fertilizer results in higher levels of Fe-associated P species compared to fall broadcasting, ultimately leading to a system with less exchangeable P and a strong dominance of iron-bound phosphorus. | Full points for explaining that the absence of cover crops prevents the transformation of Fe-associated P, which would otherwise occur via ligand-promoted dissolution by root exudates and competitive adsorption by organic acids. Also mention that spring injected treatments tend to have higher Fe-associated P than fall broadcast treatments. |
Review
#187
sediment
P K
▶
LLM Prompt
Sample Information
Material: sediment
Sample Origin: Kansas Agricultural Watershed field laboratory, Manhattan, Kansas, USA
Sample-Specific Conditions
- Treatment: Control, with cover crop
- Control (no P fertilizer) with cover crops, sediment from time period 3
Measurement
We plan to measure the P K XANES spectrum of this sample.
Questions
Based on all the information above:
1. Based on the environmental conditions (agricultural runoff sediment from a no-till system with cover crops and no P fertilizer), what candidate reference spectra are needed to model the P K-edge XANES spectrum of this sample using linear combination fitting?
2. Estimate the relative phase fractions of the P species present in this specific sediment sample (Control with cover crops, time period 3).
3. Explain the biogeochemical reasoning for why this specific treatment (Control with cover crops) results in this distribution of P species, particularly focusing on the role of the cover crops in altering the dominant P phases compared to a system without cover crops.
Ground Truth
Material: sediment
Measurement: P K-edge XANES in fluorescence mode at Sector 9-BM-B, Advanced Photon Source
Fit method: Linear combination fitting (LCF)
Phase fractions: (±10%)
| Phase | Fraction |
|---|---|
| Fe-adsorbed P | 0.28 |
| Clay-Al-adsorbed P | 0.42 |
| Apatite-like P | 0.3 |
Fit basis (paper's reference spectra):
- Fe-adsorbed P
- Clay-Al-adsorbed P
- Apatite-like P
Source evidence: Figure 8, page 392
Key reasoning: In sediments, cover crop treatments were dominated by clay-Al-absorbed P species, whereas no cover crop treatments were dominated by Fe-associated P species. This suggests that cover crops induced the transformation of Fe-associated P to other P forms. This redistribution is likely due to cover crops changing the Fe chemistry in surface soil via ligand-promoted dissolution by root exudates and competitive adsorption by organic acids.
Reasoning source: Section 3.2 (Phosphorus XANES-soils and sediments), page 393
Scoring Rubric (total: 100 pts)
| Q | Type | Max | Question | Reference Answer | Scoring Criteria |
|---|---|---|---|---|---|
| q1 | identification | 25 | Based on the environmental conditions (agricultural runoff sediment from a no-till system with cover crops and no P fertilizer), what candidate reference spectra are needed to model the P K-edge XANES spectrum of this sample using linear combination fitting? | To model the P K-edge XANES spectrum of this sediment sample using linear combination fitting, the required reference spectra are Fe-adsorbed P, Clay-Al-adsorbed P, and Apatite-like P. These specific phases are expected because the sample is an agricultural sediment from a control treatment (no P fertilizer) that includes cover crops. In this environment, the presence of cover crops alters the soil chemistry through the release of root exudates and organic acids. This biological activity induces the transformation of Fe-associated P into other forms, making clay-Al-adsorbed P the dominant species alongside residual Fe-adsorbed P and stable Apatite-like P. | Full points if the answer identifies Fe-adsorbed P, Clay-Al-adsorbed P, and Apatite-like P as the necessary reference components. Partial credit for identifying at least two of the three. |
| q2 | quantification | 35 | Estimate the relative phase fractions of the P species present in this specific sediment sample (Control with cover crops, time period 3). | The estimated relative phase fractions for this sediment sample are 0.42 for Clay-Al-adsorbed P, 0.30 for Apatite-like P, and 0.28 for Fe-adsorbed P, with an estimated uncertainty of 10%. These specific values result directly from the application of cover crops in the control treatment without P fertilizer. The cover crops release root exudates and organic acids that cause ligand-promoted dissolution and competitive adsorption, fundamentally changing the Fe chemistry in the surface soil. Consequently, this mechanism drives the redistribution of phosphorus, reducing the Fe-associated P fraction to 28% and causing the system to be dominated by the 42% Clay-Al-adsorbed P fraction. | Full points if the estimated fractions are within ±10% of the ground truth: Clay-Al-adsorbed P (~42%), Apatite-like P (~30%), and Fe-adsorbed P (~28%). Partial credit if the relative abundance order is correct (Clay-Al-adsorbed > Apatite-like > Fe-adsorbed). |
| q3 | reasoning | 40 | Explain the biogeochemical reasoning for why this specific treatment (Control with cover crops) results in this distribution of P species, particularly focusing on the role of the cover crops in altering the dominant P phases compared to a system without cover crops. | The distribution of P species in this sediment sample is primarily driven by the presence of cover crops in the unfertilized control treatment. While sediments without cover crops are typically dominated by Fe-associated P species, the introduction of cover crops fundamentally changes the Fe chemistry in the surface soil. Specifically, root exudates cause ligand-promoted dissolution, and organic acids lead to competitive adsorption at Fe binding sites. This biogeochemical mechanism induces the transformation and redistribution of Fe-associated P into other forms, ultimately resulting in a sediment profile dominated by clay-Al-absorbed P species. | Full points if the answer explains that cover crops induce the transformation of Fe-associated P to Clay-Al-adsorbed P (or other forms) due to changes in Fe chemistry via ligand-promoted dissolution by root exudates and competitive adsorption by organic acids. |
Review
Evaluation of preservation protocols for oxygen‐sensitive minerals within laminated aquatic sediments
APS
Environmental
Gabrielle Ledesma, Raisa Islam, Elizabeth D. Swanner
DOI: 10.1002/lom3.10533
4 scenarios
▶
#188
sediment
Fe K-edge
▶
LLM Prompt
Sample Information
Material: sediment
Sample Origin: Brownie Lake, Minnesota, USA
Sample-Specific Conditions
- Preparation: freeze core thin section
- freeze core thin section
Measurement
We plan to measure the Fe K-edge XANES spectrum of this sample.
Questions
Based on all the information above:
1. Given the anoxic environment of Brownie Lake and the specialized anoxic embedding preparation (freeze core thin section), what is the expected dominant oxidation state of iron in this sediment sample, and what physical reasoning supports this expectation?
2. To verify the oxidation state of iron in this sample using XANES, what specific candidate reference spectra should be included in the analysis for comparison?
Ground Truth
Material: sediment
Measurement: Fe K-edge XANES, fluorescence mode, beamline 13-IDE
Fit method: Pre-edge peak fitting and comparison to reference spectra
Fit basis (paper's reference spectra):
- pyrite
- siderite
- ferrihydrite
Source evidence: Table 3, Figure 2, pages 15-17
Key reasoning: The preservation of the Fe(II) oxidation state was confirmed by fitting the pre-edge peaks of the embedded thin section and comparing the centroid position to a bulk sediment sample. The centroid energy (7112.74 eV) and peak shape are consistent with Fe(II) reference materials like siderite and pyrite, and lack the higher energy shift characteristic of Fe(III) oxides like ferrihydrite. This indicates the anoxic embedding protocol successfully prevented oxidation.
Reasoning source: Assessment section, pages 15-17
Scoring Rubric (total: 100 pts)
| Q | Type | Max | Question | Reference Answer | Scoring Criteria |
|---|---|---|---|---|---|
| q1 | reasoning | 54 | Given the anoxic environment of Brownie Lake and the specialized anoxic embedding preparation (freeze core thin section), what is the expected dominant oxidation state of iron in this sediment sample, and what physical reasoning supports this expectation? | The expected dominant oxidation state of iron in this sediment sample is Fe(II). This expectation arises because the specialized anoxic embedding protocol using a freeze core thin section successfully prevents oxidation of the sample during preparation. Spectroscopically, this preservation is confirmed by the pre-edge peak centroid energy at 7112.74 eV and the peak shape, which lack the higher energy shift characteristic of Fe(III) oxides. Therefore, the sample conditions maintain the native Fe(II) state found in the sediment, consistent with Fe(II) phases rather than oxidized Fe(III) phases like ferrihydrite. | Full points for identifying Fe(II) / Fe2+ as the dominant state and explaining that the anoxic conditions of the lake and the oxygen-free preparation protocol prevent oxidation to Fe(III). |
| q2 | identification | 46 | To verify the oxidation state of iron in this sample using XANES, what specific candidate reference spectra should be included in the analysis for comparison? | The specific candidate reference spectra that should be included in the analysis are pyrite, siderite, and ferrihydrite. These references are necessary because the freeze core thin section preparation aims to preserve the native anoxic state of the sediment. Pyrite and siderite serve as essential Fe(II) reference materials to confirm the preservation of the Fe(II) oxidation state, which is characterized by a pre-edge centroid energy of 7112.74 eV. Conversely, ferrihydrite must be included as an Fe(III) oxide reference to verify the absence of a higher energy shift, thereby proving that the anoxic embedding protocol successfully prevented unwanted oxidation. | Full points for listing Fe(II) standards such as siderite or pyrite, and an Fe(III) standard such as ferrihydrite for contrast. |
Review
#189
sediment trap particulate
Fe K-edge
▶
LLM Prompt
Sample Information
Material: sediment trap particulate
Sample Origin: Brownie Lake, Minnesota, USA
Sample-Specific Conditions
- Preparation: bulk particulates
- bulk particulates
Measurement
We plan to measure the Fe K-edge XANES spectrum of this sample.
Questions
Based on all the information above:
1. Based on the preparation method (bulk particulates vs. targeted microXANES), what oxidation state of iron is expected to dominate the bulk XANES signal of this sediment trap sample, and why might it differ from targeted micro-analyses?
2. Describe the expected pre-edge peak characteristics (number of peaks and energy position) for this bulk sediment trap sample, and explain how its position compares to more reduced samples.
3. If one were to perform linear combination fitting (LCF) on this bulk sediment trap sample, what specific types of reference spectra should be included in the fit basis to account for the observed oxidation state?
Ground Truth
Material: sediment trap particulate
Measurement: Fe K-edge XANES, fluorescence mode, beamline 9-BM
Fit method: Pre-edge peak fitting
Fit basis (paper's reference spectra):
- Gaussian peak
Source evidence: Table 3 and Page 17, lines 322-334
Key reasoning: The bulk sediment trap sample (BL10pt5) was fit with a single Gaussian pre-edge peak with a centroid energy of 7113.37 eV. This higher energy indicates the Fe in the bulk sample is more oxidized than in the embedded microXANES samples. This oxidized signal likely originates from Fe(II) and Fe(III) bearing clays or other less concentrated oxidized iron phases that contribute substantially to the bulk signal but were missed when targeting specific Fe-rich particles for microXANES.
Reasoning source: Page 17, lines 322-334
Scoring Rubric (total: 100 pts)
| Q | Type | Max | Question | Reference Answer | Scoring Criteria |
|---|---|---|---|---|---|
| q1 | reasoning | 40 | Based on the preparation method (bulk particulates vs. targeted microXANES), what oxidation state of iron is expected to dominate the bulk XANES signal of this sediment trap sample, and why might it differ from targeted micro-analyses? | The bulk XANES signal of this sediment trap particulate sample is expected to be dominated by a mixed 2+ and 3+ oxidation state, representing a more oxidized iron pool than targeted micro-analyses. This difference arises directly from the bulk particulate preparation method, which captures the average signal of the entire sample rather than focusing on specific Fe-rich particles. Because the bulk measurement averages the whole sample, it includes substantial contributions from less concentrated, widely distributed oxidized iron phases, such as Fe(II) and Fe(III) bearing clays. Consequently, the bulk signal reflects these more oxidized phases that are typically missed when microXANES targets specific, more reduced iron-rich particles. | The answer must identify that oxidized Fe (Fe3+) dominates the bulk signal. It must explain that bulk analysis captures less concentrated phases like Fe-bearing clays, whereas microXANES tends to target specific Fe-rich (and often more reduced) particles. |
| q2 | spectral | 30 | Describe the expected pre-edge peak characteristics (number of peaks and energy position) for this bulk sediment trap sample, and explain how its position compares to more reduced samples. | The Fe K-edge XANES spectrum for this bulk sediment trap sample is expected to exhibit a single pre-edge peak that can be fit with a single Gaussian function. The centroid energy position of this pre-edge peak is located at 7113.37 eV, with an intensity of 0.068. This peak position is shifted to a higher energy by more than 1 eV compared to less oxidized, embedded microXANES samples. This higher energy position occurs because the bulk particulate preparation captures a substantial signal from more oxidized iron phases, such as mixed Fe(II) and Fe(III) bearing clays, which inherently shift the pre-edge absorption feature to higher energies relative to the more reduced targeted particles. | The answer must state that the pre-edge is fit by a single peak (Gaussian) located at approximately 7113.37 eV, and note that this position is shifted to higher energy (>1 eV higher) compared to more reduced samples. |
| q3 | prediction | 30 | If one were to perform linear combination fitting (LCF) on this bulk sediment trap sample, what specific types of reference spectra should be included in the fit basis to account for the observed oxidation state? | To accurately model this bulk sediment trap sample using linear combination fitting, the fit basis must include reference spectra for oxidized iron phases, specifically mixed Fe(II) and Fe(III) bearing clays. These specific references are required because the bulk particulate preparation captures an averaged signal that includes less concentrated but widely distributed oxidized phases. The observed pre-edge peak at 7113.37 eV confirms that the bulk material is more oxidized than targeted micro-analyses of specific Fe-rich particles. Therefore, including Fe(II) and Fe(III) clay references ensures the fit accounts for the mixed 2+ and 3+ oxidation states that actually dominate the bulk sediment trap material. | The answer must suggest oxidized Fe standards, specifically mentioning Fe(III)-bearing clays or Fe(III) oxides, as these are the phases that contribute substantially to the bulk oxidized signal. |
Review
#190
sediment
Mn K-edge
▶
LLM Prompt
Sample Information
Material: sediment
Sample Origin: Brownie Lake, Minnesota, USA
Sample-Specific Conditions
- Preparation: freeze core thin section
- freeze core thin section
Measurement
We plan to measure the Mn K-edge XANES spectrum of this sample.
Questions
Based on all the information above:
1. What candidate reference spectra should be included in the analysis to properly evaluate the speciation and oxidation state of manganese in this sediment sample?
Ground Truth
Material: sediment
Measurement: Mn K-edge microXANES in fluorescence mode at beamline 13-IDE
Fit method: Principal component analysis to identify end-members, followed by qualitative comparison of E0 and spectral shape to reference spectra
Fit basis (paper's reference spectra):
- rhodocrosite (Mn-carbonate)
- hureaulite (Mn-phosphate)
- aqueous Mn2+
- phyllomanganate
Source evidence: Page 18, Lines 337-345; Figure 3
Key reasoning: The average E0 of the thin section end-member spectra was 6546.05 eV, which is consistent with the Mn2+ oxidation state. The end-member Mn XANES of the sediment sample had a similar pre-edge peak to Mn-carbonate and peak shapes like aqueous Mn2+, and lacked the energy shift characteristic of an oxide. This indicates the oxidation state was preserved during embedding and is predominantly Mn2+.
Reasoning source: Assessment section, Page 18
Scoring Rubric (total: 100 pts)
| Q | Type | Max | Question | Reference Answer | Scoring Criteria |
|---|---|---|---|---|---|
| q2 | identification | 100 | What candidate reference spectra should be included in the analysis to properly evaluate the speciation and oxidation state of manganese in this sediment sample? | To properly evaluate the manganese speciation in this Brownie Lake sediment sample, the analysis should include reference spectra for rhodocrosite (Mn-carbonate), hureaulite (Mn-phosphate), aqueous Mn2+, and phyllomanganate. These specific phases are expected because the freeze core thin section preparation successfully preserves the native oxidation state of the sediment, which is predominantly Mn2+. The sample's end-member spectra exhibit an average E0 of 6546.05 eV and lack the energy shift characteristic of an oxide, confirming this preserved Mn2+ state. Consequently, references like Mn-carbonate and aqueous Mn2+ are essential, as the sediment's XANES data displays a pre-edge peak similar to Mn-carbonate and peak shapes resembling aqueous Mn2+. | Must list appropriate reference spectra including Mn(II) species such as Mn-carbonate (rhodocrosite), Mn-phosphate (hureaulite), or aqueous Mn2+, as well as a higher-valent Mn oxide (e.g., phyllomanganate) to rule out oxidation. |
Review
#191
sediment
S K-edge
▶
LLM Prompt
Sample Information
Material: sediment
Sample Origin: Brownie Lake, Minnesota, USA
Sample-Specific Conditions
- Preparation: freeze core thin section
- freeze core thin section
Measurement
We plan to measure the S K-edge XANES spectrum of this sample.
Questions
Based on all the information above:
1. Based on the environmental conditions (anoxic sediment from a meromictic lake) and the preparation method (freeze core thin section with acetone dehydration), what sulfur phase is expected to dominate the sample's native signal, and why might other typical sediment sulfur phases be absent?
2. When analyzing the S K-edge microXANES spectrum of this embedded thin section, what mathematical functions or reference components are necessary to fit the data, and what major artifact must be accounted for?
3. If the sample preparation had not successfully maintained anoxic conditions, what new sulfur phase would be expected to appear in the XANES spectrum, and what does its absence in this sample indicate about the preparation protocol?
Ground Truth
Material: sediment
Measurement: S K-edge microXANES in fluorescence mode at beamline 13-IDE
Fit method: Peak fitting
Fit basis (paper's reference spectra):
- Gaussian peaks
- arctangent function
Source evidence: Figure 4a, Page 22, Lines 377-385
Key reasoning: The microXANES spectrum of the thin section was fit with Gaussian peaks. After accounting for four peaks attributable to the Spurr's resin used for embedding, the remaining sample peaks at 2470.45 and 2479.85 eV were assigned to an inorganic monosulfide, likely FeS. The absence of sulfate peaks indicates no oxidation occurred during preparation, while the absence of elemental or organic S peaks suggests they may have been solubilized during acetone washes.
Reasoning source: Page 22, Lines 377-385
Scoring Rubric (total: 100 pts)
| Q | Type | Max | Question | Reference Answer | Scoring Criteria |
|---|---|---|---|---|---|
| q1 | reasoning | 40 | Based on the environmental conditions (anoxic sediment from a meromictic lake) and the preparation method (freeze core thin section with acetone dehydration), what sulfur phase is expected to dominate the sample's native signal, and why might other typical sediment sulfur phases be absent? | The native sulfur signal in this sediment sample is expected to be dominated by an inorganic monosulfide, likely FeS, characterized by peaks at 2470.45 and 2479.85 eV. This phase dominates because the freeze core thin section preparation successfully prevented oxidation, which would have otherwise altered the native state. Other typical sediment sulfur phases, such as elemental or organic sulfur, are absent from the spectrum. Their absence is directly attributed to the preparation conditions, as these phases were likely solubilized and removed during the acetone washes used for dehydration. | Must identify FeS (or inorganic monosulfide) as the dominant phase. Must explain that sulfate is absent due to lack of oxidation during preparation, and elemental/organic sulfur may be absent because they were solubilized during the acetone washes used in the embedding process. |
| q2 | identification | 30 | When analyzing the S K-edge microXANES spectrum of this embedded thin section, what mathematical functions or reference components are necessary to fit the data, and what major artifact must be accounted for? | To fit the S K-edge microXANES spectrum of this sediment sample, a peak fitting method utilizing Gaussian peaks and an arctangent function is necessary. When performing this fit, a major artifact that must be accounted for is the presence of Spurr's resin, which was used for embedding the freeze core thin section. Specifically, four of the Gaussian peaks in the fit are directly attributable to this resin rather than the native sample. Only after accounting for this embedding artifact can the remaining peaks at 2470.45 and 2479.85 eV be accurately assigned to the sample's native inorganic monosulfide (FeS) content. | Must mention the use of Gaussian peaks and an arctangent step function for fitting. Must explicitly state that sulfur contamination from the embedding resin (Spurr's resin) must be accounted for as an artifact. |
| q3 | prediction | 30 | If the sample preparation had not successfully maintained anoxic conditions, what new sulfur phase would be expected to appear in the XANES spectrum, and what does its absence in this sample indicate about the preparation protocol? | If anoxic conditions had not been maintained during the preparation of the sediment freeze core thin section, sulfate peaks would be expected to appear in the XANES spectrum. The appearance of sulfate would occur because the native inorganic monosulfide (FeS) in the sediment would undergo oxidation upon exposure to air. However, the complete absence of sulfate peaks in the measured spectrum indicates that no oxidation occurred. This demonstrates that the freeze core thin section preparation protocol was highly successful in preserving the native, reduced sulfur state of the sample. | Must predict the appearance of inorganic sulfate. Must state that its absence indicates the sulfur did not become oxidized during the thin section preparation (freezing and anoxic embedding). |
Review
From Molecule to Material: How Support Changes Heterobimetallic Catalysts in Lactide Polymerization
ESRF-BM23
Catalyst
Fan Yang et al.
DOI: 10.1002/marc.202500805
1 scenario
▶
#192
[(THF)KFe(OtBu)2]/SiO2-700
Fe K
▶
LLM Prompt
Sample Information
Material: [(THF)KFe(OtBu)2]/SiO2-700
Support: SiO2-700
Reaction Conditions: Room temperature, transmission mode
Sample-Specific Conditions
- Catalyst state: Supported on silica
- Silica-supported heterobimetallic iron-potassium complex
Measurement
We plan to measure the Fe K XANES spectrum of this sample.
Questions
Based on all the information above:
1. Based on the sample conditions, what is the expected oxidation state and coordination geometry of the iron centers in this silica-supported complex?
2. Describe the expected pre-edge feature in the Fe K-edge XANES spectrum for this sample. Include its position relative to Fe(0) and its normalized intensity.
3. How does the XANES pre-edge feature support the structural assignment of the grafted iron species?
Ground Truth
Material: [(THF)KFe(OtBu)2]/SiO2-700 (2FeK)
Measurement: Fe K-edge, transmission mode, ESRF BM23 beamline
Fit method: not reported
Phase fractions: (±10%)
| Phase | Fraction |
|---|---|
| Fe(II) non-octahedral surface species | 1.0 |
Source evidence: Page 8, Figure S6
Key reasoning: The XANES spectrum shows a pre-edge feature at +1.2 (± 0.2) eV from the Fe(0) edge with a maximum normalized intensity of 0.11. This specific pre-edge position and relatively high intensity indicate that the Fe sites are in a non-octahedral coordination environment with an iron oxidation state of +2. EPR spectroscopy further confirmed the near absence of Fe(III) and Fe(0) species.
Reasoning source: Page 8, Section 2.2
Scoring Rubric (total: 100 pts)
| Q | Type | Max | Question | Reference Answer | Scoring Criteria |
|---|---|---|---|---|---|
| q1 | prediction | 30 | Based on the sample conditions, what is the expected oxidation state and coordination geometry of the iron centers in this silica-supported complex? | The expected oxidation state of the iron centers in the silica-supported [(THF)KFe(OtBu)2]/SiO2-700 complex is +2, and the coordination geometry is non-octahedral. This 100% fraction of Fe(II) non-octahedral surface species arises because the heterobimetallic iron-potassium complex grafts onto the silica support to form [(≡SiO)KFe(OtBu)2(THF)n]. The specific pre-edge position at +1.2 eV from the Fe(0) edge and its relatively high intensity of 0.11 confirm this non-octahedral Fe(II) environment. Furthermore, EPR spectroscopy confirms the near absence of Fe(III) and Fe(0) species in this supported catalyst state. | Full points for predicting an oxidation state of +2 and a non-octahedral coordination geometry. |
| q2 | spectral | 40 | Describe the expected pre-edge feature in the Fe K-edge XANES spectrum for this sample. Include its position relative to Fe(0) and its normalized intensity. | The expected Fe K-edge XANES spectrum for this sample exhibits a distinct pre-edge feature located at +1.2 (± 0.2) eV from the Fe(0) edge, with a maximum normalized intensity of 0.11. Additionally, the main edge is shifted to higher energy compared to an iron foil reference. These specific spectral features arise directly from the structural and electronic properties of the silica-supported heterobimetallic iron-potassium complex. Specifically, the relatively high pre-edge intensity and its energy position are characteristic of the iron sites existing in a non-octahedral coordination environment with a +2 oxidation state, formed upon grafting to the SiO2-700 support. | Full points for stating the pre-edge is located at approximately +1.2 eV from the Fe(0) edge and has a maximum normalized intensity of around 0.11. |
| q3 | reasoning | 30 | How does the XANES pre-edge feature support the structural assignment of the grafted iron species? | The XANES pre-edge feature strongly supports the structural assignment of the grafted iron species as a non-octahedral Fe(II) complex, specifically [(≡SiO)KFe(OtBu)2(THF)n]. The spectrum displays a pre-edge peak at +1.2 (± 0.2) eV from the Fe(0) edge with a relatively high maximum normalized intensity of 0.11. Because the heterobimetallic iron-potassium complex is supported on silica at room temperature, this specific energy position and high intensity directly indicate that the Fe sites maintain a +2 oxidation state in a non-octahedral coordination environment. This structural assignment is further corroborated by EPR spectroscopy, which confirms the near absence of any Fe(III) or Fe(0) species in the sample. | Full points for explaining that the specific position (+1.2 eV from Fe(0)) and relatively high intensity (0.11) of the pre-edge are characteristic of non-octahedral Fe(II) species, confirming the proposed surface structure. |
Review
Determining sulfur speciation in oxidatively crosslinked degradable polymers using sulfur K‐edge X‐ray absorption spectroscopy
APS
Synthesis
Melissa A. Smith et al.
DOI: 10.1002/pol.20240367
4 scenarios
▶
#193
crosslinked polythionocaprolactone
S K
▶
LLM Prompt
Sample Information
Material: crosslinked polythionocaprolactone
Method: oxidative crosslinking
Precursors: polythionocaprolactone, NaOCl
Sample-Specific Conditions
- monomer aliphatic chain length: m=4 (small lactone)
- Oxidatively crosslinked polythionocaprolactone
Preparation
- Synthesized and oxidatively crosslinked using NaOCl in H2O as described in reference [2].
Measurement
We plan to measure the S K XANES spectrum of this sample.
Questions
Based on all the information above:
1. What candidate reference spectra (sulfur-containing functional groups) are needed to construct an appropriate basis set for linear combination fitting of the S K-edge XANES spectrum of this oxidatively crosslinked polythionocaprolactone sample?
Ground Truth
Material: crosslinked polythionocaprolactone (PtnCL-CLP)
Measurement: S K-edge XANES, fluorescence mode, beamline 9-BM at APS
Fit method: Linear combination analysis (LCA)
Phase fractions: (±15%)
| Phase | Fraction |
|---|---|
| thionoester | 0.2 |
| disulfide | 0.39 |
| thioether | 0.31 |
| sulfone | 0.037 |
| sulfate ester | 0.05 |
Fit basis (paper's reference spectra):
- thionoester
- disulfide
- thioether
- sulfone
- sulfate ester
Source evidence: Table 1, Figure 1C, and Figure 2; page 10
Key reasoning: The small lactone polymer (m=4) retains a higher amount of the starting thionoester compared to macrolactones. The formation of crosslinking C-S bonds (yielding thioethers and sulfones) and non-crosslinking sulfate esters proceeds via a [4+2] cycloaddition of sulfinyl intermediates, which requires proper alignment of the sulfinyl groups. This alignment is less likely to be achieved in polymers with very short alkyl chains linking the monomers. In contrast, crosslinking disulfide bonds can form irrespective of the C=S/C=S dihedral angle, resulting in a similar proportion of disulfides across different chain lengths.
Reasoning source: Section 3.3 Chemical and physical insights, page 11
Scoring Rubric (total: 100 pts)
| Q | Type | Max | Question | Reference Answer | Scoring Criteria |
|---|---|---|---|---|---|
| q1 | identification | 100 | What candidate reference spectra (sulfur-containing functional groups) are needed to construct an appropriate basis set for linear combination fitting of the S K-edge XANES spectrum of this oxidatively crosslinked polythionocaprolactone sample? | To construct an appropriate basis set for linear combination fitting of this sample, reference spectra for thionoester, disulfide, thioether, sulfone, and sulfate ester functional groups are required. These specific sulfur species arise from the oxidative crosslinking of the polythionocaprolactone precursor using NaOCl. The thionoester reference accounts for unreacted starting material, which is retained in higher amounts because the small lactone polymer (m=4) has very short alkyl chains. These short chains hinder the proper alignment of sulfinyl intermediates required for the [4+2] cycloaddition that forms crosslinking C-S bonds (yielding thioethers and sulfones) and non-crosslinking sulfate esters. In contrast, crosslinking disulfide bonds can form regardless of the C=S/C=S dihedral angle, making them a major component of the resulting crosslinked network. | Award full points if the answer identifies thionoester (or unreacted starting material), disulfide, thioether, sulfone, and sulfate ester. Deduct points for missing components or suggesting unlikely species (e.g., sulfonate, sulfoxide, inorganic sulfate) that are not part of the final fit basis. |
Review
#194
crosslinked polythionoheptalactone
S K
▶
LLM Prompt
Sample Information
Material: crosslinked polythionoheptalactone
Method: oxidative crosslinking
Precursors: polythionoheptalactone, NaOCl
Sample-Specific Conditions
- monomer aliphatic chain length: m=5 (small lactone)
- Oxidatively crosslinked polythionoheptalactone
Preparation
- Synthesized and oxidatively crosslinked using NaOCl in H2O as described in reference [2].
Measurement
We plan to measure the S K XANES spectrum of this sample.
Questions
Based on all the information above:
1. Based on the oxidative crosslinking chemistry of polythionolactones, what candidate sulfur-containing functional groups should be included as reference spectra for linear combination fitting of the S K-edge XANES data for this sample?
Ground Truth
Material: crosslinked polythionoheptalactone (PtnHL-CLP)
Measurement: S K-edge XANES, fluorescence detection, beamline 9-BM at Advanced Photon Source
Fit method: Linear combination analysis (LCA)
Phase fractions: (±10%)
| Phase | Fraction |
|---|---|
| thionoester | 0.28 |
| disulfide | 0.37 |
| thioether | 0.28 |
| sulfone | 0.021 |
| sulfate ester | 0.043 |
Fit basis (paper's reference spectra):
- thionoester
- disulfide
- thioether
- sulfone
- sulfate ester
Source evidence: Table 1 and Figure 1D, page 8-10
Key reasoning: Oxidation of thionoesters generates sulfinyl intermediates that undergo [4+2] cycloaddition to form crosslinking C-S bonds (yielding thioethers and sulfones) and non-crosslinking sulfate esters. This cycloaddition requires alignment of the sulfinyl groups, which is sterically hindered in polymers with short alkyl chains (m=5) like PtnHL. Consequently, PtnHL-CLP retains a higher fraction of unreacted thionoester and forms fewer thioethers and sulfate esters compared to macrolactones with longer flexible chains. Disulfide crosslinks, however, can form irrespective of the C=S/C=S bond dihedral angle, so their fraction remains relatively constant across different chain lengths.
Reasoning source: Section 3.3. Chemical and physical insights, page 11
Scoring Rubric (total: 100 pts)
| Q | Type | Max | Question | Reference Answer | Scoring Criteria |
|---|---|---|---|---|---|
| q1 | identification | 100 | Based on the oxidative crosslinking chemistry of polythionolactones, what candidate sulfur-containing functional groups should be included as reference spectra for linear combination fitting of the S K-edge XANES data for this sample? | The reference spectra for linear combination fitting of this sample should include thionoester, disulfide, thioether, sulfone, and sulfate ester. These specific functional groups are expected because the oxidative crosslinking of polythionoheptalactone with NaOCl generates sulfinyl intermediates that undergo [4+2] cycloaddition. This cycloaddition reaction produces crosslinking C-S bonds, yielding thioethers and sulfones, alongside non-crosslinking sulfate esters. Furthermore, because the sample has a short monomer aliphatic chain length (m=5), steric hindrance prevents optimal alignment of the sulfinyl groups, leaving a significant amount of unreacted thionoester. Finally, disulfides must be included because they form crosslinks independently of the C=S/C=S bond dihedral angle and are unaffected by the short chain length. | Full points for identifying all five key components: unreacted thionoester, disulfide, thioether, sulfone, and sulfate ester. Deduct points for missing components or including unlikely species (e.g., sulfonate, sulfoxide) that are ruled out in this system. |
Review
#195
crosslinked polythionopentadecalactone
S K
▶
LLM Prompt
Sample Information
Material: crosslinked polythionopentadecalactone
Method: oxidative crosslinking
Precursors: polythionopentadecalactone, NaOCl
Sample-Specific Conditions
- monomer aliphatic chain length: m=13 (macrolactone)
- Oxidatively crosslinked polythionopentadecalactone
Preparation
- Synthesized and oxidatively crosslinked using NaOCl in H2O as described in reference [2].
Measurement
We plan to measure the S K XANES spectrum of this sample.
Questions
Based on all the information above:
1. What candidate reference spectra are needed to model the S K-edge XANES spectrum of this oxidatively crosslinked polythionopentadecalactone using linear combination fitting?
2. Based on the sample conditions (oxidative crosslinking of a macrolactone with m=13), estimate the relative fractions of the sulfur species present in the resulting polymer.
Ground Truth
Material: crosslinked polythionopentadecalactone (PtnPDL-CLP)
Measurement: S K-edge XANES, fluorescence mode, beamline 9-BM
Fit method: Linear combination analysis (LCA)
Phase fractions: (±15%)
| Phase | Fraction |
|---|---|
| thionoester | 0.09 |
| disulfide | 0.35 |
| thioether | 0.39 |
| sulfone | 0.044 |
| sulfate ester | 0.117 |
Fit basis (paper's reference spectra):
- thionoester
- disulfide
- thioether
- sulfone
- sulfate ester
Source evidence: Table 1 and Figure 1E, page 10
Key reasoning: The long alkyl chains (m=13) in the macrolactone precursor provide sufficient flexibility for the alignment of sulfinyl intermediates generated during oxidation. This alignment facilitates [4 + 2] cycloaddition reactions that yield crosslinking C-S bonds (thioethers and sulfones) and non-crosslinking sulfate esters. Consequently, this polymer shows a higher extent of oxidation (more thioether and sulfate ester, less unreacted thionoester) compared to small lactone polymers. Disulfide bonds form irrespective of the C=S/C=S dihedral angle and are thus present in similar proportions across all samples.
Reasoning source: Section 3.3. Chemical and physical insights, page 11
Scoring Rubric (total: 100 pts)
| Q | Type | Max | Question | Reference Answer | Scoring Criteria |
|---|---|---|---|---|---|
| q1 | identification | 46 | What candidate reference spectra are needed to model the S K-edge XANES spectrum of this oxidatively crosslinked polythionopentadecalactone using linear combination fitting? | The candidate reference spectra needed to model the S K-edge XANES spectrum using linear combination fitting are thionoester, disulfide, thioether, sulfone, and sulfate ester. These specific sulfur phases are expected because the oxidative crosslinking of the macrolactone precursor with NaOCl generates sulfinyl intermediates. The long aliphatic chains (m=13) provide sufficient flexibility for these intermediates to align, facilitating [4 + 2] cycloaddition reactions that produce crosslinking C-S bonds (thioethers and sulfones) and non-crosslinking sulfate esters, while disulfide bonds form irrespective of the C=S/C=S dihedral angle alongside some unreacted thionoester. | Full points for identifying thionoester (or unreacted precursor), disulfide, thioether, sulfone, and sulfate ester. Deduct points for missing components or suggesting unlikely species (e.g., sulfonate, sulfoxide) that are not present in the final fit. |
| q2 | quantification | 54 | Based on the sample conditions (oxidative crosslinking of a macrolactone with m=13), estimate the relative fractions of the sulfur species present in the resulting polymer. | The estimated relative fractions of the sulfur species in the polymer are 39% thioether, 35% disulfide, 11.7% sulfate ester, 9% thionoester, and 4.4% sulfone, with an uncertainty of 15%. These specific values result from the long alkyl chains (m=13) of the macrolactone precursor, which provide high flexibility for the alignment of sulfinyl intermediates during NaOCl oxidation. This alignment strongly favors [4 + 2] cycloaddition reactions, leading to a higher extent of oxidation (abundant thioether and sulfate ester, and minimal unreacted thionoester), while the substantial 35% disulfide fraction arises because disulfide formation occurs independently of the C=S/C=S dihedral angle. | Full points if the estimated fractions are within ±15% of the ground truth values (thionoester ~9%, disulfide ~35%, thioether ~39%, sulfone ~4.4%, sulfate ester ~11.7%). Partial credit for correctly identifying that thioether and disulfide are the major components, while thionoester, sulfone, and sulfate ester are minor. |
Review
#196
crosslinked polythionopentadecalactone-block-caprolactone
S K
▶
LLM Prompt
Sample Information
Material: crosslinked polythionopentadecalactone-block-caprolactone
Method: oxidative crosslinking
Precursors: polythionopentadecalactone-block-caprolactone, NaOCl
Sample-Specific Conditions
- monomer aliphatic chain length: block copolymer (macrolactone + small lactone)
- Oxidatively crosslinked polythionopentadecalactone-block-caprolactone
Preparation
- Synthesized and oxidatively crosslinked using NaOCl in H2O as described in reference [2].
Measurement
We plan to measure the S K XANES spectrum of this sample.
Questions
Based on all the information above:
1. What candidate reference spectra (sulfur functional groups) are needed to perform a complete linear combination fit for the S K-edge XANES spectrum of this oxidatively crosslinked polythionolactone block copolymer?
Ground Truth
Material: crosslinked polythionopentadecalactone-block-caprolactone (PtnPDL-b-PtnCL-CLP)
Measurement: S K-edge XANES, fluorescence mode, beamline 9-BM at APS
Fit method: Linear combination analysis (LCA)
Phase fractions: (±10%)
| Phase | Fraction |
|---|---|
| thionoester | 0.1 |
| disulfide | 0.35 |
| thioether | 0.39 |
| sulfone | 0.034 |
| sulfate ester | 0.125 |
Fit basis (paper's reference spectra):
- thionoester
- disulfide
- thioether
- sulfone
- sulfate ester
Source evidence: Table 1, Figure 1F, Figure 2, page 10
Key reasoning: The block copolymer contains long alkyl chains from the macrolactone block, providing flexibility that allows for the alignment of sulfinyl intermediates during oxidation. This alignment facilitates [4+2] cycloaddition reactions, leading to higher amounts of crosslinking C-S bonds (thioethers) and non-crosslinking sulfate esters compared to small lactone polymers. The formation of these polar groups promotes micellar aggregation, which keeps polar groups at the surface and buries nonpolar groups, continuously exposing unreacted thionoesters to the aqueous oxidant and resulting in a greater overall extent of oxidation.
Reasoning source: Section 3.3 'Chemical and physical insights', pages 11-12
Scoring Rubric (total: 100 pts)
| Q | Type | Max | Question | Reference Answer | Scoring Criteria |
|---|---|---|---|---|---|
| q1 | identification | 100 | What candidate reference spectra (sulfur functional groups) are needed to perform a complete linear combination fit for the S K-edge XANES spectrum of this oxidatively crosslinked polythionolactone block copolymer? | To perform a complete linear combination fit for this sample, the required candidate reference spectra are thionoester, disulfide, thioether, sulfone, and sulfate ester. These specific sulfur functional groups arise because the block copolymer contains long alkyl chains from the macrolactone block, providing flexibility that allows for the alignment of sulfinyl intermediates during the aqueous NaOCl oxidation. This alignment facilitates [4+2] cycloaddition reactions, which specifically generate crosslinking C-S bonds (thioethers) and non-crosslinking sulfate esters. Additionally, the formation of these polar groups promotes micellar aggregation in the aqueous environment, keeping polar groups at the surface and burying nonpolar groups. This structural arrangement continuously exposes unreacted thionoesters to the aqueous oxidant, resulting in a greater overall extent of oxidation and the diverse mixture of sulfur species. | Full score for identifying thionoester (unreacted starting material), disulfide, thioether, sulfone, and sulfate ester. Deduct points for missing components or including unsupported species like sulfonate, sulfoxide, or sulfine. |
Review
Iron(II) Complexes Featuring a Redox‐Active Dihydrazonopyrrole Ligand
APS
Pure Phase
Kate A. Jesse et al.
DOI: 10.1002/zaac.202100097
3 scenarios
▶
#197
(Ph,TolDHP•)Fe(PMe3)2
Fe K
▶
LLM Prompt
Sample Information
Material: (Ph,TolDHP•)Fe(PMe3)2
Crystal Structure: intermediate geometry between square pyramidal and trigonal bipyramidal (τ5 = 0.45)
Oxidation State: Fe(II)
Sample Form: powder
Measurement Mode: transmission
- High spin Fe(II) complex antiferromagnetically coupled to a dianionic Ph,TolDHP ligand-based radical
Measurement
We plan to measure the Fe K XANES spectrum of this sample.
Questions
Based on all the information above:
1. What is the expected Fe K-edge position for this complex, and what does this specific edge position confirm about the oxidation state of iron?
2. How does the XANES data support the assignment of the oxidation event as ligand-based rather than metal-based?
3. Describe the expected overall spectral shape of this complex's Fe K-edge XANES spectrum in relation to other reference complexes.
Ground Truth
Compound: (Ph,TolDHP•)Fe(PMe3)2
Oxidation state: Fe(II)
Measurement: Fe K-edge, transmission mode
Edge position: 7121.3
Spectral shape: Effectively identical K-edge to complex 2.
Distinguishing features: not reported
Key reasoning: The identical edge position (7121.3 eV) to complex 2 confirms that the oxidation state of Fe remains Fe(II). This indicates that the oxidation event is ligand-based rather than metal-based. The complex is characterized as a high spin Fe(II) center antiferromagnetically coupled to a dianionic Ph,TolDHP ligand-based radical.
Reasoning source: text/figure_2
Scoring Rubric (total: 100 pts)
| Q | Type | Max | Question | Reference Answer | Scoring Criteria |
|---|---|---|---|---|---|
| q1 | spectral | 40 | What is the expected Fe K-edge position for this complex, and what does this specific edge position confirm about the oxidation state of iron? | The expected Fe K-edge position for the (Ph,TolDHP•)Fe(PMe3)2 complex is 7121.3 eV. This specific edge position confirms that the oxidation state of the iron center remains Fe(II). This spectral feature arises because the material is characterized as a high spin Fe(II) center antiferromagnetically coupled to a dianionic Ph,TolDHP ligand-based radical. Since the oxidation event is ligand-based rather than metal-based, the electron density at the iron center is preserved, resulting in an edge position identical to its Fe(II) precursor. | Award full points if the response correctly identifies the edge position as 7121.3 eV and explains that it confirms the iron remains in the Fe(II) oxidation state. |
| q2 | reasoning | 30 | How does the XANES data support the assignment of the oxidation event as ligand-based rather than metal-based? | The XANES data supports a ligand-based oxidation event because the Fe K-edge position is observed at 7121.3 eV, which is identical to the unoxidized precursor (complex 2). If the oxidation were metal-based, the edge position would shift to a higher energy to reflect an Fe(III) state. Instead, the unchanged edge energy confirms the metal remains in the Fe(II) oxidation state. This perfectly aligns with the sample conditions describing the material as a high spin Fe(II) center antiferromagnetically coupled to a dianionic Ph,TolDHP ligand-based radical, proving the electron was removed from the ligand rather than the iron center. | Award full points if the response explains that the edge position and spectral shape are effectively identical to complex 2, indicating no change in the metal's oxidation state, thus proving the oxidation is ligand-based. |
| q3 | spectral | 30 | Describe the expected overall spectral shape of this complex's Fe K-edge XANES spectrum in relation to other reference complexes. | The overall spectral shape of the Fe K-edge XANES spectrum for (Ph,TolDHP•)Fe(PMe3)2 is expected to be effectively identical to that of complex 2. This identical spectral shape and edge position (7121.3 eV) occur because the iron center in both complexes shares the exact same Fe(II) oxidation state. Based on the sample conditions, the material features a high spin Fe(II) center antiferromagnetically coupled to a dianionic Ph,TolDHP ligand-based radical. Because the oxidation event generating this complex is entirely ligand-based, the local electronic environment of the iron atom remains unperturbed, yielding a K-edge spectrum that mirrors its Fe(II) reference. | Award full points if the response states that the K-edge spectral shape is effectively identical to complex 2. |
Review
#198
[(Ph,TolDHP)Fe(PMe3)2][BF4]
Fe K
▶
LLM Prompt
Sample Information
Material: [(Ph,TolDHP)Fe(PMe3)2][BF4]
Crystal Structure: 5-coordinate pseudo-square pyramidal complex (τ5 = 0.04)
Oxidation State: Fe(II)
Sample Form: powder
Measurement Mode: transmission
- Low spin Fe(II) complex with an oxidized mono-anionic ligand
Measurement
We plan to measure the Fe K XANES spectrum of this sample.
Questions
Based on all the information above:
1. What is the expected Fe K-edge position (in eV) for this complex, and what does this value indicate about the oxidation state of the iron center?
2. How does the overall spectral shape of this complex compare to that of complex 1?
3. Based on the XANES data, is the oxidation event that forms this complex metal-based or ligand-based? Explain the reasoning.
Ground Truth
Compound: [(Ph,TolDHP)Fe(PMe3)2][BF4]
Oxidation state: Fe(II)
Measurement: Fe K-edge, transmission mode
Edge position: 7121.3
Spectral shape: Effectively identical K-edge to complex 1.
Distinguishing features: not reported
Key reasoning: The identical edge position to complex 1 confirms that the oxidation state of Fe remains Fe(II) and the oxidation event is ligand-based.
Reasoning source: text/figure_2
Scoring Rubric (total: 100 pts)
| Q | Type | Max | Question | Reference Answer | Scoring Criteria |
|---|---|---|---|---|---|
| q1 | spectral | 40 | What is the expected Fe K-edge position (in eV) for this complex, and what does this value indicate about the oxidation state of the iron center? | The expected Fe K-edge position for this complex is 7121.3 eV. This specific energy value indicates that the iron center is in the Fe(II) oxidation state. Given the sample conditions of a low-spin 5-coordinate pseudo-square pyramidal complex with an oxidized mono-anionic ligand, the metal center itself does not undergo oxidation. The identical edge position compared to complex 1 confirms that the oxidation event is entirely ligand-based, preserving the Fe(II) state of the metal. | Award 20 points for correctly identifying the edge position as 7121.3 eV. Award 20 points for stating that it confirms the oxidation state remains Fe(II). |
| q2 | spectral | 30 | How does the overall spectral shape of this complex compare to that of complex 1? | The overall spectral shape of this complex is effectively identical to the Fe K-edge spectrum of complex 1. This similarity arises because the sample is a low-spin Fe(II) 5-coordinate pseudo-square pyramidal complex where the oxidation event occurred on the mono-anionic ligand rather than the metal. Since the iron center remains strictly Fe(II) and its primary electronic environment is preserved, the X-ray absorption features do not shift. Therefore, the identical edge position of 7121.3 eV confirms the lack of metal-based oxidation, resulting in matching spectral shapes. | Award 30 points for stating that the K-edge spectral shape is effectively identical to complex 1. |
| q3 | reasoning | 30 | Based on the XANES data, is the oxidation event that forms this complex metal-based or ligand-based? Explain the reasoning. | Based on the XANES data, the oxidation event that forms this complex is entirely ligand-based. The sample is a low-spin 5-coordinate pseudo-square pyramidal complex featuring an oxidized mono-anionic ligand. Spectral analysis shows an Fe K-edge position of 7121.3 eV, which is effectively identical to the edge position of complex 1. This identical edge position confirms that the iron center's oxidation state remains Fe(II) during the transformation. Consequently, because the metal center is not oxidized, the electron loss must be attributed to the ligand. | Award 15 points for identifying the oxidation event as ligand-based. Award 15 points for explaining that this is confirmed by the identical edge position to complex 1, which shows the Fe oxidation state remains Fe(II). |
Review
#199
[(Ph,TolDHP)Fe(PMe3)2(MeCN)][BF4]
Fe K
▶
LLM Prompt
Sample Information
Material: [(Ph,TolDHP)Fe(PMe3)2(MeCN)][BF4]
Crystal Structure: pseudo-octahedral geometry
Oxidation State: Fe(II)
Sample Form: solution in polyethylene glycol matrix
Measurement Mode: transmission
- Acetonitrile adduct of complex 2, low spin Fe(II)
Measurement
We plan to measure the Fe K XANES spectrum of this sample.
Questions
Based on all the information above:
1. What is the expected Fe K-edge position for this complex, and how does its edge position compare to related complexes 1 and 2?
2. Based on the XANES edge position, does the binding of acetonitrile to complex 2 induce a change in the redox distribution or just the coordination environment? Explain the reasoning.
3. Identify the oxidation state of the iron center in this pure phase material.
Ground Truth
Compound: [(Ph,TolDHP)Fe(PMe3)2(MeCN)][BF4]
Oxidation state: Fe(II)
Measurement: Fe K-edge, transmission mode
Edge position: 7121.3
Spectral shape: Similar edge position to that observed for complexes 1 and 2.
Distinguishing features: not reported
Key reasoning: The similar edge position to complexes 1 and 2 suggests that the difference in UV-visible spectra between 2-MeCN and 2 arises from the changing coordination environment at the Fe center as opposed to a different redox distribution induced by ligand binding.
Reasoning source: text
Scoring Rubric (total: 100 pts)
| Q | Type | Max | Question | Reference Answer | Scoring Criteria |
|---|---|---|---|---|---|
| q1 | spectral | 30 | What is the expected Fe K-edge position for this complex, and how does its edge position compare to related complexes 1 and 2? | The expected Fe K-edge position for this complex is 7121.3 eV. This edge position is highly similar to that observed for the related complexes 1 and 2. This specific spectral feature arises because the sample is a pure low-spin Fe(II) complex, [(Ph,TolDHP)Fe(PMe3)2(MeCN)][BF4], measured in a polyethylene glycol matrix. The similarity in edge position confirms that the binding of the acetonitrile ligand to form the pseudo-octahedral adduct alters the local coordination environment rather than changing the overall Fe(II) oxidation state or redox distribution. | Full points if the edge position is identified as 7121.3 eV and stated to be similar to the edge positions of complexes 1 and 2. |
| q2 | reasoning | 40 | Based on the XANES edge position, does the binding of acetonitrile to complex 2 induce a change in the redox distribution or just the coordination environment? Explain the reasoning. | The binding of acetonitrile to complex 2 induces a change only in the coordination environment, rather than a change in the redox distribution. The sample is a low-spin Fe(II) acetonitrile adduct, [(Ph,TolDHP)Fe(PMe3)2(MeCN)][BF4], possessing a pseudo-octahedral geometry. Its measured Fe K-edge position of 7121.3 eV is similar to that of complexes 1 and 2. This similar edge position provides direct evidence that the differences in UV-visible spectra between complex 2 and its acetonitrile adduct arise strictly from the changing coordination environment at the Fe center, as opposed to a different redox distribution induced by ligand binding. | Full points if the answer states that the similar edge position indicates the difference in UV-visible spectra arises from a changing coordination environment rather than a different redox distribution induced by ligand binding. |
| q3 | identification | 30 | Identify the oxidation state of the iron center in this pure phase material. | The oxidation state of the iron center in this pure phase material is Fe(II). The sample consists entirely (fraction of 1.0) of [(Ph,TolDHP)Fe(PMe3)2(MeCN)][BF4] prepared as a solution in a polyethylene glycol matrix. In this pseudo-octahedral acetonitrile adduct of complex 2, the iron exists as a low-spin Fe(II) center. This oxidation state is maintained because, as evidenced by the Fe K-edge position of 7121.3 eV, the binding of the acetonitrile ligand only changes the coordination environment at the Fe center rather than inducing a different redox distribution. | Full points if the oxidation state is correctly identified as Fe(II). |
Review
Cytotoxicity, cellular localization and photophysical properties of Re(I) tricarbonyl complexes bound to cysteine and its derivatives
APS
Pure Phase
Miles S. Capper et al.
DOI: 10.1007/s00775-020-01798-9
4 scenarios
▶
#200
fac-[Re(CO)3(bpy)(H2O)](CF3SO3)
Re L3
▶
LLM Prompt
Sample Information
Material: fac-[Re(CO)3(bpy)(H2O)](CF3SO3)
Oxidation State: 1+
Sample Form: powder mixed with boron nitride
Measurement Mode: transmission
- Re-aqua complex
Measurement
We plan to measure the Re L3 XANES spectrum of this sample.
Questions
Based on all the information above:
1. What specific feature in the EXAFS Fourier transform distinguishes this Re-aqua complex from Re(I)-thiolate complexes?
2. What are the primary scattering paths present in the first coordination sphere of this complex?
3. What is the oxidation state of Rhenium in this complex?
Ground Truth
Compound: fac-[Re(CO)3(bpy)(H2O)](CF3SO3)
Oxidation state: 1+
Measurement: Re L3-edge, transmission mode, bending magnetic beamline 9C of the Photon Factory
Edge position: not reported
Spectral shape: EXAFS spectra and Fourier transforms were measured. The FT lacks a peak at ~2.2 Å, distinguishing it from thiolate complexes.
Distinguishing features: Absence of Re-S scattering peak at ~2.2 Å in the Fourier transform.
Key reasoning: The Fourier transform of the EXAFS spectrum for the Re-aqua complex 1 lacks a peak at ~2.2 Å associated with Re-S scattering, which distinguishes it from the Re(I)-thiolate complexes. EXAFS fitting confirms the first coordination sphere consists of Re-C and Re-(N/O) bonds.
Reasoning source: Section 3.1, page 17-18
Scoring Rubric (total: 100 pts)
| Q | Type | Max | Question | Reference Answer | Scoring Criteria |
|---|---|---|---|---|---|
| q1 | spectral | 40 | What specific feature in the EXAFS Fourier transform distinguishes this Re-aqua complex from Re(I)-thiolate complexes? | The distinguishing feature is the absence of a peak at ~2.2 Å in the Fourier transform of the EXAFS spectrum. This occurs because the sample is a Re-aqua complex, specifically fac-[Re(CO)3(bpy)(H2O)](CF3SO3), which lacks sulfur in its first coordination sphere. Consequently, the Re-S scattering path responsible for the ~2.2 Å peak in Re(I)-thiolate complexes is not present, leaving a coordination sphere consisting only of Re-C and Re-(N/O) bonds. | Must mention the absence of a peak at ~2.2 Å associated with Re-S scattering. |
| q2 | reasoning | 40 | What are the primary scattering paths present in the first coordination sphere of this complex? | The primary scattering paths in the first coordination sphere consist of Re-C and Re-(N/O) bonds. These paths arise directly from the molecular structure of the fac-[Re(CO)3(bpy)(H2O)](CF3SO3) sample, where the rhenium center is coordinated by carbonyl, bipyridine, and water ligands. EXAFS curve fitting confirms these specific interactions and verifies the absence of Re-S scattering at ~2.2 Å, which distinguishes this Re-aqua complex from thiolate derivatives. | Must identify Re-C and Re-(N/O) bonds/paths. |
| q3 | identification | 20 | What is the oxidation state of Rhenium in this complex? | The oxidation state of Rhenium in this complex is 1+. This oxidation state is dictated by the sample composition, fac-[Re(CO)3(bpy)(H2O)](CF3SO3), where the Re center is coordinated by neutral carbonyl, bipyridine, and water ligands and balanced by a single triflate anion. The structural integrity of this Re(I) aqua complex is supported by EXAFS analysis, which confirms a first coordination sphere of Re-C and Re-(N/O) bonds and lacks the Re-S scattering peak at ~2.2 Å seen in Re(I)-thiolate complexes. | Must state 1+ or Re(I). |
Review
#201
fac-[Re(CO)3(bpy)(HCys)]·0.5H2O
Re L3
▶
LLM Prompt
Sample Information
Material: fac-[Re(CO)3(bpy)(HCys)]·0.5H2O
Oxidation State: 1+
Sample Form: powder mixed with boron nitride
Measurement Mode: transmission
- Re-HCys complex
Measurement
We plan to measure the Re L3 XANES spectrum of this sample.
Questions
Based on all the information above:
1. What key feature in the X-ray absorption data (specifically the EXAFS Fourier transform) distinguishes the Re-HCys complex from the precursor Re-aqua complex?
2. Based on the EXAFS analysis, what are the expected primary coordination shell atoms and their approximate bond distances for the Re center in this complex?
3. What is the oxidation state of Rhenium in the fac-[Re(CO)3(bpy)(HCys)]·0.5H2O complex?
Ground Truth
Compound: fac-[Re(CO)3(bpy)(HCys)]·0.5H2O
Oxidation state: 1+
Measurement: Re L3-edge, transmission mode, bending magnetic beamline 9C of the Photon Factory
Edge position: not reported
Spectral shape: EXAFS spectra and Fourier transforms were measured. The FT displays a small peak at ~2.2 Å associated with Re-S scattering. Post-edge EXAFS fitting yields Re-C (1.93 Å), Re-(N/O) (2.18 Å), and Re-S (2.48 Å) distances.
Distinguishing features: Presence of a Re-S scattering peak at ~2.2 Å in the Fourier transform, distinguishing it from the aqua complex.
Key reasoning: The Fourier transform of the EXAFS spectrum displays a peak at ~2.2 Å associated with Re-S scattering, which is absent in the Re-aqua complex. EXAFS curve fitting confirms the presence of a Re-S bond at 2.48 Å, along with Re-C and Re-(N/O) paths, consistent with the coordination of the cysteinate ligand.
Reasoning source: Section 3.1, pages 17-19
Scoring Rubric (total: 100 pts)
| Q | Type | Max | Question | Reference Answer | Scoring Criteria |
|---|---|---|---|---|---|
| q1 | spectral | 30 | What key feature in the X-ray absorption data (specifically the EXAFS Fourier transform) distinguishes the Re-HCys complex from the precursor Re-aqua complex? | The distinguishing feature in the EXAFS Fourier transform is the presence of a small peak at approximately 2.2 Å. This feature arises because the sample is the fac-[Re(CO)3(bpy)(HCys)]·0.5H2O complex, where the cysteinate ligand coordinates directly to the Re center. This coordination introduces a Re-S scattering path that is completely absent in the precursor Re-aqua complex. Consequently, the structural incorporation of the sulfur-containing cysteinate ligand produces this unique Re-S scattering peak in the spectral data. | Full points for mentioning the appearance of a Re-S scattering peak at ~2.2 Å in the Fourier transform. |
| q2 | reasoning | 40 | Based on the EXAFS analysis, what are the expected primary coordination shell atoms and their approximate bond distances for the Re center in this complex? | The expected primary coordination shell atoms for the Re center include carbon, nitrogen/oxygen, and sulfur. The approximate bond distances obtained from post-edge EXAFS curve fitting are 1.93 Å for Re-C, 2.18 Å for Re-(N/O), and 2.48 Å for Re-S. These specific coordination paths and distances result directly from the composition of the fac-[Re(CO)3(bpy)(HCys)]·0.5H2O sample. The Re-C and Re-(N/O) paths correspond to the coordination of the ligands to the Re center, while the Re-S bond at 2.48 Å confirms the successful coordination of the cysteinate ligand, which is the defining structural characteristic of this Re-HCys complex. | Full points for identifying Re-C (~1.93 Å), Re-(N/O) (~2.18 Å), and Re-S (~2.48 Å) scattering paths. |
| q3 | identification | 30 | What is the oxidation state of Rhenium in the fac-[Re(CO)3(bpy)(HCys)]·0.5H2O complex? | The oxidation state of Rhenium in the fac-[Re(CO)3(bpy)(HCys)]·0.5H2O complex is 1+. This specific oxidation state arises directly from the chemical formulation of the Re-HCys complex provided in the sample conditions. As confirmed by EXAFS curve fitting, the Re center is coordinated by carbon, nitrogen/oxygen, and a cysteinate ligand (forming a Re-S bond at 2.48 Å). The successful coordination of these specific ligands in the powder sample stabilizes the Rhenium metal center in the 1+ oxidation state. | Full points for stating Re(I) or 1+. |
Review
#202
Na(fac-[Re(CO)3(bpy)(NAC)])
Re L3
▶
LLM Prompt
Sample Information
Material: Na(fac-[Re(CO)3(bpy)(NAC)])
Oxidation State: 1+
Sample Form: powder mixed with boron nitride
Measurement Mode: transmission
- Re-NAC complex
Measurement
We plan to measure the Re L3 XANES spectrum of this sample.
Questions
Based on all the information above:
1. What key feature in the Fourier transform of the Re L3-edge EXAFS spectrum distinguishes this Re-NAC complex from the Re-aqua precursor complex?
2. Describe the expected first coordination sphere of the Re center in this complex, including the types of coordinating atoms and their respective coordination numbers.
3. How does the structural disorder of the Re-S bond in this complex compare to other related Re-thiolate complexes (e.g., Re-HCys), and what physical implication does this have for the complex?
Ground Truth
Compound: Na(fac-[Re(CO)3(bpy)(NAC)])
Oxidation state: 1+
Measurement: Re L3-edge, transmission mode, bending magnetic beamline 9C of the Photon Factory
Edge position: not reported
Spectral shape: The Fourier transform of the EXAFS spectrum displays a small peak at ~2.2 Å (uncorrected for phase shift) associated with Re-S scattering, which is absent in the Re-aqua precursor complex.
Distinguishing features: Presence of a Re-S scattering peak at ~2.2 Å in the Fourier transform. Higher structural disorder (larger σ²) in the Re-S bond compared to related Re-thiolate complexes (complexes 2 and 4).
Key reasoning: The Re-NAC complex (3) was characterized by EXAFS, showing a first coordination sphere consisting of Re-C (N=3, R=1.91 Å), Re-(N/O) (N=2, R=2.16 Å), and Re-S (N=1, R=2.47 Å). A larger Debye-Waller factor (σ² = 0.0078 Ų) was observed for the Re-S bond in this complex compared to the Re-HCys and Re-GSH complexes. This reflects a larger structural or vibrational disorder along the Re-S bond, which correlates with a weaker bond and explains the rapid decomposition (ligand-solvent exchange) of the complex in certain solvents.
Reasoning source: Section 3.1, pages 18-21
Scoring Rubric (total: 100 pts)
| Q | Type | Max | Question | Reference Answer | Scoring Criteria |
|---|---|---|---|---|---|
| q1 | spectral | 30 | What key feature in the Fourier transform of the Re L3-edge EXAFS spectrum distinguishes this Re-NAC complex from the Re-aqua precursor complex? | The key distinguishing feature in the Fourier transform of the EXAFS spectrum is a small peak at ~2.2 Å (uncorrected for phase shift). This feature arises directly from the composition of the Na(fac-[Re(CO)3(bpy)(NAC)]) sample, where the N-acetylcysteine (NAC) ligand coordinates to the Re(I) center via a sulfur atom. Consequently, this peak corresponds to Re-S scattering, which is naturally absent in the Re-aqua precursor complex that lacks thiolate coordination. The presence of this specific Re-S scattering path confirms the successful formation of the Re-NAC complex in the measured powder. | Must mention the presence of a Re-S scattering peak at approximately 2.2 Å (uncorrected for phase shift). |
| q2 | identification | 30 | Describe the expected first coordination sphere of the Re center in this complex, including the types of coordinating atoms and their respective coordination numbers. | The expected first coordination sphere of the Re center consists of three carbon atoms (Re-C, N=3), two nitrogen or oxygen atoms (Re-(N/O), N=2), and one sulfur atom (Re-S, N=1). This specific coordination environment is dictated by the composition of the Na(fac-[Re(CO)3(bpy)(NAC)]) sample. Specifically, the three Re-C bonds originate from the three carbonyl (CO) ligands, the two Re-(N/O) bonds arise from the bipyridine (bpy) ligand, and the single Re-S bond is formed by the coordination of the N-acetylcysteine (NAC) thiolate group. Together, these ligands satisfy the expected octahedral coordination geometry for the Re(I) center in this complex. | Must identify the coordination environment as Re-C (N=3), Re-(N/O) (N=2), and Re-S (N=1). |
| q3 | reasoning | 40 | How does the structural disorder of the Re-S bond in this complex compare to other related Re-thiolate complexes (e.g., Re-HCys), and what physical implication does this have for the complex? | The Re-S bond in this Re-NAC complex exhibits a larger Debye-Waller factor (σ² = 0.0078 Ų) compared to related Re-thiolate complexes like Re-HCys and Re-GSH, indicating higher structural or vibrational disorder. This increased disorder arises from the specific steric and electronic properties of the N-acetylcysteine (NAC) ligand coordinated to the Re(I) center in the Na(fac-[Re(CO)3(bpy)(NAC)]) sample. The higher disorder reflects a weaker Re-S bond within this specific molecular structure. Consequently, this weaker bond physically implies that the complex is more susceptible to rapid decomposition via ligand-solvent exchange in certain solvents. | Must state that the Re-S bond has a larger structural/vibrational disorder (larger Debye-Waller factor or σ²) and that this correlates with a weaker bond and lower stability (or rapid decomposition/ligand exchange). |
Review
#203
Na(fac-[Re(CO)3(bpy)(HA)])·H2O
Re L3
▶
LLM Prompt
Sample Information
Material: Na(fac-[Re(CO)3(bpy)(HA)])·H2O
Oxidation State: 1+
Sample Form: powder mixed with boron nitride
Measurement Mode: transmission
- Re-GSH complex
Measurement
We plan to measure the Re L3 XANES spectrum of this sample.
Questions
Based on all the information above:
1. What specific feature in the Fourier transform of the EXAFS spectrum distinguishes the Re-GSH complex from the Re-aqua precursor?
2. Describe the expected first coordination sphere of the Re center in this complex as determined by EXAFS fitting.
3. What theoretical basis functions or scattering paths are necessary to model the EXAFS spectrum of this complex?
Ground Truth
Compound: Na(fac-[Re(CO)3(bpy)(HA)])·H2O
Oxidation state: 1+
Measurement: Re L3-edge, transmission mode, bending magnetic beamline 9C of the Photon Factory
Edge position: not reported
Spectral shape: The EXAFS Fourier transform displays a peak at ~2.2 Å (not corrected for phase shift) associated with Re-S scattering, alongside scattering from Re-C and Re-(N/O) paths.
Distinguishing features: The presence of a Re-S scattering peak at ~2.2 Å in the Fourier transform, which distinguishes it from the Re-aqua precursor complex.
Key reasoning: The Fourier transform of the Re(I)-thiolate complex displays a peak at ~2.2 Å (uncorrected for phase shift) associated with Re-S scattering, which is absent in the Re-aqua complex. EXAFS fitting confirms the presence of Re-C, Re-(N/O), and Re-S scattering paths in the first coordination sphere.
Reasoning source: Section 3.1, pages 17-19
Scoring Rubric (total: 100 pts)
| Q | Type | Max | Question | Reference Answer | Scoring Criteria |
|---|---|---|---|---|---|
| q1 | spectral | 40 | What specific feature in the Fourier transform of the EXAFS spectrum distinguishes the Re-GSH complex from the Re-aqua precursor? | The distinguishing feature in the Fourier transform of the EXAFS spectrum is a distinct peak at ~2.2 Å, which is uncorrected for phase shift. This feature arises directly from the composition of the Na(fac-[Re(CO)3(bpy)(HA)])·H2O sample, which is a Re(I)-thiolate (Re-GSH) complex. The coordination of the thiolate ligand to the Re(1+) center introduces Re-S scattering in the first coordination sphere. Consequently, this Re-S scattering produces the ~2.2 Å peak, distinguishing it from the Re-aqua precursor complex where such sulfur coordination is absent. | Award full points for identifying the Re-S scattering peak at ~2.2 Å (uncorrected for phase shift) in the Fourier transform. |
| q2 | reasoning | 30 | Describe the expected first coordination sphere of the Re center in this complex as determined by EXAFS fitting. | As determined by EXAFS fitting, the first coordination sphere of the Re center consists of Re-C, Re-(N/O), and Re-S scattering paths. This specific coordination environment is expected given the chemical formula of the sample, Na(fac-[Re(CO)3(bpy)(HA)])·H2O. The Re(1+) center is coordinated by carbonyl groups (yielding Re-C paths), a bipyridine ligand (yielding Re-N/O paths), and a thiolate/GSH ligand. The inclusion of the thiolate ligand specifically introduces the Re-S scattering path, which manifests as a characteristic peak at ~2.2 Å in the Fourier transform. | Award full points for mentioning Re-C, Re-(N/O), and Re-S scattering paths. |
| q3 | reasoning | 30 | What theoretical basis functions or scattering paths are necessary to model the EXAFS spectrum of this complex? | The EXAFS spectrum of this complex must be modeled using FEFF 7.0 theoretical paths via least-squares curve fitting. These basis functions are necessary to accurately capture the complex coordination environment of the Na(fac-[Re(CO)3(bpy)(HA)])·H2O sample. Because the material is a Re(I)-thiolate complex, the theoretical paths must account for Re-C, Re-(N/O), and Re-S scattering in the first coordination sphere. Applying these specific FEFF 7.0 paths allows the model to successfully fit the experimental data, including the distinguishing Re-S scattering peak at ~2.2 Å in the Fourier transform. | Award full points for mentioning ab initio calculated amplitude and phase shift functions (e.g., from FEFF) for Re-C, Re-(N/O), and Re-S paths. |
Review
The fate of calcium in temperate forest soils: a Ca K-edge XANES study
BNL-NSLS-II-8-ID
Environmental
Jörg Prietzel, Wantana Klysubun, Luis Carlos Colocho Hurtarte
DOI: 10.1007/s10533-020-00748-6
74 scenarios
▶
#204
soil
Ca K
▶
LLM Prompt
Sample Information
Material: soil
Sample Origin: Tuttlingen, Swabian Alb, Germany
Sample-Specific Conditions
- Soil horizon: L
- Rendzic Leptosol, L horizon
Measurement
We plan to measure the Ca K XANES spectrum of this sample.
Questions
Based on all the information above:
1. Based on the sample conditions (L horizon of a Rendzic Leptosol in a temperate forest), what are the expected major Ca-bearing phases and their approximate fractions?
2. What reference spectra would be most critical to include in a linear combination fitting (LCF) analysis to accurately model the Ca speciation in this specific soil horizon?
3. Explain the biogeochemical reasoning for the expected Ca speciation in the L horizon of this forest soil.
Ground Truth
Material: soil
Measurement: Ca K-edge XANES in fluorescence mode at Beamline 8 of SLRI
Fit method: Linear combination fitting (LCF)
Phase fractions: (±10%)
| Phase | Fraction |
|---|---|
| Carbonate Ca | 0.095 |
| Clay mineral sorbed Ca | 0.095 |
| Oxalate Ca | 0.381 |
| Citrate Ca | 0.286 |
| Pectate Ca | 0.143 |
Fit basis (paper's reference spectra):
- Calcite
- Aragonite
- Dolomite
- Apatite
- Brushite
- Monetite
- Anorthite
- Augite
- Epidote
- Ca adsorbed to montmorillonite
- Gypsum
- Anhydrite
- Fluorite
- Sinjarite
- Ca formate
- Ca acetate
- Ca citrate
- Ca oxalate
- Ca lactate
- Ca pectate
- Ca phytate
Source evidence: Table 4, page 204
Key reasoning: The L horizon is the uppermost litter layer of the forest floor. Organically bound Ca enters this layer primarily via litter fall (e.g., foliage, twigs, bark) from the dominating trees (such as beech). Consequently, the Ca speciation in the L layer is dominated by organic forms like Ca oxalate, Ca citrate, and Ca pectate, closely mirroring the Ca speciation of the foliage litter source. The high proportion of Ca oxalate reflects its synthesis by trees and subsequent deposition via leaf shedding, contributing to the base pumping effect.
Reasoning source: Section 'Speciation of organically bound soil Ca as affected by plant input and microbial turnover', pages 215-216
Scoring Rubric (total: 100 pts)
| Q | Type | Max | Question | Reference Answer | Scoring Criteria |
|---|---|---|---|---|---|
| q1 | quantification | 40 | Based on the sample conditions (L horizon of a Rendzic Leptosol in a temperate forest), what are the expected major Ca-bearing phases and their approximate fractions? | The expected major Ca-bearing phases in this sample are Oxalate Ca (38.1%), Citrate Ca (28.6%), Pectate Ca (14.3%), Carbonate Ca (9.5%), and Clay mineral sorbed Ca (9.5%), with an uncertainty of 10%. These specific fractions arise because the sample is from the L horizon, which is the uppermost litter layer of the forest floor. Organically bound Ca enters this layer primarily via litter fall (e.g., foliage, twigs, bark) from dominating trees like beech. The high proportion of Ca oxalate specifically reflects its synthesis by trees and subsequent deposition via leaf shedding, which contributes to the base pumping effect. | Award 40 points if organic Ca phases (oxalate, citrate, pectate) are identified as the dominant species (~80% total) with minor contributions from carbonate and clay-sorbed Ca (~10% each). Deduct points if inorganic phases are predicted to dominate. |
| q2 | identification | 30 | What reference spectra would be most critical to include in a linear combination fitting (LCF) analysis to accurately model the Ca speciation in this specific soil horizon? | Critical reference spectra for linear combination fitting (LCF) must include organic forms like Ca oxalate, Ca citrate, and Ca pectate, as well as inorganic and sorbed forms like Calcite and Ca adsorbed to montmorillonite. A full basis set should also include Aragonite, Dolomite, Apatite, Brushite, Monetite, Anorthite, Augite, Epidote, Gypsum, Anhydrite, Fluorite, Sinjarite, and other organic salts (Ca formate, acetate, lactate, phytate). These phases are required because the sample originates from the L horizon, the uppermost litter layer of a Rendzic Leptosol. In this layer, Ca speciation is dominated by organic forms that closely mirror the foliage litter source deposited by dominating trees. The inclusion of these specific organic references is necessary to capture the plant-synthesized Ca forms resulting from leaf shedding and the base pumping effect. | Award 30 points for listing relevant organic Ca standards (Ca oxalate, Ca citrate/carboxylate, Ca pectate) along with minor inorganic standards (calcite/carbonate, clay-sorbed Ca). Partial credit for missing some organic standards. |
| q3 | reasoning | 30 | Explain the biogeochemical reasoning for the expected Ca speciation in the L horizon of this forest soil. | The expected Ca speciation in the L horizon of this Rendzic Leptosol is heavily dominated by organic forms such as Ca oxalate, Ca citrate, and Ca pectate. This distribution occurs because the L horizon is the uppermost litter layer of the forest floor, receiving organically bound Ca primarily via litter fall (foliage, twigs, bark) from dominating trees like beech. As a result, the Ca speciation in this layer closely mirrors the Ca speciation of the foliage litter source. The high proportion of Ca oxalate specifically reflects its synthesis by trees and its subsequent deposition via leaf shedding. Ultimately, this biological cycling and deposition mechanism contributes to the base pumping effect, explaining the prevalence of organic Ca over inorganic forms in this horizon. | Award 30 points for explaining that the L horizon is the fresh litter layer, and its Ca speciation is heavily influenced by plant-derived organic Ca (like Ca oxalate and pectate) entering via litter fall (e.g., foliage), reflecting the biological 'base pumping effect' of the forest trees. |
Review
#205
soil
Ca K
▶
LLM Prompt
Sample Information
Material: soil
Sample Origin: Tuttlingen, Swabian Alb, Germany
Sample-Specific Conditions
- Soil horizon: Of
- Rendzic Leptosol, Of horizon
Measurement
We plan to measure the Ca K XANES spectrum of this sample.
Questions
Based on all the information above:
1. Based on the sample conditions (Of horizon of a Rendzic Leptosol), what candidate reference spectra should be included in a Linear Combination Fitting (LCF) analysis of its Ca K-edge XANES spectrum?
2. Estimate the relative fractions of the Ca phases in this Of horizon sample.
3. Explain the biogeochemical reasoning for the expected Ca speciation in this horizon, specifically addressing the absence of carbonate and the relative abundance of different organic Ca forms compared to fresh litter (L horizon).
Ground Truth
Material: soil
Measurement: Ca K-edge XANES, fluorescence mode, Beamline 8 of SLRI
Fit method: Linear combination fitting (LCF)
Phase fractions: (±10%)
| Phase | Fraction |
|---|---|
| Clay mineral sorbed Ca | 0.1 |
| Oxalate Ca | 0.2 |
| Citrate Ca | 0.35 |
| Pectate Ca | 0.2 |
| Phytate Ca | 0.15 |
Fit basis (paper's reference spectra):
- Carbonate Ca
- Clay mineral sorbed Ca
- Oxalate Ca
- Citrate Ca
- Pectate Ca
- Phytate Ca
Source evidence: Table 4, page 204
Key reasoning: In the Of horizon of the Rendzic Leptosol at Tuttlingen, carbonate-bound Ca is absent, reflecting the organic nature of the horizon and the dissolution of lithogenic carbonates. The vast majority of Ca is organically bound, originating from litter fall (e.g., foliage, twigs). Progressive aging and microbial decomposition of forest floor soil organic matter from the L to the Of layer is associated with a marked decrease in the contribution of plant-derived oxalate-bound Ca, which is rapidly decomposed. Consequently, other organic forms like citrate, pectate, and phytate become the dominant Ca species, alongside a minor fraction of clay mineral-sorbed Ca.
Reasoning source: Page 215, Section 'Speciation of organically bound soil Ca as affected by plant input and microbial turnover'
Scoring Rubric (total: 100 pts)
| Q | Type | Max | Question | Reference Answer | Scoring Criteria |
|---|---|---|---|---|---|
| q1 | identification | 20 | Based on the sample conditions (Of horizon of a Rendzic Leptosol), what candidate reference spectra should be included in a Linear Combination Fitting (LCF) analysis of its Ca K-edge XANES spectrum? | The candidate reference spectra for the LCF analysis should include Carbonate Ca, Clay mineral sorbed Ca, Oxalate Ca, Citrate Ca, Pectate Ca, and Phytate Ca. These phases are selected because the Of horizon of this Rendzic Leptosol is an organic layer where Ca originates primarily from litter fall such as foliage and twigs. In this specific environment, lithogenic carbonates dissolve, meaning carbonate-bound Ca is expected to be absent. Meanwhile, microbial decomposition of the forest floor organic matter breaks down plant-derived compounds, resulting in a system dominated by various organically bound Ca species (citrate, pectate, phytate, and residual oxalate) alongside a minor fraction of clay mineral-sorbed Ca. | Full points for identifying organic Ca forms (oxalate, citrate, pectate, phytate) and clay mineral-sorbed Ca. Deduct points if lithogenic minerals like primary silicates or large amounts of carbonates are proposed as major components for this specific organic horizon. |
| q2 | quantification | 40 | Estimate the relative fractions of the Ca phases in this Of horizon sample. | The estimated relative fractions of Ca phases are 35% Citrate Ca, 20% Oxalate Ca, 20% Pectate Ca, 15% Phytate Ca, and 10% Clay mineral sorbed Ca, with an uncertainty of 10%. These specific values arise because the Of horizon is characterized by progressive aging and microbial decomposition of soil organic matter originating from litter fall. This microbial activity rapidly decomposes plant-derived oxalate, significantly reducing its fraction compared to fresher litter layers. As a result, other organic forms like citrate, pectate, and phytate accumulate to become the dominant Ca species. Additionally, the highly organic nature of the horizon and the dissolution of lithogenic carbonates explain the complete absence (0%) of carbonate Ca, leaving only a minor 10% fraction of clay mineral-sorbed Ca. | Full points if the estimates are within ±10% of the ground truth: ~90% organically bound Ca (split among citrate ~35%, oxalate ~20%, pectate ~20%, phytate ~15%) and ~10% clay mineral-sorbed Ca. Zero points for carbonate > 5%. |
| q3 | reasoning | 40 | Explain the biogeochemical reasoning for the expected Ca speciation in this horizon, specifically addressing the absence of carbonate and the relative abundance of different organic Ca forms compared to fresh litter (L horizon). | The biogeochemical speciation of Ca in the Of horizon is driven by the organic nature of the layer and the microbial turnover of litter fall. Lithogenic carbonates are completely dissolved in this horizon, leading to the total absence of carbonate-bound Ca. The Ca pool is instead dominated by organically bound forms originating initially from foliage and twigs. As soil organic matter ages and undergoes microbial decomposition from the fresh L layer to the Of layer, plant-derived oxalate-bound Ca is rapidly decomposed, causing a marked decrease in its relative abundance. Consequently, this rapid turnover allows other organic forms like citrate, pectate, and phytate to become the dominant Ca species, alongside a minor fraction of clay mineral-sorbed Ca. | Full points for explaining that carbonate is absent in this organic layer, and that while fresh litter (L horizon) is rich in Ca oxalate, microbial decomposition during the transition to the Of horizon rapidly degrades oxalate, leaving more recalcitrant organic forms like citrate, pectate, and phytate to dominate. |
Review
#206
soil
Ca K
▶
LLM Prompt
Sample Information
Material: soil
Sample Origin: Tuttlingen, Swabian Alb, Germany
Sample-Specific Conditions
- Soil horizon: Ah1
- Rendzic Leptosol, Ah1 horizon
Measurement
We plan to measure the Ca K XANES spectrum of this sample.
Questions
Based on all the information above:
1. Based on the sample's origin and soil horizon (Ah1 of a Rendzic Leptosol), what candidate reference phases should be included in a linear combination fitting analysis of its Ca K-edge XANES spectrum?
2. Estimate the relative fractions of the Ca species present in this Ah1 horizon sample.
3. Explain the physical and pedogenic reasoning for the expected Ca speciation in this specific soil horizon, particularly the absence of carbonate and the dominance of organic and clay-bound Ca.
Ground Truth
Material: soil
Measurement: Ca K-edge XANES in fluorescence mode at Beamline 8 of SLRI
Fit method: Linear combination fitting (LCF)
Phase fractions: (±10%)
| Phase | Fraction |
|---|---|
| Clay mineral sorbed Ca | 0.273 |
| Oxalate Ca | 0.091 |
| Citrate Ca | 0.273 |
| Phytate Ca | 0.364 |
Fit basis (paper's reference spectra):
- calcite
- aragonite
- dolomite
- apatite
- brushite
- monetite
- anorthite
- augite
- epidote
- Ca adsorbed to montmorillonite
- gypsum
- anhydrite
- fluorite
- sinjarite
- Ca formate
- Ca acetate
- Ca citrate
- Ca oxalate
- Ca lactate
- Ca pectate
- Ca phytate
Source evidence: Table 4, page 204
Key reasoning: The Ah1 horizon of the Tuttlingen Rendzic Leptosol is depleted in Ca and has completely lost its carbonate due to intensive limestone weathering. This weathering leads to the accumulation of clay minerals and soil organic matter (SOM), which act as effective Ca2+ sorbents. As a result, the Ca speciation shifts entirely from lithogenic carbonate to a mixture of organically bound Ca (phytate, citrate, oxalate) and clay mineral-adsorbed Ca.
Reasoning source: Section 'Effects of pedogenesis on soil Ca speciation', page 213
Scoring Rubric (total: 100 pts)
| Q | Type | Max | Question | Reference Answer | Scoring Criteria |
|---|---|---|---|---|---|
| q1 | identification | 20 | Based on the sample's origin and soil horizon (Ah1 of a Rendzic Leptosol), what candidate reference phases should be included in a linear combination fitting analysis of its Ca K-edge XANES spectrum? | The candidate reference phases for the linear combination fitting analysis should include calcite, aragonite, dolomite, apatite, brushite, monetite, anorthite, augite, epidote, Ca adsorbed to montmorillonite, gypsum, anhydrite, fluorite, sinjarite, and various organic Ca forms (Ca formate, Ca acetate, Ca citrate, Ca oxalate, Ca lactate, Ca pectate, Ca phytate). These phases must be included because the Ah1 horizon of the Tuttlingen Rendzic Leptosol undergoes intensive limestone weathering, which depletes lithogenic carbonates. This weathering process leads to the accumulation of clay minerals and soil organic matter (SOM) that act as effective Ca2+ sorbents. Consequently, the fitting basis must broadly account for potential residual inorganic minerals as well as the organically bound and clay-adsorbed Ca species that dominate after pedogenesis. | Score based on the inclusion of relevant organic Ca standards (e.g., Ca phytate, Ca citrate, Ca oxalate) and clay mineral-adsorbed Ca, as well as the recognition that carbonate standards might be tested but found absent. |
| q2 | quantification | 40 | Estimate the relative fractions of the Ca species present in this Ah1 horizon sample. | The estimated relative fractions of Ca species in this sample are 36.4% Phytate Ca, 27.3% Citrate Ca, 27.3% Clay mineral sorbed Ca, and 9.1% Oxalate Ca. These specific values result from the intensive limestone weathering characteristic of the Ah1 horizon in this Rendzic Leptosol, which completely removes the original lithogenic carbonate. Because this weathering leads to the accumulation of soil organic matter and clay minerals, these materials act as highly effective Ca2+ sorbents. Therefore, the fractions reflect a complete shift in Ca speciation away from carbonates to a mixture entirely dominated by organically bound Ca and clay mineral-adsorbed Ca. | Full points for identifying the absence of carbonate and estimating roughly equal parts of clay mineral-sorbed Ca, citrate Ca, and phytate Ca (~25-35% each), with a minor contribution from oxalate Ca (~10%). |
| q3 | reasoning | 40 | Explain the physical and pedogenic reasoning for the expected Ca speciation in this specific soil horizon, particularly the absence of carbonate and the dominance of organic and clay-bound Ca. | The expected Ca speciation in the Ah1 horizon of the Tuttlingen Rendzic Leptosol is driven by intensive limestone weathering. This pedogenic process causes the soil horizon to become highly depleted in Ca, resulting in the complete loss of its original lithogenic carbonate. As the carbonates weather away, clay minerals and soil organic matter (SOM) accumulate in the horizon. These accumulated materials act as highly effective Ca2+ sorbents, capturing the remaining calcium. As a result, the Ca speciation shifts entirely from inorganic carbonates to a mixture of organically bound Ca (such as phytate, citrate, and oxalate) and clay mineral-adsorbed Ca. | Score based on mentioning intensive limestone weathering leading to carbonate depletion, and the subsequent accumulation of clay minerals and soil organic matter (SOM) that act as effective sorbents for Ca2+. |
Review
#207
soil
Ca K
▶
LLM Prompt
Sample Information
Material: soil
Sample Origin: Tuttlingen, Swabian Alb, Germany
Sample-Specific Conditions
- Soil horizon: Ah2
- Rendzic Leptosol, Ah2 horizon
Measurement
We plan to measure the Ca K XANES spectrum of this sample.
Questions
Based on all the information above:
1. Based on the sample conditions (Ah2 horizon of a Rendzic Leptosol from Tuttlingen), what are the expected Ca-bearing phases and their approximate mass fractions?
2. What reference spectra would be necessary to accurately model the Ca K-edge XANES spectrum of this soil sample using linear combination fitting?
3. Explain the physical and biogeochemical reasoning for the expected Ca speciation in this specific soil horizon, considering its pedogenic context.
Ground Truth
Material: soil
Measurement: Ca K-edge XANES in fluorescence mode at Beamline 8 of SLRI
Fit method: Linear combination fitting (LCF)
Phase fractions: (±10%)
| Phase | Fraction |
|---|---|
| Carbonate Ca | 0.273 |
| Clay mineral sorbed Ca | 0.182 |
| Citrate Ca | 0.364 |
| Pectate Ca | 0.182 |
Fit basis (paper's reference spectra):
- Calcite
- Aragonite
- Dolomite
- Apatite
- Brushite
- Monetite
- Epidote
- Anorthite
- Augite
- Ca adsorbed to montmorillonite
- Gypsum
- Anhydrite
- Fluorite
- Sinjarite
- Ca formate
- Ca acetate
- Ca citrate
- Ca oxalate
- Ca lactate
- Ca pectate
- Ca phytate
Source evidence: Table 4, page 204
Key reasoning: The Ah2 horizon of the Tuttlingen Rendzic Leptosol represents a topsoil horizon in a progressively advanced stage of pedogenesis. Intensive limestone weathering has led to a depletion of total Ca and a significant loss of lithogenic carbonate-bound Ca compared to the subsoil. Consequently, the Ca speciation is dominated by organically bound Ca (e.g., citrate and pectate) and Ca adsorbed to clay minerals that have accumulated during weathering. Oxalate-bound Ca is absent in this mineral horizon, as it is typically restricted to the uppermost organic layers and rapidly decomposed in calcareous soils.
Reasoning source: Results (Initial soils formed from calcareous parent material, page 203) and Discussion (Effects of pedogenesis on soil Ca speciation, page 213)
Scoring Rubric (total: 100 pts)
| Q | Type | Max | Question | Reference Answer | Scoring Criteria |
|---|---|---|---|---|---|
| q1 | quantification | 40 | Based on the sample conditions (Ah2 horizon of a Rendzic Leptosol from Tuttlingen), what are the expected Ca-bearing phases and their approximate mass fractions? | The expected Ca-bearing phases and their approximate mass fractions are Citrate Ca (36.4%), Carbonate Ca (27.3%), Clay mineral sorbed Ca (18.2%), and Pectate Ca (18.2%), with an estimated uncertainty of 10%. These specific fractions arise because the Ah2 horizon of this Tuttlingen Rendzic Leptosol represents a topsoil in a progressively advanced stage of pedogenesis. Intensive limestone weathering in this horizon has caused a significant depletion of total Ca and a major loss of lithogenic carbonate-bound Ca compared to the subsoil. Consequently, the remaining calcium speciation is dominated by organically bound forms (citrate and pectate) and Ca adsorbed to clay minerals that have accumulated during the weathering process. | Full credit for identifying organically bound Ca (citrate/pectate) as the dominant fraction (~55%), with significant contributions from carbonate Ca (~27%) and clay mineral-sorbed Ca (~18%). Deduct points for missing major phases or predicting large amounts of oxalate or primary silicates. |
| q2 | identification | 20 | What reference spectra would be necessary to accurately model the Ca K-edge XANES spectrum of this soil sample using linear combination fitting? | To accurately model the Ca K-edge XANES spectrum using linear combination fitting, a comprehensive basis set of reference spectra is required, including Calcite, Aragonite, Dolomite, Apatite, Brushite, Monetite, Epidote, Anorthite, Augite, Ca adsorbed to montmorillonite, Gypsum, Anhydrite, Fluorite, Sinjarite, and various organic Ca forms (formate, acetate, citrate, oxalate, lactate, pectate, and phytate). These specific references are necessary to capture the complex biogeochemical transformations occurring in the Ah2 horizon of a Rendzic Leptosol. Because this topsoil undergoes intensive limestone weathering, the references must account for residual lithogenic carbonates, newly accumulated clay minerals, and a variety of organically bound Ca species that dominate the advanced stages of pedogenesis. Furthermore, references like Ca oxalate must be included in the fit basis to confirm its expected absence, as oxalate is typically restricted to uppermost organic layers and rapidly decomposes in these calcareous mineral horizons. | Full credit for listing a comprehensive set of relevant environmental Ca references, specifically including carbonates (calcite), clay-adsorbed Ca (e.g., Ca-montmorillonite), and various organic Ca forms (citrate, pectate, oxalate, phytate). |
| q3 | reasoning | 40 | Explain the physical and biogeochemical reasoning for the expected Ca speciation in this specific soil horizon, considering its pedogenic context. | The Ca speciation in the Ah2 horizon of the Tuttlingen Rendzic Leptosol is driven by its progressively advanced stage of pedogenesis. Intensive limestone weathering in this topsoil horizon leads to the depletion of total Ca and a significant loss of lithogenic carbonate-bound Ca compared to the underlying subsoil. As a result of this weathering mechanism, clay minerals accumulate and organic matter becomes the primary sink for calcium. This explains why the final speciation is heavily dominated by organically bound Ca, specifically citrate and pectate, alongside Ca adsorbed to clay minerals. Additionally, oxalate-bound Ca is completely absent in this specific mineral horizon because it is typically restricted to the uppermost organic layers and is rapidly decomposed in calcareous soils. | Full credit for explaining that advanced pedogenesis and intensive limestone weathering in the topsoil lead to a depletion of lithogenic carbonate Ca and an accumulation of clay minerals and soil organic matter, which act as the primary Ca sorbents. Must mention the dominance of organically bound and clay-adsorbed Ca over carbonate, and the typical absence/rapid decomposition of Ca oxalate in such mineral horizons. |
Review
#208
soil
Ca K
▶
LLM Prompt
Sample Information
Material: soil
Sample Origin: Tuttlingen, Swabian Alb, Germany
Sample-Specific Conditions
- Soil horizon: BwAh
- Rendzic Leptosol, BwAh horizon
Measurement
We plan to measure the Ca K XANES spectrum of this sample.
Questions
Based on all the information above:
1. Based on the sample conditions (Rendzic Leptosol, BwAh horizon, limestone parent material), what are the expected major Ca phases and their approximate relative fractions?
2. What specific reference spectra are required to perform a linear combination fitting (LCF) analysis of the Ca K-edge XANES spectrum for this soil horizon?
3. Explain the pedogenic and biogeochemical processes that lead to the observed mixture of lithogenic and pedogenic/organic Ca phases in this specific soil horizon.
Ground Truth
Material: soil
Measurement: Ca K-edge XANES in fluorescence mode at Beamline 8 of the Synchrotron Light Research Institute (SLRI)
Fit method: Linear combination fitting (LCF)
Phase fractions: (±10%)
| Phase | Fraction |
|---|---|
| Carbonate Ca | 0.5 |
| Citrate Ca | 0.273 |
| Clay mineral sorbed Ca | 0.182 |
| Pectate Ca | 0.045 |
Fit basis (paper's reference spectra):
- Calcite (Carbonate Ca)
- Ca adsorbed to montmorillonite (Clay mineral sorbed Ca)
- Ca citrate
- Ca pectate
Source evidence: Table 4, page 204
Key reasoning: In the Rendzic Leptosol at Tuttlingen, the BwAh horizon represents a transitional zone where carbonate weathering has occurred but some lithogenic carbonate remains (50% of total Ca). The presence of organically bound Ca (citrate, pectate) and clay mineral-sorbed Ca reflects the accumulation of soil organic matter (SOM) and clay minerals due to pedogenesis and biotic activity. The remaining carbonate Ca indicates incomplete decalcification compared to the overlying Ah horizons, which have almost completely lost their carbonate due to intensive limestone weathering.
Reasoning source: Section 'Effects of pedogenesis on soil Ca speciation', pages 213-214
Scoring Rubric (total: 100 pts)
| Q | Type | Max | Question | Reference Answer | Scoring Criteria |
|---|---|---|---|---|---|
| q1 | quantification | 40 | Based on the sample conditions (Rendzic Leptosol, BwAh horizon, limestone parent material), what are the expected major Ca phases and their approximate relative fractions? | The expected major Ca phases in this Rendzic Leptosol BwAh horizon are Carbonate Ca (50%), Citrate Ca (27.3%), Clay mineral sorbed Ca (18.2%), and Pectate Ca (4.5%), with an estimated uncertainty of 10%. These specific fractions result from the BwAh horizon acting as a transitional zone where incomplete decalcification leaves exactly half of the total Ca as residual lithogenic carbonate. The remaining fractions (citrate, pectate, and clay-sorbed Ca) arise because pedogenesis and biotic activity lead to the accumulation of soil organic matter and clay minerals. Unlike the overlying Ah horizons that have almost completely lost their carbonate due to intensive weathering, this specific horizon retains a significant carbonate fraction alongside the newly formed pedogenic and organic phases. | Full credit for identifying Carbonate Ca (~50%), Citrate/organic Ca (~27%), Clay mineral sorbed Ca (~18%), and Pectate Ca (~5%). Partial credit for identifying the correct phases without exact fractions, or for correctly identifying Carbonate Ca as the dominant phase with secondary organic and clay-sorbed contributions. |
| q2 | identification | 30 | What specific reference spectra are required to perform a linear combination fitting (LCF) analysis of the Ca K-edge XANES spectrum for this soil horizon? | To perform a linear combination fitting (LCF) analysis on this sample, the required reference spectra are Calcite (Carbonate Ca), Ca adsorbed to montmorillonite (Clay mineral sorbed Ca), Ca citrate, and Ca pectate. These specific reference phases are expected because the BwAh horizon of this Rendzic Leptosol represents a transitional weathering zone containing both lithogenic and pedogenic components. Calcite is required because incomplete decalcification leaves residual lithogenic carbonate in this horizon. Meanwhile, the citrate, pectate, and montmorillonite references are necessary to account for the organically bound and clay-sorbed Ca that accumulate due to pedogenesis, biotic activity, and soil organic matter formation. | Full credit for listing a carbonate reference (e.g., Calcite), a clay mineral-sorbed Ca reference (e.g., Ca adsorbed to montmorillonite), and organic Ca references (Ca citrate, Ca pectate). |
| q3 | reasoning | 30 | Explain the pedogenic and biogeochemical processes that lead to the observed mixture of lithogenic and pedogenic/organic Ca phases in this specific soil horizon. | The observed mixture of Ca phases in the BwAh horizon of this Rendzic Leptosol is driven by its role as a transitional zone undergoing incomplete decalcification. Intensive limestone weathering occurs, but unlike the overlying Ah horizons which are almost completely decalcified, the BwAh horizon retains 50% of its total Ca as lithogenic carbonate (calcite). Concurrently, pedogenesis and biotic activity drive the accumulation of soil organic matter (SOM) and clay minerals. This biogeochemical alteration results in the formation of pedogenic and organic Ca phases, specifically organically bound Ca (citrate and pectate) and clay mineral-sorbed Ca, which make up the remaining half of the calcium speciation. | Full credit for explaining that the BwAh horizon is a transitional zone where intensive limestone weathering has reduced but not eliminated lithogenic carbonate, while pedogenesis and biotic activity have led to the accumulation of clay minerals and soil organic matter (SOM) that act as effective sorbents for Ca (forming clay-sorbed and organically bound Ca). |
Review
#209
soil
Ca K
▶
LLM Prompt
Sample Information
Material: soil
Sample Origin: Tuttlingen, Swabian Alb, Germany
Sample-Specific Conditions
- Soil horizon: C1
- Rendzic Leptosol, C1 horizon
Measurement
We plan to measure the Ca K XANES spectrum of this sample.
Questions
Based on all the information above:
1. Based on the soil type (Rendzic Leptosol) and parent material (limestone), what are the expected dominant Ca phases and their approximate fractions in the deep C1 horizon?
2. What specific reference spectra should be included in the linear combination fitting (LCF) basis to accurately model the Ca speciation in this C1 horizon sample?
3. Explain the pedogenic reasoning for the observed Ca speciation in the C1 horizon of this Rendzic Leptosol, particularly in contrast to what would be expected in the topsoil horizons.
Ground Truth
Material: soil
Measurement: Ca K-edge XANES in fluorescence mode at Beamline 8 of the Synchrotron Light Research Institute (SLRI)
Fit method: Linear combination fitting (LCF)
Phase fractions: (±10%)
| Phase | Fraction |
|---|---|
| Carbonate Ca | 0.83 |
| Citrate Ca | 0.17 |
Fit basis (paper's reference spectra):
- Calcite
- Ca citrate
Source evidence: Table 4, page 204
Key reasoning: The parent material of the Tuttlingen Rendzic Leptosol is limestone, and its bedrock Ca is calcite-bound. In the C horizons of all studied Leptosols, Ca was exclusively or almost exclusively bound in bedrock carbonates (calcite for Tuttlingen). The C1 horizon is deep and retains the typical features of the unweathered bedrock mineralogy, resulting in a strong dominance of carbonate-bound Ca, with only a minor contribution of organically bound Ca (modeled as citrate).
Reasoning source: Page 203, 'Initial soils formed from calcareous parent material' section
Scoring Rubric (total: 100 pts)
| Q | Type | Max | Question | Reference Answer | Scoring Criteria |
|---|---|---|---|---|---|
| q1 | quantification | 40 | Based on the soil type (Rendzic Leptosol) and parent material (limestone), what are the expected dominant Ca phases and their approximate fractions in the deep C1 horizon? | The expected Ca phases in this sample are Carbonate Ca at approximately 0.83 (83%) and Citrate Ca at approximately 0.17 (17%), with a 10% uncertainty. These specific fractions result from the sample being located in the deep C1 horizon of a Rendzic Leptosol formed from limestone parent material. Because this deep horizon retains the unweathered bedrock mineralogy, the speciation is strongly dominated by the original bedrock carbonates (calcite), leaving only a minor fraction of organically bound Ca (modeled as citrate). | Full points for identifying Carbonate Ca as the strongly dominant phase (~83%) and a minor organic Ca component (e.g., Citrate Ca, ~17%). Partial credit if carbonate is identified as dominant but fractions are slightly off. |
| q2 | identification | 30 | What specific reference spectra should be included in the linear combination fitting (LCF) basis to accurately model the Ca speciation in this C1 horizon sample? | The linear combination fitting (LCF) basis should include Calcite and Ca citrate reference spectra. These specific phases are expected because the sample originates from the C1 horizon of a Tuttlingen Rendzic Leptosol, which formed from a limestone parent material. The deep C1 horizon retains the unweathered bedrock mineralogy, meaning the Ca is almost exclusively bound in bedrock carbonates, which explains the need for the calcite reference. The Ca citrate reference is required to model the minor contribution of organically bound Ca present in this horizon. | Full points for specifying a calcium carbonate reference (specifically calcite, given the limestone bedrock) and an organic carboxylate reference (such as Ca citrate). |
| q3 | reasoning | 30 | Explain the pedogenic reasoning for the observed Ca speciation in the C1 horizon of this Rendzic Leptosol, particularly in contrast to what would be expected in the topsoil horizons. | The observed Ca speciation in the C1 horizon is strongly dominated by carbonate-bound Ca (83% calcite) alongside a minor organically bound component (17% Ca citrate). This occurs because the parent material of the Tuttlingen Rendzic Leptosol is limestone, meaning the original bedrock Ca is calcite-bound. Because the C1 horizon is deep, it retains the typical features of the unweathered bedrock mineralogy, resulting in an almost exclusive binding of Ca in bedrock carbonates. This contrasts with shallower topsoil horizons, which would typically be more weathered and have higher organic contributions. | Full points for explaining that the C horizon retains the unweathered bedrock mineralogy (calcite/limestone), whereas topsoil horizons would be expected to show carbonate depletion due to weathering and an accumulation of organically bound or clay-adsorbed Ca. |
Review
#210
soil
Ca K
▶
LLM Prompt
Sample Information
Material: soil
Sample Origin: Tuttlingen, Swabian Alb, Germany
Sample-Specific Conditions
- Soil horizon: C2
- Rendzic Leptosol, C2 horizon
Measurement
We plan to measure the Ca K XANES spectrum of this sample.
Questions
Based on all the information above:
1. Based on the sample origin (limestone bedrock) and soil horizon (C2, deep subsoil), identify the expected Ca phases and estimate their approximate mass fractions.
2. What reference spectra are necessary to include in a Linear Combination Fitting (LCF) analysis to accurately model the Ca speciation in this sample?
3. Explain the pedogenic and biogeochemical reasoning for the dominance of the major Ca phase in this specific C2 horizon, and contrast it with the expected speciation in a topsoil horizon.
Ground Truth
Material: soil
Measurement: Ca K-edge XANES, fluorescence mode, Beamline 8 of SLRI
Fit method: Linear combination fitting (LCF)
Phase fractions: (±10%)
| Phase | Fraction |
|---|---|
| Carbonate Ca | 0.9 |
| Citrate Ca | 0.1 |
Fit basis (paper's reference spectra):
- Calcite
- Aragonite
- Dolomite
- Apatite
- Brushite
- Monetite
- Epidote
- Anorthite
- Augite
- Ca adsorbed to montmorillonite
- Gypsum
- Anhydrite
- Fluorite
- Sinjarite
- Ca formate
- Ca acetate
- Ca citrate
- Ca oxalate
- Ca lactate
- Ca pectate
- Ca phytate
Source evidence: Table 4, page 204
Key reasoning: The C2 horizon is a deep subsoil horizon of a Rendzic Leptosol formed from limestone bedrock. In these initial soils, the subsoil Ca speciation is strongly dominated by the lithogenic bedrock mineralogy, which at Tuttlingen is calcite. Weathering and pedogenesis, which deplete carbonate and accumulate organically bound Ca, are minimal at this depth compared to the topsoil.
Reasoning source: Results (Soils: Initial soils formed from calcareous parent material), page 203; Discussion (Effects of pedogenesis on soil Ca speciation), page 213
Scoring Rubric (total: 100 pts)
| Q | Type | Max | Question | Reference Answer | Scoring Criteria |
|---|---|---|---|---|---|
| q1 | quantification | 40 | Based on the sample origin (limestone bedrock) and soil horizon (C2, deep subsoil), identify the expected Ca phases and estimate their approximate mass fractions. | The expected Ca phases in this sample are Carbonate Ca and Citrate Ca, with approximate mass fractions of 0.9 (90%) and 0.1 (10%), respectively, with an uncertainty of 10%. These specific values result from the sample being from the C2 horizon of a Rendzic Leptosol formed from limestone bedrock in Tuttlingen. At this deep subsoil depth, weathering and pedogenesis are minimal compared to the topsoil. Consequently, the Ca speciation is strongly dominated by the lithogenic bedrock mineralogy (calcite), leading to the high 90% carbonate fraction, while organically bound Ca (citrate) remains very low at 10%. | Full points if Carbonate Ca is identified as the dominant phase (~90%) and a minor organic phase (like Citrate Ca) is estimated at ~10%. Partial points for identifying Carbonate Ca as the overwhelming majority without specifying the minor organic component. |
| q2 | identification | 30 | What reference spectra are necessary to include in a Linear Combination Fitting (LCF) analysis to accurately model the Ca speciation in this sample? | To accurately model the Ca speciation using Linear Combination Fitting (LCF), a comprehensive basis set of reference spectra is required, including Calcite, Aragonite, Dolomite, Apatite, Brushite, Monetite, Epidote, Anorthite, Augite, Ca adsorbed to montmorillonite, Gypsum, Anhydrite, Fluorite, Sinjarite, and various organic Ca forms (formate, acetate, citrate, oxalate, lactate, pectate, and phytate). These specific references are necessary to capture both the dominant lithogenic minerals and the minor organically bound phases present in the soil. Because this Rendzic Leptosol C2 horizon is formed from limestone bedrock, the basis set must heavily feature carbonates like calcite to account for the unweathered parent material. Additionally, the inclusion of organic Ca references like Ca citrate is essential to detect the minor organically bound Ca fractions that accumulate even under minimal pedogenesis in the subsoil. | Full points for listing inorganic carbonates (especially Calcite, given the limestone origin) and relevant organic Ca carboxylates (e.g., Citrate, Oxalate, Pectate) as candidate reference spectra. |
| q3 | reasoning | 30 | Explain the pedogenic and biogeochemical reasoning for the dominance of the major Ca phase in this specific C2 horizon, and contrast it with the expected speciation in a topsoil horizon. | The major Ca phase in this Rendzic Leptosol C2 horizon is Carbonate Ca, which accounts for 90% of the speciation. This dominance occurs because the C2 horizon is a deep subsoil layer formed directly from the local limestone bedrock at Tuttlingen. At this depth, the soil experiences minimal weathering and pedogenesis, meaning the Ca speciation remains strongly dictated by the lithogenic bedrock mineralogy, specifically calcite. In contrast, a topsoil horizon would experience much higher rates of weathering and pedogenesis. This surface activity would deplete the lithogenic carbonate minerals and accumulate a higher fraction of organically bound Ca phases, such as Citrate Ca, which only makes up 10% of this deep subsoil sample. | Full points for explaining that the C2 horizon is deep subsoil where lithogenic bedrock mineralogy (calcite/carbonate) dominates due to minimal weathering. Must contrast this with topsoil, where pedogenesis and weathering deplete carbonates and accumulate organically bound or clay-adsorbed Ca. |
Review
#211
bedrock
Ca K
▶
LLM Prompt
Sample Information
Material: bedrock
Sample Origin: Tuttlingen, Swabian Alb, Germany
Sample-Specific Conditions
- Soil horizon: Bedrock
- Rendzic Leptosol, Bedrock
Measurement
We plan to measure the Ca K XANES spectrum of this sample.
Questions
Based on all the information above:
1. Based on the sample origin (Tuttlingen, Swabian Alb, Jurassic limestone), what is the expected dominant Ca phase in this bedrock sample, and why?
2. What candidate reference spectra should be included in a linear combination fitting analysis to model the Ca speciation of this bedrock and its overlying soil horizons?
3. How is the Ca speciation expected to change as this bedrock weathers into the overlying mineral and organic soil horizons?
Ground Truth
Material: bedrock
Measurement: Ca K-edge XANES in fluorescence mode at Beamline 8 of SLRI
Fit method: Linear combination fitting (LCF)
Phase fractions: (±10%)
| Phase | Fraction |
|---|---|
| Carbonate Ca | 1.0 |
Fit basis (paper's reference spectra):
- Calcite
- Aragonite
- Dolomite
- Apatite
- Brushite
- Monetite
- Anorthite
- Augite
- Epidote
- Ca adsorbed to montmorillonite
- Gypsum
- Anhydrite
- Fluorite
- Sinjarite
- Ca formate
- Ca acetate
- Ca citrate
- Ca oxalate
- Ca lactate
- Ca pectate
- Ca phytate
Source evidence: Table 4, page 204
Key reasoning: The bedrock at the Tuttlingen site is Jurassic limestone, which consists entirely of calcite. Therefore, the Ca in the bedrock sample is exclusively bound as lithogenic carbonate (calcite). During pedogenesis, this lithogenic carbonate weathers and is progressively replaced by organically bound Ca and clay mineral-bound Ca in the overlying soil horizons.
Reasoning source: Page 203, 'Initial soils formed from calcareous parent material' section
Scoring Rubric (total: 100 pts)
| Q | Type | Max | Question | Reference Answer | Scoring Criteria |
|---|---|---|---|---|---|
| q1 | reasoning | 35 | Based on the sample origin (Tuttlingen, Swabian Alb, Jurassic limestone), what is the expected dominant Ca phase in this bedrock sample, and why? | The expected dominant Ca phase in this bedrock sample is Carbonate Ca (specifically calcite) at a fraction of 1.0 (100%). This occurs because the bedrock at the Tuttlingen site in the Swabian Alb is composed of Jurassic limestone, which consists entirely of calcite. Therefore, given these specific geological conditions, the calcium in the unweathered bedrock is exclusively bound as lithogenic carbonate. | Full points for identifying Carbonate Ca (or calcite) as the sole phase (1.0 fraction) and explaining that the bedrock is Jurassic limestone. |
| q2 | identification | 30 | What candidate reference spectra should be included in a linear combination fitting analysis to model the Ca speciation of this bedrock and its overlying soil horizons? | The linear combination fitting analysis should include a comprehensive basis set of 21 reference spectra: Calcite, Aragonite, Dolomite, Apatite, Brushite, Monetite, Anorthite, Augite, Epidote, Ca adsorbed to montmorillonite, Gypsum, Anhydrite, Fluorite, Sinjarite, Ca formate, Ca acetate, Ca citrate, Ca oxalate, Ca lactate, Ca pectate, and Ca phytate. These specific references are required because they capture the full range of Ca speciation expected as the Jurassic limestone bedrock weathers into a Rendzic Leptosol. While the unweathered bedrock is exclusively lithogenic carbonate (calcite), the overlying soil horizons will contain organically bound Ca and clay mineral-bound Ca due to pedogenesis, necessitating this broad array of mineral, organic, and adsorbed Ca standards. | Full points for listing relevant inorganic (e.g., calcite, dolomite, silicates) and organic (e.g., Ca oxalate, Ca pectate, Ca phytate) reference compounds. |
| q3 | prediction | 35 | How is the Ca speciation expected to change as this bedrock weathers into the overlying mineral and organic soil horizons? | As the bedrock weathers, the Ca speciation will shift from 1.0 (100%) Carbonate Ca to a mixture of organically bound Ca and clay mineral-bound Ca. This transformation occurs because the initial Rendzic Leptosol bedrock consists entirely of Jurassic limestone, which is exclusively lithogenic carbonate. During pedogenesis, this lithogenic carbonate undergoes weathering and is progressively replaced by calcium that binds to organic matter and clay minerals in the overlying soil horizons. | Full points for stating that lithogenic carbonate weathers and is replaced by organically bound Ca and clay mineral-bound Ca. |
Review
#212
soil
Ca K
▶
LLM Prompt
Sample Information
Material: soil
Sample Origin: Wellheim, Franconian Alb, Germany
Sample-Specific Conditions
- Soil horizon: L
- Rendzic Leptosol, L horizon
Measurement
We plan to measure the Ca K XANES spectrum of this sample.
Questions
Based on all the information above:
1. Based on the sample conditions (L horizon of a forest soil), what are the expected dominant Ca phases and their approximate fractions?
2. What reference spectra should be included in the basis set to accurately model the Ca K-edge XANES spectrum of this litter layer sample using Linear Combination Fitting?
3. Explain the biogeochemical reasoning for why the Ca speciation in this L horizon is entirely organically bound, specifically dominated by oxalate and pectate.
Ground Truth
Material: soil
Measurement: Ca K-edge XANES, fluorescence mode, Beamline 8 of SLRI
Fit method: Linear Combination Fitting (LCF)
Phase fractions: (±10%)
| Phase | Fraction |
|---|---|
| Oxalate Ca | 0.4 |
| Citrate Ca | 0.2 |
| Pectate Ca | 0.4 |
Fit basis (paper's reference spectra):
- Calcite
- Aragonite
- Dolomite
- Apatite
- Brushite
- Monetite
- Anorthite
- Augite
- Epidote
- Ca adsorbed to montmorillonite
- Gypsum
- Anhydrite
- Fluorite
- Sinjarite
- Ca formate
- Ca acetate
- Ca citrate
- Ca oxalate
- Ca lactate
- Ca pectate
- Ca phytate
Source evidence: Table 4, page 204
Key reasoning: The L horizon represents the uppermost litter layer of the forest floor. Organically bound Ca enters this layer primarily via litter fall (e.g., foliage, twigs). The Ca speciation in the L layer is dominated by Ca pectate and Ca oxalate, which closely reflects the Ca speciation of beech foliage, the dominant litter source at the site. Plant-synthesized Ca oxalate and Ca pectate are deposited directly onto the soil surface, leading to a purely organic Ca speciation in this initial decomposition stage.
Reasoning source: Page 215, 'Speciation of organically bound soil Ca as affected by plant input and microbial turnover'
Scoring Rubric (total: 100 pts)
| Q | Type | Max | Question | Reference Answer | Scoring Criteria |
|---|---|---|---|---|---|
| q1 | quantification | 40 | Based on the sample conditions (L horizon of a forest soil), what are the expected dominant Ca phases and their approximate fractions? | The expected dominant Ca phases in this sample are Oxalate Ca (0.4 or 40%), Pectate Ca (0.4 or 40%), and Citrate Ca (0.2 or 20%), with an estimated uncertainty of 10%. These specific fractions result from the sample being from the L horizon, which is the uppermost litter layer of the forest floor. In this initial decomposition stage, organically bound Ca enters the layer directly via litter fall such as foliage and twigs. The dominance of Ca oxalate and Ca pectate at these exact fractions closely reflects the natural Ca speciation of beech foliage, which is the primary litter source deposited onto the soil surface at this site. | Full points for identifying Ca oxalate, Ca pectate, and Ca citrate as the primary phases with fractions around 40%, 40%, and 20% respectively. Partial points for identifying that the Ca is 100% organically bound with oxalate and pectate as major components. |
| q2 | identification | 30 | What reference spectra should be included in the basis set to accurately model the Ca K-edge XANES spectrum of this litter layer sample using Linear Combination Fitting? | To accurately model the Ca K-edge XANES spectrum using Linear Combination Fitting, the basis set should include Calcite, Aragonite, Dolomite, Apatite, Brushite, Monetite, Anorthite, Augite, Epidote, Ca adsorbed to montmorillonite, Gypsum, Anhydrite, Fluorite, Sinjarite, Ca formate, Ca acetate, Ca citrate, Ca oxalate, Ca lactate, Ca pectate, and Ca phytate. This comprehensive mix of organic and inorganic references is required because the sample is from the L horizon of a Rendzic Leptosol. Since this uppermost litter layer receives plant-synthesized Ca directly from litter fall (e.g., foliage and twigs), organic references like Ca oxalate, Ca pectate, and Ca citrate are essential to capture the purely organic Ca speciation of the initial decomposition stage. Meanwhile, the inorganic references are necessary to verify the absence of mineral Ca contributions in this specific soil horizon. | Full points for listing relevant organic Ca reference compounds such as Ca oxalate, Ca pectate, and Ca citrate (or other carboxylates). Partial points for mentioning general organic Ca standards without specific names. |
| q3 | reasoning | 30 | Explain the biogeochemical reasoning for why the Ca speciation in this L horizon is entirely organically bound, specifically dominated by oxalate and pectate. | The Ca speciation in the L horizon is entirely organically bound because this horizon represents the uppermost litter layer of the forest floor, which is the initial stage of organic matter decomposition. Calcium enters this layer primarily through direct litter fall, such as foliage and twigs from the forest canopy. The speciation is specifically dominated by Ca oxalate (40%) and Ca pectate (40%) because these fractions closely reflect the inherent Ca speciation of beech foliage, the dominant litter source at the Wellheim site. Because these plant-synthesized organic Ca compounds are deposited directly onto the soil surface, the resulting speciation remains purely organic prior to deeper soil integration or advanced microbial turnover. | Full points for explaining that the L horizon consists of fresh litter fall (foliage), and its Ca speciation directly reflects the plant-synthesized Ca forms (oxalate and pectate) deposited on the soil surface before significant microbial decomposition or mixing with mineral soil occurs. |
Review
#213
soil
Ca K
▶
LLM Prompt
Sample Information
Material: soil
Sample Origin: Wellheim, Franconian Alb, Germany
Sample-Specific Conditions
- Soil horizon: Ah
- Rendzic Leptosol, Ah horizon
Measurement
We plan to measure the Ca K XANES spectrum of this sample.
Questions
Based on all the information above:
1. Based on the sample conditions (Rendzic Leptosol, Ah horizon, formed on dolomitic limestone), what are the expected major Ca phases and their approximate fractions?
2. What reference spectra should be included in the basis set for Linear Combination Fitting (LCF) of this soil sample?
3. Explain the biogeochemical reasoning for the observed Ca speciation in this Ah horizon. Specifically, address the balance between inorganic and organic Ca, and why certain organic Ca phases are present while others are absent.
Ground Truth
Material: soil
Measurement: Ca K-edge XANES, fluorescence mode, Beamline 8 of SLRI
Fit method: Linear combination fitting (LCF)
Phase fractions: (±10%)
| Phase | Fraction |
|---|---|
| Carbonate Ca | 0.318 |
| Pectate Ca | 0.318 |
| Phytate Ca | 0.318 |
Fit basis (paper's reference spectra):
- Calcite
- Aragonite
- Dolomite
- Apatite
- Brushite
- Monetite
- Anorthite
- Augite
- Epidote
- Ca adsorbed to montmorillonite
- Gypsum
- Anhydrite
- Fluorite
- Sinjarite
- Ca formate
- Ca acetate
- Ca citrate
- Ca oxalate
- Ca lactate
- Ca pectate
- Ca phytate
Source evidence: Table 4, page 10
Key reasoning: In the Ah horizon of the Wellheim Rendzic Leptosol, organically bound Ca dominates over inorganically bound Ca. The inorganic Ca is present as carbonate-Ca, reflecting the dolomitic limestone parent material, but its contribution is decreased compared to the subsoil due to carbonate weathering. The organically bound Ca is present as Ca pectate and Ca phytate, which enter the soil via litter fall and root necromass. Oxalate-bound Ca, which dominates in the litter (L) layer, is absent in the mineral soil due to rapid microbial decomposition in calcareous soils.
Reasoning source: Results (Initial soils formed from calcareous parent material, page 9) and Discussion (Speciation of organically bound soil Ca as affected by plant input and microbial turnover, pages 21-23)
Scoring Rubric (total: 100 pts)
| Q | Type | Max | Question | Reference Answer | Scoring Criteria |
|---|---|---|---|---|---|
| q1 | quantification | 40 | Based on the sample conditions (Rendzic Leptosol, Ah horizon, formed on dolomitic limestone), what are the expected major Ca phases and their approximate fractions? | The expected major Ca phases in this Ah horizon sample are Carbonate Ca, Pectate Ca, and Phytate Ca, each accounting for approximately 31.8% (0.318 fraction) of the total Ca, with an uncertainty of 10%. These specific fractions arise because organically bound Ca (pectate and phytate combined) dominates over inorganically bound Ca in this topsoil horizon. The inorganic carbonate fraction (31.8%) reflects the dolomitic limestone parent material, though its contribution is reduced due to carbonate weathering compared to the subsoil. The remaining ~63.6% consists of organic Ca pectate and Ca phytate, which accumulate in the Ah horizon via litter fall and root necromass. | Full points for identifying Carbonate Ca, Pectate Ca, and Phytate Ca as the major phases with roughly equal fractions (~30-35% each). Partial points for identifying the dominance of organically bound Ca (pectate/phytate) and the presence of residual carbonate. |
| q2 | identification | 30 | What reference spectra should be included in the basis set for Linear Combination Fitting (LCF) of this soil sample? | The basis set for Linear Combination Fitting (LCF) should include Calcite, Aragonite, Dolomite, Apatite, Brushite, Monetite, Anorthite, Augite, Epidote, Ca adsorbed to montmorillonite, Gypsum, Anhydrite, Fluorite, Sinjarite, Ca formate, Ca acetate, Ca citrate, Ca oxalate, Ca lactate, Ca pectate, and Ca phytate. This comprehensive set of references is necessary to capture the complex biogeochemical environment of the Rendzic Leptosol Ah horizon. Specifically, inorganic references like dolomite and calcite are required to account for the dolomitic limestone parent material and its weathering products. Furthermore, a wide array of organic references (such as pectate, phytate, and oxalate) must be included to model the dominant organically bound Ca introduced via litter fall and root necromass, as well as to account for microbial decomposition dynamics. | Full points for listing a comprehensive set of relevant environmental Ca references, including carbonates (calcite, dolomite), silicates, clay-adsorbed Ca, and various organic Ca forms (oxalate, pectate, phytate, citrate). |
| q3 | reasoning | 30 | Explain the biogeochemical reasoning for the observed Ca speciation in this Ah horizon. Specifically, address the balance between inorganic and organic Ca, and why certain organic Ca phases are present while others are absent. | In the Ah horizon of this Rendzic Leptosol, organically bound Ca dominates over inorganically bound Ca due to the continuous input of plant material and active topsoil weathering. The inorganic Ca is present as carbonate-Ca, which reflects the underlying dolomitic limestone parent material, but its relative fraction is decreased due to carbonate weathering. The dominant organic phases are Ca pectate and Ca phytate, which are introduced into the soil through litter fall and root necromass. Notably, oxalate-bound Ca is absent in this mineral soil horizon, despite dominating the overlying litter layer, because it undergoes rapid microbial decomposition in these calcareous soil conditions. | Full points for explaining that carbonate weathering reduces inorganic Ca compared to the subsoil, while plant input enriches organically bound Ca. Must mention that Ca pectate and Ca phytate accumulate, whereas Ca oxalate (dominant in litter) is absent due to rapid microbial decomposition in calcareous soils. |
Review
#214
soil
Ca K
▶
LLM Prompt
Sample Information
Material: soil
Sample Origin: Wellheim, Franconian Alb, Germany
Sample-Specific Conditions
- Soil horizon: CAh
- Rendzic Leptosol, CAh horizon
Measurement
We plan to measure the Ca K XANES spectrum of this sample.
Questions
Based on all the information above:
1. Based on the sample conditions (Rendzic Leptosol, CAh horizon, dolomitic limestone parent material), what candidate reference spectra are needed for Linear Combination Fitting of its Ca K-edge XANES spectrum?
2. Estimate the relative fractions of the Ca phases in this CAh horizon sample.
3. Explain the pedogenic and biogeochemical processes that lead to the specific Ca speciation (balance of inorganic vs. organic Ca forms) observed in this transitional CAh horizon.
Ground Truth
Material: soil
Measurement: Ca K-edge XANES, fluorescence mode, Beamline 8 of the Synchrotron Light Research Institute (SLRI)
Fit method: Linear combination fitting (LCF)
Phase fractions: (±10%)
| Phase | Fraction |
|---|---|
| Carbonate Ca | 0.346 |
| Oxalate Ca | 0.115 |
| Citrate Ca | 0.154 |
| Pectate Ca | 0.115 |
| Phytate Ca | 0.269 |
Fit basis (paper's reference spectra):
- Carbonate Ca (calcite/dolomite)
- Ca oxalate
- Ca citrate
- Ca pectate
- Ca phytate
Source evidence: Table 4, page 204
Key reasoning: In the Rendzic Leptosol formed from dolomitic limestone, the CAh horizon represents a transition between the unweathered subsoil and the highly weathered topsoil. Carbonate weathering leads to a decreased contribution of lithogenic carbonate-Ca compared to the subsoil, while pedogenesis and biotic activity result in the accumulation of organically bound Ca. Organically bound Ca dominates this horizon (65% of total Ca), primarily present as Ca phytate, citrate, oxalate, and pectate, reflecting plant inputs and microbial turnover. The remaining carbonate-Ca (35%) reflects the incomplete weathering of the parent material at this transitional depth.
Reasoning source: Results (Initial soils formed from calcareous parent material), page 203; Discussion (Effects of pedogenesis on soil Ca speciation), page 213
Scoring Rubric (total: 100 pts)
| Q | Type | Max | Question | Reference Answer | Scoring Criteria |
|---|---|---|---|---|---|
| q1 | identification | 20 | Based on the sample conditions (Rendzic Leptosol, CAh horizon, dolomitic limestone parent material), what candidate reference spectra are needed for Linear Combination Fitting of its Ca K-edge XANES spectrum? | To fit the Ca K-edge XANES spectrum of this sample, the required reference spectra are Carbonate Ca (calcite/dolomite), Ca oxalate, Ca citrate, Ca pectate, and Ca phytate. These specific phases are expected because the CAh horizon of a Rendzic Leptosol represents a transitional zone between unweathered subsoil and highly weathered topsoil. The presence of carbonate references accounts for the incomplete weathering of the dolomitic limestone parent material at this depth. Meanwhile, the organic Ca references (oxalate, citrate, pectate, and phytate) are necessary because pedogenesis and biotic activity lead to the accumulation of organically bound Ca from plant inputs and microbial turnover. | Full points for identifying a mix of lithogenic carbonate (calcite/dolomite) and various organic Ca forms (oxalate, citrate, pectate, phytate). Partial points for missing some organic components. |
| q2 | quantification | 40 | Estimate the relative fractions of the Ca phases in this CAh horizon sample. | The estimated relative fractions for the Ca phases in this sample are 34.6% Carbonate Ca, 26.9% Phytate Ca, 15.4% Citrate Ca, 11.5% Oxalate Ca, and 11.5% Pectate Ca, with an uncertainty of 10%. These specific values result from the CAh horizon acting as a transitional layer where organically bound Ca dominates (approximately 65% of total Ca) due to pedogenesis, plant inputs, and microbial turnover. The remaining 34.6% consists of lithogenic carbonate-Ca, which reflects the incomplete weathering of the dolomitic limestone parent material at this specific depth. Consequently, the fractions illustrate a balance between decreasing lithogenic minerals and accumulating biogenic organic Ca forms. | Full points if the estimated fractions are within ±10% of the ground truth (approx. 35% carbonate Ca, 65% organic Ca distributed among phytate, citrate, oxalate, and pectate). Partial points for correctly identifying the dominance of organic Ca over carbonate Ca. |
| q3 | reasoning | 40 | Explain the pedogenic and biogeochemical processes that lead to the specific Ca speciation (balance of inorganic vs. organic Ca forms) observed in this transitional CAh horizon. | In the CAh horizon of this Rendzic Leptosol, the Ca speciation is driven by a balance between carbonate weathering and biological accumulation. Because this horizon is a transition between the unweathered subsoil and highly weathered topsoil, weathering processes decrease the contribution of lithogenic carbonate-Ca from the dolomitic limestone parent material to about 35%. Simultaneously, pedogenesis and biotic activity drive the accumulation of organically bound Ca, which dominates the horizon at roughly 65% of the total Ca. This organic fraction, primarily composed of Ca phytate, citrate, oxalate, and pectate, is a direct result of continuous plant inputs and microbial turnover in the soil. | Full points for explaining that the CAh horizon is a transitional zone where incomplete weathering leaves residual lithogenic carbonate, while pedogenesis and biotic activity (plant litter, microbial turnover) drive the accumulation of diverse organically bound Ca forms (phytate, pectate, oxalate, citrate) which dominate the total Ca. |
Review
#215
soil
Ca K
▶
LLM Prompt
Sample Information
Material: soil
Sample Origin: Achenpass, German Alps, Germany
Sample-Specific Conditions
- Soil horizon: L
- Rendzic Leptosol, L horizon
Measurement
We plan to measure the Ca K XANES spectrum of this sample.
Questions
Based on all the information above:
1. Based on the sample origin (mature mixed mountain forest) and soil horizon (L horizon of a Rendzic Leptosol), what are the expected dominant Ca phases and their approximate fractions?
2. What reference spectra would be most critical to include in a Linear Combination Fitting (LCF) analysis for this specific forest floor (L horizon) sample?
3. Explain the biogeochemical reasoning for the high abundance of Ca oxalate and Ca pectate in the L horizon of this forest soil.
Ground Truth
Material: soil
Measurement: Ca K-edge XANES, fluorescence mode, Beamline 8 of SLRI
Fit method: Linear Combination Fitting (LCF)
Phase fractions: (±10%)
| Phase | Fraction |
|---|---|
| Oxalate Ca | 0.438 |
| Citrate Ca | 0.125 |
| Pectate Ca | 0.438 |
Fit basis (paper's reference spectra):
- Ca oxalate
- Ca citrate
- Ca pectate
Source evidence: Table 4, page 10
Key reasoning: The Ca speciation in the L layers (litter layers) of the Leptosols is dominated by Ca pectate and Ca oxalate, which is almost identical to the speciation of beech foliage, the dominating litter source at the site. Organically bound Ca enters the forest floor surface via litter fall (foliage, seeds, twigs, bark particles) deposited on and being converted into L layers. The markedly elevated concentrations of oxalate-bound Ca in L layers compared to deeper horizons highlight the relevance of Ca oxalate input into forest soils via litter fall.
Reasoning source: Page 21-22, Sections 'Speciation of organically bound soil Ca as affected by plant input and microbial turnover' and 'The fate of Ca oxalate in calcareous and silicate soils'
Scoring Rubric (total: 100 pts)
| Q | Type | Max | Question | Reference Answer | Scoring Criteria |
|---|---|---|---|---|---|
| q1 | quantification | 40 | Based on the sample origin (mature mixed mountain forest) and soil horizon (L horizon of a Rendzic Leptosol), what are the expected dominant Ca phases and their approximate fractions? | The expected dominant Ca phases for this sample are Oxalate Ca (43.8%), Pectate Ca (43.8%), and Citrate Ca (12.5%), with an uncertainty of 10%. These specific fractions arise because the L horizon (litter layer) of this Rendzic Leptosol is heavily influenced by fresh litter fall, primarily from beech foliage. Organically bound Ca enters the forest floor surface via this litter fall, which is naturally rich in Ca pectate and Ca oxalate. Consequently, the speciation in this surface layer is almost identical to the source foliage, resulting in the markedly elevated concentrations of oxalate- and pectate-bound Ca compared to deeper soil horizons. | Full points for identifying Ca oxalate and Ca pectate as the dominant phases with fractions around 40-45% each, and a minor contribution of Ca citrate (~10-15%). Deduct points for missing major phases or including significant inorganic phases (like carbonate or clay-bound Ca) which are absent in this litter layer. |
| q2 | identification | 30 | What reference spectra would be most critical to include in a Linear Combination Fitting (LCF) analysis for this specific forest floor (L horizon) sample? | The most critical reference spectra to include in the Linear Combination Fitting (LCF) analysis are Ca oxalate, Ca pectate, and Ca citrate. These specific reference phases are required because the L horizon of this Rendzic Leptosol consists of a litter layer dominated by recent plant input, specifically beech foliage, seeds, twigs, and bark particles. This fresh litter fall deposits organically bound Ca directly onto the forest floor surface. Because the Ca speciation in this layer remains almost identical to the original foliage, the LCF basis must account for the highly elevated levels of Ca oxalate and Ca pectate characteristic of this biological input. | Full points for listing organic Ca reference compounds, specifically Ca oxalate, Ca pectate, and Ca citrate. Deduct points for suggesting inorganic minerals (e.g., calcite, dolomite, silicates) as primary components for this specific horizon. |
| q3 | reasoning | 30 | Explain the biogeochemical reasoning for the high abundance of Ca oxalate and Ca pectate in the L horizon of this forest soil. | The high abundance of Ca oxalate (43.8%) and Ca pectate (43.8%) in the L horizon of this Rendzic Leptosol is directly driven by the deposition of fresh plant material. Organically bound Ca enters the forest floor surface primarily through litter fall, such as foliage, seeds, twigs, and bark particles. At this site, beech foliage is the dominating litter source, and its natural Ca speciation is almost identical to what is found in the L layer. Therefore, as this litter is deposited and begins converting into the L layer, it creates markedly elevated concentrations of oxalate-bound and pectate-bound Ca compared to deeper soil horizons. | Full points for explaining that the L layer composition reflects the input of fresh plant litter (especially foliage like beech), which is rich in plant-synthesized Ca oxalate and Ca pectate. Mentioning that organically bound Ca enters the forest floor via this litter fall is required. |
Review
#216
soil
Ca K
▶
LLM Prompt
Sample Information
Material: soil
Sample Origin: Achenpass, German Alps, Germany
Sample-Specific Conditions
- Soil horizon: Ah
- Rendzic Leptosol, Ah horizon
Measurement
We plan to measure the Ca K XANES spectrum of this sample.
Questions
Based on all the information above:
1. Based on the sample origin (Achenpass, German Alps) and soil horizon (Rendzic Leptosol, Ah horizon), what are the expected major Ca-bearing phases in this sample, and what are their approximate fractions?
2. What reference spectra would be most appropriate to include in a linear combination fitting (LCF) basis set to model the Ca K-edge XANES spectrum of this specific soil sample?
3. Explain the physical and pedogenic reasoning for the observed Ca speciation in this Ah horizon sample, particularly the dominance of the primary phase.
Ground Truth
Material: soil
Measurement: Ca K-edge XANES, fluorescence mode, Beamline 8 of SLRI
Fit method: Linear combination fitting (LCF)
Phase fractions: (±10%)
| Phase | Fraction |
|---|---|
| Carbonate Ca | 0.686 |
| Clay mineral sorbed Ca | 0.152 |
| Phytate Ca | 0.162 |
Fit basis (paper's reference spectra):
- Dolomite (Carbonate Ca)
- Ca adsorbed to montmorillonite (Clay mineral sorbed Ca)
- Ca phytate
Source evidence: Table 4, page 204
Key reasoning: Achenpass is the least developed Leptosol among the studied sites, characterized by large Ca and carbonate contents as well as small soil organic matter (SOM) and Al/Fe oxyhydroxide contents in the Ah horizon. Consequently, its Ca speciation shows a strong predominance of carbonate-bound Ca, reflecting the initial stages of pedogenesis on dolostone bedrock. Minor contributions from clay mineral-sorbed Ca and organically bound Ca (phytate) are also present due to early soil formation and organic input.
Reasoning source: Page 214, 'Effects of pedogenesis on soil Ca speciation'
Scoring Rubric (total: 100 pts)
| Q | Type | Max | Question | Reference Answer | Scoring Criteria |
|---|---|---|---|---|---|
| q1 | quantification | 40 | Based on the sample origin (Achenpass, German Alps) and soil horizon (Rendzic Leptosol, Ah horizon), what are the expected major Ca-bearing phases in this sample, and what are their approximate fractions? | The expected major Ca-bearing phases in this Rendzic Leptosol Ah horizon sample are Carbonate Ca (0.686), Phytate Ca (0.162), and Clay mineral sorbed Ca (0.152), with an uncertainty of 10%. These specific fractions result from the Achenpass sample being the least developed Leptosol among the studied sites, which is characterized by large Ca and carbonate contents alongside small soil organic matter (SOM) and Al/Fe oxyhydroxide contents. The strong predominance of carbonate-bound Ca (68.6%) directly reflects the initial stages of pedogenesis on dolostone bedrock. Meanwhile, the minor fractions of clay mineral-sorbed Ca (15.2%) and organically bound Ca (16.2%) arise due to early soil formation processes and organic input in the Ah horizon. | Full points for identifying Carbonate Ca as the dominant phase (~65-70%) and minor contributions from Clay mineral sorbed Ca (~15%) and organically bound Ca (Phytate Ca, ~15%). Deduct points for missing phases or significantly inaccurate fractions. |
| q2 | identification | 30 | What reference spectra would be most appropriate to include in a linear combination fitting (LCF) basis set to model the Ca K-edge XANES spectrum of this specific soil sample? | The most appropriate reference spectra to include in the linear combination fitting (LCF) basis set are Dolomite (Carbonate Ca), Ca adsorbed to montmorillonite (Clay mineral sorbed Ca), and Ca phytate. These specific reference phases are expected because this Achenpass soil sample represents the least developed Leptosol, characterized by the initial stages of pedogenesis on dolostone bedrock. This geological and pedogenic context results in a strong predominance of carbonate-bound Ca (dolomite) due to large initial Ca and carbonate contents. Additionally, references for clay mineral-sorbed Ca and organically bound Ca (phytate) are required to account for the minor phases generated by early soil formation and organic input present in the Ah horizon. | Full points for listing a carbonate reference (specifically dolomite, given the alpine dolostone origin), a clay mineral-sorbed Ca reference (e.g., Ca-montmorillonite), and an organic Ca reference (e.g., Ca phytate). |
| q3 | reasoning | 30 | Explain the physical and pedogenic reasoning for the observed Ca speciation in this Ah horizon sample, particularly the dominance of the primary phase. | The observed Ca speciation in this Rendzic Leptosol Ah horizon sample is dominated by carbonate-bound Ca (68.6%), with minor contributions from organically bound Ca phytate (16.2%) and clay mineral-sorbed Ca (15.2%). This distribution occurs because the Achenpass sample is the least developed Leptosol among the studied sites, reflecting the initial stages of pedogenesis on dolostone bedrock. Because of this early developmental stage, the soil retains large Ca and carbonate contents while having small soil organic matter (SOM) and Al/Fe oxyhydroxide contents. The minor fractions of clay-sorbed and phytate Ca are present due to early soil formation processes and organic input typical of an Ah surface horizon. | Full points for explaining that Achenpass is an initial, least-developed Leptosol with large carbonate contents and small SOM/oxyhydroxide contents, leading to a predominance of lithogenic carbonate-bound Ca over pedogenic or organically bound Ca forms. |
Review
#217
soil
Ca K
▶
LLM Prompt
Sample Information
Material: soil
Sample Origin: Achenpass, German Alps, Germany
Sample-Specific Conditions
- Soil horizon: CAh
- Rendzic Leptosol, CAh horizon
Measurement
We plan to measure the Ca K XANES spectrum of this sample.
Questions
Based on all the information above:
1. Based on the sample origin and soil horizon, what candidate reference spectra are needed to model the Ca K-edge XANES spectrum of this sample using linear combination fitting?
2. Estimate the relative fractions of the Ca phases present in this CAh horizon sample.
3. Explain the pedogenic and physical reasons for the expected Ca phase composition in the CAh horizon of this alpine Rendzic Leptosol.
Ground Truth
Material: soil (Rendzic Leptosol, CAh horizon)
Measurement: Ca K-edge XANES in fluorescence mode at Beamline 8 of SLRI
Fit method: Linear combination fitting (LCF)
Phase fractions: (±10%)
| Phase | Fraction |
|---|---|
| Carbonate Ca | 0.874 |
| Clay mineral sorbed Ca | 0.126 |
Fit basis (paper's reference spectra):
- Dolomite (Carbonate Ca)
- Ca adsorbed to montmorillonite (Clay mineral sorbed Ca)
Source evidence: Table 4, page 204
Key reasoning: The Achenpass soil is an initial soil (Rendzic Leptosol) formed from dolostone parent material. The CAh horizon is a transitional horizon located deep in the profile near the bedrock. Its Ca speciation is strongly dominated by lithogenic carbonate (dolomite) due to the continuous input of unweathered dolomite scree and physical weathering. The minor presence of clay mineral-sorbed Ca reflects initial pedogenesis and weathering compared to the pure carbonate bedrock.
Reasoning source: Results: Initial soils formed from calcareous parent material (page 203) and Discussion: Effects of pedogenesis on soil Ca speciation (pages 213-214)
Scoring Rubric (total: 100 pts)
| Q | Type | Max | Question | Reference Answer | Scoring Criteria |
|---|---|---|---|---|---|
| q1 | identification | 20 | Based on the sample origin and soil horizon, what candidate reference spectra are needed to model the Ca K-edge XANES spectrum of this sample using linear combination fitting? | To model the Ca K-edge XANES spectrum of this sample using linear combination fitting, the required reference spectra are Dolomite (Carbonate Ca) and Ca adsorbed to montmorillonite (Clay mineral sorbed Ca). These specific phases are expected because the sample is an initial soil (Rendzic Leptosol) from the German Alps formed from dolostone parent material. The CAh horizon is a transitional layer located deep in the profile near the bedrock, meaning it receives a continuous input of unweathered dolomite scree through physical weathering. Additionally, the inclusion of the clay mineral-sorbed Ca reference is necessary to account for the initial stages of pedogenesis and weathering occurring in this horizon. | Award full points for identifying a carbonate reference (specifically dolomite, given the alpine/dolostone origin) and a clay mineral-sorbed Ca reference (e.g., Ca-montmorillonite). |
| q2 | quantification | 40 | Estimate the relative fractions of the Ca phases present in this CAh horizon sample. | The estimated relative fractions for this CAh horizon sample are 0.874 (87.4%) Carbonate Ca (dolomite) and 0.126 (12.6%) Clay mineral sorbed Ca, with an uncertainty of 10%. These specific values result from the sample's location deep in the soil profile near the dolostone bedrock. The composition is heavily dominated by lithogenic carbonate because physical weathering provides a continuous input of unweathered dolomite scree to this transitional horizon. The minor 12.6% fraction of clay mineral-sorbed Ca reflects the limited, initial pedogenesis and weathering that has occurred compared to the pure carbonate bedrock. | Award full points if the predicted fractions are within ±10% of Carbonate Ca (87.4%) and Clay mineral sorbed Ca (12.6%). Deduct points proportionally for larger deviations or if incorrect organic phases are predicted. |
| q3 | reasoning | 40 | Explain the pedogenic and physical reasons for the expected Ca phase composition in the CAh horizon of this alpine Rendzic Leptosol. | The expected Ca phase composition in this alpine Rendzic Leptosol is strongly dominated by lithogenic carbonate (dolomite) with a minor fraction of clay mineral-sorbed Ca. This occurs because the soil is an initial soil formed from dolostone parent material at the Achenpass in the German Alps. The CAh horizon is a transitional layer situated deep in the soil profile near the bedrock. Consequently, physical weathering drives a continuous input of unweathered dolomite scree into the horizon, maintaining the high carbonate fraction. Meanwhile, the minor presence of clay mineral-sorbed Ca is the direct result of initial pedogenesis and chemical weathering acting upon the pure carbonate bedrock. | Award full points for explaining that the horizon is strongly dominated by lithogenic carbonate (dolomite) due to its proximity to the bedrock and continuous input of unweathered dolomite scree, while the minor presence of clay mineral-sorbed Ca indicates the initial stages of weathering and pedogenesis. |
Review
#218
soil
Ca K
▶
LLM Prompt
Sample Information
Material: soil
Sample Origin: Mangfall Mts, German Alps, Germany
Sample-Specific Conditions
- Soil horizon: L
- Rendzic Leptosol, L horizon
Measurement
We plan to measure the Ca K XANES spectrum of this sample.
Questions
Based on all the information above:
1. Based on the sample conditions (L horizon of a Rendzic Leptosol in a temperate forest), what are the expected dominant Ca phases and their approximate fractions?
2. What reference spectra would be necessary to accurately model the Ca K-edge XANES spectrum of this L horizon soil sample using linear combination fitting?
3. Explain the biogeochemical reasoning for the expected Ca speciation in this specific soil horizon.
Ground Truth
Material: soil
Measurement: Ca K-edge XANES in fluorescence mode at Beamline 8 of the Synchrotron Light Research Institute (SLRI)
Fit method: Linear combination fitting (LCF)
Phase fractions: (±10%)
| Phase | Fraction |
|---|---|
| Oxalate Ca | 0.5 |
| Citrate Ca | 0.125 |
| Pectate Ca | 0.375 |
Fit basis (paper's reference spectra):
- Ca oxalate
- Ca citrate
- Ca pectate
Source evidence: Table 4, page 204
Key reasoning: The L horizon is the uppermost organic surface layer consisting of recent litter fall. Organically bound Ca enters the forest floor surface via litter fall (foliage, twigs, bark) and root necromass. The Ca speciation in the L layers is dominated by Ca pectate and Ca oxalate, which closely reflects the Ca speciation of the dominating litter sources (e.g., beech and spruce foliage) at the site. Ca oxalate is synthesized by plants and deposited in foliage, while Ca pectate is a major component of plant tissue.
Reasoning source: Section 'Speciation of organically bound soil Ca as affected by plant input and microbial turnover', pages 215-216
Scoring Rubric (total: 100 pts)
| Q | Type | Max | Question | Reference Answer | Scoring Criteria |
|---|---|---|---|---|---|
| q1 | quantification | 40 | Based on the sample conditions (L horizon of a Rendzic Leptosol in a temperate forest), what are the expected dominant Ca phases and their approximate fractions? | The expected dominant Ca phases for this sample are Oxalate Ca at approximately 50%, Pectate Ca at 37.5%, and Citrate Ca at 12.5%, with an uncertainty of about 10%. These specific fractions arise because the sample is from the L horizon, which is the uppermost organic surface layer consisting of recent litter fall such as foliage, twigs, and bark. Organically bound Ca enters this forest floor surface directly from these plant inputs and root necromass. Consequently, the high fractions of Ca oxalate and Ca pectate closely reflect the Ca speciation of the dominating litter sources at the site, where Ca oxalate is synthesized and deposited in foliage and Ca pectate forms a major component of plant tissue. | Full points for identifying Oxalate Ca (~50%), Pectate Ca (~37.5%), and Citrate Ca (~12.5%). Partial points for identifying the dominance of organic Ca phases (oxalate and pectate) over inorganic phases. |
| q2 | identification | 30 | What reference spectra would be necessary to accurately model the Ca K-edge XANES spectrum of this L horizon soil sample using linear combination fitting? | To accurately model the Ca K-edge XANES spectrum of this sample using linear combination fitting, reference spectra for Ca oxalate, Ca pectate, and Ca citrate are necessary. These specific reference phases are required because the sample is from the L horizon of a Rendzic Leptosol, which is the uppermost organic surface layer composed of recent litter fall. In this horizon, organically bound Ca enters directly from plant inputs like foliage, twigs, bark, and root necromass. Therefore, the expected phases must match the dominating litter sources at the site, specifically Ca oxalate which is synthesized by plants and deposited in foliage, and Ca pectate which is a major component of plant tissue. | Full points for listing Ca oxalate, Ca pectate, and Ca citrate as the required reference spectra. |
| q3 | reasoning | 30 | Explain the biogeochemical reasoning for the expected Ca speciation in this specific soil horizon. | The expected Ca speciation in the L horizon of this Rendzic Leptosol is dominated by organically bound Ca, specifically Ca oxalate (50%), Ca pectate (37.5%), and Ca citrate (12.5%). This speciation occurs because the L horizon is the uppermost organic surface layer consisting primarily of recent litter fall, including foliage, twigs, bark, and root necromass. Organically bound Ca enters the forest floor surface directly through these plant inputs. As a result, the soil's Ca speciation closely reflects the composition of the dominating litter sources at the site, such as beech and spruce foliage. Specifically, plants synthesize Ca oxalate and deposit it in their foliage, while Ca pectate serves as a major structural component of the plant tissue itself. | Full points for explaining that the L horizon consists of recent litter fall, and its Ca speciation reflects the composition of plant inputs (foliage and root necromass), which are rich in plant-synthesized Ca oxalate and Ca pectate. |
Review
#219
soil
Ca K
▶
LLM Prompt
Sample Information
Material: soil
Sample Origin: Mangfall Mts, German Alps, Germany
Sample-Specific Conditions
- Soil horizon: Of
- Rendzic Leptosol, Of horizon
Measurement
We plan to measure the Ca K XANES spectrum of this sample.
Questions
Based on all the information above:
1. Based on the sample conditions (Of horizon of a Rendzic Leptosol from the Mangfall Mts), what candidate reference spectra are needed to model the Ca speciation using linear combination fitting?
2. Estimate the relative fractions of the Ca phases present in this specific soil horizon.
3. Explain the biogeochemical and pedogenic reasons for the presence of these specific Ca phases (e.g., oxalate and clay-sorbed Ca) in the Of horizon of this Rendzic Leptosol.
Ground Truth
Material: soil (Rendzic Leptosol, Of horizon)
Measurement: Ca K-edge XANES in fluorescence mode at Beamline 8 of the Synchrotron Light Research Institute (SLRI)
Fit method: Linear combination fitting (LCF)
Phase fractions: (±10%)
| Phase | Fraction |
|---|---|
| Clay mineral sorbed Ca | 0.333 |
| Oxalate Ca | 0.333 |
| Citrate Ca | 0.333 |
Fit basis (paper's reference spectra):
- Clay mineral sorbed Ca (Ca adsorbed to montmorillonite)
- Ca oxalate
- Ca citrate
Source evidence: Table 4, page 204
Key reasoning: In the Of horizon of the Mangfall Mts Rendzic Leptosol, organically bound Ca and clay mineral-bound Ca are prominent due to intensive mineral weathering, pedogenesis, and biotic activity. Oxalate-bound Ca is a major component, originating from litter fall (e.g., foliage deposition) and in situ synthesis by the reaction of (mycor)rhizogenic oxalic acid with Ca2+ cations. The presence of clay mineral-sorbed Ca reflects the accumulation of pedogenic minerals in the topsoil.
Reasoning source: Page 213 (Effects of pedogenesis on soil Ca speciation) and Page 215 (Speciation of organically bound soil Ca as affected by plant input and microbial turnover)
Scoring Rubric (total: 100 pts)
| Q | Type | Max | Question | Reference Answer | Scoring Criteria |
|---|---|---|---|---|---|
| q1 | identification | 20 | Based on the sample conditions (Of horizon of a Rendzic Leptosol from the Mangfall Mts), what candidate reference spectra are needed to model the Ca speciation using linear combination fitting? | To model the Ca speciation in the Of horizon of this Rendzic Leptosol using linear combination fitting, the required candidate reference spectra are clay mineral sorbed Ca (Ca adsorbed to montmorillonite), Ca oxalate, and Ca citrate. These specific phases are expected in this soil horizon because intensive mineral weathering, pedogenesis, and biotic activity promote the formation of organically bound and clay mineral-bound Ca. Specifically, oxalate-bound Ca is anticipated due to litter fall (such as foliage deposition) and in situ synthesis via the reaction of (mycor)rhizogenic oxalic acid with Ca2+ cations. Furthermore, the inclusion of a clay mineral-sorbed Ca reference is necessary because pedogenic minerals actively accumulate in this topsoil environment. | Full points for identifying clay mineral-sorbed Ca, Ca oxalate, and Ca citrate (or generic non-oxalate/pectate carboxylates). Partial credit for missing one phase or including incorrect phases like primary carbonates which are depleted in this specific horizon. |
| q2 | quantification | 40 | Estimate the relative fractions of the Ca phases present in this specific soil horizon. | The relative fractions of the Ca phases in the Of horizon of this Rendzic Leptosol are estimated to be 33.3% clay mineral sorbed Ca, 33.3% Ca oxalate, and 33.3% Ca citrate, with an uncertainty of 10%. This equal distribution of organically bound and mineral-bound Ca fractions results from the specific biogeochemical conditions of the Of horizon, which is characterized by intensive biotic activity and pedogenesis. The significant organic fractions (oxalate and citrate) are driven by litter fall deposition and the in situ reaction of (mycor)rhizogenic organic acids with Ca2+ cations. Concurrently, the 33.3% clay-sorbed fraction arises from the accumulation of pedogenic minerals during intensive mineral weathering in the topsoil. | Full points for estimating approximately equal thirds (~33.3% each) for Clay mineral sorbed Ca, Oxalate Ca, and Citrate Ca. Deduct points proportionally for deviations greater than the 10% uncertainty margin. |
| q3 | reasoning | 40 | Explain the biogeochemical and pedogenic reasons for the presence of these specific Ca phases (e.g., oxalate and clay-sorbed Ca) in the Of horizon of this Rendzic Leptosol. | The presence of these specific Ca phases in the Of horizon of the Mangfall Mts Rendzic Leptosol is driven by a combination of intensive mineral weathering, pedogenesis, and high biotic activity. Organically bound Ca, such as Ca oxalate and Ca citrate, becomes prominent due to biological inputs like litter fall (e.g., foliage deposition). Additionally, Ca oxalate is synthesized in situ through the reaction of (mycor)rhizogenic oxalic acid with available Ca2+ cations in the soil. Finally, the presence of clay mineral-sorbed Ca is a direct result of pedogenesis, which leads to the accumulation of pedogenic clay minerals in the topsoil that subsequently bind calcium. | Full points for explaining that oxalate-bound Ca originates from litter fall and in situ synthesis by (mycor)rhizogenic oxalic acid reacting with Ca2+, while clay mineral-bound Ca reflects the accumulation of pedogenic minerals due to intensive mineral weathering and biotic activity in the topsoil. |
Review
#220
soil
Ca K
▶
LLM Prompt
Sample Information
Material: soil
Sample Origin: Mangfall Mts, German Alps, Germany
Sample-Specific Conditions
- Soil horizon: Oh
- Rendzic Leptosol, Oh horizon
Measurement
We plan to measure the Ca K XANES spectrum of this sample.
Questions
Based on all the information above:
1. Based on the sample conditions (Rendzic Leptosol, Oh horizon from Mangfall Mts), identify the expected Ca phases and estimate their relative fractions.
2. What reference spectra would be necessary to accurately model the Ca K-edge XANES spectrum of this soil sample using linear combination fitting?
3. Explain the physical and biogeochemical reasoning for the expected Ca speciation in this Oh horizon, specifically addressing the absence of carbonate, the presence of clay-sorbed Ca, and the relative proportions of different organic Ca forms.
Ground Truth
Material: soil
Measurement: Ca K-edge XANES, fluorescence mode, Beamline 8 of the Synchrotron Light Research Institute (SLRI)
Fit method: Linear combination fitting (LCF)
Phase fractions: (±10%)
| Phase | Fraction |
|---|---|
| Clay mineral sorbed Ca | 0.39 |
| Oxalate Ca | 0.244 |
| Citrate Ca | 0.366 |
Fit basis (paper's reference spectra):
- Calcite
- Aragonite
- Dolomite
- Apatite
- Brushite
- Monetite
- Anorthite
- Augite
- Epidote
- Ca adsorbed to montmorillonite
- Gypsum
- Anhydrite
- Fluorite
- Sinjarite
- Ca formate
- Ca acetate
- Ca citrate
- Ca oxalate
- Ca lactate
- Ca pectate
- Ca phytate
Source evidence: Table 4, page 204
Key reasoning: In the Oh horizon of the Mangfall Mts. Rendzic Leptosol, carbonate-bound Ca is absent due to carbonate weathering. The Ca speciation is dominated by organically bound Ca (citrate and oxalate) and clay mineral-sorbed Ca. Progressive aging and microbial decomposition of forest floor soil organic matter (SOM) from L to Of and Oh layers is associated with a marked decrease in the contribution of oxalate-bound Ca to organically-bound Ca. Consequently, non-oxalate organic Ca (modeled as citrate) dominates over oxalate in the Oh horizon. Additionally, weathering leads to the accumulation of clay minerals, resulting in a significant fraction of clay mineral-sorbed Ca.
Reasoning source: Page 205 (Organic mountain soils formed on calcareous parent material) and Pages 215-216 (Speciation of organically bound soil Ca as affected by plant input and microbial turnover)
Scoring Rubric (total: 100 pts)
| Q | Type | Max | Question | Reference Answer | Scoring Criteria |
|---|---|---|---|---|---|
| q1 | quantification | 40 | Based on the sample conditions (Rendzic Leptosol, Oh horizon from Mangfall Mts), identify the expected Ca phases and estimate their relative fractions. | The expected Ca phases in this Oh horizon soil sample are clay mineral-sorbed Ca (39%), citrate-bound Ca (36.6%), and oxalate-bound Ca (24.4%), with an estimated uncertainty of 10%. These specific fractions arise because extensive carbonate weathering in this Rendzic Leptosol completely removes carbonate-bound Ca, while simultaneously leading to the accumulation of clay minerals that host the large sorbed Ca fraction. Furthermore, the progressive aging and microbial decomposition of soil organic matter in the Oh horizon causes a marked decrease in oxalate-bound Ca. Consequently, non-oxalate organic Ca, which is modeled here as citrate, dominates over the remaining oxalate fraction. | Full points for identifying clay mineral-sorbed Ca, Ca citrate (or non-oxalate organic Ca), and Ca oxalate as the primary phases, with fractions around 35-45% for clay-sorbed Ca, 30-40% for citrate/non-oxalate organic Ca, and 20-30% for oxalate. Deduct points for missing phases or including carbonate. |
| q2 | identification | 20 | What reference spectra would be necessary to accurately model the Ca K-edge XANES spectrum of this soil sample using linear combination fitting? | To accurately model the Ca K-edge XANES spectrum using linear combination fitting, a comprehensive basis set is required, including carbonates (Calcite, Aragonite, Dolomite), phosphates (Apatite, Brushite, Monetite), silicates (Anorthite, Augite, Epidote), sulfates/halides (Gypsum, Anhydrite, Fluorite, Sinjarite), Ca adsorbed to montmorillonite, and various organic Ca forms (Ca formate, acetate, citrate, oxalate, lactate, pectate, phytate). These references are necessary to capture the complex biogeochemical transformations occurring in the Rendzic Leptosol Oh horizon. Specifically, references for clay-sorbed Ca, Ca citrate, and Ca oxalate are essential because weathering leads to clay accumulation, while microbial decomposition of soil organic matter shifts the organic Ca pool from oxalate to non-oxalate forms like citrate. The inclusion of carbonate references is also necessary to confirm their expected absence due to complete carbonate weathering in this specific horizon. | Full points for listing a comprehensive set of relevant environmental Ca references, specifically including clay mineral-sorbed Ca (e.g., Ca-montmorillonite), Ca oxalate, and other Ca carboxylates (e.g., citrate, pectate, formate). |
| q3 | reasoning | 40 | Explain the physical and biogeochemical reasoning for the expected Ca speciation in this Oh horizon, specifically addressing the absence of carbonate, the presence of clay-sorbed Ca, and the relative proportions of different organic Ca forms. | In the Oh horizon of the Mangfall Mts. Rendzic Leptosol, carbonate-bound Ca is completely absent due to extensive carbonate weathering. This weathering process simultaneously leads to the accumulation of clay minerals, which explains the significant presence of clay mineral-sorbed Ca (39%) in the sample. The remaining Ca speciation is dominated by organically bound forms, specifically citrate (36.6%) and oxalate (24.4%). The relative proportions of these organic forms are driven by the progressive aging and microbial decomposition of forest floor soil organic matter from the L to the Oh layers. This microbial turnover causes a marked decrease in oxalate-bound Ca, resulting in non-oxalate organic Ca (modeled as citrate) dominating over oxalate in this highly decomposed Oh horizon. | Full points for explaining that: 1) carbonate is absent due to weathering in this organic horizon; 2) clay-sorbed Ca is present due to the accumulation of clay minerals from weathering; 3) the proportion of oxalate-bound Ca decreases relative to other organic Ca forms (like citrate) due to progressive aging and microbial decomposition of soil organic matter in the Oh horizon compared to less decomposed upper layers. |
Review
#221
soil
Ca K
▶
LLM Prompt
Sample Information
Material: soil
Sample Origin: Mangfall Mts, German Alps, Germany
Sample-Specific Conditions
- Soil horizon: Ah
- Rendzic Leptosol, Ah horizon
Measurement
We plan to measure the Ca K XANES spectrum of this sample.
Questions
Based on all the information above:
1. Based on the sample's environmental context, what candidate reference spectra should be included in a linear combination fitting (LCF) analysis of its Ca K-edge XANES spectrum?
2. Estimate the relative fractions of the major Ca phases in this Rendzic Leptosol Ah horizon sample.
3. Explain the pedogenic and environmental factors that lead to the observed Ca speciation in the Ah horizon of the Mangfall Mts. Rendzic Leptosol.
Ground Truth
Material: soil
Measurement: Ca K-edge XANES, fluorescence mode, Beamline 8 of the Synchrotron Light Research Institute (SLRI)
Fit method: Linear combination fitting (LCF)
Phase fractions: (±10%)
| Phase | Fraction |
|---|---|
| Carbonate Ca | 0.387 |
| Clay mineral sorbed Ca | 0.311 |
| Pectate Ca | 0.311 |
Fit basis (paper's reference spectra):
- Calcite
- Aragonite
- Dolomite
- Apatite
- Brushite
- Monetite
- Anorthite
- Augite
- Epidote
- Ca adsorbed to montmorillonite
- Gypsum
- Anhydrite
- Fluorite
- Sinjarite
- Ca formate
- Ca acetate
- Ca citrate
- Ca oxalate
- Ca lactate
- Ca pectate
- Ca phytate
Source evidence: Table 4, page 204
Key reasoning: The Mangfall Mts. Leptosol is located on a steep N-exposed slope and is characterized by intensive carbonate weathering and sesquioxide formation together with continuous input of dolomite scree from topslope rock walls. This continuous superficial input of unweathered parent material combined with pedogenesis results in the presence of about equal shares of carbonate-bound Ca, organically bound Ca (pectate), and clay mineral-bound Ca in the Ah horizon.
Reasoning source: Page 214, Section 'Effects of pedogenesis on soil Ca speciation'
Scoring Rubric (total: 100 pts)
| Q | Type | Max | Question | Reference Answer | Scoring Criteria |
|---|---|---|---|---|---|
| q1 | identification | 20 | Based on the sample's environmental context, what candidate reference spectra should be included in a linear combination fitting (LCF) analysis of its Ca K-edge XANES spectrum? | The linear combination fitting (LCF) analysis should include a comprehensive basis set of 21 reference spectra: Calcite, Aragonite, Dolomite, Apatite, Brushite, Monetite, Anorthite, Augite, Epidote, Ca adsorbed to montmorillonite, Gypsum, Anhydrite, Fluorite, Sinjarite, Ca formate, Ca acetate, Ca citrate, Ca oxalate, Ca lactate, Ca pectate, and Ca phytate. These specific references are necessary because the sample is a Rendzic Leptosol from the Ah horizon in the Mangfall Mts., which experiences intensive carbonate weathering, sesquioxide formation, and continuous input of dolomite scree. This combination of unweathered parent material input and active pedogenesis requires a broad library of inorganic carbonates, clay-sorbed species, and organically bound Ca phases to accurately capture the complex soil chemistry. | Full credit for listing a comprehensive set of relevant environmental Ca references including carbonates (e.g., dolomite, calcite), clay-sorbed Ca, and organic Ca forms (e.g., pectate, oxalate, citrate). |
| q2 | quantification | 40 | Estimate the relative fractions of the major Ca phases in this Rendzic Leptosol Ah horizon sample. | The major Ca phases in this sample are Carbonate Ca at 38.7%, Clay mineral sorbed Ca at 31.1%, and Pectate Ca at 31.1%, with an estimated uncertainty of 10%. These roughly equal shares of carbonate-bound, clay-bound, and organically bound Ca result directly from the specific environmental conditions of the Mangfall Mts. Leptosol. The steep N-exposed slope facilitates continuous superficial input of unweathered parent material (dolomite scree) from topslope rock walls, which maintains the high carbonate fraction. Simultaneously, active pedogenesis involving intensive carbonate weathering and sesquioxide formation in the Ah horizon drives the formation of the clay-sorbed and organically bound (pectate) Ca fractions. | Full credit for estimating approximately equal shares (~30-40% each) of Carbonate Ca, Clay mineral sorbed Ca, and Pectate Ca (or organically bound Ca). |
| q3 | reasoning | 40 | Explain the pedogenic and environmental factors that lead to the observed Ca speciation in the Ah horizon of the Mangfall Mts. Rendzic Leptosol. | The observed Ca speciation in the Ah horizon of this Rendzic Leptosol is driven by its location on a steep N-exposed slope in the Mangfall Mts. This specific topography leads to a continuous superficial input of unweathered parent material, specifically dolomite scree, from topslope rock walls. Concurrently, the soil undergoes active pedogenesis characterized by intensive carbonate weathering and sesquioxide formation. The balance between the continuous addition of fresh rock and ongoing soil weathering mechanisms results in a mixed speciation profile. Consequently, the soil contains approximately equal shares of unweathered carbonate-bound Ca (38.7%) and pedogenic products, namely clay mineral-bound Ca (31.1%) and organically bound pectate Ca (31.1%). | Full credit for mentioning the steep slope location, continuous input of dolomite scree (unweathered parent material), and intensive carbonate weathering/pedogenesis leading to a mix of lithogenic (carbonate), pedogenic (clay-sorbed), and biogenic (pectate) Ca. |
Review
#222
soil
Ca K
▶
LLM Prompt
Sample Information
Material: soil
Sample Origin: Mangfall Mts, German Alps, Germany
Sample-Specific Conditions
- Soil horizon: CAh
- Rendzic Leptosol, CAh horizon
Measurement
We plan to measure the Ca K XANES spectrum of this sample.
Questions
Based on all the information above:
1. Based on the sample origin (Mangfall Mts, dolostone parent material) and soil horizon (CAh), identify the expected major Ca phases and estimate their approximate mass fractions.
2. What reference spectra are necessary to perform Linear Combination Fitting (LCF) for this specific soil sample?
3. Explain the biogeochemical reasoning for the observed Ca speciation in this CAh horizon. Why does carbonate dominate, and why is Ca pectate the primary organic Ca form rather than Ca oxalate?
Ground Truth
Material: soil
Measurement: Ca K-edge XANES, fluorescence mode, Beamline 8 of the Synchrotron Light Research Institute (SLRI)
Fit method: Linear combination fitting (LCF)
Phase fractions: (±10%)
| Phase | Fraction |
|---|---|
| Carbonate Ca | 0.842 |
| Pectate Ca | 0.158 |
Fit basis (paper's reference spectra):
- Dolomite (Carbonate Ca)
- Ca pectate
Source evidence: Table 4, page 204
Key reasoning: The CAh horizon of the Mangfall Mts Rendzic Leptosol is a subsoil horizon close to the dolostone bedrock. It is dominated by lithogenic carbonate (dolomite) due to the calcareous parent material and continuous input of dolomite scree. The organic Ca present is mainly Ca pectate, which is a more stable organic Ca form compared to Ca oxalate, which is rapidly decomposed by microbes in calcareous soils.
Reasoning source: Section 'Effects of pedogenesis on soil Ca speciation' (page 214) and 'The fate of Ca oxalate in calcareous and silicate soils' (page 216)
Scoring Rubric (total: 100 pts)
| Q | Type | Max | Question | Reference Answer | Scoring Criteria |
|---|---|---|---|---|---|
| q1 | quantification | 40 | Based on the sample origin (Mangfall Mts, dolostone parent material) and soil horizon (CAh), identify the expected major Ca phases and estimate their approximate mass fractions. | The expected major Ca phases for this Rendzic Leptosol CAh horizon sample are Carbonate Ca (dolomite) at approximately 84.2% and Pectate Ca at 15.8%, with an uncertainty of 10%. These specific fractions arise because the CAh horizon is a subsoil layer located close to the dolostone bedrock of the Mangfall Mts, leading to a continuous input of dolomite scree that dominates the overall Ca mass. The remaining 15.8% consists of organic Ca in the form of Ca pectate. This specific organic fraction persists because Ca pectate is more stable in calcareous soils compared to other organic forms like Ca oxalate, which is rapidly decomposed by soil microbes. | Award full points for identifying Carbonate Ca (~84%) and Pectate Ca (~16%). Partial credit for identifying carbonate as the dominant phase and an organic Ca phase. |
| q2 | identification | 20 | What reference spectra are necessary to perform Linear Combination Fitting (LCF) for this specific soil sample? | To perform Linear Combination Fitting (LCF) on this soil sample, reference spectra for Dolomite (Carbonate Ca) and Ca pectate are required. These specific references are necessary because the sample originates from a Rendzic Leptosol CAh horizon, which is heavily influenced by its calcareous parent material. The proximity to the dolostone bedrock and continuous input of dolomite scree dictate the need for a lithogenic dolomite reference. Furthermore, a Ca pectate reference is needed to account for the organic Ca fraction, as Ca pectate is the stable organic form that resists rapid microbial decomposition in these calcareous soil conditions, unlike Ca oxalate. | Award full points for listing Dolomite (or Carbonate) and Ca pectate. |
| q3 | reasoning | 40 | Explain the biogeochemical reasoning for the observed Ca speciation in this CAh horizon. Why does carbonate dominate, and why is Ca pectate the primary organic Ca form rather than Ca oxalate? | The Ca speciation in this Rendzic Leptosol CAh horizon is driven by its physical proximity to the underlying dolostone bedrock in the Mangfall Mts. Carbonate dominates the speciation (84.2%) because the calcareous parent material provides a continuous input of lithogenic carbonate in the form of dolomite scree. The organic Ca fraction (15.8%) is primarily Ca pectate rather than Ca oxalate due to distinct differences in biogeochemical stability. In these specific calcareous soil conditions, Ca oxalate is rapidly decomposed by soil microbes, leaving the more stable Ca pectate to persist as the dominant organic Ca phase. | Award points for mentioning the proximity to dolostone bedrock / continuous input of dolomite scree for the carbonate dominance, and the rapid microbial decomposition of Ca oxalate in calcareous soils leaving the more stable Ca pectate. |
Review
#223
soil
Ca K
▶
LLM Prompt
Sample Information
Material: soil
Sample Origin: Tuttlingen, Swabian Alb, Germany
Sample-Specific Conditions
- Soil horizon: LOf
- Eutric Cambisol, LOf horizon
Measurement
We plan to measure the Ca K XANES spectrum of this sample.
Questions
Based on all the information above:
1. Based on the sample conditions (LOf horizon of a Eutric Cambisol under mature beech forest), what are the expected major Ca phases and their approximate fractions?
2. What reference spectra would be necessary to accurately model the Ca K-edge XANES spectrum of this sample using linear combination fitting?
3. Explain the biogeochemical reasoning for the expected Ca speciation in this specific soil horizon, considering the soil type, pedogenesis stage, and vegetation.
Ground Truth
Material: soil
Measurement: Ca K-edge XANES in fluorescence mode at Beamline 8 of the Synchrotron Light Research Institute (SLRI)
Fit method: Linear combination fitting (LCF)
Phase fractions: (±10%)
| Phase | Fraction |
|---|---|
| Oxalate Ca | 0.25 |
| Citrate Ca | 0.375 |
| Pectate Ca | 0.125 |
| Phytate Ca | 0.25 |
Fit basis (paper's reference spectra):
- Ca oxalate
- Ca citrate
- Ca pectate
- Ca phytate
- Calcite
- Clay mineral-adsorbed Ca
Source evidence: Table 5, page 206
Key reasoning: The Eutric Cambisol at Tuttlingen represents an advanced stage of pedogenesis on calcareous bedrock, where carbonate-bound Ca has completely disappeared from the topsoil due to intensive weathering. The Ca in the LOf horizon (organic surface layer) is entirely organically bound, originating from litter fall (predominantly beech foliage). Beech foliage contains significant amounts of Ca oxalate, Ca pectate, and Ca phytate, which explains the dominance of these organic Ca forms in the LOf horizon.
Reasoning source: Sections 'Effects of pedogenesis on soil Ca speciation' and 'Speciation of organically bound soil Ca as affected by plant input and microbial turnover', pages 213-215
Scoring Rubric (total: 100 pts)
| Q | Type | Max | Question | Reference Answer | Scoring Criteria |
|---|---|---|---|---|---|
| q1 | quantification | 40 | Based on the sample conditions (LOf horizon of a Eutric Cambisol under mature beech forest), what are the expected major Ca phases and their approximate fractions? | The expected major Ca phases in this sample are Citrate Ca (37.5%), Oxalate Ca (25%), Phytate Ca (25%), and Pectate Ca (12.5%), with an estimated uncertainty of 10%. These specific fractions arise because the sample is from the LOf horizon (organic surface layer) of a Eutric Cambisol, which represents an advanced stage of pedogenesis. Due to intensive weathering, carbonate-bound Ca has completely disappeared from the topsoil, leaving Ca that is entirely organically bound. This organic Ca originates from beech foliage litter fall, which naturally contains significant amounts of Ca oxalate, Ca pectate, and Ca phytate, thereby dictating the observed organic fractions. | Full points for identifying that Ca is entirely organically bound (oxalate, citrate/carboxylate, pectate, phytate) with approximate fractions of 25% oxalate, 35-40% citrate, 10-15% pectate, and 25% phytate. Deduct points if inorganic phases (carbonate, silicates) are predicted in significant amounts. |
| q2 | identification | 30 | What reference spectra would be necessary to accurately model the Ca K-edge XANES spectrum of this sample using linear combination fitting? | To accurately model the Ca K-edge XANES spectrum of this sample using linear combination fitting, the necessary reference spectra are Ca oxalate, Ca citrate, Ca pectate, Ca phytate, Calcite, and Clay mineral-adsorbed Ca. These references are required because the sample originates from the LOf horizon of a Eutric Cambisol on calcareous bedrock. Although intensive weathering in this advanced pedogenic stage has completely removed carbonate-bound Ca from the topsoil, leaving entirely organically bound Ca from beech litter fall (oxalate, citrate, pectate, phytate), a complete basis set including inorganic forms like calcite and clay-adsorbed Ca is needed to properly model the system and verify their absence. | Full points for listing relevant organic Ca standards such as Ca oxalate, Ca citrate (or other carboxylates), Ca pectate, and Ca phytate. Mentioning inorganic standards (calcite, clay-adsorbed Ca) as necessary to rule them out is also acceptable. |
| q3 | reasoning | 30 | Explain the biogeochemical reasoning for the expected Ca speciation in this specific soil horizon, considering the soil type, pedogenesis stage, and vegetation. | The Ca speciation in the LOf horizon of this Eutric Cambisol is entirely organically bound, consisting of citrate, oxalate, phytate, and pectate. This speciation arises because the soil represents an advanced stage of pedogenesis on calcareous bedrock, where intensive weathering has completely removed carbonate-bound Ca from the topsoil. Consequently, the Ca in this organic surface layer originates exclusively from litter fall, predominantly beech foliage. Because beech foliage naturally contains significant amounts of Ca oxalate, Ca pectate, and Ca phytate, these organic forms dominate the biogeochemical composition of the horizon. | Full points for explaining that (1) the Eutric Cambisol at Tuttlingen is at an advanced stage of pedogenesis where topsoil carbonates have been completely weathered away, and (2) the LOf horizon is an organic surface layer where Ca speciation is driven by litterfall (beech foliage), which is rich in Ca oxalate, pectate, and phytate. |
Review
#224
soil
Ca K
▶
LLM Prompt
Sample Information
Material: soil
Sample Origin: Tuttlingen, Swabian Alb, Germany
Sample-Specific Conditions
- Soil horizon: Ah
- Eutric Cambisol, Ah horizon
Measurement
We plan to measure the Ca K XANES spectrum of this sample.
Questions
Based on all the information above:
1. Based on the sample conditions (Eutric Cambisol, Ah horizon, advanced pedogenesis), what candidate reference spectra are needed to model the Ca K-edge XANES spectrum using linear combination fitting?
2. Estimate the relative fractions of the major Ca species in this Ah horizon soil sample.
3. Explain the biogeochemical and pedogenic reasoning for the expected Ca speciation in this sample, specifically addressing why lithogenic carbonate is absent and why the identified phases dominate.
Ground Truth
Material: soil
Measurement: Ca K-edge XANES, fluorescence mode, Beamline 8 at SLRI
Fit method: Linear combination fitting (LCF)
Phase fractions: (±10%)
| Phase | Fraction |
|---|---|
| Clay mineral sorbed Ca | 0.4 |
| Oxalate Ca | 0.2 |
| Citrate Ca | 0.4 |
Fit basis (paper's reference spectra):
- Ca-Montmorillonite (Clay mineral sorbed Ca)
- Ca oxalate
- Ca citrate (summarizing other carboxylates)
Source evidence: Table 5, page 206; Figure 3, page 205
Key reasoning: In the Eutric Cambisol at Tuttlingen, advanced pedogenesis and intensive limestone weathering have led to the complete disappearance of lithogenic carbonate-bound Ca in the topsoil (Ah horizon). Consequently, Ca in this horizon is entirely distributed between clay mineral-adsorbed forms and organically bound forms (oxalate and citrate). The accumulation of clay mineral-bound and organically bound Ca reflects topsoil acidification and the replacement of primary minerals by secondary pedogenic sinks and soil organic matter.
Reasoning source: Section 'Effects of pedogenesis on soil Ca speciation', pages 213-214
Scoring Rubric (total: 100 pts)
| Q | Type | Max | Question | Reference Answer | Scoring Criteria |
|---|---|---|---|---|---|
| q1 | identification | 30 | Based on the sample conditions (Eutric Cambisol, Ah horizon, advanced pedogenesis), what candidate reference spectra are needed to model the Ca K-edge XANES spectrum using linear combination fitting? | To model the Ca K-edge XANES spectrum of this sample using linear combination fitting, the required reference spectra are Ca-Montmorillonite (representing clay mineral sorbed Ca), Ca oxalate, and Ca citrate (which summarizes other carboxylates). These specific phases are expected because the sample is from the Ah horizon of a Eutric Cambisol in Tuttlingen, where advanced pedogenesis and intensive limestone weathering have occurred. This weathering leads to topsoil acidification and the complete disappearance of primary lithogenic carbonate-bound Ca. Consequently, the remaining Ca is entirely distributed into secondary pedogenic sinks and soil organic matter, necessitating references for clay mineral-adsorbed and organically bound forms. | Full credit for identifying clay mineral-sorbed Ca (e.g., Ca-montmorillonite) and organic Ca forms (Ca oxalate, Ca citrate/carboxylates). Deduct points if lithogenic carbonates (calcite/dolomite) are incorrectly included as major components for this specific horizon. |
| q2 | quantification | 35 | Estimate the relative fractions of the major Ca species in this Ah horizon soil sample. | The estimated relative fractions for the major Ca species in this sample are 40% clay mineral sorbed Ca (Ca-Montmorillonite), 20% Ca oxalate, and 40% Ca citrate, with an uncertainty of 10%. These specific values result from the advanced pedogenesis and intensive limestone weathering characteristic of the Eutric Cambisol Ah horizon at Tuttlingen. Because these processes cause the complete disappearance of lithogenic carbonate-bound Ca, the total Ca pool is forced to redistribute entirely into secondary sinks. The resulting 40/20/40 split reflects this topsoil acidification, where primary minerals are completely replaced by clay mineral-adsorbed forms and organically bound forms associated with soil organic matter. | Full credit for fractions within ±10% of the ground truth: Clay mineral sorbed Ca (~40%), Oxalate Ca (~20%), and Citrate Ca (~40%). Partial credit if the balance between organic and clay-sorbed Ca is approximately correct but specific organic species are misassigned. |
| q3 | reasoning | 35 | Explain the biogeochemical and pedogenic reasoning for the expected Ca speciation in this sample, specifically addressing why lithogenic carbonate is absent and why the identified phases dominate. | The expected Ca speciation in this Ah horizon soil sample is driven by advanced pedogenesis and intensive limestone weathering in the Eutric Cambisol at Tuttlingen. These intense weathering processes and subsequent topsoil acidification lead to the complete dissolution and disappearance of primary lithogenic carbonate-bound Ca. As a result, the Ca in this topsoil horizon is entirely redistributed into secondary pedogenic sinks and soil organic matter. This mechanism explains why the identified phases dominate, as the Ca accumulates exclusively as clay mineral-adsorbed forms (Ca-Montmorillonite) and organically bound forms (Ca oxalate and Ca citrate). | Full credit for explaining that advanced pedogenesis and intensive weathering lead to the complete dissolution/disappearance of carbonate-bound Ca in the topsoil, resulting in Ca being retained exclusively by secondary pedogenic sinks (clay minerals) and soil organic matter (oxalate, citrate). |
Review
#225
soil
Ca K
▶
LLM Prompt
Sample Information
Material: soil
Sample Origin: Tuttlingen, Swabian Alb, Germany
Sample-Specific Conditions
- Soil horizon: AhBw
- Eutric Cambisol, AhBw horizon
Measurement
We plan to measure the Ca K XANES spectrum of this sample.
Questions
Based on all the information above:
1. Based on the sample origin (Tuttlingen, Swabian Alb, Germany) and soil type (Eutric Cambisol, AhBw horizon), what are the expected dominant Ca phases and their approximate mass fractions?
2. What reference spectra would be most appropriate to include in a linear combination fitting (LCF) analysis for this specific soil horizon?
3. Explain the pedogenic and biogeochemical reasons for the expected Ca speciation in this AhBw horizon, particularly regarding the absence of carbonate Ca.
Ground Truth
Material: soil
Measurement: Ca K-edge XANES, fluorescence mode, Beamline 8 of SLRI
Fit method: Linear combination fitting (LCF)
Phase fractions: (±10%)
| Phase | Fraction |
|---|---|
| Clay mineral sorbed Ca | 0.667 |
| Citrate Ca | 0.333 |
Fit basis (paper's reference spectra):
- Ca adsorbed to montmorillonite
- Ca citrate
Source evidence: Table 5, page 206; Figure 3, page 205
Key reasoning: The Eutric Cambisol at Tuttlingen represents a soil with an advanced stage of pedogenesis formed from limestone. In the AhBw horizon, intensive carbonate weathering and topsoil acidification have led to the complete disappearance of lithogenic carbonate-bound Ca. Consequently, the remaining Ca is present as secondary forms, specifically accumulated as clay mineral-bound Ca and organically bound Ca (represented by citrate Ca). This reflects the pedogenic trajectory where primary carbonates are dissolved and Ca is retained by cation exchange on clay minerals and complexation with soil organic matter.
Reasoning source: Page 203 (Soils with advanced pedogenesis formed from calcareous parent material) and Page 214 (Effects of pedogenesis on soil Ca speciation)
Scoring Rubric (total: 100 pts)
| Q | Type | Max | Question | Reference Answer | Scoring Criteria |
|---|---|---|---|---|---|
| q1 | quantification | 40 | Based on the sample origin (Tuttlingen, Swabian Alb, Germany) and soil type (Eutric Cambisol, AhBw horizon), what are the expected dominant Ca phases and their approximate mass fractions? | The expected dominant Ca phases in this Eutric Cambisol AhBw horizon are clay mineral sorbed Ca at approximately 66.7% and organically bound Ca (represented by citrate Ca) at 33.3%, with an uncertainty of 10%. These specific fractions result from the advanced stage of pedogenesis and intensive carbonate weathering in this soil from Tuttlingen. Topsoil acidification has led to the complete dissolution and disappearance of primary lithogenic carbonate-bound Ca. Consequently, the remaining Ca is retained entirely as secondary forms through cation exchange on clay minerals and complexation with soil organic matter, yielding the observed distribution. | Full points for identifying Clay mineral sorbed Ca (~67%) and organically bound Ca / Citrate Ca (~33%). Partial points if phases are correct but fractions are off by more than 10%. |
| q2 | identification | 30 | What reference spectra would be most appropriate to include in a linear combination fitting (LCF) analysis for this specific soil horizon? | The most appropriate reference spectra for linear combination fitting (LCF) of this sample are Ca adsorbed to montmorillonite and Ca citrate. These specific references are required because the Eutric Cambisol AhBw horizon from Tuttlingen represents a soil with an advanced stage of pedogenesis formed from limestone. Due to intensive carbonate weathering and topsoil acidification, all primary lithogenic carbonate-bound Ca has completely disappeared from this horizon. Therefore, the references must represent the secondary forms of Ca that remain, specifically Ca retained by cation exchange on clay minerals (montmorillonite) and Ca complexed with soil organic matter (citrate). | Full points for listing Ca adsorbed to a clay mineral (e.g., montmorillonite) and an organic Ca standard like Ca citrate (or generic carboxylate). Deduct points for including carbonates, which are absent in this horizon. |
| q3 | reasoning | 30 | Explain the pedogenic and biogeochemical reasons for the expected Ca speciation in this AhBw horizon, particularly regarding the absence of carbonate Ca. | The Ca speciation in the AhBw horizon of this Eutric Cambisol from Tuttlingen is driven by an advanced stage of pedogenesis of its limestone parent material. Intensive carbonate weathering and topsoil acidification have caused the complete dissolution and disappearance of primary lithogenic carbonate-bound Ca. Because of this weathering trajectory, the remaining Ca in the soil is entirely present as secondary forms rather than primary minerals. Specifically, the dissolved Ca is retained in the soil profile through cation exchange on clay minerals (yielding ~66.7% clay-sorbed Ca) and complexation with soil organic matter (yielding ~33.3% citrate-like Ca). | Full points for explaining that advanced pedogenesis and intensive weathering lead to the complete dissolution of lithogenic carbonates, leaving Ca retained only as clay mineral-bound and organically bound forms. |
Review
#226
soil
Ca K
▶
LLM Prompt
Sample Information
Material: soil
Sample Origin: Tuttlingen, Swabian Alb, Germany
Sample-Specific Conditions
- Soil horizon: Bw
- Eutric Cambisol, Bw horizon
Measurement
We plan to measure the Ca K XANES spectrum of this sample.
Questions
Based on all the information above:
1. Based on the sample conditions (Eutric Cambisol, Bw horizon from Tuttlingen), what are the expected Ca phases and their approximate fractions?
2. What reference spectra would be necessary to perform a Linear Combination Fitting (LCF) analysis of this sample?
3. Explain the physical and pedogenic reasoning for the expected Ca speciation in this specific soil horizon (Bw horizon of a Eutric Cambisol). Why are certain phases dominant while others are absent?
Ground Truth
Material: soil
Measurement: Ca K-edge XANES in fluorescence mode at Beamline 8 of the Synchrotron Light Research Institute (SLRI)
Fit method: Linear combination fitting (LCF)
Phase fractions: (±10%)
| Phase | Fraction |
|---|---|
| Clay mineral sorbed Ca | 0.833 |
| Citrate Ca | 0.167 |
Fit basis (paper's reference spectra):
- Calcite
- Aragonite
- Dolomite
- Apatite
- Brushite
- Monetite
- Anorthite
- Augite
- Epidote
- Ca adsorbed to montmorillonite
- Gypsum
- Anhydrite
- Fluorite
- Sinjarite
- Ca formate
- Ca acetate
- Ca citrate
- Ca oxalate
- Ca lactate
- Ca pectate
- Ca phytate
Source evidence: Table 5, page 206; Figure 3, page 205
Key reasoning: The Tuttlingen Eutric Cambisol represents an advanced stage of pedogenesis on calcareous bedrock. The Bw horizon is completely de-carbonated due to intensive weathering, resulting in the absence of carbonate-bound Ca. Instead, Ca is predominantly adsorbed to clay minerals, which accumulate during weathering, with a minor contribution from organically bound Ca (citrate-type).
Reasoning source: Effects of pedogenesis on soil Ca speciation, pages 213-214
Scoring Rubric (total: 100 pts)
| Q | Type | Max | Question | Reference Answer | Scoring Criteria |
|---|---|---|---|---|---|
| q1 | quantification | 40 | Based on the sample conditions (Eutric Cambisol, Bw horizon from Tuttlingen), what are the expected Ca phases and their approximate fractions? | The expected Ca phases for this sample are clay mineral sorbed Ca at a fraction of 0.833 (83.3%) and citrate-bound Ca at a fraction of 0.167 (16.7%), with an estimated uncertainty of 10%. These specific values result from the advanced stage of pedogenesis characteristic of the Tuttlingen Eutric Cambisol. Because the Bw horizon undergoes intensive weathering, it becomes completely de-carbonated, which eliminates any carbonate-bound Ca phases. Consequently, the Ca is predominantly adsorbed to the clay minerals that accumulate during this weathering process, leaving only a minor fraction of organically bound citrate-type Ca. | Full points for identifying clay mineral sorbed Ca as the dominant phase (~80-85%) and a minor organic component like citrate Ca (~15-20%). Deduct points if carbonate or primary silicates are predicted in significant amounts. |
| q2 | identification | 30 | What reference spectra would be necessary to perform a Linear Combination Fitting (LCF) analysis of this sample? | To perform a Linear Combination Fitting (LCF) analysis on this sample, a comprehensive basis set of reference spectra is required, including Calcite, Aragonite, Dolomite, Apatite, Brushite, Monetite, Anorthite, Augite, Epidote, Ca adsorbed to montmorillonite, Gypsum, Anhydrite, Fluorite, Sinjarite, and various organic Ca forms (formate, acetate, citrate, oxalate, lactate, pectate, and phytate). This broad set of references is necessary to screen for all potential Ca species in soils, though the specific conditions of the Tuttlingen Eutric Cambisol Bw horizon dictate the final speciation. Because this horizon represents an advanced stage of pedogenesis with intensive weathering, it is completely de-carbonated. Therefore, the fitting ultimately isolates the references for clay-adsorbed Ca (montmorillonite) and organically bound Ca (citrate), which dominate the sample due to clay accumulation and the absence of primary carbonates. | Full points for listing relevant soil Ca reference compounds, specifically including clay mineral-adsorbed Ca (e.g., Ca-montmorillonite) and organic Ca forms (e.g., Ca citrate, oxalate, pectate), as well as carbonates to confirm their absence. |
| q3 | reasoning | 30 | Explain the physical and pedogenic reasoning for the expected Ca speciation in this specific soil horizon (Bw horizon of a Eutric Cambisol). Why are certain phases dominant while others are absent? | The Ca speciation in the Bw horizon of the Tuttlingen Eutric Cambisol is driven by an advanced stage of pedogenesis occurring on calcareous bedrock. Due to intensive weathering in this specific horizon, the soil becomes completely de-carbonated, which explains the total absence of primary carbonate-bound Ca phases. As weathering progresses, clay minerals accumulate in the soil profile, providing abundant surface area for cation exchange. Consequently, the dominant phase is Ca adsorbed to these clay minerals, while a minor fraction remains as organically bound citrate-type Ca. | Full points for explaining that advanced pedogenesis and intensive weathering lead to complete de-carbonation of the Bw horizon, eliminating carbonate-bound Ca. The remaining Ca is predominantly adsorbed to secondary clay minerals formed during weathering, with minor organic Ca contributions. |
Review
#227
soil
Ca K
▶
LLM Prompt
Sample Information
Material: soil
Sample Origin: Tuttlingen, Swabian Alb, Germany
Sample-Specific Conditions
- Soil horizon: CB
- Eutric Cambisol, CB horizon
Measurement
We plan to measure the Ca K XANES spectrum of this sample.
Questions
Based on all the information above:
1. Based on the sample origin (limestone parent material) and soil horizon (CB), what are the primary Ca-bearing phases expected in this sample, and what reference spectra should be included in a linear combination fitting (LCF) analysis?
2. Estimate the relative phase fractions of the calcium species present in this Eutric Cambisol CB horizon sample.
3. Explain the pedogenic reasoning for the expected calcium speciation in this specific deep CB horizon, and contrast it with what would be expected in the upper (e.g., Bw or Ah) horizons of the same soil profile.
Ground Truth
Material: soil
Measurement: Ca K-edge XANES, fluorescence mode, Beamline 8 of the Synchrotron Light Research Institute (SLRI)
Fit method: Linear combination fitting (LCF)
Phase fractions: (±10%)
| Phase | Fraction |
|---|---|
| Carbonate Ca | 0.807 |
| Clay mineral sorbed Ca | 0.193 |
Fit basis (paper's reference spectra):
- Carbonate (calcite)
- Clay mineral sorbed Ca (Ca-montmorillonite)
Source evidence: Table 5 (page 206) and Figure 3 (page 205)
Key reasoning: The CB horizon of the Tuttlingen Eutric Cambisol represents a deep soil layer where pedogenesis and weathering are less advanced than in the topsoil. Consequently, it retains a high proportion of lithogenic carbonate from the limestone parent material, which has not yet been completely weathered away. The remaining calcium is present as clay mineral-sorbed Ca, reflecting the initial stages of mineral weathering and secondary mineral formation at this depth, in contrast to the completely de-carbonated upper Bw and Ah horizons.
Reasoning source: Results (Soils with advanced pedogenesis formed from calcareous parent material, page 203) and Discussion (Effects of pedogenesis on soil Ca speciation, pages 213-214)
Scoring Rubric (total: 100 pts)
| Q | Type | Max | Question | Reference Answer | Scoring Criteria |
|---|---|---|---|---|---|
| q1 | identification | 25 | Based on the sample origin (limestone parent material) and soil horizon (CB), what are the primary Ca-bearing phases expected in this sample, and what reference spectra should be included in a linear combination fitting (LCF) analysis? | The primary Ca-bearing phases expected in this sample are carbonate and clay mineral-sorbed calcium. Consequently, the reference spectra that should be included in a linear combination fitting (LCF) analysis are calcite and Ca-montmorillonite. These specific phases are expected because the CB horizon of this Eutric Cambisol represents a deep soil layer where pedogenesis and weathering are less advanced than in the topsoil. As a result, the sample retains a high proportion of unweathered lithogenic carbonate from the limestone parent material, while the clay mineral-sorbed Ca reflects the initial stages of secondary mineral formation at this depth. | Full points for identifying Carbonate (specifically calcite, given the limestone parent material) and Clay mineral-sorbed Ca as the necessary reference spectra for this horizon. |
| q2 | quantification | 35 | Estimate the relative phase fractions of the calcium species present in this Eutric Cambisol CB horizon sample. | The estimated relative phase fractions for this sample are 0.807 (80.7%) carbonate Ca and 0.193 (19.3%) clay mineral-sorbed Ca, with an uncertainty of 10%. These specific values result from the sample's location in the deep CB horizon of the Eutric Cambisol profile, where weathering is significantly less advanced compared to the topsoil. Because pedogenesis is limited at this depth, the vast majority of the calcium remains as unweathered lithogenic carbonate derived from the limestone parent material. The minor 19.3% fraction of clay mineral-sorbed Ca reflects only the initial stages of mineral weathering and secondary mineral formation occurring in this deep layer. | Full points for estimating approximately 80% Carbonate Ca and 20% Clay mineral-sorbed Ca. Estimates within the 10% uncertainty range (e.g., 70-90% carbonate, 10-30% clay-sorbed) receive full credit. |
| q3 | reasoning | 40 | Explain the pedogenic reasoning for the expected calcium speciation in this specific deep CB horizon, and contrast it with what would be expected in the upper (e.g., Bw or Ah) horizons of the same soil profile. | The calcium speciation in the deep CB horizon of this Tuttlingen Eutric Cambisol is dominated by lithogenic carbonate alongside a minor fraction of clay mineral-sorbed Ca. This distribution arises because pedogenesis and weathering are less advanced at this depth, allowing the soil to retain a high proportion of unweathered carbonate from the limestone parent material while only exhibiting the initial stages of secondary mineral formation. In stark contrast, the upper Bw and Ah horizons of this same soil profile experience much more advanced weathering and pedogenesis. Consequently, those upper horizons would be expected to be completely de-carbonated, lacking the lithogenic carbonate that characterizes the deeper CB horizon. | Full points for explaining that the deep CB horizon retains a large amount of lithogenic carbonate from the limestone parent material due to less advanced weathering. The answer must also note that upper horizons (Bw, Ah) would be depleted of this carbonate due to intensive weathering and topsoil acidification, instead being dominated by organically bound or clay mineral-bound Ca. |
Review
#228
soil
Ca K
▶
LLM Prompt
Sample Information
Material: soil
Sample Origin: Wellheim, Franconian Alb, Germany
Sample-Specific Conditions
- Soil horizon: L
- Eutric Cambisol, L horizon
Measurement
We plan to measure the Ca K XANES spectrum of this sample.
Questions
Based on all the information above:
1. Based on the sample conditions (L horizon of a Eutric Cambisol under a mature beech forest), identify the expected dominant Ca phases and estimate their relative fractions.
2. What candidate reference spectra are needed to perform linear combination fitting (LCF) on the Ca K-edge XANES spectrum of this L horizon soil sample?
3. Explain the biogeochemical reasons for the expected Ca speciation in this L horizon sample. Why are these specific phases dominant?
Ground Truth
Material: soil
Measurement: Ca K-edge XANES in fluorescence mode at Beamline 8 of SLRI
Fit method: Linear combination fitting (LCF)
Phase fractions: (±10%)
| Phase | Fraction |
|---|---|
| Oxalate Ca | 0.474 |
| Citrate Ca | 0.105 |
| Pectate Ca | 0.421 |
Fit basis (paper's reference spectra):
- Ca oxalate
- Ca citrate
- Ca pectate
Source evidence: Table 5, page 206
Key reasoning: The L horizon (litter layer) of the Eutric Cambisol is dominated by organically bound Ca, specifically Ca oxalate and Ca pectate. This speciation reflects the input of fresh litter (foliage, twigs, bark) deposited on the forest floor surface. The Ca speciation in the L layers is almost identical to that of beech foliage, which is the dominating litter source at the Wellheim site. Ca oxalate is synthesized by plants and deposited via litter fall, representing a major component of the 'base pumping effect' of forest trees.
Reasoning source: Section 'Speciation of organically bound soil Ca as affected by plant input and microbial turnover', pages 215-216
Scoring Rubric (total: 100 pts)
| Q | Type | Max | Question | Reference Answer | Scoring Criteria |
|---|---|---|---|---|---|
| q1 | quantification | 40 | Based on the sample conditions (L horizon of a Eutric Cambisol under a mature beech forest), identify the expected dominant Ca phases and estimate their relative fractions. | The expected dominant Ca phases in this L horizon soil sample are Ca oxalate (47.4%), Ca pectate (42.1%), and Ca citrate (10.5%), with an estimated uncertainty of 10%. These specific fractions arise because the L horizon of this Eutric Cambisol represents the surface litter layer, which receives direct inputs of fresh foliage, twigs, and bark. At the Wellheim site, beech foliage is the dominant litter source, meaning the soil's Ca speciation is almost identical to that of the plant material. Consequently, the high proportions of Ca oxalate and Ca pectate result directly from plants synthesizing these organic compounds and depositing them via litter fall, driving the base pumping effect of the forest trees. | Full points for identifying Ca oxalate and Ca pectate as the dominant phases, with Ca oxalate at ~45-50%, Ca pectate at ~40-45%, and a minor contribution of Ca citrate (~10%). |
| q2 | identification | 20 | What candidate reference spectra are needed to perform linear combination fitting (LCF) on the Ca K-edge XANES spectrum of this L horizon soil sample? | To perform linear combination fitting (LCF) on the Ca K-edge XANES spectrum of this sample, the required candidate reference spectra are Ca oxalate, Ca pectate, and Ca citrate. These specific references are necessary because the L horizon of the Eutric Cambisol is a litter layer dominated by organically bound calcium derived from fresh plant inputs. Since beech foliage is the primary litter source at the Wellheim site, the soil's Ca speciation closely mirrors the organic composition of the leaves. Therefore, plant-synthesized compounds deposited during litter fall, particularly Ca oxalate and Ca pectate associated with the trees' base pumping effect, dictate the required LCF basis set. | Full points for listing organic Ca reference compounds such as Ca oxalate, Ca pectate, and Ca citrate (or other carboxylates). |
| q3 | reasoning | 40 | Explain the biogeochemical reasons for the expected Ca speciation in this L horizon sample. Why are these specific phases dominant? | The Ca speciation in this Eutric Cambisol L horizon is dominated by organically bound phases, specifically Ca oxalate (47.4%), Ca pectate (42.1%), and Ca citrate (10.5%). These specific phases are dominant because the L horizon consists of fresh litter (foliage, twigs, and bark) deposited directly on the forest floor surface. At the Wellheim site, this litter is predominantly beech foliage, causing the soil's Ca speciation to be almost identical to that of the living plant material. Ultimately, this speciation reflects a major component of the trees' 'base pumping effect', where compounds like Ca oxalate are actively synthesized by the plants and subsequently returned to the soil surface via litter fall. | Full points for explaining that the L horizon consists of fresh litter fall (foliage, twigs), and its Ca speciation closely matches that of the dominant litter source (beech foliage), which is rich in plant-synthesized Ca oxalate and Ca pectate. |
Review
#229
soil
Ca K
▶
LLM Prompt
Sample Information
Material: soil
Sample Origin: Achenpass, German Alps, Germany
Sample-Specific Conditions
- Soil horizon: L
- Eutric Cambisol, L horizon
Measurement
We plan to measure the Ca K XANES spectrum of this sample.
Questions
Based on all the information above:
1. Based on the sample conditions (L horizon of a Eutric Cambisol in a temperate forest), what candidate reference spectra are needed to accurately model the Ca K-edge XANES spectrum using linear combination fitting?
2. Estimate the relative fractions of the Ca phases present in this L horizon sample.
3. Explain the ecological and biogeochemical reasoning for the expected Ca speciation in this L horizon, considering the forest type and the nature of the soil layer.
Ground Truth
Material: soil
Measurement: Ca K-edge XANES in fluorescence mode at Beamline 8 of the Synchrotron Light Research Institute (SLRI)
Fit method: Linear combination fitting (LCF)
Phase fractions: (±10%)
| Phase | Fraction |
|---|---|
| Oxalate Ca | 0.353 |
| Citrate Ca | 0.176 |
| Pectate Ca | 0.471 |
Fit basis (paper's reference spectra):
- Calcite
- Aragonite
- Dolomite
- Apatite
- Brushite
- Monetite
- Anorthite
- Augite
- Epidote
- Ca adsorbed to montmorillonite
- Gypsum
- Anhydrite
- Fluorite
- Sinjarite
- Ca formate
- Ca acetate
- Ca citrate
- Ca oxalate
- Ca lactate
- Ca pectate
- Ca phytate
Source evidence: Table 5, page 206
Key reasoning: The Ca speciation in the L layers of the Cambisols is dominated by organically bound Ca, specifically Ca pectate and Ca oxalate. This speciation is almost identical to that of beech foliage, which is the dominating litter source at the site. Organically bound Ca enters the forest floor surface via litter fall deposited on and being converted into L layers. The large concentration of oxalate-bound Ca in L layers reflects the direct input of Ca oxalate via litter fall, which is a major component of the 'base pumping effect' of forest trees.
Reasoning source: Section 'Speciation of organically bound soil Ca as affected by plant input and microbial turnover', pages 215-216
Scoring Rubric (total: 100 pts)
| Q | Type | Max | Question | Reference Answer | Scoring Criteria |
|---|---|---|---|---|---|
| q1 | identification | 30 | Based on the sample conditions (L horizon of a Eutric Cambisol in a temperate forest), what candidate reference spectra are needed to accurately model the Ca K-edge XANES spectrum using linear combination fitting? | To accurately model the Ca K-edge XANES spectrum of this soil sample using linear combination fitting, a comprehensive basis set of inorganic and organic Ca references is required. The necessary candidate spectra include Calcite, Aragonite, Dolomite, Apatite, Brushite, Monetite, Anorthite, Augite, Epidote, Ca adsorbed to montmorillonite, Gypsum, Anhydrite, Fluorite, Sinjarite, and various organic forms like Ca formate, Ca acetate, Ca citrate, Ca oxalate, Ca lactate, Ca pectate, and Ca phytate. The inclusion of these specific organic references is crucial because the sample is from the L horizon of a Eutric Cambisol, where Ca speciation is dominated by organically bound Ca entering via litter fall from the dominating beech foliage. | Full credit for identifying organic Ca carboxylates (specifically Ca pectate, Ca oxalate, and Ca citrate) as the primary required reference spectra. Partial credit for mentioning general organic Ca or including inorganic phases without emphasizing the dominance of organic forms in the litter layer. |
| q2 | quantification | 40 | Estimate the relative fractions of the Ca phases present in this L horizon sample. | The Ca speciation in this L horizon sample is estimated to consist of 47.1% Pectate Ca, 35.3% Oxalate Ca, and 17.6% Citrate Ca, with an uncertainty of 10%. These specific fractions result directly from the nature of the L horizon, which receives organically bound Ca via deposited litter fall. Because the speciation in this layer is almost identical to that of the dominating beech foliage litter source, the sample is entirely dominated by organic Ca phases. The particularly large fraction of oxalate-bound Ca (35.3%) reflects the direct input of Ca oxalate via this litter fall, acting as a major component of the base pumping effect of the forest trees. | Full credit for estimating fractions within ±10% of the ground truth: ~47% Pectate Ca, ~35% Oxalate Ca, and ~18% Citrate Ca. Partial credit for correctly identifying that Ca pectate and Ca oxalate are the dominant phases, even if the exact percentages deviate further. |
| q3 | reasoning | 30 | Explain the ecological and biogeochemical reasoning for the expected Ca speciation in this L horizon, considering the forest type and the nature of the soil layer. | The expected Ca speciation in the L horizon of this Eutric Cambisol is entirely dominated by organically bound Ca, specifically Ca pectate, Ca oxalate, and Ca citrate. This occurs because the L horizon represents the forest floor surface where organically bound Ca enters via deposited litter fall. The resulting speciation is almost identical to that of beech foliage, which is the dominating litter source at this site. Therefore, the large concentration of oxalate-bound Ca directly reflects the input of Ca oxalate via this litter fall. This biogeochemical mechanism is a major component of the 'base pumping effect' of forest trees, which deposits organically bound calcium onto the soil surface. | Full credit for explaining that the L (litter) layer speciation is driven by fresh plant input (beech foliage), which is rich in Ca pectate and Ca oxalate. Must mention that organically bound Ca enters the forest floor via litter fall and that Ca oxalate deposition is a key part of the trees' base pumping effect. |
Review
#230
soil
Ca K
▶
LLM Prompt
Sample Information
Material: soil
Sample Origin: Achenpass, German Alps, Germany
Sample-Specific Conditions
- Soil horizon: Ah
- Eutric Cambisol, Ah horizon
Measurement
We plan to measure the Ca K XANES spectrum of this sample.
Questions
Based on all the information above:
1. Based on the sample conditions (Eutric Cambisol, Ah horizon, alpine environment with dolostone bedrock), what are the expected major Ca phases and their approximate fractions?
2. What reference spectra would be necessary to accurately model the Ca K-edge XANES spectrum of this sample using linear combination fitting?
3. Explain the physical and pedogenic reasons why the Ah horizon of this specific alpine Cambisol retains a dominant fraction of carbonate-bound Ca, whereas typical Cambisol topsoils are depleted in carbonates.
Ground Truth
Material: soil
Measurement: Ca K-edge XANES, fluorescence mode, Beamline 8 of the Synchrotron Light Research Institute (SLRI)
Fit method: Linear combination fitting (LCF)
Phase fractions: (±10%)
| Phase | Fraction |
|---|---|
| Carbonate Ca | 0.605 |
| Clay mineral sorbed Ca | 0.211 |
| Phytate Ca | 0.105 |
| Oxalate Ca | 0.079 |
Fit basis (paper's reference spectra):
- Carbonate Ca (e.g., Dolomite)
- Clay mineral sorbed Ca (e.g., Ca adsorbed to montmorillonite)
- Ca oxalate
- Ca phytate
Source evidence: Table 5, page 206
Key reasoning: The Achenpass Eutric Cambisol is located on a steep slope below dolostone rock outcrops. Physical weathering and downslope transport result in continuous input of dolomite scree to the soil surface, which is admixed into the topsoil (Ah horizon) by bioturbation. This allochthonous input maintains a high fraction of carbonate-bound Ca in the Ah horizon, despite the advanced pedogenesis typical of Cambisols. Concurrently, weathering and biological activity lead to the accumulation of clay mineral-sorbed Ca and organically bound Ca (such as Ca oxalate and Ca phytate) in this topsoil horizon.
Reasoning source: Page 214, 'Effects of pedogenesis on soil Ca speciation'
Scoring Rubric (total: 100 pts)
| Q | Type | Max | Question | Reference Answer | Scoring Criteria |
|---|---|---|---|---|---|
| q1 | quantification | 40 | Based on the sample conditions (Eutric Cambisol, Ah horizon, alpine environment with dolostone bedrock), what are the expected major Ca phases and their approximate fractions? | The expected major Ca phases in this Ah horizon soil sample are Carbonate Ca (60.5%), Clay mineral sorbed Ca (21.1%), Phytate Ca (10.5%), and Oxalate Ca (7.9%), with an uncertainty of 10%. These specific fractions result from the sample's location on a steep slope below dolostone rock outcrops, which provides a continuous allochthonous input of dolomite scree to the soil surface. Bioturbation admixes this scree into the topsoil, maintaining a high fraction of carbonate-bound Ca despite the advanced pedogenesis typical of Cambisols. Additionally, concurrent weathering and biological activity in the Ah horizon drive the formation and accumulation of the remaining fractions, specifically clay mineral-sorbed Ca and organically bound Ca like oxalate and phytate. | Award full points for identifying Carbonate Ca as the dominant phase (~60%), followed by Clay mineral sorbed Ca (~20%), and organic Ca forms like Phytate and Oxalate (~10% each). Deduct points for missing major phases or significantly inaccurate fraction estimates. |
| q2 | identification | 30 | What reference spectra would be necessary to accurately model the Ca K-edge XANES spectrum of this sample using linear combination fitting? | To accurately model the Ca K-edge XANES spectrum of this sample using linear combination fitting, the necessary reference spectra are Carbonate Ca (e.g., Dolomite), Clay mineral sorbed Ca (e.g., Ca adsorbed to montmorillonite), Ca oxalate, and Ca phytate. These specific reference phases are required because the sample is an Ah horizon of a Eutric Cambisol located below dolostone rock outcrops. Physical weathering and downslope transport continuously supply dolomite scree that is mixed into the topsoil by bioturbation, necessitating a carbonate reference. Furthermore, biological activity and weathering in this topsoil horizon produce organically bound Ca (oxalate and phytate) and clay mineral-sorbed Ca, requiring their respective spectra to capture the complete speciation. | Award points for including a carbonate reference (e.g., dolomite), a clay mineral-sorbed Ca reference (e.g., Ca-montmorillonite), and specific organic Ca references (Ca oxalate, Ca phytate). |
| q3 | reasoning | 30 | Explain the physical and pedogenic reasons why the Ah horizon of this specific alpine Cambisol retains a dominant fraction of carbonate-bound Ca, whereas typical Cambisol topsoils are depleted in carbonates. | The Ah horizon of this specific Achenpass Eutric Cambisol retains a dominant fraction of carbonate-bound Ca (60.5%) due to its specific topographical setting on a steep slope below dolostone rock outcrops. Physical weathering and downslope transport result in a continuous allochthonous input of dolomite scree to the soil surface. This fresh carbonate material is subsequently admixed into the topsoil (Ah horizon) by bioturbation. Consequently, this continuous replenishment mechanism maintains a high fraction of carbonate-bound Ca, counteracting the typical depletion expected from the advanced pedogenesis characteristic of Cambisols. | Award points for mentioning the steep slope location, the continuous input of dolomite scree from upslope rock outcrops (allochthonous carbonate input), and its admixture into the topsoil via bioturbation. |
Review
#231
soil
Ca K
▶
LLM Prompt
Sample Information
Material: soil
Sample Origin: Achenpass, German Alps, Germany
Sample-Specific Conditions
- Soil horizon: BwAh
- Eutric Cambisol, BwAh horizon
Measurement
We plan to measure the Ca K XANES spectrum of this sample.
Questions
Based on all the information above:
1. Based on the sample conditions (Eutric Cambisol, BwAh horizon, formed from dolostone), what candidate Ca phases should be considered as reference spectra for linear combination fitting of its Ca K-edge XANES spectrum?
2. Estimate the relative fractions of the major Ca species (carbonate, clay mineral-sorbed, and organic forms) in this specific soil horizon.
3. Explain the pedogenic and environmental reasoning for the observed Ca speciation in this specific horizon, particularly addressing why a significant fraction of carbonate Ca persists alongside clay-sorbed and organic Ca.
Ground Truth
Material: soil
Measurement: Ca K-edge XANES in fluorescence mode at Beamline 8 of the Synchrotron Light Research Institute (SLRI)
Fit method: Linear combination fitting (LCF)
Phase fractions: (±10%)
| Phase | Fraction |
|---|---|
| Carbonate Ca | 0.235 |
| Clay mineral sorbed Ca | 0.412 |
| Oxalate Ca | 0.118 |
| Citrate Ca | 0.176 |
| Pectate Ca | 0.059 |
Fit basis (paper's reference spectra):
- Calcite
- Dolomite
- Aragonite
- Apatite
- Brushite
- Monetite
- Anorthite
- Augite
- Epidote
- Ca adsorbed to montmorillonite
- Gypsum
- Anhydrite
- Fluorite
- Sinjarite
- Ca formate
- Ca acetate
- Ca citrate
- Ca oxalate
- Ca lactate
- Ca pectate
- Ca phytate
Source evidence: Table 5, page 206
Key reasoning: The Achenpass soil is an Eutric Cambisol formed from dolostone on a steep hillslope. The BwAh horizon exhibits a mixed Ca speciation resulting from progressive pedogenesis, which leads to the accumulation of clay mineral-bound and organically bound Ca (oxalate, citrate, pectate). The persistence of a significant fraction of carbonate-bound Ca in this horizon, unlike in non-alpine Cambisols, is due to continuous superficial input of unweathered dolomite scree from upslope rock walls and its subsequent admixture into the soil by bioturbation.
Reasoning source: Page 214, 'Effects of pedogenesis on soil Ca speciation'
Scoring Rubric (total: 100 pts)
| Q | Type | Max | Question | Reference Answer | Scoring Criteria |
|---|---|---|---|---|---|
| q1 | identification | 30 | Based on the sample conditions (Eutric Cambisol, BwAh horizon, formed from dolostone), what candidate Ca phases should be considered as reference spectra for linear combination fitting of its Ca K-edge XANES spectrum? | The candidate Ca phases for linear combination fitting should include inorganic minerals like Calcite, Dolomite, Aragonite, Apatite, Brushite, Monetite, Anorthite, Augite, Epidote, Gypsum, Anhydrite, Fluorite, and Sinjarite, as well as Ca adsorbed to montmorillonite. Additionally, organic Ca forms such as Ca formate, Ca acetate, Ca citrate, Ca oxalate, Ca lactate, Ca pectate, and Ca phytate must be considered. These specific phases are expected because the sample is an Eutric Cambisol from the BwAh horizon formed from dolostone, where progressive pedogenesis leads to the accumulation of clay mineral-bound and organically bound Ca. Furthermore, the steep alpine hillslope environment causes continuous input of unweathered dolomite scree, necessitating the inclusion of primary carbonate minerals alongside the secondary pedogenic phases. | Full credit for identifying carbonates (dolomite/calcite), clay mineral-sorbed Ca, and organic Ca forms (oxalate, citrate, pectate). Partial credit if only inorganic or only organic phases are mentioned. |
| q2 | quantification | 40 | Estimate the relative fractions of the major Ca species (carbonate, clay mineral-sorbed, and organic forms) in this specific soil horizon. | The relative fractions of Ca species in this BwAh horizon are 0.412 for clay mineral-sorbed Ca, 0.235 for carbonate Ca, and a combined organic fraction comprising 0.176 citrate Ca, 0.118 oxalate Ca, and 0.059 pectate Ca, all with a 10% uncertainty. These specific values result from the progressive pedogenesis occurring in this Eutric Cambisol, which naturally accumulates clay-bound and organically bound Ca species over time. The unusually high remaining fraction of carbonate Ca (0.235) for a Cambisol is directly caused by the sample's location on a steep alpine hillslope. This environment provides a continuous superficial input of unweathered dolomite scree from upslope rock walls, which is subsequently mixed into the soil by bioturbation. | Full credit for estimating fractions within ±10% of the ground truth: ~41% clay mineral-sorbed Ca, ~24% carbonate Ca, and ~35% total organic Ca (split among citrate, oxalate, and pectate). Partial credit for correctly identifying clay-sorbed Ca as the dominant phase followed by organic and carbonate Ca. |
| q3 | reasoning | 30 | Explain the pedogenic and environmental reasoning for the observed Ca speciation in this specific horizon, particularly addressing why a significant fraction of carbonate Ca persists alongside clay-sorbed and organic Ca. | The observed Ca speciation in the BwAh horizon of this Eutric Cambisol is driven by a combination of progressive pedogenesis and unique topographical factors. Pedogenesis in this soil naturally leads to the weathering of primary minerals and the subsequent accumulation of secondary clay mineral-bound Ca and organically bound Ca, such as oxalate, citrate, and pectate. However, unlike typical non-alpine Cambisols, a significant fraction of carbonate-bound Ca persists in this horizon. This persistence occurs because the soil is located on a steep hillslope below dolostone rock walls, leading to a continuous superficial input of unweathered dolomite scree. This fresh carbonate material is then continuously incorporated and mixed into the BwAh horizon through bioturbation, maintaining the mixed Ca speciation. | Full credit for explaining that progressive pedogenesis leads to the accumulation of clay-sorbed and organic Ca, while the persistence of carbonate Ca is driven by the continuous input of unweathered dolomite scree from upslope rock walls and bioturbation. |
Review
#232
soil
Ca K
▶
LLM Prompt
Sample Information
Material: soil
Sample Origin: Achenpass, German Alps, Germany
Sample-Specific Conditions
- Soil horizon: Bw
- Eutric Cambisol, Bw horizon
Measurement
We plan to measure the Ca K XANES spectrum of this sample.
Questions
Based on all the information above:
1. Predict the major Ca phases and their approximate relative fractions (within 10-15%) for the Bw horizon of the Achenpass Eutric Cambisol.
2. What reference spectra are necessary to perform a comprehensive Linear Combination Fitting (LCF) for this and similar temperate forest soil samples?
3. Based on pedogenic processes in alpine Eutric Cambisols formed on dolostone, explain why the Bw horizon exhibits this specific Ca speciation, contrasting it with typical Ah or C horizons.
Ground Truth
Material: soil
Measurement: Ca K-edge XANES in fluorescence mode at Beamline 8 of the Synchrotron Light Research Institute (SLRI)
Fit method: Linear combination fitting (LCF)
Phase fractions: (±10%)
| Phase | Fraction |
|---|---|
| Carbonate Ca | 0.385 |
| Clay mineral sorbed Ca | 0.308 |
| Phytate Ca | 0.308 |
Fit basis (paper's reference spectra):
- Calcite
- Aragonite
- Dolomite
- Apatite
- Brushite
- Monetite
- Anorthite
- Augite
- Epidote
- Ca adsorbed to montmorillonite
- Gypsum
- Anhydrite
- Fluorite
- Sinjarite
- Ca formate
- Ca acetate
- Ca citrate
- Ca oxalate
- Ca lactate
- Ca pectate
- Ca phytate
Source evidence: Table 5, page 206; text on page 203 and 214
Key reasoning: The Achenpass soil is an alpine Eutric Cambisol formed from dolostone on a steep slope. The Bw horizon is characterized by intensive silicate weathering and is largely de-carbonated compared to the Ah and C horizons, resulting in a small but non-zero carbonate-Ca fraction. Weathering intensity increases the amount of clay mineral-bound Ca. Organically bound Ca (phytate) is also present, reflecting the advanced stage of pedogenesis and organic matter input.
Reasoning source: Results (page 203) and Discussion (page 214)
Scoring Rubric (total: 100 pts)
| Q | Type | Max | Question | Reference Answer | Scoring Criteria |
|---|---|---|---|---|---|
| q1 | prediction | 40 | Predict the major Ca phases and their approximate relative fractions (within 10-15%) for the Bw horizon of the Achenpass Eutric Cambisol. | The major Ca phases predicted for the Bw horizon of this Achenpass Eutric Cambisol are Carbonate Ca (38.5%), Clay mineral sorbed Ca (30.8%), and Phytate Ca (30.8%). These specific fractions arise because the soil formed from dolostone on a steep alpine slope, leading to distinct weathering profiles. The Bw horizon undergoes intensive silicate weathering and is largely de-carbonated, leaving a reduced but non-zero carbonate fraction. Concurrently, this high weathering intensity increases the proportion of clay mineral-bound Ca, while advanced pedogenesis and organic matter input contribute to the organically bound phytate Ca fraction. | Full points for identifying Carbonate Ca (~38%), Clay mineral sorbed Ca (~31%), and Phytate Ca (~31%). Partial credit for identifying the correct phases with slightly off fractions. |
| q2 | identification | 30 | What reference spectra are necessary to perform a comprehensive Linear Combination Fitting (LCF) for this and similar temperate forest soil samples? | A comprehensive LCF requires a broad basis set including inorganic minerals (Calcite, Aragonite, Dolomite, Apatite, Brushite, Monetite, Anorthite, Augite, Epidote, Gypsum, Anhydrite, Fluorite, Sinjarite). It also requires clay-sorbed Ca (Ca adsorbed to montmorillonite) and organic Ca species (Ca formate, Ca acetate, Ca citrate, Ca oxalate, Ca lactate, Ca pectate, Ca phytate). This extensive library is necessary because alpine Eutric Cambisols formed from dolostone contain a complex mixture of primary bedrock minerals, secondary weathering products, and organic matter. Specifically, the intensive silicate weathering and de-carbonation in the Bw horizon require references for residual carbonates and clay-sorbed Ca, while the advanced stage of pedogenesis necessitates organic references like phytate to capture organically bound Ca inputs. | Full points for listing a comprehensive set of relevant Ca references including carbonates (calcite, dolomite), silicates/clay-adsorbed Ca, and organic Ca forms (phytate, oxalate, citrate, pectate). |
| q3 | reasoning | 30 | Based on pedogenic processes in alpine Eutric Cambisols formed on dolostone, explain why the Bw horizon exhibits this specific Ca speciation, contrasting it with typical Ah or C horizons. | The Bw horizon exhibits a Ca speciation of 38.5% Carbonate Ca, 30.8% Clay mineral sorbed Ca, and 30.8% Phytate Ca due to its specific pedogenic environment on a steep alpine slope. Unlike the Ah or C horizons, the Bw horizon is characterized by intensive silicate weathering and is largely de-carbonated, which explains the relatively small but non-zero carbonate-Ca fraction. This intense weathering process directly increases the amount of clay mineral-bound Ca compared to less weathered horizons. Furthermore, the advanced stage of pedogenesis and organic matter input in this horizon lead to the significant presence of organically bound Ca in the form of phytate. | Full points for mentioning intensive silicate weathering and de-carbonation in the Bw horizon (reducing carbonate Ca), the accumulation of clay mineral-bound Ca due to weathering, and the presence of organically bound Ca (phytate). |
Review
#233
soil
Ca K
▶
LLM Prompt
Sample Information
Material: soil
Sample Origin: Achenpass, German Alps, Germany
Sample-Specific Conditions
- Soil horizon: BwC
- Eutric Cambisol, BwC horizon
Measurement
We plan to measure the Ca K XANES spectrum of this sample.
Questions
Based on all the information above:
1. What candidate reference spectra are needed to model the Ca speciation in the BwC horizon of this Eutric Cambisol formed on dolostone?
2. Estimate the phase fractions of Ca in this BwC horizon.
3. Explain why carbonate Ca strongly dominates the Ca speciation in this specific horizon, given that it is a Cambisol (a soil type typically characterized by advanced pedogenesis and weathering).
Ground Truth
Material: soil
Measurement: Ca K-edge XANES, fluorescence mode, Beamline 8 of SLRI
Fit method: Linear combination fitting (LCF)
Phase fractions: (±10%)
| Phase | Fraction |
|---|---|
| Carbonate Ca | 0.911 |
| Clay mineral sorbed Ca | 0.089 |
Fit basis (paper's reference spectra):
- Calcite
- Aragonite
- Dolomite
- Apatite
- Brushite
- Monetite
- Anorthite
- Augite
- Epidote
- Ca adsorbed to montmorillonite
- Gypsum
- Anhydrite
- Fluorite
- Sinjarite
- Ca formate
- Ca acetate
- Ca citrate
- Ca oxalate
- Ca lactate
- Ca pectate
- Ca phytate
Source evidence: Table 5, page 206
Key reasoning: The Achenpass Cambisol is formed on dolostone bedrock on a steep slope. The BwC horizon is a deep subsoil horizon transitioning to the parent material. In this horizon, soil pH is controlled by carbonate weathering, and the Ca speciation is strongly dominated by autochthonous lithogenic carbonate Ca (dolomite). A small fraction of clay mineral-sorbed Ca is present due to initial weathering processes, unlike the fully de-carbonated Bw horizons above it.
Reasoning source: Section 'Effects of pedogenesis on soil Ca speciation', page 214
Scoring Rubric (total: 100 pts)
| Q | Type | Max | Question | Reference Answer | Scoring Criteria |
|---|---|---|---|---|---|
| q1 | identification | 30 | What candidate reference spectra are needed to model the Ca speciation in the BwC horizon of this Eutric Cambisol formed on dolostone? | To model the Ca speciation in this soil sample, a comprehensive basis set of reference spectra is required, including Calcite, Aragonite, Dolomite, Apatite, Brushite, Monetite, Anorthite, Augite, Epidote, Ca adsorbed to montmorillonite, Gypsum, Anhydrite, Fluorite, Sinjarite, and various organic Ca forms (formate, acetate, citrate, oxalate, lactate, pectate, phytate). These specific references are needed because the sample is a deep BwC subsoil horizon transitioning to dolostone parent material, where initial weathering processes occur. Consequently, the basis set must account for primary lithogenic minerals like dolomite and other carbonates, secondary weathering products like clay mineral-sorbed Ca, and potential organic or biogenic Ca phases that could be present throughout the soil profile. | Full credit for identifying carbonate (e.g., dolomite/calcite) and clay mineral-sorbed Ca as the necessary reference spectra. |
| q2 | quantification | 40 | Estimate the phase fractions of Ca in this BwC horizon. | The Ca speciation in this BwC horizon is estimated to be 91.1% Carbonate Ca and 8.9% Clay mineral sorbed Ca, with an uncertainty of 10%. These specific fractions result from the sample's location in a deep subsoil horizon that is transitioning to the dolostone parent material. Because it is a transitional BwC horizon rather than a fully de-carbonated upper Bw horizon, the Ca speciation remains strongly dominated by autochthonous lithogenic carbonate Ca (dolomite). The minor 8.9% fraction of clay mineral-sorbed Ca arises from the initial stages of carbonate weathering occurring at this depth. | Full credit for estimating ~91% Carbonate Ca and ~9% Clay mineral sorbed Ca. Partial credit for identifying Carbonate Ca as the overwhelming majority (>80%). |
| q3 | reasoning | 30 | Explain why carbonate Ca strongly dominates the Ca speciation in this specific horizon, given that it is a Cambisol (a soil type typically characterized by advanced pedogenesis and weathering). | Carbonate Ca strongly dominates the Ca speciation in this sample because the BwC horizon represents a deep subsoil layer transitioning directly into the dolostone bedrock. Although Cambisols generally undergo advanced pedogenesis, this specific soil formed on a steep slope at the Achenpass, which influences its weathering profile. In this deep transitional horizon, soil pH is still controlled by carbonate weathering, preventing complete decarbonation. Therefore, unlike the fully de-carbonated Bw horizons above it, the BwC horizon retains a massive fraction of autochthonous lithogenic carbonate Ca (dolomite), with only minor initial weathering producing clay mineral-sorbed Ca. | Full credit for explaining that the BwC horizon is a deep subsoil horizon transitioning to the dolostone parent material, where autochthonous carbonate remains largely unweathered and controls the pH, unlike the fully de-carbonated Bw horizons above it. |
Review
#234
soil
Ca K
▶
LLM Prompt
Sample Information
Material: soil
Sample Origin: Mangfall Mts, German Alps, Germany
Sample-Specific Conditions
- Soil horizon: Of
- Eutric Cambisol, Of horizon
Measurement
We plan to measure the Ca K XANES spectrum of this sample.
Questions
Based on all the information above:
1. Based on the sample conditions (Of horizon of a Eutric Cambisol from Mangfall Mts), identify the expected Ca-bearing phases and estimate their relative fractions.
2. What candidate reference spectra should be included in the basis set to accurately model the Ca K-edge XANES spectrum of this soil sample using linear combination fitting?
3. Discuss the pedogenic and biogeochemical reasoning for the observed Ca speciation in this Of horizon. Why are these specific organic and inorganic Ca phases present, and how do they reflect the weathering history and biological inputs?
Ground Truth
Material: soil
Measurement: Ca K-edge XANES, fluorescence mode, Beamline 8 of SLRI
Fit method: Linear combination fitting (LCF)
Phase fractions: (±10%)
| Phase | Fraction |
|---|---|
| Carbonate Ca | 0.053 |
| Clay mineral sorbed Ca | 0.316 |
| Oxalate Ca | 0.263 |
| Citrate Ca | 0.263 |
| Pectate Ca | 0.105 |
Fit basis (paper's reference spectra):
- Calcite
- Dolomite
- Ca adsorbed to montmorillonite
- Ca oxalate
- Ca citrate
- Ca pectate
- Ca phytate
- Augite
- Anorthite
- Epidote
Source evidence: Table 5, page 206
Key reasoning: In the Eutric Cambisol at Mangfall Mts, pedogenesis and topsoil acidification lead to a decrease in carbonate-bound Ca compared to the parent material. Organically bound Ca enters the forest floor via litter fall (beech and spruce) and root necromass, contributing oxalate, citrate, and pectate. Progressive aging and microbial decomposition of forest floor SOM from L to Of layers is associated with a marked decrease in the contribution of oxalate-bound Ca to organically bound Ca. Clay mineral-sorbed Ca is also present due to weathering and pedogenesis.
Reasoning source: Sections 'Effects of pedogenesis on soil Ca speciation' and 'Speciation of organically bound soil Ca as affected by plant input and microbial turnover', pages 213-215
Scoring Rubric (total: 100 pts)
| Q | Type | Max | Question | Reference Answer | Scoring Criteria |
|---|---|---|---|---|---|
| q1 | quantification | 40 | Based on the sample conditions (Of horizon of a Eutric Cambisol from Mangfall Mts), identify the expected Ca-bearing phases and estimate their relative fractions. | The expected Ca-bearing phases in this Of horizon sample are clay mineral sorbed Ca (0.316), oxalate Ca (0.263), citrate Ca (0.263), pectate Ca (0.105), and carbonate Ca (0.053), with an estimated uncertainty of 10%. These specific fractions arise because pedogenesis and topsoil acidification in the Eutric Cambisol significantly decrease the carbonate-bound Ca compared to the parent material. Concurrently, weathering generates clay minerals that account for the large fraction of sorbed Ca. The specific distribution of organic Ca fractions (oxalate, citrate, pectate) results from biological inputs like litter fall, where the oxalate fraction specifically reflects a marked decrease caused by progressive aging and microbial decomposition of soil organic matter in the Of layer. | Full credit if the predicted phases match the ground truth (Carbonate, Clay mineral sorbed, Oxalate, Citrate, Pectate) and the estimated fractions are within ±10% of the GT values. Partial credit for identifying the correct phases with less accurate fractions. |
| q2 | identification | 20 | What candidate reference spectra should be included in the basis set to accurately model the Ca K-edge XANES spectrum of this soil sample using linear combination fitting? | To accurately model the Ca K-edge XANES spectrum using linear combination fitting, the basis set should include Calcite, Dolomite, Ca adsorbed to montmorillonite, Ca oxalate, Ca citrate, Ca pectate, Ca phytate, Augite, Anorthite, and Epidote. These specific reference spectra are required because the Eutric Cambisol from the Mangfall Mts undergoes pedogenesis and topsoil acidification, necessitating inorganic references for residual carbonates and primary weathering products like clay minerals. Furthermore, biological inputs from beech and spruce litter fall and root necromass introduce various organically bound Ca forms into the forest floor. Therefore, organic references such as oxalate, citrate, pectate, and phytate must be included to capture the complex speciation resulting from microbial decomposition in the Of horizon. | Full credit for listing the key reference compounds used to model temperate forest soils (e.g., Calcite/Dolomite, Ca-montmorillonite, Ca oxalate, Ca citrate, Ca pectate, Ca phytate, and primary silicates like Augite/Anorthite). |
| q3 | reasoning | 40 | Discuss the pedogenic and biogeochemical reasoning for the observed Ca speciation in this Of horizon. Why are these specific organic and inorganic Ca phases present, and how do they reflect the weathering history and biological inputs? | The observed Ca speciation in the Of horizon of this Eutric Cambisol is driven by a combination of pedogenesis, topsoil acidification, and biological inputs. Acidification and weathering processes decrease the initial carbonate-bound Ca from the parent material while simultaneously generating clay mineral-sorbed Ca. Organically bound Ca is introduced into the forest floor through beech and spruce litter fall and root necromass, supplying Ca in the form of oxalate, citrate, and pectate. As the soil organic matter undergoes progressive aging and microbial decomposition from the L to the Of layer, the relative contribution of oxalate-bound Ca markedly decreases. Ultimately, this interplay of weathering and microbial turnover produces the specific mixture of residual carbonates, clay-sorbed Ca, and distinct organic Ca phases observed in the sample. | Full credit for explaining that pedogenesis reduces carbonate Ca, while plant litter and microbial turnover introduce organic Ca (oxalate, citrate, pectate). Must mention that progressive aging from L to Of horizons decreases the oxalate fraction due to microbial decomposition, and that clay mineral-sorbed Ca is present due to weathering. |
Review
#235
soil
Ca K
▶
LLM Prompt
Sample Information
Material: soil
Sample Origin: Mangfall Mts, German Alps, Germany
Sample-Specific Conditions
- Soil horizon: Oh
- Eutric Cambisol, Oh horizon
Measurement
We plan to measure the Ca K XANES spectrum of this sample.
Questions
Based on all the information above:
1. Based on the sample conditions (Oh horizon of a Eutric Cambisol from the Mangfall Mts), what candidate Ca-bearing phases should be included as reference spectra for Linear Combination Fitting (LCF) of the Ca K-edge XANES spectrum?
2. Estimate the relative fractions of the major Ca species in this Oh horizon sample. Provide your answer as percentages summing to 100%.
3. Explain the biogeochemical and pedogenic reasoning for the expected Ca speciation in this specific horizon, particularly addressing the presence of carbonate in an organic horizon and the distribution of organic Ca species.
Ground Truth
Material: soil
Measurement: Ca K-edge XANES, fluorescence mode, Beamline 8 of the Synchrotron Light Research Institute (SLRI)
Fit method: Linear combination fitting (LCF)
Phase fractions: (±10%)
| Phase | Fraction |
|---|---|
| Carbonate Ca | 0.217 |
| Clay mineral sorbed Ca | 0.391 |
| Oxalate Ca | 0.174 |
| Citrate Ca | 0.13 |
| Pectate Ca | 0.087 |
Fit basis (paper's reference spectra):
- Carbonate (Calcite/Dolomite)
- Clay mineral-sorbed Ca (Ca-montmorillonite)
- Ca oxalate
- Ca citrate
- Ca pectate
- Ca phytate
Source evidence: Table 5, page 206
Key reasoning: In Eutric Cambisols formed from calcareous parent material, pedogenesis typically leads to a decrease in carbonate-bound Ca and an accumulation of organically bound and clay mineral-bound Ca in the topsoil. However, the Mangfall Mts. Cambisol is located on a steep slope with continuous input of dolomite scree from upslope rock outcrops, resulting in the presence of allochthonous carbonate even in the organic (Oh) horizon. The organic Ca speciation (oxalate, citrate, pectate) reflects the progressive aging and microbial decomposition of forest floor SOM, where the relative contribution of oxalate-bound Ca decreases with SOM age and decomposition status compared to other organic Ca forms.
Reasoning source: Section 'Effects of pedogenesis on soil Ca speciation' (pages 213-214) and 'Speciation of organically bound soil Ca as affected by plant input and microbial turnover' (pages 215-216)
Scoring Rubric (total: 100 pts)
| Q | Type | Max | Question | Reference Answer | Scoring Criteria |
|---|---|---|---|---|---|
| q1 | identification | 30 | Based on the sample conditions (Oh horizon of a Eutric Cambisol from the Mangfall Mts), what candidate Ca-bearing phases should be included as reference spectra for Linear Combination Fitting (LCF) of the Ca K-edge XANES spectrum? | The candidate Ca-bearing phases for Linear Combination Fitting (LCF) should include Carbonate (Calcite/Dolomite), Clay mineral-sorbed Ca (Ca-montmorillonite), Ca oxalate, Ca citrate, Ca pectate, and Ca phytate. These phases are expected in the Oh horizon of this Eutric Cambisol because pedogenesis typically leads to an accumulation of organically bound and clay mineral-bound Ca in the topsoil. The specific organic Ca forms (oxalate, citrate, pectate, phytate) are required to model the progressive aging and microbial decomposition of forest floor soil organic matter (SOM). Additionally, carbonate must be included as a reference because this specific Mangfall Mts. site is located on a steep slope with continuous input of dolomite scree from upslope rock outcrops, introducing allochthonous carbonate even into the organic horizon. | Full credit for identifying a mix of inorganic (carbonate, clay mineral-sorbed Ca) and organic (oxalate, citrate, pectate, phytate) Ca reference phases. Partial credit if only inorganic or only organic phases are mentioned. |
| q2 | quantification | 35 | Estimate the relative fractions of the major Ca species in this Oh horizon sample. Provide your answer as percentages summing to 100%. | The estimated relative fractions of Ca species in this Oh horizon sample are 39.1% clay mineral-sorbed Ca, 21.7% carbonate Ca, 17.4% oxalate Ca, 13.0% citrate Ca, and 8.7% pectate Ca, with an uncertainty of 10%. These specific values result from pedogenic processes in Eutric Cambisols that naturally accumulate clay-bound and organically bound Ca in the topsoil. The unusually high 21.7% carbonate fraction persists in this organic horizon due to the continuous physical input of dolomite scree from upslope rock outcrops on the steep Mangfall Mts. slope. Furthermore, the specific distribution of the organic fractions reflects the advanced aging and microbial decomposition of the forest floor SOM, which selectively decreases the relative contribution of oxalate-bound Ca (17.4%) compared to earlier decomposition stages. | Full credit if the estimated fractions are within ±10-15% of the ground truth (approx. 39% clay mineral-sorbed, 22% carbonate, 17% oxalate, 13% citrate, 9% pectate). Partial credit for correctly identifying clay mineral-sorbed Ca and carbonate as the dominant phases, with a significant but smaller contribution from mixed organic Ca forms. |
| q3 | reasoning | 35 | Explain the biogeochemical and pedogenic reasoning for the expected Ca speciation in this specific horizon, particularly addressing the presence of carbonate in an organic horizon and the distribution of organic Ca species. | In typical Eutric Cambisols formed from calcareous parent material, pedogenesis leads to a decrease in carbonate-bound Ca and an accumulation of organically bound and clay mineral-bound Ca in the topsoil. However, the unexpected presence of carbonate in this specific organic (Oh) horizon is due to the sample's location on a steep slope in the Mangfall Mts., which receives a continuous input of dolomite scree from upslope rock outcrops. This physical process introduces allochthonous carbonate that persists alongside the expected clay-sorbed Ca. The distribution of organic Ca species (oxalate, citrate, pectate) is driven by the progressive aging and microbial decomposition of forest floor soil organic matter (SOM). Specifically, as the SOM ages and decomposes, the relative contribution of oxalate-bound Ca decreases compared to the other organic Ca forms. | Full credit for explaining that the presence of carbonate is due to continuous allochthonous input (e.g., dolomite scree from steep slopes), the high clay-sorbed fraction is typical for topsoils undergoing pedogenesis, and the organic Ca distribution reflects progressive microbial decomposition where oxalate-bound Ca decreases with SOM age. |
Review
#236
soil
Ca K
▶
LLM Prompt
Sample Information
Material: soil
Sample Origin: Mangfall Mts, German Alps, Germany
Sample-Specific Conditions
- Soil horizon: Ah1
- Eutric Cambisol, Ah1 horizon
Measurement
We plan to measure the Ca K XANES spectrum of this sample.
Questions
Based on all the information above:
1. Based on the sample conditions (Eutric Cambisol, Ah1 horizon, Mangfall Mts), identify the expected Ca phases and estimate their relative fractions.
2. What specific reference compounds should be included in the basis set for Linear Combination Fitting (LCF) to model the Ca K-edge XANES spectrum of this sample?
3. Explain the pedogenic and environmental factors that result in the specific Ca speciation observed in this Ah1 horizon, particularly the coexistence of lithogenic and pedogenic/organic Ca forms.
Ground Truth
Material: soil
Measurement: Ca K-edge XANES in fluorescence mode at Beamline 8 of the Synchrotron Light Research Institute (SLRI)
Fit method: Linear combination fitting (LCF)
Phase fractions: (±10%)
| Phase | Fraction |
|---|---|
| Carbonate Ca | 0.333 |
| Clay mineral sorbed Ca | 0.233 |
| Citrate Ca | 0.2 |
| Oxalate Ca | 0.133 |
| Pectate Ca | 0.1 |
Fit basis (paper's reference spectra):
- Dolomite (representing Carbonate Ca)
- Ca adsorbed to montmorillonite (representing Clay mineral sorbed Ca)
- Ca oxalate
- Ca citrate (summarizing carboxylates other than oxalate/pectate)
- Ca pectate
Source evidence: Table 5, page 206
Key reasoning: The Eutric Cambisol at Mangfall Mts is located on a steep slope with upslope dolostone rock outcrops. Continuous input of dolomite scree into the topsoil via gravity and snow gliding, followed by bioturbation, maintains a significant fraction of lithogenic carbonate-bound Ca in the Ah1 horizon. Concurrently, intensive weathering and pedogenesis lead to the accumulation of clay mineral-bound Ca and organically bound Ca (oxalate, citrate, pectate) derived from plant litter and microbial turnover.
Reasoning source: Page 214, 'Effects of pedogenesis on soil Ca speciation'
Scoring Rubric (total: 100 pts)
| Q | Type | Max | Question | Reference Answer | Scoring Criteria |
|---|---|---|---|---|---|
| q1 | quantification | 40 | Based on the sample conditions (Eutric Cambisol, Ah1 horizon, Mangfall Mts), identify the expected Ca phases and estimate their relative fractions. | The expected Ca phases in this Eutric Cambisol Ah1 horizon are Carbonate Ca (33.3%), Clay mineral sorbed Ca (23.3%), Citrate Ca (20.0%), Oxalate Ca (13.3%), and Pectate Ca (10.0%), with an estimated uncertainty of 10%. These specific fractions arise because the sample is located on a steep slope below dolostone rock outcrops in the Mangfall Mountains. Gravity and snow gliding continuously input dolomite scree into the topsoil, which is mixed by bioturbation, maintaining a high fraction of lithogenic carbonate. Simultaneously, intensive weathering and pedogenesis in this Ah1 horizon produce the remaining fractions by accumulating clay mineral-bound Ca and organically bound Ca (citrate, oxalate, pectate) derived from plant litter and microbial turnover. | Full points if all 5 phases (Carbonate, Clay-sorbed, Citrate, Oxalate, Pectate) are identified with fractions within ±10% of the ground truth. Partial credit for identifying the correct phases without accurate fractions or missing minor phases. |
| q2 | identification | 30 | What specific reference compounds should be included in the basis set for Linear Combination Fitting (LCF) to model the Ca K-edge XANES spectrum of this sample? | The LCF basis set for this soil sample should include Dolomite (representing Carbonate Ca), Ca adsorbed to montmorillonite (representing Clay mineral sorbed Ca), Ca oxalate, Ca citrate (summarizing carboxylates other than oxalate/pectate), and Ca pectate. These specific reference compounds are required because the Eutric Cambisol Ah1 horizon from the Mangfall Mountains receives a continuous input of dolomite scree from upslope rock outcrops via gravity and snow gliding. Bioturbation mixes this lithogenic carbonate with pedogenic products formed through intensive weathering in the topsoil. Consequently, references for clay mineral-bound Ca and organically bound Ca (oxalate, citrate, pectate) are necessary to account for the accumulation of Ca derived from plant litter and microbial turnover. | Full points for listing Dolomite, Ca-montmorillonite (or clay-sorbed Ca), Ca oxalate, Ca citrate, and Ca pectate. Partial credit for missing 1-2 references or using generic terms (e.g., 'carbonate' instead of 'dolomite'). |
| q3 | reasoning | 30 | Explain the pedogenic and environmental factors that result in the specific Ca speciation observed in this Ah1 horizon, particularly the coexistence of lithogenic and pedogenic/organic Ca forms. | The coexistence of lithogenic and pedogenic/organic Ca forms in this Eutric Cambisol Ah1 horizon is driven by its specific topographic and environmental setting in the Mangfall Mountains. The site is located on a steep slope with upslope dolostone rock outcrops, leading to a continuous input of dolomite scree into the topsoil via gravity and snow gliding. Bioturbation subsequently mixes this lithogenic carbonate-bound Ca into the Ah1 horizon, maintaining its significant presence. Concurrently, intensive weathering and pedogenesis in the topsoil drive the formation of pedogenic and organic Ca forms. This dual process results in the accumulation of clay mineral-bound Ca alongside organically bound Ca (oxalate, citrate, and pectate) originating from plant litter and microbial turnover. | Full points for explaining that continuous input of dolomite scree from upslope outcrops maintains lithogenic carbonate, while simultaneous intensive weathering and pedogenesis drive the formation of clay-bound and organically bound Ca (from plant/microbial input). |
Review
#237
soil
Ca K
▶
LLM Prompt
Sample Information
Material: soil
Sample Origin: Mangfall Mts, German Alps, Germany
Sample-Specific Conditions
- Soil horizon: Ah2
- Eutric Cambisol, Ah2 horizon
Measurement
We plan to measure the Ca K XANES spectrum of this sample.
Questions
Based on all the information above:
1. Based on the environmental conditions and soil type (Eutric Cambisol, Ah2 horizon, dolostone parent material), what candidate reference spectra should be included in a linear combination fitting analysis of its Ca K-edge XANES spectrum?
2. Estimate the relative fractions of the major Ca species (carbonate, clay-sorbed, and organic forms) in this Ah2 horizon sample.
3. Provide a physical and biogeochemical reasoning for the observed Ca speciation in this sample. Specifically, explain why carbonate-bound Ca is present in this topsoil horizon and why clay mineral-sorbed Ca constitutes such a large fraction.
Ground Truth
Material: soil
Measurement: Ca K-edge XANES in fluorescence mode at Beamline 8 of SLRI
Fit method: Linear combination fitting (LCF)
Phase fractions: (±10%)
| Phase | Fraction |
|---|---|
| Carbonate Ca | 0.167 |
| Clay mineral sorbed Ca | 0.417 |
| Oxalate Ca | 0.167 |
| Citrate Ca | 0.25 |
Fit basis (paper's reference spectra):
- Calcite
- Dolomite
- Aragonite
- Apatite
- Brushite
- Monetite
- Anorthite
- Augite
- Epidote
- Ca adsorbed to montmorillonite
- Gypsum
- Anhydrite
- Fluorite
- Sinjarite
- Ca formate
- Ca acetate
- Ca citrate
- Ca oxalate
- Ca lactate
- Ca pectate
- Ca phytate
Source evidence: Table 5, page 206
Key reasoning: The sample is from the Ah2 horizon of an Eutric Cambisol formed on dolostone. The presence of carbonate-bound Ca (16.7%) in this topsoil horizon is due to continuous superficial input of unweathered dolomite scree from upslope rock outcrops, leading to a 'double pedogenesis'. The large fraction of clay mineral-sorbed Ca (41.7%) reflects the relatively young (Holocene) age of the soil, which contains high-CEC clay minerals like illite and smectite, unlike older soils where clay-sorbed Ca is replaced by Al due to advanced acidification. The organically bound Ca (oxalate and citrate, totaling ~42%) originates from plant litter and root inputs.
Reasoning source: Section 'Effects of pedogenesis on soil Ca speciation', pages 213-214
Scoring Rubric (total: 100 pts)
| Q | Type | Max | Question | Reference Answer | Scoring Criteria |
|---|---|---|---|---|---|
| q1 | identification | 30 | Based on the environmental conditions and soil type (Eutric Cambisol, Ah2 horizon, dolostone parent material), what candidate reference spectra should be included in a linear combination fitting analysis of its Ca K-edge XANES spectrum? | The candidate reference spectra for the linear combination fitting analysis should include inorganic minerals (Calcite, Dolomite, Aragonite, Apatite, Brushite, Monetite, Anorthite, Augite, Epidote, Gypsum, Anhydrite, Fluorite, Sinjarite), clay-sorbed Ca (Ca adsorbed to montmorillonite), and organic Ca forms (Ca formate, Ca acetate, Ca citrate, Ca oxalate, Ca lactate, Ca pectate, Ca phytate). These specific phases are expected because the sample is an Ah2 topsoil horizon of an Eutric Cambisol formed on dolostone. The inorganic carbonate references are necessary due to the continuous superficial input of unweathered dolomite scree from upslope rock outcrops. The clay-sorbed reference is required because this relatively young Holocene soil contains high-CEC clay minerals that have not yet undergone advanced acidification. Finally, the organic references are essential to account for the organically bound Ca originating from plant litter and root inputs typical of this soil horizon. | Full credit for identifying carbonates (e.g., dolomite/calcite), clay-adsorbed Ca (e.g., Ca-montmorillonite), and organic Ca forms (e.g., Ca oxalate, Ca citrate/pectate). Partial credit if only inorganic or only organic phases are mentioned. |
| q2 | quantification | 35 | Estimate the relative fractions of the major Ca species (carbonate, clay-sorbed, and organic forms) in this Ah2 horizon sample. | The relative fractions of Ca species in this Ah2 horizon sample are estimated to be 41.7% clay mineral-sorbed Ca, 16.7% carbonate Ca, 16.7% oxalate Ca, and 25.0% citrate Ca, with an uncertainty of 10%. These specific values result directly from the pedogenic and environmental conditions of the Eutric Cambisol. The large fraction of clay-sorbed Ca (41.7%) occurs because the soil is relatively young (Holocene) and retains high-CEC clay minerals like illite and smectite, avoiding the advanced acidification that replaces Ca with Al in older soils. The 16.7% carbonate fraction persists in this topsoil due to a 'double pedogenesis' effect caused by continuous superficial input of unweathered dolomite scree from upslope outcrops. The remaining ~42% organically bound Ca (oxalate and citrate) reflects the significant biological contribution from plant litter and root inputs in this Ah2 horizon. | Full credit for estimating ~15-20% carbonate Ca, ~40-45% clay mineral-sorbed Ca, and ~40-45% organically bound Ca (split between oxalate and other carboxylates like citrate). Partial credit for correctly identifying clay-sorbed Ca as the dominant single phase or for reasonable approximations of the organic vs inorganic split. |
| q3 | reasoning | 35 | Provide a physical and biogeochemical reasoning for the observed Ca speciation in this sample. Specifically, explain why carbonate-bound Ca is present in this topsoil horizon and why clay mineral-sorbed Ca constitutes such a large fraction. | The observed Ca speciation in this Ah2 horizon of an Eutric Cambisol is driven by its relatively young Holocene age, its dolostone parent material, and its topographic position in the Mangfall Mountains. Carbonate-bound Ca (16.7%) is present in this topsoil horizon despite typical weathering because of a 'double pedogenesis' process, where continuous superficial input of unweathered dolomite scree from upslope rock outcrops replenishes the carbonates. Clay mineral-sorbed Ca constitutes a large fraction (41.7%) because the young soil contains high-cation exchange capacity (CEC) clay minerals like illite and smectite. Unlike older soils where advanced acidification causes Al to replace sorbed Ca, this younger soil retains its clay-sorbed Ca. Additionally, the significant presence of organically bound Ca (~42% as oxalate and citrate) is the direct biogeochemical result of organic inputs from plant litter and root exudates in the topsoil. | Full credit for explaining that carbonate presence in the topsoil is due to continuous superficial input of unweathered dolomite scree (allochthonous input), and that the high clay-sorbed Ca fraction is due to the relatively young (Holocene) age of the soil retaining high-CEC clay minerals (illite/smectite) before advanced acidification replaces Ca with Al. |
Review
#238
soil
Ca K
▶
LLM Prompt
Sample Information
Material: soil
Sample Origin: Mangfall Mts, German Alps, Germany
Sample-Specific Conditions
- Soil horizon: Bw
- Eutric Cambisol, Bw horizon
Measurement
We plan to measure the Ca K XANES spectrum of this sample.
Questions
Based on all the information above:
1. What candidate reference spectra are needed to model the Ca K-edge XANES spectrum of this Eutric Cambisol Bw horizon sample using linear combination fitting?
2. Based on the sample conditions (Eutric Cambisol, Bw horizon), estimate the relative fractions of the major Ca phases present in this soil.
3. Explain the pedogenic reasoning for why these specific Ca phases dominate in the Bw horizon of this Eutric Cambisol, particularly in contrast to the calcareous parent material.
Ground Truth
Material: soil
Measurement: Ca K-edge XANES, fluorescence mode, Beamline 8 of the Synchrotron Light Research Institute (SLRI)
Fit method: Linear combination fitting (LCF)
Phase fractions: (±10%)
| Phase | Fraction |
|---|---|
| Clay mineral sorbed Ca | 0.5 |
| Citrate Ca | 0.357 |
| Oxalate Ca | 0.143 |
Fit basis (paper's reference spectra):
- Calcite
- Dolomite
- Aragonite
- Apatite
- Brushite
- Monetite
- Anorthite
- Augite
- Epidote
- Ca adsorbed to montmorillonite
- Gypsum
- Anhydrite
- Fluorite
- Sinjarite
- Ca formate
- Ca acetate
- Ca citrate
- Ca oxalate
- Ca lactate
- Ca pectate
- Ca phytate
Source evidence: Table 5, page 206
Key reasoning: In Eutric Cambisols formed from calcareous parent material, progressive pedogenesis and intensive silicate weathering lead to the de-carbonation of Bw horizons. As a result, lithogenic carbonate-bound Ca is lost, and the Ca speciation becomes dominated by clay mineral-bound Ca and organically bound Ca forms (such as citrate and oxalate). This reflects an advanced stage of soil development where primary minerals have weathered and secondary sinks (clays and soil organic matter) control Ca speciation.
Reasoning source: Page 214, 'Effects of pedogenesis on soil Ca speciation'
Scoring Rubric (total: 100 pts)
| Q | Type | Max | Question | Reference Answer | Scoring Criteria |
|---|---|---|---|---|---|
| q1 | identification | 20 | What candidate reference spectra are needed to model the Ca K-edge XANES spectrum of this Eutric Cambisol Bw horizon sample using linear combination fitting? | To model the Ca K-edge XANES spectrum of this soil sample using linear combination fitting, a comprehensive basis set of 21 reference spectra is required. This set must include carbonates (Calcite, Dolomite, Aragonite), phosphates (Apatite, Brushite, Monetite), silicates (Anorthite, Augite, Epidote), sulfates/halides (Gypsum, Anhydrite, Fluorite, Sinjarite), clay-sorbed Ca (Ca adsorbed to montmorillonite), and various organic Ca forms (Ca formate, acetate, citrate, oxalate, lactate, pectate, phytate). These specific references are necessary because, in Eutric Cambisols, progressive pedogenesis and intensive silicate weathering cause the de-carbonation of the Bw horizon. Consequently, primary lithogenic carbonate-bound Ca is lost, and the system transitions to an advanced stage of soil development where secondary sinks like clays and soil organic matter control Ca speciation, necessitating a wide array of organic and clay-bound reference standards. | Full credit for identifying clay mineral-sorbed Ca (e.g., Ca-montmorillonite) and organic Ca carboxylates (such as Ca citrate and Ca oxalate). Partial credit if carbonates are incorrectly included as major components for this specific de-carbonated horizon. |
| q2 | quantification | 40 | Based on the sample conditions (Eutric Cambisol, Bw horizon), estimate the relative fractions of the major Ca phases present in this soil. | The major Ca phases in this Eutric Cambisol Bw horizon are estimated to be 50% clay mineral sorbed Ca, 35.7% citrate Ca, and 14.3% oxalate Ca, with an uncertainty of 10%. These specific fractions result from the advanced stage of soil development characteristic of this specific soil horizon. Due to progressive pedogenesis and intensive silicate weathering, the Bw horizon undergoes severe de-carbonation, leading to the complete loss of lithogenic carbonate-bound Ca. As a result, primary minerals are weathered away, and the remaining Ca speciation is entirely controlled by secondary sinks, specifically clay minerals and soil organic matter like citrate and oxalate. | Full credit for estimating approximately 50% clay mineral-sorbed Ca and 50% organically bound Ca (split between citrate/other carboxylates and oxalate). Deduct points if lithogenic carbonates are estimated at >5%. |
| q3 | reasoning | 40 | Explain the pedogenic reasoning for why these specific Ca phases dominate in the Bw horizon of this Eutric Cambisol, particularly in contrast to the calcareous parent material. | The dominance of clay mineral-bound and organically bound Ca phases in the Bw horizon is driven by progressive pedogenesis and intensive silicate weathering. Although the Eutric Cambisol forms from calcareous parent material, these weathering processes lead to the extensive de-carbonation of the Bw horizon. Consequently, the original lithogenic carbonate-bound Ca is completely lost from this layer of the soil profile. This reflects an advanced stage of soil development where primary minerals have weathered away, leaving secondary sinks such as clays and soil organic matter (like citrate and oxalate) to control and dominate the Ca speciation. | Full credit for explaining that progressive pedogenesis and intensive silicate weathering lead to the de-carbonation of the Bw horizon, resulting in a shift from lithogenic carbonate Ca to secondary sinks like clay mineral-bound and organically bound Ca forms. |
Review
#239
soil
Ca K
▶
LLM Prompt
Sample Information
Material: soil
Sample Origin: Mangfall Mts, German Alps, Germany
Sample-Specific Conditions
- Soil horizon: L
- Rockic Histosol, L horizon
Measurement
We plan to measure the Ca K XANES spectrum of this sample.
Questions
Based on all the information above:
1. Based on the sample conditions (L horizon of a Rockic Histosol in a temperate forest), what are the expected dominant Ca phases, and what are their approximate fractions?
2. What reference spectra should be included in the linear combination fitting (LCF) basis set to accurately model the Ca speciation in this forest soil litter layer?
3. Explain the physical and biological reasoning for why Ca oxalate is the dominant Ca species in this L horizon, and predict how its relative fraction would change in deeper, more decomposed organic horizons (e.g., Oh).
Ground Truth
Material: soil
Measurement: Ca K-edge XANES, fluorescence mode, Beamline 8 of SLRI
Fit method: Linear combination fitting (LCF)
Phase fractions: (±10%)
| Phase | Fraction |
|---|---|
| Oxalate Ca | 0.686 |
| Citrate Ca | 0.063 |
| Phytate Ca | 0.252 |
Fit basis (paper's reference spectra):
- Calcite
- Aragonite
- Dolomite
- Apatite
- Brushite
- Monetite
- Anorthite
- Augite
- Epidote
- Ca adsorbed to montmorillonite
- Gypsum
- Anhydrite
- Fluorite
- Sinjarite
- Ca formate
- Ca acetate
- Ca citrate
- Ca oxalate
- Ca lactate
- Ca pectate
- Ca phytate
Source evidence: Table 6, page 208
Key reasoning: The L layer of the Histosol is formed from recent litter fall (foliage, twigs, bark particles). The Ca speciation in this horizon reflects the input of spruce and beech litter, which are rich in Ca oxalate and other organic Ca forms like Ca phytate. Ca oxalate is synthesized by plants and deposited in foliage, entering the soil surface via litter fall. As the organic matter ages and undergoes microbial decomposition in deeper horizons, the proportion of oxalate-bound Ca decreases rapidly.
Reasoning source: Page 215-216, 'Speciation of organically bound soil Ca as affected by plant input and microbial turnover' section
Scoring Rubric (total: 100 pts)
| Q | Type | Max | Question | Reference Answer | Scoring Criteria |
|---|---|---|---|---|---|
| q1 | quantification | 40 | Based on the sample conditions (L horizon of a Rockic Histosol in a temperate forest), what are the expected dominant Ca phases, and what are their approximate fractions? | The expected dominant Ca phases in this L horizon sample are Oxalate Ca (0.686 or 68.6%), Phytate Ca (0.252 or 25.2%), and Citrate Ca (0.063 or 6.3%), with an estimated uncertainty of 10%. These specific fractions arise because the L layer of a Rockic Histosol is formed directly from recent litter fall, such as foliage, twigs, and bark particles. Spruce and beech litter are naturally rich in organic Ca forms, particularly Ca oxalate, which is synthesized by plants and deposited in their foliage. Therefore, the fresh litter input at the soil surface results in a Ca speciation heavily dominated by these plant-derived organic complexes rather than inorganic minerals. | Full points for identifying Oxalate Ca as the dominant phase (~68%) and Phytate Ca as a secondary phase (~25%). Partial points for identifying organic Ca forms generally without specific fractions. |
| q2 | identification | 30 | What reference spectra should be included in the linear combination fitting (LCF) basis set to accurately model the Ca speciation in this forest soil litter layer? | The linear combination fitting (LCF) basis set should include Calcite, Aragonite, Dolomite, Apatite, Brushite, Monetite, Anorthite, Augite, Epidote, Ca adsorbed to montmorillonite, Gypsum, Anhydrite, Fluorite, Sinjarite, Ca formate, Ca acetate, Ca citrate, Ca oxalate, Ca lactate, Ca pectate, and Ca phytate. This extensive mix of organic and inorganic references is required because the L horizon of a Rockic Histosol represents a complex interface of fresh biological inputs and underlying soil. The inclusion of numerous organic standards is critical because the horizon is composed of recent spruce and beech litter fall, which is rich in plant-synthesized organic Ca forms like oxalate and phytate. The inorganic standards are necessary to rule out or quantify any mineral contributions from the surrounding soil environment or atmospheric deposition. | Full points for listing relevant organic Ca reference compounds such as Ca oxalate, Ca citrate, Ca phytate, and Ca pectate, as well as potential inorganic minerals (carbonates, silicates) for completeness. |
| q3 | reasoning | 30 | Explain the physical and biological reasoning for why Ca oxalate is the dominant Ca species in this L horizon, and predict how its relative fraction would change in deeper, more decomposed organic horizons (e.g., Oh). | Ca oxalate dominates the L horizon because this layer consists of recent litter fall, including foliage, twigs, and bark particles from spruce and beech trees. Biologically, plants synthesize Ca oxalate and deposit it directly into their foliage, meaning the fresh litter entering the soil surface is inherently enriched in this specific Ca species. As this organic matter transitions into deeper horizons (such as the Oh horizon), it ages and undergoes significant microbial decomposition. Consequently, the relative fraction of oxalate-bound Ca is expected to decrease rapidly in deeper layers as microbial turnover breaks down these primary plant-derived organic Ca complexes. | Full points for explaining that Ca oxalate enters the L horizon via fresh plant litter fall (spruce/beech foliage) where it was deposited by plants, and predicting that its fraction decreases in deeper horizons due to rapid microbial decomposition. |
Review
#240
soil
Ca K
▶
LLM Prompt
Sample Information
Material: soil
Sample Origin: Mangfall Mts, German Alps, Germany
Sample-Specific Conditions
- Soil horizon: Of
- Rockic Histosol, Of horizon
Measurement
We plan to measure the Ca K XANES spectrum of this sample.
Questions
Based on all the information above:
1. Based on the sample origin (Mangfall Mts Histosol) and horizon (Of), what candidate reference spectra should be included in a Linear Combination Fitting (LCF) analysis of its Ca K-edge XANES spectrum?
2. Estimate the relative fractions of the Ca phases in this Of horizon sample.
3. Explain the physical and biogeochemical reasons for the presence of a large fraction of clay mineral-sorbed Ca in this organic (Of) horizon, as well as the origin of the oxalate-bound Ca.
Ground Truth
Material: soil
Measurement: Ca K-edge XANES, fluorescence mode, Beamline 8 of the Synchrotron Light Research Institute (SLRI)
Fit method: Linear Combination Fitting (LCF)
Phase fractions: (±10%)
| Phase | Fraction |
|---|---|
| Clay mineral sorbed Ca | 0.376 |
| Oxalate Ca | 0.398 |
| Citrate Ca | 0.15 |
| Phytate Ca | 0.075 |
Fit basis (paper's reference spectra):
- Clay mineral sorbed Ca
- Ca oxalate
- Ca citrate
- Ca phytate
Source evidence: Table 6, page 208
Key reasoning: In the Of horizon of the Mangfall Mts Histosol, organically bound Ca dominates, with a significant contribution from oxalate-bound Ca originating from litter fall (spruce and beech). The high fraction of clay mineral-sorbed Ca in this organic surface horizon is explained by continuous aeolian silicate dust deposition that accompanied the slow accrual of the horizon over a long period.
Reasoning source: Sections 'Speciation of organically bound soil Ca as affected by plant input and microbial turnover' (p. 215) and 'Differentiation of organically and inorganically bound exchangeable soil Ca' (p. 217)
Scoring Rubric (total: 100 pts)
| Q | Type | Max | Question | Reference Answer | Scoring Criteria |
|---|---|---|---|---|---|
| q1 | identification | 30 | Based on the sample origin (Mangfall Mts Histosol) and horizon (Of), what candidate reference spectra should be included in a Linear Combination Fitting (LCF) analysis of its Ca K-edge XANES spectrum? | The candidate reference spectra for the Linear Combination Fitting (LCF) analysis of this soil sample should include clay mineral sorbed Ca, Ca oxalate, Ca citrate, and Ca phytate. These specific phases are expected because the sample is from the organic Of horizon of a Rockic Histosol in the Mangfall Mts, an environment where organically bound Ca dominates. The Ca oxalate phase is specifically expected due to the accumulation of spruce and beech litter fall in this horizon. Furthermore, the inclusion of clay mineral sorbed Ca is necessary because continuous aeolian silicate dust deposition accompanied the slow accrual of this organic surface horizon over a long period. | Full points for identifying clay mineral-sorbed Ca and organic Ca forms (specifically oxalate, citrate, and phytate). Partial points for missing some organic species or the clay mineral component. |
| q2 | quantification | 35 | Estimate the relative fractions of the Ca phases in this Of horizon sample. | The estimated relative fractions for the Ca phases in this sample are 39.8% Ca oxalate, 37.6% clay mineral sorbed Ca, 15.0% Ca citrate, and 7.5% Ca phytate, with an estimated uncertainty of 10%. These specific values result from the biogeochemical conditions of the Of horizon in the Mangfall Mts Histosol, which strongly favors organically bound Ca. The highest fraction, Ca oxalate (39.8%), is driven by the significant input of spruce and beech litter fall into this organic layer. Meanwhile, the surprisingly high fraction of inorganic clay mineral sorbed Ca (37.6%) in an organic horizon occurs because the slow accrual of this layer was accompanied by continuous aeolian silicate dust deposition. | Full points if the estimated fractions are within ±10% of the ground truth (approx. 38% clay mineral sorbed Ca, 40% oxalate Ca, 15% citrate Ca, 8% phytate Ca). Partial points for correct relative ordering (Oxalate ≈ Clay > Citrate > Phytate). |
| q3 | reasoning | 35 | Explain the physical and biogeochemical reasons for the presence of a large fraction of clay mineral-sorbed Ca in this organic (Of) horizon, as well as the origin of the oxalate-bound Ca. | In the Of horizon of the Mangfall Mts Rockic Histosol, the Ca speciation is heavily influenced by both biological inputs and physical deposition processes. The origin of the oxalate-bound Ca is biogeochemical, stemming directly from the accumulation and breakdown of spruce and beech litter fall in this organic surface layer. Despite being an organic-dominated horizon, there is a large fraction of clay mineral-sorbed Ca due to physical environmental factors. Specifically, this inorganic contribution is explained by continuous aeolian silicate dust deposition that accompanied the slow accrual of the horizon over a long period. | Full points for attributing the clay mineral-sorbed Ca to continuous aeolian silicate dust deposition during the slow accrual of the organic horizon, and attributing the oxalate Ca to plant litter input (spruce/beech) and its subsequent microbial decomposition. |
Review
#241
soil
Ca K
▶
LLM Prompt
Sample Information
Material: soil
Sample Origin: Mangfall Mts, German Alps, Germany
Sample-Specific Conditions
- Soil horizon: Oh1
- Rockic Histosol, Oh1 horizon
Measurement
We plan to measure the Ca K XANES spectrum of this sample.
Questions
Based on all the information above:
1. Based on the sample conditions (Rockic Histosol, Oh1 horizon from Mangfall Mts), what are the expected major Ca-bearing phases and their approximate fractions?
2. What reference spectra should be included in the basis set for Linear Combination Fitting (LCF) of this soil sample?
3. Explain the biogeochemical and pedogenic reasoning for the observed Ca speciation in this Oh1 horizon, specifically addressing the relative abundance of oxalate-bound Ca versus other organic Ca forms, and the presence of clay mineral-sorbed Ca in an organic soil horizon.
Ground Truth
Material: soil
Measurement: Ca K-edge XANES in fluorescence mode at Beamline 8 of the Synchrotron Light Research Institute (SLRI)
Fit method: Linear combination fitting (LCF) in the energy range 4020-4140 eV
Phase fractions: (±10%)
| Phase | Fraction |
|---|---|
| Clay mineral sorbed Ca | 0.385 |
| Oxalate Ca | 0.231 |
| Citrate Ca | 0.385 |
Fit basis (paper's reference spectra):
- Calcite
- Aragonite
- Dolomite
- Apatite
- Brushite
- Monetite
- Anorthite
- Augite
- Epidote
- Ca adsorbed to montmorillonite
- Gypsum
- Anhydrite
- Fluorite
- Sinjarite
- Ca formate
- Ca acetate
- Ca citrate
- Ca oxalate
- Ca lactate
- Ca pectate
- Ca phytate
Source evidence: Table 6, page 208
Key reasoning: In the Histosols, the contribution of oxalate-bound Ca decreases with soil depth, SOM age, and SOM decomposition status, leading to non-oxalate organic Ca (like citrate) dominating in the Oh horizons. Furthermore, up to 40% of total Ca is adsorbed to clay minerals in these organic surface horizons. This is explained by the slow accrual of these horizons over a long period, which was accompanied by continuous aeolian silicate dust deposition, providing mineral constituents for Ca adsorption.
Reasoning source: Results section (page 205) and Discussion section (pages 217-218)
Scoring Rubric (total: 100 pts)
| Q | Type | Max | Question | Reference Answer | Scoring Criteria |
|---|---|---|---|---|---|
| q1 | quantification | 40 | Based on the sample conditions (Rockic Histosol, Oh1 horizon from Mangfall Mts), what are the expected major Ca-bearing phases and their approximate fractions? | The expected major Ca-bearing phases in this Rockic Histosol Oh1 horizon are clay mineral sorbed Ca (38.5%), citrate Ca (38.5%), and oxalate Ca (23.1%), with an uncertainty of 10%. These specific fractions arise because, in Histosols, the contribution of oxalate-bound Ca decreases with soil depth, soil organic matter (SOM) age, and SOM decomposition status, allowing non-oxalate organic Ca forms like citrate to dominate in the Oh horizons. Additionally, the high fraction of clay mineral sorbed Ca (nearly 40%) in this organic surface horizon results from the slow accrual of the horizon over a long period. This slow formation was accompanied by continuous aeolian silicate dust deposition, which provided the necessary mineral constituents for significant Ca adsorption. | Full points for identifying Clay mineral sorbed Ca (~35-40%), Citrate Ca / non-oxalate organic Ca (~35-40%), and Oxalate Ca (~20-25%). Partial points for identifying the correct phases without accurate fractions. |
| q2 | identification | 20 | What reference spectra should be included in the basis set for Linear Combination Fitting (LCF) of this soil sample? | The basis set for Linear Combination Fitting (LCF) should include Calcite, Aragonite, Dolomite, Apatite, Brushite, Monetite, Anorthite, Augite, Epidote, Ca adsorbed to montmorillonite, Gypsum, Anhydrite, Fluorite, Sinjarite, Ca formate, Ca acetate, Ca citrate, Ca oxalate, Ca lactate, Ca pectate, and Ca phytate. This comprehensive set of mineral, organic, and adsorbed references is necessary to capture the complex speciation of the Rockic Histosol Oh1 horizon based on its pedogenic conditions. Specifically, organic references like Ca citrate and Ca oxalate are required because non-oxalate organic Ca dominates over oxalate-bound Ca as soil organic matter ages and decomposes in Oh horizons. Furthermore, mineral and adsorbed references like Ca adsorbed to montmorillonite must be included because continuous aeolian silicate dust deposition during the slow accrual of this horizon provides mineral constituents that account for a large portion of the adsorbed Ca. | Full points for listing a comprehensive set of Ca reference compounds relevant to soils, including various organic Ca forms (oxalate, citrate, pectate, phytate), clay-adsorbed Ca (e.g., Ca-montmorillonite), and inorganic minerals (carbonates, silicates, phosphates, sulfates). |
| q3 | reasoning | 40 | Explain the biogeochemical and pedogenic reasoning for the observed Ca speciation in this Oh1 horizon, specifically addressing the relative abundance of oxalate-bound Ca versus other organic Ca forms, and the presence of clay mineral-sorbed Ca in an organic soil horizon. | In the Oh1 horizon of this Rockic Histosol, the Ca speciation is dominated by clay mineral sorbed Ca (38.5%) and citrate Ca (38.5%), with a smaller fraction of oxalate Ca (23.1%). The lower relative abundance of oxalate-bound Ca compared to other organic forms like citrate occurs because oxalate-bound Ca decreases with increasing soil depth, soil organic matter (SOM) age, and SOM decomposition status. As the SOM decomposes in the Oh horizon, non-oxalate organic Ca forms become the dominant organic phases. Despite being an organic surface horizon, a large portion of the total Ca is adsorbed to clay minerals due to the slow accrual of these horizons over a long period. This slow formation was accompanied by continuous aeolian silicate dust deposition, which introduced the mineral constituents necessary for clay mineral Ca adsorption. | Full points for explaining that (1) oxalate-bound Ca decreases with SOM age and decomposition (depth), making non-oxalate organic Ca dominant in Oh horizons, and (2) the significant presence of clay mineral-sorbed Ca in this organic horizon is due to continuous aeolian silicate dust deposition over the long-term accrual of the horizon. |
Review
#242
soil
Ca K
▶
LLM Prompt
Sample Information
Material: soil
Sample Origin: Mangfall Mts, German Alps, Germany
Sample-Specific Conditions
- Soil horizon: Oh2
- Rockic Histosol, Oh2 horizon
Measurement
We plan to measure the Ca K XANES spectrum of this sample.
Questions
Based on all the information above:
1. Based on the sample conditions (Rockic Histosol, Oh2 horizon from the Mangfall Mts), identify the expected Ca-bearing phases and estimate their approximate relative fractions.
2. What specific reference spectra should be included in a linear combination fitting (LCF) analysis to accurately model the Ca K-edge XANES spectrum of this soil horizon?
3. Explain the physical and biogeochemical reasoning for the observed phase composition in this specific horizon, particularly focusing on why oxalate-bound Ca is a minor component compared to other organic Ca forms.
Ground Truth
Material: soil
Measurement: Ca K-edge XANES in fluorescence mode at Beamline 8 of the Synchrotron Light Research Institute (SLRI)
Fit method: Linear combination fitting (LCF)
Phase fractions: (±10%)
| Phase | Fraction |
|---|---|
| Clay mineral sorbed Ca | 0.093 |
| Oxalate Ca | 0.167 |
| Citrate Ca | 0.37 |
| Pectate Ca | 0.185 |
| Phytate Ca | 0.185 |
Fit basis (paper's reference spectra):
- Ca adsorbed to montmorillonite
- Ca oxalate
- Ca citrate
- Ca pectate
- Ca phytate
Source evidence: Table 6, page 208
Key reasoning: In the thick organic surface layers (Rockic Histosols) formed on calcareous parent material, the majority of soil Ca is organically bound. With progressive aging and microbial decomposition of forest floor SOM from L to Of and Oh layers, the contribution of plant-derived oxalate-bound Ca decreases markedly due to rapid microbial decomposition. Consequently, in the older Oh2 horizon, non-oxalate organic Ca forms such as Ca citrate, Ca pectate, and Ca phytate dominate the Ca speciation. A small amount of clay mineral-adsorbed Ca is also present, which is attributed to continuous aeolian silicate dust deposition over the long-term accrual of the organic horizons.
Reasoning source: Results (Organic mountain soils formed on calcareous parent material, page 203) and Discussion (Speciation of organically bound soil Ca as affected by plant input and microbial turnover, pages 215-217)
Scoring Rubric (total: 100 pts)
| Q | Type | Max | Question | Reference Answer | Scoring Criteria |
|---|---|---|---|---|---|
| q1 | quantification | 40 | Based on the sample conditions (Rockic Histosol, Oh2 horizon from the Mangfall Mts), identify the expected Ca-bearing phases and estimate their approximate relative fractions. | The expected Ca-bearing phases in this Rockic Histosol Oh2 horizon are Citrate Ca (37%), Pectate Ca (18.5%), Phytate Ca (18.5%), Oxalate Ca (16.7%), and Clay mineral sorbed Ca (9.3%), with an estimated uncertainty of 10%. These specific fractions result from the progressive aging and microbial decomposition of soil organic matter in this older Oh2 horizon. Because plant-derived oxalate is rapidly decomposed by microbes, its fraction decreases markedly compared to younger horizons, allowing non-oxalate organic forms like citrate, pectate, and phytate to dominate the Ca speciation. Additionally, the minor fraction of clay-sorbed Ca arises from continuous aeolian silicate dust deposition over the long-term accrual of these thick organic surface layers. | Full credit for identifying the dominance of organic Ca forms (citrate, pectate, phytate) with a minor contribution of oxalate and clay-sorbed Ca, and providing fractions within ±10% of the ground truth values. |
| q2 | identification | 30 | What specific reference spectra should be included in a linear combination fitting (LCF) analysis to accurately model the Ca K-edge XANES spectrum of this soil horizon? | To accurately model the Ca K-edge XANES spectrum of this soil horizon using linear combination fitting (LCF), the reference spectra should include Ca citrate, Ca pectate, Ca phytate, Ca oxalate, and Ca adsorbed to montmorillonite. These specific references are required because the sample is a thick organic surface layer (Rockic Histosol) where the majority of soil Ca is organically bound. Given that this is an older Oh2 horizon, rapid microbial decomposition has depleted plant-derived oxalate, making non-oxalate organic forms like citrate, pectate, and phytate the dominant phases. Furthermore, a reference for clay mineral-adsorbed Ca (montmorillonite) must be included to account for the continuous aeolian silicate dust deposition that occurs during the long-term accrual of these organic horizons. | Full credit for listing the exact basis components used for this sample: Ca adsorbed to clay (montmorillonite), Ca oxalate, Ca citrate, Ca pectate, and Ca phytate. |
| q3 | reasoning | 30 | Explain the physical and biogeochemical reasoning for the observed phase composition in this specific horizon, particularly focusing on why oxalate-bound Ca is a minor component compared to other organic Ca forms. | In the thick organic surface layers of Rockic Histosols formed on calcareous parent material, the majority of soil Ca is organically bound. As the forest floor soil organic matter undergoes progressive aging and microbial decomposition from L to Of and Oh layers, the biogeochemical composition shifts significantly. In this older Oh2 horizon, plant-derived oxalate-bound Ca becomes a minor component (16.7%) because it is subjected to rapid microbial decomposition. Consequently, non-oxalate organic Ca forms, such as Ca citrate, Ca pectate, and Ca phytate, dominate the speciation. Finally, a small physical contribution of clay mineral-adsorbed Ca is observed due to continuous aeolian silicate dust deposition over the long-term accrual of the organic horizon. | Full credit for explaining that progressive aging and microbial decomposition in the Oh layers lead to the rapid breakdown of plant-derived Ca oxalate, resulting in the dominance of more stable non-oxalate organic Ca forms (citrate, pectate, phytate), and mentioning that clay-sorbed Ca originates from aeolian dust deposition. |
Review
#243
soil
Ca K
▶
LLM Prompt
Sample Information
Material: soil
Sample Origin: Mangfall Mts, German Alps, Germany
Sample-Specific Conditions
- Soil horizon: Oh3
- Rockic Histosol, Oh3 horizon
Measurement
We plan to measure the Ca K XANES spectrum of this sample.
Questions
Based on all the information above:
1. Based on the sample conditions (Mangfall Mts, Rockic Histosol, Oh3 horizon), what are the expected Ca-bearing phases and their approximate mass fractions?
2. What reference spectra (basis functions) should be included in the linear combination fitting (LCF) analysis to properly speciate Ca in this forest soil sample?
3. Explain the biogeochemical reasoning for the expected Ca speciation in this specific horizon (Oh3 of a Rockic Histosol), particularly regarding the fate of Ca oxalate and the plausibility of the inorganic fractions.
Ground Truth
Material: soil
Measurement: Ca K-edge XANES, fluorescence mode, Beamline 8 of the Synchrotron Light Research Institute (SLRI)
Fit method: Linear combination fitting (LCF)
Phase fractions: (±10%)
| Phase | Fraction |
|---|---|
| Carbonate Ca | 0.162 |
| Clay mineral sorbed Ca | 0.162 |
| Citrate Ca | 0.189 |
| Pectate Ca | 0.081 |
| Phytate Ca | 0.405 |
Fit basis (paper's reference spectra):
- Calcite
- Dolomite
- Aragonite
- Apatite
- Brushite
- Monetite
- Anorthite
- Augite
- Epidote
- Ca adsorbed to montmorillonite
- Gypsum
- Anhydrite
- Fluorite
- Sinjarite
- Ca formate
- Ca acetate
- Ca citrate
- Ca oxalate
- Ca lactate
- Ca pectate
- Ca phytate
Source evidence: Table 6, page 208
Key reasoning: In the older, lower sections of the thick Rockic Histosol O layers (Oh3), oxalate-bound Ca is completely absent because plant-synthesized Ca oxalate is rapidly decomposed by microbes during long-term O layer aging (up to 150 years). Consequently, organically bound Ca is dominated by more stable forms like Ca phytate, citrate, and pectate. While LCF assigns significant fractions to clay mineral-bound Ca and carbonate Ca, the authors note that the large clay mineral-bound Ca fraction is not plausible for this highly organic horizon (>460 mg OC/g) and is likely an artifact caused by the bridging cation function of Ca2+ between SOM and clay minerals, which complicates LCF assignments.
Reasoning source: Pages 216-218 (Sections: 'The fate of Ca oxalate in calcareous and silicate soils' and 'Differentiation of organically and inorganically bound exchangeable soil Ca')
Scoring Rubric (total: 100 pts)
| Q | Type | Max | Question | Reference Answer | Scoring Criteria |
|---|---|---|---|---|---|
| q1 | quantification | 40 | Based on the sample conditions (Mangfall Mts, Rockic Histosol, Oh3 horizon), what are the expected Ca-bearing phases and their approximate mass fractions? | The expected Ca-bearing phases and their approximate mass fractions are Phytate Ca (40.5%), Citrate Ca (18.9%), Carbonate Ca (16.2%), Clay mineral sorbed Ca (16.2%), and Pectate Ca (8.1%), with an uncertainty of 10%. These specific fractions arise because in the older, lower Oh3 horizon of this Rockic Histosol, plant-synthesized Ca oxalate is completely decomposed by microbes during long-term aging, leaving behind more stable organically bound forms like phytate, citrate, and pectate. Furthermore, the 16.2% fraction assigned to clay mineral-bound Ca is likely an artifact rather than a true representation, caused by Ca2+ acting as a bridging cation between soil organic matter and clay minerals in this highly organic horizon. | Full points for identifying Phytate Ca as the dominant organic phase (~40%), with significant contributions from Citrate Ca (~19%), Carbonate Ca (~16%), Clay mineral sorbed Ca (~16%), and Pectate Ca (~8%). Deduct points for missing major phases or incorrectly including Ca oxalate. |
| q2 | identification | 20 | What reference spectra (basis functions) should be included in the linear combination fitting (LCF) analysis to properly speciate Ca in this forest soil sample? | The linear combination fitting (LCF) analysis should include a comprehensive basis set of inorganic and organic Ca references: Calcite, Dolomite, Aragonite, Apatite, Brushite, Monetite, Anorthite, Augite, Epidote, Ca adsorbed to montmorillonite, Gypsum, Anhydrite, Fluorite, Sinjarite, Ca formate, Ca acetate, Ca citrate, Ca oxalate, Ca lactate, Ca pectate, and Ca phytate. This broad set of references is necessary because the Oh3 horizon of a Rockic Histosol contains a complex mixture of both mineral and organic components that change during long-term aging. Specifically, organic references like phytate, citrate, pectate, and oxalate are required to track the microbial decomposition of plant-synthesized Ca oxalate and identify the remaining stable organic Ca forms, while inorganic and clay references are needed to account for carbonate Ca and the bridging cation function of Ca2+ between soil organic matter and clay minerals. | Full points for listing a comprehensive set of relevant soil Ca references, including carbonates (calcite, dolomite), primary silicates, clay mineral-adsorbed Ca, and various organic Ca forms (oxalate, citrate, pectate, phytate). |
| q3 | reasoning | 40 | Explain the biogeochemical reasoning for the expected Ca speciation in this specific horizon (Oh3 of a Rockic Histosol), particularly regarding the fate of Ca oxalate and the plausibility of the inorganic fractions. | In the older, lower Oh3 horizon of the Rockic Histosol, Ca oxalate is completely absent because plant-synthesized Ca oxalate is rapidly decomposed by microbes during long-term O layer aging (up to 150 years). As a result, the organically bound Ca pool is dominated by more stable organic forms, specifically Ca phytate, citrate, and pectate. Although LCF analysis assigns significant fractions to carbonate Ca and clay mineral-bound Ca, the large clay mineral-bound fraction is not plausible for this highly organic horizon (>460 mg OC/g). Instead, this apparent clay-sorbed fraction is likely an artifact resulting from the bridging cation function of Ca2+ between soil organic matter and clay minerals, which complicates the spectral assignments. | Full points for explaining that Ca oxalate is rapidly decomposed during long-term O layer aging, leading to its absence and the dominance of phytate/citrate/pectate. Must also mention that the high clay mineral-bound Ca fraction assigned by LCF is likely an artifact due to Ca2+ acting as a bridging cation between SOM and clay minerals in this highly organic horizon. |
Review
#244
soil
Ca K
▶
LLM Prompt
Sample Information
Material: soil
Sample Origin: Wetterstein, German Alps, Germany
Sample-Specific Conditions
- Soil horizon: L
- Rockic Histosol, L horizon
Measurement
We plan to measure the Ca K XANES spectrum of this sample.
Questions
Based on all the information above:
1. Based on the sample conditions (L horizon of a Rockic Histosol in a mountain forest), what are the expected dominant Ca phases and their approximate relative fractions?
2. What specific reference spectra should be included in the basis set for Linear Combination Fitting (LCF) of the Ca K-edge XANES spectrum for this L horizon soil sample?
3. Explain the physical and biological reasoning for why the Ca speciation in this L horizon is dominated by these specific organic Ca phases, and why inorganic Ca phases are absent.
Ground Truth
Material: soil
Measurement: Ca K-edge XANES in fluorescence mode at Beamline 8 of the Synchrotron Light Research Institute (SLRI)
Fit method: Linear combination fitting (LCF)
Phase fractions: (±10%)
| Phase | Fraction |
|---|---|
| Oxalate Ca | 0.195 |
| Citrate Ca | 0.345 |
| Pectate Ca | 0.46 |
Fit basis (paper's reference spectra):
- Ca oxalate
- Ca citrate
- Ca pectate
Source evidence: Table 6, page 208
Key reasoning: The L layer (litter layer) of the forest soil is dominated entirely by organically bound Ca, specifically Ca pectate, Ca citrate, and Ca oxalate. Organically bound Ca enters the forest floor surface via litter fall (foliage, seeds, twigs, bark particles) deposited on and being converted into L layers. The Ca speciation in the L layers strongly reflects the input of fresh plant litter, which is rich in plant-synthesized Ca carboxylates like Ca oxalate and Ca pectate.
Reasoning source: Section 'Speciation of organically bound soil Ca as affected by plant input and microbial turnover', page 215
Scoring Rubric (total: 100 pts)
| Q | Type | Max | Question | Reference Answer | Scoring Criteria |
|---|---|---|---|---|---|
| q1 | quantification | 40 | Based on the sample conditions (L horizon of a Rockic Histosol in a mountain forest), what are the expected dominant Ca phases and their approximate relative fractions? | The expected dominant Ca phases in this L horizon soil sample are Pectate Ca (0.46), Citrate Ca (0.345), and Oxalate Ca (0.195), with an estimated uncertainty of 10%. These specific fractions result from the sample being located in the L layer (litter layer) of a Rockic Histosol, which is dominated entirely by organically bound Ca. Because this horizon receives fresh litter fall such as foliage, seeds, twigs, and bark, its composition strongly reflects the direct input of these fresh plant materials, which are naturally rich in plant-synthesized Ca carboxylates. | Full points for identifying Ca pectate, Ca citrate, and Ca oxalate as the dominant phases with fractions around 46%, 35%, and 20%, respectively. Deduct points for missing phases, including inorganic phases (like carbonates or silicates which should be absent in the L layer), or for fractions that deviate by more than 10-15%. |
| q2 | identification | 30 | What specific reference spectra should be included in the basis set for Linear Combination Fitting (LCF) of the Ca K-edge XANES spectrum for this L horizon soil sample? | The basis set for Linear Combination Fitting (LCF) of the Ca K-edge XANES spectrum should include reference spectra for Ca oxalate, Ca citrate, and Ca pectate. These specific reference phases are expected because the sample originates from the L horizon of a forest soil, which functions as the surface litter layer. The physical deposition of fresh plant litter (foliage, twigs, bark) onto this layer means the Ca speciation is entirely dictated by plant-synthesized Ca carboxylates, requiring these organic Ca references to accurately fit the spectrum. | Full points for listing Ca pectate, Ca citrate, and Ca oxalate. Deduct points for suggesting inorganic reference spectra (e.g., calcite, dolomite, augite) since the L horizon is composed of fresh organic litter. |
| q3 | reasoning | 30 | Explain the physical and biological reasoning for why the Ca speciation in this L horizon is dominated by these specific organic Ca phases, and why inorganic Ca phases are absent. | The Ca speciation in the L horizon of this Rockic Histosol is dominated by Ca pectate, Ca citrate, and Ca oxalate because this horizon constitutes the forest floor's litter layer. Biologically, Ca enters this surface layer directly via fresh litter fall, including foliage, seeds, twigs, and bark particles deposited by the forest canopy. Because this fresh plant material is inherently rich in plant-synthesized Ca carboxylates, the soil horizon's speciation strongly reflects this fresh organic input. Consequently, inorganic Ca phases are absent, as the Ca pool is entirely defined by the organically bound Ca compounds recently deposited by the vegetation. | Full points for explaining that the L horizon consists of fresh litter fall (foliage, twigs, etc.) deposited on the forest floor, and that plants synthesize and accumulate Ca as organic carboxylates (like Ca oxalate and Ca pectate) in their tissues. Inorganic soil minerals have not yet been mixed into this uppermost fresh litter layer. |
Review
#245
soil
Ca K
▶
LLM Prompt
Sample Information
Material: soil
Sample Origin: Wetterstein, German Alps, Germany
Sample-Specific Conditions
- Soil horizon: Of
- Rockic Histosol, Of horizon
Measurement
We plan to measure the Ca K XANES spectrum of this sample.
Questions
Based on all the information above:
1. Based on the sample conditions (Rockic Histosol, Of horizon from the Wetterstein site), what candidate reference spectra should be included in a linear combination fitting (LCF) analysis of its Ca K-edge XANES spectrum?
2. Estimate the relative fractions of the major Ca phases in this Of horizon soil sample. Provide your answer as percentages.
3. Explain the physical and biogeochemical reasoning for the presence and relative abundance of the dominant Ca phases in this specific soil horizon (Of horizon of a Rockic Histosol). Specifically, address why both organic Ca forms (like oxalate) and inorganic forms (like clay-sorbed Ca) are present in this organic surface layer.
Ground Truth
Material: soil
Measurement: Ca K-edge XANES, fluorescence mode, Beamline 8 of SLRI
Fit method: Linear combination fitting (LCF)
Phase fractions: (±10%)
| Phase | Fraction |
|---|---|
| Clay mineral sorbed Ca | 0.286 |
| Oxalate Ca | 0.357 |
| Citrate Ca | 0.238 |
| Phytate Ca | 0.119 |
Fit basis (paper's reference spectra):
- calcite
- aragonite
- dolomite
- apatite
- brushite
- monetite
- anorthite
- augite
- epidote
- Ca adsorbed to montmorillonite
- gypsum
- anhydrite
- fluorite
- sinjarite
- Ca formate
- Ca acetate
- Ca citrate
- Ca oxalate
- Ca lactate
- Ca pectate
- Ca phytate
Source evidence: Table 6, page 208
Key reasoning: In the Rockic Histosol (Wetterstein), the organic surface horizons have accrued slowly over a long-term period. The Of horizon is dominated by organically bound Ca (oxalate, citrate, phytate) and clay mineral-sorbed Ca. Oxalate-bound Ca is a major component due to litter fall and in situ synthesis by biogenic oxalic acid, but its contribution decreases with depth (ageing) due to microbial decomposition. The surprising presence of clay mineral-sorbed Ca in this organic horizon is explained by continuous aeolian silicate dust deposition during the long-term accrual of the organic surface layers.
Reasoning source: Results section (page 205) and Discussion sections 'The fate of Ca oxalate in calcareous and silicate soils' (page 216) and 'Differentiation of organically and inorganically bound exchangeable soil Ca' (pages 217-218)
Scoring Rubric (total: 100 pts)
| Q | Type | Max | Question | Reference Answer | Scoring Criteria |
|---|---|---|---|---|---|
| q1 | identification | 20 | Based on the sample conditions (Rockic Histosol, Of horizon from the Wetterstein site), what candidate reference spectra should be included in a linear combination fitting (LCF) analysis of its Ca K-edge XANES spectrum? | For the linear combination fitting (LCF) analysis of the Ca K-edge XANES spectrum of this Rockic Histosol Of horizon soil, the candidate reference spectra should include a comprehensive suite of inorganic and organic Ca phases. The basis set must include calcite, aragonite, dolomite, apatite, brushite, monetite, anorthite, augite, epidote, Ca adsorbed to montmorillonite, gypsum, anhydrite, fluorite, and sinjarite, as well as organic forms including Ca formate, Ca acetate, Ca citrate, Ca oxalate, Ca lactate, Ca pectate, and Ca phytate. These specific references are required because this organic surface horizon has accrued slowly over a long period, accumulating both biogenic organic matter and inorganic materials. The organic references account for Ca bound to organic acids from litter fall and biogenic synthesis, while the inorganic references, particularly clay-sorbed Ca, are necessary to capture the effects of continuous aeolian silicate dust deposition into the organic layer. | Full credit for identifying a mix of organic Ca compounds (e.g., Ca oxalate, Ca citrate, Ca phytate) and clay mineral-sorbed Ca. Partial credit for mentioning only organic or only inorganic phases. |
| q2 | quantification | 40 | Estimate the relative fractions of the major Ca phases in this Of horizon soil sample. Provide your answer as percentages. | The relative fractions of the major Ca phases in this Of horizon sample are approximately 35.7% Oxalate Ca, 28.6% Clay mineral sorbed Ca, 23.8% Citrate Ca, and 11.9% Phytate Ca, with an estimated uncertainty of 10%. These specific values result from the biogeochemical conditions of the slowly accruing organic surface layer, which is naturally dominated by organically bound Ca. The high fraction of oxalate-bound Ca (35.7%) is driven by litter fall and in situ synthesis by biogenic oxalic acid, which remains abundant in this upper horizon before microbial decomposition reduces it at greater depths. Furthermore, the significant 28.6% fraction of clay mineral-sorbed Ca is present because continuous aeolian silicate dust deposition occurred simultaneously with the long-term accrual of the organic matter. | Full credit if the predicted fractions are within ±10-15% of the ground truth: ~36% Oxalate Ca, ~29% Clay mineral sorbed Ca, ~24% Citrate Ca, and ~12% Phytate Ca. Partial credit if the dominant phases (Oxalate and Clay-sorbed Ca) are correctly identified as the major components. |
| q3 | reasoning | 40 | Explain the physical and biogeochemical reasoning for the presence and relative abundance of the dominant Ca phases in this specific soil horizon (Of horizon of a Rockic Histosol). Specifically, address why both organic Ca forms (like oxalate) and inorganic forms (like clay-sorbed Ca) are present in this organic surface layer. | In the Of horizon of this Rockic Histosol from the Wetterstein site, the dominant Ca phases are a mixture of organically bound Ca (oxalate, citrate, phytate) and inorganic clay mineral-sorbed Ca. The high abundance of organic forms, particularly Ca oxalate, is driven by continuous litter fall and in situ synthesis by biogenic oxalic acid within the slowly accruing organic surface layer. This oxalate fraction is prominent in the upper Of horizon but is known to decrease with depth and ageing due to microbial decomposition. The surprising presence of inorganic clay mineral-sorbed Ca in this highly organic horizon is explained by continuous aeolian silicate dust deposition that mixed with the organic surface layers during their long-term accrual. | Full credit for explaining that oxalate-bound Ca dominates due to litter fall and biogenic synthesis, but is subject to microbial decomposition with depth/ageing. Must also explain that the presence of clay mineral-sorbed Ca in this organic horizon is due to continuous aeolian silicate dust deposition over the long-term accrual of the surface layer. |
Review
#246
soil
Ca K
▶
LLM Prompt
Sample Information
Material: soil
Sample Origin: Wetterstein, German Alps, Germany
Sample-Specific Conditions
- Soil horizon: Oh1
- Rockic Histosol, Oh1 horizon
Measurement
We plan to measure the Ca K XANES spectrum of this sample.
Questions
Based on all the information above:
1. Based on the sample's origin as an Oh1 horizon of a Rockic Histosol, what candidate reference spectra should be included in a linear combination fitting (LCF) analysis of its Ca K-edge XANES spectrum?
2. Estimate the relative fractions of the major Ca species in this soil horizon.
3. Explain the biogeochemical and pedogenic reasoning for the presence of a significant clay mineral-sorbed Ca fraction and a low Ca oxalate fraction in this specific organic soil horizon.
Ground Truth
Material: soil
Measurement: Ca K-edge XANES in fluorescence mode at Beamline 8 of the Synchrotron Light Research Institute (SLRI)
Fit method: Linear combination fitting (LCF)
Phase fractions: (±10%)
| Phase | Fraction |
|---|---|
| Clay mineral sorbed Ca | 0.287 |
| Oxalate Ca | 0.059 |
| Citrate Ca | 0.28 |
| Phytate Ca | 0.374 |
Fit basis (paper's reference spectra):
- Ca adsorbed to montmorillonite
- Ca oxalate
- Ca citrate
- Ca phytate
Source evidence: Table 6, page 208
Key reasoning: The Oh1 horizon of the Wetterstein Rockic Histosol is a thick organic surface layer that has accrued slowly over a long period, accompanied by continuous aeolian silicate dust deposition, which explains the significant fraction of clay mineral-sorbed Ca despite it being an organic horizon. Carbonate-bound Ca is completely absent due to intensive weathering and organic matter accumulation. The organically bound Ca is dominated by phytate and citrate, with a low fraction of oxalate (5.9%) because progressive aging and microbial decomposition of Ca oxalate occur with increasing soil depth.
Reasoning source: Results (Organic mountain soils formed on calcareous parent material, page 203) and Discussion (Speciation of organically bound soil Ca as affected by plant input and microbial turnover, page 215; Differentiation of organically and inorganically bound exchangeable soil Ca, page 217)
Scoring Rubric (total: 100 pts)
| Q | Type | Max | Question | Reference Answer | Scoring Criteria |
|---|---|---|---|---|---|
| q1 | identification | 30 | Based on the sample's origin as an Oh1 horizon of a Rockic Histosol, what candidate reference spectra should be included in a linear combination fitting (LCF) analysis of its Ca K-edge XANES spectrum? | The candidate reference spectra for the linear combination fitting (LCF) analysis should include Ca adsorbed to montmorillonite, Ca oxalate, Ca citrate, and Ca phytate. These specific phases are expected because the Oh1 horizon of this Rockic Histosol is a thick organic surface layer, leading to organically bound Ca dominated by phytate, citrate, and oxalate. Additionally, continuous aeolian silicate dust deposition over a long period introduces clay minerals, explaining the need for a clay mineral-sorbed Ca reference. Carbonate references are excluded because intensive weathering and organic matter accumulation in this horizon have completely removed carbonate-bound Ca. | Full credit for identifying clay mineral-sorbed Ca and various organic Ca forms (phytate, citrate, oxalate). Partial credit if carbonates are incorrectly suggested as major components, as they are typically absent in these highly weathered organic horizons. |
| q2 | quantification | 35 | Estimate the relative fractions of the major Ca species in this soil horizon. | The relative fractions of Ca species in this soil horizon are estimated to be 37.4% Phytate Ca, 28.7% Clay mineral sorbed Ca, 28.0% Citrate Ca, and 5.9% Oxalate Ca, with an uncertainty of 10%. These specific values result from the pedogenic conditions of the Oh1 horizon, where continuous aeolian silicate dust deposition accounts for the substantial fraction of clay mineral-sorbed Ca despite it being an organic layer. The organically bound Ca is dominated by phytate and citrate due to the slow, long-term accumulation of organic matter. Meanwhile, the oxalate fraction is notably low (5.9%) because progressive aging and microbial decomposition of Ca oxalate occur as soil depth increases. | Full credit for estimating ~35-40% phytate, ~25-30% citrate, ~25-30% clay mineral-sorbed Ca, and <10% oxalate. Partial credit for identifying organic Ca as the dominant pool alongside a significant clay-sorbed component, while correctly noting the absence of carbonates. |
| q3 | reasoning | 35 | Explain the biogeochemical and pedogenic reasoning for the presence of a significant clay mineral-sorbed Ca fraction and a low Ca oxalate fraction in this specific organic soil horizon. | The significant clay mineral-sorbed Ca fraction (28.7%) in this organic Oh1 horizon arises from continuous aeolian silicate dust deposition that accompanied the slow, long-term accrual of the thick organic surface layer. Despite being an organic horizon, this dust input provides the necessary clay minerals for Ca sorption. Conversely, the low Ca oxalate fraction (5.9%) is the result of progressive aging and microbial decomposition of Ca oxalate that occurs with increasing soil depth. Furthermore, intensive weathering and organic matter accumulation in this Rockic Histosol completely eliminate carbonate-bound Ca, leaving the remaining Ca pool dominated by these specific organic and clay-sorbed species. | Full credit for explaining that aeolian silicate dust deposition over long periods contributes to the mineral content (explaining the clay-sorbed Ca) and that progressive aging and microbial decomposition of organic matter with depth leads to the depletion of Ca oxalate. |
Review
#247
soil
Ca K
▶
LLM Prompt
Sample Information
Material: soil
Sample Origin: Wetterstein, German Alps, Germany
Sample-Specific Conditions
- Soil horizon: Oh2
- Rockic Histosol, Oh2 horizon
Measurement
We plan to measure the Ca K XANES spectrum of this sample.
Questions
Based on all the information above:
1. Based on the sample conditions (Rockic Histosol, Oh2 horizon from Wetterstein), what are the expected dominant Ca phases and their approximate fractions?
2. What reference spectra would be required to successfully fit the Ca K-edge XANES spectrum of this sample using linear combination fitting?
3. Explain the biogeochemical reasoning for the expected Ca speciation in this specific soil horizon, particularly regarding the absence of Ca oxalate.
Ground Truth
Material: soil
Measurement: Ca K-edge XANES, fluorescence mode, Beamline 8 of the Synchrotron Light Research Institute (SLRI)
Fit method: Linear combination fitting (LCF)
Phase fractions: (±10%)
| Phase | Fraction |
|---|---|
| Citrate Ca | 0.297 |
| Pectate Ca | 0.703 |
Fit basis (paper's reference spectra):
- Ca citrate
- Ca pectate
Source evidence: Table 6, page 208
Key reasoning: The Oh2 horizon of the Wetterstein Rockic Histosol represents an older, more decomposed organic layer. Progressive aging and microbial decomposition of forest floor SOM from L to Of and Oh layers is associated with a marked decrease in oxalate-bound Ca. Ca oxalate is rapidly decomposed compared to Ca pectate or Ca citrate during long-term O layer ageing, leading to its absence in older sections of the thick Rockic Histosol O layers, where organically bound Ca is largely present as pectate and citrate.
Reasoning source: Section 'Speciation of organically bound soil Ca as affected by plant input and microbial turnover', pages 215-216
Scoring Rubric (total: 100 pts)
| Q | Type | Max | Question | Reference Answer | Scoring Criteria |
|---|---|---|---|---|---|
| q1 | quantification | 40 | Based on the sample conditions (Rockic Histosol, Oh2 horizon from Wetterstein), what are the expected dominant Ca phases and their approximate fractions? | The expected dominant Ca phases in this sample are Ca pectate at approximately 70.3% and Ca citrate at approximately 29.7%, with an estimated uncertainty of 10%. These specific fractions result from the sample originating in the Oh2 horizon of a Wetterstein Rockic Histosol, which represents an older, more decomposed organic layer. During the long-term aging and microbial decomposition of forest floor soil organic matter, Ca oxalate is rapidly decomposed compared to other phases. Consequently, Ca oxalate is absent in this older horizon, leaving the more resistant Ca pectate and Ca citrate to make up the entirety of the organically bound calcium. | Full points for identifying Ca pectate (~70%) and Ca citrate (~30%) as the dominant phases. Partial points for identifying organically bound Ca forms but missing the exact species or fractions. |
| q2 | identification | 20 | What reference spectra would be required to successfully fit the Ca K-edge XANES spectrum of this sample using linear combination fitting? | To successfully fit the Ca K-edge XANES spectrum of this sample using linear combination fitting, reference spectra for Ca citrate and Ca pectate are required. These specific reference phases are expected because the sample is taken from the Oh2 horizon of a Rockic Histosol, an older and highly decomposed organic soil layer. Progressive aging and microbial decomposition in these thick O layers cause a marked decrease in oxalate-bound Ca, which degrades much more rapidly than pectate or citrate. Because the Ca oxalate has been completely decomposed in this older section, the organically bound calcium is exclusively present as the remaining pectate and citrate phases. | Full points for listing Ca pectate and Ca citrate (or general Ca carboxylates/organically bound Ca references). Partial points for including other organic Ca references like Ca oxalate or Ca phytate. |
| q3 | reasoning | 40 | Explain the biogeochemical reasoning for the expected Ca speciation in this specific soil horizon, particularly regarding the absence of Ca oxalate. | The biogeochemical reasoning for the Ca speciation in the Oh2 horizon of the Wetterstein Rockic Histosol is driven by the progressive aging and microbial decomposition of forest floor soil organic matter. As the soil transitions from L to Of and Oh layers, the organic material becomes older and more heavily decomposed. During this long-term aging process, microbes rapidly decompose Ca oxalate compared to other organically bound calcium forms like Ca pectate or Ca citrate. Because of this rapid degradation, Ca oxalate is entirely absent in the older sections of these thick Rockic Histosol O layers, leaving the more stable Ca pectate and Ca citrate as the dominant remaining phases. | Full points for explaining that the Oh2 horizon represents an older, more decomposed organic layer where progressive aging and microbial decomposition lead to the rapid breakdown of Ca oxalate compared to more stable forms like Ca pectate and Ca citrate. |
Review
#248
soil
Ca K
▶
LLM Prompt
Sample Information
Material: soil
Sample Origin: Wetterstein, German Alps, Germany
Sample-Specific Conditions
- Soil horizon: Oh3
- Rockic Histosol, Oh3 horizon
Measurement
We plan to measure the Ca K XANES spectrum of this sample.
Questions
Based on all the information above:
1. Based on the sample conditions (Rockic Histosol, Oh3 horizon, Wetterstein), what are the expected major Ca-bearing phases and their approximate fractions?
2. What candidate reference spectra should be included in a Linear Combination Fitting (LCF) analysis to accurately speciate Ca in this deep organic soil horizon?
3. Explain the biogeochemical reasoning for the observed Ca speciation in this deep organic (Oh3) horizon, particularly focusing on the presence of clay mineral-sorbed Ca and the low proportion of oxalate-bound Ca despite the organic nature of the horizon.
Ground Truth
Material: soil
Measurement: Ca K-edge XANES in fluorescence mode at Beamline 8 of SLRI
Fit method: Linear combination fitting (LCF)
Phase fractions: (±10%)
| Phase | Fraction |
|---|---|
| Clay mineral sorbed Ca | 0.298 |
| Oxalate Ca | 0.079 |
| Citrate Ca | 0.271 |
| Pectate Ca | 0.081 |
| Phytate Ca | 0.271 |
Fit basis (paper's reference spectra):
- Calcite
- Aragonite
- Dolomite
- Apatite
- Brushite
- Monetite
- Anorthite
- Augite
- Epidote
- Ca adsorbed to montmorillonite
- Gypsum
- Anhydrite
- Fluorite
- Sinjarite
- Ca formate
- Ca acetate
- Ca citrate
- Ca oxalate
- Ca lactate
- Ca pectate
- Ca phytate
Source evidence: Table 6, page 208
Key reasoning: In the Oh3 horizon of the Wetterstein Rockic Histosol, carbonate-bound Ca is absent. The horizon consists of 30-60% mineral constituents due to continuous aeolian silicate dust deposition over >1500 years, explaining the large contribution of clay mineral-bound Ca. Organically bound Ca dominates, but the share of oxalate-bound Ca is very low because plant-derived Ca oxalate decomposes rapidly during long-term O layer aging compared to more stable forms like Ca citrate, Ca phytate, and Ca pectate.
Reasoning source: Results (Organic mountain soils formed on calcareous parent material) and Discussion (Differentiation of organically and inorganically bound exchangeable soil Ca; The fate of Ca oxalate in calcareous and silicate soils) sections
Scoring Rubric (total: 100 pts)
| Q | Type | Max | Question | Reference Answer | Scoring Criteria |
|---|---|---|---|---|---|
| q1 | quantification | 40 | Based on the sample conditions (Rockic Histosol, Oh3 horizon, Wetterstein), what are the expected major Ca-bearing phases and their approximate fractions? | The expected major Ca-bearing phases in this Rockic Histosol Oh3 horizon are Clay mineral sorbed Ca (29.8%), Citrate Ca (27.1%), Phytate Ca (27.1%), Pectate Ca (8.1%), and Oxalate Ca (7.9%), with an uncertainty of 10%. These specific fractions result from the unique biogeochemical conditions of this deep organic horizon, where carbonate-bound Ca is completely absent. The high fraction of clay mineral-bound Ca arises because the horizon contains 30-60% mineral constituents from continuous aeolian silicate dust deposition over more than 1500 years. Meanwhile, organically bound Ca dominates the remaining fractions, but the oxalate-bound Ca fraction is notably low because plant-derived Ca oxalate decomposes rapidly during long-term O layer aging, leaving behind more stable organic forms like Ca citrate, phytate, and pectate. | Full points if the answer identifies clay mineral-sorbed Ca (~30%) and a mixture of organic Ca forms (citrate, phytate, pectate, oxalate) making up the remaining ~70%, with oxalate being a minor component (<10%). Partial credit for identifying the general classes (clay-sorbed and organic) without accurate specific organic phase breakdowns. |
| q2 | identification | 30 | What candidate reference spectra should be included in a Linear Combination Fitting (LCF) analysis to accurately speciate Ca in this deep organic soil horizon? | A comprehensive Linear Combination Fitting (LCF) analysis for this soil sample should include a broad basis set of inorganic and organic Ca references. The candidate spectra must include carbonates (Calcite, Aragonite, Dolomite), phosphates (Apatite, Brushite, Monetite), silicates (Anorthite, Augite, Epidote, Ca adsorbed to montmorillonite), sulfates/halides (Gypsum, Anhydrite, Fluorite, Sinjarite), and various organic Ca salts (Ca formate, acetate, citrate, oxalate, lactate, pectate, phytate). These specific references are necessary because the Oh3 horizon of this Rockic Histosol experiences continuous aeolian silicate dust deposition, necessitating silicate and clay mineral references to capture the inorganic mineral constituents. Furthermore, because it is an aging organic layer where plant-derived materials decompose, a wide array of organic Ca standards is required to capture the dominant stable organic phases (citrate, phytate, pectate) and the residual rapidly-decomposing phases (oxalate). | Full points if the answer lists a comprehensive set of organic Ca standards (oxalate, citrate, pectate, phytate, acetate, formate) and inorganic standards (clay mineral-adsorbed Ca, carbonates, primary silicates, phosphates, sulfates) to capture both the expected phases and rule out others. |
| q3 | reasoning | 30 | Explain the biogeochemical reasoning for the observed Ca speciation in this deep organic (Oh3) horizon, particularly focusing on the presence of clay mineral-sorbed Ca and the low proportion of oxalate-bound Ca despite the organic nature of the horizon. | The Ca speciation in the Oh3 horizon of the Wetterstein Rockic Histosol is driven by long-term atmospheric deposition and organic matter degradation. The significant presence of clay mineral-sorbed Ca occurs because this horizon consists of 30-60% mineral constituents, which accumulate due to continuous aeolian silicate dust deposition over more than 1500 years. Although organically bound Ca dominates the overall speciation, the proportion of oxalate-bound Ca is very low. This low oxalate fraction results from the rapid decomposition of plant-derived Ca oxalate during the long-term aging of the O layer. Consequently, the organic Ca pool shifts to be dominated by more stable forms such as Ca citrate, Ca phytate, and Ca pectate, while carbonate-bound Ca is entirely absent from the horizon. | Full points if the answer explains that (1) clay mineral-sorbed Ca is present due to long-term aeolian silicate dust deposition accumulating in the aging organic layer, and (2) oxalate-bound Ca is low because plant-derived Ca oxalate decomposes rapidly during long-term O layer aging compared to more stable organic forms like citrate, phytate, and pectate. |
Review
#249
soil
Ca K
▶
LLM Prompt
Sample Information
Material: soil
Sample Origin: Wetterstein, German Alps, Germany
Sample-Specific Conditions
- Soil horizon: Oh4
- Rockic Histosol, Oh4 horizon
Measurement
We plan to measure the Ca K XANES spectrum of this sample.
Questions
Based on all the information above:
1. Based on the sample conditions (deep organic Oh4 horizon of a Rockic Histosol), what candidate Ca phases should be included in the reference library for linear combination fitting?
2. Estimate the phase fractions of the dominant Ca species in this Oh4 horizon sample.
3. Explain the biogeochemical reasoning for the expected Ca speciation in this deep organic horizon, particularly regarding the fate of Ca oxalate.
Ground Truth
Material: soil
Measurement: Ca K-edge XANES, fluorescence mode, Beamline 8 of SLRI
Fit method: Linear combination fitting (LCF)
Phase fractions: (±10%)
| Phase | Fraction |
|---|---|
| Citrate Ca | 0.386 |
| Pectate Ca | 0.614 |
Fit basis (paper's reference spectra):
- Carbonate (Calcite/Dolomite)
- Clay mineral-sorbed Ca
- Ca oxalate
- Ca citrate (representing non-oxalate/pectate carboxylates)
- Ca pectate
- Ca phytate
Source evidence: Table 6, page 208
Key reasoning: In the deep, older organic horizon (Oh4) of the Wetterstein Histosol, carbonate-bound Ca is absent and all Ca is organically bound. Oxalate-bound Ca, which is present in upper horizons from litter fall, is completely absent here due to rapid microbial decomposition during long-term O layer ageing (up to 1500 years). Consequently, more stable organic forms like Ca pectate and other carboxylates (modeled as Ca citrate) dominate the speciation.
Reasoning source: Results (Organic mountain soils formed on calcareous parent material) page 203; Discussion (The fate of Ca oxalate in calcareous and silicate soils) page 216
Scoring Rubric (total: 100 pts)
| Q | Type | Max | Question | Reference Answer | Scoring Criteria |
|---|---|---|---|---|---|
| q1 | identification | 30 | Based on the sample conditions (deep organic Oh4 horizon of a Rockic Histosol), what candidate Ca phases should be included in the reference library for linear combination fitting? | The reference library for linear combination fitting of this soil sample should include Carbonate (Calcite/Dolomite), Clay mineral-sorbed Ca, Ca oxalate, Ca citrate (representing non-oxalate/pectate carboxylates), Ca pectate, and Ca phytate. These phases are included to account for all potential inorganic and organic Ca pools in the Rockic Histosol profile. Given the specific conditions of the deep, older organic Oh4 horizon from the Wetterstein Alps, carbonate-bound Ca is absent and all Ca is organically bound. Because long-term O layer ageing (up to 1500 years) leads to the rapid microbial decomposition of litter-derived Ca oxalate, the library must include more stable organic forms like Ca pectate and other carboxylates (modeled as Ca citrate) which are expected to dominate the actual speciation. | Full credit for identifying organic Ca forms (pectate, citrate/carboxylates) and noting the likely absence of inorganic forms like carbonates or primary silicates in this purely organic horizon. |
| q2 | quantification | 35 | Estimate the phase fractions of the dominant Ca species in this Oh4 horizon sample. | The dominant Ca species in this Oh4 horizon sample are estimated to be Pectate Ca at 61.4% and Citrate Ca (representing other carboxylates) at 38.6%, with an uncertainty of 10%. These specific values result from the biogeochemical conditions of the deep, older organic horizon of the Wetterstein Histosol, where carbonate-bound Ca is completely absent and all Ca is organically bound. Additionally, while Ca oxalate is typically present in upper horizons from litter fall, it is completely absent here due to rapid microbial decomposition during the long-term ageing of the O layer (up to 1500 years). Consequently, the speciation is entirely dominated by these more stable organic forms, leaving Ca pectate and Ca citrate to make up 100% of the detected Ca pool. | Full credit for estimating ~60% Ca pectate and ~40% Ca citrate (or other non-oxalate carboxylates), and 0% Ca oxalate or inorganic Ca. |
| q3 | reasoning | 35 | Explain the biogeochemical reasoning for the expected Ca speciation in this deep organic horizon, particularly regarding the fate of Ca oxalate. | In the deep, older organic Oh4 horizon of the Wetterstein Rockic Histosol, the Ca speciation is entirely organically bound, with carbonate-bound Ca being completely absent. Although Ca oxalate is typically introduced to upper soil horizons via litter fall, it is completely absent in this deep Oh4 layer. This absence is driven by rapid microbial decomposition that occurs during the long-term ageing of the O layer, which can last up to 1500 years. As a result of this microbial degradation, the less stable Ca oxalate is lost, leaving more stable organic forms like Ca pectate and other carboxylates (modeled as Ca citrate) to dominate the Ca speciation in this specific horizon. | Full credit for explaining that while Ca oxalate is deposited via litterfall in upper horizons, it undergoes rapid microbial decomposition during long-term ageing in deep organic layers, leaving more stable organic forms like Ca pectate and other carboxylates to dominate. |
Review
#250
soil
Ca K
▶
LLM Prompt
Sample Information
Material: soil
Sample Origin: Bad Brückenau, Rhön Mts, Germany
Sample-Specific Conditions
- Soil horizon: L
- Dystric Cambisol, L horizon
Measurement
We plan to measure the Ca K XANES spectrum of this sample.
Questions
Based on all the information above:
1. Based on the sample conditions (L horizon of a Dystric Cambisol under a mature beech forest), what are the expected major Ca phases, and what are their estimated fractions?
2. What reference spectra would be necessary to include in a linear combination fitting (LCF) basis set to accurately model the Ca speciation in this L horizon soil sample?
3. Explain the biogeochemical reasoning for why Ca oxalate is expected to be the dominant Ca species in the L horizon of this specific forest soil.
Ground Truth
Material: soil
Measurement: Ca K-edge XANES, fluorescence mode, Beamline 8 at SLRI
Fit method: Linear combination fitting (LCF)
Phase fractions: (±10%)
| Phase | Fraction |
|---|---|
| Clay mineral sorbed Ca | 0.222 |
| Oxalate Ca | 0.556 |
| Citrate Ca | 0.222 |
Fit basis (paper's reference spectra):
- Calcite
- Aragonite
- Dolomite
- Apatite
- Brushite
- Monetite
- Anorthite
- Augite
- Epidote
- Ca adsorbed to montmorillonite
- Gypsum
- Anhydrite
- Fluorite
- Sinjarite
- Ca formate
- Ca acetate
- Ca citrate
- Ca oxalate
- Ca lactate
- Ca pectate
- Ca phytate
Source evidence: Table 6, page 208
Key reasoning: The L horizon (litter layer) of this forest soil receives organically bound Ca primarily via litter fall from the mature Fagus sylvatica (beech) stand. Broadleaf trees synthesize large amounts of Ca oxalate and deposit it in foliage vacuoles, which is then transferred to the forest floor upon leaf shedding. Consequently, the Ca speciation in the L layer is dominated by organically bound Ca, particularly Ca oxalate, along with other carboxylates (represented by Ca citrate) and some clay mineral-sorbed Ca.
Reasoning source: Page 215, 'Speciation of organically bound soil Ca as affected by plant input and microbial turnover' and Page 216, 'The fate of Ca oxalate in calcareous and silicate soils'
Scoring Rubric (total: 100 pts)
| Q | Type | Max | Question | Reference Answer | Scoring Criteria |
|---|---|---|---|---|---|
| q1 | quantification | 40 | Based on the sample conditions (L horizon of a Dystric Cambisol under a mature beech forest), what are the expected major Ca phases, and what are their estimated fractions? | The expected major Ca phases in this L horizon soil sample are Oxalate Ca (0.556 or 55.6%), Clay mineral sorbed Ca (0.222 or 22.2%), and Citrate Ca (0.222 or 22.2%), with an uncertainty of 10%. These specific fractions arise because the L horizon (litter layer) receives organically bound Ca primarily through litter fall from the mature beech stand. Broadleaf trees synthesize large amounts of Ca oxalate in their foliage vacuoles, which is deposited onto the forest floor when leaves are shed. Consequently, the Ca speciation is heavily dominated by this plant-derived Ca oxalate, alongside other carboxylates like Ca citrate and a smaller proportion of Ca sorbed to clay minerals. | Full points for identifying Ca oxalate as the dominant phase (~50-60%) and organically bound carboxylates (e.g., citrate) and clay mineral-sorbed Ca as minor phases (~20-25% each). Partial points for identifying organically bound Ca without specific fractions. |
| q2 | identification | 30 | What reference spectra would be necessary to include in a linear combination fitting (LCF) basis set to accurately model the Ca speciation in this L horizon soil sample? | To accurately model the Ca speciation using linear combination fitting (LCF), the basis set should include organic Ca references such as Ca oxalate, Ca citrate, Ca formate, Ca acetate, Ca lactate, Ca pectate, and Ca phytate, as well as inorganic and sorbed references like Ca adsorbed to montmorillonite, Calcite, Aragonite, Dolomite, Apatite, Brushite, Monetite, Anorthite, Augite, Epidote, Gypsum, Anhydrite, Fluorite, and Sinjarite. This comprehensive basis set is necessary because the L horizon of this Dystric Cambisol is heavily influenced by litter fall from mature beech trees. Broadleaf trees synthesize and deposit large amounts of Ca oxalate and other carboxylates into the litter layer upon leaf shedding. Therefore, the basis set must account for these dominant organically bound Ca species, alongside potential mineral and clay-sorbed Ca components present in the soil environment. | Full points for listing Ca oxalate, other Ca carboxylates (like Ca citrate, acetate, or formate), and a clay mineral-sorbed Ca standard (e.g., Ca adsorbed to montmorillonite). Partial points for missing one of the key organic or adsorbed components. |
| q3 | reasoning | 30 | Explain the biogeochemical reasoning for why Ca oxalate is expected to be the dominant Ca species in the L horizon of this specific forest soil. | Ca oxalate is expected to be the dominant Ca species in the L horizon of this Dystric Cambisol because this litter layer receives its Ca primarily through litter fall from a mature beech stand. Broadleaf trees synthesize large quantities of Ca oxalate and store it within their foliage vacuoles. When these trees shed their leaves, the accumulated Ca oxalate is directly transferred to the forest floor. As a result, the Ca speciation in this specific soil horizon is heavily dominated by organically bound Ca, specifically Ca oxalate (comprising 55.6% of the Ca), along with other plant-derived carboxylates and clay mineral-sorbed Ca. | Full points for explaining that the L horizon receives fresh litter fall from broadleaf trees (beech), which synthesize and accumulate large amounts of Ca oxalate in their foliage, transferring it directly to the forest floor surface. |
Review
#251
soil
Ca K
▶
LLM Prompt
Sample Information
Material: soil
Sample Origin: Bad Brückenau, Rhön Mts, Germany
Sample-Specific Conditions
- Soil horizon: Ah
- Dystric Cambisol, Ah horizon
Measurement
We plan to measure the Ca K XANES spectrum of this sample.
Questions
Based on all the information above:
1. Based on the sample origin (basalt-derived Dystric Cambisol) and horizon (Ah), what are the expected major Ca-bearing phases in this soil sample, and what are their approximate relative fractions?
2. What reference spectra should be included in the linear combination fitting (LCF) basis set to accurately model the Ca speciation in this specific soil horizon?
3. Explain the biogeochemical reasoning for the persistence of primary silicate Ca and the accumulation of Ca oxalate in the Ah horizon of this basalt-derived soil.
Ground Truth
Material: soil
Measurement: Ca K-edge XANES in fluorescence mode at Beamline 8 of the Synchrotron Light Research Institute (SLRI)
Fit method: Linear combination fitting (LCF)
Phase fractions: (±10%)
| Phase | Fraction |
|---|---|
| Silicate Ca (Augite, Anorthite) | 0.57 |
| Oxalate Ca | 0.14 |
| Other organic Ca (Citrate, Pectate) | 0.29 |
Fit basis (paper's reference spectra):
- Augite
- Anorthite
- Epidote
- Ca adsorbed to montmorillonite
- Ca oxalate
- Ca citrate
- Ca pectate
- Ca phytate
Source evidence: Table 6 (page 14) and Figure 5 (page 16)
Key reasoning: In the Dystric Cambisol Bad Brückenau, which developed from basalt, primary silicate-bound Ca (augite and plagioclase/anorthite) predominates in the fine earth fraction of the entire mineral soil, including the Ah horizon. This is indicated by the persistence of typical spectral features of bedrock minerals, such as the peak at 4057/58 eV. Organically bound Ca makes up about 36% of the total Ca in the Ah horizon, with oxalate being a major organic Ca form, likely synthesized in situ by biogenic oxalic acid reacting with soil solution Ca2+ and protected against decomposition by association with pedogenic minerals.
Reasoning source: Results (Soils with intermediate pedogenesis formed from silicate parent material, page 11) and Discussion (The fate of Ca oxalate in calcareous and silicate soils, page 23)
Scoring Rubric (total: 100 pts)
| Q | Type | Max | Question | Reference Answer | Scoring Criteria |
|---|---|---|---|---|---|
| q1 | quantification | 35 | Based on the sample origin (basalt-derived Dystric Cambisol) and horizon (Ah), what are the expected major Ca-bearing phases in this soil sample, and what are their approximate relative fractions? | The expected major Ca-bearing phases in this Ah horizon soil sample are silicate Ca (augite and anorthite) at approximately 57%, Ca oxalate at 14%, and other organic Ca forms (citrate, pectate) at 29%. These specific fractions result from the soil's development from basalt parent material, which causes primary silicate-bound Ca to predominate throughout the mineral soil. Additionally, the significant fraction of organically bound Ca is expected in the Ah horizon because biogenic oxalic acid reacts with soil solution Ca2+ to synthesize Ca oxalate in situ. This organic Ca accumulates and is maintained at these levels because it is protected against decomposition through association with pedogenic minerals. | Full points if the answer identifies primary silicates (e.g., augite, anorthite/plagioclase) as the dominant phase (~55-60%) and organically bound Ca (specifically Ca oxalate and other carboxylates like citrate/pectate) as the secondary phases (~35-40%). |
| q2 | identification | 30 | What reference spectra should be included in the linear combination fitting (LCF) basis set to accurately model the Ca speciation in this specific soil horizon? | The linear combination fitting (LCF) basis set for this soil sample should include augite, anorthite, epidote, Ca adsorbed to montmorillonite, Ca oxalate, Ca citrate, Ca pectate, and Ca phytate. These specific reference spectra are required because the Dystric Cambisol developed from basalt, meaning primary bedrock silicate minerals like augite and anorthite will persist and dominate the Ca speciation. Furthermore, because this is an Ah (topsoil) horizon, biogenic processes introduce organic acids that react with available Ca2+ to form organic Ca phases. Therefore, references for Ca oxalate (which is synthesized in situ and protected by pedogenic minerals) along with other organic forms like citrate, pectate, and phytate are necessary to accurately capture the organically bound Ca fraction. | Full points if the answer lists appropriate primary silicate minerals (augite, anorthite, epidote) and relevant organic Ca compounds (Ca oxalate, Ca citrate, Ca pectate). |
| q3 | reasoning | 35 | Explain the biogeochemical reasoning for the persistence of primary silicate Ca and the accumulation of Ca oxalate in the Ah horizon of this basalt-derived soil. | In this Dystric Cambisol from Bad Brückenau, primary silicate Ca persists because the soil developed directly from basalt parent material, allowing bedrock minerals like augite and anorthite to remain predominant in the fine earth fraction. This persistence is structurally evidenced in the XANES spectra by typical features of bedrock minerals, such as a peak at 4057/58 eV. Concurrently, Ca oxalate accumulates in the Ah horizon due to biological activity, where biogenic oxalic acid reacts with Ca2+ in the soil solution to synthesize the oxalate in situ. This newly formed Ca oxalate is then protected against subsequent decomposition by associating with pedogenic minerals, allowing it to remain a major organic Ca form in this horizon. | Full points if the answer explains that primary silicates persist due to the intermediate stage of pedogenesis from basalt bedrock, and that Ca oxalate is synthesized in situ by biogenic oxalic acid reacting with soil Ca2+ and is stabilized/protected from decomposition by association with pedogenic minerals (e.g., Fe/Al oxyhydroxides). |
Review
#252
soil
Ca K
▶
LLM Prompt
Sample Information
Material: soil
Sample Origin: Bad Brückenau, Rhön Mts, Germany
Sample-Specific Conditions
- Soil horizon: BwAh
- Dystric Cambisol, BwAh horizon
Measurement
We plan to measure the Ca K XANES spectrum of this sample.
Questions
Based on all the information above:
1. Based on the sample conditions (Dystric Cambisol, BwAh horizon, formed from basalt parent material), what are the expected major Ca phases and their approximate fractions?
2. What reference spectra should be included in the linear combination fitting basis to accurately model the Ca K-edge XANES spectrum of this basalt-derived soil horizon?
3. Explain the biogeochemical reasoning for the significant presence of oxalate-bound Ca in this deep subsoil (BwAh) horizon, given that Ca oxalate is typically associated with surface litter layers.
Ground Truth
Material: soil
Measurement: Ca K-edge XANES, fluorescence mode, Beamline 8 of SLRI
Fit method: Linear combination fitting (LCF)
Phase fractions: (±15%)
| Phase | Fraction |
|---|---|
| Silicate Ca | 0.455 |
| Clay mineral sorbed Ca | 0.182 |
| Oxalate Ca | 0.364 |
Fit basis (paper's reference spectra):
- Augite
- Anorthite
- Epidote
- Ca adsorbed to montmorillonite
- Ca oxalate
- Ca citrate
- Ca pectate
- Ca phytate
Source evidence: Table 6 and Figure 5, pages 208 and 210
Key reasoning: In the basalt-derived Dystric Cambisol of Bad Brückenau, primary silicate-bound Ca (e.g., augite, plagioclase/anorthite) persists throughout the mineral soil due to the silicate parent material. Organically bound Ca is also prominent, with a large portion being oxalate-bound Ca. This deep subsoil Ca oxalate is likely synthesized in situ from biogenic oxalic acid (plant root and microbial exudates) reacting with soil solution Ca2+, and is protected from decomposition by association with pedogenic minerals (e.g., adsorption via ternary complex formation or occlusion with Fe/Al oxyhydroxides). Clay mineral-sorbed Ca is also present as an exchangeable pool.
Reasoning source: Results (Soils with intermediate pedogenesis formed from silicate parent material) and Discussion (The fate of Ca oxalate in calcareous and silicate soils)
Scoring Rubric (total: 100 pts)
| Q | Type | Max | Question | Reference Answer | Scoring Criteria |
|---|---|---|---|---|---|
| q1 | quantification | 40 | Based on the sample conditions (Dystric Cambisol, BwAh horizon, formed from basalt parent material), what are the expected major Ca phases and their approximate fractions? | The expected major Ca phases in this Dystric Cambisol BwAh horizon are Silicate Ca (45.5%), Oxalate Ca (36.4%), and Clay mineral sorbed Ca (18.2%), with an estimated uncertainty of 15%. These specific fractions result from the soil's basaltic silicate parent material, which allows primary silicate-bound Ca to persist throughout the mineral soil. The significant fraction of oxalate Ca arises from in situ synthesis via biogenic oxalic acid from plant roots and microbes reacting with soil solution Ca2+, which is then protected by pedogenic minerals. Finally, the remaining fraction forms an exchangeable pool of clay mineral-sorbed Ca typical for this soil environment. | Award 10 points each for identifying Silicate Ca, Oxalate Ca, and Clay mineral sorbed Ca as the major phases. Award 10 points if the estimated fractions are within 15% of the ground truth values (Silicate Ca ~45%, Oxalate Ca ~36%, Clay mineral sorbed Ca ~18%). |
| q2 | identification | 30 | What reference spectra should be included in the linear combination fitting basis to accurately model the Ca K-edge XANES spectrum of this basalt-derived soil horizon? | The linear combination fitting basis should include Augite, Anorthite, Epidote, Ca adsorbed to montmorillonite, Ca oxalate, Ca citrate, Ca pectate, and Ca phytate. These specific references are required because the basalt-derived Dystric Cambisol contains persistent primary silicate-bound Ca, such as augite and anorthite, inherited from its parent material. Additionally, the basis must account for organically bound Ca, particularly Ca oxalate synthesized in situ from root and microbial exudates, as well as other organic complexes. Finally, references like Ca adsorbed to montmorillonite are necessary to accurately capture the exchangeable pool of clay mineral-sorbed Ca present in this horizon. | Award 10 points for including primary silicates (e.g., augite, anorthite/plagioclase, epidote), 10 points for clay mineral-sorbed Ca (e.g., Ca adsorbed to montmorillonite), and 10 points for organic Ca forms (specifically Ca oxalate, along with citrate, pectate, or phytate). |
| q3 | reasoning | 30 | Explain the biogeochemical reasoning for the significant presence of oxalate-bound Ca in this deep subsoil (BwAh) horizon, given that Ca oxalate is typically associated with surface litter layers. | The significant presence of oxalate-bound Ca in the deep subsoil BwAh horizon of this Dystric Cambisol is driven by in situ synthesis rather than surface accumulation. Biogenic oxalic acid, exuded by plant roots and microbes in the subsoil, reacts directly with Ca2+ in the soil solution to form Ca oxalate. Once formed, this organically bound Ca is protected from decomposition through strong associations with pedogenic minerals. Specifically, it is stabilized via adsorption through ternary complex formation or occlusion with Fe/Al oxyhydroxides, allowing it to persist prominently in this basalt-derived mineral soil. | Award 15 points for explaining that the Ca oxalate is synthesized in situ by the reaction of biogenic oxalic acid (from plant roots and microbial exudates) with soil solution Ca2+. Award 15 points for noting that it is protected against decomposition by association with pedogenic minerals (e.g., adsorption or occlusion with Fe/Al oxyhydroxides). |
Review
#253
soil
Ca K
▶
LLM Prompt
Sample Information
Material: soil
Sample Origin: Bad Brückenau, Rhön Mts, Germany
Sample-Specific Conditions
- Soil horizon: Bw1
- Dystric Cambisol, Bw1 horizon
Measurement
We plan to measure the Ca K XANES spectrum of this sample.
Questions
Based on all the information above:
1. Based on the sample origin (Dystric Cambisol on basalt bedrock) and horizon (Bw1), what candidate reference spectra should be included in a linear combination fitting (LCF) analysis of its Ca K-edge XANES spectrum?
2. Estimate the relative fractions of the major Ca species (Silicate Ca, Clay mineral sorbed Ca, Oxalate Ca, Phytate Ca) in this Bw1 horizon soil sample.
3. Explain the biogeochemical and pedogenic reasoning for the significant presence of primary silicate Ca and the enrichment of oxalate-bound Ca in this specific subsoil horizon.
Ground Truth
Material: soil
Measurement: Ca K-edge XANES, fluorescence mode, Beamline 8 of the Synchrotron Light Research Institute (SLRI)
Fit method: Linear combination fitting (LCF)
Phase fractions: (±10%)
| Phase | Fraction |
|---|---|
| Silicate Ca | 0.308 |
| Clay mineral sorbed Ca | 0.154 |
| Oxalate Ca | 0.308 |
| Phytate Ca | 0.231 |
Fit basis (paper's reference spectra):
- Augite / Anorthite (Silicate Ca)
- Ca adsorbed to montmorillonite (Clay mineral sorbed Ca)
- Ca oxalate
- Ca phytate
Source evidence: Table 6, page 208
Key reasoning: In the Dystric Cambisol formed from silicate bedrock (basalt), a considerably larger part of mineral soil Ca is bound as primary silicate Ca compared to soils on calcareous bedrock. Oxalate-bound Ca is enriched in the subsoil of these basalt-derived soils, likely synthesized in situ by reaction of biogenic oxalic acid with soil solution Ca2+ and protected against decomposition by association with pedogenic Fe and Al minerals.
Reasoning source: Page 214 (Effects of pedogenesis on soil Ca speciation) and Page 217 (The fate of Ca oxalate in calcareous and silicate soils)
Scoring Rubric (total: 100 pts)
| Q | Type | Max | Question | Reference Answer | Scoring Criteria |
|---|---|---|---|---|---|
| q1 | identification | 30 | Based on the sample origin (Dystric Cambisol on basalt bedrock) and horizon (Bw1), what candidate reference spectra should be included in a linear combination fitting (LCF) analysis of its Ca K-edge XANES spectrum? | The candidate reference spectra for the LCF analysis of this Bw1 horizon soil sample should include Augite/Anorthite (Silicate Ca), Ca adsorbed to montmorillonite (Clay mineral sorbed Ca), Ca oxalate, and Ca phytate. These specific phases are expected because the sample is a Dystric Cambisol formed from silicate bedrock (basalt), which naturally retains a large portion of mineral soil Ca as primary silicate Ca. Furthermore, organic and secondary phases like Ca oxalate are expected in this subsoil horizon because biogenic oxalic acid reacts in situ with soil solution Ca2+. This oxalate-bound Ca is then protected against decomposition through association with pedogenic Fe and Al minerals characteristic of this soil type. | Full credit for identifying primary silicates (e.g., augite, anorthite/plagioclase), clay mineral-sorbed Ca, and organic Ca forms (specifically Ca oxalate and Ca phytate). Partial credit for missing specific organic forms or silicates. |
| q2 | quantification | 35 | Estimate the relative fractions of the major Ca species (Silicate Ca, Clay mineral sorbed Ca, Oxalate Ca, Phytate Ca) in this Bw1 horizon soil sample. | The estimated relative fractions for this Bw1 horizon sample are 30.8% Silicate Ca, 15.4% Clay mineral sorbed Ca, 30.8% Oxalate Ca, and 23.1% Phytate Ca, with an uncertainty of 10%. These specific values reflect the soil's origin as a Dystric Cambisol formed on basalt, where a considerably larger fraction of Ca remains bound as primary silicate Ca (30.8%) compared to soils on calcareous bedrock. The equally high fraction of Oxalate Ca (30.8%) results from the in situ synthesis of calcium oxalate via the reaction of biogenic oxalic acid with soil solution Ca2+. This high oxalate fraction is maintained in the subsoil because it is protected from decomposition by associating with pedogenic Fe and Al minerals. | Full credit if estimated fractions are within ±10-15% of the ground truth (Silicate Ca ~31%, Oxalate Ca ~31%, Phytate Ca ~23%, Clay mineral sorbed Ca ~15%). Partial credit if the dominant phases (Silicate and Oxalate) are correctly identified as the largest contributors. |
| q3 | reasoning | 35 | Explain the biogeochemical and pedogenic reasoning for the significant presence of primary silicate Ca and the enrichment of oxalate-bound Ca in this specific subsoil horizon. | In this Dystric Cambisol sample from the Bw1 horizon, the significant presence of primary silicate Ca is directly due to its formation from silicate bedrock (basalt). Unlike soils on calcareous bedrock, this basalt-derived soil retains a considerably larger portion of its mineral soil Ca in primary silicate forms like augite and anorthite. The enrichment of oxalate-bound Ca in this subsoil is driven by an in situ biogeochemical mechanism where biogenic oxalic acid reacts with Ca2+ in the soil solution. Once synthesized, this Ca oxalate is protected against decomposition through its association with pedogenic Fe and Al minerals that are characteristic of this soil environment. | Full credit for explaining that the basaltic parent material provides primary silicate Ca, and that subsoil Ca oxalate is synthesized in situ by biogenic oxalic acid reacting with soil solution Ca2+, which is then protected from decomposition by association with pedogenic minerals (Fe/Al oxyhydroxides). |
Review
#254
soil
Ca K
▶
LLM Prompt
Sample Information
Material: soil
Sample Origin: Bad Brückenau, Rhön Mts, Germany
Sample-Specific Conditions
- Soil horizon: Bw2
- Dystric Cambisol, Bw2 horizon
Measurement
We plan to measure the Ca K XANES spectrum of this sample.
Questions
Based on all the information above:
1. Based on the sample conditions (Dystric Cambisol, Bw2 subsoil horizon, basalt parent material), what are the expected major Ca-bearing phases and their approximate relative fractions?
2. What specific reference spectra should be included in a Linear Combination Fitting (LCF) basis set to accurately model the Ca speciation in this basalt-derived subsoil horizon?
3. Explain the pedogenic and physical reasons for the observed Ca speciation in this specific soil horizon, particularly the dominance of silicate Ca.
Ground Truth
Material: soil
Measurement: Ca K-edge XANES, fluorescence mode, Beamline 8 of SLRI
Fit method: Linear combination fitting (LCF)
Phase fractions: (±10%)
| Phase | Fraction |
|---|---|
| Silicate Ca | 0.667 |
| Citrate Ca | 0.2 |
| Pectate Ca | 0.133 |
Fit basis (paper's reference spectra):
- Augite
- Anorthite
- Epidote
- Ca citrate
- Ca pectate
Source evidence: Table 6, page 14; Figure 5, page 16
Key reasoning: The Bad Brückenau soil is a Dystric Cambisol developed from silicate bedrock (basalt). In the subsoil (Bw2 horizon), a large portion of the mineral soil Ca is bound as primary silicate Ca (e.g., augite and plagioclase/anorthite) derived from the unweathered fine earth and rock fragments of the parent material. Organically bound Ca (citrate and pectate) is also present, as the contribution of organically bound Ca to total soil Ca in this profile is generally large and shows no systematic depth trend.
Reasoning source: Results section 'Soils with intermediate pedogenesis formed from silicate parent material', page 11-12; Discussion section, page 20
Scoring Rubric (total: 100 pts)
| Q | Type | Max | Question | Reference Answer | Scoring Criteria |
|---|---|---|---|---|---|
| q1 | quantification | 40 | Based on the sample conditions (Dystric Cambisol, Bw2 subsoil horizon, basalt parent material), what are the expected major Ca-bearing phases and their approximate relative fractions? | The expected major Ca-bearing phases are Silicate Ca at approximately 66.7%, Citrate Ca at 20.0%, and Pectate Ca at 13.3%, with an estimated uncertainty of 10%. These specific fractions arise because the sample is a Dystric Cambisol from the Bw2 subsoil horizon developed from basalt bedrock. In this subsoil horizon, the majority of the Ca remains bound as primary silicate Ca derived from the unweathered fine earth and rock fragments of the parent material. The remaining fraction consists of organically bound Ca (citrate and pectate) because its contribution to total soil Ca in this specific profile is generally large and exhibits no systematic depth trend. | Full points for identifying Silicate Ca as the dominant phase (~65-70%) and organic Ca (citrate/pectate) as the minor phases (~30-35%). Partial points for identifying the correct phases without accurate fractions. |
| q2 | identification | 30 | What specific reference spectra should be included in a Linear Combination Fitting (LCF) basis set to accurately model the Ca speciation in this basalt-derived subsoil horizon? | The Linear Combination Fitting (LCF) basis set should include reference spectra for Augite, Anorthite, Epidote, Ca citrate, and Ca pectate. These specific reference phases are required because the sample is a Dystric Cambisol developed from silicate bedrock (basalt). The primary silicate minerals (augite, anorthite/plagioclase, and epidote) are expected because they derive from the unweathered fine earth and rock fragments persisting in the Bw2 subsoil horizon. Furthermore, Ca citrate and Ca pectate must be included to model the organically bound Ca, which remains a large contributor to the total soil Ca throughout this profile regardless of depth. | Full points for listing primary silicate minerals typical of basalt (e.g., augite, anorthite/plagioclase) and relevant organic Ca carboxylates (citrate, pectate). |
| q3 | reasoning | 30 | Explain the pedogenic and physical reasons for the observed Ca speciation in this specific soil horizon, particularly the dominance of silicate Ca. | The dominance of silicate Ca (66.7%) in this sample is due to its origin as a Dystric Cambisol developed from silicate bedrock (basalt). In the Bw2 subsoil horizon, pedogenesis leaves a large portion of the mineral soil Ca bound as primary silicate Ca, such as augite and plagioclase/anorthite. This occurs because these minerals are derived directly from the unweathered fine earth and rock fragments of the parent material that persist at this depth. Despite the dominance of silicates, organically bound Ca (citrate and pectate) still makes up a significant portion of the speciation, as organic Ca contributions in this specific soil profile are generally large and show no systematic depth trend. | Full points for explaining that the soil developed from silicate bedrock (basalt), meaning subsoil horizons retain a large fraction of primary lithogenic silicate Ca (augite/plagioclase) in rock fragments and fine earth, while organic Ca phases reflect the baseline organic matter contribution that lacks a strong depth gradient in this profile. |
Review
#255
soil
Ca K
▶
LLM Prompt
Sample Information
Material: soil
Sample Origin: Steinach, Rhön Mts, Germany
Sample-Specific Conditions
- Soil horizon: LOf
- Dystric Cambisol, LOf horizon
Measurement
We plan to measure the Ca K XANES spectrum of this sample.
Questions
Based on all the information above:
1. Based on the sample conditions (LOf horizon of a Dystric Cambisol on silicate bedrock), identify the likely Ca-bearing phases present and estimate their relative fractions.
2. What reference spectra would be necessary to accurately model the Ca K-edge XANES spectrum of this soil horizon using linear combination fitting?
3. Explain the biogeochemical and pedogenic processes that lead to the observed Ca speciation in this specific organic surface horizon (LOf) of a soil developed on silicate bedrock.
Ground Truth
Material: soil
Measurement: Ca K-edge XANES in fluorescence mode at Beamline 8 of SLRI
Fit method: Linear combination fitting (LCF)
Phase fractions: (±10%)
| Phase | Fraction |
|---|---|
| Clay mineral sorbed Ca | 0.364 |
| Oxalate Ca | 0.364 |
| Citrate Ca | 0.273 |
Fit basis (paper's reference spectra):
- Ca adsorbed to montmorillonite (Clay mineral sorbed Ca)
- Ca oxalate
- Ca citrate (summarizing carboxylate species other than oxalate or pectate)
Source evidence: Table 6, page 208; Figure 5 caption, page 210
Key reasoning: In the Dystric Cambisol formed from silicate bedrock, the organic surface layer (LOf horizon) receives organically bound Ca primarily via litter fall (e.g., beech foliage), which is rich in Ca oxalate and other carboxylates (modeled as Ca citrate). Consequently, most of the Ca in this horizon is organically bound. The significant presence of clay mineral-adsorbed Ca in the organic surface horizon is attributed to the accumulation of aeolian silicate dust deposition over time, which provides mineral surfaces for Ca adsorption.
Reasoning source: Page 205 (Soils with intermediate pedogenesis formed from silicate parent material); Page 215 (Speciation of organically bound soil Ca as affected by plant input); Pages 217-218 (Differentiation of organically and inorganically bound exchangeable soil Ca)
Scoring Rubric (total: 100 pts)
| Q | Type | Max | Question | Reference Answer | Scoring Criteria |
|---|---|---|---|---|---|
| q1 | quantification | 40 | Based on the sample conditions (LOf horizon of a Dystric Cambisol on silicate bedrock), identify the likely Ca-bearing phases present and estimate their relative fractions. | The likely Ca-bearing phases in this LOf horizon of a Dystric Cambisol are clay mineral sorbed Ca (36.4%), Ca oxalate (36.4%), and Ca citrate (27.3%), with an estimated uncertainty of 10%. These specific fractions arise because the organic surface layer (LOf) receives organically bound Ca primarily through litter fall, which is rich in Ca oxalate and other carboxylates (modeled here as citrate), resulting in a predominantly organic Ca pool. The significant fraction of clay mineral-sorbed Ca (36.4%) in this organic horizon results from the accumulation of aeolian silicate dust deposition over time. This aeolian dust provides the necessary mineral surfaces for Ca adsorption in a soil profile otherwise formed from silicate bedrock. | Full points for identifying organically bound Ca (oxalate and other carboxylates/citrate) and clay mineral-sorbed Ca, with fractions around 30-40% each. Partial credit for identifying either the organic or the mineral-adsorbed components. |
| q2 | identification | 30 | What reference spectra would be necessary to accurately model the Ca K-edge XANES spectrum of this soil horizon using linear combination fitting? | To accurately model the Ca K-edge XANES spectrum of this soil sample using linear combination fitting, the necessary reference spectra are Ca adsorbed to montmorillonite (representing clay mineral sorbed Ca), Ca oxalate, and Ca citrate (which summarizes carboxylate species other than oxalate or pectate). These specific references are required because the LOf horizon of this Dystric Cambisol receives substantial organic Ca input from litter fall (e.g., beech foliage), necessitating the oxalate and citrate standards to model the organically bound Ca. Additionally, the montmorillonite standard is needed because aeolian silicate dust deposition accumulates in this organic surface layer over time. This dust provides mineral surfaces that adsorb Ca, making a clay mineral reference essential to capture the inorganic fraction. | Full points for listing Ca oxalate, a representative other carboxylate (like Ca citrate), and a clay mineral-adsorbed Ca standard (e.g., Ca-montmorillonite). Partial credit for missing one of the organic or mineral standards. |
| q3 | reasoning | 30 | Explain the biogeochemical and pedogenic processes that lead to the observed Ca speciation in this specific organic surface horizon (LOf) of a soil developed on silicate bedrock. | In the LOf horizon of this Dystric Cambisol formed on silicate bedrock, the observed Ca speciation is driven by a combination of biological inputs and atmospheric deposition. The organic surface layer receives organically bound Ca primarily via litter fall, such as beech foliage, which is highly enriched in Ca oxalate and other carboxylates. Consequently, the majority of the Ca in this horizon is organically bound, represented by the Ca oxalate and Ca citrate fractions. Concurrently, the significant presence of inorganically bound, clay mineral-adsorbed Ca is attributed to the pedogenic accumulation of aeolian silicate dust over time. This dust deposition introduces mineral surfaces into the organic horizon, enabling the adsorption of Ca despite the underlying silicate bedrock. | Full points for explaining that organically bound Ca (oxalate/citrate) originates from plant litter fall, while clay mineral-sorbed Ca is present due to aeolian silicate dust deposition or mixing in the surface layer. |
Review
#256
soil
Ca K
▶
LLM Prompt
Sample Information
Material: soil
Sample Origin: Steinach, Rhön Mts, Germany
Sample-Specific Conditions
- Soil horizon: Ah
- Dystric Cambisol, Ah horizon
Measurement
We plan to measure the Ca K XANES spectrum of this sample.
Questions
Based on all the information above:
1. Based on the sample conditions (Dystric Cambisol, Ah horizon, basalt parent material), what candidate reference spectra should be included in a linear combination fitting analysis of its Ca K-edge XANES spectrum?
2. Estimate the phase fractions of the major Ca species (Silicate Ca, Clay mineral sorbed Ca, and Oxalate Ca) in this Ah horizon soil sample.
3. Explain the biogeochemical reasoning for the observed Ca speciation in this sample, particularly focusing on the persistence of primary silicate Ca and the stabilization mechanism of Ca oxalate.
Ground Truth
Material: soil
Measurement: Ca K-edge XANES, fluorescence mode, Beamline 8 of SLRI
Fit method: Linear combination fitting (LCF)
Phase fractions: (±10%)
| Phase | Fraction |
|---|---|
| Silicate Ca | 0.56 |
| Clay mineral sorbed Ca | 0.16 |
| Oxalate Ca | 0.28 |
Fit basis (paper's reference spectra):
- Epidote
- Augite
- Anorthite
- Ca adsorbed to montmorillonite (CM-adsorbed)
- Ca oxalate
- Ca citrate
- Ca pectate
- Ca phytate
Source evidence: Table 6, page 208; Figure 5, page 210
Key reasoning: In the Dystric Cambisol Steinach formed from basalt (silicate bedrock), a large portion of soil Ca remains bound as primary silicate Ca in the fine earth fraction. Pedogenesis leads to the formation of clay minerals and accumulation of soil organic matter, resulting in the presence of clay mineral-sorbed Ca and organically bound Ca. The organically bound Ca in this horizon is entirely oxalate-bound, which is synthesized in situ by biogenic oxalic acid and protected against decomposition by association with pedogenic minerals (e.g., adsorption to Fe and Al oxyhydroxides).
Reasoning source: Sections 'Effects of pedogenesis on soil Ca speciation' (p. 214) and 'The fate of Ca oxalate in calcareous and silicate soils' (p. 216-217)
Scoring Rubric (total: 100 pts)
| Q | Type | Max | Question | Reference Answer | Scoring Criteria |
|---|---|---|---|---|---|
| q1 | identification | 30 | Based on the sample conditions (Dystric Cambisol, Ah horizon, basalt parent material), what candidate reference spectra should be included in a linear combination fitting analysis of its Ca K-edge XANES spectrum? | The candidate reference spectra for linear combination fitting should include Epidote, Augite, Anorthite, Ca adsorbed to montmorillonite, Ca oxalate, Ca citrate, Ca pectate, and Ca phytate. These specific phases are expected because the Dystric Cambisol formed from basalt (silicate bedrock), meaning primary silicate minerals like augite, epidote, and anorthite will still host a large portion of the soil Ca. Furthermore, pedogenesis in the Ah horizon leads to the formation of clay minerals and the accumulation of soil organic matter. This necessitates the inclusion of clay mineral-sorbed Ca and various organically bound Ca references to account for biogenic weathering products and secondary mineral formation. | Award 10 points for identifying primary silicates (e.g., augite, anorthite, epidote), 10 points for clay mineral-sorbed Ca, and 10 points for organic Ca forms (specifically Ca oxalate). |
| q2 | quantification | 30 | Estimate the phase fractions of the major Ca species (Silicate Ca, Clay mineral sorbed Ca, and Oxalate Ca) in this Ah horizon soil sample. | The estimated phase fractions for this Ah horizon soil sample are 0.56 (56%) Silicate Ca, 0.16 (16%) Clay mineral sorbed Ca, and 0.28 (28%) Oxalate Ca, with an uncertainty of 10%. These specific values result from the soil's formation from basaltic bedrock, which causes the majority of the Ca (56%) to remain bound within primary silicates in the fine earth fraction. The remaining fractions are driven by pedogenesis in the Ah horizon, which produces clay minerals that sorb 16% of the Ca. Additionally, biological activity synthesizes biogenic oxalic acid, leading to 28% of the Ca being organically bound as oxalate, which is protected from decomposition by association with pedogenic minerals. | Award 10 points for Silicate Ca (~50-60%), 10 points for Oxalate Ca (~25-35%), and 10 points for Clay mineral sorbed Ca (~10-20%). |
| q3 | reasoning | 40 | Explain the biogeochemical reasoning for the observed Ca speciation in this sample, particularly focusing on the persistence of primary silicate Ca and the stabilization mechanism of Ca oxalate. | The observed Ca speciation in this Dystric Cambisol Ah horizon is primarily driven by its formation from basaltic silicate bedrock and subsequent pedogenesis. Because the soil originates from basalt, a large portion of the soil Ca persists as primary silicate Ca within the fine earth fraction. As pedogenesis occurs, clay minerals form and soil organic matter accumulates, leading to the presence of clay mineral-sorbed Ca and organically bound Ca. The organically bound Ca is entirely oxalate-bound, having been synthesized in situ by biogenic oxalic acid. This Ca oxalate is stabilized and protected against decomposition through its association with pedogenic minerals, specifically via adsorption to Fe and Al oxyhydroxides. | Award 20 points for explaining that the basalt parent material provides primary silicate Ca that persists in the fine earth fraction despite pedogenesis. Award 20 points for explaining that Ca oxalate is synthesized in situ and protected from decomposition by association with pedogenic minerals (Fe/Al oxyhydroxides) in silicate soils. |
Review
#257
soil
Ca K
▶
LLM Prompt
Sample Information
Material: soil
Sample Origin: Steinach, Rhön Mts, Germany
Sample-Specific Conditions
- Soil horizon: Bw1
- Dystric Cambisol, Bw1 horizon
Measurement
We plan to measure the Ca K XANES spectrum of this sample.
Questions
Based on all the information above:
1. Based on the sample origin (Dystric Cambisol on basalt bedrock, Bw1 subsoil horizon), what are the expected major Ca-bearing phases, and what are their estimated relative fractions?
2. What reference spectra would be most appropriate to include in a Linear Combination Fitting (LCF) analysis for this specific soil horizon?
3. Explain the physical and biogeochemical reasoning for the significant presence of Ca oxalate in this deep subsoil (Bw1) horizon, given that it is a Dystric Cambisol formed on silicate bedrock.
Ground Truth
Material: soil
Measurement: Ca K-edge XANES, fluorescence mode, Beamline 8 of the Synchrotron Light Research Institute (SLRI)
Fit method: Linear combination fitting (LCF)
Phase fractions: (±10%)
| Phase | Fraction |
|---|---|
| Silicate Ca | 0.667 |
| Oxalate Ca | 0.259 |
| Phytate Ca | 0.074 |
Fit basis (paper's reference spectra):
- Augite
- Anorthite
- Epidote
- Ca oxalate
- Ca phytate
- Ca pectate
- Ca citrate
- Ca adsorbed to montmorillonite
Source evidence: Table 6, page 208
Key reasoning: In Dystric Cambisols developed from silicate bedrock (basalt), a considerably larger part of mineral soil Ca is bound as primary silicate Ca compared to soils on calcareous bedrock. In contrast to calcareous soils where it rapidly decomposes, oxalate-bound Ca is enriched in the subsoil of these basalt-derived Cambisols. This deep subsoil Ca oxalate is synthesized in situ by the reaction of biogenic oxalic acid with soil solution Ca2+ and is protected against decomposition by association with pedogenic minerals (e.g., adsorption via ternary complex formation or occlusion).
Reasoning source: Section 'Effects of pedogenesis on soil Ca speciation' (page 214) and 'The fate of Ca oxalate in calcareous and silicate soils' (page 217)
Scoring Rubric (total: 100 pts)
| Q | Type | Max | Question | Reference Answer | Scoring Criteria |
|---|---|---|---|---|---|
| q1 | quantification | 40 | Based on the sample origin (Dystric Cambisol on basalt bedrock, Bw1 subsoil horizon), what are the expected major Ca-bearing phases, and what are their estimated relative fractions? | The expected major Ca-bearing phases in this Bw1 soil horizon are Silicate Ca (66.7%), Oxalate Ca (25.9%), and Phytate Ca (7.4%), with an estimated uncertainty of 10%. These specific fractions result from the soil being a Dystric Cambisol developed on silicate bedrock (basalt), which causes a considerably larger portion of the mineral soil Ca to remain bound as primary silicate Ca compared to soils on calcareous bedrock. Additionally, the significant 25.9% fraction of Oxalate Ca arises because biogenic oxalic acid reacts with soil solution Ca2+ to synthesize Ca oxalate in situ within the subsoil. Unlike in calcareous soils where it rapidly decomposes, this oxalate is enriched and protected against decomposition in this specific horizon through association with pedogenic minerals via ternary complex formation or occlusion. | Full points for identifying Silicate Ca as the dominant phase (~65-70%) and Oxalate Ca as the major secondary phase (~25%), with a minor contribution from Phytate Ca (<10%). Deduct points for missing the dominance of primary silicates or the significant presence of oxalate. |
| q2 | identification | 30 | What reference spectra would be most appropriate to include in a Linear Combination Fitting (LCF) analysis for this specific soil horizon? | The most appropriate reference spectra for Linear Combination Fitting (LCF) include primary silicates (Augite, Anorthite, Epidote), organic Ca forms (Ca oxalate, Ca phytate, Ca pectate, Ca citrate), and an exchangeable Ca reference (Ca adsorbed to montmorillonite). These specific silicate references are required because the sample is a Dystric Cambisol developed from silicate bedrock (basalt), meaning primary silicate minerals will naturally dominate the Ca speciation. Furthermore, organic references like Ca oxalate and Ca phytate must be included because biogenic oxalic acid reacts with Ca2+ in the soil solution to form Ca oxalate in situ within the Bw1 subsoil horizon. This organic Ca is preserved rather than decomposed due to its protective association with pedogenic minerals, necessitating a diverse basis set of both primary silicate and organic/adsorbed Ca standards to accurately capture the soil's composition. | Full points for listing primary silicate minerals relevant to basalt (e.g., augite, anorthite, epidote) and relevant organic Ca forms (Ca oxalate, Ca phytate). Deduct points for suggesting carbonates (calcite/dolomite) as major components, since this is a Dystric Cambisol on silicate bedrock. |
| q3 | reasoning | 30 | Explain the physical and biogeochemical reasoning for the significant presence of Ca oxalate in this deep subsoil (Bw1) horizon, given that it is a Dystric Cambisol formed on silicate bedrock. | In Dystric Cambisols derived from silicate bedrock like basalt, Ca oxalate is significantly enriched in the deep subsoil (Bw1 horizon) because it is synthesized in situ. This synthesis occurs through the biogeochemical reaction of biogenic oxalic acid with Ca2+ present in the soil solution. While Ca oxalate rapidly decomposes in calcareous soils, it is physically and chemically protected in these silicate-derived subsoils. This protection against decomposition is achieved through its association with pedogenic minerals, specifically via adsorption through ternary complex formation or physical occlusion, allowing it to persist as a major Ca-bearing phase. | Full points for explaining that Ca oxalate is synthesized in situ by biogenic oxalic acid reacting with soil solution Ca2+, and that it accumulates in silicate subsoils because it is protected from decomposition by association with pedogenic minerals (unlike in calcareous soils where it decomposes rapidly). |
Review
#258
soil
Ca K
▶
LLM Prompt
Sample Information
Material: soil
Sample Origin: Steinach, Rhön Mts, Germany
Sample-Specific Conditions
- Soil horizon: Bw2
- Dystric Cambisol, Bw2 horizon
Measurement
We plan to measure the Ca K XANES spectrum of this sample.
Questions
Based on all the information above:
1. Based on the sample conditions (Dystric Cambisol, Bw2 horizon, silicate bedrock), what are the expected major Ca phases and their approximate fractions?
2. What reference spectra should be included in the linear combination fitting basis to model the Ca speciation in this specific soil horizon?
3. Explain the physical and biogeochemical reasoning for the presence of Ca oxalate in this deep subsoil (Bw2) horizon, given its low water solubility.
Ground Truth
Material: soil
Measurement: Ca K-edge XANES in fluorescence mode at Beamline 8 of SLRI
Fit method: Linear combination fitting (LCF)
Phase fractions: (±10%)
| Phase | Fraction |
|---|---|
| Silicate Ca | 0.615 |
| Clay mineral sorbed Ca | 0.173 |
| Oxalate Ca | 0.212 |
Fit basis (paper's reference spectra):
- Epidote
- Augite
- Anorthite
- Ca adsorbed to montmorillonite
- Ca oxalate
Source evidence: Table 6 and Figure 5, pages 208 and 210
Key reasoning: In Dystric Cambisols developed from silicate bedrock (basalt), a large part of mineral soil Ca is bound as primary silicate Ca (e.g., augite, anorthite, epidote). The contribution of organically bound Ca decreases with depth, with most of it being oxalate-bound. The presence of oxalate-bound Ca in deep subsoil horizons is attributed to in situ synthesis by reaction of biogenic oxalic acid with soil solution Ca2+ and subsequent protection against decomposition by association with pedogenic minerals.
Reasoning source: Results (page 205) and Discussion (page 217)
Scoring Rubric (total: 100 pts)
| Q | Type | Max | Question | Reference Answer | Scoring Criteria |
|---|---|---|---|---|---|
| q1 | quantification | 35 | Based on the sample conditions (Dystric Cambisol, Bw2 horizon, silicate bedrock), what are the expected major Ca phases and their approximate fractions? | The expected major Ca phases in this Bw2 horizon sample are Silicate Ca (0.615 or 61.5%), Oxalate Ca (0.212 or 21.2%), and Clay mineral sorbed Ca (0.173 or 17.3%), with an estimated uncertainty of 10%. These specific fractions result directly from the sample being a Dystric Cambisol developed from silicate bedrock (basalt), which causes the majority of the calcium to remain bound within primary silicate minerals. Additionally, because this is a deeper subsoil horizon (Bw2), the overall contribution of organically bound Ca decreases compared to surface layers. The remaining organic fraction is predominantly oxalate-bound Ca formed in situ, while the rest of the available Ca is sorbed to clay minerals. | Award full points if Silicate Ca is identified as the dominant phase (~60%), with minor contributions from Oxalate Ca (~20%) and Clay mineral sorbed Ca (~15-20%). |
| q2 | identification | 30 | What reference spectra should be included in the linear combination fitting basis to model the Ca speciation in this specific soil horizon? | The linear combination fitting (LCF) basis for this soil sample should include reference spectra for Epidote, Augite, Anorthite, Ca adsorbed to montmorillonite, and Ca oxalate. These specific reference phases are expected because the sample is a Dystric Cambisol derived from silicate bedrock, meaning primary silicate minerals like augite, anorthite, and epidote will naturally host the majority of the soil's calcium. Furthermore, the conditions in the Bw2 horizon support the presence of clay minerals that sorb calcium, necessitating the montmorillonite reference. Finally, Ca oxalate must be included because biogenic oxalic acid reacts with soil solution Ca2+ to synthesize oxalate-bound Ca in situ, which is then preserved in this subsoil horizon by pedogenic minerals. | Award full points if the basis includes primary silicates (e.g., augite, anorthite, epidote), clay mineral-adsorbed Ca (e.g., Ca-montmorillonite), and Ca oxalate. |
| q3 | reasoning | 35 | Explain the physical and biogeochemical reasoning for the presence of Ca oxalate in this deep subsoil (Bw2) horizon, given its low water solubility. | The presence of Ca oxalate in the deep subsoil Bw2 horizon of this Dystric Cambisol is driven by a combination of in situ synthesis and subsequent physical protection. While the overall contribution of organically bound Ca generally decreases with depth, biogenic oxalic acid reacts directly with Ca2+ in the soil solution to precipitate calcium oxalate within this specific horizon. Once formed, this oxalate-bound Ca is protected against further decomposition through its association with pedogenic minerals. Consequently, these biogeochemical reactions and protective mineral associations allow Ca oxalate to persist as a significant phase (accounting for roughly 21.2% of the Ca) despite the depth and its low water solubility. | Award full points if the answer explains that Ca oxalate is synthesized in situ from biogenic oxalic acid reacting with soil solution Ca2+, and is protected from decomposition by association with pedogenic minerals. |
Review
#259
soil
Ca K
▶
LLM Prompt
Sample Information
Material: soil
Sample Origin: Steinach, Rhön Mts, Germany
Sample-Specific Conditions
- Soil horizon: Bw3
- Dystric Cambisol, Bw3 horizon
Measurement
We plan to measure the Ca K XANES spectrum of this sample.
Questions
Based on all the information above:
1. Based on the sample origin (basalt-derived Dystric Cambisol) and horizon (Bw3), what candidate Ca phases should be included in a linear combination fitting analysis of its Ca K-edge XANES spectrum?
2. Estimate the relative fractions of the major Ca phases in this Bw3 horizon sample.
3. Explain the biogeochemical reasoning for the observed Ca speciation in this deep subsoil horizon, specifically addressing the dominance of silicate Ca and the specific form of organic Ca present.
Ground Truth
Material: soil
Measurement: Ca K-edge XANES, fluorescence mode, Beamline 8 at SLRI
Fit method: Linear combination fitting (LCF)
Phase fractions: (±15%)
| Phase | Fraction |
|---|---|
| Silicate Ca | 0.609 |
| Clay mineral sorbed Ca | 0.188 |
| Oxalate Ca | 0.203 |
Fit basis (paper's reference spectra):
- Augite
- Anorthite
- Epidote
- Ca adsorbed to montmorillonite (CM-adsorbed)
- Ca oxalate
Source evidence: Table 6, page 208; Figure 5, page 210
Key reasoning: Steinach is a Dystric Cambisol formed from basalt (silicate bedrock). In the deep subsoil (Bw3 horizon), the majority of Ca remains as primary silicate Ca (lithogenic Ca) due to incomplete weathering. The contribution of organically bound Ca to total Ca decreases systematically with depth, but the organic Ca present in this deep horizon is entirely oxalate-bound. This subsoil Ca oxalate is likely synthesized in situ by reaction of biogenic oxalic acid with soil solution Ca2+ and protected against decomposition by association with pedogenic minerals.
Reasoning source: Results (Soils with intermediate pedogenesis formed from silicate parent material), page 205; Discussion (Effects of pedogenesis on soil Ca speciation), page 214; Discussion (The fate of Ca oxalate in calcareous and silicate soils), page 217
Scoring Rubric (total: 100 pts)
| Q | Type | Max | Question | Reference Answer | Scoring Criteria |
|---|---|---|---|---|---|
| q1 | identification | 30 | Based on the sample origin (basalt-derived Dystric Cambisol) and horizon (Bw3), what candidate Ca phases should be included in a linear combination fitting analysis of its Ca K-edge XANES spectrum? | The candidate Ca phases for the linear combination fitting analysis should include Augite, Anorthite, Epidote, Ca adsorbed to montmorillonite (CM-adsorbed), and Ca oxalate. These specific phases are expected because the sample is a Dystric Cambisol formed from basalt (silicate bedrock), meaning primary silicate minerals like augite, anorthite, and epidote persist due to incomplete weathering in the deep subsoil (Bw3 horizon). Furthermore, clay mineral sorbed Ca and Ca oxalate must be included because biogenic oxalic acid reacts with soil solution Ca2+ in situ, forming oxalate that is protected from decomposition by pedogenic minerals in this deep horizon. | Award 10 points for identifying primary silicates (e.g., augite, anorthite, epidote), 10 points for clay mineral-sorbed Ca, and 10 points for Ca oxalate. |
| q2 | quantification | 30 | Estimate the relative fractions of the major Ca phases in this Bw3 horizon sample. | The relative fractions of the major Ca phases in this sample are 0.609 (60.9%) Silicate Ca, 0.188 (18.8%) Clay mineral sorbed Ca, and 0.203 (20.3%) Oxalate Ca, with an estimated uncertainty of 15%. These specific values result from the sample's location in the deep subsoil (Bw3 horizon) of a basalt-derived Dystric Cambisol, where incomplete weathering causes primary lithogenic silicate Ca to remain the dominant fraction. Additionally, while the overall contribution of organically bound Ca decreases systematically with depth, the remaining organic fraction (20.3%) is entirely oxalate-bound because it is synthesized in situ from biogenic oxalic acid and soil solution Ca2+, and subsequently protected by pedogenic minerals. | Award 10 points for Silicate Ca at ~60%, 10 points for Clay mineral sorbed Ca at ~20%, and 10 points for Oxalate Ca at ~20%. |
| q3 | reasoning | 40 | Explain the biogeochemical reasoning for the observed Ca speciation in this deep subsoil horizon, specifically addressing the dominance of silicate Ca and the specific form of organic Ca present. | In the deep Bw3 subsoil horizon of this basalt-derived Dystric Cambisol, the majority of Ca (60.9%) remains as primary silicate (lithogenic) Ca due to the incomplete weathering of the silicate bedrock. Although the total amount of organically bound Ca decreases systematically with depth, the organic Ca that is present in this deep horizon exists entirely as Ca oxalate (20.3%). This specific speciation occurs because biogenic oxalic acid reacts in situ with Ca2+ in the soil solution to synthesize Ca oxalate. This oxalate is then protected against decomposition through its association with pedogenic minerals, allowing it to persist alongside clay mineral sorbed Ca in the deep subsoil. | Award 15 points for explaining that incomplete weathering of the basalt parent material leaves primary silicate Ca as the dominant phase in the deep subsoil. Award 15 points for noting that while total organic Ca is low at this depth, it is present as Ca oxalate. Award 10 points for explaining that this deep subsoil Ca oxalate is likely synthesized in situ and protected from decomposition by association with pedogenic minerals. |
Review
#260
soil
Ca K
▶
LLM Prompt
Sample Information
Material: soil
Sample Origin: Steinach, Rhön Mts, Germany
Sample-Specific Conditions
- Soil horizon: CBw
- Dystric Cambisol, CBw horizon
Measurement
We plan to measure the Ca K XANES spectrum of this sample.
Questions
Based on all the information above:
1. What candidate reference spectra are needed for Linear Combination Fitting of the Ca K-edge XANES spectrum of this deep subsoil (CBw) horizon from a Dystric Cambisol formed on basalt?
2. Estimate the relative fractions of the major Ca species in this CBw horizon sample.
3. Explain the biogeochemical reasoning for the observed Ca speciation in this deep subsoil (CBw) horizon of a Dystric Cambisol on silicate bedrock, particularly regarding the unexpected presence of organic Ca at this depth.
Ground Truth
Material: soil
Measurement: Ca K-edge XANES, fluorescence mode, Beamline 8 at SLRI
Fit method: Linear Combination Fitting (LCF)
Phase fractions: (±10%)
| Phase | Fraction |
|---|---|
| Silicate Ca | 0.688 |
| Clay mineral sorbed Ca | 0.156 |
| Oxalate Ca | 0.156 |
Fit basis (paper's reference spectra):
- Primary silicates (Augite, Anorthite, Epidote)
- Ca adsorbed to montmorillonite (Clay mineral sorbed Ca)
- Ca oxalate
Source evidence: Table 6 (continued), page 209
Key reasoning: In Dystric Cambisols developed from silicate bedrock (basalt), a large portion of mineral soil Ca is bound as primary silicate Ca, which dominates the deep subsoil (CBw) horizon. The presence of oxalate-bound Ca in this deep subsoil is not due to bioturbation or leaching, but rather in situ synthesis by reaction of biogenic oxalic acid with soil solution Ca. This Ca oxalate is protected against decomposition by association with pedogenic minerals (e.g., adsorption or occlusion). Clay mineral-sorbed Ca is also present as a product of silicate weathering.
Reasoning source: Section 'Effects of pedogenesis on soil Ca speciation' (page 214) and 'The fate of Ca oxalate in calcareous and silicate soils' (page 217)
Scoring Rubric (total: 100 pts)
| Q | Type | Max | Question | Reference Answer | Scoring Criteria |
|---|---|---|---|---|---|
| q1 | identification | 30 | What candidate reference spectra are needed for Linear Combination Fitting of the Ca K-edge XANES spectrum of this deep subsoil (CBw) horizon from a Dystric Cambisol formed on basalt? | The required reference spectra for Linear Combination Fitting are primary silicates (such as Augite, Anorthite, and Epidote), Ca adsorbed to montmorillonite (clay mineral sorbed Ca), and Ca oxalate. These specific phases are expected because the sample is a deep subsoil (CBw) horizon of a Dystric Cambisol developed from silicate bedrock, where primary silicate Ca naturally dominates the mineralogy. Furthermore, silicate weathering produces clay minerals that sorb Ca, while biogenic oxalic acid reacts with soil solution Ca to synthesize Ca oxalate in situ. This organic Ca oxalate phase is preserved even at this depth because it is protected against decomposition through association with pedogenic minerals. | Full credit for identifying primary silicates (e.g., augite, anorthite, epidote), clay mineral-sorbed Ca (e.g., Ca-montmorillonite), and Ca oxalate. Partial credit for missing one of the minor components. |
| q2 | quantification | 30 | Estimate the relative fractions of the major Ca species in this CBw horizon sample. | The estimated relative fractions for this sample are 68.8% Silicate Ca, 15.6% Clay mineral sorbed Ca, and 15.6% Oxalate Ca, with an uncertainty of 10%. These specific values result from the sample being a deep subsoil (CBw) horizon of a Dystric Cambisol formed on basalt, which causes primary silicate Ca to heavily dominate the overall composition. The remaining fraction is split equally between clay mineral-sorbed Ca, which forms as a natural weathering product of the bedrock silicates, and Ca oxalate. The 15.6% oxalate fraction persists at this depth not due to leaching or bioturbation, but because it is synthesized in situ from biogenic oxalic acid and protected from decomposition by occlusion or adsorption to pedogenic minerals. | Full credit for estimating ~65-70% silicate Ca, ~15% clay mineral-sorbed Ca, and ~15% oxalate Ca. Partial credit for correctly identifying silicate Ca as the dominant phase (>60%) with minor but roughly equal contributions from clay-sorbed Ca and oxalate Ca. |
| q3 | reasoning | 40 | Explain the biogeochemical reasoning for the observed Ca speciation in this deep subsoil (CBw) horizon of a Dystric Cambisol on silicate bedrock, particularly regarding the unexpected presence of organic Ca at this depth. | In the deep subsoil (CBw) horizon of a Dystric Cambisol developed from basalt, the dominant Ca species is primary silicate Ca, reflecting the unweathered or partially weathered silicate bedrock. As these primary silicates weather, they produce clay minerals that account for the secondary clay mineral-sorbed Ca fraction. The unexpected presence of organic Ca, specifically Ca oxalate, at this depth is not caused by bioturbation or leaching from upper organic layers. Instead, it arises from in situ synthesis where biogenic oxalic acid reacts directly with Ca in the soil solution. This organic Ca oxalate survives in the deep subsoil because it is protected against decomposition through adsorption or occlusion by pedogenic minerals. | Full credit for explaining that primary silicate Ca dominates due to the basaltic parent material and limited weathering at depth, while the presence of Ca oxalate is due to in situ synthesis by biogenic oxalic acid and subsequent protection from decomposition by association with pedogenic minerals. |
Review
#261
plant foliage
Ca K
▶
LLM Prompt
Sample Information
Material: plant foliage
Sample Origin: Achenpass, German Alps, Germany
Sample-Specific Conditions
- Plant species: Beech
- Foliage of European beech
Measurement
We plan to measure the Ca K XANES spectrum of this sample.
Questions
Based on all the information above:
1. Based on the sample conditions (European beech foliage from Achenpass), what are the expected major Ca phases and their approximate mass fractions?
2. What reference spectra should be included in the linear combination fitting basis to accurately model the Ca K-edge XANES spectrum of this broadleaf foliage sample?
3. Explain the biological and physiological reasons for the specific Ca speciation observed in this beech foliage, particularly regarding the dominant phase and the presence of phosphorus-associated Ca.
Ground Truth
Material: plant foliage
Measurement: Ca K-edge XANES, fluorescence mode, Beamline 8 of SLRI
Fit method: Linear combination fitting (LCF)
Phase fractions: (±10%)
| Phase | Fraction |
|---|---|
| Oxalate Ca | 0.511 |
| Pectate Ca | 0.351 |
| Phytate Ca | 0.137 |
Fit basis (paper's reference spectra):
- Ca oxalate
- Ca pectate
- Ca phytate
- Ca citrate
Source evidence: Table 7, page 211; Figure 6, page 212
Key reasoning: Broadleaf species like European beech (Fagus sylvatica) are characterized by large stomatal conductance and high foliar Ca concentrations. To manage excess Ca taken up passively via the transpiration stream, they intensively synthesize Ca oxalate and deposit it in cell walls and vacuoles, which also provides protection against herbivory. Furthermore, unlike many other tree species, beech accumulates a significant amount of phosphorus in its foliage in the form of Ca phytate. The remaining organically bound Ca is primarily present as Ca pectate.
Reasoning source: Results (Plant samples), page 206; Discussion (Speciation of organically bound soil Ca as affected by plant input and microbial turnover), page 215; Discussion (The fate of Ca oxalate in calcareous and silicate soils), page 216
Scoring Rubric (total: 100 pts)
| Q | Type | Max | Question | Reference Answer | Scoring Criteria |
|---|---|---|---|---|---|
| q1 | quantification | 40 | Based on the sample conditions (European beech foliage from Achenpass), what are the expected major Ca phases and their approximate mass fractions? | The expected major Ca phases in the European beech foliage are Ca oxalate (0.511 or 51.1%), Ca pectate (0.351 or 35.1%), and Ca phytate (0.137 or 13.7%), with an estimated uncertainty of 10%. These specific fractions result from the physiological traits of broadleaf species like beech, which have large stomatal conductance and consequently high passive Ca uptake via the transpiration stream. To manage this excess Ca, the plant intensively synthesizes Ca oxalate as the dominant fraction (~51%) for deposition in cell walls and vacuoles. The ~14% Ca phytate fraction arises because beech uniquely accumulates significant phosphorus in its foliage, while the remaining organically bound calcium makes up the ~35% Ca pectate fraction. | Full points if the answer identifies Ca oxalate (~50%), Ca pectate (~35%), and Ca phytate (~10-15%). Partial credit for identifying the correct phases with inaccurate fractions. |
| q2 | identification | 20 | What reference spectra should be included in the linear combination fitting basis to accurately model the Ca K-edge XANES spectrum of this broadleaf foliage sample? | The linear combination fitting (LCF) basis for this European beech foliage sample should include reference spectra for Ca oxalate, Ca pectate, Ca phytate, and Ca citrate. These specific reference phases are necessary because broadleaf species like beech take up excess Ca passively due to their high stomatal conductance and transpiration stream. To regulate this excess calcium, the foliage intensively synthesizes Ca oxalate for storage in cell walls and vacuoles, a process that also deters herbivory. Additionally, beech foliage accumulates a significant amount of phosphorus as Ca phytate, while the remainder of the organically bound calcium is primarily present as Ca pectate, dictating the need for these specific standards to accurately model the XANES spectrum. | Full points for listing organic Ca carboxylates and phosphates relevant to plant tissue, specifically Ca oxalate, Ca pectate, and Ca phytate. |
| q3 | reasoning | 40 | Explain the biological and physiological reasons for the specific Ca speciation observed in this beech foliage, particularly regarding the dominant phase and the presence of phosphorus-associated Ca. | The specific Ca speciation in European beech foliage is driven by the plant's large stomatal conductance, which causes high passive uptake of Ca via the transpiration stream. To manage this excess foliar Ca, the plant intensively synthesizes Ca oxalate as the dominant phase, depositing it into cell walls and vacuoles where it also provides protection against herbivory. Furthermore, unlike many other tree species, beech accumulates a significant amount of phosphorus in its foliage, which binds with calcium to form the observed phosphorus-associated Ca phytate phase. The remaining organically bound calcium in the foliage is primarily maintained as Ca pectate. | Full points if the answer explains that broadleaf trees have high stomatal conductance leading to excess Ca uptake, which is managed by synthesizing and depositing Ca oxalate in vacuoles/cell walls. Must also mention that beech specifically accumulates phosphorus as Ca phytate, alongside structural Ca pectate. |
Review
#262
plant foliage
Ca K
▶
LLM Prompt
Sample Information
Material: plant foliage
Sample Origin: Mangfall Mts, German Alps, Germany
Sample-Specific Conditions
- Plant species: Beech
- Foliage of European beech
Measurement
We plan to measure the Ca K XANES spectrum of this sample.
Questions
Based on all the information above:
1. Based on the sample conditions (foliage of European beech), what are the primary Ca-bearing phases expected to be identified by Ca K-edge XANES?
2. Estimate the relative fractions of the Ca phases in the European beech foliage sample.
3. Explain the physiological and ecological reasons for the specific Ca speciation observed in European beech foliage, particularly focusing on the roles of oxalate and phytate.
Ground Truth
Material: plant foliage
Measurement: Ca K-edge XANES, fluorescence mode, Beamline 8 of SLRI
Fit method: Linear combination fitting (LCF)
Phase fractions: (±10%)
| Phase | Fraction |
|---|---|
| Oxalate Ca | 0.538 |
| Pectate Ca | 0.371 |
| Phytate Ca | 0.091 |
Fit basis (paper's reference spectra):
- Ca oxalate
- Ca pectate
- Ca phytate
- Ca citrate
- Ca acetate
- Ca lactate
- Ca formate
- Calcite
- Aragonite
- Dolomite
- Apatite
- Brushite
- Monetite
- Anorthite
- Augite
- Epidote
- Ca adsorbed to montmorillonite
- Gypsum
- Anhydrite
- Fluorite
- Sinjarite
Source evidence: Table 7, page 211; Figure 6, page 212
Key reasoning: In broadleaf trees like beech, calcium is taken up passively and transported to the foliage, where excess Ca is deposited as Ca oxalate in cell walls and vacuoles to prevent toxicity. This process is intensive due to large stomatal conductance and high foliar Ca concentrations. Additionally, beech accumulates a significant amount of phosphorus in its foliage as Ca phytate, distinguishing it from other species like spruce or maple. Ca pectate is also a major structural component of the foliage.
Reasoning source: Results (Plant samples), page 206; Discussion (The fate of Ca oxalate in calcareous and silicate soils), page 216; Discussion (Speciation of organically bound soil Ca as affected by plant input and microbial turnover), page 215
Scoring Rubric (total: 100 pts)
| Q | Type | Max | Question | Reference Answer | Scoring Criteria |
|---|---|---|---|---|---|
| q1 | identification | 30 | Based on the sample conditions (foliage of European beech), what are the primary Ca-bearing phases expected to be identified by Ca K-edge XANES? | The primary Ca-bearing phases expected to be identified in the European beech foliage are Ca oxalate, Ca pectate, and Ca phytate. These specific phases arise because broadleaf trees like beech passively take up and transport calcium to their foliage, where excess is deposited as Ca oxalate in cell walls and vacuoles to prevent toxicity. This oxalate deposition is particularly intensive in beech due to its large stomatal conductance and high foliar Ca concentrations. Furthermore, Ca pectate serves as a major structural component of the foliage, while Ca phytate forms because beech uniquely accumulates significant amounts of phosphorus in its leaves compared to other tree species. | Full points for identifying Ca oxalate, Ca pectate, and Ca phytate as the primary phases. |
| q2 | quantification | 30 | Estimate the relative fractions of the Ca phases in the European beech foliage sample. | The estimated relative fractions for the Ca phases in the European beech foliage are 53.8% Ca oxalate, 37.1% Ca pectate, and 9.1% Ca phytate, with an uncertainty of 10%. Ca oxalate dominates the composition (53.8%) because beech trees have large stomatal conductance and high foliar Ca concentrations, necessitating the intensive deposition of excess calcium into cell walls and vacuoles to prevent toxicity. Ca pectate makes up a substantial secondary fraction (37.1%) because it is a fundamental structural component required for the plant foliage. Finally, the minor but significant fraction of Ca phytate (9.1%) is present because beech specifically accumulates phosphorus in its foliage, distinguishing its chemical makeup from other species like spruce or maple. | Full points for estimating ~50-55% Ca oxalate, ~35-40% Ca pectate, and ~10% Ca phytate. |
| q3 | reasoning | 40 | Explain the physiological and ecological reasons for the specific Ca speciation observed in European beech foliage, particularly focusing on the roles of oxalate and phytate. | In European beech foliage, the specific Ca speciation is driven by the plant's passive uptake and transport mechanisms for calcium. Because beech has large stomatal conductance, it accumulates high foliar Ca concentrations, which can become toxic to the plant. To prevent this toxicity, the tree intensively deposits the excess calcium as Ca oxalate within the cell walls and vacuoles, resulting in its dominance as the primary Ca phase. Additionally, beech trees accumulate a significant amount of phosphorus in their foliage, which binds with calcium to form Ca phytate, a physiological feature that distinguishes beech from other species. Alongside these processes, Ca pectate is consistently formed as a major structural component of the foliage tissue. | Full points for explaining that passive Ca uptake via transpiration leads to excess Ca, which is deposited as Ca oxalate in vacuoles/cell walls to prevent toxicity, and noting that beech specifically accumulates phosphorus as Ca phytate. |
Review
#263
plant foliage
Ca K
▶
LLM Prompt
Sample Information
Material: plant foliage
Sample Origin: Wellheim, Franconian Alb, Germany
Sample-Specific Conditions
- Plant species: Beech
- Foliage of European beech
Measurement
We plan to measure the Ca K XANES spectrum of this sample.
Questions
Based on all the information above:
1. Based on the sample conditions (European beech foliage), what candidate Ca reference spectra should be included in a linear combination fitting (LCF) analysis of its Ca K-edge XANES spectrum?
2. Estimate the relative fractions of the Ca phases present in this European beech foliage sample.
3. Explain the physiological reasoning for the expected Ca speciation in broadleaf tree foliage such as European beech, specifically addressing why large amounts of Ca oxalate and detectable amounts of Ca phytate are present.
Ground Truth
Material: plant foliage
Measurement: Ca K-edge XANES in fluorescence mode at Beamline 8 of the Synchrotron Light Research Institute (SLRI)
Fit method: Linear combination fitting (LCF)
Phase fractions: (±10%)
| Phase | Fraction |
|---|---|
| Ca oxalate | 0.521 |
| Ca pectate | 0.421 |
| Ca phytate | 0.058 |
Fit basis (paper's reference spectra):
- Ca oxalate
- Ca pectate
- Ca phytate
Source evidence: Table 7 and Figure 6, pages 211-212
Key reasoning: Calcium is taken up passively by plant roots and transported with the transpiration water stream to the foliage, where excess Ca is deposited as Ca oxalate in cell walls and vacuoles. This process is particularly intensive for broadleaf trees like European beech (Fagus sylvatica), which are characterized by large stomatal conductance and large foliar Ca concentrations. Furthermore, in contrast to other species like spruce, fir, and maple, beech accumulates a significant amount of phosphorus in its foliage as Ca phytate. Ca pectate is also a major structural component of the broadleaf foliage.
Reasoning source: Results (Plant samples) on page 206, and Discussion (The fate of Ca oxalate in calcareous and silicate soils) on page 216
Scoring Rubric (total: 100 pts)
| Q | Type | Max | Question | Reference Answer | Scoring Criteria |
|---|---|---|---|---|---|
| q1 | identification | 30 | Based on the sample conditions (European beech foliage), what candidate Ca reference spectra should be included in a linear combination fitting (LCF) analysis of its Ca K-edge XANES spectrum? | The candidate Ca reference spectra for the linear combination fitting (LCF) analysis of the European beech foliage should include Ca oxalate, Ca pectate, and Ca phytate. These specific phases are expected because calcium is passively transported to the foliage via the transpiration stream, where broadleaf trees like beech deposit excess Ca as Ca oxalate in cell walls and vacuoles due to their large stomatal conductance. Additionally, Ca pectate must be included because it serves as a major structural component in broadleaf foliage. Finally, unlike other tree species, beech specifically accumulates significant amounts of phosphorus in its leaves in the form of Ca phytate, necessitating its inclusion in the fit basis. | Full points for identifying Ca oxalate, Ca pectate, and Ca phytate as the primary organic Ca phases in beech foliage. |
| q2 | quantification | 35 | Estimate the relative fractions of the Ca phases present in this European beech foliage sample. | The estimated relative fractions for the Ca phases in the European beech foliage are 52.1% Ca oxalate, 42.1% Ca pectate, and 5.8% Ca phytate, with an uncertainty of 10%. These specific values result from the physiological characteristics of broadleaf trees like beech, which have large stomatal conductance leading to high foliar Ca concentrations and the massive deposition of excess Ca as Ca oxalate, making it the dominant phase. Ca pectate makes up the second largest fraction because it is a major, necessary structural component of the broadleaf foliage. The minor but distinct fraction of Ca phytate arises because beech uniquely accumulates phosphorus in its foliage in this form, unlike other species such as spruce, fir, or maple. | Full points for estimating ~50-55% Ca oxalate, ~40-45% Ca pectate, and ~5-10% Ca phytate. Partial credit if the dominant phases (oxalate and pectate) are correctly identified as making up >90% of the total Ca. |
| q3 | reasoning | 35 | Explain the physiological reasoning for the expected Ca speciation in broadleaf tree foliage such as European beech, specifically addressing why large amounts of Ca oxalate and detectable amounts of Ca phytate are present. | In broadleaf trees like European beech, calcium is taken up passively by the roots and transported to the foliage via the transpiration water stream. Because beech trees have large stomatal conductance, they accumulate large foliar Ca concentrations, and the excess calcium is deposited heavily as Ca oxalate in the cell walls and vacuoles. Furthermore, beech foliage contains detectable amounts of Ca phytate because this specific species accumulates a significant amount of phosphorus in its leaves in this form, which contrasts with other trees like spruce, fir, and maple. Finally, a large portion of the remaining calcium is bound as Ca pectate, which acts as a major structural component of the broadleaf foliage. | Full points for explaining that Ca is passively transported via the transpiration stream and excess is deposited as Ca oxalate in vacuoles/cell walls (especially high in broadleaf trees due to high stomatal conductance), and noting that beech specifically accumulates phosphorus as Ca phytate. |
Review
#264
plant foliage
Ca K
▶
LLM Prompt
Sample Information
Material: plant foliage
Sample Origin: Achenpass, German Alps, Germany
Sample-Specific Conditions
- Plant species: Maple
- Foliage of sycamore maple
Measurement
We plan to measure the Ca K XANES spectrum of this sample.
Questions
Based on all the information above:
1. What candidate reference spectra are most appropriate for modeling the Ca K-edge XANES spectrum of broadleaf tree foliage (such as sycamore maple) using linear combination fitting?
2. Based on the sample conditions (sycamore maple foliage), estimate the relative fractions of the major Ca phases present.
3. Explain the physiological reasoning for the specific Ca speciation (particularly the high fraction of Ca oxalate) observed in the foliage of broadleaf trees like maple.
Ground Truth
Material: plant foliage
Measurement: Ca K-edge XANES in fluorescence mode at Beamline 8 of SLRI
Fit method: Linear combination fitting (LCF)
Phase fractions: (±10%)
| Phase | Fraction |
|---|---|
| Oxalate Ca | 0.496 |
| Pectate Ca | 0.456 |
| Phytate Ca | 0.048 |
Fit basis (paper's reference spectra):
- Ca oxalate
- Ca pectate
- Ca phytate
- Ca citrate
Source evidence: Table 7, page 211
Key reasoning: Calcium is taken up passively by plant roots and transported with the transpiration water stream to the foliage. Excess Ca is deposited as Ca oxalate in cell walls and foliage cell vacuoles to dispose of it and prevent toxicity. This process is particularly intensive for broadleaf trees (e.g., Acer spp.) which are characterized by large stomatal conductance and large foliar Ca concentrations. Consequently, broadleaf foliage Ca speciation is dominated by Ca oxalate (~50%) and Ca pectate (~40-46%), with minor amounts of Ca phytate.
Reasoning source: Section 'The fate of Ca oxalate in calcareous and silicate soils', page 216; Section 'Plant samples', page 206
Scoring Rubric (total: 100 pts)
| Q | Type | Max | Question | Reference Answer | Scoring Criteria |
|---|---|---|---|---|---|
| q1 | identification | 20 | What candidate reference spectra are most appropriate for modeling the Ca K-edge XANES spectrum of broadleaf tree foliage (such as sycamore maple) using linear combination fitting? | The most appropriate candidate reference spectra for modeling the Ca K-edge XANES spectrum of sycamore maple foliage using linear combination fitting are Ca oxalate, Ca pectate, Ca phytate, and Ca citrate. These specific phases are expected because calcium is passively taken up by plant roots and transported to the foliage via the transpiration water stream. In broadleaf trees like maple, which have large stomatal conductance and high foliar Ca concentrations, excess calcium must be managed to prevent toxicity. Consequently, the plant deposits this excess calcium primarily as Ca oxalate and Ca pectate in cell walls and vacuoles, making them the dominant reference phases required for spectral fitting. | Must identify organic Ca compounds, specifically Ca oxalate, Ca pectate, and Ca phytate. |
| q2 | quantification | 40 | Based on the sample conditions (sycamore maple foliage), estimate the relative fractions of the major Ca phases present. | The relative fractions of the major Ca phases in the sycamore maple foliage are estimated to be 49.6% Ca oxalate, 45.6% Ca pectate, and 4.8% Ca phytate, with an uncertainty of 10%. These specific values result from the physiological characteristics of broadleaf trees, which exhibit large stomatal conductance and accumulate large foliar Ca concentrations from the transpiration water stream. To dispose of excess calcium and prevent toxicity, the maple tree heavily deposits it into cell walls and foliage cell vacuoles. This intensive detoxification process directly leads to a speciation dominated by Ca oxalate (~50%) and Ca pectate (~40-46%), leaving only minor amounts of Ca phytate. | Must estimate Ca oxalate at ~50%, Ca pectate at ~40-46%, and Ca phytate at ~5-10%. |
| q3 | reasoning | 40 | Explain the physiological reasoning for the specific Ca speciation (particularly the high fraction of Ca oxalate) observed in the foliage of broadleaf trees like maple. | In broadleaf trees like sycamore maple, calcium is taken up passively by the roots and transported to the foliage along with the transpiration water stream. Because broadleaf trees are characterized by large stomatal conductance, they accumulate large foliar Ca concentrations. To prevent toxicity from this excess calcium, the plant actively deposits it into cell walls and foliage cell vacuoles to safely dispose of it. This physiological detoxification mechanism directly results in the observed Ca speciation, which is heavily dominated by Ca oxalate (49.6%) and Ca pectate (45.6%), with only minor amounts of Ca phytate (4.8%) present. | Must mention passive Ca uptake via the transpiration stream, large stomatal conductance in broadleaf trees leading to high Ca accumulation, and the deposition of excess Ca as Ca oxalate in vacuoles/cell walls to prevent toxicity. |
Review
#265
plant foliage
Ca K
▶
LLM Prompt
Sample Information
Material: plant foliage
Sample Origin: Mangfall Mts, German Alps, Germany
Sample-Specific Conditions
- Plant species: Maple
- Foliage of sycamore maple
Measurement
We plan to measure the Ca K XANES spectrum of this sample.
Questions
Based on all the information above:
1. What candidate reference spectra are needed to model the Ca speciation in broadleaf tree foliage (e.g., maple) using linear combination fitting?
2. Estimate the relative fractions of the major Ca species in maple foliage.
3. Explain the physiological reasoning for the accumulation of these specific Ca species in broadleaf foliage.
Ground Truth
Material: plant foliage
Measurement: Ca K-edge XANES, fluorescence mode, Beamline 8 at SLRI
Fit method: Linear combination fitting (LCF)
Phase fractions: (±10%)
| Phase | Fraction |
|---|---|
| Ca oxalate | 0.5 |
| Ca pectate | 0.5 |
Fit basis (paper's reference spectra):
- Ca oxalate
- Ca pectate
- Ca citrate
- Ca phytate
Source evidence: Table 7, page 211
Key reasoning: Calcium is taken up passively by plant roots and transported with the transpiration water stream to the foliage. In broadleaf trees like maple (Acer spp.), which have large stomatal conductance and high foliar Ca concentrations, excess Ca is deposited as Ca oxalate in cell walls and vacuoles to prevent toxicity and maintain water uptake. The remaining Ca is bound to structural organic components such as pectate.
Reasoning source: Section 'The fate of Ca oxalate in calcareous and silicate soils', page 216
Scoring Rubric (total: 100 pts)
| Q | Type | Max | Question | Reference Answer | Scoring Criteria |
|---|---|---|---|---|---|
| q1 | identification | 30 | What candidate reference spectra are needed to model the Ca speciation in broadleaf tree foliage (e.g., maple) using linear combination fitting? | To model the Ca speciation in broadleaf tree foliage like sycamore maple using linear combination fitting, the candidate reference spectra needed are Ca oxalate, Ca pectate, Ca citrate, and Ca phytate. These specific phases are expected because calcium is passively transported to the foliage via the transpiration stream, leading to high foliar Ca concentrations due to the tree's large stomatal conductance. To prevent toxicity and maintain water uptake, the maple tree deposits excess calcium as Ca oxalate in cell walls and vacuoles. Meanwhile, the remaining calcium binds to structural organic components, necessitating references like Ca pectate to fully capture the sample's speciation. | Full credit for identifying organic Ca carboxylates, specifically Ca oxalate and Ca pectate, as the primary reference spectra needed. |
| q2 | quantification | 30 | Estimate the relative fractions of the major Ca species in maple foliage. | In maple foliage, the relative fractions of the major Ca species are estimated to be 0.5 (50%) Ca oxalate and 0.5 (50%) Ca pectate, with a fitting uncertainty of 10%. These specific values arise because broadleaf trees like the sycamore maple passively take up calcium and transport it via the transpiration water stream. Due to their large stomatal conductance, high concentrations of calcium accumulate in the foliage. To prevent toxicity and maintain water uptake, the plant deposits half of this accumulated calcium as Ca oxalate in cell walls and vacuoles, while the remaining half is bound to structural organic components as Ca pectate. | Full credit for estimating approximately 50% Ca oxalate and 50% Ca pectate. |
| q3 | reasoning | 40 | Explain the physiological reasoning for the accumulation of these specific Ca species in broadleaf foliage. | The accumulation of 50% Ca oxalate and 50% Ca pectate in broadleaf foliage like sycamore maple is driven by the plant's water transpiration mechanism. Calcium is taken up passively by the roots and transported to the foliage along with the transpiration water stream. Because broadleaf trees have large stomatal conductance, they accumulate high foliar calcium concentrations. To prevent calcium toxicity and maintain continuous water uptake, the plant must safely sequester the excess calcium by depositing it as Ca oxalate in cell walls and vacuoles, while the remaining calcium is utilized by binding to structural organic components such as pectate. | Full credit for explaining that excess Ca from the transpiration stream is deposited as Ca oxalate in vacuoles/cell walls to prevent toxicity, a process that is particularly intensive in broadleaf trees due to high stomatal conductance, while the rest is bound to structural components like pectate. |
Review
#266
plant foliage
Ca K
▶
LLM Prompt
Sample Information
Material: plant foliage
Sample Origin: Achenpass, German Alps, Germany
Sample-Specific Conditions
- Plant species: Spruce
- Current-year needles of Norway spruce
Measurement
We plan to measure the Ca K XANES spectrum of this sample.
Questions
Based on all the information above:
1. Based on the sample conditions (current-year spruce needles), what candidate reference spectra should be included in a linear combination fitting analysis of its Ca K-edge XANES spectrum?
2. Estimate the relative fractions of the Ca phases present in this spruce foliage sample.
3. Explain the physiological and ecological reasoning for the dominance of the primary Ca phase in this conifer foliage sample.
Ground Truth
Material: plant foliage
Measurement: Ca K-edge XANES in fluorescence mode at Beamline 8 of SLRI
Fit method: Linear combination fitting (LCF)
Phase fractions: (±10%)
| Phase | Fraction |
|---|---|
| Ca oxalate | 0.9 |
| Ca citrate | 0.1 |
Fit basis (paper's reference spectra):
- Ca oxalate
- Ca citrate
- Ca pectate
- Ca phytate
Source evidence: Table 7 and text on page 206 (Plant samples section)
Key reasoning: In conifer species like spruce, foliage Ca speciation is strongly dominated by oxalate-bound Ca (90%) with a minor contribution from citrate-Ca (10%). Calcium is taken up passively by plant roots and transported with the transpiration stream to the foliage. Excess Ca is deposited as Ca oxalate in cell walls and foliage cell vacuoles, which allows the plant to maintain water uptake and photosynthesis without costly Ca discrimination at the soil-root interface, while also providing protection against herbivory.
Reasoning source: Results section 'Plant samples' (page 206) and Discussion section 'The fate of Ca oxalate in calcareous and silicate soils' (page 216)
Scoring Rubric (total: 100 pts)
| Q | Type | Max | Question | Reference Answer | Scoring Criteria |
|---|---|---|---|---|---|
| q1 | identification | 30 | Based on the sample conditions (current-year spruce needles), what candidate reference spectra should be included in a linear combination fitting analysis of its Ca K-edge XANES spectrum? | The linear combination fitting analysis of the Ca K-edge XANES spectrum for this spruce foliage sample should include Ca oxalate, Ca citrate, Ca pectate, and Ca phytate as candidate reference spectra. These specific references are chosen because calcium in conifer species like Norway spruce is primarily transported and stored in these organic forms. Specifically, calcium is taken up passively by roots and transported to the foliage via the transpiration stream, where excess Ca must be managed by the plant. Therefore, these organic calcium salts represent the expected physiological sinks for calcium deposited in the cell walls and vacuoles of current-year spruce needles. | Full credit for identifying organic Ca carboxylates, specifically Ca oxalate and Ca citrate. Partial credit for mentioning other plant-relevant organic Ca forms like Ca pectate or Ca phytate. |
| q2 | quantification | 30 | Estimate the relative fractions of the Ca phases present in this spruce foliage sample. | The Ca speciation in this current-year Norway spruce needle sample is estimated to be 90% Ca oxalate and 10% Ca citrate, with an uncertainty of approximately 10%. These specific fractions result from the physiological mechanisms of conifer species, which passively take up calcium from the soil and transport it to the foliage via the transpiration stream. To maintain water uptake and photosynthesis without expending energy on costly calcium discrimination at the soil-root interface, the plant deposits the vast majority (90%) of this excess calcium as insoluble Ca oxalate. The minor 10% fraction of Ca citrate represents the remaining organic calcium pool within the foliage. | Full credit for estimating ~90% Ca oxalate and ~10% Ca citrate. Partial credit if Ca oxalate is identified as the strongly dominant phase (>80%) with minor other organic Ca forms. |
| q3 | reasoning | 40 | Explain the physiological and ecological reasoning for the dominance of the primary Ca phase in this conifer foliage sample. | The primary Ca phase in this Norway spruce foliage sample is Ca oxalate, which accounts for 90% of the calcium speciation. This dominance occurs because calcium is taken up passively by the plant roots and transported directly to the foliage alongside the transpiration stream. Rather than performing costly calcium discrimination at the soil-root interface, the spruce plant manages excess calcium by precipitating it as Ca oxalate in cell walls and foliage cell vacuoles. This physiological mechanism allows the plant to safely maintain essential water uptake and photosynthesis, while the resulting Ca oxalate deposits also provide an ecological advantage by protecting the needles against herbivory. | Full credit for explaining that excess passively-transported Ca is deposited as Ca oxalate in vacuoles/cell walls to avoid costly Ca discrimination at the roots, maintain photosynthesis/water uptake, and/or protect against herbivory. |
Review
#267
plant foliage
Ca K
▶
LLM Prompt
Sample Information
Material: plant foliage
Sample Origin: Mangfall Mts, German Alps, Germany
Sample-Specific Conditions
- Plant species: Spruce
- Current-year needles of Norway spruce
Measurement
We plan to measure the Ca K XANES spectrum of this sample.
Questions
Based on all the information above:
1. Based on the sample conditions (current-year needles of Norway spruce), what candidate reference spectra are needed to model the Ca K-edge XANES spectrum using linear combination fitting?
2. Estimate the relative phase fractions of the Ca species present in this spruce foliage sample.
3. Explain the physiological reasoning behind the expected Ca speciation in spruce foliage. Why is the dominant phase formed, and how does this speciation pattern generally differ from that found in broadleaf tree foliage?
Ground Truth
Material: plant foliage
Measurement: Ca K-edge XANES, fluorescence mode, Beamline 8 at SLRI
Fit method: Linear combination fitting (LCF)
Phase fractions: (±10%)
| Phase | Fraction |
|---|---|
| Ca oxalate | 0.86 |
| Ca citrate | 0.14 |
Fit basis (paper's reference spectra):
- Ca oxalate
- Ca citrate
- Ca pectate
- Ca phytate
Source evidence: Table 7, page 211; Figure 6, page 212
Key reasoning: Calcium is taken up passively by plant roots and transported with the transpiration stream to the foliage, where excess Ca is deposited as Ca oxalate in cell walls and vacuoles. Conifer species like spruce are characterized by a strong dominance of oxalate-bound Ca (around 90%) with minor amounts of citrate-Ca. This differs markedly from broadleaf species, which typically contain lower proportions of Ca oxalate and significant shares of Ca pectate and Ca phytate.
Reasoning source: Results section 'Plant samples' (page 206) and Discussion section 'The fate of Ca oxalate in calcareous and silicate soils' (page 216)
Scoring Rubric (total: 100 pts)
| Q | Type | Max | Question | Reference Answer | Scoring Criteria |
|---|---|---|---|---|---|
| q1 | identification | 30 | Based on the sample conditions (current-year needles of Norway spruce), what candidate reference spectra are needed to model the Ca K-edge XANES spectrum using linear combination fitting? | To model the Ca K-edge XANES spectrum of the spruce foliage using linear combination fitting, the required candidate reference spectra are Ca oxalate, Ca citrate, Ca pectate, and Ca phytate. These specific references are necessary because calcium is passively transported to the plant foliage, where different tree types store the excess calcium in distinct chemical forms. In conifer species like Norway spruce, this excess is primarily deposited as Ca oxalate and Ca citrate in cell walls and vacuoles. Including Ca pectate and Ca phytate in the fit basis is also essential to distinguish the conifer's speciation from broadleaf species, which typically contain significant amounts of these other phases. | Full points if the answer identifies Ca oxalate and Ca citrate (or general carboxylates) as the primary required reference spectra. Partial points if other organic Ca forms (like pectate or phytate) are mentioned without noting their absence or minor role in conifers. |
| q2 | quantification | 30 | Estimate the relative phase fractions of the Ca species present in this spruce foliage sample. | The relative phase fractions for this Norway spruce foliage sample are estimated to be 0.86 (86%) Ca oxalate and 0.14 (14%) Ca citrate, with an uncertainty of 10%. These specific values arise from the physiological mechanisms of conifer species, which passively take up calcium through their roots and transport it to the needles via the transpiration stream. To manage the excess calcium, spruce trees deposit it primarily in cell walls and vacuoles, resulting in a strong dominance of oxalate-bound Ca (around 90%) and minor amounts of citrate-Ca. This contrasts with broadleaf species, explaining why no Ca pectate or Ca phytate fractions are present in this spruce sample. | Full points if the estimated fractions are approximately 85-90% Ca oxalate and 10-15% Ca citrate. Partial points if Ca oxalate is identified as the strongly dominant phase (>75%) but the minor phase is misidentified or the proportions are slightly off. |
| q3 | reasoning | 40 | Explain the physiological reasoning behind the expected Ca speciation in spruce foliage. Why is the dominant phase formed, and how does this speciation pattern generally differ from that found in broadleaf tree foliage? | The expected Ca speciation in spruce foliage is driven by the passive uptake of calcium by plant roots and its subsequent transport to the needles via the transpiration stream. Because the plant must manage this continuous influx of calcium, the excess is deposited as Ca oxalate in the cell walls and vacuoles, making it the dominant phase (around 90%) alongside minor amounts of Ca citrate. This physiological storage mechanism in conifers like Norway spruce differs markedly from that of broadleaf tree species. Broadleaf foliage typically contains much lower proportions of Ca oxalate and instead features significant shares of Ca pectate and Ca phytate. | Full points if the answer explains that excess passively transported Ca is deposited in vacuoles/cell walls as Ca oxalate to regulate Ca levels, and notes that conifers are heavily dominated by Ca oxalate/citrate whereas broadleaf species have higher proportions of Ca pectate and Ca phytate. |
Review
#268
plant foliage
Ca K
▶
LLM Prompt
Sample Information
Material: plant foliage
Sample Origin: Achenpass, German Alps, Germany
Sample-Specific Conditions
- Plant species: Spruce
- Older needles of Norway spruce
Measurement
We plan to measure the Ca K XANES spectrum of this sample.
Questions
Based on all the information above:
1. Based on the sample conditions (older spruce foliage), what are the expected primary Ca phases, and what reference spectra should be included in a linear combination fitting (LCF) analysis?
2. Estimate the relative fractions of the Ca phases present in this older spruce foliage sample.
3. Explain the physiological reasoning for the observed Ca speciation in conifer foliage such as spruce, particularly regarding the dominant phase.
Ground Truth
Material: plant foliage
Measurement: Ca K-edge XANES in fluorescence mode at Beamline 8 of SLRI
Fit method: Linear combination fitting (LCF)
Phase fractions: (±10%)
| Phase | Fraction |
|---|---|
| Oxalate Ca | 0.887 |
| Citrate Ca | 0.113 |
Fit basis (paper's reference spectra):
- Ca oxalate
- Ca citrate
- Ca pectate
- Ca phytate
Source evidence: Table 7 (page 211) and Figure 6 (page 212)
Key reasoning: In conifer species like spruce, calcium speciation is strongly dominated by oxalate-bound Ca (approx. 90%), with the remainder being citrate-Ca (approx. 10%). Calcium is taken up passively by roots and transported to foliage, where excess Ca is deposited as Ca oxalate in cell vacuoles to prevent toxicity and maintain water uptake without costly Ca discrimination. There is no significant difference in Ca speciation between current-year and older conifer needles.
Reasoning source: Results section 'Plant samples' (page 206) and Discussion section 'The fate of Ca oxalate in calcareous and silicate soils' (page 216)
Scoring Rubric (total: 100 pts)
| Q | Type | Max | Question | Reference Answer | Scoring Criteria |
|---|---|---|---|---|---|
| q1 | identification | 30 | Based on the sample conditions (older spruce foliage), what are the expected primary Ca phases, and what reference spectra should be included in a linear combination fitting (LCF) analysis? | The expected primary Ca phases in the older spruce foliage are Ca oxalate and Ca citrate. For a complete linear combination fitting (LCF) analysis, the reference spectra basis should include Ca oxalate, Ca citrate, Ca pectate, and Ca phytate. These specific phases are expected because conifer species like Norway spruce passively take up calcium through their roots and transport it to the foliage. To prevent toxicity while maintaining water uptake without costly Ca discrimination, the plant deposits excess calcium into cell vacuoles primarily as Ca oxalate, a mechanism that remains consistent in both current-year and older needles. | Full points for identifying Ca oxalate as the dominant phase and Ca citrate as a minor phase, and listing them as necessary reference spectra. |
| q2 | quantification | 30 | Estimate the relative fractions of the Ca phases present in this older spruce foliage sample. | The relative fractions of Ca phases in this older spruce foliage sample are estimated to be 0.887 (88.7%) Oxalate Ca and 0.113 (11.3%) Citrate Ca, with an uncertainty of 10%. These specific values result from the physiological strategy of conifers, which passively transport calcium to their foliage and must manage the excess to prevent toxicity. Because the plant avoids metabolically costly calcium discrimination to maintain water uptake, the vast majority (approximately 90%) of the calcium is sequestered as Ca oxalate in cell vacuoles, leaving a minor fraction (approximately 10%) as citrate-Ca in both new and older needles. | Full points for estimating ~85-90% Oxalate Ca and ~10-15% Citrate Ca. Deduct points for estimates outside a +/- 10% range. |
| q3 | reasoning | 40 | Explain the physiological reasoning for the observed Ca speciation in conifer foliage such as spruce, particularly regarding the dominant phase. | In conifer foliage such as Norway spruce, calcium speciation is strongly dominated by oxalate-bound Ca (approximately 90%), with the remainder being citrate-Ca (approximately 10%). This speciation arises because calcium is taken up passively by the plant's roots and transported directly to the foliage. In order to maintain essential water uptake without engaging in metabolically costly calcium discrimination, the plant must safely manage the accumulating calcium. As a result, the excess calcium is deposited as Ca oxalate within the cell vacuoles to prevent toxicity, a physiological process that operates identically in both current-year and older needles. | Full points for explaining that excess Ca is passively taken up and deposited as Ca oxalate in cell vacuoles to prevent toxicity, allowing the plant to maintain water uptake without costly Ca discrimination at the roots. |
Review
#269
plant foliage
Ca K
▶
LLM Prompt
Sample Information
Material: plant foliage
Sample Origin: Mangfall Mts, German Alps, Germany
Sample-Specific Conditions
- Plant species: Spruce
- Older needles of Norway spruce
Measurement
We plan to measure the Ca K XANES spectrum of this sample.
Questions
Based on all the information above:
1. Based on the sample conditions (older needles of Norway spruce), what are the expected major Ca phases and their approximate fractions?
2. What reference spectra would be most appropriate to include in a linear combination fitting (LCF) analysis of this sample?
3. Explain the biological and physiological reasons for the expected Ca speciation in this conifer foliage sample.
Ground Truth
Material: plant foliage
Measurement: Ca K-edge XANES in fluorescence mode at Beamline 8 of SLRI
Fit method: Linear combination fitting (LCF)
Phase fractions: (±10%)
| Phase | Fraction |
|---|---|
| Oxalate Ca | 0.913 |
| Citrate Ca | 0.088 |
Fit basis (paper's reference spectra):
- Ca oxalate
- Ca citrate
- Ca pectate
- Ca phytate
- Ca formate
- Ca acetate
- Ca lactate
- calcite
- aragonite
- dolomite
- apatite
- brushite
- monetite
- anorthite
- augite
- epidote
- Ca adsorbed to montmorillonite
- gypsum
- anhydrite
- fluorite
- sinjarite
Source evidence: Table 7, page 211
Key reasoning: Conifer foliage (such as spruce) is dominated by oxalate-bound Ca (~90%) and citrate-Ca (~10%), which differs from broadleaf species that contain significant pectate and phytate. Calcium is taken up passively by roots and transported to foliage, where excess Ca is deposited as Ca oxalate in cell walls and vacuoles. This deposition helps dispose of excess Ca, protects against herbivory, and allows the plant to maintain water uptake and photosynthesis without costly Ca discrimination at the roots.
Reasoning source: Results (Plant samples, page 206) and Discussion (The fate of Ca oxalate in calcareous and silicate soils, page 216)
Scoring Rubric (total: 100 pts)
| Q | Type | Max | Question | Reference Answer | Scoring Criteria |
|---|---|---|---|---|---|
| q1 | quantification | 40 | Based on the sample conditions (older needles of Norway spruce), what are the expected major Ca phases and their approximate fractions? | The expected major Ca phases in the older needles of Norway spruce are Oxalate Ca at a fraction of 0.913 (91.3%) and Citrate Ca at 0.088 (8.8%), with an estimated uncertainty of 10%. These specific values result from the physiological strategy of conifer foliage, which differs from broadleaf species by lacking significant pectate and phytate. Because calcium is taken up passively by the roots and transported to the foliage, excess Ca accumulates in the older needles. To maintain water uptake and photosynthesis without costly Ca discrimination at the roots, the spruce plant deposits this massive excess of calcium as Ca oxalate in cell walls and vacuoles, leading to the ~90% oxalate fraction. | Award full points if the answer identifies Ca oxalate as the strongly dominant phase (~90%) and Ca citrate as the minor phase (~10%). Deduct points if broadleaf-associated phases (pectate, phytate) are predicted in significant amounts. |
| q2 | identification | 30 | What reference spectra would be most appropriate to include in a linear combination fitting (LCF) analysis of this sample? | The most appropriate reference spectra for LCF analysis include organic standards (Ca oxalate, Ca citrate, Ca pectate, Ca phytate, Ca formate, Ca acetate, Ca lactate) and inorganic/mineral standards (calcite, aragonite, dolomite, apatite, brushite, monetite, anorthite, augite, epidote, Ca adsorbed to montmorillonite, gypsum, anhydrite, fluorite, sinjarite). These phases are expected in the fitting basis because the sample is Norway spruce foliage, which actively manages calcium taken up passively from the environment. To avoid toxicity and maintain photosynthesis without costly root-level discrimination, the plant transports excess Ca to the needles and deposits it primarily as Ca oxalate and Ca citrate in cell walls and vacuoles. Including this comprehensive mix of organic and mineral references allows the LCF to accurately isolate these dominant plant-derived organic phases from any other potential environmental minerals. | Award full points if the answer lists relevant organic Ca reference compounds, specifically Ca oxalate and Ca citrate, as well as other potential plant-relevant organic Ca forms (pectate, phytate, acetate, formate). |
| q3 | reasoning | 30 | Explain the biological and physiological reasons for the expected Ca speciation in this conifer foliage sample. | The expected Ca speciation in this Norway spruce foliage is approximately 90% Ca oxalate and 10% Ca citrate due to the plant's specific calcium management strategy. Calcium is taken up passively by the roots and transported to the foliage along with water. Because discriminating against calcium at the root level would be biologically costly, the plant instead maintains necessary water uptake and photosynthesis by allowing the Ca to enter the older needles. To safely dispose of this excess calcium, the plant precipitates it as Ca oxalate within the cell walls and vacuoles. This physiological mechanism not only regulates internal calcium levels but also provides the added benefit of protecting the foliage against herbivory. | Award full points if the answer explains that Ca is taken up passively and excess Ca is deposited as Ca oxalate in cell walls/vacuoles to dispose of it, protect against herbivory, and maintain water uptake/photosynthesis without costly Ca discrimination. |
Review
#270
plant foliage
Ca K
▶
LLM Prompt
Sample Information
Material: plant foliage
Sample Origin: Achenpass, German Alps, Germany
Sample-Specific Conditions
- Plant species: Fir
- Current-year needles of Silver fir
Measurement
We plan to measure the Ca K XANES spectrum of this sample.
Questions
Based on all the information above:
1. What candidate reference spectra are needed to model the Ca speciation in this conifer foliage sample using linear combination fitting?
2. Estimate the relative fractions of the Ca phases present in this current-year fir foliage sample.
3. Explain the physiological reasoning for the observed Ca speciation in conifer foliage, and contrast it with the expected speciation in broadleaf foliage.
Ground Truth
Material: plant foliage
Measurement: Ca K-edge XANES in fluorescence mode at Beamline 8 of SLRI
Fit method: Linear combination fitting (LCF)
Phase fractions: (±10%)
| Phase | Fraction |
|---|---|
| Oxalate Ca | 0.947 |
| Citrate Ca | 0.053 |
Fit basis (paper's reference spectra):
- Ca oxalate
- Ca citrate
- Ca pectate
- Ca phytate
Source evidence: Table 7, page 211
Key reasoning: Conifer species foliage (such as fir and spruce) is dominated by oxalate-bound Ca (around 90%) and citrate-Ca (around 10%), which differs markedly from broadleaf species that contain significant amounts of Ca pectate and Ca phytate. Calcium is taken up passively by plant roots and transported to the foliage, where excess Ca is deposited as Ca oxalate in cell walls and vacuoles. This allows the plant to maintain water uptake and photosynthesis without costly Ca discrimination at the root interface. There is no significant difference in Ca speciation between current-year and older conifer needles.
Reasoning source: Results section 'Plant samples' (page 206) and Discussion section 'The fate of Ca oxalate in calcareous and silicate soils' (page 216)
Scoring Rubric (total: 100 pts)
| Q | Type | Max | Question | Reference Answer | Scoring Criteria |
|---|---|---|---|---|---|
| q1 | identification | 20 | What candidate reference spectra are needed to model the Ca speciation in this conifer foliage sample using linear combination fitting? | To model the Ca speciation in this current-year Silver fir foliage sample using linear combination fitting, the required candidate reference spectra are Ca oxalate, Ca citrate, Ca pectate, and Ca phytate. These specific references are necessary because they cover the expected calcium compounds found across different plant types. In conifer foliage like fir needles, calcium is taken up passively by the roots and transported to the leaves, where excess Ca is deposited primarily as Ca oxalate in cell walls and vacuoles, alongside minor amounts of citrate-Ca. Including pectate and phytate in the basis set allows the fit to accurately distinguish this conifer-specific oxalate dominance from the speciation typical of broadleaf species. | Full points for identifying organic Ca carboxylate and phosphate phases typical of plant foliage, specifically Ca oxalate and Ca citrate (with Ca pectate and Ca phytate as other potential candidates for foliage in general). |
| q2 | quantification | 40 | Estimate the relative fractions of the Ca phases present in this current-year fir foliage sample. | The Ca speciation in this current-year Silver fir foliage sample is estimated to be 94.7% Oxalate Ca and 5.3% Citrate Ca, with an uncertainty of 10%. These specific values result from the physiological behavior of conifer species, which are typically dominated by around 90% oxalate-bound Ca and 10% citrate-Ca. This high oxalate fraction occurs because the fir tree passively takes up calcium through its roots and deposits the excess as Ca oxalate in the foliage's cell walls and vacuoles to maintain water uptake and photosynthesis. Additionally, the fact that these are current-year needles does not change this expected distribution, as there is no significant difference in Ca speciation between current-year and older conifer needles. | Full points for estimating ~90-95% Oxalate Ca and ~5-10% Citrate Ca. Deduct points if inorganic phases (like carbonates or silicates) are included, or if the proportions deviate by more than 10%. |
| q3 | reasoning | 40 | Explain the physiological reasoning for the observed Ca speciation in conifer foliage, and contrast it with the expected speciation in broadleaf foliage. | The observed Ca speciation in conifer foliage, such as these Silver fir needles, is driven by the plant's passive uptake of calcium through its roots. To avoid the energy-intensive process of discriminating against calcium at the root interface, the plant transports the calcium to the foliage and deposits the excess as Ca oxalate in cell walls and vacuoles, allowing it to maintain normal water uptake and photosynthesis. As a result, conifer foliage is dominated by oxalate-bound Ca (around 90%) and citrate-Ca (around 10%). This contrasts sharply with the expected speciation in broadleaf foliage, which utilizes different physiological mechanisms and consequently contains significant amounts of Ca pectate and Ca phytate. | Full points for explaining that excess passively-uptaken Ca is deposited as Ca oxalate in vacuoles/cell walls to prevent toxicity and avoid costly root discrimination. Must also note that conifer foliage is almost entirely Ca oxalate and citrate, whereas broadleaf foliage contains significant fractions of Ca pectate and Ca phytate. |
Review
#271
plant foliage
Ca K
▶
LLM Prompt
Sample Information
Material: plant foliage
Sample Origin: Mangfall Mts, German Alps, Germany
Sample-Specific Conditions
- Plant species: Fir
- Current-year needles of Silver fir
Measurement
We plan to measure the Ca K XANES spectrum of this sample.
Questions
Based on all the information above:
1. Based on the sample conditions (current-year needles of Silver fir), what are the expected Ca phases and their approximate mass fractions?
2. What reference spectra would be most appropriate to include in a linear combination fitting (LCF) analysis for this conifer foliage sample?
3. Explain the physiological reasoning for the observed Ca speciation in this conifer foliage sample.
Ground Truth
Material: plant foliage
Measurement: Ca K-edge XANES, fluorescence mode, Beamline 8 of SLRI
Fit method: Linear combination fitting (LCF)
Phase fractions: (±10%)
| Phase | Fraction |
|---|---|
| Ca oxalate | 0.898 |
| Ca citrate | 0.102 |
Fit basis (paper's reference spectra):
- Ca oxalate
- Ca citrate
- Ca pectate
- Ca phytate
Source evidence: Table 7, page 211
Key reasoning: Calcium is taken up passively by plant roots and transported with the transpiration water stream to the foliage, where excess Ca is deposited as Ca oxalate in cell walls and vacuoles to prevent toxicity. Conifer species like Fir are characterized by a Ca speciation dominated by oxalate-bound Ca (approx. 90%) and citrate-Ca (approx. 10%), differing from broadleaf species which contain significant amounts of Ca pectate and Ca phytate.
Reasoning source: Results (Plant samples) page 206; Discussion (The fate of Ca oxalate in calcareous and silicate soils) page 216
Scoring Rubric (total: 100 pts)
| Q | Type | Max | Question | Reference Answer | Scoring Criteria |
|---|---|---|---|---|---|
| q1 | quantification | 40 | Based on the sample conditions (current-year needles of Silver fir), what are the expected Ca phases and their approximate mass fractions? | The expected Ca phases for the current-year needles of Silver fir are Ca oxalate at approximately 89.8% and Ca citrate at approximately 10.2%, with an uncertainty of 10%. These specific fractions arise because calcium is passively taken up by the plant roots and transported to the foliage via the transpiration water stream. To prevent toxicity, conifer species like Fir deposit this excess calcium primarily as Ca oxalate in cell walls and vacuoles, resulting in a speciation dominated by ~90% oxalate-bound Ca and ~10% citrate-Ca. | Full points for identifying Ca oxalate as the dominant phase (~90%) and Ca citrate as the minor phase (~10%). Deduct points for missing phases or significantly inaccurate fractions. |
| q2 | identification | 30 | What reference spectra would be most appropriate to include in a linear combination fitting (LCF) analysis for this conifer foliage sample? | The most appropriate reference spectra to include in a linear combination fitting (LCF) analysis for this sample are Ca oxalate, Ca citrate, Ca pectate, and Ca phytate. These references are required because calcium is passively transported to the foliage, where conifers like the Silver fir deposit excess Ca as Ca oxalate and Ca citrate in cell walls and vacuoles to prevent toxicity. Including Ca pectate and Ca phytate in the fitting basis is also necessary to accurately distinguish this conifer sample from broadleaf species, which contain significant amounts of those additional phases. | Full points for listing relevant organic Ca reference compounds such as Ca oxalate, Ca citrate, Ca pectate, and Ca phytate. |
| q3 | reasoning | 30 | Explain the physiological reasoning for the observed Ca speciation in this conifer foliage sample. | The observed Ca speciation in this Silver fir foliage sample is heavily dominated by Ca oxalate (89.8%) and Ca citrate (10.2%). This distribution occurs because calcium is taken up passively by the plant roots and carried to the current-year needles via the transpiration water stream. To prevent cellular toxicity from this accumulated calcium, conifer species physiologically adapt by depositing the excess Ca as Ca oxalate in cell walls and vacuoles, distinctly differentiating them from broadleaf species that utilize Ca pectate and Ca phytate. | Full points for explaining that Ca is taken up passively and excess is deposited as Ca oxalate in vacuoles/cell walls to prevent toxicity, and noting the specific ~90% oxalate / 10% citrate distribution typical for conifers. |
Review
#272
plant foliage
Ca K
▶
LLM Prompt
Sample Information
Material: plant foliage
Sample Origin: Achenpass, German Alps, Germany
Sample-Specific Conditions
- Plant species: Fir
- Older needles of Silver fir
Measurement
We plan to measure the Ca K XANES spectrum of this sample.
Questions
Based on all the information above:
1. Based on the sample conditions (older needles of Silver fir), what are the expected Ca phases and their approximate relative fractions?
2. What reference spectra should be considered as candidate basis functions for a linear combination fitting (LCF) analysis of this conifer foliage sample?
3. Explain the physiological reasoning for the dominance of the primary Ca phase in this conifer foliage sample.
Ground Truth
Material: plant foliage
Measurement: Ca K-edge XANES in fluorescence mode at Beamline 8 of the Synchrotron Light Research Institute (SLRI)
Fit method: linear combination fitting (LCF)
Phase fractions: (±10%)
| Phase | Fraction |
|---|---|
| Oxalate Ca | 0.907 |
| Citrate Ca | 0.093 |
Fit basis (paper's reference spectra):
- Ca oxalate
- Ca citrate
- Ca pectate
- Ca phytate
Source evidence: Table 7 and text on page 206; Figure 6
Key reasoning: Foliage Ca speciation differs significantly between broadleaf and conifer species. Conifer species (like fir and spruce) are dominated by oxalate-bound Ca (approx. 90%) and citrate-Ca (approx. 10%), with no speciation difference between current-year and older needles. Calcium is taken up passively by roots and transported to foliage; excess Ca is deposited as Ca oxalate in cell walls and vacuoles to prevent toxicity while maintaining water uptake and photosynthesis.
Reasoning source: Results section 'Plant samples' (page 206) and Discussion section 'The fate of Ca oxalate in calcareous and silicate soils' (page 216)
Scoring Rubric (total: 100 pts)
| Q | Type | Max | Question | Reference Answer | Scoring Criteria |
|---|---|---|---|---|---|
| q1 | quantification | 40 | Based on the sample conditions (older needles of Silver fir), what are the expected Ca phases and their approximate relative fractions? | The expected Ca phases for the older needles of Silver fir are Oxalate Ca at approximately 90.7% and Citrate Ca at approximately 9.3%, with a 10% uncertainty. These specific fractions arise because foliage Ca speciation is highly dependent on the plant type, with conifer species like fir being heavily dominated by oxalate-bound Ca alongside a minor citrate-Ca component. Furthermore, there is no speciation difference between current-year and older needles in these conifers. This distribution occurs because calcium is taken up passively by the roots and transported to the foliage, where excess Ca is deposited as Ca oxalate in cell walls and vacuoles to prevent toxicity while maintaining water uptake and photosynthesis. | Full points for identifying Ca oxalate as the dominant phase (~90%) and Ca citrate as the minor phase (~10%). Partial points for identifying the correct phases without accurate fractions. |
| q2 | identification | 30 | What reference spectra should be considered as candidate basis functions for a linear combination fitting (LCF) analysis of this conifer foliage sample? | The candidate basis functions for the linear combination fitting (LCF) analysis of this sample should include Ca oxalate, Ca citrate, Ca pectate, and Ca phytate. These specific reference spectra are considered because they represent the primary organic calcium forms typically found in plant foliage. For conifer species like the Silver fir, calcium is passively transported from the roots to the foliage, where excess amounts must be safely managed. Consequently, the plant deposits this excess calcium primarily as Ca oxalate in cell walls and vacuoles to prevent toxicity, making these specific organic calcium salts the expected phases to model the XANES spectrum. | Full points for listing relevant organic Ca reference compounds such as Ca oxalate, Ca citrate, Ca pectate, and Ca phytate. |
| q3 | reasoning | 30 | Explain the physiological reasoning for the dominance of the primary Ca phase in this conifer foliage sample. | In conifer species like Silver fir, the dominant Ca phase is Ca oxalate, which accounts for approximately 90.7% of the calcium in both current-year and older needles. This dominance occurs because calcium is taken up passively by the plant's roots and continuously transported to the foliage. To manage this continuous influx and prevent calcium toxicity, the plant deposits the excess Ca as Ca oxalate within the cell walls and vacuoles. This physiological mechanism allows the fir needles to safely sequester the calcium while successfully maintaining essential functions like water uptake and photosynthesis. | Full points for explaining that excess passively taken-up Ca is deposited as Ca oxalate in vacuoles/cell walls to prevent toxicity and maintain water uptake/photosynthesis. |
Review
#273
plant foliage
Ca K
▶
LLM Prompt
Sample Information
Material: plant foliage
Sample Origin: Mangfall Mts, German Alps, Germany
Sample-Specific Conditions
- Plant species: Fir
- Older needles of Silver fir
Measurement
We plan to measure the Ca K XANES spectrum of this sample.
Questions
Based on all the information above:
1. Based on the sample conditions (older needles of Silver fir), what candidate reference spectra are needed to perform a Linear Combination Fitting (LCF) analysis of the Ca K-edge XANES spectrum?
2. Estimate the phase fractions of the different Ca species present in this older Silver fir foliage sample.
3. Explain the physiological and ecological reasoning for the strong dominance of the primary Ca species in conifer foliage, and discuss whether needle age (current-year vs. older) is expected to change this speciation.
Ground Truth
Material: plant foliage
Measurement: Ca K-edge XANES, fluorescence mode, Beamline 8 of the Synchrotron Light Research Institute (SLRI)
Fit method: Linear combination fitting (LCF)
Phase fractions: (±10%)
| Phase | Fraction |
|---|---|
| Ca oxalate | 0.941 |
| Ca citrate | 0.059 |
Fit basis (paper's reference spectra):
- Ca oxalate
- Ca citrate
- Ca pectate
- Ca phytate
Source evidence: Table 7, page 211; Figure 6, page 212
Key reasoning: Calcium is taken up passively by plant roots and transported with the transpiration water stream to the foliage. Excess Ca is deposited as Ca oxalate in cell walls and foliage cell vacuoles, which protects against herbivory and allows plants to maintain water uptake and photosynthesis without costly Ca discrimination at the roots. In conifer foliage (like fir and spruce), oxalate-bound Ca strongly dominates, making up about 90% of total Ca, with minor contributions from Ca citrate. There is no significant Ca speciation difference between current-year and older conifer needles.
Reasoning source: Results (Plant samples) page 206; Discussion (The fate of Ca oxalate in calcareous and silicate soils) page 216
Scoring Rubric (total: 100 pts)
| Q | Type | Max | Question | Reference Answer | Scoring Criteria |
|---|---|---|---|---|---|
| q1 | identification | 20 | Based on the sample conditions (older needles of Silver fir), what candidate reference spectra are needed to perform a Linear Combination Fitting (LCF) analysis of the Ca K-edge XANES spectrum? | To perform a Linear Combination Fitting (LCF) analysis on the Ca K-edge XANES spectrum of older Silver fir needles, the required candidate reference spectra are Ca oxalate, Ca citrate, Ca pectate, and Ca phytate. These specific reference phases are selected because calcium is passively transported to the foliage via the transpiration stream, where the plant must manage the excess Ca. In conifer foliage like fir, the plant deposits this excess primarily as Ca oxalate in cell walls and vacuoles to maintain water uptake and photosynthesis without costly root discrimination, alongside minor organic phases like Ca citrate. Therefore, this basis set perfectly captures the dominant oxalate phase and the minor organic calcium species expected in the plant foliage. | Full points if the answer identifies organic Ca carboxylates, specifically Ca oxalate and Ca citrate, as the primary reference spectra needed for conifer foliage. |
| q2 | quantification | 40 | Estimate the phase fractions of the different Ca species present in this older Silver fir foliage sample. | The estimated phase fractions for the older Silver fir foliage are 0.941 (94.1%) Ca oxalate and 0.059 (5.9%) Ca citrate, with an uncertainty of 10%. These specific values result from the physiological mechanism where conifers passively take up calcium and deposit the vast majority of the excess as Ca oxalate in cell walls and vacuoles. This massive accumulation of oxalate-bound Ca (making up about 90% of total Ca) allows the plant to maintain continuous water uptake and photosynthesis without requiring costly calcium discrimination at the roots. Furthermore, because there is no significant difference in calcium speciation between current-year and older conifer needles, these older fir needles maintain this overwhelming dominance of Ca oxalate with only minor contributions from Ca citrate. | Full points if the answer estimates Ca oxalate at ~90-95% and Ca citrate at ~5-10%. Partial points for identifying Ca oxalate as the strongly dominant phase (>80%). |
| q3 | reasoning | 40 | Explain the physiological and ecological reasoning for the strong dominance of the primary Ca species in conifer foliage, and discuss whether needle age (current-year vs. older) is expected to change this speciation. | The strong dominance of Ca oxalate in conifer foliage like Silver fir occurs because calcium is taken up passively by plant roots and transported to the leaves via the transpiration water stream. To manage this continuous influx while maintaining essential water uptake and photosynthesis, the plant avoids costly calcium discrimination at the roots and instead deposits the excess calcium as Ca oxalate in cell walls and foliage cell vacuoles. Ecologically, this massive deposition of Ca oxalate also provides the plant with a defense mechanism that protects against herbivory. Finally, needle age is not expected to change this speciation, as there is no significant difference in the dominant oxalate-bound calcium speciation between current-year and older conifer needles. | Full points if the answer explains that excess passively transported Ca is deposited as Ca oxalate in vacuoles/cell walls to prevent toxicity, maintain water uptake without root discrimination, and deter herbivory, AND notes that needle age does not significantly alter this speciation. |
Review
#274
plant roots
Ca K
▶
LLM Prompt
Sample Information
Material: plant roots
Sample Origin: Achenpass, German Alps, Germany
Sample-Specific Conditions
- Plant species: Beech
- Fine roots of European beech from leptosol
Measurement
We plan to measure the Ca K XANES spectrum of this sample.
Questions
Based on all the information above:
1. Based on the sample conditions (European beech fine roots from a leptosol), identify the expected major Ca phases and estimate their approximate mass fractions.
2. What candidate reference spectra should be included in the basis set for linear combination fitting of the Ca K-edge XANES spectrum of this fine root sample?
3. Explain how the Ca speciation in beech fine roots differs from that of beech foliage, and discuss the implications of this root speciation for the organic Ca pool in the soil.
Ground Truth
Material: plant roots
Measurement: Ca K-edge XANES in fluorescence mode at Beamline 8 of the Synchrotron Light Research Institute (SLRI)
Fit method: Linear combination fitting (LCF) in the energy range 4020-4140 eV
Phase fractions: (±10%)
| Phase | Fraction |
|---|---|
| Oxalate Ca | 0.179 |
| Pectate Ca | 0.593 |
| Phytate Ca | 0.228 |
Fit basis (paper's reference spectra):
- Ca oxalate
- Ca citrate
- Ca pectate
- Ca phytate
Source evidence: Table 7, page 211
Key reasoning: Beech fine root Ca speciation is dominated by Ca pectate (approx. 55-60%) and Ca phytate (approx. 20-25%), with a smaller share of Ca oxalate (approx. 18-20%). This differs markedly from beech foliage, which has a much higher proportion of Ca oxalate (approx. 50%). The input of Ca pectate and Ca phytate from fine root necromass into topsoil horizons contributes significantly to the organic Ca pool, though Ca phytate decomposes rapidly upon litter deposition.
Reasoning source: Results (Plant samples) page 206; Discussion (Speciation of organically bound soil Ca as affected by plant input and microbial turnover) page 215
Scoring Rubric (total: 100 pts)
| Q | Type | Max | Question | Reference Answer | Scoring Criteria |
|---|---|---|---|---|---|
| q1 | quantification | 40 | Based on the sample conditions (European beech fine roots from a leptosol), identify the expected major Ca phases and estimate their approximate mass fractions. | The expected major Ca phases in the European beech fine roots are Ca pectate at a mass fraction of 0.593, Ca phytate at 0.228, and Ca oxalate at 0.179, with an estimated uncertainty of 10%. These specific values result from the biological composition of beech fine roots, which are naturally dominated by Ca pectate (approx. 55-60%) and Ca phytate (approx. 20-25%). This distribution occurs because fine roots have a distinct physiological role compared to beech foliage, which instead accumulates a much higher proportion of Ca oxalate (approx. 50%). Consequently, the high fractions of pectate and phytate in these roots serve as a significant input source for the organic Ca pool in the leptosol topsoil upon necromass deposition. | Full points if the predicted phases are Ca pectate, Ca phytate, and Ca oxalate, and the estimated fractions are within ±10% of the ground truth (Pectate ~59%, Phytate ~23%, Oxalate ~18%). Partial credit for identifying the correct phases without accurate fractions. |
| q2 | identification | 20 | What candidate reference spectra should be included in the basis set for linear combination fitting of the Ca K-edge XANES spectrum of this fine root sample? | The basis set for linear combination fitting of the Ca K-edge XANES spectrum should include reference spectra for Ca oxalate, Ca citrate, Ca pectate, and Ca phytate. These specific phases are expected because the sample consists of European beech fine roots, which biologically accumulate these specific organic calcium forms. Specifically, beech fine root speciation is naturally dominated by Ca pectate and Ca phytate, with a smaller share of Ca oxalate. Including these references is essential to accurately model the root's composition, which differs markedly from foliage and acts as a primary contributor of pectate and phytate to the organic Ca pool in the leptosol soil. | Full points for listing the relevant organic Ca reference compounds: Ca pectate, Ca phytate, Ca oxalate, and optionally Ca citrate. |
| q3 | reasoning | 40 | Explain how the Ca speciation in beech fine roots differs from that of beech foliage, and discuss the implications of this root speciation for the organic Ca pool in the soil. | In European beech fine roots, Ca speciation is dominated by Ca pectate (approx. 55-60%) and Ca phytate (approx. 20-25%), with only a minor share of Ca oxalate (approx. 18-20%). This contrasts sharply with beech foliage, which accumulates a much higher proportion of Ca oxalate (approx. 50%). Because these fine roots grow within the leptosol, their eventual death and deposition as necromass directly dictate the chemical nature of soil inputs. Consequently, the high root concentrations of Ca pectate and Ca phytate contribute significantly to the organic Ca pool in the topsoil horizons. However, the persistence of these inputs varies, as the Ca phytate fraction decomposes rapidly upon litter deposition. | Full points for explaining that fine roots have larger shares of Ca pectate and Ca phytate and smaller shares of Ca oxalate compared to foliage, and noting that root necromass injects these specific organic Ca forms into the soil, where Ca phytate is known to decompose rapidly. |
Review
#275
plant roots
Ca K
▶
LLM Prompt
Sample Information
Material: plant roots
Sample Origin: Achenpass, German Alps, Germany
Sample-Specific Conditions
- Plant species: Beech
- Fine roots of European beech from cambisol
Measurement
We plan to measure the Ca K XANES spectrum of this sample.
Questions
Based on all the information above:
1. Based on the sample conditions (beech fine roots), what are the expected primary organic Ca-bearing phases that should be included as reference spectra for linear combination fitting?
2. Estimate the relative phase fractions of the primary Ca species in these beech fine roots.
3. How does the expected Ca speciation in beech fine roots differ from that of beech foliage, and what physiological mechanism explains this difference?
Ground Truth
Material: plant roots
Measurement: Ca K-edge XANES in fluorescence mode at Beamline 8 of SLRI
Fit method: Linear combination fitting (LCF)
Phase fractions: (±10%)
| Phase | Fraction |
|---|---|
| Oxalate Ca | 0.231 |
| Pectate Ca | 0.5 |
| Phytate Ca | 0.269 |
Fit basis (paper's reference spectra):
- Ca oxalate
- Ca pectate
- Ca phytate
Source evidence: Table 7, page 17
Key reasoning: Beech fine root Ca speciation is almost identical among different sites and differs markedly from that of beech foliage. While excess Ca is transported to foliage and deposited as Ca oxalate in vacuoles (leading to high oxalate fractions in leaves), fine roots retain smaller shares of oxalate-bound Ca (around 20-23%). Instead, root Ca is dominated by structural and storage forms, specifically Ca pectate (around 50%) and Ca phytate (around 25-27%).
Reasoning source: Results section (Plant samples, page 12) and Discussion section (The fate of Ca oxalate in calcareous and silicate soils, page 22)
Scoring Rubric (total: 100 pts)
| Q | Type | Max | Question | Reference Answer | Scoring Criteria |
|---|---|---|---|---|---|
| q1 | identification | 30 | Based on the sample conditions (beech fine roots), what are the expected primary organic Ca-bearing phases that should be included as reference spectra for linear combination fitting? | The expected primary organic Ca-bearing phases to include as reference spectra for linear combination fitting are Ca oxalate, Ca pectate, and Ca phytate. These specific phases are expected in beech fine roots because root calcium is primarily dominated by structural and storage forms rather than excess deposits. Specifically, Ca pectate and Ca phytate serve as the main structural and storage components in the roots. Meanwhile, a smaller portion of Ca oxalate is present, as most excess calcium is transported away from the roots to the foliage for vacuolar deposition. | Full points for identifying Ca oxalate, Ca pectate, and Ca phytate as the primary reference phases. |
| q2 | quantification | 40 | Estimate the relative phase fractions of the primary Ca species in these beech fine roots. | The estimated relative phase fractions for the beech fine roots are 50.0% Ca pectate, 26.9% Ca phytate, and 23.1% Ca oxalate, with an uncertainty of 10%. These specific values result from the physiological function of the fine roots, which primarily utilize calcium for structural and storage purposes rather than excess accumulation. Consequently, structural Ca pectate dominates at exactly half of the total calcium, while storage-form Ca phytate makes up just over a quarter. The remaining fraction of Ca oxalate is relatively low (23.1%) because excess calcium is not heavily deposited in the roots, but is instead transported to the plant's foliage. | Full points if the estimated fractions are within ±10% of the ground truth (approx. 50% Pectate Ca, 27% Phytate Ca, 23% Oxalate Ca). |
| q3 | reasoning | 30 | How does the expected Ca speciation in beech fine roots differ from that of beech foliage, and what physiological mechanism explains this difference? | The Ca speciation in beech fine roots differs markedly from that of beech foliage by having a much lower proportion of Ca oxalate and higher proportions of Ca pectate and Ca phytate. This difference is driven by the physiological mechanism of calcium transport and management in the plant. Excess calcium is actively transported away from the roots to the foliage, where it is deposited as Ca oxalate in vacuoles, leading to high oxalate fractions in leaves. In contrast, the fine roots retain only a small share of oxalate-bound Ca (around 20-23%) and instead utilize the majority of their calcium for structural (Ca pectate, 50%) and storage (Ca phytate, 25-27%) functions. | Full points for explaining that roots have significantly less Ca oxalate and more Ca pectate/phytate than foliage, because excess Ca is transported to the foliage and deposited as Ca oxalate in vacuoles. |
Review
#276
plant roots
Ca K
▶
LLM Prompt
Sample Information
Material: plant roots
Sample Origin: Mangfall Mts, German Alps, Germany
Sample-Specific Conditions
- Plant species: Beech
- Fine roots of European beech from leptosol
Measurement
We plan to measure the Ca K XANES spectrum of this sample.
Questions
Based on all the information above:
1. What candidate reference spectra are needed to model the Ca speciation in European beech fine roots using linear combination fitting?
2. Estimate the relative fractions of the different Ca phases present in the fine roots of European beech from the Mangfall Mts leptosol.
3. How does the Ca speciation in beech fine roots differ from that in beech foliage, and what does this indicate about the input of organically bound Ca into forest soils?
Ground Truth
Material: plant roots
Measurement: Ca K-edge XANES, fluorescence mode, Beamline 8 of the Synchrotron Light Research Institute (SLRI)
Fit method: Linear combination fitting (LCF)
Phase fractions: (±10%)
| Phase | Fraction |
|---|---|
| Oxalate Ca | 0.186 |
| Pectate Ca | 0.559 |
| Phytate Ca | 0.255 |
Fit basis (paper's reference spectra):
- Ca oxalate
- Ca pectate
- Ca phytate
Source evidence: Table 7, page 211
Key reasoning: Beech fine root Ca speciation differs markedly from that of beech foliage by having larger shares of Ca pectate (approx. 55% of total Ca) and Ca phytate (approx. 25%), and smaller oxalate-bound Ca shares (approx. 20%). The input of Ca pectate occurs via fine root necromass injection into topsoil horizons, contrasting with the Ca oxalate-dominated deposition from foliage litter fall.
Reasoning source: Results - Plant samples (Page 206) and Discussion - Speciation of organically bound soil Ca as affected by plant input and microbial turnover (Page 215)
Scoring Rubric (total: 100 pts)
| Q | Type | Max | Question | Reference Answer | Scoring Criteria |
|---|---|---|---|---|---|
| q1 | identification | 20 | What candidate reference spectra are needed to model the Ca speciation in European beech fine roots using linear combination fitting? | To model the Ca speciation in European beech fine roots using linear combination fitting, the required candidate reference spectra are Ca oxalate, Ca pectate, and Ca phytate. These specific phases are expected because the biological composition of beech fine roots differs markedly from that of beech foliage. Specifically, fine roots are characterized by larger shares of Ca pectate and Ca phytate, alongside a smaller share of oxalate-bound Ca. This distinct speciation profile reflects the roots' structural and storage roles, which ultimately drives the input of Ca pectate into topsoil horizons via fine root necromass injection. | Full points for identifying Ca oxalate, Ca pectate, and Ca phytate as the necessary reference spectra. |
| q2 | quantification | 40 | Estimate the relative fractions of the different Ca phases present in the fine roots of European beech from the Mangfall Mts leptosol. | The relative fractions of Ca phases in the European beech fine roots from the Mangfall Mts leptosol are estimated to be 0.559 Pectate Ca, 0.255 Phytate Ca, and 0.186 Oxalate Ca, with an uncertainty of 10%. These specific values result from the distinct biological composition of beech fine roots compared to beech foliage. While foliage litter fall is dominated by Ca oxalate deposition, fine roots are characterized by larger shares of Ca pectate (approx. 55%) and Ca phytate (approx. 25%), and smaller oxalate-bound Ca shares (approx. 20%). This specific distribution dictates the chemical nature of the root necromass that is injected into the topsoil horizons. | Full points for estimating fractions close to ~56% Pectate Ca, ~25% Phytate Ca, and ~19% Oxalate Ca. Partial credit for correctly identifying Pectate Ca as the dominant phase followed by Phytate and Oxalate. |
| q3 | reasoning | 40 | How does the Ca speciation in beech fine roots differ from that in beech foliage, and what does this indicate about the input of organically bound Ca into forest soils? | The Ca speciation in European beech fine roots differs markedly from that of beech foliage by having larger shares of Ca pectate (approximately 55%) and Ca phytate (approximately 25%), alongside a smaller share of oxalate-bound Ca (approximately 20%). This compositional difference dictates how organically bound Ca is introduced into forest soils from different plant parts. Specifically, the high pectate content in roots means that Ca pectate is injected directly into topsoil horizons via fine root necromass. This contrasts sharply with foliage litter fall, which drives a Ca oxalate-dominated deposition into the soil system. | Full points for explaining that fine roots have larger shares of Ca pectate and Ca phytate, and smaller shares of Ca oxalate compared to foliage, and noting that this reflects Ca pectate input via fine root necromass injection into topsoils. |
Review
#277
plant roots
Ca K
▶
LLM Prompt
Sample Information
Material: plant roots
Sample Origin: Mangfall Mts, German Alps, Germany
Sample-Specific Conditions
- Plant species: Spruce
- Fine roots of Norway spruce from histosol
Measurement
We plan to measure the Ca K XANES spectrum of this sample.
Questions
Based on all the information above:
1. Identify the expected Ca phases and estimate their approximate relative fractions in the fine roots of Norway spruce sampled from a histosol.
2. What reference spectra are required for a complete linear combination fitting (LCF) basis set to model the Ca K-edge XANES spectrum of these spruce fine roots?
3. Explain the biological and environmental reasoning for the presence and distribution of these organic Ca phases in spruce fine roots, and how this speciation compares to that of broadleaf species like beech.
Ground Truth
Material: plant roots
Measurement: Ca K-edge, fluorescence mode, Beamline 8 of the Synchrotron Light Research Institute (SLRI)
Fit method: Linear combination fitting (LCF)
Phase fractions: (±10%)
| Phase | Fraction |
|---|---|
| Ca oxalate | 0.333 |
| Ca citrate | 0.262 |
| Ca pectate | 0.31 |
| Ca phytate | 0.095 |
Fit basis (paper's reference spectra):
- Ca oxalate
- Ca citrate
- Ca pectate
- Ca phytate
Source evidence: Table 7, page 211; text on page 206
Key reasoning: Spruce fine roots contain a mixture of organically bound Ca phases, specifically Ca oxalate, Ca pectate, Ca citrate, and Ca phytate. Ca oxalate in roots can be formed in situ by the reaction of (mycor)rhizogenic oxalic acid with Ca2+ cations from the soil solution. The speciation in spruce roots (approx. 33% oxalate, 31% pectate, 26% citrate, 9% phytate) differs from broadleaf species like beech, which typically have larger shares of Ca pectate and phytate and smaller shares of Ca oxalate in their fine roots.
Reasoning source: Page 206 (Plant samples section) and Page 215-216 (Speciation of organically bound soil Ca as affected by plant input and microbial turnover)
Scoring Rubric (total: 100 pts)
| Q | Type | Max | Question | Reference Answer | Scoring Criteria |
|---|---|---|---|---|---|
| q1 | quantification | 40 | Identify the expected Ca phases and estimate their approximate relative fractions in the fine roots of Norway spruce sampled from a histosol. | The expected Ca phases in the fine roots of Norway spruce from a histosol are Ca oxalate (33.3%), Ca pectate (31.0%), Ca citrate (26.2%), and Ca phytate (9.5%), with an estimated uncertainty of 10%. These specific fractions arise because spruce fine roots naturally accumulate a distinct mixture of organically bound Ca phases based on their biological interactions with the soil. Specifically, the high proportion of Ca oxalate (approx. 33%) is formed in situ through the reaction of (mycor)rhizogenic oxalic acid with Ca2+ cations absorbed from the soil solution. This distribution is characteristic of spruce roots, which inherently differ from broadleaf species by maintaining a larger share of Ca oxalate and smaller shares of Ca pectate and phytate. | Full credit for identifying Ca oxalate, Ca pectate, Ca citrate, and Ca phytate with fractions approximately matching 33%, 31%, 26%, and 9-10% respectively. Partial credit for identifying the correct organic phases without accurate fractions. |
| q2 | identification | 30 | What reference spectra are required for a complete linear combination fitting (LCF) basis set to model the Ca K-edge XANES spectrum of these spruce fine roots? | A complete linear combination fitting (LCF) basis set for modeling the Ca K-edge XANES spectrum of these spruce fine roots requires reference spectra for Ca oxalate, Ca pectate, Ca citrate, and Ca phytate. These specific reference standards are necessary because the fine roots of Norway spruce naturally contain a complex mixture of these organically bound Ca phases. The presence of these phases is driven by biological and environmental processes, such as the in situ formation of Ca oxalate from the reaction between (mycor)rhizogenic oxalic acid and soil-derived Ca2+ cations. Consequently, capturing this specific species-dependent speciation—which features higher oxalate and lower pectate/phytate compared to broadleaf trees—requires this exact combination of organic Ca references. | Full credit for listing Ca oxalate, Ca citrate, Ca pectate, and Ca phytate as the necessary reference standards. |
| q3 | reasoning | 30 | Explain the biological and environmental reasoning for the presence and distribution of these organic Ca phases in spruce fine roots, and how this speciation compares to that of broadleaf species like beech. | The presence and distribution of organic Ca phases in Norway spruce fine roots are driven by specific biological interactions with the histosol environment. Specifically, Ca oxalate forms in situ when (mycor)rhizogenic oxalic acid reacts with Ca2+ cations taken up from the soil solution. This mechanism results in a distinct speciation profile consisting of approximately 33% Ca oxalate, 31% Ca pectate, 26% Ca citrate, and 9% Ca phytate. This distribution is highly species-dependent; compared to broadleaf species like beech, spruce fine roots exhibit a significantly larger share of Ca oxalate and correspondingly smaller shares of Ca pectate and Ca phytate. | Full credit for explaining that Ca is organically bound to carboxylates/phosphates (oxalate, pectate, citrate, phytate), mentioning the in situ formation of Ca oxalate via (mycor)rhizogenic oxalic acid, and noting that spruce roots have a different distribution (more citrate/oxalate, less pectate/phytate) compared to beech roots. |
Review
In situ X-ray absorption study of Cu species in Cu-CHA catalysts for NH3-SCR during temperature-programmed reduction in NO/NH3
ESRF-BM23
Catalyst
Chiara Negri et al.
DOI: 10.1007/s11164-020-04350-1
5 scenarios
▶
#278
Cu-CHA
Cu K
▶
LLM Prompt
Sample Information
Material: Cu-CHA
Support: Chabazite (CHA)
Reaction Conditions: 1000 ppm NO + 1000 ppm NH3, 50 °C
Sample-Specific Conditions
- Temperature: 50 °C
- Cu-CHA catalyst with Cu/Al=0.5, oxidized pretreatment, at start of NO-TPR
Measurement
We plan to measure the Cu K XANES spectrum of this sample.
Questions
Based on all the information above:
1. Based on the sample conditions (Cu-CHA oxidized pretreatment, exposed to NO/NH3 at 50 °C before heating), what Cu phase dominates the catalyst, and what is the physical reasoning for its formation?
2. If you were to perform a linear combination fit or MCR analysis of the full NO-TPR experiment starting from this state, what principal components or reference spectra would be required?
3. Describe the expected Cu K-edge XANES spectral shape for this sample at 50 °C, including the positions of key peaks.
Ground Truth
Material: Cu-CHA
Measurement: in situ Cu K-edge XANES in transmission mode at ESRF BM23
Fit method: MCR-ALS and PCA
Phase fractions: (±10%)
| Phase | Fraction |
|---|---|
| [CuII(NH3)3(X)]+ | 1.0 |
Fit basis (paper's reference spectra):
- PC1: [CuII(NH3)3(X)]+ (where X = OH-, O-, or NO3-)
- PC2: [CuI(NH3)2]+
- PC3: Z[CuI(NH3)]
Source evidence: Figure 5c (top panel) and Figure 3a
Key reasoning: At 50 °C, before the temperature ramp begins, the Cu species have been exposed to NO/NH3 but reduction to CuI has not yet occurred. The CuII ions are solvated by NH3 to form mobile, pseudo-square planar mixed-ligand complexes [CuII(NH3)3(X)]+ (where X = OH-, O-, or NO3-).
Reasoning source: Section 'XANES spectral evolution during NO-TPR' and 'Principal component analysis (PCA) and multivariate curve resolution (MCR) of in situ XANES'
Scoring Rubric (total: 100 pts)
| Q | Type | Max | Question | Reference Answer | Scoring Criteria |
|---|---|---|---|---|---|
| q1 | reasoning | 33 | Based on the sample conditions (Cu-CHA oxidized pretreatment, exposed to NO/NH3 at 50 °C before heating), what Cu phase dominates the catalyst, and what is the physical reasoning for its formation? | The dominant phase is a mobile, pseudo-square planar mixed-ligand complex, [CuII(NH3)3(X)]+ (where X = OH-, O-, or NO3-), which accounts for 1.0 (100%) of the Cu species. This phase forms because the Cu-CHA catalyst underwent an oxidized pretreatment and is currently at a low temperature of 50 °C at the start of the NO-TPR. Under these specific conditions, the Cu species have been exposed to the NO and NH3 gas mixture, leading to the solvation of CuII ions by NH3. However, because the temperature ramp has not yet begun, the thermal energy is insufficient to drive the reduction of CuII to CuI, leaving the fully oxidized, NH3-solvated complex as the sole phase. | Must identify [CuII(NH3)3(X)]+ (or mixed-ligand ammonia-solvated CuII complex) as the dominant phase (fraction ~1.0). Must explain that at 50 °C, reduction to CuI has not yet occurred, and CuII ions are solvated by NH3 forming mobile pseudo-square planar complexes. |
| q2 | identification | 25 | If you were to perform a linear combination fit or MCR analysis of the full NO-TPR experiment starting from this state, what principal components or reference spectra would be required? | An MCR-ALS and PCA analysis of the full NO-TPR experiment would require three principal components: PC1 as [CuII(NH3)3(X)]+ (where X = OH-, O-, or NO3-), PC2 as [CuI(NH3)2]+, and PC3 as Z[CuI(NH3)]. These specific components are required because they represent the chemical evolution of the Cu-CHA catalyst under the reaction conditions. At the initial 50 °C state, the oxidized pretreatment and exposure to NH3/NO result entirely in the solvated CuII complex (PC1) since reduction has not yet occurred. As the NO-TPR temperature ramp progresses, the initial [CuII(NH3)3(X)]+ phase will reduce, necessitating the inclusion of the CuI species (PC2 and PC3) to capture the complete structural transformation. | Must list the three components identified in the paper: [CuII(NH3)3(X)]+, [CuI(NH3)2]+, and Z[CuI(NH3)]. |
| q3 | spectral | 42 | Describe the expected Cu K-edge XANES spectral shape for this sample at 50 °C, including the positions of key peaks. | The expected Cu K-edge XANES spectrum exhibits a weak pre-edge peak at 8977 eV, a weak and broad rising-edge peak at approximately 8986 eV, and smooth white-line features at 8994 and 8999 eV. These spectral features arise directly from the 100% [CuII(NH3)3(X)]+ phase present at 50 °C before the NO-TPR temperature ramp begins. The weak pre-edge peak at 8977 eV originates from a 1s to 3d dipole-forbidden transition, which serves as an unambiguous diagnostic feature for the unreduced CuII oxidation state maintained at this low temperature. Furthermore, the smoother white-line features and broader rising-edge peak (1s to 4p transition) compared to a [CuII(NH3)4]2+ reference occur because the CuII ions are solvated by NH3 into a pseudo-square planar geometry with mixed N/O ligation. | Must mention the weak pre-edge peak at ~8977 eV, the weak/broad rising-edge peak at ~8986 eV, and the white-line features around 8994 and 8999 eV. |
Review
#279
Cu-CHA
Cu K
▶
LLM Prompt
Sample Information
Material: Cu-CHA
Support: Chabazite (CHA)
Reaction Conditions: 1000 ppm NO + 1000 ppm NH3, 200 °C
Sample-Specific Conditions
- Temperature: 200 °C
- Cu-CHA catalyst with Cu/Al=0.5, oxidized pretreatment, during NO-TPR
Measurement
We plan to measure the Cu K XANES spectrum of this sample.
Questions
Based on all the information above:
1. Based on the sample conditions (Cu-CHA, Cu/Al=0.5, oxidized pretreatment, NO-TPR at 200 °C), what candidate reference spectra or basis functions are needed to model the Cu K-edge XANES spectrum?
2. Estimate the relative fractions of the Cu species present in this sample at 200 °C.
3. Explain the physical and chemical reasoning for the observed phase composition at 200 °C during the NO-TPR experiment.
Ground Truth
Material: Cu-CHA
Measurement: in situ Cu K-edge XANES in transmission mode at BM23 beamline
Fit method: MCR-ALS and PCA
Phase fractions: (±10%)
| Phase | Fraction |
|---|---|
| [CuII(NH3)3(X)]+ | 0.13 |
| [CuI(NH3)2]+ | 0.8 |
| Z[CuI(NH3)] | 0.07 |
Fit basis (paper's reference spectra):
- MCR-retrieved PC1: [CuII(NH3)3(X)]+ (where X = OH-, O- or NO3-)
- MCR-retrieved PC2: [CuI(NH3)2]+
- MCR-retrieved PC3: Z[CuI(NH3)]
Source evidence: Page 12, Section 'Comparison to NO-TPR' and Figure 6a
Key reasoning: During the NO-TPR ramp, the low-temperature reduction event (ca. 108 °C) reduces the majority of CuII to CuI, reaching 87% CuI at 200 °C. The remaining 13% CuII corresponds to ammonia-solvated Cu-nitrate species that reduce at higher temperatures (ca. 223 °C). The CuI is predominantly present as mobile [CuI(NH3)2]+ complexes, but upon heating to 200 °C, these complexes begin to lose an NH3 ligand, forming a minor fraction of framework-coordinated Z[CuI(NH3)] species.
Reasoning source: Page 11-12, Sections 'Principal component analysis (PCA) and multivariate curve resolution (MCR) of in situ XANES' and 'Comparison to NO-TPR'
Scoring Rubric (total: 100 pts)
| Q | Type | Max | Question | Reference Answer | Scoring Criteria |
|---|---|---|---|---|---|
| q1 | identification | 30 | Based on the sample conditions (Cu-CHA, Cu/Al=0.5, oxidized pretreatment, NO-TPR at 200 °C), what candidate reference spectra or basis functions are needed to model the Cu K-edge XANES spectrum? | To model the Cu K-edge XANES spectrum of this Cu-CHA sample, the required basis functions are MCR-retrieved principal components corresponding to [CuII(NH3)3(X)]+ (where X = OH-, O- or NO3-), [CuI(NH3)2]+, and Z[CuI(NH3)]. These specific phases are expected because, during the NO-TPR ramp up to 200 °C in the presence of NO and NH3, the initially oxidized Cu species undergo significant reduction. A low-temperature reduction event (around 108 °C) converts most CuII into mobile [CuI(NH3)2]+ complexes. However, some ammonia-solvated Cu-nitrate species resist reduction until higher temperatures, necessitating the CuII basis, while heating to 200 °C causes some [CuI(NH3)2]+ to lose an NH3 ligand, requiring the framework-coordinated Z[CuI(NH3)] basis. | Award 10 points for each correctly identified species: [CuII(NH3)3(X)]+ (or ammonia-solvated CuII), [CuI(NH3)2]+, and Z[CuI(NH3)] (or framework-coordinated CuI). |
| q2 | quantification | 30 | Estimate the relative fractions of the Cu species present in this sample at 200 °C. | At 200 °C, the relative fractions of the Cu species are 80% [CuI(NH3)2]+, 13% [CuII(NH3)3(X)]+, and 7% Z[CuI(NH3)], with an estimated uncertainty of 10%. These specific values result from the NO-TPR conditions, where a low-temperature reduction event at approximately 108 °C has already reduced the majority of the initial CuII to CuI, yielding a total of 87% CuI at 200 °C. The 13% CuII fraction remains because these ammonia-solvated Cu-nitrate species only reduce at a higher temperature of about 223 °C. Within the CuI fraction, the dominant species is the mobile [CuI(NH3)2]+ complex (80%), but the elevated temperature of 200 °C drives the loss of an NH3 ligand from a small portion of these complexes, resulting in the 7% fraction of framework-coordinated Z[CuI(NH3)]. | Award 10 points for each fraction estimated within ±10% of the ground truth: 13% CuII, 80% [CuI(NH3)2]+, and 7% Z[CuI(NH3)]. |
| q3 | reasoning | 40 | Explain the physical and chemical reasoning for the observed phase composition at 200 °C during the NO-TPR experiment. | The observed phase composition in the Cu-CHA catalyst at 200 °C is driven by the temperature-dependent reduction and ligand-exchange dynamics during the NO-TPR experiment with 1000 ppm NO and 1000 ppm NH3. Starting from an oxidized pretreatment, heating the sample triggers a low-temperature reduction event near 108 °C, which converts the vast majority of CuII into mobile [CuI(NH3)2]+ complexes. By 200 °C, 87% of the copper has been reduced to CuI, while 13% remains as CuII because these specific ammonia-solvated Cu-nitrate species require higher temperatures (ca. 223 °C) to reduce. Furthermore, the thermal energy at 200 °C causes a minor fraction of the dominant [CuI(NH3)2]+ complexes to lose an NH3 ligand. This ligand loss mechanism leads to the formation of the framework-coordinated Z[CuI(NH3)] species, completing the observed mixture. | Award 15 points for explaining that the low-temperature reduction event has largely completed, yielding mostly CuI; 15 points for identifying the remaining CuII as species (like nitrates) that reduce at higher temperatures; and 10 points for explaining the partial conversion of mobile [CuI(NH3)2]+ to framework-coordinated Z[CuI(NH3)] due to thermal desorption of an NH3 ligand. |
Review
#280
Cu-CHA
Cu K
▶
LLM Prompt
Sample Information
Material: Cu-CHA
Support: Chabazite (CHA)
Reaction Conditions: 1000 ppm NO + 1000 ppm NH3, 290 °C
Sample-Specific Conditions
- Temperature: 290 °C
- Cu-CHA catalyst with Cu/Al=0.5, oxidized pretreatment, end of NO-TPR
Measurement
We plan to measure the Cu K XANES spectrum of this sample.
Questions
Based on all the information above:
1. Based on the reaction conditions (290 °C in NO/NH3 after an oxidizing pretreatment), what Cu phases or structural motifs are expected to be present in the Cu-CHA catalyst?
2. Estimate the relative fractions of the Cu species present at 290 °C.
3. What candidate reference spectra or principal components would be needed to model the XANES data for this sample during the full NO-TPR temperature ramp from 50 °C to 290 °C?
Ground Truth
Material: Cu-CHA
Measurement: Cu K-edge in-situ transmission mode at BM23 beamline
Fit method: MCR-ALS (Multivariate Curve Resolution - Alternating Least Squares)
Phase fractions: (±10%)
| Phase | Fraction |
|---|---|
| [CuI(NH3)2]+ | 0.7 |
| Z[CuI(NH3)] | 0.3 |
Fit basis (paper's reference spectra):
- PC1: mobile CuII amino-complexes [CuII(NH3)3(X)]+
- PC2: mobile [CuI(NH3)2]+
- PC3: framework-coordinated Z[CuI(NH3)]
Source evidence: Fig. 5c (top panel) and page 11 text
Key reasoning: During heating in NO/NH3, CuII species are fully reduced to CuI by 240-250 °C. At higher temperatures (above 200 °C), the mobile [CuI(NH3)2]+ complexes start to lose a single NH3 ligand due to thermal desorption, forming framework-coordinated Z[CuI(NH3)] species. By 290 °C, this new species accounts for 28-33% of the total Cu, with the remainder being the mobile [CuI(NH3)2]+ complex.
Reasoning source: Page 11, 'Principal component analysis (PCA) and multivariate curve resolution (MCR) of in situ XANES' section
Scoring Rubric (total: 101 pts)
| Q | Type | Max | Question | Reference Answer | Scoring Criteria |
|---|---|---|---|---|---|
| q1 | identification | 29 | Based on the reaction conditions (290 °C in NO/NH3 after an oxidizing pretreatment), what Cu phases or structural motifs are expected to be present in the Cu-CHA catalyst? | At 290 °C in NO/NH3, the expected Cu species in the Cu-CHA catalyst are mobile [CuI(NH3)2]+ complexes and framework-coordinated Z[CuI(NH3)] species. This composition arises because, during the NO-TPR heating process, the initial CuII species from the oxidized pretreatment are fully reduced to CuI by 240-250 °C. As the temperature increases above 200 °C, thermal desorption causes the mobile [CuI(NH3)2]+ complexes to lose a single NH3 ligand. Consequently, by the end of the ramp at 290 °C, the catalyst consists entirely of the remaining mobile [CuI(NH3)2]+ and the newly formed framework-coordinated Z[CuI(NH3)]. | Full credit for identifying both mobile [CuI(NH3)2]+ and framework-coordinated Z[CuI(NH3)] species. Partial credit for identifying only one of the CuI species. |
| q2 | quantification | 36 | Estimate the relative fractions of the Cu species present at 290 °C. | At 290 °C, the relative fractions of the Cu species are approximately 70% mobile [CuI(NH3)2]+ and 30% framework-coordinated Z[CuI(NH3)], with an uncertainty of 10%. These specific values result from the temperature-dependent evolution of the catalyst during heating in the NO/NH3 mixture. After all CuII is reduced to CuI by 240-250 °C, thermal desorption of a single NH3 ligand from the mobile [CuI(NH3)2]+ complexes drives the formation of Z[CuI(NH3)]. By 290 °C, this thermal desorption has progressed enough to convert 28-33% of the total copper into the framework-coordinated species, leaving the remaining ~70% as the mobile complex. | Full credit for estimating ~70% [CuI(NH3)2]+ and ~30% Z[CuI(NH3)] (within the 10% uncertainty margin). |
| q4 | identification | 36 | What candidate reference spectra or principal components would be needed to model the XANES data for this sample during the full NO-TPR temperature ramp from 50 °C to 290 °C? | To model the XANES data during the full NO-TPR ramp from 50 °C to 290 °C, three principal components are needed: PC1 for mobile CuII amino-complexes [CuII(NH3)3(X)]+, PC2 for mobile [CuI(NH3)2]+, and PC3 for framework-coordinated Z[CuI(NH3)]. These specific components are required because they represent the complete chemical evolution of the Cu-CHA catalyst under these reaction conditions. Initially, the oxidized pretreatment yields CuII species, which are then fully reduced to CuI by 240-250 °C in the NO/NH3 mixture. At higher temperatures up to 290 °C, thermal desorption of an NH3 ligand converts a portion of the mobile [CuI(NH3)2]+ into framework-coordinated Z[CuI(NH3)], necessitating all three references to capture the full transformation. | Full credit for listing the three necessary components: a CuII species (mobile CuII amino-complexes), and two CuI species (mobile [CuI(NH3)2]+ and framework-coordinated Z[CuI(NH3)]). |
Review
#281
Cu-CHA
Cu K
▶
LLM Prompt
Sample Information
Material: Cu-CHA
Support: Chabazite (CHA)
Reaction Conditions: 1000 ppm NO + 1000 ppm NH3, 200 °C
Sample-Specific Conditions
- Temperature: 200 °C
- Cu-CHA catalyst with Cu/Al=0.2, oxidized pretreatment, during NO-TPR
Measurement
We plan to measure the Cu K XANES spectrum of this sample.
Questions
Based on all the information above:
1. What candidate Cu species (phases) are expected to be present in the Cu-CHA catalyst (Cu/Al=0.2, oxidized pretreatment) at 200 °C during NO-TPR in a NO/NH3 mixture?
2. Estimate the relative fractions of the Cu species present at 200 °C for this specific sample.
3. Explain the physical and chemical reasons for the presence and relative abundance of these specific Cu species at 200 °C.
4. What reference spectra or basis components are required to fit the XANES spectrum of this sample using a linear combination or multivariate approach?
Ground Truth
Material: Cu-CHA
Measurement: Cu K-edge in-situ transmission mode at BM23 beamline (ESRF)
Fit method: MCR-ALS (Multivariate Curve Resolution - Alternating Least Squares) based on PCA
Phase fractions: (±10%)
| Phase | Fraction |
|---|---|
| [CuII(NH3)3(X)]+ | 0.05 |
| [CuI(NH3)2]+ | 0.85 |
| Z[CuI(NH3)] | 0.1 |
Fit basis (paper's reference spectra):
- PC1: [CuII(NH3)3(X)]+ (X=OH-, O- or NO3-)
- PC2: mobile [CuI(NH3)2]+
- PC3: framework-coordinated Z[CuI(NH3)]
Source evidence: Figure 5c (middle panel) and Figure 6b (top panel), pages 367-369
Key reasoning: During the NO-TPR experiment, the initial CuII species (solvated by NH3 as [CuII(NH3)3(X)]+) are reduced by the NO/NH3 mixture. For the 0.2_15 OX sample, a main low-temperature reduction event occurs, yielding up to 95% CuI species by 200 °C. The CuI species initially form as mobile [CuI(NH3)2]+ complexes. As the temperature reaches and exceeds 200 °C, these mobile complexes begin to lose a single NH3 ligand, resulting in the formation of framework-coordinated Z[CuI(NH3)] species.
Reasoning source: Comparison to NO-TPR section, pages 368-369
Scoring Rubric (total: 100 pts)
| Q | Type | Max | Question | Reference Answer | Scoring Criteria |
|---|---|---|---|---|---|
| q1 | identification | 20 | What candidate Cu species (phases) are expected to be present in the Cu-CHA catalyst (Cu/Al=0.2, oxidized pretreatment) at 200 °C during NO-TPR in a NO/NH3 mixture? | The expected Cu species in the Cu-CHA catalyst are [CuII(NH3)3(X)]+ (where X=OH-, O- or NO3-), mobile [CuI(NH3)2]+, and framework-coordinated Z[CuI(NH3)]. These specific phases are expected because the initial oxidized CuII species are reduced by the NO/NH3 mixture during the NO-TPR experiment. By 200 °C, a major low-temperature reduction event converts most of the CuII into CuI species, which initially form as mobile [CuI(NH3)2]+ complexes. As the temperature reaches 200 °C, these mobile complexes begin to lose an NH3 ligand, resulting in the emergence of the framework-coordinated Z[CuI(NH3)] species alongside the small amount of remaining unreduced CuII. | Full points for identifying the remaining CuII species (e.g., [CuII(NH3)3(X)]+), the dominant mobile CuI species ([CuI(NH3)2]+), and the emerging framework-coordinated CuI species (Z[CuI(NH3)]). |
| q2 | quantification | 30 | Estimate the relative fractions of the Cu species present at 200 °C for this specific sample. | The estimated relative fractions for this sample are 5% [CuII(NH3)3(X)]+, 85% mobile [CuI(NH3)2]+, and 10% framework-coordinated Z[CuI(NH3)], with an uncertainty of 10%. These specific values result from the sample's behavior during the NO-TPR process at 200 °C. The low fraction of CuII (5%) and high total fraction of CuI (95%) occur because the NO/NH3 mixture drives a main low-temperature reduction event for the oxidized Cu/Al=0.2 sample that is largely complete by this temperature. The dominance of [CuI(NH3)2]+ (85%) over Z[CuI(NH3)] (10%) reflects that the CuI species initially form as mobile di-ammine complexes, which are just beginning to lose a single NH3 ligand to form the framework-coordinated species as the temperature reaches 200 °C. | Full points for estimating ~5% CuII, ~85% [CuI(NH3)2]+, and ~10% Z[CuI(NH3)]. Partial credit for correctly identifying that CuI is ~95% of the total, with [CuI(NH3)2]+ being the major component. |
| q3 | reasoning | 30 | Explain the physical and chemical reasons for the presence and relative abundance of these specific Cu species at 200 °C. | The presence and relative abundance of these species are driven by the reduction of the initial oxidized Cu-CHA (Cu/Al=0.2) catalyst by the NO/NH3 mixture during NO-TPR. Initially, the copper exists as NH3-solvated [CuII(NH3)3(X)]+ complexes. A significant low-temperature reduction event occurs, converting 95% of these CuII species into CuI by 200 °C, leaving only 5% unreduced. The newly formed CuI species initially exist as mobile [CuI(NH3)2]+ complexes (85%), but as the temperature reaches 200 °C, they begin to lose a single NH3 ligand. This thermally driven ligand loss leads to the formation of the framework-coordinated Z[CuI(NH3)] species, which accounts for the remaining 10% of the copper. | Full points for explaining that the low-temperature reduction event converts most CuII to mobile [CuI(NH3)2]+, and that around 200 °C, thermal desorption of an NH3 ligand begins to convert the mobile species into framework-coordinated Z[CuI(NH3)]. |
| q4 | identification | 20 | What reference spectra or basis components are required to fit the XANES spectrum of this sample using a linear combination or multivariate approach? | Fitting the XANES spectrum using an MCR-ALS approach based on PCA requires three principal components (PCs) representing specific Cu species. The required basis components are PC1 for [CuII(NH3)3(X)]+ (where X=OH-, O- or NO3-), PC2 for mobile [CuI(NH3)2]+, and PC3 for framework-coordinated Z[CuI(NH3)]. These specific basis components are required because they correspond to the distinct chemical states generated in the Cu-CHA (Cu/Al=0.2) sample during NO-TPR at 200 °C. The NO/NH3 mixture reduces the initial CuII species (PC1) into mobile CuI di-ammine complexes (PC2), and as the temperature reaches 200 °C, the loss of an NH3 ligand from these mobile complexes necessitates the inclusion of the framework-coordinated Z[CuI(NH3)] component (PC3) to accurately capture the evolving structural properties of the sample. | Full points for listing the three principal components/reference spectra: PC1 for [CuII(NH3)3(X)]+, PC2 for [CuI(NH3)2]+, and PC3 for Z[CuI(NH3)]. |
Review
#282
Cu-CHA
Cu K
▶
LLM Prompt
Sample Information
Material: Cu-CHA
Support: Chabazite (CHA)
Reaction Conditions: 1000 ppm NO + 1000 ppm NH3, 190 °C
Sample-Specific Conditions
- Temperature: 190 °C
- Cu-CHA catalyst with Cu/Al=0.2, reduced pretreatment, during NO-TPR
Measurement
We plan to measure the Cu K XANES spectrum of this sample.
Questions
Based on all the information above:
1. Based on the reaction conditions (NO-TPR at 190 °C on a reduced-pretreated Cu-CHA catalyst), what candidate Cu species (reference spectra) are needed to model the XANES spectrum?
2. Estimate the relative fractions of the Cu species present in the catalyst at 190 °C.
Ground Truth
Material: Cu-CHA
Measurement: in-situ Cu K-edge transmission XANES
Fit method: Multivariate Curve Resolution (MCR-ALS) based on PCA
Phase fractions: (±10%)
| Phase | Fraction |
|---|---|
| [CuII(NH3)3(X)]+ | 0.2 |
| [CuI(NH3)2]+ | 0.75 |
| Z[CuI(NH3)] | 0.05 |
Fit basis (paper's reference spectra):
- [CuII(NH3)3(X)]+ (X=OH-, O- or NO3-)
- [CuI(NH3)2]+
- Z[CuI(NH3)]
Source evidence: Figure 5c (right panel, 0.2_15 RED) and Figure 6c (top panel)
Key reasoning: During the NO-TPR experiment on the reduced-pretreated Cu-CHA catalyst, the initial CuII species (solvated by NH3) are progressively reduced by the NO/NH3 mixture. By 190 °C, a broad low-temperature reduction event has occurred, reducing about 80% of the CuII to CuI. The dominant CuI species formed is the mobile [CuI(NH3)2]+ complex. At this temperature, the framework-coordinated Z[CuI(NH3)] species is just beginning to form in minor amounts, as the mobile complexes start to thermally desorb an NH3 ligand upon heating above 150-200 °C.
Reasoning source: Results and discussion - Comparison to NO-TPR (page 369) and XANES spectral evolution during NO-TPR (page 367)
Scoring Rubric (total: 100 pts)
| Q | Type | Max | Question | Reference Answer | Scoring Criteria |
|---|---|---|---|---|---|
| q1 | identification | 46 | Based on the reaction conditions (NO-TPR at 190 °C on a reduced-pretreated Cu-CHA catalyst), what candidate Cu species (reference spectra) are needed to model the XANES spectrum? | To model the XANES spectrum of this Cu-CHA catalyst, the required reference species are [CuII(NH3)3(X)]+ (where X=OH-, O- or NO3-), [CuI(NH3)2]+, and Z[CuI(NH3)]. These specific phases are expected because, during the NO-TPR experiment with 1000 ppm NO and 1000 ppm NH3, the initial NH3-solvated CuII species undergo progressive reduction. By 190 °C, the NO/NH3 mixture has reduced the majority of the CuII to CuI, primarily forming the mobile [CuI(NH3)2]+ complex. Additionally, the framework-coordinated Z[CuI(NH3)] species begins to appear as a minor phase because heating above 150-200 °C causes the mobile complexes to thermally desorb an NH3 ligand. | Full points for identifying a CuII ammonia-solvated complex (e.g., [CuII(NH3)3(X)]+), a mobile CuI diamine complex ([CuI(NH3)2]+), and a framework-coordinated monoamine CuI species (Z[CuI(NH3)]). |
| q2 | quantification | 54 | Estimate the relative fractions of the Cu species present in the catalyst at 190 °C. | At 190 °C, the estimated relative fractions of the Cu species are 75% [CuI(NH3)2]+, 20% [CuII(NH3)3(X)]+ (where X=OH-, O- or NO3-), and 5% Z[CuI(NH3)], with an uncertainty of 10%. These specific values result from a broad low-temperature reduction event driven by the NO/NH3 mixture during the NO-TPR process on the reduced-pretreated Cu-CHA catalyst. By reaching 190 °C, approximately 80% of the initial CuII species have been reduced to CuI, leaving 20% as unreduced [CuII(NH3)3(X)]+. The dominant reduction product is the mobile [CuI(NH3)2]+ complex (75%), while the remaining 5% consists of Z[CuI(NH3)], which just begins to form in minor amounts as the mobile complexes start to thermally desorb an NH3 ligand at this temperature. | Full points for estimating ~20% CuII species, ~75% [CuI(NH3)2]+, and ~5% Z[CuI(NH3)]. Partial credit if the total CuI is estimated at ~80% and CuII at ~20%, but the split between the two CuI species is slightly inaccurate. |
Review
The proximity between hydroxyl and single atom determines the catalytic reactivity of Rh1/CeO2 single-atom catalysts
BNL-NSLS-II-8-ID
Catalyst
Danfeng Wu et al.
DOI: 10.1007/s12274-023-6333-3
1 scenario
▶
#283
Rh/CeO2
Rh K
▶
LLM Prompt
Sample Information
Material: Rh/CeO2
Support: r-CeO2
Reaction Conditions: ex-situ
Sample-Specific Conditions
- support morphology: rod (111 facet)
- Rh single atoms on rod-shaped CeO2 exposing (111) facets
Measurement
We plan to measure the Rh K XANES spectrum of this sample.
Questions
Based on all the information above:
1. What is the expected oxidation state of the Rh species in the as-prepared 0.5Rh1/r-CeO2 catalyst, and what reference material would be most appropriate to confirm this via XANES energy comparison?
2. Although the XANES energy of this sample is similar to bulk Rh2O3, what structural feature distinguishes the Rh species in 0.5Rh1/r-CeO2 from bulk Rh2O3, and how is this confirmed spectroscopically?
3. Based on the paper's findings, explain how the combination of XANES and EXAFS data confirms the successful synthesis of a Rh single-atom catalyst on the r-CeO2 support.
Ground Truth
Material: 0.5Rh1/r-CeO2
Measurement: X-ray absorption near-edge structure (XANES), ex-situ, 8-ID beamline at National Synchrotron Light Source II (NSLS-II)
Fit method: Direct comparison of XANES energy to reference
Phase fractions: (±10%)
| Phase | Fraction |
|---|---|
| Rh3+ (single atoms) | 1.0 |
Fit basis (paper's reference spectra):
- Rh2O3
Source evidence: Page 4, right column (text referring to Fig. S11 and Table S2 in ESM); Page 8, Acknowledgements (beamline info)
Key reasoning: The XANES spectra of the 0.5Rh1/r-CeO2 sample showed a similar XANES energy to the Rh2O3 reference, indicating that the oxidation state of the Rh species is Rh3+. Furthermore, EXAFS analysis confirmed the presence of Rh-O bonds (similar to Rh2O3) but a complete absence of high-shell Rh-O-Rh peaks, which verifies the atomic dispersion of Rh as single atoms rather than bulk oxide particles.
Reasoning source: Page 4, right column (Results and discussion)
Scoring Rubric (total: 100 pts)
| Q | Type | Max | Question | Reference Answer | Scoring Criteria |
|---|---|---|---|---|---|
| q1 | identification | 30 | What is the expected oxidation state of the Rh species in the as-prepared 0.5Rh1/r-CeO2 catalyst, and what reference material would be most appropriate to confirm this via XANES energy comparison? | The expected oxidation state of the Rh species in the 0.5Rh1/r-CeO2 catalyst is Rh3+ (fraction of 1.0), and the most appropriate reference material for XANES energy comparison is Rh2O3. These specific phases and fractions are expected because the sample consists of Rh single atoms dispersed on rod-shaped r-CeO2 exposing (111) facets. Under these ex-situ conditions, the isolated Rh atoms bond strongly with the oxygen of the CeO2 support, leading to a fully oxidized Rh3+ state. Consequently, the sample exhibits a XANES energy that directly matches the bulk Rh2O3 reference spectrum. | Award full points for identifying the oxidation state as Rh3+ and naming Rh2O3 as the appropriate reference material for XANES energy comparison. |
| q2 | spectral | 40 | Although the XANES energy of this sample is similar to bulk Rh2O3, what structural feature distinguishes the Rh species in 0.5Rh1/r-CeO2 from bulk Rh2O3, and how is this confirmed spectroscopically? | The distinguishing structural feature of the 0.5Rh1/r-CeO2 sample is that the Rh species are atomically dispersed as isolated single atoms rather than forming bulk oxide particles. This structural property arises because the sample is specifically designed to stabilize Rh single atoms on rod-shaped CeO2 exposing (111) facets. Spectroscopically, this is confirmed by the EXAFS region, which shows the presence of Rh-O bonds but a complete absence of the high-shell Rh-O-Rh peaks characteristic of bulk Rh2O3. Therefore, while the XANES energy indicates a Rh3+ state similar to bulk Rh2O3, the lack of Rh-O-Rh scattering paths verifies the isolated nature of the Rh atoms. | Award full points for explaining that the Rh species are isolated single atoms, which is confirmed by the absence of high-shell Rh-O-Rh peaks in the EXAFS region (despite having similar Rh-O bonds to Rh2O3). |
| q3 | reasoning | 30 | Based on the paper's findings, explain how the combination of XANES and EXAFS data confirms the successful synthesis of a Rh single-atom catalyst on the r-CeO2 support. | The combination of XANES and EXAFS data confirms both the electronic state and the structural isolation of the Rh species. XANES analysis shows an energy similar to a Rh2O3 reference, while EXAFS analysis confirms the presence of Rh-O bonds but a complete absence of high-shell Rh-O-Rh peaks. These outcomes result directly from the sample conditions, where Rh is dispersed on rod-shaped r-CeO2 exposing (111) facets under ex-situ conditions. The strong interaction between the isolated Rh atoms and the oxygen-rich CeO2 support fully oxidizes the metal to Rh3+ (1.0 fraction). Simultaneously, the lack of Rh-O-Rh bonds proves that the Rh species do not aggregate into bulk oxide particles, confirming their successful stabilization as single atoms. | Award full points for stating that XANES confirms the Rh3+ oxidation state (similar to Rh2O3), while EXAFS confirms atomic dispersion by showing Rh-O coordination but lacking Rh-O-Rh scattering paths. |
Review
Mass production of high-performance single atomic FeNC electrocatalysts via sequenced ultrasonic atomization and pyrolysis process
APS
Catalyst
Jugang Ma et al.
DOI: 10.1007/s40843-020-1464-6
2 scenarios
▶
#284
Fe/N/C
Fe K
▶
LLM Prompt
Sample Information
Material: Fe/N/C
Support: Carbon black
Sample-Specific Conditions
- Synthesis stage: Before acid leaching
- Fe nanoparticles on carbon black before acid leaching
Measurement
We plan to measure the Fe K XANES spectrum of this sample.
Questions
Based on all the information above:
1. Based on the synthesis conditions (pyrolysis at 800 °C with carbon and phenanthroline), what is the expected dominant Fe phase and oxidation state in the FeNC sample before acid leaching, and what is the physical reasoning for its formation?
2. What standard reference spectra should be used to evaluate the Fe K-edge XANES spectrum of this sample, and which of these references will the sample's spectral shape most closely resemble?
3. What distinguishing feature in the XANES spectrum differentiates this pre-leached FeNC sample from the final single-atom catalyst (FeNC SACs) produced after the subsequent acid leaching step?
Ground Truth
Material: Fe/N/C
Measurement: Fe K-edge XANES, ex-situ, Advanced Photon Source
Fit method: Qualitative comparison
Phase fractions:
| Phase | Fraction |
|---|---|
| metallic_iron | 1.0 |
Fit basis (paper's reference spectra):
- Fe foil
- FeO
- Fe2O3
Source evidence: Page 10, Figure 4a
Key reasoning: The resonance of the normalized XANES spectrum of the FeNC is similar to that of the Fe foil, indicating an abundance of Fe(0) atoms in the FeNC. This result is attributable to the reducing effect of carbon and phenanthroline during the high-temperature pyrolysis.
Reasoning source: Page 10, Results and Discussion
Scoring Rubric (total: 100 pts)
| Q | Type | Max | Question | Reference Answer | Scoring Criteria |
|---|---|---|---|---|---|
| q1 | reasoning | 40 | Based on the synthesis conditions (pyrolysis at 800 °C with carbon and phenanthroline), what is the expected dominant Fe phase and oxidation state in the FeNC sample before acid leaching, and what is the physical reasoning for its formation? | The expected dominant Fe phase in the pre-leached FeNC sample is metallic iron nanoparticles with an oxidation state of 0. This phase accounts for a fraction of 1.0 in the sample. The formation of this metallic phase is attributable to the strong reducing effect of the carbon black support and phenanthroline during the high-temperature pyrolysis synthesis stage. Because the sample has not yet undergone acid leaching, these reducing conditions ensure the iron remains as an abundance of Fe(0) atoms. | Award 10 points for identifying metallic iron / Fe(0) as the dominant phase. Award 10 points for stating the oxidation state is 0. Award 20 points for explaining that this is due to the reducing effect of carbon and phenanthroline during the high-temperature pyrolysis. |
| q2 | spectral | 30 | What standard reference spectra should be used to evaluate the Fe K-edge XANES spectrum of this sample, and which of these references will the sample's spectral shape most closely resemble? | To evaluate the Fe K-edge XANES spectrum, Fe foil, FeO, and Fe2O3 should be used as the standard reference basis for qualitative comparison. The sample's spectral resonance will most closely resemble the Fe foil reference. This resemblance occurs because the high-temperature pyrolysis in the presence of carbon and phenanthroline exerts a strong reducing effect, converting the iron into metallic Fe(0) nanoparticles. Since the sample is measured before acid leaching, these metallic nanoparticles remain intact, causing the spectrum to be dominated by Fe(0) features. | Award 15 points for listing Fe foil, FeO, and Fe2O3 as the appropriate reference spectra. Award 15 points for stating that the sample's XANES resonance/shape will be similar to that of the Fe foil. |
| q3 | identification | 30 | What distinguishing feature in the XANES spectrum differentiates this pre-leached FeNC sample from the final single-atom catalyst (FeNC SACs) produced after the subsequent acid leaching step? | The pre-leached FeNC sample is distinguished by a XANES spectrum that is dominated by Fe(0) features and a resonance similar to Fe foil. In contrast, the final acid-leached FeNC single-atom catalysts exhibit an absorption edge close to Fe2O3, indicating a 3+ valence state. This spectral difference arises because the initial high-temperature pyrolysis with carbon and phenanthroline reduces the iron into metallic Fe(0) nanoparticles. The subsequent acid leaching step removes these metallic nanoparticles, leaving behind the oxidized single-atom sites that characterize the final catalyst. | Award 30 points for explaining that the pre-leached sample is dominated by metallic Fe(0) features, whereas the acid-leached FeNC SACs would show features of a higher oxidation state (Fe3+ / absorption edge close to Fe2O3). |
Review
#285
Fe/N/C
Fe K
▶
LLM Prompt
Sample Information
Material: Fe/N/C
Support: Carbon black
Sample-Specific Conditions
- Synthesis stage: After acid leaching and calcination
- Single atomic Fe catalyst after acid leaching and calcination
Measurement
We plan to measure the Fe K XANES spectrum of this sample.
Questions
Based on all the information above:
1. Based on the synthesis conditions (acid leaching and calcination of Fe/N/C), what is the dominant Fe active site structure and its expected oxidation state?
2. Describe the expected position of the Fe K-edge for this sample compared to standard references (Fe foil, FeO, Fe2O3) and state the specific edge energy (E0) if known.
3. What specific prominent absorption peak is expected in the XANES spectrum of this single-atom catalyst, and what electronic transition is it attributed to?
4. How does the XANES spectrum of this acid-leached sample (FeNC SACs) distinguish it from a pre-leached sample containing Fe nanoparticles?
Ground Truth
Material: Fe/N/C
Measurement: Fe K-edge XANES
Fit method: Theoretical spectrum comparison
Phase fractions:
| Phase | Fraction |
|---|---|
| FeN4 | 1.0 |
Fit basis (paper's reference spectra):
- Fe foil
- FeO
- Fe2O3
- Theoretical FeN4 spectrum
Source evidence: Page 10, Figure 4a, 4b, and Figure S9
Key reasoning: Acid leaching removes Fe nanoparticles formed during pyrolysis, leaving only single Fe atoms. The absorption edge of FeNC SACs is close to that of Fe2O3, indicating a 3+ valence state. A prominent peak at 7114.5 eV confirms Fe-ligand coordination, and theoretical XANES spectra match the experimental data for an Fe atom chelating to four pyridinic N atoms.
Reasoning source: Page 10, Results and Discussion
Scoring Rubric (total: 100 pts)
| Q | Type | Max | Question | Reference Answer | Scoring Criteria |
|---|---|---|---|---|---|
| q1 | identification | 25 | Based on the synthesis conditions (acid leaching and calcination of Fe/N/C), what is the dominant Fe active site structure and its expected oxidation state? | The dominant active site structure is a single atomic Fe coordinated to four pyridinic N atoms (FeN4Cx), with an expected oxidation state of 3+. This specific structure and 1.0 fraction of FeN4 arise because the acid leaching step removes any Fe nanoparticles that formed during the prior calcination of the Fe/N/C material. Consequently, only the acid-resistant single Fe atoms remain, which are chelated to four pyridinic N atoms bridging two graphene edges on the carbon black support. The 3+ oxidation state is confirmed by the absorption edge aligning closely with that of an Fe2O3 reference. | Full points for identifying single atomic Fe coordinated to four N atoms (FeN4) and an oxidation state of 3+. |
| q2 | spectral | 25 | Describe the expected position of the Fe K-edge for this sample compared to standard references (Fe foil, FeO, Fe2O3) and state the specific edge energy (E0) if known. | The expected position of the Fe K-edge for this sample is 7126.7 eV. Compared to standard references, this absorption edge is shifted to a higher energy than both Fe foil and FeO, aligning closely with the Fe2O3 reference. This shift occurs because the acid leaching process removes metallic Fe(0) nanoparticles, leaving behind single Fe atoms coordinated to nitrogen on the carbon support. This specific Fe-N coordination environment stabilizes the single Fe atoms in a 3+ valence state, resulting in an edge position that matches the Fe(III) oxide reference. | Full points for stating the edge is situated beyond Fe foil and FeO, is close to Fe2O3, and specifying the E0 value of approximately 7126.7 eV. |
| q3 | spectral | 25 | What specific prominent absorption peak is expected in the XANES spectrum of this single-atom catalyst, and what electronic transition is it attributed to? | A prominent absorption peak is expected at 7114.5 eV in the XANES spectrum of this sample. This peak is attributed to a 1s → 4p electronic transition occurring alongside a simultaneous ligand-to-metal (L–M) charge transfer. This specific spectral feature arises directly from the sample's synthesis via acid leaching and calcination, which isolates single Fe atoms on the carbon black support. Because the Fe atoms are exclusively chelated to four pyridinic N atoms (FeN4Cx) rather than forming metallic bonds, this distinct Fe-ligand coordination environment produces the prominent 7114.5 eV peak. | Full points for identifying the peak at 7114.5 eV and attributing it to the 1s → 4p transition with simultaneous ligand-to-metal (L–M) charge transfer. |
| q4 | reasoning | 25 | How does the XANES spectrum of this acid-leached sample (FeNC SACs) distinguish it from a pre-leached sample containing Fe nanoparticles? | The XANES spectrum of the acid-leached sample is distinguished by the complete absence of Fe(0) features and the presence of a prominent peak at 7114.5 eV indicative of specific Fe-N coordination. During the synthesis of the Fe/N/C material, calcination initially forms both single atoms and Fe nanoparticles. The subsequent acid leaching step specifically targets and removes these Fe nanoparticles, leaving only single Fe atoms. Therefore, the spectrum of the leached sample lacks the metallic Fe(0) characteristics seen in the unpurified sample and instead perfectly matches a theoretical FeN4 spectrum. | Full points for explaining that the acid-leached sample lacks Fe(0) features (which would indicate nanoparticles) and instead shows features characteristic of isolated Fe 3+ ions coordinated to nitrogen. |
Review
CO2 hydrogenation over rhodium cluster catalyst nucleated within a manganese oxide framework
BNL-NSLS-II-8-ID
Catalyst
Shuting Xiang et al.
DOI: 10.1016/j.apcata.2024.119845
3 scenarios
▶
#286
Rh-Na-OL1
Rh K-edge
▶
LLM Prompt
Sample Information
Material: Rh-Na-OL1
Support: Na-OL1
Reaction Conditions: Room temperature, air
Sample-Specific Conditions
- Support and counterion: Na-OL1
- Fresh Rh catalyst supported on Na-doped layered birnessite manganese oxide
Measurement
We plan to measure the Rh K-edge XANES spectrum of this sample.
Questions
Based on all the information above:
1. Based on the sample preparation conditions (as-synthesized, dried in air), what is the expected dominant oxidation state of Rh in the Rh-Na-OL1 sample, and what physical reasoning supports this?
2. What reference spectra are necessary to evaluate the oxidation state of this sample, and how does the sample's edge position compare to these references?
3. Describe the expected distinguishing spectral features of the Rh K-edge XANES for this as-synthesized sample compared to metallic rhodium.
Ground Truth
Material: Rh-Na-OL1
Measurement: Ex situ Rh K-edge XAFS at beamline 8-ID (ISS) at NSLS-II
Fit method: Qualitative edge position comparison
Phase fractions: (±10%)
| Phase | Fraction |
|---|---|
| Rh3+ (Rh2O3-like) | 1.0 |
Fit basis (paper's reference spectra):
- Rh foil
- Rh2O3
Source evidence: Page 22, Figure 6(a)
Key reasoning: The as-synthesized Rh-Na-OL1 sample was prepared via Rh3+ ion exchange and dried in air. Its XANES edge position is at the exact same position as the Rh2O3 reference, indicating that the Rh atoms are fully oxidized (Rh3+) and substitute into the MnO6 octahedral structures. There is an obvious deviation from the Rh foil spectrum, confirming the absence of metallic Rh.
Reasoning source: Section 3.6, Page 22
Scoring Rubric (total: 100 pts)
| Q | Type | Max | Question | Reference Answer | Scoring Criteria |
|---|---|---|---|---|---|
| q1 | reasoning | 35 | Based on the sample preparation conditions (as-synthesized, dried in air), what is the expected dominant oxidation state of Rh in the Rh-Na-OL1 sample, and what physical reasoning supports this? | The expected dominant oxidation state of Rh in the Rh-Na-OL1 sample is 3+, corresponding to a 1.0 fraction of Rh2O3-like species. This fully oxidized state arises because the fresh catalyst was prepared via Rh3+ ion exchange onto the Na-doped layered birnessite manganese oxide support and kept at room temperature in air. Under these as-synthesized, air-dried conditions, the Rh atoms substitute directly into the MnO6 octahedral structures of the support framework without undergoing any reduction. Consequently, the Rh species remain fully oxidized as Rh3+, confirming the complete absence of metallic Rh. | Full points if the answer correctly identifies the Rh oxidation state as 3+ and explains that the preparation in air leads to fully oxidized Rh substituting into the MnO6 framework, matching the Rh2O3 reference. |
| q2 | spectral | 35 | What reference spectra are necessary to evaluate the oxidation state of this sample, and how does the sample's edge position compare to these references? | The necessary reference spectra to evaluate the oxidation state of this sample are Rh foil (metallic Rh) and Rh2O3 (Rh3+). The Rh K-edge XANES edge position of the Rh-Na-OL1 sample is at the exact same position as the Rh2O3 reference and shows an obvious deviation from the Rh foil spectrum. These specific spectral features occur because the fresh sample was prepared via Rh3+ ion exchange on a Na-OL1 support and dried in air at room temperature. Because these conditions preserve the fully oxidized state and allow Rh to substitute into the MnO6 octahedral structures, the electronic structure of the sample perfectly matches the 3+ oxidation state of Rh2O3, confirming a 1.0 fraction of Rh3+. | Full points if the answer identifies Rh foil and Rh2O3 as the necessary references, and states that the sample's edge position is identical to Rh2O3. |
| q3 | spectral | 30 | Describe the expected distinguishing spectral features of the Rh K-edge XANES for this as-synthesized sample compared to metallic rhodium. | The primary distinguishing spectral feature of the Rh-Na-OL1 sample is that its XANES edge position exhibits an apparent deviation from the XANES of metallic Rh foil, instead appearing at the exact same position as the Rh2O3 reference. This distinct shift compared to metallic rhodium is expected because the fresh catalyst was synthesized via Rh3+ ion exchange on a Na-doped layered birnessite manganese oxide support and maintained in air at room temperature. These specific sample conditions prevent any reduction, causing the Rh atoms to substitute into the MnO6 octahedral framework as fully oxidized Rh3+ species. As a result, the spectrum lacks any metallic Rh features and perfectly mirrors the oxidized electronic state of a Rh2O3-like compound. | Full points if the answer notes an apparent deviation from the Rh foil spectrum and an edge position that matches Rh2O3, indicating obvious oxidation. |
Review
#287
Rh-V-OMS2
V K-edge
▶
LLM Prompt
Sample Information
Material: Rh-V-OMS2
Support: V-OMS2
Reaction Conditions: Room temperature, air
Sample-Specific Conditions
- Support and counterion: V-OMS2
- Fresh Rh catalyst supported on V-doped cryptomelane-type tunnel manganese oxide, measured at V edge
Measurement
We plan to measure the V K-edge XANES spectrum of this sample.
Questions
Based on all the information above:
1. Based on the synthesis of the V-doped cryptomelane-type tunnel manganese oxide (Rh-V-OMS2), what is the expected oxidation state and local coordination environment of the vanadium atoms, and what reference compound does it structurally resemble?
2. When analyzing the V K-edge XANES spectrum of this catalyst, what specific spectral features are considered the most reliable for determining the quantitative oxidation state and symmetry of the vanadium atoms?
Ground Truth
Material: Rh-V-OMS2
Measurement: V K-edge ex situ at beamline 8-ID (ISS)
Fit method: Correlation of normalized pre-edge peak area and centroid position
Phase fractions: (±10%)
| Phase | Fraction |
|---|---|
| VO2-like V4+ (substituting Mn in framework) | 1.0 |
Fit basis (paper's reference spectra):
- VO2
Source evidence: Page 24-25, Section 3.6
Key reasoning: To determine the quantitative and accurate oxidation state and symmetry information for vanadium, correlations between the normalized pre-edge peak area and its centroid position were analyzed. The V atoms in Rh-V-OMS2 were found to have an oxidation state of 4+ and an octahedral structure similar to VO2. This indicates that the V atoms substitutionally replace Mn atoms within the MnO6 octahedral structures of the OMS-2 framework.
Reasoning source: Section 3.6, Pages 24-25
Scoring Rubric (total: 100 pts)
| Q | Type | Max | Question | Reference Answer | Scoring Criteria |
|---|---|---|---|---|---|
| q1 | identification | 50 | Based on the synthesis of the V-doped cryptomelane-type tunnel manganese oxide (Rh-V-OMS2), what is the expected oxidation state and local coordination environment of the vanadium atoms, and what reference compound does it structurally resemble? | The vanadium atoms in the Rh-V-OMS2 catalyst are expected to have a 4+ oxidation state and an octahedral local coordination environment, structurally resembling the reference compound VO2. This specific state arises because the fresh catalyst is synthesized as a V-doped cryptomelane-type tunnel manganese oxide (V-OMS2) measured under room temperature and air. Under these conditions, the V atoms substitutionally replace Mn atoms directly within the MnO6 octahedral structures of the OMS-2 framework. Consequently, the vanadium adopts the host's octahedral geometry and stable 4+ oxidation state, resulting in a 100% fraction of VO2-like V4+ species. | Full credit requires identifying the oxidation state as 4+, the coordination environment as octahedral (substituting Mn in the MnO6 framework), and mentioning VO2 as the structurally similar reference compound. |
| q2 | spectral | 50 | When analyzing the V K-edge XANES spectrum of this catalyst, what specific spectral features are considered the most reliable for determining the quantitative oxidation state and symmetry of the vanadium atoms? | The most reliable spectral features for determining the quantitative oxidation state and symmetry of the vanadium atoms are the normalized pre-edge peak area and its centroid position. In the V K-edge XANES spectrum of the fresh Rh-V-OMS2 catalyst measured in air at room temperature, these pre-edge features directly probe the local electronic and structural environment of the vanadium dopant. Because the V atoms substitutionally replace Mn atoms within the MnO6 octahedral structures of the OMS-2 framework, they adopt a 4+ oxidation state and an octahedral geometry similar to VO2. The correlation between the pre-edge peak area and centroid position accurately reflects this specific VO2-like octahedral symmetry, confirming the successful framework substitution. | Full credit requires specifying the correlation between the normalized pre-edge peak area and its centroid position. |
Review
#288
Rh-Na-OL1
Rh K-edge
▶
LLM Prompt
Sample Information
Material: Rh-Na-OL1
Support: Na-OL1
Reaction Conditions: 4:1:1 H2:CO2:He, 300 °C
Sample-Specific Conditions
- Reaction state: Post-reaction
- Rh catalyst after in situ CO2 hydrogenation
Measurement
We plan to measure the Rh K-edge XANES spectrum of this sample.
Questions
Based on all the information above:
1. Based on the reaction conditions (4:1:1 H2:CO2:He, 300 °C), what is the dominant Rh phase expected in the post-reaction Rh-Na-OL1 catalyst, and what physical transformation occurs during the reaction to produce this phase?
2. Describe the expected XANES spectral shape of the post-reaction Rh-Na-OL1 sample. What distinguishing features in the XANES spectrum indicate the completion of this transformation compared to the fresh catalyst?
3. If one were to perform linear combination fitting (LCF) to track the evolution of the Rh species from the fresh state to the post-reaction state, what reference spectra would be essential to include in the fit basis?
Ground Truth
Material: Rh-Na-OL1
Measurement: Rh K-edge in situ XAFS at Beamline 7-BM (QAS)
Fit method: EXAFS fitting and qualitative XANES comparison
Phase fractions: (±10%)
| Phase | Fraction |
|---|---|
| metallic Rh | 1.0 |
Fit basis (paper's reference spectra):
- Rh foil (metallic Rh0)
- Rh2O3
Source evidence: Figure 7(a), Figure 8(a), and text on pages 25-26
Key reasoning: During in situ CO2 hydrogenation at 300 °C, the initially oxidized, highly dispersed Rh species are fully reduced. In situ XANES spectra show a clear transition towards metallic Rh, matching the Rh foil reference. EXAFS fitting confirms this by showing the Rh-O coordination number reducing to zero and the Rh-Rh coordination number increasing to approximately 5.5, indicating the formation of fully reduced metallic Rh sub-nanometer clusters.
Reasoning source: Section 3.7 (In situ Extended Fine Structure of Rh-X-(OL1/OMS2)), Pages 25-26
Scoring Rubric (total: 101 pts)
| Q | Type | Max | Question | Reference Answer | Scoring Criteria |
|---|---|---|---|---|---|
| q1 | reasoning | 38 | Based on the reaction conditions (4:1:1 H2:CO2:He, 300 °C), what is the dominant Rh phase expected in the post-reaction Rh-Na-OL1 catalyst, and what physical transformation occurs during the reaction to produce this phase? | The dominant Rh phase expected in the post-reaction Rh-Na-OL1 catalyst is fully reduced metallic Rh (Rh0) sub-nanometer clusters, which account for a fraction of 1.0 (100%) of the Rh species. This complete reduction occurs because the in situ CO2 hydrogenation conditions (4:1:1 H2:CO2:He at 300 °C) provide a highly reducing, hydrogen-rich environment at elevated temperatures. Under these specific conditions, the initially oxidized and highly dispersed Rh species undergo a physical transformation where Rh-O bonds are completely broken (coordination number reduces to zero) and Rh-Rh bonds form (coordination number increases to ~5.5). Consequently, the reaction environment drives the total conversion of the oxidized precursor into metallic Rh clusters. | Full points for identifying metallic Rh (Rh0) clusters as the dominant phase and explaining that the initially oxidized, highly dispersed Rh species are fully reduced under the reaction conditions. |
| q2 | spectral | 38 | Describe the expected XANES spectral shape of the post-reaction Rh-Na-OL1 sample. What distinguishing features in the XANES spectrum indicate the completion of this transformation compared to the fresh catalyst? | The expected XANES spectral shape of the post-reaction Rh-Na-OL1 sample closely matches the profile of a metallic Rh foil standard. The distinguishing features indicating the completion of this transformation are a decreased white line intensity compared to the fresh catalyst, the complete lack of the intense white line characteristic of oxidized Rh (e.g., Rh2O3), and an edge position that aligns with metallic Rh. These specific spectral features arise because the reducing reaction conditions (4:1:1 H2:CO2:He at 300 °C) drive the Rh fraction to 1.0 metallic Rh0. The high temperature and hydrogen-rich atmosphere strip oxygen from the initially oxidized Rh species, dropping the Rh-O coordination to zero and forming metallic clusters, which directly eliminates the oxidized white line feature. | Full points for stating the spectrum matches a metallic Rh foil standard, specifically noting the decreased white line intensity and the absence of features characteristic of oxidized Rh (like Rh2O3). |
| q3 | identification | 25 | If one were to perform linear combination fitting (LCF) to track the evolution of the Rh species from the fresh state to the post-reaction state, what reference spectra would be essential to include in the fit basis? | To track the evolution of the Rh species from the fresh to the post-reaction state, the essential reference spectra to include in the fit basis are Rh2O3 and Rh foil (metallic Rh0). These references are required because the in situ CO2 hydrogenation conditions (4:1:1 H2:CO2:He at 300 °C) force a complete chemical transition from a fully oxidized state to a fully reduced state. The hydrogen-rich atmosphere at 300 °C reduces the initially oxidized Rh species (modeled by Rh2O3) by breaking Rh-O bonds and forming Rh-Rh bonds. This results in a final post-reaction composition with a 1.0 fraction of metallic Rh clusters, making the Rh foil reference essential to capture the end state of this transformation. | Full points for identifying Rh foil (metallic Rh0) and Rh2O3 (oxidized Rh) as the necessary reference spectra. |
Review
Highly active Ni/CeO2 catalyst for CO2 methanation: Preparation and characterization
APS
Catalyst
Ning Rui et al.
DOI: 10.1016/j.apcatb.2020.119581
2 scenarios
▶
#289
NiO/CeO2
Ni K
▶
LLM Prompt
Sample Information
Material: NiO/CeO2
Support: CeO2
Reaction Conditions: Room temperature, flowing H2
Sample-Specific Conditions
- Preparation method: Thermal calcination
- Thermally calcined Ni precursor on CeO2 support at room temperature
Measurement
We plan to measure the Ni K XANES spectrum of this sample.
Questions
Based on all the information above:
1. Based on the sample conditions (thermally calcined Ni precursor on CeO2, measured at room temperature under flowing H2), what is the expected dominant phase of the nickel species, and what physical reasoning justifies this expectation?
2. Describe the expected key spectral features of the Ni K-edge XANES spectrum for this sample, specifically focusing on the edge position and the white line.
3. What specific electronic transition gives rise to the intense white line feature in the Ni K-edge XANES spectrum of this sample?
4. What distinguishing spectral features in the Ni K-edge XANES spectrum would differentiate this room-temperature sample from a fully reduced metallic Ni sample?
Ground Truth
Material: NiO/CeO2
Measurement: in-situ Ni K-edge XAS, beamline 9-BM at Advanced Photon Source (APS)
Source evidence: Figure 4(a) and Section 3.3, page 19
Key reasoning: At room temperature under flowing H2, the Ni K-edge XANES spectrum of the thermally calcined NiO/CeO2-C sample shows an intense white line feature and an edge energy around 8345 eV. This spectral shape and edge position perfectly match the NiO reference spectrum, indicating that the nickel is fully in the NiO state prior to heating.
Reasoning source: Section 3.3, page 19
Scoring Rubric (total: 100 pts)
| Q | Type | Max | Question | Reference Answer | Scoring Criteria |
|---|---|---|---|---|---|
| q1 | reasoning | 25 | Based on the sample conditions (thermally calcined Ni precursor on CeO2, measured at room temperature under flowing H2), what is the expected dominant phase of the nickel species, and what physical reasoning justifies this expectation? | The expected dominant phase of the nickel species is fully oxidized NiO (Ni2+). This phase arises because the sample was prepared via thermal calcination of a Ni precursor on the CeO2 support, which naturally forms an oxidized NiO state. Although the measurement is conducted under flowing H2, the reaction conditions are strictly at room temperature, which is insufficient to initiate the reduction process prior to heating. Consequently, the nickel remains entirely in its initial NiO state, perfectly matching the bulk NiO reference spectrum. | Full points for identifying NiO as the dominant phase and explaining that at room temperature, the H2 reduction has not yet initiated, leaving the calcined precursor in its fully oxidized NiO state. |
| q2 | spectral | 25 | Describe the expected key spectral features of the Ni K-edge XANES spectrum for this sample, specifically focusing on the edge position and the white line. | The Ni K-edge XANES spectrum for this sample is expected to exhibit an edge energy located at approximately 8345 eV alongside an intense white line feature. These specific spectral features arise because the sample consists of a thermally calcined Ni precursor on CeO2 measured at room temperature, which leaves the nickel fully in the oxidized Ni2+ (NiO) state prior to heating. The oxidized electronic structure of this unreduced NiO state produces this characteristic intense white line and higher edge position, perfectly matching a bulk NiO reference. | Full points for stating an edge energy of approximately 8345 eV and describing an intense white line feature characteristic of NiO. |
| q3 | spectral | 25 | What specific electronic transition gives rise to the intense white line feature in the Ni K-edge XANES spectrum of this sample? | The intense white line feature in the Ni K-edge XANES spectrum originates from the 1s → 4p electronic transition. This transition is highly prominent because the sample, prepared via thermal calcination and kept at room temperature under flowing H2, remains fully in the oxidized Ni2+ (NiO) state prior to heating. In this unreduced NiO state, the specific electronic structure of the oxidized nickel facilitates this strong 1s to 4p absorption event, producing the intense white line characteristic of bulk NiO. | Full points for correctly identifying the 1s → 4p transition as the origin of the white line. |
| q4 | prediction | 25 | What distinguishing spectral features in the Ni K-edge XANES spectrum would differentiate this room-temperature sample from a fully reduced metallic Ni sample? | This room-temperature sample is differentiated from a fully reduced metallic Ni sample by its intense white line and a higher edge energy of approximately 8345 eV. These distinguishing features occur because the room-temperature conditions under flowing H2 are insufficient to reduce the thermally calcined NiO/CeO2 sample, leaving it in a fully oxidized Ni2+ state. In contrast, if the sample were fully reduced to metallic Ni, the structural and electronic changes would cause the spectrum to exhibit a dramatically weakened white line and an edge shifted down to 8333 eV. | Full points for noting that the oxidized sample has an intense white line and higher edge energy (~8345 eV), whereas the reduced metallic Ni would show a dramatically weakened white line and an edge shifted to lower energy (~8333 eV). |
Review
#290
Ni/CeO2
Ni K
▶
LLM Prompt
Sample Information
Material: Ni/CeO2
Support: CeO2
Reaction Conditions: 500 °C, flowing H2
Sample-Specific Conditions
- Preparation method: Thermal calcination
- Thermally calcined Ni catalyst reduced at 500 °C
Measurement
We plan to measure the Ni K XANES spectrum of this sample.
Questions
Based on all the information above:
1. Identify the dominant Ni phase present in the thermally calcined Ni/CeO2 catalyst after reduction in flowing H2 at 500 °C. What reference spectra should be used to verify this phase?
2. Describe the expected Ni K-edge XANES spectral features for this reduced sample, specifically focusing on the edge position and white line intensity compared to the unreduced NiO state. What electronic transition is associated with the white line?
Ground Truth
Material: Ni/CeO2
Measurement: in-situ Ni K-edge XANES at beamline 9-BM (APS)
Fit method: qualitative comparison
Phase fractions:
| Phase | Fraction |
|---|---|
| metallic_nickel | 1.0 |
Fit basis (paper's reference spectra):
- Ni foil
- NiO
Source evidence: Figure 4(a) and Section 3.3, page 17; TR-XRD on page 23
Key reasoning: Under H2 at 500 °C, the white line intensity is weakened dramatically, and the edge energy shifts to 8333 eV, matching the Ni foil reference. This indicates that NiO is completely reduced to metallic Ni. TR-XRD also confirms that NiO is entirely reduced to metallic Ni at 290 °C for the calcined catalyst, so at 500 °C it is fully metallic.
Reasoning source: Section 3.3, pages 17 and 23
Scoring Rubric (total: 100 pts)
| Q | Type | Max | Question | Reference Answer | Scoring Criteria |
|---|---|---|---|---|---|
| q1 | identification | 43 | Identify the dominant Ni phase present in the thermally calcined Ni/CeO2 catalyst after reduction in flowing H2 at 500 °C. What reference spectra should be used to verify this phase? | The dominant Ni phase present in the thermally calcined Ni/CeO2 catalyst after reduction is metallic Ni, with a fraction of 1.0. To verify this phase, reference spectra for Ni foil and NiO should be used as a fit basis for qualitative comparison. This complete reduction to metallic Ni occurs because the sample is exposed to flowing H2 at 500 °C, which provides a strong reducing environment. As confirmed by TR-XRD, the NiO in the calcined catalyst is entirely reduced to metallic Ni by 290 °C, ensuring that at the elevated condition of 500 °C, the transformation to oxidation state 0 is fully complete. | 15 points for identifying metallic Ni as the dominant phase (fraction 1.0). 15 points for listing Ni foil (or metallic Ni) and NiO as reference spectra. |
| q2 | spectral | 57 | Describe the expected Ni K-edge XANES spectral features for this reduced sample, specifically focusing on the edge position and white line intensity compared to the unreduced NiO state. What electronic transition is associated with the white line? | The expected Ni K-edge XANES spectrum for this sample will exhibit an edge energy shifted to 8333 eV and a dramatically weakened white line intensity compared to the unreduced NiO state, which typically has an edge at 8345 eV. The white line feature in this spectrum originates from the 1s to 4p electronic transition. These specific spectral features arise because the flowing H2 environment at 500 °C completely reduces the initial NiO to metallic Ni (oxidation state 0). Because TR-XRD confirms full reduction occurs by 290 °C, the sample at 500 °C is fully metallic, causing its spectral shape and edge position to perfectly match that of a metallic Ni foil reference. | 15 points for stating the edge energy shifts to lower energy (specifically 8333 eV). 15 points for stating the white line intensity is weakened dramatically compared to NiO. 10 points for identifying the white line origin as the 1s->4p transition. |
Review
Selective hydrogenation of CO2 and CO over potassium promoted Co/ZSM-5
BNL-NSLS-II-8-ID
Catalyst
Renjie Liu et al.
DOI: 10.1016/j.apcatb.2020.119787
4 scenarios
▶
#291
K-CoOx/H-ZSM-5
Co K
▶
LLM Prompt
Sample Information
Material: K-CoOx/H-ZSM-5
Support: H-ZSM-5 (Si/Al=200)
Reaction Conditions: Room temperature
Sample-Specific Conditions
- Preparation method and state: IWI, Fresh
- As-synthesized K-promoted Co/ZSM-5 prepared by incipient wetness impregnation
Measurement
We plan to measure the Co K XANES spectrum of this sample.
Questions
Based on all the information above:
1. What candidate reference spectra are required to construct a complete basis for modeling the Co K-edge XANES data of this catalyst system (including its fresh state and subsequent reduction)?
2. Estimate the phase fractions of the cobalt species present in the fresh, as-synthesized IWI200 catalyst prior to any reduction treatment.
3. Explain the physical reasoning for the expected initial phase composition of this as-synthesized catalyst based on its preparation method.
Ground Truth
Material: K-CoOx/H-ZSM-5 (Si/Al=200)
Measurement: Co K-edge XANES, in situ, 8-ID (ISS) beamline at NSLS-II
Fit method: Multivariate Curve Resolution (MCR) analysis
Phase fractions: (±10%)
| Phase | Fraction |
|---|---|
| Co3O4 | 0.8 |
| CoO | 0.2 |
Fit basis (paper's reference spectra):
- CoO
- Co3O4
- metallic Co (nano-Co)
Source evidence: Page 21, Section 3.5 text and Figure 5
Key reasoning: The fresh IWI200 catalyst is prepared by incipient wetness impregnation and calcined in air at 550 °C, which primarily forms Co3O4. However, MCR analysis of the XANES data for the fresh sample identifies two components, Co3O4 and CoO, indicating that the as-synthesized state is not a pure single oxide phase. The composition is determined to be a mixture of 80% Co3O4 and 20% CoO.
Reasoning source: Section 2.3 (Synthesis Method) and Section 3.5 (Multivariate Curve Resolution Analysis of XANES Data)
Scoring Rubric (total: 100 pts)
| Q | Type | Max | Question | Reference Answer | Scoring Criteria |
|---|---|---|---|---|---|
| q1 | identification | 30 | What candidate reference spectra are required to construct a complete basis for modeling the Co K-edge XANES data of this catalyst system (including its fresh state and subsequent reduction)? | The required reference spectra to construct a complete basis for modeling this catalyst system are CoO, Co3O4, and metallic Co (nano-Co). These specific phases are expected because the fresh K-CoOx/H-ZSM-5 catalyst is prepared by incipient wetness impregnation and calcined in air at 550 °C, which primarily forms Co3O4 along with some CoO. The inclusion of metallic Co (nano-Co) is necessary to account for the subsequent reduction of these initial oxide phases. Together, this three-component basis fully captures the initial mixed-oxide state at room temperature and the eventual reduced metallic state of the catalyst. | Full credit for identifying CoO, Co3O4, and metallic Co (or nano-Co) as the necessary reference spectra. |
| q2 | quantification | 40 | Estimate the phase fractions of the cobalt species present in the fresh, as-synthesized IWI200 catalyst prior to any reduction treatment. | The fresh, as-synthesized IWI200 catalyst consists of 80% Co3O4 and 20% CoO, with an uncertainty of 10%. These specific values result from the incipient wetness impregnation preparation method followed by calcination in air at 550 °C. While this high-temperature calcination primarily drives the formation of Co3O4, it does not produce a pure single oxide phase. Consequently, the as-synthesized state at room temperature remains a mixed oxide, which MCR analysis identifies as the 80:20 ratio of Co3O4 to CoO. | Full credit for stating 80% Co3O4 and 20% CoO. Partial credit for identifying the correct phases without the exact 80/20 split. |
| q3 | reasoning | 30 | Explain the physical reasoning for the expected initial phase composition of this as-synthesized catalyst based on its preparation method. | The expected initial phase composition of the fresh catalyst is a mixed oxide state consisting of 80% Co3O4 and 20% CoO. This composition arises directly from the catalyst's preparation via incipient wetness impregnation followed by calcination in air at 550 °C. The high-temperature air calcination provides the oxidizing environment necessary to primarily form Co3O4. However, the process does not yield a pure single oxide phase, resulting in a residual 20% fraction of CoO remaining in the as-synthesized material at room temperature. | Full credit for explaining that calcination in air at 550 °C primarily forms Co3O4, but a minor fraction of CoO (20%) is also present, resulting in a mixed oxide state rather than a pure single phase. |
Review
#292
K-Co/H-ZSM-5
Co K
▶
LLM Prompt
Sample Information
Material: K-Co/H-ZSM-5
Support: H-ZSM-5 (Si/Al=200)
Reaction Conditions: H2 flow, room temperature after cooling
Sample-Specific Conditions
- Preparation method and state: IWI, Reduced
- Reduced K-promoted Co/ZSM-5 prepared by incipient wetness impregnation
Measurement
We plan to measure the Co K XANES spectrum of this sample.
Questions
Based on all the information above:
1. Identify the candidate reference spectra required to model the Co K-edge XANES data for the IWI200 catalyst during its reduction process.
2. Estimate the phase fractions of the Co species present in the K-promoted Co/ZSM-5 (IWI200) catalyst after in situ reduction at 350 °C for 1.5 h.
3. Explain the physical reasoning for why this specific phase composition is observed after reduction, focusing on the effects of the incipient wetness impregnation (IWI) method and the Si/Al ratio of the support.
Ground Truth
Material: K-Co/H-ZSM-5 (IWI200)
Measurement: Co K-edge in-situ XANES at 8-ID (ISS) beamline, NSLS-II
Fit method: Multivariate Curve Resolution (MCR)
Phase fractions: (±10%)
| Phase | Fraction |
|---|---|
| CoO | 0.67 |
| nano-Co | 0.33 |
Fit basis (paper's reference spectra):
- CoO
- Co3O4
- metallic Co (nano-Co)
Source evidence: Page 21, text and Figure 5
Key reasoning: The incipient wetness impregnation (IWI) method increases contact between the electropositive K promoter and Co, which facilitates reduction via electron donation. Additionally, the high Si/Al ratio of 200 means there is a lower concentration of acid sites compared to lower ratios (like Si/Al=50), which allows for a greater extent of reduction. Despite these promoting factors, the reduction at 350 °C is incomplete, yielding a mixture of CoO and metallic nano-Co.
Reasoning source: Section 3.5 (Page 21) and Section 4. Discussion (Page 26)
Scoring Rubric (total: 100 pts)
| Q | Type | Max | Question | Reference Answer | Scoring Criteria |
|---|---|---|---|---|---|
| q1 | identification | 20 | Identify the candidate reference spectra required to model the Co K-edge XANES data for the IWI200 catalyst during its reduction process. | To model the Co K-edge XANES data for the IWI200 catalyst during its reduction process, the required candidate reference spectra are CoO, Co3O4, and metallic Co (nano-Co). These specific phases are expected because the sample undergoes reduction under H2 flow, transitioning from initial oxidized cobalt species (Co3O4) through intermediate oxides (CoO) toward metallic cobalt. The incipient wetness impregnation (IWI) method enhances contact between the electropositive K promoter and Co, facilitating this reduction via electron donation. Furthermore, the high Si/Al ratio of 200 provides fewer acid sites, promoting the reduction process, though the reduction at 350 °C remains incomplete, necessitating references for both oxidized and metallic states. | Award full points for identifying CoO, Co3O4, and metallic Co (or nano-Co) as the necessary reference components. |
| q2 | quantification | 40 | Estimate the phase fractions of the Co species present in the K-promoted Co/ZSM-5 (IWI200) catalyst after in situ reduction at 350 °C for 1.5 h. | After in situ reduction at 350 °C, the phase fractions of the Co species in the K-Co/H-ZSM-5 (IWI200) catalyst are estimated to be 0.67 (67%) CoO and 0.33 (33%) metallic nano-Co, with an uncertainty of 10%. These specific values result from the competing effects of the catalyst's composition and the applied reduction conditions. The IWI preparation method increases contact with the electropositive K promoter, which donates electrons to facilitate reduction, while the high Si/Al ratio of 200 minimizes acid sites that typically hinder reduction. However, despite these promoting factors, the thermal energy provided at 350 °C is insufficient to fully reduce the cobalt, resulting in this specific incomplete reduction mixture dominated by CoO. | Award full points for estimating approximately 67% CoO and 33% metallic Co (nano-Co). Deduct points proportionally for estimates outside a 10% error margin. |
| q3 | reasoning | 40 | Explain the physical reasoning for why this specific phase composition is observed after reduction, focusing on the effects of the incipient wetness impregnation (IWI) method and the Si/Al ratio of the support. | The observed phase composition of 67% CoO and 33% metallic nano-Co arises from the specific structural and chemical properties imparted by the sample preparation and support. The incipient wetness impregnation (IWI) method maximizes the contact between the electropositive K promoter and the cobalt species. This close proximity facilitates the reduction process under H2 flow through electron donation from potassium to cobalt. Additionally, the H-ZSM-5 support has a high Si/Al ratio of 200, which corresponds to a lower concentration of acid sites compared to supports with lower ratios, thereby allowing for a greater extent of reduction. Ultimately, while these combined factors promote the formation of metallic Co, the reduction temperature of 350 °C is not high enough to achieve complete reduction, leaving a majority CoO phase. | Award full points for explaining that (1) the IWI method increases contact between electropositive K and Co, facilitating reduction, and (2) the high Si/Al ratio (200) provides fewer acid sites that would otherwise hinder reduction, leading to a greater (but still incomplete) extent of reduction to CoO and nano-Co. |
Review
#293
CoOx/K-ZSM-5
Co K
▶
LLM Prompt
Sample Information
Material: CoOx/K-ZSM-5
Support: K-ZSM-5 (Si/Al=200)
Reaction Conditions: Room temperature
Sample-Specific Conditions
- Preparation method and state: IE, Fresh
- As-synthesized Co/ZSM-5 prepared by ion exchange
Measurement
We plan to measure the Co K XANES spectrum of this sample.
Questions
Based on all the information above:
1. Identify the dominant cobalt phase present in the fresh, as-synthesized IE200 catalyst prior to any reduction treatment, and explain why this phase is expected.
2. To analyze the in situ XANES reduction series of this IE200 catalyst using Multivariate Curve Resolution (MCR), what specific reference spectra or basis components are required to capture the full transformation?
Ground Truth
Material: CoOx/K-ZSM-5 (IE200)
Measurement: Co K-edge XANES, in situ, 8-ID (ISS) beamline at NSLS-II
Fit method: Multivariate Curve Resolution (MCR)
Phase fractions: (±10%)
| Phase | Fraction |
|---|---|
| Co3O4 | 1.0 |
Fit basis (paper's reference spectra):
- CoO
- Co3O4
- nano-Co
- intermediate state
Source evidence: Page 22, Section 3.5, Figure 5c
Key reasoning: The fresh IE200 catalyst, prepared by ion exchange and calcined in air, is composed entirely of Co3O4 prior to reduction. MCR analysis of the XANES dataset for the fresh sample yields a 100% contribution from the Co3O4 reference component.
Reasoning source: Section 3.5, Page 22
Scoring Rubric (total: 100 pts)
| Q | Type | Max | Question | Reference Answer | Scoring Criteria |
|---|---|---|---|---|---|
| q1 | identification | 50 | Identify the dominant cobalt phase present in the fresh, as-synthesized IE200 catalyst prior to any reduction treatment, and explain why this phase is expected. | The dominant cobalt phase present in the fresh, as-synthesized IE200 catalyst is Co3O4, which accounts for 100% of the cobalt species. This specific phase is expected because the sample was prepared via ion exchange on a K-ZSM-5 (Si/Al=200) support and subsequently calcined in air. Prior to any reduction treatment at room temperature, this air calcination fully oxidizes the cobalt precursor, resulting entirely in the Co3O4 phase. Consequently, Multivariate Curve Resolution (MCR) analysis of the XANES spectrum yields a 1.0 fraction for the Co3O4 reference, which is characterized by a main peak at approximately 7730 eV. | Full credit for identifying Co3O4 as the sole/dominant phase (100%) and explaining that it is the expected state for the fresh, calcined catalyst before reduction. |
| q2 | reasoning | 50 | To analyze the in situ XANES reduction series of this IE200 catalyst using Multivariate Curve Resolution (MCR), what specific reference spectra or basis components are required to capture the full transformation? | To analyze the in situ XANES reduction series of the IE200 catalyst using Multivariate Curve Resolution (MCR), the required basis components are CoO, Co3O4, nano-Co, and an intermediate state. These specific components are necessary to capture the full structural evolution of the CoOx/K-ZSM-5 material during the reduction process. Because the fresh sample, prepared by ion exchange and calcined in air, begins entirely as fully oxidized Co3O4, it must transition through intermediate phases before reaching a metallic state. Therefore, including the initial Co3O4 phase, the intermediate CoO and "intermediate state" phases, and the final reduced nano-Co phase ensures the entire reduction pathway is accurately modeled. | Full credit for listing Co3O4, CoO, nano-Co (or metallic Co), and an intermediate state component. |
Review
#294
Co/K-ZSM-5
Co K
▶
LLM Prompt
Sample Information
Material: Co/K-ZSM-5
Support: K-ZSM-5 (Si/Al=200)
Reaction Conditions: H2 flow, room temperature after cooling
Sample-Specific Conditions
- Preparation method and state: IE, Reduced
- Reduced Co/ZSM-5 prepared by ion exchange
Measurement
We plan to measure the Co K XANES spectrum of this sample.
Questions
Based on all the information above:
1. What candidate reference spectra or components are needed to model the XANES data of this sample during its reduction process using Multivariate Curve Resolution (MCR)?
2. Estimate the phase fractions of the Co species in the sample after the in situ reduction at 350 °C for 1.5 h.
3. Explain the physical reasoning for the observed extent of reduction in this ion-exchanged (IE) catalyst, particularly in comparison to a co-impregnated (IWI) catalyst.
Ground Truth
Material: Co/K-ZSM-5
Measurement: Co K-edge XANES, in situ, 8-ID (ISS) beamline at NSLS-II
Fit method: MCR
Phase fractions: (±10%)
| Phase | Fraction |
|---|---|
| CoO | 0.84 |
| nano-Co | 0.16 |
Fit basis (paper's reference spectra):
- CoO
- Co3O4
- nano-Co
- intermediate state
Source evidence: Page 22, text and Figure 5
Key reasoning: The IE200 catalyst is reduced to a lesser extent than the corresponding IWI200 catalyst. In the IE catalysts, K is introduced via ion exchange and is not in intimate contact with the Co-based active phase. This lack of contact, unlike in co-impregnated catalysts where electropositive K donates electrons to facilitate Co reduction, results in less nano-Co formation and a higher fraction of CoO remaining after reduction.
Reasoning source: Section 3.5 (Page 22) and Section 4 (Page 26)
Scoring Rubric (total: 100 pts)
| Q | Type | Max | Question | Reference Answer | Scoring Criteria |
|---|---|---|---|---|---|
| q1 | identification | 30 | What candidate reference spectra or components are needed to model the XANES data of this sample during its reduction process using Multivariate Curve Resolution (MCR)? | The candidate reference spectra needed to model the XANES data using MCR are CoO, Co3O4, nano-Co, and an intermediate state. These specific components are required because the Co/K-ZSM-5 sample undergoes a reduction process in H2 flow where the initial oxidized cobalt species transition toward metallic cobalt. Because this sample was prepared via ion exchange (IE), the potassium is not in intimate contact with the cobalt phase to donate electrons and facilitate reduction. Consequently, the reduction is incomplete, necessitating a basis set that includes both fully reduced (nano-Co) and partially reduced or unreduced oxide phases (CoO, Co3O4, and an intermediate state) to accurately capture the structural evolution. | Full points for identifying CoO, Co3O4, nano-Co (or metallic Co), and an intermediate state component. |
| q2 | quantification | 35 | Estimate the phase fractions of the Co species in the sample after the in situ reduction at 350 °C for 1.5 h. | After reduction, the estimated phase fractions are 0.84 (84%) CoO and 0.16 (16%) nano-Co, with an uncertainty of 10%. These specific values result directly from the ion exchange (IE) preparation method used for this Co/K-ZSM-5 catalyst. In this IE preparation, the potassium is not in intimate contact with the Co-based active phase. Without this close contact, the electropositive K cannot donate electrons to facilitate the reduction of cobalt under H2 flow, yielding a low fraction of metallic nano-Co (16%) and leaving a predominantly high fraction of unreduced CoO (84%). | Full points for estimating ~84% CoO and ~16% nano-Co. Partial points for identifying CoO as the dominant phase with a minor metallic Co component. |
| q3 | reasoning | 35 | Explain the physical reasoning for the observed extent of reduction in this ion-exchanged (IE) catalyst, particularly in comparison to a co-impregnated (IWI) catalyst. | The ion-exchanged (IE) Co/K-ZSM-5 catalyst exhibits a significantly lower extent of reduction compared to the corresponding co-impregnated (IWI) catalyst. This occurs because, in the IE preparation method, potassium is introduced via ion exchange and does not maintain intimate contact with the Co-based active phase. In contrast, co-impregnated catalysts allow the electropositive potassium to be in close proximity to cobalt, where it can donate electrons and facilitate the reduction process under H2 flow. Due to this lack of contact in the IE sample, the electron donation mechanism is absent, resulting in less nano-Co formation and a much higher fraction of CoO remaining after the reduction treatment. | Full points for explaining that in the IE catalyst, K is not in intimate contact with the Co active phase, which limits the electron donation from K to Co that would otherwise facilitate reduction (as seen in IWI catalysts), leading to a lesser extent of reduction (more CoO, less nano-Co). |
Review
Enhancing glycerol electrooxidation from synergistic interactions of platinum and transition metal carbides
BNL-NSLS-II-8-ID
Catalyst
Hansen Mou et al.
DOI: 10.1016/j.apcatb.2022.121648
1 scenario
▶
#295
Pt/C
Pt L3, L2
▶
LLM Prompt
Sample Information
Material: Pt/C
Support: Vulcan XC-72
Reaction Conditions: 0.1 M KOH + 1 M glycerol, 1.1 V vs RHE
Sample-Specific Conditions
- Potential: 1.1 V
- Commercial Pt on carbon catalyst under glycerol oxidation conditions
Measurement
We plan to measure the Pt L3, L2 XANES spectrum of this sample.
Questions
Based on all the information above:
1. Based on the reaction conditions (1.1 V vs RHE in 0.1 M KOH + 1 M glycerol), what is the expected dominant phase and oxidation state of Pt in the Pt/C catalyst?
2. Describe the expected spectral shape of the Pt L3-edge XANES for this sample at 1.1 V vs RHE, particularly focusing on the white line intensity compared to its state at open circuit and a standard reference material.
3. Explain the physical reasoning for the observed chemical state of Pt at 1.1 V vs RHE. How does the applied potential affect the Pt species compared to the initial open circuit condition?
Ground Truth
Material: Pt/C
Measurement: in-situ Pt L3-edge XANES at beamline 7-BM (QAS)
Fit method: Qualitative comparison
Phase fractions: (±10%)
| Phase | Fraction |
|---|---|
| metallic_platinum | 1.0 |
Fit basis (paper's reference spectra):
- Pt foil
Source evidence: Figure 5a and Section 3.4, page 17
Key reasoning: At open circuit, the Pt/C catalyst exhibits a mild oxidation feature. As the potential exceeds 0.3 V, the white line becomes weaker and resembles that of Pt foil due to the reduction of Pt. The XANES features remain unchanged up to 1.1 V, indicating that Pt is in a largely metallic state under these reaction conditions.
Reasoning source: Section 3.4 In-situ XAFS Characterization, page 17
Scoring Rubric (total: 100 pts)
| Q | Type | Max | Question | Reference Answer | Scoring Criteria |
|---|---|---|---|---|---|
| q1 | identification | 30 | Based on the reaction conditions (1.1 V vs RHE in 0.1 M KOH + 1 M glycerol), what is the expected dominant phase and oxidation state of Pt in the Pt/C catalyst? | The expected dominant phase of the Pt/C catalyst is metallic platinum with an oxidation state of 0, representing a fraction of 1.0. This purely metallic phase arises because, under the specific reaction conditions of 1.1 V vs RHE in 0.1 M KOH and 1 M glycerol, the initially mildly oxidized Pt at open circuit undergoes reduction. Specifically, as the applied potential exceeds 0.3 V, the Pt is reduced to a metallic state. This metallic state remains stable and unchanged up to the applied potential of 1.1 V, resulting in the complete absence of oxidized species. | Full points for identifying metallic Pt (oxidation state 0) as the dominant or sole phase. |
| q2 | spectral | 35 | Describe the expected spectral shape of the Pt L3-edge XANES for this sample at 1.1 V vs RHE, particularly focusing on the white line intensity compared to its state at open circuit and a standard reference material. | The expected Pt L3-edge XANES spectrum at 11564 eV will closely resemble that of a metallic Pt foil reference. The primary distinguishing feature is a weak white line intensity, which contrasts sharply with the stronger white line of the mildly oxidized state observed at open circuit. This specific spectral shape arises because the applied potential of 1.1 V vs RHE in the KOH and glycerol electrolyte causes the reduction of the Pt species. As the potential exceeds 0.3 V, the reduction to a purely metallic state (oxidation state 0) eliminates the strong white line, yielding a spectrum nearly identical to metallic Pt foil. | Full points for stating that the spectrum resembles a metallic Pt foil reference and exhibits a weaker white line intensity compared to the open circuit condition. |
| q3 | reasoning | 35 | Explain the physical reasoning for the observed chemical state of Pt at 1.1 V vs RHE. How does the applied potential affect the Pt species compared to the initial open circuit condition? | At the initial open circuit condition, the commercial Pt/C catalyst exhibits a mild oxidation feature. However, as the applied potential in the 0.1 M KOH and 1 M glycerol solution exceeds 0.3 V vs RHE, the platinum undergoes a reduction process. This reduction converts the mildly oxidized platinum species into a purely metallic state. Because these XANES features remain unchanged as the potential is further increased up to 1.1 V, the physical reasoning dictates that the Pt remains in a stable, largely metallic state under these specific glycerol oxidation conditions. | Full points for explaining that while Pt is mildly oxidized at open circuit, applying a potential > 0.3 V leads to the reduction of Pt, which then remains in a largely metallic state up to 1.1 V. |
Review
The in-situ formation of supported hydrous ruthenium oxide in aqueous phase during HDO of lignin-derived fractions
ESRF-BM23
Catalyst
Evgeny Naranov et al.
DOI: 10.1016/j.apcatb.2023.122861
2 scenarios
▶
#296
RuO2
Ru K-edge
▶
LLM Prompt
Sample Information
Material: RuO2
Support: micro-mesoporous materials (S1, S2, S4)
Reaction Conditions: ambient
Sample-Specific Conditions
- reaction time: 0 h
- Initial state of the RuO2 supported on micro-mesoporous materials
Measurement
We plan to measure the Ru K-edge XANES spectrum of this sample.
Questions
Based on all the information above:
1. Based on the preparation method (calcination at 400 °C) and ambient conditions prior to the reaction, what is the expected dominant Ru phase in this sample, and what is its oxidation state?
2. Describe the expected Ru K-edge XANES spectral shape of this as-prepared sample. What reference material would it most closely resemble?
Ground Truth
Material: RuO2 supported on micro-mesoporous materials (S1, S2, S4)
Measurement: Ru K-edge XANES, transmission mode, BM23 beamline of ESRF
Fit method: Direct comparison to reference spectra
Phase fractions:
| Phase | Fraction |
|---|---|
| RuO2 | 1.0 |
Fit basis (paper's reference spectra):
- RuO2
- metallic Ru
- RuOOH
Source evidence: Section 3.2, Page 12; Figure 2C
Key reasoning: The catalysts were prepared by incipient wetness impregnation followed by calcination at 400 °C, which oxidizes the Ru precursor to RuO2. The Ru K-edge XANES spectra of all three as-prepared samples (RuO2/S1, RuO2/S2, RuO2/S4) were identical to the RuO2 reference spectrum. This confirms that ruthenium is entirely in the Ru(IV) oxidation state prior to the hydrodeoxygenation reaction.
Reasoning source: Section 2.1 (Materials synthesis) and Section 3.2 (RuO2 phase characterization)
Scoring Rubric (total: 100 pts)
| Q | Type | Max | Question | Reference Answer | Scoring Criteria |
|---|---|---|---|---|---|
| q1 | identification | 50 | Based on the preparation method (calcination at 400 °C) and ambient conditions prior to the reaction, what is the expected dominant Ru phase in this sample, and what is its oxidation state? | The expected dominant phase in this sample is RuO2 (fraction of 1.0), with ruthenium in the Ru(IV) or 4+ oxidation state. This specific phase and oxidation state arise because the catalysts were prepared via incipient wetness impregnation followed by calcination at 400 °C. This high-temperature calcination completely oxidizes the Ru precursor into RuO2. Since the sample is in its initial state (0 h reaction time) under ambient conditions prior to the hydrodeoxygenation reaction, no reduction has occurred, leaving the ruthenium entirely in the fully oxidized Ru(IV) state. | Full points for identifying RuO2 as the dominant/sole phase and Ru(IV) or 4+ as the oxidation state, with reasoning tied to the oxidative calcination treatment. |
| q2 | spectral | 50 | Describe the expected Ru K-edge XANES spectral shape of this as-prepared sample. What reference material would it most closely resemble? | The Ru K-edge XANES spectral shape of this as-prepared sample is expected to be identical to the pure RuO2 reference spectrum. Specifically, it will display an absorption edge position characteristic of the Ru(IV) oxidation state. These spectral features result directly from the sample preparation, where calcination at 400 °C fully oxidizes the precursor to RuO2. Because the sample is at 0 h reaction time under ambient conditions, its electronic structure consists entirely of Ru(IV) without any reduced species, producing a spectrum that perfectly matches the RuO2 reference for all supported samples (S1, S2, S4). | Full points for stating the spectrum will be identical to a RuO2 reference spectrum and that the absorption edge position will be characteristic of the Ru(IV) state. |
Review
#297
Ru/RuO2/RuOOH
Ru K-edge
▶
LLM Prompt
Sample Information
Material: Ru/RuO2/RuOOH
Support: micro-mesoporous materials (S1, S2, S4)
Reaction Conditions: 200 °C, 20 bar H2, aqueous phase, 3 hours
Sample-Specific Conditions
- reaction time: 3 h
- In-situ formed hydrous ruthenium oxide (HRO) during hydrodeoxygenation
Measurement
We plan to measure the Ru K-edge XANES spectrum of this sample.
Questions
Based on all the information above:
1. Based on the reaction conditions (200 °C, 20 bar H2, aqueous phase), what candidate reference spectra or basis functions are required to accurately model the Ru K-edge XANES spectrum of this catalyst using Linear Combination Fitting (LCF)?
2. Estimate the phase fractions of the ruthenium species present in the catalyst after 3 hours of hydrodeoxygenation under these specific conditions.
3. Explain the physical reasoning for why the catalyst does not fully reduce to metallic Ru under these relatively strong reducing conditions (20 bar H2, 200 °C) after 3 hours, leading to the observed phase mixture.
Ground Truth
Material: Ru/RuO2/RuOOH
Measurement: Ru K-edge in-situ transmission mode at BM23 beamline of ESRF
Fit method: LCF
Phase fractions:
| Phase | Fraction |
|---|---|
| metallic Ru | 0.33 |
| RuO2 | 0.33 |
| RuOOH | 0.34 |
Fit basis (paper's reference spectra):
- RuO2
- metallic Ru
- RuOOH
Source evidence: Abstract (Page 1) and Section 3.5 (Page 26)
Key reasoning: Under HDO conditions (200 °C, 20 bar H2) in an aqueous medium, the initial RuO2 phase undergoes partial reduction. The presence of water significantly slows down the reduction process compared to reactions in hydrocarbon solvents, preventing complete conversion to metallic Ru even after 3 hours. This hindered reduction results in the coexistence of metallic Ru, unreduced RuO2, and a newly formed RuOOH phase (hydrous ruthenium oxide) in approximately equal ratios.
Reasoning source: Abstract (Page 1) and Section 3.4 (Page 23)
Scoring Rubric (total: 100 pts)
| Q | Type | Max | Question | Reference Answer | Scoring Criteria |
|---|---|---|---|---|---|
| q1 | identification | 25 | Based on the reaction conditions (200 °C, 20 bar H2, aqueous phase), what candidate reference spectra or basis functions are required to accurately model the Ru K-edge XANES spectrum of this catalyst using Linear Combination Fitting (LCF)? | To accurately model the Ru K-edge XANES spectrum using Linear Combination Fitting (LCF), the required reference spectra are RuO2, metallic Ru, and RuOOH. These specific basis functions are necessary because the initial RuO2 phase undergoes only partial reduction under the hydrodeoxygenation conditions of 200 °C and 20 bar H2 in an aqueous medium. The presence of water significantly slows down the reduction process compared to hydrocarbon solvents, preventing complete conversion to metallic Ru over the 3-hour reaction time. Consequently, this hindered reduction leads to a final state where unreduced RuO2, newly formed hydrous ruthenium oxide (RuOOH), and metallic Ru coexist. | Full points for identifying all three necessary components: metallic Ru, RuO2, and RuOOH. Deduct points for missing components or including incorrect phases. |
| q2 | quantification | 35 | Estimate the phase fractions of the ruthenium species present in the catalyst after 3 hours of hydrodeoxygenation under these specific conditions. | After 3 hours of hydrodeoxygenation, the estimated phase fractions are 33% metallic Ru, 33% RuO2, and 34% RuOOH. These approximately equal fractions result directly from conducting the reaction at 200 °C and 20 bar H2 in an aqueous phase. Although the hydrogen pressure and temperature are relatively high, the aqueous medium significantly hinders the reduction process of the initial RuO2 phase. Because the water slows down the reduction rate, the 3-hour timeframe is insufficient for complete conversion, leaving a balanced coexistence of the unreduced oxide, the metallic phase, and the in-situ formed RuOOH. | Full points for stating that the three phases (metallic Ru, RuO2, and RuOOH) exist in approximately equal ratios (~33% each). Partial credit if the correct phases are identified but the ratios are significantly off. |
| q3 | reasoning | 40 | Explain the physical reasoning for why the catalyst does not fully reduce to metallic Ru under these relatively strong reducing conditions (20 bar H2, 200 °C) after 3 hours, leading to the observed phase mixture. | The catalyst does not fully reduce to metallic Ru because the hydrodeoxygenation reaction takes place in an aqueous medium. While the conditions of 200 °C and 20 bar H2 are strongly reducing, the presence of water significantly slows down the reduction process of the initial RuO2 phase compared to reactions performed in hydrocarbon solvents. Due to this hindered reduction rate, a 3-hour reaction time is insufficient to achieve complete conversion. As a result, the partial reduction yields an approximately equal mixture of metallic Ru (33%), unreduced RuO2 (33%), and an in-situ formed hydrous ruthenium oxide or RuOOH phase (34%). | Full points for explaining that the presence of the aqueous phase (water) slows down the reduction kinetics of RuO2 compared to hydrocarbon environments, resulting in a partial reduction that leaves unreduced RuO2, forms RuOOH, and only yields a fraction of metallic Ru. |
Review
Promoting the oxidative coupling of methanol and dimethylamine using group 1 alkali metals on palladium-gold nanoparticles
BNL-NSLS-II-8-ID
Catalyst
Alexander P. Minne et al.
DOI: 10.1016/j.apcatb.2025.125533
2 scenarios
▶
#298
PdAu-K
Pd K
▶
LLM Prompt
Sample Information
Material: PdAu-K
Support: amorphous silica (Si-xerogel)
Reaction Conditions: Ambient temperature and pressure
Sample-Specific Conditions
- Alkali promoter: K
- Potassium-promoted palladium-gold nanoparticles on silica
Measurement
We plan to measure the Pd K XANES spectrum of this sample.
Questions
Based on all the information above:
1. What candidate reference spectra are needed to perform Linear Combination Fitting (LCF) on the Pd K-edge XANES spectrum of this PdAu-K/SiO2 sample?
2. Based on the sample conditions (ambient temperature/pressure, ex situ measurement after reduction), estimate the phase fractions of the Pd species present in the PdAu-K/SiO2 catalyst.
3. Why does the PdAu-K/SiO2 sample exhibit a partially oxidized phase composition despite being a reduced bimetallic catalyst?
Ground Truth
Material: PdAu-K/SiO2
Measurement: Pd K-edge ex situ XANES at SSRL beamline 9-3
Fit method: Linear combination fitting (LCF)
Phase fractions:
| Phase | Fraction |
|---|---|
| metallic_palladium | 0.83 |
| palladium_oxide | 0.17 |
Fit basis (paper's reference spectra):
- metallic Pd
- PdO
Source evidence: Section 3.1, Page 12, text and Figure 2
Key reasoning: XANES spectra suggest that most of the Pd in the K-promoted sample is in the metallic state, but some is oxidized. EXAFS fitting indicates the Pd is mostly coordinated to Au (alloyed), but with smaller contributions from Pd and O. This suggests there may be some local Pd aggregation, and aggregates near the surface may become partially oxidized. The total Pd coordination number being closer to 9 than 12 also suggests significant amounts of surface Pd, which is susceptible to this partial oxidation.
Reasoning source: Section 3.1, Page 12
Scoring Rubric (total: 100 pts)
| Q | Type | Max | Question | Reference Answer | Scoring Criteria |
|---|---|---|---|---|---|
| q1 | identification | 20 | What candidate reference spectra are needed to perform Linear Combination Fitting (LCF) on the Pd K-edge XANES spectrum of this PdAu-K/SiO2 sample? | The candidate reference spectra needed for LCF of the Pd K-edge XANES spectrum are metallic Pd and PdO. These phases are expected because, under ambient temperature and pressure, the potassium-promoted palladium-gold nanoparticles consist primarily of metallic Pd alloyed with Au. However, the total Pd coordination number is closer to 9 than 12, indicating a significant amount of surface Pd. This surface Pd, along with local Pd aggregation, is highly susceptible to partial oxidation under ambient conditions, requiring both metallic and oxide references to accurately fit the spectrum. | Award full points for identifying metallic Pd and PdO (or palladium oxide) as the necessary reference spectra. |
| q2 | quantification | 40 | Based on the sample conditions (ambient temperature/pressure, ex situ measurement after reduction), estimate the phase fractions of the Pd species present in the PdAu-K/SiO2 catalyst. | The estimated phase fractions for the Pd K-edge XANES spectrum are 0.83 (83%) metallic palladium and 0.17 (17%) palladium oxide. These specific values result from the sample's bimetallic nanoparticle structure under ambient conditions, where the Pd is mostly alloyed and coordinated to Au in a metallic state. The 17% oxide fraction arises because the nanoparticles have a total Pd coordination number closer to 9 rather than 12, indicating a high proportion of surface Pd. Additionally, local Pd aggregation occurs, and these surface-exposed aggregates become partially oxidized when exposed to ambient temperature and pressure. | Award 40 points for estimating ~83% metallic Pd and ~17% PdO. Allow a ±10% margin of error for full points. Deduct points proportionally for larger deviations. |
| q3 | reasoning | 40 | Why does the PdAu-K/SiO2 sample exhibit a partially oxidized phase composition despite being a reduced bimetallic catalyst? | The PdAu-K/SiO2 sample exhibits a partially oxidized phase composition under ambient conditions due to the structural characteristics of its nanoparticles. While the Pd is mostly coordinated to Au in a metallic alloy, the total Pd coordination number is closer to 9 than 12, which indicates a significant amount of surface Pd. Furthermore, smaller coordination contributions from Pd and O suggest that some local Pd aggregation occurs within the sample. These surface-exposed Pd aggregates are highly susceptible to their environment, causing them to become partially oxidized when exposed to ambient temperature and pressure. | Award full points for explaining that while the sample is mostly alloyed (metallic), local Pd aggregation occurs, and these aggregates near the surface become partially oxidized. Mentioning that the high fraction of surface Pd (indicated by lower coordination numbers) makes it susceptible to oxidation should also be credited. |
Review
#299
PdAu-Cs
Pd K
▶
LLM Prompt
Sample Information
Material: PdAu-Cs
Support: amorphous silica (Si-xerogel)
Reaction Conditions: Ambient temperature and pressure
Sample-Specific Conditions
- Alkali promoter: Cs
- Cesium-promoted palladium-gold nanoparticles on silica
Measurement
We plan to measure the Pd K XANES spectrum of this sample.
Questions
Based on all the information above:
1. What candidate reference spectra are required to perform a linear combination fitting (LCF) analysis of the Pd K-edge XANES spectrum for this as-synthesized, ex-situ sample?
2. Estimate the phase fractions of the Pd species present in this Cs-promoted PdAu/SiO2 catalyst under ambient, ex-situ conditions.
3. Explain the physical reasoning for the observed phase composition. Specifically, why is the sample predominantly metallic, and what structural feature accounts for the minor oxidized fraction?
Ground Truth
Material: PdAu-Cs/SiO2
Measurement: Pd K-edge ex situ XANES at SSRL beamline 9-3
Fit method: Linear combination fitting (LCF)
Phase fractions:
| Phase | Fraction |
|---|---|
| metallic_palladium | 0.91 |
| palladium_oxide | 0.09 |
Fit basis (paper's reference spectra):
- metallic Pd
- PdO
Source evidence: Page 12, Section 3.1, text
Key reasoning: XANES spectra indicate that most of the Pd in the Cs-promoted sample is in the metallic state, though a small fraction is oxidized. EXAFS fitting shows Pd is mostly coordinated to Au, indicating an alloyed structure, but local Pd aggregation near the surface can lead to partial oxidation. The high metallic fraction (91%) aligns with the higher Pd-Au coordination number observed for the Cs-promoted sample compared to the K-promoted sample, suggesting it is more metallic and less oxidized.
Reasoning source: Page 12, Section 3.1
Scoring Rubric (total: 100 pts)
| Q | Type | Max | Question | Reference Answer | Scoring Criteria |
|---|---|---|---|---|---|
| q1 | identification | 20 | What candidate reference spectra are required to perform a linear combination fitting (LCF) analysis of the Pd K-edge XANES spectrum for this as-synthesized, ex-situ sample? | The required reference spectra for the LCF analysis of the Pd K-edge XANES spectrum are metallic Pd and PdO. These specific phases are expected because the cesium-promoted palladium-gold nanoparticles on silica form an alloyed structure where Pd is mostly coordinated to Au, stabilizing a predominantly metallic state. However, local Pd aggregation near the surface of the nanoparticles leads to partial oxidation under ambient, ex-situ conditions. Thus, both metallic and oxide references are needed to accurately model the structural reality of this sample. | Full points for identifying metallic Pd (or Pd foil) and PdO as the necessary reference standards. |
| q2 | quantification | 40 | Estimate the phase fractions of the Pd species present in this Cs-promoted PdAu/SiO2 catalyst under ambient, ex-situ conditions. | The LCF analysis yields phase fractions of 0.91 (91%) metallic palladium and 0.09 (9%) palladium oxide. This high metallic fraction results from the Cs-promoted sample's alloyed structure, which exhibits a high Pd-Au coordination number that keeps the Pd predominantly metallic. The small 9% oxidized fraction occurs because of local Pd aggregation near the nanoparticle surface. Under ambient temperature and pressure, these surface-segregated Pd atoms are susceptible to partial oxidation, resulting in the minor PdO component. | Full points for estimating ~91% metallic palladium and ~9% palladium oxide. Deduct points proportionally for deviations greater than 10%. |
| q3 | reasoning | 40 | Explain the physical reasoning for the observed phase composition. Specifically, why is the sample predominantly metallic, and what structural feature accounts for the minor oxidized fraction? | The predominantly metallic composition (91%) of the Cs-promoted PdAu/SiO2 catalyst is driven by its highly alloyed structure, where Pd is mostly coordinated to Au. This high Pd-Au coordination number, which is characteristic of the Cs-promoted sample, inherently stabilizes the metallic state and reduces overall oxidation. Conversely, the minor oxidized fraction (9%) is caused by local Pd aggregation near the surface of the nanoparticles. When these surface Pd aggregates are exposed to ambient temperature and pressure during ex-situ handling, they undergo partial oxidation to form PdO. | Full points for explaining that the Pd is mostly alloyed with Au (leading to the dominant metallic state), but local Pd aggregation near the nanoparticle surface results in partial oxidation. |
Review
A dual promotional effect of doping tantalum (Ta) in atomically dispersed Ru/CeO2 catalyst toward CO2 methanation: Enhanced associative adsorption of CO2 and activation of H2
BNL-NSLS-II-8-ID
Catalyst
Deboshree Mukherjee et al.
DOI: 10.1016/j.apcato.2025.207077
2 scenarios
▶
#300
Ru/Ta-CeO2
Ru K-edge
▶
LLM Prompt
Sample Information
Material: Ru/Ta-CeO2
Support: Ta-CeO2
Reaction Conditions: in air, RT
Sample-Specific Conditions
- treatment: as prepared
- As prepared Ru/Ta-CeO2 catalyst
Measurement
We plan to measure the Ru K-edge XANES spectrum of this sample.
Questions
Based on all the information above:
1. Based on the preparation conditions (calcined in air at 500 °C), what is the expected chemical state and dispersion of the Ru species in the as-prepared Ru/Ta-CeO2 catalyst?
2. What reference standards should be measured to qualitatively assess the oxidation state of this sample via Ru K-edge XANES?
3. How does the structural environment of the Ru species in this as-prepared sample differ from bulk RuO2, and what specific X-ray absorption spectral evidence supports this?
4. Describe the expected general shape of the Ru K-edge XANES spectrum for this as-prepared sample compared to a metallic Ru reference.
Ground Truth
Material: Ru/Ta-CeO2
Measurement: Ru K-edge XANES, fluorescence mode, 7-BM (QAS) and 8-ID (ISS) beamlines
Fit method: Qualitative comparison
Phase fractions:
| Phase | Fraction |
|---|---|
| RuOx | 1.0 |
Fit basis (paper's reference spectra):
- Ru foil
- RuO2
Source evidence: Page 32, Section 3.D; Figure 13A and 13C
Key reasoning: The as-prepared Ru/Ta-CeO2 catalyst, which was calcined in air at 500 °C, exhibits a Ru K-edge XANES spectrum characteristic of oxidized Ru species (RuOx). The corresponding EXAFS spectrum shows no signal around 2.4 Å for Ru-Ru coordination, indicating that the Ru species is present in an atomically dispersed state anchored to the Ta-CeO2 support surface.
Reasoning source: Page 32, Section 3.D
Scoring Rubric (total: 100 pts)
| Q | Type | Max | Question | Reference Answer | Scoring Criteria |
|---|---|---|---|---|---|
| q1 | identification | 30 | Based on the preparation conditions (calcined in air at 500 °C), what is the expected chemical state and dispersion of the Ru species in the as-prepared Ru/Ta-CeO2 catalyst? | The expected chemical state of the Ru species in the as-prepared Ru/Ta-CeO2 catalyst is fully oxidized (RuOx, fraction 1.0), and it exists in an atomically dispersed state. Because the sample was calcined in air at 500 °C, this highly oxidative environment drives the complete oxidation of the ruthenium precursor. Additionally, the specific interaction with the Ta-CeO2 support during this preparation anchors the Ru species to the surface, preventing agglomeration. This results in isolated, atomically dispersed RuOx species rather than the formation of bulk ruthenium oxide particles. | The answer must identify the Ru species as oxidized (RuOx) and specify that it is atomically dispersed on the support. |
| q2 | reasoning | 20 | What reference standards should be measured to qualitatively assess the oxidation state of this sample via Ru K-edge XANES? | To qualitatively assess the oxidation state of this sample via Ru K-edge XANES, Ru foil and RuO2 should be measured as reference standards. Because the as-prepared Ru/Ta-CeO2 catalyst was calcined in air at 500 °C, the Ru species are driven to a fully oxidized state (RuOx). Measuring a metallic Ru foil provides a baseline for the fully reduced state, while bulk RuO2 serves as the standard for the fully oxidized state. Comparing the sample against these two extremes confirms that the air treatment successfully oxidized the ruthenium, as evidenced by a spectrum distinctly different from the metallic foil. | The answer must mention a metallic reference (Ru foil) and an oxidized reference (such as RuO2). |
| q3 | reasoning | 30 | How does the structural environment of the Ru species in this as-prepared sample differ from bulk RuO2, and what specific X-ray absorption spectral evidence supports this? | Unlike bulk RuO2, which features an extended lattice with adjacent ruthenium atoms, the Ru species in this as-prepared sample are atomically dispersed and anchored directly to the Ta-CeO2 support surface. Because the catalyst was prepared by calcination in air at 500 °C on the Ta-CeO2 support, the support stabilizes the oxidized Ru (RuOx) as isolated atoms and prevents them from sintering into bulk crystals. The specific spectral evidence supporting this structural difference is the complete absence of a Ru-Ru coordination peak around 2.4 Å in the corresponding EXAFS spectrum. This lack of Ru-Ru scattering confirms that the preparation conditions successfully yielded an isolated, atomically dispersed RuOx phase. | The answer must explain that the sample contains atomically dispersed RuOx rather than bulk RuO2 particles, evidenced by the lack of a Ru-Ru coordination signal (around 2.4 Å) in the EXAFS data. |
| q4 | spectral | 20 | Describe the expected general shape of the Ru K-edge XANES spectrum for this as-prepared sample compared to a metallic Ru reference. | The expected Ru K-edge XANES spectrum for this sample will exhibit a strong white line that is distinctly different from the spectrum of a metallic Ru foil reference. Because the as-prepared Ru/Ta-CeO2 catalyst was calcined in air at 500 °C, the ruthenium is completely converted into an oxidized RuOx phase (fraction 1.0). This highly oxidized state depletes electron density from the Ru atoms, leading to a strong transition to unoccupied states that manifests as an intense white line peak. Therefore, the spectral shape directly reflects the oxidized, atomically dispersed environment created by the air calcination, contrasting sharply with the features of zero-valent metallic ruthenium. | The answer must state that the spectrum will exhibit a strong white line typical of oxidized species, distinguishing it from the metallic Ru foil spectrum. |
Review
#301
Ru/Ta-CeO2
Ru K-edge
▶
LLM Prompt
Sample Information
Material: Ru/Ta-CeO2
Support: Ta-CeO2
Reaction Conditions: in He atmosphere, RT
Sample-Specific Conditions
- treatment: H2 pretreated
- H2 pretreated Ru/Ta-CeO2 catalyst
Measurement
We plan to measure the Ru K-edge XANES spectrum of this sample.
Questions
Based on all the information above:
1. What is the dominant Ru phase in the Ru/Ta-CeO2 catalyst after H2 pretreatment at 300 °C, and what is the physical reasoning for this state based on the treatment conditions?
2. What reference spectra are appropriate to evaluate the reduction state of this sample, and how does the sample's XANES spectrum compare to these references after the H2 pretreatment?
3. How does the Ru speciation (oxidation state and coordination) change from the as-prepared state to the H2-pretreated state, and how is this reflected in the X-ray absorption data?
Ground Truth
Material: Ru/Ta-CeO2
Measurement: in situ Ru K-edge XANES in fluorescence mode at NSLS-II (7-BM and 8-ID)
Fit method: Qualitative comparison (no formal LCF reported)
Phase fractions:
| Phase | Fraction |
|---|---|
| metallic Ru | 1.0 |
Fit basis (paper's reference spectra):
- Ru foil
- RuO2
Source evidence: Page 32, text and Figure 13A
Key reasoning: The as-prepared Ru/Ta-CeO2 catalyst initially contains atomically dispersed RuOx species. After H2 pretreatment at 300 °C, the Ru K-edge XANES spectrum shifts and closely resembles the Ru metal reference (Ru foil). Concurrently, EXAFS shows the emergence of a Ru-Ru coordination signal and a significant weakening of the Ru-O peak, confirming the reduction of RuOx to metallic Ru.
Reasoning source: Page 32, text discussing Figure 13
Scoring Rubric (total: 100 pts)
| Q | Type | Max | Question | Reference Answer | Scoring Criteria |
|---|---|---|---|---|---|
| q1 | reasoning | 40 | What is the dominant Ru phase in the Ru/Ta-CeO2 catalyst after H2 pretreatment at 300 °C, and what is the physical reasoning for this state based on the treatment conditions? | The dominant Ru phase in the H2-pretreated Ru/Ta-CeO2 catalyst is metallic Ru (oxidation state 0) with a fraction of 1.0. This state arises because the sample is subjected to a reductive H2 pretreatment at 300 °C, which drives the complete reduction of the initially atomically dispersed RuOx species. The reducing hydrogen atmosphere at this elevated temperature strips oxygen from the RuOx, leading to the formation of metallic Ru. This physical transformation is confirmed by the XANES spectrum shifting to lower energy to match a Ru foil reference, alongside EXAFS data showing the emergence of Ru-Ru coordination and the weakening of Ru-O bonds. | Award full points for identifying metallic Ru (or Ru(0)) as the dominant phase and explaining that the H2 pretreatment reduces the initial atomically dispersed RuOx species into metallic Ru, as evidenced by the emergence of Ru-Ru coordination. |
| q2 | spectral | 30 | What reference spectra are appropriate to evaluate the reduction state of this sample, and how does the sample's XANES spectrum compare to these references after the H2 pretreatment? | The appropriate reference spectra to evaluate the reduction state of this sample are Ru foil (metallic Ru) and RuO2. After the H2 pretreatment, the sample's Ru K-edge XANES spectrum shifts to a lower energy and closely resembles the spectral shape of the Ru foil reference, while losing the features associated with oxidized RuOx. This spectral behavior occurs because the H2 pretreatment at 300 °C completely reduces the initial atomically dispersed RuOx species into metallic Ru (fraction 1.0). Consequently, the loss of oxygen coordination and the formation of Ru-Ru metallic bonds dictate that the sample's spectrum aligns with the metallic Ru foil reference rather than the RuO2 reference. | Award full points for mentioning Ru foil (metallic Ru) and RuO2 as appropriate references, and stating that the sample's spectrum closely resembles the Ru foil reference after pretreatment. |
| q3 | prediction | 30 | How does the Ru speciation (oxidation state and coordination) change from the as-prepared state to the H2-pretreated state, and how is this reflected in the X-ray absorption data? | In the as-prepared state, the Ru/Ta-CeO2 catalyst consists of atomically dispersed RuOx species characterized by Ru-O coordination. Following H2 pretreatment at 300 °C, the speciation completely changes to metallic Ru (oxidation state 0) with a fraction of 1.0. This transformation occurs because the reducing H2 atmosphere at 300 °C removes oxygen from the RuOx species, driving the reduction of the metal and the formation of metallic Ru-Ru bonds. In the X-ray absorption data, this is reflected by the XANES spectrum shifting to lower energy to match a Ru foil reference, while EXAFS shows a significant weakening of the Ru-O peak and the emergence of a Ru-Ru coordination signal. | Award full points for explaining the transition from atomically dispersed RuOx (Ru-O coordination, higher energy edge) to metallic Ru (Ru-Ru coordination, edge shifted to lower energy matching Ru foil). |
Review
Understanding the interfacial changes of PtCo3O4 catalysts during the dehydrogenation of ammonia borane
ESRF-BM23
Catalyst
Silvio Bellomi et al.
DOI: 10.1016/j.apsusc.2025.164116
1 scenario
▶
#302
PtCo3O4
Co K
▶
LLM Prompt
Sample Information
Material: PtCo3O4
Support: Co3O4
Reaction Conditions: Fresh, before reaction
Sample-Specific Conditions
- Reaction state: Before reaction
- Fresh Pt-impregnated Co3O4 catalyst before ammonia borane dehydrogenation
Measurement
We plan to measure the Co K XANES spectrum of this sample.
Questions
Based on all the information above:
1. Describe the expected spectral shape of the fresh PtCo3O4 catalyst at the Co K-edge and explain what this implies about the effect of Pt deposition on the bulk support.
Ground Truth
Material: PtCo3O4
Measurement: Co K-edge, transmission mode, BM23 beamline at ESRF
Fit method: not reported
Phase fractions: (±5%)
| Phase | Fraction |
|---|---|
| Co3O4 | 1.0 |
Fit basis (paper's reference spectra):
- Co3O4
Source evidence: Section 3.2, Figure 3c
Key reasoning: The Co K-edge XANES of the fresh PtCo3O4 catalyst is in perfect line-to-line correspondence with that of pristine Co3O4. This supports the absence of changes in the oxidation state of bulk Co3O4 due to the insertion of Pt, limiting any charge transfer to the uppermost surface layers in closer contact with the metal.
Reasoning source: Section 3.2
Scoring Rubric (total: 100 pts)
| Q | Type | Max | Question | Reference Answer | Scoring Criteria |
|---|---|---|---|---|---|
| q2 | reasoning | 100 | Describe the expected spectral shape of the fresh PtCo3O4 catalyst at the Co K-edge and explain what this implies about the effect of Pt deposition on the bulk support. | The expected Co K-edge XANES spectrum of the fresh PtCo3O4 catalyst perfectly matches the spectral shape of pristine Co3O4, which is characteristic of a normal spinel structure containing Co(III) in octahedral and Co(II) in tetrahedral sites. Because the sample is in its fresh state before the ammonia borane dehydrogenation reaction, the spectrum lacks the shift to lower energies and broadening that would indicate reduction. This perfect line-to-line correspondence with pristine Co3O4 implies that the insertion of Pt during impregnation does not alter the oxidation state of the bulk support. Consequently, any charge transfer between the deposited Pt and the Co3O4 support is strictly limited to the uppermost surface layers in close contact with the metal, leaving the bulk entirely unaffected. | Award 20 points for stating the spectrum perfectly matches pristine Co3O4 (normal spinel). Award 20 points for explaining that Pt insertion does not change the bulk oxidation state, limiting charge transfer to the surface layers. |
Review
A comparative study on cubic and tetragonal Ce-ZrO2 supported Rh catalysts for N2O decomposition
BNL-NSLS-II-8-ID
Catalyst
Jae-Rang Youn et al.
DOI: 10.1016/j.apsusc.2026.166042
3 scenarios
▶
#303
Rh/Ce0.7Zr0.3O2
Ce L3-edge
▶
LLM Prompt
Sample Information
Material: Rh/Ce0.7Zr0.3O2
Support: Ce0.7Zr0.3O2
Sample-Specific Conditions
- Ce/Zr ratio (cubic phase): 0.7/0.3
- Cubic Ce-ZrO2 supported Rh catalyst
Measurement
We plan to measure the Ce L3-edge XANES spectrum of this sample.
Questions
Based on all the information above:
1. Based on the sample conditions (1 wt% Rh supported on cubic Ce0.7Zr0.3O2), what are the expected oxidation states of Cerium and their approximate relative fractions?
2. What are the physical and structural reasons for the observed Ce3+ fraction in this cubic Rh/Ce0.7Zr0.3O2 catalyst? Consider the effects of both the mixed oxide support and the active metal.
3. When quantifying the Ce oxidation states from the Ce L3-edge XANES spectrum of this material via peak fitting, what specific spectral components (and their corresponding electronic transitions) are used as the basis for Ce4+ and Ce3+?
Ground Truth
Material: Rh/Ce0.7Zr0.3O2
Measurement: Ce L3-edge XANES, fluorescence mode, 4-BM (XFM) beamline at NSLS-II
Fit method: Curve-fitting (peak fitting) after arctangent background subtraction
Phase fractions: (±10%)
| Phase | Fraction |
|---|---|
| Ce3+ | 0.205 |
| Ce4+ | 0.795 |
Fit basis (paper's reference spectra):
- Ce4+ components (PA peak at 5738 eV for 2p → 4f05d* transition, PB peak at 5731.1–5731.8 eV for 2p → 4f15d*L transition)
- Ce3+ component (PC peak at 5727.2 eV)
Source evidence: Table 3 and Figure 4(e), pages 30 and 34
Key reasoning: The cubic Rh/Ce0.7Zr0.3O2 catalyst exhibits a relatively high Ce3+ fraction (20.5%) due to the partial substitution of Zr4+ into the CeO2 lattice, which induces changes in the local coordination environment and crystal field splitting. Additionally, charge transfer from the supported Rh nanoparticles to the Ce-ZrO2 support promotes the generation of oxygen vacancies and localized electron interactions, further stabilizing the Ce3+ state. The Ce-rich cubic structure facilitates a higher Ce3+ concentration compared to Zr-rich tetragonal structures.
Reasoning source: Section 3.1 (pages 13, 15-16)
Scoring Rubric (total: 100 pts)
| Q | Type | Max | Question | Reference Answer | Scoring Criteria |
|---|---|---|---|---|---|
| q1 | quantification | 30 | Based on the sample conditions (1 wt% Rh supported on cubic Ce0.7Zr0.3O2), what are the expected oxidation states of Cerium and their approximate relative fractions? | The expected oxidation states of Cerium in the Rh/Ce0.7Zr0.3O2 catalyst are Ce3+ and Ce4+, with relative fractions of 20.5% and 79.5%, respectively. These specific values result from the structural and electronic properties dictated by the sample conditions. Specifically, the partial substitution of Zr4+ into the CeO2 lattice of the cubic Ce0.7Zr0.3O2 support alters the local coordination environment and crystal field splitting. Additionally, charge transfer from the supported Rh nanoparticles to the support promotes oxygen vacancy generation, which stabilizes the 20.5% Ce3+ fraction. The Ce-rich cubic structure inherently facilitates this higher Ce3+ concentration compared to Zr-rich tetragonal structures. | Full score for identifying Ce3+ and Ce4+ with fractions around 20-21% and 79-80% respectively. Partial score for identifying the states without accurate fractions. |
| q2 | reasoning | 40 | What are the physical and structural reasons for the observed Ce3+ fraction in this cubic Rh/Ce0.7Zr0.3O2 catalyst? Consider the effects of both the mixed oxide support and the active metal. | The observed Ce3+ fraction of 20.5% in the Rh/Ce0.7Zr0.3O2 catalyst is driven by both the mixed oxide support structure and electronic interactions with the active metal. Within the support, the partial substitution of Zr4+ into the CeO2 lattice induces changes in the local coordination environment and crystal field splitting. Furthermore, the Ce-rich cubic structure of the Ce0.7Zr0.3O2 support inherently facilitates a higher Ce3+ concentration compared to Zr-rich tetragonal structures. Finally, charge transfer from the supported Rh nanoparticles to the Ce-ZrO2 support promotes the generation of oxygen vacancies and localized electron interactions, which further stabilize the Ce3+ state. | Full score requires mentioning: 1) Zr4+ substitution into the CeO2 lattice altering the local coordination environment, 2) charge transfer from Rh to the support, and 3) the resulting generation of oxygen vacancies that stabilize Ce3+. |
| q3 | identification | 30 | When quantifying the Ce oxidation states from the Ce L3-edge XANES spectrum of this material via peak fitting, what specific spectral components (and their corresponding electronic transitions) are used as the basis for Ce4+ and Ce3+? | When quantifying the Ce L3-edge XANES spectrum via curve-fitting after arctangent background subtraction, the Ce4+ state is modeled using the PA peak at 5738 eV (2p → 4f05d* transition) and the PB peak at 5731.1–5731.8 eV (2p → 4f15d*L transition). The Ce3+ state is modeled using the PC peak at 5727.2 eV. These specific spectral components arise directly from the sample conditions of the cubic Rh/Ce0.7Zr0.3O2 catalyst. The partial substitution of Zr4+ into the CeO2 lattice and charge transfer from the Rh nanoparticles generate oxygen vacancies and alter the local coordination environment. This stabilizes a mixed-valence state (20.5% Ce3+ and 79.5% Ce4+), producing the distinct electronic transitions observed at these specific energies. | Full score for identifying the Ce4+ peaks (e.g., PA and PB corresponding to 2p -> 4f05d* and 2p -> 4f15d*L transitions) and the Ce3+ peak (e.g., PC). |
Review
#304
Rh/Ce0.3Zr0.7O2
Ce L3-edge
▶
LLM Prompt
Sample Information
Material: Rh/Ce0.3Zr0.7O2
Support: Ce0.3Zr0.7O2
Sample-Specific Conditions
- Ce/Zr ratio (tetragonal phase): 0.3/0.7
- Tetragonal Ce-ZrO2 supported Rh catalyst
Measurement
We plan to measure the Ce L3-edge XANES spectrum of this sample.
Questions
Based on all the information above:
1. Based on the sample conditions (tetragonal Ce0.3Zr0.7O2 support), what are the expected Ce oxidation states, and what are their estimated fractions?
2. What analytical method and specific spectral components are typically used to quantify the Ce3+/Ce4+ ratio from the Ce L3-edge XANES spectrum of this material?
3. Explain the physical reasoning for the observed Ce3+ fraction in this tetragonal Rh/Ce0.3Zr0.7O2 catalyst, particularly in comparison to a Ce-rich cubic support.
Ground Truth
Material: Rh/Ce0.3Zr0.7O2
Measurement: Ce L3-edge XANES, fluorescence mode, 4-BM (XFM) beamline at NSLS-II
Fit method: Peak fitting (ratio of integrated areas)
Phase fractions: (±10%)
| Phase | Fraction |
|---|---|
| Ce3+ | 0.131 |
| Ce4+ | 0.869 |
Fit basis (paper's reference spectra):
- Ce3+ component (PC peak at ~5727.2 eV)
- Ce4+ components (PA peak at ~5738 eV, PB peak at ~5731.1-5731.8 eV)
Source evidence: Table 3, page 30; Section 3.1, pages 15-16
Key reasoning: The Ce/Zr ratio governs the crystal structure, with the Zr-rich Ce0.3Zr0.7O2 forming a tetragonal phase. This tetragonal structure stabilizes oxygen species more strongly within the lattice compared to the cubic phase, resulting in lower oxygen mobility and a lower concentration of surface oxygen vacancies. Consequently, the tetragonal Rh/Ce0.3Zr0.7O2 catalyst exhibits a lower Ce3+ fraction (13.1%) than its Ce-rich cubic counterpart, reflecting differences in the local structural environment and the degree of Ce-O hybridization.
Reasoning source: Section 3.1, pages 15-16
Scoring Rubric (total: 100 pts)
| Q | Type | Max | Question | Reference Answer | Scoring Criteria |
|---|---|---|---|---|---|
| q1 | quantification | 40 | Based on the sample conditions (tetragonal Ce0.3Zr0.7O2 support), what are the expected Ce oxidation states, and what are their estimated fractions? | The expected Ce oxidation states for this sample are Ce3+ and Ce4+, with estimated fractions of 13.1% (0.131) and 86.9% (0.869), respectively, subject to a 10% uncertainty. These specific values result directly from the sample's Zr-rich composition (Ce/Zr ratio of 0.3/0.7), which causes the material to form a tetragonal crystal structure. This tetragonal phase stabilizes oxygen species more strongly within the lattice compared to a cubic phase, leading to lower oxygen mobility and a lower concentration of surface oxygen vacancies. Consequently, this restricted vacancy formation dictates the relatively low observed Ce3+ fraction of 13.1%. | Full points for identifying Ce3+ and Ce4+ with fractions of approximately 13% and 87%, respectively. Partial points for identifying the correct oxidation states but inaccurate fractions. |
| q2 | identification | 30 | What analytical method and specific spectral components are typically used to quantify the Ce3+/Ce4+ ratio from the Ce L3-edge XANES spectrum of this material? | The Ce3+/Ce4+ ratio is quantified using a peak fitting method based on the ratio of integrated areas of specific spectral components. The fit basis includes a Ce3+ component (PC peak at ~5727.2 eV) and Ce4+ components (PA peak at ~5738 eV and PB peak at ~5731.1-5731.8 eV). These specific spectral features and their relative intensities arise because the Zr-rich Ce0.3Zr0.7O2 composition forms a tetragonal phase that strongly stabilizes lattice oxygen. This structural environment limits surface oxygen vacancies and alters the degree of Ce-O hybridization, which directly produces a dominant Ce4+ spectral signature and a minor Ce3+ peak contribution. | Full points for mentioning peak fitting/deconvolution (integration of peak areas) and identifying the specific Ce3+ and Ce4+ related peaks (e.g., PC for Ce3+, PA/PB for Ce4+). |
| q3 | reasoning | 30 | Explain the physical reasoning for the observed Ce3+ fraction in this tetragonal Rh/Ce0.3Zr0.7O2 catalyst, particularly in comparison to a Ce-rich cubic support. | The observed Ce3+ fraction of 13.1% in the Rh/Ce0.3Zr0.7O2 catalyst is fundamentally governed by its specific Ce/Zr ratio of 0.3/0.7, which dictates the formation of a tetragonal crystal structure. In this Zr-rich tetragonal phase, oxygen species are stabilized much more strongly within the lattice compared to a Ce-rich cubic phase. This strong stabilization leads to lower oxygen mobility and a correspondingly lower concentration of surface oxygen vacancies. As a result, the tetragonal catalyst exhibits a lower Ce3+ fraction than its cubic counterpart, directly reflecting these differences in the local structural environment and the degree of Ce-O hybridization. | Full points for explaining that the Zr-rich tetragonal structure stabilizes oxygen species more strongly, leading to lower oxygen mobility, fewer oxygen vacancies, and consequently a lower Ce3+ fraction compared to the cubic phase. |
Review
#305
Rh/Ce0.7Zr0.3O2
Rh K-edge
▶
LLM Prompt
Sample Information
Material: Rh/Ce0.7Zr0.3O2
Support: Ce0.7Zr0.3O2
Sample-Specific Conditions
- Ce/Zr ratio (cubic phase): 0.7/0.3
- Cubic Ce-ZrO2 supported Rh catalyst
Measurement
We plan to measure the Rh K-edge XANES spectrum of this sample.
Questions
Based on all the information above:
1. Based on the sample conditions (1 wt% Rh on cubic Ce0.7Zr0.3O2, calcined at 550 ºC), what is the expected dominant oxidation state of Rh, and what reference spectra would be most appropriate to confirm this?
2. Describe the expected Rh K-edge XANES spectral shape for this catalyst compared to bulk Rh2O3. Specifically, how does the edge position compare, and what physical phenomenon causes this difference?
3. In the pre-edge region (~23,200 eV), how would the intensity of the peak for this cubic Rh/Ce0.7Zr0.3O2 catalyst compare to a tetragonal Rh/Ce0.3Zr0.7O2 catalyst, and what structural characteristic dictates this intensity?
Ground Truth
Material: Rh/Ce0.7Zr0.3O2
Measurement: Rh K-edge XANES, NSLS-II 8-ID (ISS) beamline
Fit method: Qualitative comparison
Phase fractions: (±10%)
| Phase | Fraction |
|---|---|
| Rh2O3-like (oxidized Rh) | 1.0 |
Fit basis (paper's reference spectra):
- Rh2O3
- Rh foil
Source evidence: Figure 5(a) and Section 3.1, Page 16
Key reasoning: The XANES spectrum closely matches that of Rh2O3, indicating that Rh species are mainly present in a positive oxidation state. The absorption edge is shifted toward higher energies compared to bulk Rh2O3, which is associated with structural distortions in the Rh coordination environment likely induced by the Jahn-Teller effect when Rh3+ ions are incorporated into the oxide lattice.
Reasoning source: Section 3.1, Page 16
Scoring Rubric (total: 100 pts)
| Q | Type | Max | Question | Reference Answer | Scoring Criteria |
|---|---|---|---|---|---|
| q1 | identification | 30 | Based on the sample conditions (1 wt% Rh on cubic Ce0.7Zr0.3O2, calcined at 550 ºC), what is the expected dominant oxidation state of Rh, and what reference spectra would be most appropriate to confirm this? | The expected dominant oxidation state of Rh in this catalyst is a positive oxidation state (Rhδ+, where Rh0 < Rhδ+ < Rh3+). To confirm this, the most appropriate reference spectra for comparison are bulk Rh2O3 and Rh foil. This fully oxidized state (a 1.0 fraction of Rh2O3-like species) arises because the Rh species are incorporated into the cubic Ce0.7Zr0.3O2 oxide lattice under the given sample conditions. The interaction with this specific support stabilizes the Rh in a positive oxidation state, making its spectrum closely match the Rh2O3 reference. | Full credit for identifying a positive oxidation state (Rh3+ or Rhδ+) and suggesting Rh2O3 and Rh foil as references. |
| q2 | spectral | 40 | Describe the expected Rh K-edge XANES spectral shape for this catalyst compared to bulk Rh2O3. Specifically, how does the edge position compare, and what physical phenomenon causes this difference? | The Rh K-edge XANES spectrum for this catalyst closely matches the overall shape of bulk Rh2O3, but its absorption edge is shifted toward higher energies. This shift occurs because the Rh3+ ions are incorporated into the cubic Ce0.7Zr0.3O2 oxide lattice of the support. This incorporation induces structural distortions in the Rh coordination environment, which are likely caused by the Jahn-Teller effect. Consequently, these specific structural and electronic changes in the lattice-bound Rh alter the edge position relative to undistorted bulk Rh2O3. | Full credit for stating the spectrum closely matches Rh2O3 but the absorption edge is shifted to higher energies, and attributing this shift to structural distortions/Jahn-Teller effect from Rh3+ incorporation into the oxide lattice. |
| q3 | reasoning | 30 | In the pre-edge region (~23,200 eV), how would the intensity of the peak for this cubic Rh/Ce0.7Zr0.3O2 catalyst compare to a tetragonal Rh/Ce0.3Zr0.7O2 catalyst, and what structural characteristic dictates this intensity? | In the pre-edge region at ~23,200 eV, the peak intensity for the cubic Rh/Ce0.7Zr0.3O2 catalyst is expected to be less pronounced than in the tetragonal catalyst. This pre-edge feature originates from dipole-allowed transitions caused by d-p orbital mixing in non-centrosymmetric environments. The difference in intensity arises because the specific cubic Ce0.7Zr0.3O2 support environment induces different degrees of structural distortion compared to the tetragonal phase. Because the Rh ions are incorporated into this specific cubic oxide lattice, the resulting local coordination environment is less non-centrosymmetric than in the tetragonal support, leading to a weaker pre-edge peak. | Full credit for stating the pre-edge peak is less pronounced in the cubic catalyst compared to the tetragonal one, and explaining that pre-edge intensity is related to local symmetry (non-centrosymmetric environments leading to d-p orbital mixing). |
Review
Ga(iBu)3 supported on meso H-ZSM-5: Effect of Si/Al ratio on the activity and selectivity in propane aromatization
ESRF-BM23
Catalyst
Abou Nakad Jessy et al.
DOI: 10.1016/j.catcom.2023.106825
1 scenario
▶
#306
Ga(iBu)3/meso H-ZSM-5
Ga K
▶
LLM Prompt
Sample Information
Material: Ga(iBu)3/meso H-ZSM-5
Support: meso H-ZSM-5 (Si/Al = 50)
Sample-Specific Conditions
- Si/Al ratio: 50
- Ga(iBu)3 grafted onto mesoporous H-ZSM-5 with Si/Al ratio of 50
Measurement
We plan to measure the Ga K XANES spectrum of this sample.
Questions
Based on all the information above:
1. Based on the sample conditions (grafting Ga(iBu)3 onto meso H-ZSM-5 at 25 °C), what is the dominant surface gallium species formed, and what physical/chemical evidence supports this specific structural motif?
2. What are the expected first-shell coordination numbers and approximate bond distances for the Ga center in this grafted catalyst as determined by X-ray absorption spectroscopy?
3. Why does the Ga(iBu)3 precursor selectively form this specific monopodal species on the mesoporous support rather than reacting with the Brønsted acid sites?
Ground Truth
Material: Ga(iBu)3/meso H-ZSM-5
Measurement: Ga K-edge X-ray absorption spectroscopy (EXAFS), transmission mode, BM23 beamline
Fit method: EXAFS fitting using spherical waves
Phase fractions: (±10%)
| Phase | Fraction |
|---|---|
| [(≡SiO)Ga(iBu)2] (monopodal species) | 1.0 |
Fit basis (paper's reference spectra):
- Theoretical files calculated for the total central atom loss factor, electron mean free path, phases, and amplitudes based on model clusters of atoms
Source evidence: Page 5-6, Section 3.3; Table 1; Table 2; Figure 5; Scheme 1
Key reasoning: Elemental analysis and gas evolution quantification during grafting indicated the release of ~0.9 equivalents of isobutane per Ga, suggesting a monopodal species with two isobutyl fragments. DRIFT spectroscopy confirmed selective reaction with isolated silanols in the mesopores, leaving micropore Brønsted acid sites intact due to the high kinetic diameter of the Ga(iBu)3 precursor. EXAFS fitting confirmed this local structure, showing Ga coordinated to one oxygen atom (1.807 Å) and two carbon atoms (1.98 Å) in its first coordination sphere.
Reasoning source: Section 3.3 (Preparation and characterization of [Ga(iBu)3] supported on meso H-ZSM-5-250), pages 5-6
Scoring Rubric (total: 100 pts)
| Q | Type | Max | Question | Reference Answer | Scoring Criteria |
|---|---|---|---|---|---|
| q1 | identification | 40 | Based on the sample conditions (grafting Ga(iBu)3 onto meso H-ZSM-5 at 25 °C), what is the dominant surface gallium species formed, and what physical/chemical evidence supports this specific structural motif? | The dominant surface gallium species formed is a monopodal [(≡SiO)Ga(iBu)2] complex, which accounts for 100% of the fitted fraction. This specific phase arises from the grafting of the Ga(iBu)3 precursor onto the mesoporous H-ZSM-5 support (Si/Al = 50), where it selectively reacts with isolated silanols located in the mesopores. The formation of this monopodal structure is supported by gas evolution quantification during grafting, which indicated the release of approximately 0.9 equivalents of isobutane per Ga atom. Furthermore, DRIFT spectroscopy confirmed the selective reaction with mesopore silanols, and EXAFS fitting verified the local coordination environment of the resulting species. | Must identify the monopodal species [(≡SiO)Ga(iBu)2]. Must mention supporting evidence such as the release of ~1 equivalent of isobutane (mass balance), selective consumption of silanols observed by IR, or EXAFS coordination numbers (1 O and 2 C). |
| q2 | spectral | 30 | What are the expected first-shell coordination numbers and approximate bond distances for the Ga center in this grafted catalyst as determined by X-ray absorption spectroscopy? | Based on EXAFS fitting, the Ga center in the grafted catalyst is coordinated to one oxygen atom at a distance of 1.807 Å and two carbon atoms at a distance of 1.98 Å in its first coordination sphere. These specific structural features arise directly from the formation of the monopodal [(≡SiO)Ga(iBu)2] species on the meso H-ZSM-5 support. Because the Ga(iBu)3 precursor reacts selectively with isolated surface silanols and releases ~0.9 equivalents of isobutane per Ga, the resulting surface complex retains two isobutyl fragments (yielding two Ga-C bonds) and forms one bond to the silica surface (yielding one Ga-O bond). Consequently, the EXAFS data perfectly reflects this local coordination environment dictated by the grafting mechanism. | Must specify that Ga is coordinated to 1 Oxygen atom at approximately 1.81 Å and 2 Carbon atoms at approximately 1.98 Å. |
| q3 | reasoning | 30 | Why does the Ga(iBu)3 precursor selectively form this specific monopodal species on the mesoporous support rather than reacting with the Brønsted acid sites? | The Ga(iBu)3 precursor selectively forms the monopodal [(≡SiO)Ga(iBu)2] species by reacting with isolated silanols in the mesopores of the H-ZSM-5 support rather than the Brønsted acid sites. This selectivity occurs because the high kinetic diameter of the Ga(iBu)3 precursor prevents it from accessing the micropores where the Brønsted acid sites are located. As a result of this steric restriction, the precursor is confined to the mesopores where it reacts exclusively with surface silanols, releasing ~0.9 equivalents of isobutane per Ga atom. This specific reaction pathway leaves the micropore Brønsted acid sites completely intact while yielding a 100% fraction of the monopodal surface species. | Must explain that the high kinetic diameter (bulkiness) of the Ga(iBu)3 precursor prevents it from accessing the micropores where the Brønsted acid sites are located, restricting its reaction to the silanol groups in the mesopores. |
Review
Promotion of Pd nanoparticles by Fe and formation of a Pd3Fe intermetallic alloy for propane dehydrogenation
APS
Catalyst
Ce Yang et al.
DOI: 10.1016/j.cattod.2018.07.043
2 scenarios
▶
#307
Pd
Pd K
▶
LLM Prompt
Sample Information
Material: Pd
Support: SiO2
Sample-Specific Conditions
- composition: Pd
- Silica supported Pd nanoparticles
Measurement
We plan to measure the Pd K XANES spectrum of this sample.
Questions
Based on all the information above:
1. Based on the sample conditions (silica-supported Pd nanoparticles reduced in H2), what is the expected dominant phase and oxidation state of Pd, and what is the physical reasoning for this?
2. What is the expected edge energy for the Pd K-edge XANES of this sample, and what does the overall spectral shape (including white line intensity) indicate about the sample?
Ground Truth
Material: Pd
Measurement: in-situ Pd K-edge XANES
Fit method: not applicable
Phase fractions:
| Phase | Fraction |
|---|---|
| metallic_palladium | 1.0 |
Source evidence: Page 4, text referring to Figure S2
Key reasoning: After reduction in H2, the XANES at the Pd K edge indicates that the shape, edge energy, and white line intensity are characteristic of fully reduced metallic Pd.
Reasoning source: Page 4, Results section
Scoring Rubric (total: 100 pts)
| Q | Type | Max | Question | Reference Answer | Scoring Criteria |
|---|---|---|---|---|---|
| q1 | reasoning | 57 | Based on the sample conditions (silica-supported Pd nanoparticles reduced in H2), what is the expected dominant phase and oxidation state of Pd, and what is the physical reasoning for this? | The expected dominant phase for the silica-supported Pd nanoparticles is metallic palladium with an oxidation state of 0. This phase accounts for a fraction of 1.0 (100%) of the sample. This specific state arises because the sample is subjected to reduction in H2. The hydrogen treatment fully reduces the palladium species, resulting in completely reduced metallic Pd nanoparticles on the silica support. | Must identify metallic Pd (oxidation state 0) as the dominant phase and explain that the H2 reduction treatment fully reduces the Pd precursor to its metallic state. |
| q2 | spectral | 43 | What is the expected edge energy for the Pd K-edge XANES of this sample, and what does the overall spectral shape (including white line intensity) indicate about the sample? | The expected edge energy for the Pd K-edge XANES of this sample is 24350 eV. The overall spectral shape, including the edge energy and white line intensity, indicates that the sample consists of fully reduced metallic Pd. These specific spectral features arise directly from the sample conditions, where the silica-supported Pd nanoparticles are reduced in an H2 environment. Because this hydrogen treatment completely reduces the palladium to an oxidation state of 0, the resulting XANES spectrum exhibits the exact shape and white line intensity characteristic of metallic palladium. | Must state the edge energy is approximately 24350 eV and that the spectral shape and white line intensity are indicative of fully reduced metallic Pd. |
Review
#308
Pd3Fe
Pd K
▶
LLM Prompt
Sample Information
Material: Pd3Fe
Support: SiO2
Sample-Specific Conditions
- composition: Pd3Fe
- Silica supported Pd3Fe nanoparticles
Measurement
We plan to measure the Pd K XANES spectrum of this sample.
Questions
Based on all the information above:
1. Based on the sample preparation and treatment (reduced in H2), what is the expected dominant phase and oxidation state of Pd in this catalyst?
2. Describe the expected spectral shape of the Pd K-edge XANES for this sample. How does it compare to the spectrum of monometallic Pd nanoparticles?
3. What is the approximate Pd K-edge energy for this sample, and what does this value indicate about the state of the Pd atoms?
Ground Truth
Material: Pd3Fe
Measurement: Pd K-edge, in-situ, beamline 10-BM
Fit method: not reported
Phase fractions: (±5%)
| Phase | Fraction |
|---|---|
| Pd3Fe intermetallic alloy | 1.0 |
Source evidence: Page 4, text; Page 6, XRD results
Key reasoning: The sample was reduced in H2, which fully reduces the Pd to a metallic state. The Pd K-edge XANES shows an edge energy and white line intensity similar to metallic Pd, confirming complete reduction. Small changes in the XANES shape compared to monometallic Pd, along with EXAFS and XRD data, indicate the formation of a bimetallic Pd3Fe intermetallic alloy phase.
Reasoning source: Page 4, Results section
Scoring Rubric (total: 100 pts)
| Q | Type | Max | Question | Reference Answer | Scoring Criteria |
|---|---|---|---|---|---|
| q1 | identification | 35 | Based on the sample preparation and treatment (reduced in H2), what is the expected dominant phase and oxidation state of Pd in this catalyst? | The expected dominant phase for this sample is a Pd3Fe intermetallic alloy, accounting for a 1.0 fraction of the Pd species, with Pd in a metallic (0) oxidation state. This specific phase and oxidation state arise because the silica-supported Pd3Fe nanoparticles were reduced in H2. The H2 treatment fully reduces the Pd atoms to a metallic state. Furthermore, the specific Pd3Fe composition of the nanoparticles facilitates the formation of the bimetallic Pd3Fe intermetallic alloy phase upon reduction, as confirmed by complementary EXAFS and XRD data. | Full points for identifying the Pd3Fe intermetallic alloy phase and a metallic (0) oxidation state, reasoning that H2 treatment fully reduces the Pd. |
| q2 | spectral | 35 | Describe the expected spectral shape of the Pd K-edge XANES for this sample. How does it compare to the spectrum of monometallic Pd nanoparticles? | The expected Pd K-edge XANES spectral shape exhibits an edge energy and white line intensity that are very similar to metallic Pd. However, it features small distinguishing changes in the XANES shape when compared directly to the spectrum of monometallic Pd nanoparticles. These spectral features occur because the H2 reduction process fully reduces the silica-supported nanoparticles to a metallic state, yielding the overall metallic Pd-like profile. The subtle deviations from monometallic Pd arise specifically from the sample's Pd3Fe composition, which leads to the formation of a bimetallic Pd3Fe intermetallic alloy rather than pure Pd nanoparticles. | Full points for stating the shape, edge energy, and white line intensity are similar to metallic Pd, but with small shape changes that distinguish it from monometallic Pd due to bimetallic formation. |
| q3 | spectral | 30 | What is the approximate Pd K-edge energy for this sample, and what does this value indicate about the state of the Pd atoms? | The approximate Pd K-edge energy for this sample is 24350 eV. This edge position, along with the white line intensity, indicates that the Pd atoms are in a fully reduced, metallic (0) oxidation state. This specific electronic state is achieved because the silica-supported Pd3Fe nanoparticles were subjected to reduction in H2. The H2 treatment completely reduces the Pd species, resulting in an edge energy characteristic of metallic Pd within the formed bimetallic Pd3Fe intermetallic alloy. | Full points for stating an edge energy of approximately 24350 eV and noting that this indicates fully reduced, metallic Pd. |
Review
Reducibility of Cu-zeolites and stability of Cu+ monocarbonyl adducts: Qualitative and quantitative relationships from MCR-XAS and DFT
ESRF-BM23
Catalyst
Gabriele Deplano et al.
DOI: 10.1016/j.cattod.2023.114403
5 scenarios
▶
#309
Cu-CHA
Cu K-edge
▶
LLM Prompt
Sample Information
Material: Cu-CHA
Support: CHA zeolite
Reaction Conditions: He at 50 °C
Sample-Specific Conditions
- gas environment: He
- Cu-exchanged CHA zeolite after reduction in NH3 and cooling to 50 °C
Measurement
We plan to measure the Cu K-edge XANES spectrum of this sample.
Questions
Based on all the information above:
1. What is the dominant Cu phase expected for this Cu-CHA sample after NH3 reduction and cooling to 50 °C in He, and what physical reasoning explains this state?
2. Describe the expected XANES spectral features for this sample, including any specific electronic transitions and their corresponding energies.
Ground Truth
Material: (0.35)Cu-CHA(5)
Measurement: in situ Cu K-edge XANES in transmission mode at BM23 beamline (ESRF)
Fit method: MCR-ALS
Phase fractions:
| Phase | Fraction |
|---|---|
| PC1: [Cu+] | 1.0 |
Fit basis (paper's reference spectra):
- PC1: [Cu+]
- PC2: [Cu(CO)2]+
- PC3: [Cu(CO)]+
Source evidence: Figure 5 (left panels) and Section 3.2
Key reasoning: After reduction in NH3 at 500 °C and subsequent flushing with He, the sample is cooled to 50 °C. MCR-ALS analysis identifies this initial state before CO exposure as a bare Cu+ species coordinated to the framework. The concentration profile shows this component at a relative fraction of 1.0 at the start of the experiment.
Reasoning source: Section 3.1 and 3.2
Scoring Rubric (total: 100 pts)
| Q | Type | Max | Question | Reference Answer | Scoring Criteria |
|---|---|---|---|---|---|
| q1 | identification | 43 | What is the dominant Cu phase expected for this Cu-CHA sample after NH3 reduction and cooling to 50 °C in He, and what physical reasoning explains this state? | The dominant Cu phase expected for this sample is a bare Cu+ species coordinated to the zeolite framework, present at a relative fraction of 1.0. This specific state arises because the Cu-exchanged CHA zeolite undergoes reduction in NH3 at 500 °C, which fully reduces the copper species to the Cu+ oxidation state. Subsequently, the sample is flushed with He and cooled to 50 °C. Because the sample is maintained in this inert He environment prior to any reactant exposure (such as CO), the copper remains stabilized by the framework as a bare, unligated Cu+ cation. | Full points for identifying bare Cu+ coordinated to the framework. Partial points for just stating Cu+. Must mention that NH3 reduction followed by He flushing removes the reductant/ligands, leaving framework-bound Cu+. |
| q2 | spectral | 57 | Describe the expected XANES spectral features for this sample, including any specific electronic transitions and their corresponding energies. | The expected Cu K-edge XANES spectrum for this sample is characterized by an intense pre-edge peak at 8983 eV, corresponding to the Cu+ 1s -> 4p electronic transition. Additionally, the spectrum exhibits a distinctly structured white line region. These spectral features arise directly from the sample conditions, where reduction in NH3 and cooling in He yields a bare Cu+ species coordinated to the framework. The intense 8983 eV transition is the direct electronic signature of this fully reduced Cu+ oxidation state. Furthermore, the specific structural coordination of the bare Cu+ cation within the unique CHA zeolite topology produces the structured white line, which distinguishes it from the unstructured white lines of other zeolites like MOR and MFI. | Full points for mentioning the intense pre-edge peak at 8983 eV, assigning it to the Cu+ 1s->4p transition, and noting the structured white line. |
Review
#310
Cu-CHA
Cu K-edge
▶
LLM Prompt
Sample Information
Material: Cu-CHA
Support: CHA zeolite
Reaction Conditions: 5 mol% CO in He at 50 °C
Sample-Specific Conditions
- gas environment: CO
- Cu-exchanged CHA zeolite exposed to CO at 50 °C
Measurement
We plan to measure the Cu K-edge XANES spectrum of this sample.
Questions
Based on all the information above:
1. Under the specified conditions (5 mol% CO in He at 50 °C), what Cu species dominates in the Cu-CHA zeolite, and what is the physical reasoning for its formation?
2. What reference spectra or basis components would be necessary to fully model the XANES data of this sample during a cycle of CO adsorption and subsequent He flushing?
3. Describe the expected Cu K-edge XANES spectral features for this sample under the CO atmosphere, specifically noting any characteristic peak positions.
4. What spectral features distinguish the Cu species formed under these conditions from the bare Cu+ species present before CO exposure?
Ground Truth
Material: (0.35)Cu-CHA(5)
Measurement: Cu K-edge in situ transmission mode at BM23 beamline (ESRF)
Fit method: MCR-ALS
Phase fractions:
| Phase | Fraction |
|---|---|
| PC2: [Cu(CO)2]+ | 1.0 |
Fit basis (paper's reference spectra):
- PC1: [Cu+]
- PC2: [Cu(CO)2]+
- PC3: [Cu(CO)]+
Source evidence: Figure 3 (middle panel), Figure 5 (top left and bottom left), Section 3.1 and 3.2
Key reasoning: Exposure of the reduced Cu-zeolite to CO at 50 °C and relatively high partial pressure (5 mol%) leads to the quantitative formation of Cu+ dicarbonyl complexes ([Cu(CO)2]+). The high CO coverage stabilizes the dicarbonyl over the monocarbonyl or bare Cu+.
Reasoning source: Section 3.1 and 3.2
Scoring Rubric (total: 100 pts)
| Q | Type | Max | Question | Reference Answer | Scoring Criteria |
|---|---|---|---|---|---|
| q1 | reasoning | 30 | Under the specified conditions (5 mol% CO in He at 50 °C), what Cu species dominates in the Cu-CHA zeolite, and what is the physical reasoning for its formation? | Under the specified conditions of 5 mol% CO in He at 50 °C, the dominant species in the Cu-CHA zeolite is the Cu+ dicarbonyl complex ([Cu(CO)2]+), which forms with a quantitative fraction of 1.0. This complete conversion occurs because the relatively high partial pressure of CO (5 mol%) combined with the low temperature (50 °C) creates a high CO coverage on the reduced Cu-zeolite. This high coverage environment thermodynamically stabilizes the dicarbonyl complex over the monocarbonyl ([Cu(CO)]+) or bare Cu+ species. | 15 points for identifying [Cu(CO)2]+ as the dominant/sole phase. 15 points for explaining that high CO partial pressure at low temperature (50 °C) drives the quantitative formation of the dicarbonyl adduct from bare Cu+. |
| q2 | identification | 20 | What reference spectra or basis components would be necessary to fully model the XANES data of this sample during a cycle of CO adsorption and subsequent He flushing? | To fully model the XANES data of this sample during a cycle of CO adsorption and flushing, the necessary basis components are bare [Cu+], the monocarbonyl complex [Cu(CO)]+, and the dicarbonyl complex [Cu(CO)2]+. These specific phases are required because exposing the reduced Cu-CHA zeolite to 5 mol% CO at 50 °C creates a high CO coverage that stabilizes the [Cu(CO)2]+ complex. As the CO environment fluctuates during adsorption and subsequent He flushing, the CO partial pressure changes, shifting the equilibrium and necessitating all three components to capture the transitions between the bare Cu+, monocarbonyl, and dicarbonyl states. | 20 points for identifying the need for bare Cu+, [Cu(CO)2]+ (dicarbonyl), and [Cu(CO)]+ (monocarbonyl) components. |
| q3 | spectral | 30 | Describe the expected Cu K-edge XANES spectral features for this sample under the CO atmosphere, specifically noting any characteristic peak positions. | Under the 5 mol% CO atmosphere at 50 °C, the expected Cu K-edge XANES spectrum features a sharp, high-intensity peak at 8981 eV and a medium-intensity shoulder on the rising edge at 8987 eV. Additionally, the spectrum shows a significantly decreased intensity of the original bare Cu+ 1s->4p transition at 8983 eV. These specific spectral features arise because the relatively high CO partial pressure and 50 °C temperature lead to high CO coverage, quantitatively forming Cu+ dicarbonyl complexes ([Cu(CO)2]+). The observed peaks at 8981 eV and 8987 eV are the characteristic electronic transitions produced by the structural and electronic environment of this stabilized CO-bound Cu+ species. | 10 points for mentioning the sharp feature at ~8981 eV. 10 points for mentioning the shoulder at ~8987 eV. 10 points for noting the decrease/disappearance of the bare Cu+ 1s->4p transition (at ~8983 eV). |
| q4 | spectral | 20 | What spectral features distinguish the Cu species formed under these conditions from the bare Cu+ species present before CO exposure? | The Cu species formed under these conditions is distinguished by the appearance of a sharp peak at 8981 eV and a shoulder at 8987 eV, alongside a significant decrease in the strong 1s->4p transition at 8983 eV that is characteristic of bare Cu+. These distinguishing spectral features emerge because exposing the Cu-CHA zeolite to 5 mol% CO at 50 °C results in high CO coverage, which quantitatively converts the bare Cu+ into the Cu+ dicarbonyl complex ([Cu(CO)2]+). Consequently, the spectral signature shifts away from the bare Cu+ electronic transitions to the characteristic transitions of the thermodynamically stabilized CO-bound Cu+ species. | 20 points for stating that the CO-bound species has peaks at 8981 and 8987 eV, whereas the bare Cu+ has a prominent 1s->4p transition at 8983 eV. |
Review
#311
Cu-CHA
Cu K-edge
▶
LLM Prompt
Sample Information
Material: Cu-CHA
Support: CHA zeolite
Reaction Conditions: He flush at 50 °C for 45 min
Sample-Specific Conditions
- gas environment: He flush (45 min)
- Cu-exchanged CHA zeolite after CO exposure and 45 min He flush at 50 °C
Measurement
We plan to measure the Cu K-edge XANES spectrum of this sample.
Questions
Based on all the information above:
1. Based on the reaction conditions (He flush at 50 °C for 45 min after CO exposure), what are the expected Cu species present in the (0.35)Cu-CHA(5) sample, and what reference spectra or basis functions would be needed to model the XANES data?
2. Estimate the phase fractions of the Cu species present in the (0.35)Cu-CHA(5) sample after 45 min of He flush at 50 °C.
Ground Truth
Material: (0.35)Cu-CHA(5)
Measurement: Cu K-edge in situ transmission mode at BM23 beamline (ESRF)
Fit method: MCR-ALS
Phase fractions:
| Phase | Fraction |
|---|---|
| PC3: [Cu(CO)]+ | 0.95 |
| PC1: [Cu+] | 0.05 |
Fit basis (paper's reference spectra):
- PC1: [Cu+]
- PC2: [Cu(CO)2]+
- PC3: [Cu(CO)]+
Source evidence: Page 6, Section 3.2, text and Figure 5 (bottom left panel)
Key reasoning: During the He flush at 50 °C, the [Cu(CO)2]+ adducts formed under CO exposure decompose. For the CHA topology, the conversion to [Cu(CO)]+ is not quantitative, and is accompanied by the formation of a fraction of bare Cu+ species (c.a. 5%) in less than 45 min. This is due to the lower stability of the [Cu(CO)]+ adducts in the CHA framework, possibly related to steric constraints imposed by the small cage system and the relative abundance of Cu.
Reasoning source: Page 6, Section 3.2
Scoring Rubric (total: 100 pts)
| Q | Type | Max | Question | Reference Answer | Scoring Criteria |
|---|---|---|---|---|---|
| q1 | identification | 46 | Based on the reaction conditions (He flush at 50 °C for 45 min after CO exposure), what are the expected Cu species present in the (0.35)Cu-CHA(5) sample, and what reference spectra or basis functions would be needed to model the XANES data? | The expected Cu species present in the sample are [Cu(CO)]+ and bare [Cu+]. To model the XANES data using MCR-ALS, the required basis functions are PC3: [Cu(CO)]+ and PC1: [Cu+], though PC2: [Cu(CO)2]+ is part of the overall system basis. These specific phases arise because, during the 45-minute He flush at 50 °C, the [Cu(CO)2]+ adducts formed during prior CO exposure decompose. In the CHA zeolite topology, the conversion to [Cu(CO)]+ is not quantitative and yields bare Cu+ species. This occurs due to the lower stability of the [Cu(CO)]+ adducts in the CHA framework, which is likely related to steric constraints imposed by the small cage system and the relative abundance of Cu. | Full score if the answer identifies [Cu(CO)]+ and bare Cu+ as the present species, and mentions the need for basis functions representing bare Cu+, [Cu(CO)2]+, and [Cu(CO)]+. |
| q2 | quantification | 54 | Estimate the phase fractions of the Cu species present in the (0.35)Cu-CHA(5) sample after 45 min of He flush at 50 °C. | The estimated phase fractions for the sample are 0.95 for PC3: [Cu(CO)]+ and 0.05 for PC1: [Cu+]. These specific values result from the decomposition of [Cu(CO)2]+ adducts during the 45-minute He flush at 50 °C. In the CHA zeolite topology, the conversion from dicarbonyls to [Cu(CO)]+ is not quantitative, resulting in the formation of approximately 5% bare Cu+ species. This fractional distribution occurs due to the lower stability of the [Cu(CO)]+ adducts in the CHA framework. This instability is likely related to steric constraints imposed by the small cage system and the relative abundance of Cu. | Full score if the estimated fractions are approximately 95% [Cu(CO)]+ and 5% bare Cu+. |
Review
#312
Cu-CHA
Cu K-edge
▶
LLM Prompt
Sample Information
Material: Cu-CHA
Support: CHA zeolite
Reaction Conditions: He flush at 50 °C for 65 min
Sample-Specific Conditions
- gas environment: He flush (65 min)
- Cu-exchanged CHA zeolite after CO exposure and 65 min He flush at 50 °C
Measurement
We plan to measure the Cu K-edge XANES spectrum of this sample.
Questions
Based on all the information above:
1. Based on the reaction conditions (He flush at 50 °C for 65 min after CO exposure), what are the expected Cu species present in the (0.35)Cu-CHA(5) sample, and what are their approximate fractions?
2. What set of pure spectral components (basis functions) would be required to fully describe the XANES spectral evolution of this sample during the entire cycle of CO exposure and subsequent He flushing at 50 °C?
Ground Truth
Material: (0.35)Cu-CHA(5)
Measurement: in situ Cu K-edge XANES in transmission mode at ESRF BM23
Fit method: MCR-ALS
Phase fractions:
| Phase | Fraction |
|---|---|
| PC3: [Cu(CO)]+ | 0.9 |
| PC1: [Cu+] | 0.1 |
Fit basis (paper's reference spectra):
- PC1: [Cu+]
- PC2: [Cu(CO)2]+
- PC3: [Cu(CO)]+
Source evidence: Page 6, Section 3.2, text: 'almost 10% of residual unbound Cu+ species after 65 min.'
Key reasoning: During He flushing at 50 °C, the [Cu(CO)2]+ adducts formed under CO exposure decompose. While this typically yields stable [Cu(CO)]+ monocarbonyls, in the CHA topology the conversion is accompanied by the formation of bare Cu+ species. This enhanced reversibility and lower stability of Cu-carbonyls in CHA is attributed to steric constraints imposed by the small cage system and the relative abundance of Cu in the specific sample.
Reasoning source: Page 6, Section 3.2
Scoring Rubric (total: 100 pts)
| Q | Type | Max | Question | Reference Answer | Scoring Criteria |
|---|---|---|---|---|---|
| q1 | quantification | 57 | Based on the reaction conditions (He flush at 50 °C for 65 min after CO exposure), what are the expected Cu species present in the (0.35)Cu-CHA(5) sample, and what are their approximate fractions? | After a 65-minute He flush at 50 °C, the expected Cu species in the (0.35)Cu-CHA(5) sample are [Cu(CO)]+ monocarbonyls at a fraction of 0.9 (90%) and bare [Cu+] species at a fraction of 0.1 (10%). These specific fractions result from the decomposition of [Cu(CO)2]+ adducts that originally formed during the prior CO exposure. While flushing with He at 50 °C typically yields stable [Cu(CO)]+ monocarbonyls, the CHA topology causes this conversion to be accompanied by the formation of bare Cu+ species. This enhanced reversibility and lower stability of the Cu-carbonyls in the CHA zeolite is due to steric constraints imposed by its small cage system, as well as the relative abundance of Cu in this specific sample. | 20 points for identifying both [Cu(CO)]+ and bare Cu+ as the present species. 20 points for correctly estimating the fractions at approximately 90% [Cu(CO)]+ and 10% bare Cu+. |
| q2 | identification | 43 | What set of pure spectral components (basis functions) would be required to fully describe the XANES spectral evolution of this sample during the entire cycle of CO exposure and subsequent He flushing at 50 °C? | To fully describe the XANES spectral evolution during the entire cycle of CO exposure and He flushing at 50 °C, three pure spectral components are required: PC1 for bare [Cu+], PC2 for [Cu(CO)2]+, and PC3 for [Cu(CO)]+. These specific basis functions are necessary because the initial CO exposure forms [Cu(CO)2]+ adducts, which subsequently decompose during the 50 °C He flush. The decomposition process yields both stable [Cu(CO)]+ monocarbonyls and residual bare [Cu+] species. The appearance of the bare [Cu+] component alongside the monocarbonyl during the He flush is driven by the enhanced reversibility and lower stability of Cu-carbonyls in the CHA topology, which arises from steric constraints within its small cage system and the sample's specific Cu abundance. | 10 points each for identifying the three necessary components: bare Cu+, [Cu(CO)2]+ (dicarbonyl), and [Cu(CO)]+ (monocarbonyl). |
Review
#313
Cu-MOR
Cu K-edge
▶
LLM Prompt
Sample Information
Material: Cu-MOR
Support: MOR zeolite
Reaction Conditions: He flush at 50 °C for 60 min
Sample-Specific Conditions
- zeolite topology: MOR
- Cu-exchanged MOR zeolite after CO exposure and He flush at 50 °C
Measurement
We plan to measure the Cu K-edge XANES spectrum of this sample.
Questions
Based on all the information above:
1. Based on the reaction conditions (He flush at 50 °C after CO exposure), what is the dominant Cu phase expected in the Cu-MOR zeolite, and what is the physical reasoning for its formation?
2. What reference spectra or principal components would be necessary to model the full CO adsorption and desorption cycle at 50 °C using a linear combination or MCR approach?
Ground Truth
Material: (0.32)Cu-MOR(11)
Measurement: in situ Cu K-edge XANES in transmission mode at BM23 beamline (ESRF)
Fit method: MCR-ALS
Phase fractions:
| Phase | Fraction |
|---|---|
| PC3: [Cu(CO)]+ | 1.0 |
Fit basis (paper's reference spectra):
- PC1: [Cu+]
- PC2: [Cu(CO)2]+
- PC3: [Cu(CO)]+
Source evidence: Figure 5 (middle panels) and Section 3.2
Key reasoning: When the CO partial pressure is lowered to zero during the He flush at 50 °C, the high-coverage [Cu(CO)2]+ adducts partially decomplexate. The only carbonyl complex that is retained and stable under these conditions is the Cu+ monocarbonyl, [Cu(CO)]+. For the MOR topology, this conversion is quantitative, leaving no residual bare Cu+ or dicarbonyl species.
Reasoning source: Section 3.1 and 3.2, pages 5-6
Scoring Rubric (total: 100 pts)
| Q | Type | Max | Question | Reference Answer | Scoring Criteria |
|---|---|---|---|---|---|
| q1 | reasoning | 50 | Based on the reaction conditions (He flush at 50 °C after CO exposure), what is the dominant Cu phase expected in the Cu-MOR zeolite, and what is the physical reasoning for its formation? | The dominant Cu phase expected in the Cu-MOR zeolite is the Cu+ monocarbonyl complex, [Cu(CO)]+, which accounts for a fraction of 1.0. This phase arises because the initial CO exposure forms high-coverage [Cu(CO)2]+ adducts. When the CO partial pressure is lowered to zero during the He flush at 50 °C, these adducts partially decomplexate. In the MOR zeolite topology, this conversion is quantitative, meaning the [Cu(CO)]+ monocarbonyl is the only carbonyl complex that remains stable and retained, leaving no residual bare Cu+ or dicarbonyl species. | 10 points for identifying [Cu(CO)]+ (monocarbonyl) as the dominant phase. 20 points for explaining that lowering the CO partial pressure causes decomplexation of [Cu(CO)2]+ to the more stable [Cu(CO)]+ adduct. |
| q3 | identification | 50 | What reference spectra or principal components would be necessary to model the full CO adsorption and desorption cycle at 50 °C using a linear combination or MCR approach? | To model the full CO adsorption and desorption cycle using an MCR-ALS approach, three principal components are necessary: PC1 for bare [Cu+], PC2 for the dicarbonyl [Cu(CO)2]+, and PC3 for the monocarbonyl [Cu(CO)]+. These specific components are required because they represent the distinct chemical states the Cu-MOR sample transitions through during the reaction conditions. Bare [Cu+] exists prior to CO exposure, which then converts to high-coverage [Cu(CO)2]+ adducts under CO pressure. When the CO partial pressure is lowered to zero during the He flush at 50 °C, the dicarbonyl species partially decomplexate to form the stable [Cu(CO)]+ monocarbonyl, which quantitatively dominates the final state in the MOR topology. | 10 points each for identifying bare Cu+, [Cu(CO)]+ (monocarbonyl), and [Cu(CO)2]+ (dicarbonyl) as the necessary components. |
Review
Activity and selectivity for CO2 methanation of clusters and nanoplates of ruthenium dispersed on ceria: In-situ studies with XAFS and DRIFTS
BNL-NSLS-II-8-ID
Catalyst
Irene Barba-Nieto et al.
DOI: 10.1016/j.cattod.2025.115443
2 scenarios
▶
#314
Ru/CeO2
Ru Ru K-edge, Ce L3-edge
▶
LLM Prompt
Sample Information
Material: Ru/CeO2
Support: CeO2
Reaction Conditions: ambient temperature, no gases
Sample-Specific Conditions
- gas environment: Fresh
- Fresh 20 mol% Ru dispersed on ceria
Measurement
We plan to measure the Ru Ru K-edge, Ce L3-edge XANES spectrum of this sample.
Questions
Based on all the information above:
1. Based on the sample conditions (fresh 20 mol% Ru/CeO2 at ambient temperature with no gases), what is the expected dominant Ru phase, and why?
2. What reference spectra would be essential to include in a basis set to confirm the initial state of this sample and monitor potential changes during subsequent catalytic treatments?
3. How would the Ru K-edge XANES spectral shape of this fresh sample differ from that of a fully reduced metallic Ru sample?
Ground Truth
Material: 20% Ru-CeO2
Measurement: Ru K-edge XANES in fluorescence mode at 8-ID beamline (NSLS-II)
Fit method: qualitative comparison
Phase fractions: (±10%)
| Phase | Fraction |
|---|---|
| RuO2 | 1.0 |
Fit basis (paper's reference spectra):
- RuO2
- Ru foil
Source evidence: Figure 3a and Section 3.3 A, page 11
Key reasoning: Initially, the fresh sample of 20% Ru-Ce was measured in the absence of gases at ambient temperature. The sample exhibited a distinct presence of ruthenium as RuO2, as evidenced by its comparison with the RuO2 reference spectrum. EXAFS analysis further confirmed that the oxygen anions surrounding the Ru are localized at the same distance as in the Ru(IV)O2 reference.
Reasoning source: Section 3.3 A, pages 11 and 14
Scoring Rubric (total: 100 pts)
| Q | Type | Max | Question | Reference Answer | Scoring Criteria |
|---|---|---|---|---|---|
| q1 | reasoning | 40 | Based on the sample conditions (fresh 20 mol% Ru/CeO2 at ambient temperature with no gases), what is the expected dominant Ru phase, and why? | The expected dominant Ru phase for this sample is RuO2, comprising a fraction of 1.0 (100%) of the ruthenium species. This fully oxidized state is expected because the sample is a fresh preparation of 20 mol% Ru dispersed on ceria, measured at ambient temperature without exposure to any reactive or reducing gases. In this initial, untreated state, the ruthenium naturally exists as Ru(IV). Consequently, the oxygen anions surrounding the Ru are localized at the same distance as in a standard Ru(IV)O2 reference, confirming the complete presence of the RuO2 phase. | 20 points for identifying RuO2 as the dominant phase. 20 points for explaining that in the as-prepared (fresh) state before any reductive treatment, the ruthenium remains fully oxidized. |
| q2 | identification | 30 | What reference spectra would be essential to include in a basis set to confirm the initial state of this sample and monitor potential changes during subsequent catalytic treatments? | The essential reference spectra to include in the basis set for qualitative comparison are RuO2 and Ru foil. These references are necessary because the sample is a fresh 20 mol% Ru dispersed on ceria, measured at ambient temperature with no gases. Under these initial, untreated conditions, the ruthenium is fully oxidized, making the RuO2 reference critical for confirming the starting Ru(IV) state. Meanwhile, the Ru foil reference is required to distinguish this oxidized state from metallic Ru and to monitor any potential reduction that might occur during subsequent catalytic treatments. | 15 points for RuO2 (to fit the initial oxidized state). 15 points for metallic Ru (Ru foil) to monitor potential reduction. |
| q3 | spectral | 30 | How would the Ru K-edge XANES spectral shape of this fresh sample differ from that of a fully reduced metallic Ru sample? | The Ru K-edge XANES spectrum of this fresh sample would exhibit a shift to a higher edge energy and display distinct white line features compared to a fully reduced metallic Ru sample. These spectral differences arise directly from the sample conditions, as the fresh 20 mol% Ru/CeO2 is measured at ambient temperature without any reducing gases. Because it remains in an untreated, fully oxidized state, the ruthenium exists entirely as Ru(IV) rather than metallic Ru. Consequently, the spectrum closely matches the line shape of a tetragonal RuO2 reference, reflecting the structural and electronic properties of this fully oxidized phase. | 15 points for mentioning a shift to higher edge energy (characteristic of the oxidized Ru(IV) state). 15 points for mentioning the distinct white line shape matching tetragonal RuO2 compared to metallic Ru. |
Review
#315
Ru/CeO2
Ru Ru K-edge, Ce L3-edge
▶
LLM Prompt
Sample Information
Material: Ru/CeO2
Support: CeO2
Reaction Conditions: H2/Ar at 250 °C
Sample-Specific Conditions
- gas environment: H2 250 °C
- 20 mol% Ru dispersed on ceria under H2 at 250 °C
Measurement
We plan to measure the Ru Ru K-edge, Ce L3-edge XANES spectrum of this sample.
Questions
Based on all the information above:
1. Under H2 at 250 °C, what is the dominant phase and oxidation state of Ru in the 20% Ru/CeO2 catalyst, and what is the physical reasoning for this state?
2. Describe the expected XANES spectral shape for this sample at the Ru K-edge. What distinguishing features indicate its chemical state?
3. If one were to perform linear combination fitting on the XANES spectrum of this sample to track its evolution from the fresh state, what reference spectra would be most appropriate to include as a basis?
Ground Truth
Material: 20% Ru-Ce (20 mol% Ru dispersed on CeO2)
Measurement: Ru K-edge, in-situ fluorescence mode, 8-ID beamline at NSLS-II
Fit method: Qualitative comparison
Phase fractions: (±10%)
| Phase | Fraction |
|---|---|
| Ru foil | 1.0 |
Fit basis (paper's reference spectra):
- Ru foil
- RuO2
Source evidence: Figure 3a, Page 11
Key reasoning: When the temperature is elevated to 250 °C under H2 flow, the ruthenium undergoes reduction. For the 20% Ru-Ce system, the XANES line shape obtained is very similar to that seen for a metallic (hcp) Ru foil, identifying a full reduction of the initially supported RuO2.
Reasoning source: Section 3.3.A, Page 11
Scoring Rubric (total: 100 pts)
| Q | Type | Max | Question | Reference Answer | Scoring Criteria |
|---|---|---|---|---|---|
| q1 | reasoning | 35 | Under H2 at 250 °C, what is the dominant phase and oxidation state of Ru in the 20% Ru/CeO2 catalyst, and what is the physical reasoning for this state? | Under the specified conditions, the dominant phase of the 20% Ru/CeO2 catalyst is metallic Ru (hcp) with an oxidation state of 0, representing a fraction of 1.0. This state arises because when the sample is exposed to a reducing H2 gas environment at an elevated temperature of 250 °C, the ruthenium undergoes a complete reduction process. Specifically, the thermal energy and hydrogen flow drive the full reduction of the initially supported RuO2 into metallic ruthenium. Therefore, the combination of the 250 °C temperature and H2 atmosphere entirely dictates this final metallic state. | Full points for identifying metallic Ru (oxidation state 0) and explaining that the H2 environment at elevated temperature causes full reduction of the initial RuO2 phase. |
| q2 | spectral | 35 | Describe the expected XANES spectral shape for this sample at the Ru K-edge. What distinguishing features indicate its chemical state? | The expected Ru K-edge XANES spectrum has an edge position at 22117 eV and exhibits a line shape that is very similar to a metallic (hcp) Ru foil reference. These spectral features arise because the sample conditions (H2 flow at 250 °C) drive the complete reduction of the initially supported RuO2 into metallic ruthenium. The exact match to the metallic Ru foil reference distinguishes this fully reduced state from the oxidized RuO2 state found in fresh samples or those exposed to CO2. Ultimately, the lack of oxidized spectral features directly reflects the complete reduction mechanism induced by the high-temperature hydrogen environment. | Full points for stating the line shape is very similar to a metallic (hcp) Ru foil, which distinguishes it from the oxidized RuO2 state. |
| q3 | identification | 30 | If one were to perform linear combination fitting on the XANES spectrum of this sample to track its evolution from the fresh state, what reference spectra would be most appropriate to include as a basis? | The most appropriate reference spectra to include as a basis for linear combination fitting are Ru foil and RuO2. These specific references are necessary because the 20 mol% Ru/CeO2 sample begins as initially supported RuO2 in its fresh state and undergoes complete reduction to metallic Ru (hcp) when exposed to H2 at 250 °C. The RuO2 reference captures the initial oxidized state, while the Ru foil reference accounts for the fully reduced metallic state (fraction of 1.0) that results from the elevated temperature and reducing hydrogen environment. Using this basis allows for accurate tracking of the reduction mechanism driven by these specific sample conditions. | Full points for identifying Ru foil (metallic Ru) and RuO2 as the necessary reference spectra. |
Review
Selective adsorption of arsenic over phosphate by transition metal cross-linked chitosan
APS
Environmental
Lauren N. Pincus et al.
DOI: 10.1016/j.cej.2021.128582
2 scenarios
▶
#316
adsorbent
As K
▶
LLM Prompt
Sample Information
Material: adsorbent
Sample Origin: synthetic
Sample-Specific Conditions
- adsorbate and adsorbent: As(V), Fe(III)-chitosan
- Arsenate adsorbed onto Fe(III)-cross-linked chitosan
Measurement
We plan to measure the As K XANES spectrum of this sample.
Questions
Based on all the information above:
1. What is the expected oxidation state of arsenic in this sample after adsorption, and what structural motif dominates the binding to the Fe(III)-chitosan matrix?
Ground Truth
Material: Fe(III)-cross-linked chitosan adsorbent
Measurement: As K-edge fluorescence mode at NSLS II (8-ID) or APS (9-BM)
Fit method: not applicable (oxidation state observation only)
Phase fractions:
| Phase | Fraction |
|---|---|
| As(V) inner-sphere complex | 1.0 |
Source evidence: Section 3.3, page 24
Key reasoning: XANES analysis confirmed that no oxidation state changes occurred upon adsorption of As(V) to the transition metal chitosan complexes. Complementary EXAFS analysis showed an As-Fe scattering path at 3.29 Å, indicating inner-sphere complexation. In contrast, Cu(II)-chitosan did not show an As-Cu bond, suggesting outer-sphere complexation. These differences in complexation likely explain the higher As(V) removal performance by Fe(III)-chitosan compared to Cu(II)-chitosan.
Reasoning source: Section 3.3, pages 24-25
Scoring Rubric (total: 100 pts)
| Q | Type | Max | Question | Reference Answer | Scoring Criteria |
|---|---|---|---|---|---|
| q1 | prediction | 100 | What is the expected oxidation state of arsenic in this sample after adsorption, and what structural motif dominates the binding to the Fe(III)-chitosan matrix? | The expected oxidation state of arsenic in this sample is As(V), and the binding is entirely dominated by an As(V) inner-sphere complex (1.0 fraction). Based on the sample conditions involving arsenate adsorbed onto a synthetic Fe(III)-cross-linked chitosan adsorbent, XANES confirms that no oxidation state changes occur during the adsorption process. The formation of this specific structural motif is evidenced by complementary EXAFS analysis, which shows an As-Fe scattering path at 3.29 Å. This direct bonding indicates inner-sphere complexation with the iron centers, a mechanism that ultimately explains the high As(V) removal performance of the Fe(III)-chitosan material. | Correctly identifies the oxidation state as As(V) (noting that no reduction occurred during adsorption) and specifies that it forms an inner-sphere complex with Fe. |
Review
#317
adsorbent
As K
▶
LLM Prompt
Sample Information
Material: adsorbent
Sample Origin: synthetic
Sample-Specific Conditions
- adsorbate and adsorbent: As(III), Fe(III)-chitosan
- Arsenite adsorbed onto Fe(III)-cross-linked chitosan
Measurement
We plan to measure the As K XANES spectrum of this sample.
Questions
Based on all the information above:
1. What is the expected oxidation state of the arsenic species after adsorption onto the Fe(III)-chitosan complex, and what does this indicate about the adsorption process?
Ground Truth
Material: Fe(III)-cross-linked chitosan adsorbent
Measurement: As K-edge, fluorescence mode, 8-ID at NSLS II and 9-BM at APS
Fit method: not reported
Phase fractions:
| Phase | Fraction |
|---|---|
| As(III) adsorbed on Fe(III)-chitosan | 1.0 |
Source evidence: Page 24, Section 3.3
Key reasoning: XANES analysis confirmed that no oxidation state changes occurred upon adsorption of As(III) to the transition metal chitosan complexes (TMCs).
Reasoning source: Page 24, Section 3.3
Scoring Rubric (total: 100 pts)
| Q | Type | Max | Question | Reference Answer | Scoring Criteria |
|---|---|---|---|---|---|
| q1 | prediction | 100 | What is the expected oxidation state of the arsenic species after adsorption onto the Fe(III)-chitosan complex, and what does this indicate about the adsorption process? | The expected oxidation state of the arsenic species after adsorption onto the Fe(III)-chitosan complex is As(III). The sample was prepared by adsorbing arsenite, which is initially As(III), onto a synthetic Fe(III)-cross-linked chitosan adsorbent. XANES analysis confirms that the arsenic fraction is 1.0 for As(III) adsorbed on the complex, demonstrating that no oxidation state changes occur upon adsorption to these transition metal chitosan complexes. Consequently, this indicates that the adsorption process is strictly non-redox, with the adsorbate retaining its original oxidation state upon interacting with the adsorbent. | Must state that the oxidation state remains As(III), indicating that no redox reactions (such as oxidation to As(V)) occur upon adsorption to the transition metal complex. |
Review
Ru/MgO catalyst with dual Ru structure sites for efficient CO production from CO2 hydrogenation
BNL-NSLS-II-8-ID
Catalyst
Shaohua Xie et al.
DOI: 10.1016/j.cej.2024.150486
10 scenarios
▶
#318
Ru/MgO
Ru K
▶
LLM Prompt
Sample Information
Material: Ru/MgO
Support: MgO
Sample-Specific Conditions
- Ru loading: 0.5 wt.%
- 0.5 wt.% Ru on MgO, fresh catalyst
Measurement
We plan to measure the Ru K XANES spectrum of this sample.
Questions
Based on all the information above:
1. Identify the appropriate reference spectra (basis functions) needed to perform linear combination fitting (LCF) on the Ru K-edge XANES spectrum of the fresh 0.5 wt.% Ru/MgO catalyst to determine its oxidation state.
2. Based on the sample conditions (freshly calcined at 550 °C), estimate the phase fractions of the Ru species present in the 0.5 wt.% Ru/MgO catalyst.
3. Explain the physical reasoning behind the highly oxidized state of the Ru species in this fresh catalyst, and describe the structural nature of these species on the MgO support.
Ground Truth
Material: 0.5Ru/MgO
Measurement: Ru K-edge fluorescent mode at beamline 7-BM QAS of NSLS-II
Fit method: linear combination fitting
Phase fractions: (±10%)
| Phase | Fraction |
|---|---|
| RuO2 | 0.95 |
| Ru foil | 0.05 |
Fit basis (paper's reference spectra):
- Ru foil
- RuO2
Source evidence: Page 14, lines 309-314; Page 21, line 452; Page 22, line 471
Key reasoning: The fresh 0.5Ru/MgO catalyst exhibits a white line intensity very similar to RuO2, indicating the Ru species are primarily in an oxide phase. Linear combination fitting using Ru foil and RuO2 references yields an average oxidation state of 3.8, which corresponds to approximately 95% RuO2-like species and 5% metallic Ru. EXAFS analysis confirms the absence of Ru-Ru and Ru-O-Ru coordination shells, suggesting these highly oxidized Ru species exist as isolated single atoms (Ru1) highly dispersed on the MgO support.
Reasoning source: Section 3.2 Structure characterization (Page 14) and Section 3.5 CO2 hydrogenation mechanism (Page 21)
Scoring Rubric (total: 101 pts)
| Q | Type | Max | Question | Reference Answer | Scoring Criteria |
|---|---|---|---|---|---|
| q1 | identification | 25 | Identify the appropriate reference spectra (basis functions) needed to perform linear combination fitting (LCF) on the Ru K-edge XANES spectrum of the fresh 0.5 wt.% Ru/MgO catalyst to determine its oxidation state. | To perform linear combination fitting on the fresh 0.5 wt.% Ru/MgO catalyst, the appropriate reference spectra are Ru foil and RuO2. These references are necessary because the fresh catalyst exhibits a white line intensity very similar to RuO2, indicating the presence of a highly oxidized phase alongside a minor metallic component. Given the low 0.5 wt.% Ru loading on the MgO support, the Ru species are highly dispersed as isolated single atoms (Ru1) rather than large metallic clusters. Therefore, using RuO2 and Ru foil as basis functions accurately captures the highly oxidized nature of these dispersed species in the fresh sample. | Full credit for identifying both Ru foil (metallic Ru) and RuO2 as the necessary reference spectra. |
| q2 | quantification | 38 | Based on the sample conditions (freshly calcined at 550 °C), estimate the phase fractions of the Ru species present in the 0.5 wt.% Ru/MgO catalyst. | The phase fractions for the fresh 0.5 wt.% Ru/MgO catalyst are approximately 95% RuO2-like species and 5% metallic Ru (Ru foil). These specific values result from the fresh state of the catalyst and the low 0.5 wt.% Ru loading on the MgO support, which promotes extreme dispersion of the metal. Under these conditions, the Ru species exist primarily as isolated single atoms (Ru1) lacking Ru-Ru and Ru-O-Ru coordination shells. This structural configuration leads to a highly oxidized state with an average oxidation state of 3.8, directly explaining the overwhelming dominance of the 95% RuO2-like fraction. | Full credit for estimating approximately 95% RuO2 (or oxidized Ru4+ species) and 5% metallic Ru, or stating an average oxidation state of ~3.8. |
| q3 | reasoning | 38 | Explain the physical reasoning behind the highly oxidized state of the Ru species in this fresh catalyst, and describe the structural nature of these species on the MgO support. | The highly oxidized state of the Ru species in the fresh 0.5 wt.% Ru/MgO catalyst is evidenced by a white line intensity very similar to RuO2, corresponding to an average oxidation state of 3.8. This oxidized state arises because the low 0.5 wt.% loading on the MgO support allows the ruthenium to be highly dispersed rather than aggregating into metallic nanoparticles. Structurally, the absence of Ru-Ru and Ru-O-Ru coordination shells confirms that the ruthenium does not form extended lattices. Consequently, these highly oxidized Ru species exist as isolated single atoms (Ru1) that are stabilized by the MgO support, resulting in a composition of 95% RuO2-like species and 5% metallic Ru. | Full credit for explaining that the Ru species are in an oxide phase (due to calcination) and exist as highly dispersed, isolated single atoms (Ru1) on the MgO support, lacking bulk Ru-Ru or Ru-O-Ru coordination. |
Review
#319
Ru/MgO
Ru K
▶
LLM Prompt
Sample Information
Material: Ru/MgO
Support: MgO
Sample-Specific Conditions
- state: spent
- 0.5 wt.% Ru on MgO, spent catalyst after CO2 hydrogenation
Measurement
We plan to measure the Ru K XANES spectrum of this sample.
Questions
Based on all the information above:
1. What reference spectra are appropriate for linear combination fitting (LCF) of the Ru K-edge XANES for this spent 0.5Ru/MgO catalyst to determine its average oxidation state?
2. Based on the reaction conditions (CO2 hydrogenation at 550 °C for 12 h), estimate the phase fractions of the Ru species in the spent 0.5Ru/MgO-p catalyst.
3. Explain the physical and chemical reasons for the observed phase composition in the spent 0.5Ru/MgO catalyst compared to its fresh state.
4. How would the white line intensity and absorption edge energy of the spent 0.5Ru/MgO-p catalyst compare to the fresh 0.5Ru/MgO catalyst in the Ru K-edge XANES spectra?
Ground Truth
Material: 0.5Ru/MgO-p
Measurement: Ru K-edge fluorescent mode at beamline 7-BM QAS (NSLS-II)
Fit method: Linear combination fitting (LCF)
Phase fractions: (±10%)
| Phase | Fraction |
|---|---|
| RuO2 | 0.725 |
| Ru foil | 0.275 |
Fit basis (paper's reference spectra):
- Ru foil
- RuO2
Source evidence: Section 3.4, Lines 408-415; Fig. S13a, Fig. S14, Table S2
Key reasoning: During long-term on-stream CO2 hydrogenation at 550 °C for 12 h, the highly dispersed Ru single atoms (Ru1) partially sintered and reduced to form metallic Ru nanoparticles. This is evidenced by a decrease in the white line intensity and absorption edge energy in the XANES spectra, corresponding to a decline in the average Ru oxidation state from 3.8 (fresh) to 2.9 (spent). The catalyst thus contains a mixture of remaining oxidized Ru species (modeled as RuO2) and newly formed metallic Ru.
Reasoning source: Section 3.4 (Catalytic stability), Lines 408-423
Scoring Rubric (total: 100 pts)
| Q | Type | Max | Question | Reference Answer | Scoring Criteria |
|---|---|---|---|---|---|
| q1 | identification | 20 | What reference spectra are appropriate for linear combination fitting (LCF) of the Ru K-edge XANES for this spent 0.5Ru/MgO catalyst to determine its average oxidation state? | The appropriate reference spectra for linear combination fitting (LCF) of this spent catalyst are Ru foil and RuO2. These references are necessary because during the long-term CO2 hydrogenation reaction at 550 °C for 12 h, the initially highly dispersed oxidized Ru single atoms partially sinter and reduce. Consequently, the spent sample consists of a mixture of newly formed metallic Ru nanoparticles (modeled by Ru foil) and remaining oxidized Ru species (modeled by RuO2). Using these two references allows for the accurate determination of the catalyst's average oxidation state, which declines to 2.9 in the spent state. | Must identify metallic Ru (or Ru foil) and RuO2 as the necessary reference spectra for the LCF analysis. |
| q2 | quantification | 30 | Based on the reaction conditions (CO2 hydrogenation at 550 °C for 12 h), estimate the phase fractions of the Ru species in the spent 0.5Ru/MgO-p catalyst. | The estimated phase fractions for the spent 0.5Ru/MgO catalyst are 72.5% RuO2 and 27.5% Ru foil, with an uncertainty of 10%. These specific values result from the catalyst's exposure to CO2 hydrogenation conditions at 550 °C for 12 h. Under these on-stream conditions, the highly dispersed Ru single atoms undergo partial reduction and sintering to form metallic Ru nanoparticles. The 27.5% metallic fraction reflects this partial reduction, while the dominant 72.5% RuO2 fraction represents the remaining oxidized Ru species, yielding an overall average oxidation state of 2.9. | Must state approximately 72.5% RuO2 (or oxidized Ru4+ species) and 27.5% metallic Ru (or Ru0). Accept values within a ±10% absolute range. |
| q3 | reasoning | 30 | Explain the physical and chemical reasons for the observed phase composition in the spent 0.5Ru/MgO catalyst compared to its fresh state. | In its fresh state, the 0.5Ru/MgO catalyst consists of highly dispersed Ru single atoms with an average oxidation state of 3.8. During long-term on-stream CO2 hydrogenation at 550 °C for 12 h, these single atoms undergo a physical and chemical transformation. The reaction conditions drive the partial reduction and sintering of the Ru species, leading to the formation of metallic Ru nanoparticles. As a result, the spent catalyst's phase composition shifts to a mixture of newly formed metallic Ru (27.5%) and remaining oxidized Ru species (72.5%), lowering the average oxidation state to 2.9. | Must explain that the high-temperature (550 °C) reducing environment during long-term CO2 hydrogenation causes the highly dispersed Ru single atoms to partially reduce and sinter into metallic Ru nanoparticles, resulting in a mixed phase of oxidized and metallic Ru. |
| q4 | prediction | 20 | How would the white line intensity and absorption edge energy of the spent 0.5Ru/MgO-p catalyst compare to the fresh 0.5Ru/MgO catalyst in the Ru K-edge XANES spectra? | The spent 0.5Ru/MgO catalyst will exhibit a decreased white line intensity and a shift to lower absorption edge energy compared to the fresh catalyst. These spectral changes occur because the long-term CO2 hydrogenation conditions at 550 °C for 12 h cause the highly dispersed Ru single atoms to partially sinter and reduce into metallic Ru nanoparticles. This structural and electronic transformation lowers the average Ru oxidation state from 3.8 in the fresh sample to 2.9 in the spent sample. The increased presence of metallic Ru (27.5%) relative to the oxidized species (72.5%) directly produces the observed reduction in both the edge energy and white line intensity. | Must state that both the white line intensity and the absorption edge energy decrease in the spent catalyst due to the partial reduction and lower average oxidation state of the Ru species. |
Review
#320
Ru/MgO
Ru K
▶
LLM Prompt
Sample Information
Material: Ru/MgO
Support: MgO
Sample-Specific Conditions
- state: spent
- 1.0 wt.% Ru on MgO, spent catalyst after CO2 hydrogenation
Measurement
We plan to measure the Ru K XANES spectrum of this sample.
Questions
Based on all the information above:
1. What candidate reference spectra are required to perform a linear combination fitting (LCF) analysis of the spent 1.0Ru/MgO catalyst after long-term CO2 hydrogenation?
2. Estimate the phase fractions of the Ru species in the spent 1.0Ru/MgO catalyst after 12 hours of on-stream CO2 hydrogenation at 550 °C.
3. Explain the physical and chemical reasons for the observed phase composition in the spent 1.0Ru/MgO catalyst. Why does it differ from the fresh catalyst?
Ground Truth
Material: 1.0Ru/MgO-p
Measurement: Ru K-edge XANES, fluorescent mode, beamline 7-BM QAS at NSLS-II
Fit method: Linear combination fitting (LCF)
Phase fractions: (±10%)
| Phase | Fraction |
|---|---|
| RuO2 | 0.625 |
| Ru foil | 0.375 |
Fit basis (paper's reference spectra):
- Ru foil
- RuO2
Source evidence: Section 3.4, Page 20, lines 408-416 (average oxidation state 2.5); Page 22, lines 470-471 (reference spectra)
Key reasoning: During the 12 h CO2 hydrogenation reaction at 550 °C, the highly dispersed Ru species (single atoms and atomic single-layers) in the 1.0Ru/MgO catalyst underwent partial reduction and sintering. The relatively high surface density of Ru species facilitated their agglomeration into metallic Ru nanoparticles. This structural evolution is reflected in the XANES spectra by a decreased white line intensity and absorption edge energy, resulting in an average oxidation state of 2.5, which corresponds to a mixture of oxidized (RuO2-like) and metallic Ru phases.
Reasoning source: Section 3.4, Page 20, lines 408-423
Scoring Rubric (total: 100 pts)
| Q | Type | Max | Question | Reference Answer | Scoring Criteria |
|---|---|---|---|---|---|
| q1 | identification | 20 | What candidate reference spectra are required to perform a linear combination fitting (LCF) analysis of the spent 1.0Ru/MgO catalyst after long-term CO2 hydrogenation? | To perform a linear combination fitting (LCF) analysis on the spent 1.0Ru/MgO catalyst, the required reference spectra are Ru foil (metallic Ru) and RuO2. These specific references are necessary because during the 12-hour CO2 hydrogenation reaction at 550 °C, the initially highly dispersed Ru species undergo partial reduction and sintering. The relatively high surface density of the 1.0 wt.% Ru loading facilitates their agglomeration into metallic Ru nanoparticles, while a significant portion of oxidized species remains. This structural evolution results in an average oxidation state of 2.5, requiring both metallic and oxidized references to accurately model the mixed-phase composition. | Full points for identifying metallic Ru (or Ru foil) and RuO2 as the necessary reference spectra. |
| q2 | quantification | 40 | Estimate the phase fractions of the Ru species in the spent 1.0Ru/MgO catalyst after 12 hours of on-stream CO2 hydrogenation at 550 °C. | The phase fractions of the Ru species in the spent 1.0 wt.% Ru/MgO catalyst are estimated to be 62.5% RuO2 and 37.5% metallic Ru (Ru foil), with an uncertainty of 10%. These specific values arise from the reaction conditions during the 12-hour CO2 hydrogenation at 550 °C, which cause the highly dispersed Ru single atoms and atomic single-layers to undergo partial reduction and sintering. Due to the relatively high surface density of Ru on the MgO support, the species agglomerate into metallic Ru nanoparticles while retaining a majority oxidized fraction. This partial reduction yields an average oxidation state of 2.5, directly corresponding to this specific mixture of oxidized and metallic phases. | Full points for estimating approximately 62.5% RuO2 (or oxidized Ru species) and 37.5% metallic Ru, or an average oxidation state of 2.5. Deduct points proportionally for estimates outside a 10% margin of error. |
| q3 | reasoning | 40 | Explain the physical and chemical reasons for the observed phase composition in the spent 1.0Ru/MgO catalyst. Why does it differ from the fresh catalyst? | The observed phase composition of 62.5% RuO2 and 37.5% metallic Ru in the spent catalyst is driven by the reaction conditions of CO2 hydrogenation at 550 °C over 12 hours. Under these conditions, the initially highly dispersed Ru species, consisting of single atoms and atomic single-layers in the fresh catalyst, undergo partial reduction and sintering. Because of the relatively high surface density of the 1.0 wt.% Ru loading on the MgO support, these species readily agglomerate into metallic Ru nanoparticles. This structural and chemical evolution is reflected in the XANES spectra by a decreased white line intensity and absorption edge energy, ultimately resulting in a mixed phase with an average oxidation state of 2.5. | Full points for explaining that the high surface density of Ru single atoms and atomic single-layers leads to sintering and the formation of metallic Ru nanoparticles under the reducing reaction conditions at 550 °C, resulting in a partially reduced state (mixture of metallic and oxidized Ru). |
Review
#321
Ru/MgO
Ru K
▶
LLM Prompt
Sample Information
Material: Ru/MgO
Support: MgO
Reaction Conditions: Ar flow, 30 °C
Sample-Specific Conditions
- reaction step: Step 1
- 0.5 wt.% Ru on MgO, in situ Step 1
Measurement
We plan to measure the Ru K XANES spectrum of this sample.
Questions
Based on all the information above:
1. What candidate reference spectra are appropriate for performing linear combination fitting (LCF) on the Ru K-edge XANES data for this catalyst under these conditions?
2. Estimate the phase fractions of the Ru species for the 0.5 wt.% Ru/MgO catalyst during the initial Ar flow at 30 °C (Step 1).
3. Explain the physical reasoning for the observed phase composition of the Ru species on the MgO support under these initial conditions (Ar flow, 30 °C) prior to the introduction of reaction gases.
Ground Truth
Material: 0.5Ru/MgO
Measurement: Ru K-edge XANES, fluorescent mode, beamline 7-BM QAS at NSLS-II
Fit method: Linear combination fitting (LCF)
Phase fractions: (±10%)
| Phase | Fraction |
|---|---|
| RuO2 | 0.925 |
| Ru foil | 0.075 |
Fit basis (paper's reference spectra):
- Ru foil
- RuO2
Source evidence: Figure 11a, 11c and Section 3.5, Page 21-22
Key reasoning: During Step 1 (Ar flow at 30 °C), the 0.5Ru/MgO catalyst remains in its initial, as-prepared state before any reaction gases are introduced. The XANES linear combination fitting yields an average oxidation state of 3.7, which corresponds to a mixture heavily dominated by RuO2-like oxidized species (92.5%) with a minor metallic Ru component (7.5%). The Ru species are highly dispersed as single atoms on the MgO support, primarily exhibiting Ru-O and Ru-O-Mg coordination without bulk RuO2 particles.
Reasoning source: Section 3.2 (Page 14) and Section 3.5 (Page 21-22)
Scoring Rubric (total: 100 pts)
| Q | Type | Max | Question | Reference Answer | Scoring Criteria |
|---|---|---|---|---|---|
| q1 | identification | 20 | What candidate reference spectra are appropriate for performing linear combination fitting (LCF) on the Ru K-edge XANES data for this catalyst under these conditions? | The appropriate reference spectra for linear combination fitting (LCF) of the Ru K-edge XANES data are Ru foil and RuO2. These references are expected because, during Step 1 under an inert Ar flow at 30 °C, the 0.5 wt.% Ru/MgO catalyst remains in its initial, as-prepared state prior to the introduction of reaction gases. In this state, the Ru species are highly dispersed as single atoms on the MgO support, primarily exhibiting Ru-O and Ru-O-Mg coordination without bulk RuO2 particles. This highly oxidized environment, combined with a minor metallic component, results in an average oxidation state of 3.7, necessitating both RuO2 and Ru foil references to accurately fit the spectrum. | Full points for identifying Ru foil (or metallic Ru) and RuO2 as the necessary reference spectra. |
| q2 | quantification | 40 | Estimate the phase fractions of the Ru species for the 0.5 wt.% Ru/MgO catalyst during the initial Ar flow at 30 °C (Step 1). | The estimated phase fractions for the 0.5 wt.% Ru/MgO catalyst are 92.5% RuO2 and 7.5% Ru foil, with a fitting uncertainty of 10%. These specific values result from the catalyst remaining in its initial, as-prepared state during Step 1 under an inert Ar flow at 30 °C, before any reaction gases are introduced. Because the Ru species are highly dispersed as single atoms on the MgO support, they predominantly form Ru-O and Ru-O-Mg bonds rather than bulk RuO2 particles. This specific coordination environment yields an average oxidation state of 3.7, which mathematically translates to a composition heavily dominated by oxidized species (92.5%) with only a minor metallic fraction (7.5%). | Full points for estimating ~92.5% RuO2 (or oxidized Ru species) and ~7.5% metallic Ru. Partial credit for stating it is predominantly an oxidized phase with an average oxidation state near 3.7. |
| q3 | reasoning | 40 | Explain the physical reasoning for the observed phase composition of the Ru species on the MgO support under these initial conditions (Ar flow, 30 °C) prior to the introduction of reaction gases. | Under the initial Step 1 conditions of Ar flow at 30 °C, the 0.5 wt.% Ru/MgO catalyst remains in its as-prepared state because no reactive gases have been introduced to alter its composition. The low 0.5 wt.% loading allows the Ru species to be highly dispersed as single atoms across the MgO support. As a result, the Ru atoms primarily exhibit Ru-O and Ru-O-Mg coordination rather than aggregating into bulk RuO2 particles. This specific structural configuration produces an average oxidation state of 3.7, explaining why the observed phase composition is heavily dominated by RuO2-like oxidized species (92.5%) with only a minor metallic Ru component (7.5%). | Full points for explaining that the catalyst remains in its initial as-prepared state, consisting of highly dispersed, isolated Ru species strongly interacting with the MgO support (Ru-O and Ru-O-Mg coordination), resulting in a highly oxidized state (average oxidation state ~3.7) dominated by RuO2-like species. |
Review
#322
Ru/MgO
Ru K
▶
LLM Prompt
Sample Information
Material: Ru/MgO
Support: MgO
Reaction Conditions: 10% CO2 + 30% H2, 500 °C
Sample-Specific Conditions
- reaction step: Step 3
- 0.5 wt.% Ru on MgO, in situ Step 3
Measurement
We plan to measure the Ru K XANES spectrum of this sample.
Questions
Based on all the information above:
1. What reference spectra are appropriate for linear combination fitting (LCF) of the Ru K-edge XANES data to determine the oxidation state of this sample?
2. Based on the reaction conditions (10% CO2 + 30% H2 at 500 °C), estimate the phase fractions of the Ru species (RuO2 vs. metallic Ru) in the 0.5Ru/MgO catalyst.
3. Explain why the 0.5Ru/MgO catalyst exhibits this specific degree of partial reduction under these conditions, particularly when compared to catalysts with higher Ru loadings (e.g., 1.0Ru/MgO).
Ground Truth
Material: 0.5Ru/MgO
Measurement: Ru K-edge XANES, in situ fluorescent mode, beamline 7-BM QAS at NSLS-II
Fit method: Linear combination fitting (LCF)
Phase fractions: (±10%)
| Phase | Fraction |
|---|---|
| RuO2 | 0.875 |
| Ru foil | 0.125 |
Fit basis (paper's reference spectra):
- Ru foil
- RuO2
Source evidence: Fig. 11c and Section 3.5, Page 21 (lines 450-454)
Key reasoning: Upon increasing the temperature to 500 °C in the reaction flow (10% CO2 + 30% H2), the Ru oxidation state decreased to 3.5 on the 0.5Ru/MgO catalyst, indicating partial reduction. This decline is less pronounced than on the 1.0Ru/MgO catalyst because the 0.5Ru/MgO catalyst contains only Ru1 single-atom sites, which are less efficient at H2 activation compared to the Ru atomic single-layer (RuASL) sites present at higher loadings.
Reasoning source: Section 3.5, Page 21
Scoring Rubric (total: 100 pts)
| Q | Type | Max | Question | Reference Answer | Scoring Criteria |
|---|---|---|---|---|---|
| q1 | identification | 20 | What reference spectra are appropriate for linear combination fitting (LCF) of the Ru K-edge XANES data to determine the oxidation state of this sample? | The appropriate reference spectra for linear combination fitting (LCF) of this sample are Ru foil (metallic Ru) and RuO2. These references are required because, under the reaction conditions of 10% CO2 + 30% H2 at 500 °C, the 0.5 wt.% Ru/MgO catalyst undergoes partial reduction. Specifically, the low 0.5 wt.% loading results in exclusively Ru1 single-atom sites that are less efficient at H2 activation. Consequently, the catalyst only partially reduces to an average oxidation state of 3.5, necessitating both fully oxidized (RuO2) and fully reduced (Ru foil) standards to accurately model this mixed state. | Must identify Ru foil (or metallic Ru) and RuO2 as the necessary reference spectra. |
| q2 | quantification | 40 | Based on the reaction conditions (10% CO2 + 30% H2 at 500 °C), estimate the phase fractions of the Ru species (RuO2 vs. metallic Ru) in the 0.5Ru/MgO catalyst. | Under the reaction conditions of 10% CO2 + 30% H2 at 500 °C, the estimated phase fractions for the 0.5Ru/MgO catalyst are 87.5% RuO2 and 12.5% metallic Ru (Ru foil), with an uncertainty of 10%. These specific values result from the catalyst undergoing only a slight partial reduction, reaching an average Ru oxidation state of 3.5. This limited reduction occurs because the 0.5 wt.% Ru loading exclusively forms Ru1 single-atom sites on the MgO support. These isolated single-atom sites are less efficient at activating the H2 present in the reaction mixture, preventing a more complete reduction to the metallic phase. | Must estimate approximately 87.5% RuO2 (or an average oxidation state of ~3.5) and 12.5% metallic Ru. |
| q3 | reasoning | 40 | Explain why the 0.5Ru/MgO catalyst exhibits this specific degree of partial reduction under these conditions, particularly when compared to catalysts with higher Ru loadings (e.g., 1.0Ru/MgO). | When the 0.5Ru/MgO catalyst is exposed to a reaction flow of 10% CO2 + 30% H2 at 500 °C, its average Ru oxidation state only decreases to 3.5, indicating a limited partial reduction. This specific degree of reduction occurs because the low 0.5 wt.% loading results in the formation of exclusively Ru1 single-atom sites on the MgO support. These isolated Ru1 sites are significantly less efficient at activating H2 gas compared to the Ru atomic single-layer (RuASL) sites that form at higher loadings like 1.0 wt.% Ru/MgO. Consequently, the less efficient H2 activation at the single-atom sites restricts the extent of reduction, leaving the catalyst predominantly in an oxidized state (87.5% RuO2) rather than fully reducing to metallic Ru. | Must explain that the 0.5Ru/MgO catalyst contains only Ru1 single-atom sites, which have a lower H2 activation/dissociation ability compared to the Ru atomic single-layer (RuASL) sites found in higher loading catalysts, leading to a less pronounced reduction. |
Review
#323
Ru/MgO
Ru K
▶
LLM Prompt
Sample Information
Material: Ru/MgO
Support: MgO
Reaction Conditions: 10% CO2 + 30% H2, 500 °C
Sample-Specific Conditions
- reaction step: Step 5
- 0.5 wt.% Ru on MgO, in situ Step 5
Measurement
We plan to measure the Ru K XANES spectrum of this sample.
Questions
Based on all the information above:
1. What reference spectra are appropriate to use as basis functions for linear combination fitting (LCF) of the Ru K-edge XANES data for this catalyst under reaction conditions?
2. Based on the reaction conditions (10% CO2 + 30% H2 at 500 °C), estimate the phase fractions of the Ru species present in the 0.5 wt.% Ru/MgO catalyst.
3. Explain why the Ru species in the 0.5 wt.% Ru/MgO catalyst exhibit this specific phase composition (partial reduction) under these reaction conditions, and discuss their mechanistic role in the CO2 hydrogenation reaction.
Ground Truth
Material: 0.5Ru/MgO
Measurement: Ru K-edge XANES, in situ fluorescent mode, beamline 7-BM QAS at NSLS-II
Fit method: Linear combination fitting (LCF)
Phase fractions: (±10%)
| Phase | Fraction |
|---|---|
| RuO2 | 0.85 |
| Ru foil | 0.15 |
Fit basis (paper's reference spectra):
- Ru foil
- RuO2
Source evidence: Figure 11c and Section 3.5, Pages 21-22
Key reasoning: During in situ CO2 hydrogenation at 500 °C (Step 5), the Ru species in 0.5Ru/MgO undergo partial reduction, reaching an average oxidation state of ~3.4. This corresponds to a mixture dominated by oxidized Ru (RuO2-like) with a small fraction of metallic Ru. The partially reduced Ru species remain stable under the reaction conditions and are unable to be re-oxidized by CO2, indicating they function primarily as active sites for H2 dissociation rather than serving as redox active sites to activate CO2.
Reasoning source: Section 3.5, Pages 21-22
Scoring Rubric (total: 100 pts)
| Q | Type | Max | Question | Reference Answer | Scoring Criteria |
|---|---|---|---|---|---|
| q1 | identification | 20 | What reference spectra are appropriate to use as basis functions for linear combination fitting (LCF) of the Ru K-edge XANES data for this catalyst under reaction conditions? | The appropriate reference spectra for linear combination fitting (LCF) of the Ru K-edge XANES data are Ru foil (metallic Ru) and RuO2. These specific basis functions are required because, under the in situ CO2 hydrogenation conditions (10% CO2 + 30% H2 at 500 °C, Step 5), the 0.5 wt.% Ru/MgO catalyst undergoes partial reduction. This process yields an average Ru oxidation state of ~3.4, corresponding to a mixture dominated by oxidized Ru (RuO2-like) alongside a small fraction of metallic Ru. The partially reduced Ru species remain stable under these reaction conditions and cannot be re-oxidized by CO2, necessitating both metallic and oxide references to accurately model the spectrum. | Full credit for identifying metallic Ru (or Ru foil) and RuO2 as the necessary reference spectra. |
| q2 | quantification | 40 | Based on the reaction conditions (10% CO2 + 30% H2 at 500 °C), estimate the phase fractions of the Ru species present in the 0.5 wt.% Ru/MgO catalyst. | Under the specified reaction conditions, the phase fractions of the Ru species are estimated to be 0.85 (85%) RuO2 and 0.15 (15%) Ru foil, with an uncertainty of 10%. These specific values result from the catalyst undergoing partial reduction during in situ CO2 hydrogenation at 500 °C (Step 5), which brings the average oxidation state to ~3.4. This oxidation state reflects a composition heavily dominated by oxidized Ru (RuO2-like) with only a minor metallic Ru component. The fractions stabilize at these values because the partially reduced Ru species cannot be re-oxidized by the CO2 present in the gas mixture, functioning instead as stable active sites for H2 dissociation. | Full credit for estimating approximately 85% oxidized Ru (RuO2-like) and 15% metallic Ru. Partial credit for identifying that the catalyst remains predominantly oxidized with only a minor fraction of metallic Ru. |
| q3 | reasoning | 40 | Explain why the Ru species in the 0.5 wt.% Ru/MgO catalyst exhibit this specific phase composition (partial reduction) under these reaction conditions, and discuss their mechanistic role in the CO2 hydrogenation reaction. | During in situ CO2 hydrogenation at 500 °C with 10% CO2 and 30% H2 (Step 5), the 0.5 wt.% Ru/MgO catalyst undergoes partial reduction to reach an average oxidation state of ~3.4. This specific phase composition, consisting of 85% RuO2 and 15% metallic Ru, arises because the Ru species are stable under these reducing conditions but cannot be re-oxidized by the CO2 present in the gas mixture. Mechanistically, this lack of re-oxidation indicates that the partially reduced Ru species do not serve as redox-active sites to activate CO2. Instead, this stable, predominantly oxidized mixture functions primarily to provide active sites for H2 dissociation during the reaction. | Full credit for explaining that the Ru species undergo partial reduction but remain stable and cannot be re-oxidized by CO2, and that they function as active sites for H2 dissociation rather than acting as redox sites for CO2 activation. |
Review
#324
Ru/MgO
Ru K
▶
LLM Prompt
Sample Information
Material: Ru/MgO
Support: MgO
Reaction Conditions: Ar flow, 30 °C
Sample-Specific Conditions
- reaction step: Step 1
- 1.0 wt.% Ru on MgO, in situ Step 1
Measurement
We plan to measure the Ru K XANES spectrum of this sample.
Questions
Based on all the information above:
1. What candidate reference spectra are needed to perform linear combination fitting (LCF) for the Ru K-edge XANES of this 1.0Ru/MgO sample under these initial conditions?
2. Based on the sample conditions (Ar flow, 30 °C, Step 1), estimate the phase fractions of the Ru species present in the 1.0Ru/MgO catalyst.
3. Why does the 1.0Ru/MgO catalyst exhibit this specific phase composition at this stage of the in situ experiment?
Ground Truth
Material: 1.0Ru/MgO
Measurement: Ru K-edge XANES, in situ fluorescent mode, beamline 7-BM QAS at NSLS-II
Fit method: Linear combination fitting (LCF)
Phase fractions: (±10%)
| Phase | Fraction |
|---|---|
| RuO2 | 0.9 |
| Ru foil | 0.1 |
Fit basis (paper's reference spectra):
- Ru foil
- RuO2
Source evidence: Figure 11b, Figure 11c, and Section 3.5 (pages 21-22)
Key reasoning: At 30 °C in Ar flow (Step 1), the Ru species on the 1.0Ru/MgO catalyst are predominantly in an oxidized state, similar to the as-prepared catalyst. The average oxidation state is 3.6, determined by linear combination fitting using Ru foil and RuO2 as references. This indicates a mixture of mostly RuO2-like species (90%) with a small fraction of metallic Ru (10%), as no significant reduction has occurred yet prior to introducing the reaction gas and heating.
Reasoning source: Section 3.5, pages 21-22
Scoring Rubric (total: 100 pts)
| Q | Type | Max | Question | Reference Answer | Scoring Criteria |
|---|---|---|---|---|---|
| q1 | identification | 20 | What candidate reference spectra are needed to perform linear combination fitting (LCF) for the Ru K-edge XANES of this 1.0Ru/MgO sample under these initial conditions? | To perform linear combination fitting (LCF) for the Ru K-edge XANES of this sample, the required reference spectra are Ru foil and RuO2. These specific references are needed because, under the initial conditions of Ar flow at 30 °C (Step 1), the 1.0 wt.% Ru on MgO catalyst remains predominantly in an oxidized state similar to the as-prepared material. Because no reaction gas has been introduced and no heating has occurred to induce significant reduction, the sample consists of mostly oxidized RuO2-like species alongside a minor fraction of metallic Ru. Therefore, these two references adequately capture the average oxidation state of 3.6 present at this stage. | Full points for identifying RuO2 and metallic Ru (or Ru foil) as the necessary reference spectra. |
| q2 | quantification | 40 | Based on the sample conditions (Ar flow, 30 °C, Step 1), estimate the phase fractions of the Ru species present in the 1.0Ru/MgO catalyst. | Based on the initial conditions, the estimated phase fractions for the 1.0Ru/MgO catalyst are 90% RuO2 and 10% metallic Ru (Ru foil), with an uncertainty of 10%. These specific values result from the sample being held at 30 °C in an inert Ar flow during Step 1, meaning no significant reduction has yet taken place. Consequently, the catalyst retains an average oxidation state of 3.6, closely resembling the as-prepared, predominantly oxidized state. The lack of a reducing agent and elevated temperature at this stage explains why the Ru species remain overwhelmingly as RuO2-like species (0.9 fraction) rather than converting to metallic Ru (0.1 fraction). | Full points for estimating ~90% RuO2 (or oxidized Ru) and ~10% metallic Ru. Partial credit for identifying it as predominantly oxidized with a minor metallic component. |
| q3 | reasoning | 40 | Why does the 1.0Ru/MgO catalyst exhibit this specific phase composition at this stage of the in situ experiment? | The 1.0Ru/MgO catalyst exhibits a composition of 90% RuO2 and 10% metallic Ru because it is currently in Step 1 of the in situ experiment, which involves only an inert Ar flow at a low temperature of 30 °C. Under these specific initial conditions, no reaction gas has been introduced and no heating has been applied to drive a chemical reduction. As a result, the catalyst remains in a state very similar to the as-prepared material, which is predominantly oxidized. This lack of a reducing environment dictates that the Ru species maintain a high average oxidation state of 3.6, yielding the observed mixture of mostly RuO2-like species with only a small fraction of metallic Ru. | Full points for explaining that at 30 °C in Ar flow (Step 1), the catalyst remains in its predominantly as-prepared oxidized state (average oxidation state ~3.6) because no reducing agents (H2) or elevated temperatures have been introduced yet. |
Review
#325
Ru/MgO
Ru K
▶
LLM Prompt
Sample Information
Material: Ru/MgO
Support: MgO
Reaction Conditions: 10% CO2 + 30% H2, 500 °C
Sample-Specific Conditions
- reaction step: Step 3
- 1.0 wt.% Ru on MgO, in situ Step 3
Measurement
We plan to measure the Ru K XANES spectrum of this sample.
Questions
Based on all the information above:
1. What reference spectra should be used as basis functions for linear combination fitting (LCF) of the Ru K-edge XANES data for the 1.0Ru/MgO catalyst under these reaction conditions?
2. Based on the reaction conditions (10% CO2 + 30% H2 at 500 °C), estimate the phase fractions of the Ru species present in the 1.0Ru/MgO catalyst.
3. Explain the physical reasoning for the observed phase composition and average oxidation state of the 1.0Ru/MgO catalyst at 500 °C in the CO2 + H2 reaction mixture. Why does this catalyst show a more pronounced reduction compared to catalysts with lower Ru loading?
Ground Truth
Material: 1.0Ru/MgO
Measurement: Ru K-edge XANES, in situ fluorescent mode, beamline 7-BM QAS at NSLS-II
Fit method: Linear combination fitting (LCF)
Phase fractions: (±10%)
| Phase | Fraction |
|---|---|
| RuO2 | 0.775 |
| Ru foil | 0.225 |
Fit basis (paper's reference spectra):
- Ru foil
- RuO2
Source evidence: Figure 11b, 11c and text on Page 21 (lines 450-454)
Key reasoning: Upon increasing the temperature to 500 °C in the reaction flow (10% CO2 + 30% H2), the Ru oxidation state decreased significantly on 1.0Ru/MgO (from an initial state of 3.6 down to 3.1). This pronounced decline is attributed to the more efficient H2 activation on RuASL (atomic single-layer) sites within the 1.0Ru/MgO catalyst, leading to a more significant reduction of Ru species compared to lower loading samples. These partially reduced Ru species on the MgO support remained stable and were unable to be fully re-oxidized by CO2.
Reasoning source: Section 3.5, Page 21 (lines 450-454) and Page 22 (lines 457-465)
Scoring Rubric (total: 100 pts)
| Q | Type | Max | Question | Reference Answer | Scoring Criteria |
|---|---|---|---|---|---|
| q1 | identification | 20 | What reference spectra should be used as basis functions for linear combination fitting (LCF) of the Ru K-edge XANES data for the 1.0Ru/MgO catalyst under these reaction conditions? | For the linear combination fitting (LCF) of the Ru K-edge XANES data, the reference spectra should be Ru foil and RuO2. These basis functions are required because, under the reaction conditions of 10% CO2 + 30% H2 at 500 °C, the 1.0 wt.% Ru on MgO catalyst undergoes a significant but partial reduction. The presence of Ru atomic single-layer (RuASL) sites enables efficient H2 activation, reducing the initial Ru species to a lower oxidation state (from 3.6 to 3.1). However, because these partially reduced species remain stable on the MgO support and cannot be fully re-oxidized by CO2, a mixture of metallic (Ru foil) and oxidized (RuO2) phases is necessary to accurately model the final state. | Full points for identifying metallic Ru (or Ru foil) and RuO2 as the necessary reference spectra. |
| q2 | quantification | 40 | Based on the reaction conditions (10% CO2 + 30% H2 at 500 °C), estimate the phase fractions of the Ru species present in the 1.0Ru/MgO catalyst. | Under the reaction conditions of 10% CO2 + 30% H2 at 500 °C, the estimated phase fractions for the 1.0Ru/MgO catalyst are 77.5% RuO2 and 22.5% Ru foil, with an uncertainty of 10%. These specific fractions result from a pronounced decrease in the Ru oxidation state (from 3.6 down to 3.1) driven by the elevated temperature and reducing environment. The 1.0 wt.% Ru loading forms Ru atomic single-layer (RuASL) sites that highly efficiently activate H2, leading to a more significant reduction compared to lower loading samples. Despite this efficient reduction, the resulting partially reduced Ru species are stabilized by the MgO support and resist full re-oxidation by the CO2 present in the gas mixture, yielding this specific mixed-phase composition. | Full points for estimating approximately 75-80% RuO2 (or oxidized Ru species) and 20-25% metallic Ru. Partial points for correctly identifying that it is a mixture dominated by oxidized species but with a significant reduced metallic fraction. |
| q3 | reasoning | 40 | Explain the physical reasoning for the observed phase composition and average oxidation state of the 1.0Ru/MgO catalyst at 500 °C in the CO2 + H2 reaction mixture. Why does this catalyst show a more pronounced reduction compared to catalysts with lower Ru loading? | The observed phase composition and the decrease in the average oxidation state (from 3.6 to 3.1) at 500 °C in the 10% CO2 + 30% H2 mixture are driven by the specific structural features of the 1.0Ru/MgO catalyst. At this 1.0 wt.% loading, Ru forms atomic single-layer (RuASL) sites on the MgO support which are highly efficient at activating H2. This enhanced H2 activation leads to a much more pronounced reduction of the Ru species compared to catalysts with lower Ru loadings. Ultimately, these partially reduced Ru species become stabilized on the MgO support and cannot be fully re-oxidized by the CO2 in the reaction flow, resulting in the stable coexistence of metallic and oxidized phases. | Full points for explaining that the 1.0Ru/MgO catalyst contains Ru atomic single-layer (RuASL) sites that provide more efficient H2 activation, leading to a more significant partial reduction of the Ru species, which then remain stable and are not fully re-oxidized by CO2. |
Review
#326
Ru/MgO
Ru K
▶
LLM Prompt
Sample Information
Material: Ru/MgO
Support: MgO
Reaction Conditions: 10% CO2, 500 °C
Sample-Specific Conditions
- reaction step: Step 4
- 1.0 wt.% Ru on MgO, in situ Step 4
Measurement
We plan to measure the Ru K XANES spectrum of this sample.
Questions
Based on all the information above:
1. What reference spectra are required to perform a linear combination fitting (LCF) analysis of the Ru K-edge XANES data for this 1.0 wt.% Ru/MgO catalyst under the specified in situ conditions?
2. Based on the reaction conditions (Step 4: 10% CO2 at 500 °C, following a previous reaction step in CO2 + H2), estimate the phase fractions of the Ru species present in the 1.0 wt.% Ru/MgO catalyst.
3. Explain the physical reasoning behind the observed phase composition of the Ru species when the gas flow is switched to pure CO2 at 500 °C (Step 4). Why does the catalyst not return to a fully oxidized state?
Ground Truth
Material: 1.0Ru/MgO
Measurement: in situ Ru K-edge XANES, fluorescent mode, beamline 7-BM QAS at NSLS-II
Fit method: linear combination fitting
Phase fractions: (±10%)
| Phase | Fraction |
|---|---|
| RuO2 | 0.75 |
| Ru foil | 0.25 |
Fit basis (paper's reference spectra):
- Ru foil
- RuO2
Source evidence: Fig. 11c and Section 3.5, pages 21-22
Key reasoning: At 500 °C, transitioning from the reaction flow (CO2 + H2) to pure CO2 flow (Step 4) caused no substantial change in the Ru oxidation state compared to the previous step. The partially reduced Ru species on the MgO support remained stable and were unable to be re-oxidized by CO2, maintaining an average oxidation state of 3.0 (which corresponds to a 75% RuO2 and 25% metallic Ru mixture based on the LCF references).
Reasoning source: Section 3.5, pages 21-22
Scoring Rubric (total: 100 pts)
| Q | Type | Max | Question | Reference Answer | Scoring Criteria |
|---|---|---|---|---|---|
| q1 | identification | 30 | What reference spectra are required to perform a linear combination fitting (LCF) analysis of the Ru K-edge XANES data for this 1.0 wt.% Ru/MgO catalyst under the specified in situ conditions? | To perform the linear combination fitting (LCF) analysis of the Ru K-edge XANES data, reference spectra for Ru foil (metallic Ru) and RuO2 are required. These specific reference phases are necessary because the 1.0 wt.% Ru/MgO catalyst exists in a partially reduced state under the Step 4 conditions (10% CO2 at 500 °C). When transitioning from the previous CO2 + H2 reaction flow to pure CO2 at 500 °C, the Ru species on the MgO support remain stable and cannot be fully re-oxidized by the CO2. Consequently, the catalyst maintains an average oxidation state of 3.0, which is accurately modeled as a mixture of metallic Ru (Ru foil) and fully oxidized Ru (RuO2). | Full credit for identifying Ru foil (or metallic Ru) and RuO2 as the necessary reference spectra. |
| q2 | quantification | 35 | Based on the reaction conditions (Step 4: 10% CO2 at 500 °C, following a previous reaction step in CO2 + H2), estimate the phase fractions of the Ru species present in the 1.0 wt.% Ru/MgO catalyst. | The estimated phase fractions for the 1.0 wt.% Ru/MgO catalyst under Step 4 conditions are 75% RuO2 and 25% Ru foil (metallic Ru), with an uncertainty of 10%. These specific values result from the catalyst maintaining an average oxidation state of 3.0 at 500 °C. When the gas flow is switched from the reducing CO2 + H2 mixture to pure 10% CO2, the partially reduced Ru species on the MgO support remain highly stable. Because the pure CO2 flow is unable to re-oxidize these stable Ru species at this temperature, the catalyst retains this 75:25 oxidized-to-metallic ratio rather than returning to a fully oxidized state. | Full credit for estimating approximately 75% RuO2 (or oxidized Ru species) and 25% metallic Ru. Partial credit for identifying a mixture of oxidized and metallic Ru without exact fractions. |
| q3 | reasoning | 35 | Explain the physical reasoning behind the observed phase composition of the Ru species when the gas flow is switched to pure CO2 at 500 °C (Step 4). Why does the catalyst not return to a fully oxidized state? | When the 1.0 wt.% Ru/MgO catalyst is subjected to pure 10% CO2 at 500 °C during Step 4, it maintains a mixed phase composition of 75% RuO2 and 25% metallic Ru. This occurs because transitioning from the previous CO2 + H2 reaction flow to pure CO2 causes no substantial change in the Ru oxidation state. The partially reduced Ru species are stabilized on the MgO support, rendering them resistant to further structural changes under these specific conditions. As a result, the pure CO2 environment at 500 °C is unable to re-oxidize these stable species, locking the catalyst into an average oxidation state of 3.0. | Full credit for explaining that the partially reduced Ru species on the MgO support remain stable and are unable to be re-oxidized by CO2 at this temperature, thus maintaining the mixed oxidation state. |
Review
#327
Ru/MgO
Ru K
▶
LLM Prompt
Sample Information
Material: Ru/MgO
Support: MgO
Reaction Conditions: 10% CO2 + 30% H2, 30 °C
Sample-Specific Conditions
- reaction step: Step 6
- 1.0 wt.% Ru on MgO, in situ Step 6
Measurement
We plan to measure the Ru K XANES spectrum of this sample.
Questions
Based on all the information above:
1. What candidate reference spectra are needed to model the Ru K-edge XANES of this sample using linear combination fitting?
2. Based on the reaction conditions (cooling to 30 °C in CO2 + H2 after reaction at 500 °C), estimate the phase fractions of the Ru species in the 1.0Ru/MgO catalyst.
3. Explain the physical reasoning for why the 1.0Ru/MgO catalyst exhibits this specific phase composition at Step 6, particularly why it does not fully re-oxidize compared to its initial state.
Ground Truth
Material: 1.0Ru/MgO
Measurement: Ru K-edge in situ fluorescent mode at beamline 7-BM QAS (NSLS-II)
Fit method: Linear combination fitting (LCF)
Phase fractions: (±10%)
| Phase | Fraction |
|---|---|
| RuO2 | 0.8 |
| Ru foil | 0.2 |
Fit basis (paper's reference spectra):
- Ru foil
- RuO2
Source evidence: Figure 11c and Section 3.5, page 22
Key reasoning: During the reaction at 500 °C, the Ru species in 1.0Ru/MgO were partially reduced due to efficient H2 activation on RuASL sites. Upon cooling down to 30 °C in the reaction flow (Step 6), the Ru oxidation state did not fully recover to its initial state (recovering only to an average oxidation state of 3.2). This indicates that the changes in partial Ru species on 1.0Ru/MgO were irreversible, likely due to the formation of metallic Ru clusters with relatively larger size that could not be re-oxidized by CO2.
Reasoning source: Section 3.5, page 21-22
Scoring Rubric (total: 100 pts)
| Q | Type | Max | Question | Reference Answer | Scoring Criteria |
|---|---|---|---|---|---|
| q1 | identification | 20 | What candidate reference spectra are needed to model the Ru K-edge XANES of this sample using linear combination fitting? | To model the Ru K-edge XANES of this sample using linear combination fitting, the required reference spectra are Ru foil (metallic Ru) and RuO2. These specific phases are expected because the 1.0 wt.% Ru/MgO catalyst undergoes partial reduction during the prior reaction at 500 °C due to efficient H2 activation. Upon cooling to 30 °C in the 10% CO2 and 30% H2 reaction flow (Step 6), the catalyst does not fully re-oxidize. The necessity of both Ru foil and RuO2 references accounts for this irreversible change, which is driven by the formation of relatively larger metallic Ru clusters that cannot be completely re-oxidized by CO2. | Full points for identifying both metallic Ru (or Ru foil) and RuO2 (or Ru4+ oxide) as the necessary reference spectra. |
| q2 | quantification | 40 | Based on the reaction conditions (cooling to 30 °C in CO2 + H2 after reaction at 500 °C), estimate the phase fractions of the Ru species in the 1.0Ru/MgO catalyst. | The estimated phase fractions for the 1.0Ru/MgO catalyst at Step 6 are 80% RuO2 and 20% metallic Ru (Ru foil), with an uncertainty of 10%. These specific values result from the sample cooling down to 30 °C in the 10% CO2 and 30% H2 reaction flow after being partially reduced at 500 °C. The 20% metallic Ru fraction persists because the high-temperature reduction process formed relatively larger metallic Ru clusters that could not be re-oxidized by the CO2 present in the gas mixture. Consequently, the catalyst only recovers to an average oxidation state of 3.2, leaving a mixture dominated by 80% RuO2 but with a significant, irreversible metallic Ru component. | Full points for estimating approximately 80% RuO2 (or oxidized Ru) and 20% metallic Ru. Deduct points proportionally for deviations greater than 10%. |
| q3 | reasoning | 40 | Explain the physical reasoning for why the 1.0Ru/MgO catalyst exhibits this specific phase composition at Step 6, particularly why it does not fully re-oxidize compared to its initial state. | During the initial reaction at 500 °C, the Ru species in the 1.0 wt.% Ru/MgO catalyst are partially reduced due to the efficient activation of H2 on the Ru sites. When the sample is subsequently cooled to 30 °C in the 10% CO2 and 30% H2 reaction flow (Step 6), the oxidation state only partially recovers to an average of 3.2. This incomplete re-oxidation occurs because the high-temperature reduction leads to the formation of relatively larger metallic Ru clusters. These larger metallic clusters are stable and cannot be re-oxidized by the CO2 in the gas stream at 30 °C, resulting in the irreversible mixed-phase composition of 80% RuO2 and 20% metallic Ru. | Full points for explaining that partial reduction occurred at higher temperatures due to efficient H2 activation, and the changes were irreversible upon cooling because of the formation of larger metallic Ru clusters that could not be re-oxidized by CO2. |
Review
Do multinuclear 3d metal catalysts achieve O–O bond formation via radical coupling or via water nucleophilic attack? WNA leads the way in [Co4O4]n+
APS
Catalyst
Roman Ezhov et al.
DOI: 10.1016/j.checat.2021.03.013
3 scenarios
▶
#328
[Co4O4Py4Ac4]0
Co K-edge
▶
LLM Prompt
Sample Information
Material: [Co4O4Py4Ac4]0
Reaction Conditions: dissolved in water
Sample-Specific Conditions
- State: Initial
- Dissolved, all-CoIII cubane prior to electrolysis
Measurement
We plan to measure the Co K-edge XANES spectrum of this sample.
Questions
Based on all the information above:
1. Given the sample is dissolved in water prior to electrolysis, what is the expected dominant phase and its Co oxidation state?
2. Why is this sample expected to be a single pure phase, and what experimental trigger would be required to induce a phase change or structural rearrangement?
3. Describe the expected spectral characteristics of this sample and its role in the context of the overall in-situ electrolysis experiment.
Ground Truth
Material: [Co4O4Py4Ac4]0
Measurement: Co K-edge in-situ
Fit method: not applicable (pure initial phase)
Phase fractions:
| Phase | Fraction |
|---|---|
| [Co4O4Py4Ac4]0 | 1.0 |
Fit basis (paper's reference spectra):
- [Co4O4Py4Ac4]0
Source evidence: Sample description: Dissolved, all-CoIII cubane prior to electrolysis
Key reasoning: The sample is the initial dissolved [Co4O4Py4Ac4]0 complex in water prior to any applied potential. Therefore, it exists as a pure, intact all-Co(III) cubane phase without any electrochemical oxidation or structural rearrangement.
Reasoning source: Sample conditions and state description
Scoring Rubric (total: 100 pts)
| Q | Type | Max | Question | Reference Answer | Scoring Criteria |
|---|---|---|---|---|---|
| q1 | identification | 30 | Given the sample is dissolved in water prior to electrolysis, what is the expected dominant phase and its Co oxidation state? | The expected dominant phase is the intact [Co4O4Py4Ac4]0 complex, which accounts for 100% of the sample. The cobalt in this complex is entirely in the Co(III) oxidation state. This specific phase and oxidation state are expected because the sample is in its initial state, dissolved in water prior to any applied potential. Without the application of an electrochemical trigger, the complex remains a pure, intact all-Co(III) cubane phase and undergoes no electrochemical oxidation or structural rearrangement. | Full points for identifying [Co4O4Py4Ac4]0 as the sole phase (fraction 1.0) and correctly stating the Co(III) oxidation state. |
| q2 | reasoning | 35 | Why is this sample expected to be a single pure phase, and what experimental trigger would be required to induce a phase change or structural rearrangement? | The sample is expected to be a single pure phase of [Co4O4Py4Ac4]0 (fraction of 1.0) because it represents the initial resting state of the complex dissolved in water. At this stage, no potential has been applied to the system. Therefore, the complex exists as an intact all-Co(III) cubane cluster without any electrochemical oxidation or structural rearrangement. To induce a phase change, such as the formation of oxidized intermediates or electrodeposited films, the experimental trigger of electrolysis (an applied potential) would be required. | Full points for explaining that the sample is in its initial state prior to any applied potential, and that electrolysis/electrochemical oxidation is required to induce changes. |
| q3 | spectral | 35 | Describe the expected spectral characteristics of this sample and its role in the context of the overall in-situ electrolysis experiment. | The Co K-edge XANES spectrum of this sample will reflect the structural and electronic properties of an intact, dissolved all-Co(III) cubane cluster. Spectrally, it serves as the pure Co(III) initial resting state baseline before any electrochemical perturbation occurs. These specific spectral characteristics arise because the sample is measured prior to electrolysis, meaning no applied potential has yet caused electrochemical oxidation or structural rearrangement. Consequently, this initial spectrum is crucial for distinguishing the starting material from any oxidized intermediates or electrodeposited films that form once electrolysis begins. | Full points for noting it reflects an intact all-Co(III) cubane and serves as the initial pure Co(III) reference state before electrochemical oxidation. |
Review
#329
[Co4O4Py4Ac4]+
Co K-edge
▶
LLM Prompt
Sample Information
Material: [Co4O4Py4Ac4]+
Reaction Conditions: measured at 20 K
Sample-Specific Conditions
- State: Chemically oxidized
- Cubane oxidized under noncatalytic conditions
Measurement
We plan to measure the Co K-edge XANES spectrum of this sample.
Questions
Based on all the information above:
1. Based on the reaction conditions (oxidation with CeIV at pH 1 under noncatalytic conditions), what is the expected dominant compound in the sample?
2. Explain the physical reasoning for why this specific state is isolated rather than an active catalytic intermediate.
3. If performing a structural or spectral analysis of this sample, what primary reference phase must be considered?
Ground Truth
Material: [Co4O4Py4Ac4]+
Measurement: Co K-edge, ex-situ
Fit method: not reported
Phase fractions: (±10%)
| Phase | Fraction |
|---|---|
| [Co4O4Py4Ac4]+ | 1.0 |
Fit basis (paper's reference spectra):
- [Co4O4Py4Ac4]+
Source evidence: Sample description text
Key reasoning: The cubane sample was chemically oxidized using cerium(IV) ammonium nitrate (CeIV) at pH 1. Because this was performed under noncatalytic conditions, it isolates the chemically oxidized state of the cubane rather than a catalytic intermediate.
Reasoning source: Sample description
Scoring Rubric (total: 100 pts)
| Q | Type | Max | Question | Reference Answer | Scoring Criteria |
|---|---|---|---|---|---|
| q1 | identification | 30 | Based on the reaction conditions (oxidation with CeIV at pH 1 under noncatalytic conditions), what is the expected dominant compound in the sample? | The expected dominant compound is the chemically oxidized state of the cubane, specifically [Co4O4Py4Ac4]+. This phase arises because the sample was chemically oxidized using cerium(IV) ammonium nitrate (CeIV) at pH 1. By performing this oxidation under noncatalytic conditions, the reaction isolates the chemically oxidized state of the cubane rather than generating a catalytic intermediate. As a result, the sample consists entirely of the [Co4O4Py4Ac4]+ phase with a fraction of 1.0. | Full credit if the answer identifies [Co4O4Py4Ac4]+ as the dominant or pure phase. |
| q2 | reasoning | 40 | Explain the physical reasoning for why this specific state is isolated rather than an active catalytic intermediate. | The specific oxidized state of [Co4O4Py4Ac4]+ is isolated because the chemical oxidation is performed under strictly noncatalytic conditions. Specifically, the cubane sample is reacted with cerium(IV) ammonium nitrate (CeIV) at pH 1. By avoiding conditions that would drive a continuous catalytic cycle, the reaction halts at the initial oxidation step. This mechanism successfully traps the chemically oxidized state of the cubane, preventing the formation of active catalytic intermediates. | Full credit if the answer notes that the oxidation was performed under noncatalytic conditions, which traps the chemically oxidized state of the cubane. |
| q3 | identification | 30 | If performing a structural or spectral analysis of this sample, what primary reference phase must be considered? | The primary reference phase that must be considered for spectral analysis is [Co4O4Py4Ac4]+. This single-phase basis is required because the sample was chemically oxidized using CeIV at pH 1 under noncatalytic conditions. These specific conditions isolate the chemically oxidized state of the cubane and prevent the formation of any catalytic intermediates. Consequently, the sample is composed entirely of this oxidized state (fraction of 1.0), making [Co4O4Py4Ac4]+ the only necessary reference for fitting the Co K-edge XANES spectrum. | Full credit if the answer specifies the chemically oxidized cubane [Co4O4Py4Ac4]+. |
Review
#330
[Co4O4Py4Ac4] catalyst
Co K-edge
▶
LLM Prompt
Sample Information
Material: [Co4O4Py4Ac4] catalyst
Reaction Conditions: bulk electrolysis at 1.4 V vs Ag/AgCl, pH 12, 8 h
Sample-Specific Conditions
- State: Electrocatalytic conditions
- Cubane under catalytic conditions via in situ bulk electrolysis
Measurement
We plan to measure the Co K-edge XANES spectrum of this sample.
Questions
Based on all the information above:
1. What intermediate phase is expected to dominate the composition of the [Co4O4Py4Ac4] catalyst during in situ bulk electrolysis at 1.4 V vs Ag/AgCl (pH 12)?
2. Explain the reasoning for the expected oxidation state of the Co centers under these specific electrocatalytic conditions.
3. If performing Linear Combination Fitting (LCF) on the in situ XANES spectrum of this sample, what specific reference spectrum would be essential to include to capture the dominant state?
Ground Truth
Material: [Co4O4Py4Ac4] catalyst
Measurement: Co K-edge in-situ
Fit method: not reported
Phase fractions: (±10%)
| Phase | Fraction |
|---|---|
| [CoIII2CoIV2] intermediate | 1.0 |
Fit basis (paper's reference spectra):
- not reported
Source evidence: text/figure_2A
Key reasoning: Under electrocatalytic conditions via in situ bulk electrolysis at 1.4 V vs Ag/AgCl (pH 12) for 8 hours, the cubane catalyst is oxidized to form the [CoIII2CoIV2] intermediate.
Reasoning source: text/figure_2A
Scoring Rubric (total: 100 pts)
| Q | Type | Max | Question | Reference Answer | Scoring Criteria |
|---|---|---|---|---|---|
| q1 | identification | 40 | What intermediate phase is expected to dominate the composition of the [Co4O4Py4Ac4] catalyst during in situ bulk electrolysis at 1.4 V vs Ag/AgCl (pH 12)? | The [CoIII2CoIV2] intermediate is expected to completely dominate the composition, representing a fraction of 1.0. This phase arises directly from the applied electrocatalytic conditions, specifically the in situ bulk electrolysis at 1.4 V vs Ag/AgCl (pH 12) for 8 hours. Under this anodic potential and alkaline environment, the initial [Co4O4Py4Ac4] cubane catalyst is fully oxidized to form the mixed-valence [CoIII2CoIV2] intermediate state. | Full credit if the answer correctly identifies the [CoIII2CoIV2] intermediate. |
| q2 | reasoning | 40 | Explain the reasoning for the expected oxidation state of the Co centers under these specific electrocatalytic conditions. | The expected oxidation state of the Co centers is a mixed-valence Co(III)/Co(IV) state. This elevated oxidation state is the direct result of subjecting the [Co4O4Py4Ac4] catalyst to in situ bulk electrolysis at 1.4 V vs Ag/AgCl at pH 12 for 8 hours. These specific electrocatalytic conditions provide the necessary oxidative driving force to oxidize the starting cubane catalyst. Consequently, this oxidation mechanism transforms the material entirely into the [CoIII2CoIV2] intermediate, yielding the observed Co(III)/Co(IV) state. | Full credit if the answer connects the applied potential (1.4 V) and 8-hour bulk electrolysis to the formation of a mixed-valence Co(III)/Co(IV) state. |
| q3 | identification | 20 | If performing Linear Combination Fitting (LCF) on the in situ XANES spectrum of this sample, what specific reference spectrum would be essential to include to capture the dominant state? | A reference spectrum for the [CoIII2CoIV2] intermediate would be essential to include, as it accounts for 100% (fraction of 1.0) of the sample composition. The necessity of this specific reference stems from the sample's exposure to electrocatalytic conditions via bulk electrolysis at 1.4 V vs Ag/AgCl (pH 12) for 8 hours. These conditions provide the oxidative potential required to fully oxidize the initial [Co4O4Py4Ac4] cubane catalyst into the [CoIII2CoIV2] intermediate. Therefore, to accurately fit the in situ Co K-edge XANES data, the basis set must capture this completely dominant Co(III)/Co(IV) oxidized phase. | Full credit if the answer states that a reference for the [CoIII2CoIV2] intermediate is required. |
Review
Scalable conformal MoSx catalyst for efficient hydrogen evolution at industrial-level current density in alkaline electrolyzers
ESRF-BM23
Catalyst
Yong Zuo et al.
DOI: 10.1016/j.checat.2026.101763
2 scenarios
▶
#331
MoS3
Mo K-edge
▶
LLM Prompt
Sample Information
Material: MoS3
Support: Ni foam
Sample-Specific Conditions
- State: Pristine
- Pristine MoS3 catalyst layer conformally coated onto a porous Ni foam substrate
Measurement
We plan to measure the Mo K-edge XANES spectrum of this sample.
Questions
Based on all the information above:
1. Based on the preparation conditions (annealing at 200 °C for 1 h in Ar), what is the expected dominant phase and the oxidation state of Mo in this pristine catalyst?
2. Describe the expected Mo K-edge XANES spectral features of this pristine sample. Specifically, how does it visually differ from the spectra of commercial MoS2 and MoO3?
Ground Truth
Material: MoS3
Measurement: Mo K-edge, fluorescence mode, BM23 beamline at ESRF
Fit method: None
Phase fractions:
| Phase | Fraction |
|---|---|
| MoS3 | 1.0 |
Fit basis (paper's reference spectra):
- MoS2-commercial
- MoS3 (pristine MoS3@NF)
Source evidence: Figure 2c, page 6
Key reasoning: Under mild annealing conditions (200 °C for 1 h in Ar), the MoSx precursor forms the MoS3 phase, which consists of sulfide clusters based on metal-metal bonded Mo(IV) triangles. The XANES spectrum of this pristine MoS3@NF sample is distinct from MoS2 and MoO3, lacking the characteristic features of both, confirming its identity as a distinct MoS3 phase.
Reasoning source: Page 5-6, Spectral Characterizations and Analyses
Scoring Rubric (total: 100 pts)
| Q | Type | Max | Question | Reference Answer | Scoring Criteria |
|---|---|---|---|---|---|
| q1 | reasoning | 45 | Based on the preparation conditions (annealing at 200 °C for 1 h in Ar), what is the expected dominant phase and the oxidation state of Mo in this pristine catalyst? | The expected dominant phase in this pristine catalyst is MoS3, with molybdenum present in the Mo(IV) oxidation state. This specific composition arises because the sample is prepared under mild annealing conditions (200 °C for 1 h in Ar) on a porous Ni foam substrate. Under these thermal conditions, the MoSx precursor fully converts into the MoS3 phase, representing a 1.0 fraction of the material. Structurally, this mild treatment yields a phase consisting of sulfide clusters based on metal-metal bonded Mo(IV) triangles, which stabilizes the Mo(IV) state and prevents the formation of other phases like MoS2 or MoO3. | Award full points if the answer identifies the dominant phase as MoS3 and the oxidation state as Mo(IV). |
| q2 | spectral | 55 | Describe the expected Mo K-edge XANES spectral features of this pristine sample. Specifically, how does it visually differ from the spectra of commercial MoS2 and MoO3? | The expected Mo K-edge XANES spectrum of the pristine MoS3@NF sample is distinctly different from both commercial MoS2 and MoO3. Specifically, it lacks the pre-edge "Feature A" (a 1s→4d transition) characteristic of MoO3, and it also lacks the post-edge "Feature B" typically seen in MoS2. These spectral differences arise directly from the sample's preparation under mild annealing conditions (200 °C for 1 h in Ar), which yields a pure MoS3 phase composed of sulfide clusters based on metal-metal bonded Mo(IV) triangles. Because the precursor fully converts to this unique MoS3 cluster structure rather than oxidizing to MoO3 or crystallizing into MoS2, its distinct electronic and structural properties produce a spectrum devoid of the characteristic features of those other phases. | Award full points if the answer notes that the spectrum is distinct from both MoS2 and MoO3, specifically mentioning the absence of the pre-edge feature seen in MoO3 and the absence of the characteristic post-edge feature (Feature B) seen in MoS2. |
Review
#332
MoS3
Mo K-edge
▶
LLM Prompt
Sample Information
Material: MoS3
Support: Ni foam
Sample-Specific Conditions
- State: After 240h HER stability test
- MoS3 catalyst layer on Ni foam after 240 h stability test
Measurement
We plan to measure the Mo K-edge XANES spectrum of this sample.
Questions
Based on all the information above:
1. Identify the candidate reference spectra needed to model the Mo K-edge XANES spectrum of the MoS3@NF catalyst after the 240 h HER stability test using Linear Combination Fitting (LCF).
2. Estimate the phase fractions of the MoS3@NF catalyst after the 240 h HER stability test based on Mo K-edge XANES LCF analysis.
3. Explain why these specific phase fractions are observed after 240 hours of HER operation at -200 mA/cm2 in alkaline media.
Ground Truth
Material: MoS3 on Ni foam
Measurement: Mo K-edge, ex-situ fluorescence mode, BM23 beamline at ESRF
Fit method: Linear Combination Fit (LCF)
Phase fractions: (±10%)
| Phase | Fraction |
|---|---|
| MoS3 | 0.95 |
| MoS2 | 0.05 |
Fit basis (paper's reference spectra):
- MoS3 (pristine)
- commercial MoS2
Source evidence: Page 6 text and Figure S12b
Key reasoning: The MoS3@NF electrode retains nearly the same structural characteristics after the 240 h stability test at -200 mA/cm2. The XANES profile closely resembles the pristine sample, showing only a minor increase (<5%) in the MoS2 fraction. This indicates that the MoS3 coating remains structurally stable under long-term alkaline HER conditions.
Reasoning source: Page 6, Spectral Characterizations and Analyses
Scoring Rubric (total: 100 pts)
| Q | Type | Max | Question | Reference Answer | Scoring Criteria |
|---|---|---|---|---|---|
| q1 | identification | 20 | Identify the candidate reference spectra needed to model the Mo K-edge XANES spectrum of the MoS3@NF catalyst after the 240 h HER stability test using Linear Combination Fitting (LCF). | The candidate reference spectra needed to model the Mo K-edge XANES spectrum using Linear Combination Fitting (LCF) are pristine MoS3 and commercial MoS2. These specific references are required because the MoS3 catalyst layer on the Ni foam is subjected to a 240-hour HER stability test at -200 mA/cm2 in alkaline media. Under these conditions, the material remains highly structurally stable, retaining the pristine MoS3 phase, while the MoS2 reference is needed to account for a very minor structural transformation induced by the prolonged electrochemical testing. | Award full points if the response identifies pristine MoS3 and MoS2 as the necessary reference spectra for the fit. |
| q2 | quantification | 40 | Estimate the phase fractions of the MoS3@NF catalyst after the 240 h HER stability test based on Mo K-edge XANES LCF analysis. | Based on the Mo K-edge XANES LCF analysis, the estimated phase fractions are 95% MoS3 and 5% MoS2, with an uncertainty of 10%. These specific values result from the exceptional structural stability of the MoS3@NF electrode during the extended 240-hour HER stability test at -200 mA/cm2. Because the catalyst resists significant degradation under these alkaline HER conditions, the MoS3 fraction remains overwhelmingly dominant (0.95), while the minor 0.05 fraction of MoS2 reflects only a slight phase evolution over the long-term operation. | Award full points if the response estimates approximately 95% MoS3 and 5% (or <5%) MoS2. Deduct points proportionally for significant deviations from these values. |
| q3 | reasoning | 40 | Explain why these specific phase fractions are observed after 240 hours of HER operation at -200 mA/cm2 in alkaline media. | The observed phase fractions of 95% MoS3 and 5% MoS2 are a direct result of the robust structural stability of the MoS3 coating on the Ni foam support. During the 240-hour HER stability test at -200 mA/cm2 in alkaline media, the electrode resists significant degradation or large-scale phase transformation. Consequently, the XANES profile closely resembles that of the pristine sample, maintaining a dominant 95% MoS3 phase. The minor 5% MoS2 fraction arises because the prolonged electrochemical stress induces only a very slight structural conversion, demonstrating that the catalyst remains highly stable under long-term alkaline HER conditions. | Award full points if the response explains that the MoS3 coating remains structurally stable during long-term alkaline HER, undergoing only a very minor (<5%) phase transition to MoS2. |
Review
Effect of salinity, pressure and temperature on the solubility of smithsonite (ZnCO3) and Zn complexation in crustal and upper mantle hydrothermal fluids
ESRF-BM23
Environmental
Stefan Farsang et al.
DOI: 10.1016/j.chemgeo.2021.120320
10 scenarios
▶
#333
hydrothermal fluid
Zn K
▶
LLM Prompt
Sample Information
Material: hydrothermal fluid
Sample Origin: synthetic
Sample-Specific Conditions
- Pressure, Temperature, Salinity: 0.54 GPa, 25 °C, 0.2 m Cl
- Zn in aqueous solution with 0.2 m Cl at 0.54 GPa and 25 °C
Measurement
We plan to measure the Zn K XANES spectrum of this sample.
Questions
Based on all the information above:
1. What candidate reference spectra are needed to model the Zn speciation in this hydrothermal fluid system using linear combination fitting, and which phase dominates at these specific conditions (0.54 GPa, 25 °C, 0.2 m Cl)?
Ground Truth
Material: hydrothermal fluid
Measurement: Zn K-edge XANES, fluorescence geometry, beamline I20-EDE
Fit method: Linear combination fitting (LCF)
Phase fractions:
| Phase | Fraction |
|---|---|
| Zn(H2O)6 | 1.0 |
| ZnCl4 | 0.0 |
Fit basis (paper's reference spectra):
- octahedral Zn(H2O)6
- tetrahedral ZnCl4
Source evidence: Table 3, page 19
Key reasoning: At ambient temperature (25 °C) and low salinity (0.2 m Cl), Zn is fully hydrated in an octahedral coordination. The high relative permittivity of water at near-ambient conditions results in a structure dominated by an extended hydrogen bond network, which favors extensive hydration of dissolved ions and prevents ion association with chloride. The transition to tetrahedral chloride complexes requires higher temperatures and salinities to lower the dielectric permittivity and disrupt the hydrogen bond network.
Reasoning source: Discussion section, pages 21-22; Results section, page 19
Scoring Rubric (total: 100 pts)
| Q | Type | Max | Question | Reference Answer | Scoring Criteria |
|---|---|---|---|---|---|
| q1 | identification | 100 | What candidate reference spectra are needed to model the Zn speciation in this hydrothermal fluid system using linear combination fitting, and which phase dominates at these specific conditions (0.54 GPa, 25 °C, 0.2 m Cl)? | To model the Zn speciation in this hydrothermal fluid using linear combination fitting, the candidate reference spectra needed are octahedral Zn(H2O)6 and tetrahedral ZnCl4. Under the specific conditions of 0.54 GPa, 25 °C, and 0.2 m Cl, the octahedral Zn(H2O)6 phase completely dominates, accounting for a fraction of 1.0 (100%). This pure hydration state occurs because at ambient temperature and low salinity, the high relative permittivity of water maintains an extended hydrogen bond network. This network strongly favors the extensive hydration of dissolved Zn ions and prevents ion association with chloride, which would otherwise require higher temperatures and salinities to lower the dielectric permittivity and disrupt the hydrogen bonds. | Full points if the answer identifies octahedral Zn(H2O)6 and tetrahedral ZnCl4 as the necessary reference spectra, and correctly states that the fully hydrated octahedral Zn(H2O)6 phase dominates (100% fraction) at these conditions. |
Review
#334
hydrothermal fluid
Zn K
▶
LLM Prompt
Sample Information
Material: hydrothermal fluid
Sample Origin: synthetic
Sample-Specific Conditions
- Pressure, Temperature, Salinity: 1.00 GPa, 200 °C, 0.2 m Cl
- Zn in aqueous solution with 0.2 m Cl at 1.00 GPa and 200 °C
Measurement
We plan to measure the Zn K XANES spectrum of this sample.
Questions
Based on all the information above:
1. What candidate reference spectra (endmembers) are appropriate for modeling the Zn speciation in this hydrothermal fluid via linear combination fitting?
2. Based on the provided conditions (1.00 GPa, 200 °C, 0.2 m Cl), estimate the relative fractions of the Zn aqueous species.
3. Explain the physical reasoning for why a mixture of these specific phases is present at 1.00 GPa and 200 °C, specifically discussing the competing effects of temperature, salinity, and pressure on Zn complexation.
Ground Truth
Material: hydrothermal fluid
Measurement: Zn K-edge XANES in fluorescence geometry at beamline I20-EDE
Fit method: Linear combination fitting (LCF)
Phase fractions:
| Phase | Fraction |
|---|---|
| Zn(H2O)6 | 0.55 |
| ZnCl4 | 0.45 |
Fit basis (paper's reference spectra):
- octahedral Zn(H2O)6
- tetrahedral ZnCl4
Source evidence: Table 3, page 19
Key reasoning: Increasing temperature and salinity generally favor the transition from octahedral O-coordinated to tetrahedral Cl-coordinated complexes. However, increasing pressure inhibits this transition because higher pressure leads to higher fluid density, which strengthens the hydrogen bond network, favors higher coordination of dissolved ions, and decreases ion association. Consequently, at 1.00 GPa and 200 °C in a relatively dilute 0.2 m Cl solution, the transition is only partial, resulting in a mixed speciation dominated slightly by the octahedral hydrated complex.
Reasoning source: Discussion section, pages 21-22 (lines 478-486, 511-514)
Scoring Rubric (total: 100 pts)
| Q | Type | Max | Question | Reference Answer | Scoring Criteria |
|---|---|---|---|---|---|
| q1 | identification | 20 | What candidate reference spectra (endmembers) are appropriate for modeling the Zn speciation in this hydrothermal fluid via linear combination fitting? | The appropriate reference spectra for modeling the Zn speciation in this hydrothermal fluid via linear combination fitting are octahedral Zn(H2O)6 and tetrahedral ZnCl4. These specific endmembers are expected because the sample conditions (200 °C, 0.2 m Cl, and 1.00 GPa) create competing thermodynamic effects on Zn complexation. While the elevated temperature and salinity drive a transition from octahedral oxygen-coordinated complexes to tetrahedral chlorine-coordinated complexes, the high pressure of 1.00 GPa inhibits this shift. The high pressure increases fluid density, which strengthens the hydrogen bond network and favors higher coordination, resulting in a mixture of both the hydrated and chlorinated species. | Full points for identifying both octahedral hydrated Zn (e.g., Zn(H2O)6) and tetrahedral chlorinated Zn (e.g., ZnCl4) as the necessary endmembers. |
| q2 | quantification | 40 | Based on the provided conditions (1.00 GPa, 200 °C, 0.2 m Cl), estimate the relative fractions of the Zn aqueous species. | Under the specified conditions of 1.00 GPa, 200 °C, and 0.2 m Cl, the estimated relative fractions are 0.55 for octahedral Zn(H2O)6 and 0.45 for tetrahedral ZnCl4. These specific values result from the competing effects of temperature, salinity, and pressure on the fluid's structure. Although the 200 °C temperature and 0.2 m Cl salinity promote the formation of tetrahedral Cl-coordinated complexes, the extreme pressure of 1.00 GPa counteracts this by increasing fluid density and decreasing ion association. Consequently, the transition to the chloride complex is only partial, leaving the speciation slightly dominated by the higher-coordination octahedral hydrated complex. | Full points for estimating approximately 55% octahedral Zn(H2O)6 and 45% tetrahedral ZnCl4 (allow ±10% margin of error). |
| q3 | reasoning | 40 | Explain the physical reasoning for why a mixture of these specific phases is present at 1.00 GPa and 200 °C, specifically discussing the competing effects of temperature, salinity, and pressure on Zn complexation. | A mixture of octahedral Zn(H2O)6 and tetrahedral ZnCl4 is present due to the competing thermodynamic effects of the sample conditions. Generally, increasing the temperature to 200 °C and adding 0.2 m Cl salinity favors the transition from octahedral O-coordinated complexes to tetrahedral Cl-coordinated complexes. However, the high pressure of 1.00 GPa strongly inhibits this transition by increasing the overall fluid density. This higher density strengthens the hydrogen bond network, favors higher coordination of dissolved ions, and decreases ion association. As a result, in this relatively dilute 0.2 m Cl solution, the structural transition is only partial, yielding a mixed speciation that is slightly dominated by the hydrated octahedral complex. | Full points for explaining that while elevated temperature and salinity drive the transition toward tetrahedral Cl-coordinated complexes, the high pressure (1.00 GPa) inhibits this transition by increasing fluid density, strengthening the hydrogen bond network, and favoring extensive hydration (octahedral coordination). |
Review
#335
hydrothermal fluid
Zn K
▶
LLM Prompt
Sample Information
Material: hydrothermal fluid
Sample Origin: synthetic
Sample-Specific Conditions
- Pressure, Temperature, Salinity: 1.60 GPa, 200 °C, 0.2 m Cl
- Zn in aqueous solution with 0.2 m Cl at 1.60 GPa and 200 °C
Measurement
We plan to measure the Zn K XANES spectrum of this sample.
Questions
Based on all the information above:
1. What candidate reference spectra (endmembers) are appropriate for modeling the Zn speciation in this hydrothermal fluid via Linear Combination Fitting?
2. Based on the provided conditions (1.60 GPa, 200 °C, 0.2 m Cl), estimate the relative fractions of the Zn aqueous species.
3. Explain the physical effect of the high pressure (1.60 GPa) on the Zn speciation and coordination environment compared to lower pressures at the same temperature and salinity.
Ground Truth
Material: hydrothermal fluid
Measurement: Zn K-edge XANES in fluorescence geometry at beamline I20-EDE
Fit method: Linear combination fitting (LCF)
Phase fractions:
| Phase | Fraction |
|---|---|
| Zn(H2O)6 | 0.78 |
| ZnCl4 | 0.22 |
Fit basis (paper's reference spectra):
- octahedral Zn(H2O)6
- tetrahedral ZnCl4
Source evidence: Table 3, page 19
Key reasoning: Increasing pressure inhibits the transition from octahedral O-coordinated to tetrahedral Cl-coordinated complexes. Higher pressure leads to higher fluid density, which strengthens the hydrogen bond network and promotes higher coordination of dissolved ions, extensive hydration, and decreased ion association. Consequently, increasing the pressure to 1.60 GPa at 200 °C in the 0.2 m Cl solution results in the octahedral hydrated species dominating over the tetrahedral chlorinated species.
Reasoning source: Discussion section, pages 21-22 (lines 480-486, 511-514)
Scoring Rubric (total: 100 pts)
| Q | Type | Max | Question | Reference Answer | Scoring Criteria |
|---|---|---|---|---|---|
| q1 | identification | 20 | What candidate reference spectra (endmembers) are appropriate for modeling the Zn speciation in this hydrothermal fluid via Linear Combination Fitting? | The appropriate reference spectra for modeling the Zn speciation in this synthetic hydrothermal fluid via Linear Combination Fitting are octahedral Zn(H2O)6 and tetrahedral ZnCl4. These specific endmembers are expected because the sample is an aqueous Zn solution containing 0.2 m Cl at 200 °C and 1.60 GPa. Under these conditions, the high pressure increases the fluid density and strengthens the hydrogen bond network. This physical change promotes extensive hydration and higher coordination of dissolved ions, resulting in a mixture of octahedral O-coordinated hydrated complexes and tetrahedral Cl-coordinated complexes. | Full points for identifying both the octahedral hydrated Zn(H2O)6 and tetrahedral chlorinated ZnCl4 endmembers. |
| q2 | quantification | 40 | Based on the provided conditions (1.60 GPa, 200 °C, 0.2 m Cl), estimate the relative fractions of the Zn aqueous species. | Based on the sample conditions, the estimated relative fractions are 0.78 for octahedral Zn(H2O)6 and 0.22 for tetrahedral ZnCl4. These specific values result from the high pressure of 1.60 GPa applied to the 0.2 m Cl aqueous solution at 200 °C. The elevated pressure significantly increases the fluid density, which strengthens the hydrogen bond network and decreases ion association. Consequently, this inhibits the transition from octahedral O-coordinated to tetrahedral Cl-coordinated complexes, causing the extensively hydrated octahedral species (78%) to dominate over the chlorinated tetrahedral species (22%). | Full points for estimating ~78% Zn(H2O)6 and ~22% ZnCl4. Partial credit for correctly identifying that the octahedral hydrated species is the dominant phase (>70%). |
| q3 | reasoning | 40 | Explain the physical effect of the high pressure (1.60 GPa) on the Zn speciation and coordination environment compared to lower pressures at the same temperature and salinity. | At 200 °C and 0.2 m Cl, applying a high pressure of 1.60 GPa physically increases the density of the hydrothermal fluid. This higher fluid density strengthens the hydrogen bond network within the aqueous solution. As a result, the system promotes higher coordination of dissolved ions, extensive hydration, and decreased ion association. This mechanism inhibits the transition from octahedral O-coordinated complexes to tetrahedral Cl-coordinated complexes, ultimately causing the octahedral Zn(H2O)6 species to dominate the coordination environment over the tetrahedral ZnCl4 species. | Full points for explaining that high pressure increases fluid density, strengthens the hydrogen bond network, promotes extensive hydration/higher coordination, and decreases ion association, thereby inhibiting the transition to tetrahedral Cl-coordinated complexes and favoring the octahedral hydrated species. |
Review
#336
hydrothermal fluid
Zn K
▶
LLM Prompt
Sample Information
Material: hydrothermal fluid
Sample Origin: synthetic
Sample-Specific Conditions
- Pressure, Temperature, Salinity: 1.53 GPa, 300 °C, 0.2 m Cl
- Zn in aqueous solution with 0.2 m Cl at 1.53 GPa and 300 °C
Measurement
We plan to measure the Zn K XANES spectrum of this sample.
Questions
Based on all the information above:
1. What candidate reference spectra (endmembers) are appropriate for modeling the Zn speciation in this hydrothermal fluid via Linear Combination Fitting?
2. Estimate the relative fractions of the Zn aqueous complexes in this 0.2 m Cl solution at 1.53 GPa and 300 °C.
3. Explain the competing physical effects of temperature and pressure on the coordination environment of Zn in this fluid, and why a mixed speciation is observed at these specific conditions (1.53 GPa, 300 °C).
Ground Truth
Material: hydrothermal fluid
Measurement: Zn K-edge XANES in fluorescence mode at Diamond Light Source beamline I20-EDE
Fit method: Linear combination fitting (LCF)
Phase fractions:
| Phase | Fraction |
|---|---|
| Zn(H2O)6 | 0.62 |
| ZnCl4 | 0.38 |
Fit basis (paper's reference spectra):
- octahedral Zn(H2O)6
- tetrahedral ZnCl4
Source evidence: Table 3, page 19
Key reasoning: Increasing temperature favors the transition from octahedral O-coordinated to tetrahedral Cl-coordinated complexes due to lowered dielectric permittivity and disruption of the hydrogen bond network. However, high pressure (1.53 GPa) counteracts this by increasing fluid density, strengthening the hydrogen bond network, and favoring higher coordination and extensive hydration. Consequently, at 1.53 GPa and 300 °C, the pressure effect partially inhibits the octahedral-to-tetrahedral transition, resulting in a mixed speciation dominated by octahedral hydrated complexes with a significant fraction of tetrahedral chlorinated complexes.
Reasoning source: Discussion section, pages 21-23
Scoring Rubric (total: 100 pts)
| Q | Type | Max | Question | Reference Answer | Scoring Criteria |
|---|---|---|---|---|---|
| q1 | identification | 20 | What candidate reference spectra (endmembers) are appropriate for modeling the Zn speciation in this hydrothermal fluid via Linear Combination Fitting? | The appropriate reference spectra for modeling the Zn speciation in this hydrothermal fluid via Linear Combination Fitting are octahedral Zn(H2O)6 and tetrahedral ZnCl4. These specific endmembers are expected because the sample conditions of 300 °C and 0.2 m Cl drive a transition from oxygen-coordinated to chlorine-coordinated complexes due to lowered dielectric permittivity and disruption of the hydrogen bond network. However, the high pressure of 1.53 GPa counteracts this temperature effect by increasing fluid density and strengthening the hydrogen bond network. This favors higher coordination and extensive hydration, resulting in a mixture of both the octahedral hydrated and tetrahedral chlorinated phases. | Full credit for identifying both octahedral hydrated Zn (e.g., Zn(H2O)6) and tetrahedral chlorinated Zn (e.g., ZnCl4) as the necessary endmembers. |
| q2 | quantification | 40 | Estimate the relative fractions of the Zn aqueous complexes in this 0.2 m Cl solution at 1.53 GPa and 300 °C. | The relative fractions of the Zn aqueous complexes in this fluid are 0.62 for octahedral Zn(H2O)6 and 0.38 for tetrahedral ZnCl4. These specific values result from the competing physical effects of temperature and pressure on the 0.2 m Cl solution. While the elevated temperature of 300 °C promotes the formation of tetrahedral chlorinated complexes by disrupting the hydrogen bond network, the high pressure of 1.53 GPa increases fluid density and favors higher coordination. Consequently, the pressure effect partially inhibits the octahedral-to-tetrahedral transition, leaving the speciation dominated by the hydrated octahedral complex alongside a significant fraction of the chlorinated tetrahedral complex. | Full credit for estimating ~62% octahedral Zn(H2O)6 and ~38% tetrahedral ZnCl4. Partial credit if the values are within ±10% of the ground truth. |
| q3 | reasoning | 40 | Explain the competing physical effects of temperature and pressure on the coordination environment of Zn in this fluid, and why a mixed speciation is observed at these specific conditions (1.53 GPa, 300 °C). | In this hydrothermal fluid, increasing the temperature to 300 °C lowers the dielectric permittivity and disrupts the hydrogen bond network, which favors a transition from octahedral O-coordinated to tetrahedral Cl-coordinated complexes. Conversely, the high pressure of 1.53 GPa counteracts this temperature effect by increasing the fluid density and strengthening the hydrogen bond network. This pressure-induced densification strongly favors higher coordination and extensive hydration of the Zn ions. As a result, at the specific conditions of 1.53 GPa and 300 °C with 0.2 m Cl, the pressure partially inhibits the octahedral-to-tetrahedral transition. This leads to the observed mixed speciation consisting of 62% octahedral Zn(H2O)6 and 38% tetrahedral ZnCl4. | Full credit for explaining that increasing temperature drives the transition toward tetrahedral Cl-coordinated complexes (by disrupting hydrogen bonds/lowering dielectric permittivity), while high pressure inhibits this transition (by increasing density/strengthening hydrogen bonds), leading to the observed mixture. |
Review
#337
hydrothermal fluid
Zn K
▶
LLM Prompt
Sample Information
Material: hydrothermal fluid
Sample Origin: synthetic
Sample-Specific Conditions
- Pressure, Temperature, Salinity: 0.60 GPa, 25 °C, 1 m Cl
- Zn in aqueous solution with 1 m Cl at 0.60 GPa and 25 °C
Measurement
We plan to measure the Zn K XANES spectrum of this sample.
Questions
Based on all the information above:
1. What candidate reference spectra (endmembers) should be used as the basis for Linear Combination Fitting (LCF) of the Zn K-edge XANES spectrum for this sample?
2. Estimate the relative phase fractions of the Zn complexes in this fluid at 0.60 GPa, 25 °C, and 1 m Cl.
3. Explain the physical reasoning for the predicted speciation at these specific conditions (0.60 GPa, 25 °C, 1 m Cl). How do the solvent properties dictate the balance between hydration and chlorination?
Ground Truth
Material: hydrothermal fluid
Measurement: Zn K-edge, fluorescence mode, I20-EDE beamline at Diamond Light Source
Fit method: LCF
Phase fractions:
| Phase | Fraction |
|---|---|
| Zn(H2O)6 | 0.94 |
| ZnCl4 | 0.06 |
Fit basis (paper's reference spectra):
- octahedral Zn(H2O)6
- tetrahedral ZnCl4
Source evidence: Table 3, page 19
Key reasoning: At ambient temperature (25 °C) and moderate salinity (1 m Cl), Zn is predominantly fully hydrated in an octahedral coordination [Zn(H2O)6]2+. The transition to tetrahedral chloride complexes [ZnCl4]2- is favored by increasing temperature and salinity, but inhibited by pressure. At 0.60 GPa and 25 °C, the fluid properties (high dielectric permittivity) favor an extended hydrogen bond network and extensive ion hydration rather than ion association, keeping the octahedral hydrated complex highly dominant.
Reasoning source: Discussion section, pages 21-22
Scoring Rubric (total: 100 pts)
| Q | Type | Max | Question | Reference Answer | Scoring Criteria |
|---|---|---|---|---|---|
| q1 | identification | 20 | What candidate reference spectra (endmembers) should be used as the basis for Linear Combination Fitting (LCF) of the Zn K-edge XANES spectrum for this sample? | The candidate reference spectra for Linear Combination Fitting (LCF) of this sample should be octahedral Zn(H2O)6 and tetrahedral ZnCl4. These specific endmembers are expected because the sample is an aqueous Zn solution containing 1 m Cl at 0.60 GPa and 25 °C. Under these ambient temperature and moderate salinity conditions, Zn exists predominantly as a fully hydrated octahedral complex. While increasing temperature and salinity would normally drive a transition toward tetrahedral chloride complexes, the high pressure (0.60 GPa) and low temperature (25 °C) maintain a high dielectric permittivity in the fluid. This fluid property favors an extended hydrogen bond network and extensive ion hydration over ion association, making these two specific complexes the necessary basis for fitting. | Full points for identifying both octahedral hydrated Zn (e.g., Zn(H2O)6) and tetrahedral chlorinated Zn (e.g., ZnCl4) as the necessary endmembers. |
| q2 | quantification | 40 | Estimate the relative phase fractions of the Zn complexes in this fluid at 0.60 GPa, 25 °C, and 1 m Cl. | The estimated relative phase fractions for this hydrothermal fluid are 0.94 (94%) octahedral Zn(H2O)6 and 0.06 (6%) tetrahedral ZnCl4. These specific values result from the sample conditions of 25 °C, 0.60 GPa, and 1 m Cl, which strongly favor hydration over chlorination. At this ambient temperature and moderate salinity, the fluid possesses a high dielectric permittivity that supports an extended hydrogen bond network. Because the transition to tetrahedral chloride complexes is inhibited by high pressure and favored only by higher temperatures, ion association is suppressed. Consequently, extensive ion hydration dominates, resulting in the highly dominant 94% fraction of the fully hydrated octahedral complex. | Full points for estimating ~94% octahedral Zn(H2O)6 and ~6% tetrahedral ZnCl4 (allow ±10% margin of error). |
| q3 | reasoning | 40 | Explain the physical reasoning for the predicted speciation at these specific conditions (0.60 GPa, 25 °C, 1 m Cl). How do the solvent properties dictate the balance between hydration and chlorination? | At the specific conditions of 0.60 GPa, 25 °C, and 1 m Cl, the speciation is heavily dominated by octahedral Zn(H2O)6 (94%) with only a minor amount of tetrahedral ZnCl4 (6%). This balance is dictated by the solvent properties at ambient temperature and high pressure, which result in a high dielectric permittivity. This high dielectric permittivity favors an extended hydrogen bond network and promotes extensive ion hydration rather than ion association. While the transition to tetrahedral chloride complexes is typically driven by increasing temperature and salinity, the applied pressure of 0.60 GPa actively inhibits this transition. Therefore, the physical conditions suppress chlorination and maintain the fully hydrated octahedral complex as the highly dominant species. | Full points for explaining that at low temperatures and high pressures, the high dielectric permittivity of water favors an extended hydrogen bond network and extensive ion hydration, inhibiting ion association (chlorination) and keeping the octahedral hydrated complex dominant. |
Review
#338
hydrothermal fluid
Zn K
▶
LLM Prompt
Sample Information
Material: hydrothermal fluid
Sample Origin: synthetic
Sample-Specific Conditions
- Pressure, Temperature, Salinity: 1.95 GPa, 200 °C, 1 m Cl
- Zn in aqueous solution with 1 m Cl at 1.95 GPa and 200 °C
Measurement
We plan to measure the Zn K XANES spectrum of this sample.
Questions
Based on all the information above:
1. What candidate reference spectra (endmembers) are required to model the Zn K-edge XANES spectrum of this hydrothermal fluid using linear combination fitting?
2. Based on the provided conditions (1.95 GPa, 200 °C, 1 m Cl), estimate the relative fractions of the Zn aqueous species present in the fluid.
Ground Truth
Material: hydrothermal fluid
Measurement: Zn K-edge XANES in fluorescence geometry at beamline I20-EDE
Fit method: Linear combination fitting (LCF)
Phase fractions:
| Phase | Fraction |
|---|---|
| Zn(H2O)6 | 0.71 |
| ZnCl4 | 0.29 |
Fit basis (paper's reference spectra):
- octahedral Zn(H2O)6
- tetrahedral ZnCl4
Source evidence: Table 3, page 19
Key reasoning: While increasing temperature and salinity generally favor the transition from octahedral O-coordinated to tetrahedral Cl-coordinated complexes, increasing pressure inhibits this transition. At 1.95 GPa, the high pressure leads to higher fluid density, which strengthens the hydrogen bond network, favors higher coordination of dissolved ions, promotes extensive hydration, and decreases ion association. Consequently, despite the elevated temperature (200 °C) and salinity (1 m Cl), the octahedral hydrated Zn(H2O)6 complex remains the dominant species (71%).
Reasoning source: Discussion section, pages 21-22 (lines 478-486, 511-514)
Scoring Rubric (total: 100 pts)
| Q | Type | Max | Question | Reference Answer | Scoring Criteria |
|---|---|---|---|---|---|
| q1 | identification | 33 | What candidate reference spectra (endmembers) are required to model the Zn K-edge XANES spectrum of this hydrothermal fluid using linear combination fitting? | To model the Zn K-edge XANES spectrum of this hydrothermal fluid using linear combination fitting, the required reference spectra are octahedral Zn(H2O)6 and tetrahedral ZnCl4. These specific endmembers are expected because the sample is an aqueous Zn solution containing 1 m Cl at an elevated temperature of 200 °C and high pressure of 1.95 GPa. While the elevated temperature and salinity drive the formation of tetrahedral Cl-coordinated complexes (ZnCl4), the extreme pressure of 1.95 GPa increases fluid density and strengthens the hydrogen bond network. This high-pressure environment promotes extensive hydration and favors higher coordination states, necessitating the octahedral hydrated Zn(H2O)6 endmember to accurately model the fluid's composition. | Full points for identifying both octahedral Zn(H2O)6 and tetrahedral ZnCl4 as the necessary endmembers. |
| q2 | quantification | 67 | Based on the provided conditions (1.95 GPa, 200 °C, 1 m Cl), estimate the relative fractions of the Zn aqueous species present in the fluid. | Based on the provided conditions, the relative fractions of the Zn aqueous species in the fluid are 0.71 (71%) for octahedral Zn(H2O)6 and 0.29 (29%) for tetrahedral ZnCl4. These specific values result from the competing effects of temperature, salinity, and pressure on the fluid's structure. Although the 200 °C temperature and 1 m Cl salinity generally favor a transition toward tetrahedral Cl-coordinated complexes, the high pressure of 1.95 GPa strongly inhibits this transition. The elevated pressure leads to a higher fluid density that strengthens the hydrogen bond network, promotes extensive hydration, and decreases ion association, ensuring that the octahedral hydrated Zn(H2O)6 complex remains the dominant species at 71%. | Full points for estimating ~71% Zn(H2O)6 and ~29% ZnCl4. Partial credit for identifying that the octahedral hydrated species is dominant but with less accurate percentages. |
Review
#339
hydrothermal fluid
Zn K
▶
LLM Prompt
Sample Information
Material: hydrothermal fluid
Sample Origin: synthetic
Sample-Specific Conditions
- Pressure, Temperature, Salinity: 0.58 GPa, 25 °C, 4 m Cl
- Zn in aqueous solution with 4 m Cl at 0.58 GPa and 25 °C
Measurement
We plan to measure the Zn K XANES spectrum of this sample.
Questions
Based on all the information above:
1. What candidate reference spectra (endmembers) are required to model the Zn speciation in this high-pressure, high-salinity fluid using linear combination fitting?
2. Based on the provided conditions (0.58 GPa, 25 °C, 4 m Cl), estimate the relative fractions of the Zn aqueous complexes present in the fluid.
Ground Truth
Material: hydrothermal fluid
Measurement: Zn K-edge XANES in fluorescence geometry
Fit method: LCF
Phase fractions:
| Phase | Fraction |
|---|---|
| Zn(H2O)6 | 0.84 |
| ZnCl4 | 0.16 |
Fit basis (paper's reference spectra):
- octahedral Zn(H2O)6
- tetrahedral ZnCl4
Source evidence: Table 3, page 19
Key reasoning: At 0.58 GPa and 25 °C in the 4 m Cl solution, Zn is predominantly found in octahedral coordination (84% Zn(H2O)6) despite the high salinity. Increasing pressure inhibits the transition from octahedral O-coordinated to tetrahedral Cl-coordinated complexes that is typically seen at lower pressures. This inhibition occurs because higher pressure increases fluid density, which strengthens the hydrogen bond network, favors higher coordination of dissolved ions, promotes extensive hydration, and decreases ion association.
Reasoning source: Discussion section, pages 21-22 (lines 478-484, 511-514)
Scoring Rubric (total: 100 pts)
| Q | Type | Max | Question | Reference Answer | Scoring Criteria |
|---|---|---|---|---|---|
| q1 | identification | 33 | What candidate reference spectra (endmembers) are required to model the Zn speciation in this high-pressure, high-salinity fluid using linear combination fitting? | To model the Zn speciation in this fluid using linear combination fitting, the required reference spectra are octahedral Zn(H2O)6 and tetrahedral ZnCl4. These specific endmembers are necessary because the sample conditions of 0.58 GPa and 25 °C in a 4 m Cl solution create a competition between hydration and chloride complexation. The high pressure increases fluid density, which strengthens the hydrogen bond network, favors higher coordination of dissolved ions, and promotes extensive hydration. Consequently, this inhibits the transition from octahedral O-coordinated complexes to tetrahedral Cl-coordinated complexes, requiring both phases to accurately capture the mixed speciation. | Full points if the answer identifies both octahedral hydrated Zn (e.g., Zn(H2O)6) and tetrahedral chlorinated Zn (e.g., ZnCl4) as the necessary endmembers. |
| q2 | quantification | 67 | Based on the provided conditions (0.58 GPa, 25 °C, 4 m Cl), estimate the relative fractions of the Zn aqueous complexes present in the fluid. | Based on the sample conditions, the estimated relative fractions are 0.84 (84%) for octahedral Zn(H2O)6 and 0.16 (16%) for tetrahedral ZnCl4. These specific values result from the application of high pressure (0.58 GPa) at 25 °C in the 4 m Cl solution, which predominantly stabilizes the hydrated octahedral complex despite the high salinity. The elevated pressure increases the fluid density and strengthens the hydrogen bond network, which favors higher coordination and extensive hydration of the dissolved ions. This mechanism decreases ion association and inhibits the transition to tetrahedral Cl-coordinated complexes, resulting in a fluid heavily dominated by Zn(H2O)6. | Full points if the estimated fractions are within ±10% of 0.84 for Zn(H2O)6 and 0.16 for ZnCl4. Partial credit for correctly identifying that the octahedral hydrated species is highly dominant (>80%) over the tetrahedral chloride species. |
Review
#340
hydrothermal fluid
Zn K
▶
LLM Prompt
Sample Information
Material: hydrothermal fluid
Sample Origin: synthetic
Sample-Specific Conditions
- Pressure, Temperature, Salinity: 1.06 GPa, 200 °C, 4 m Cl
- Zn in aqueous solution with 4 m Cl at 1.06 GPa and 200 °C
Measurement
We plan to measure the Zn K XANES spectrum of this sample.
Questions
Based on all the information above:
1. Based on the provided conditions (1.06 GPa, 200 °C, 4 m Cl), what are the expected Zn aqueous species and their approximate relative fractions?
2. What reference spectra or basis functions are required to perform a Linear Combination Fitting (LCF) analysis of the XANES spectrum for this sample?
3. Explain the competing physical and chemical effects of temperature, salinity, and pressure that lead to the observed Zn speciation in this hydrothermal fluid.
Ground Truth
Material: hydrothermal fluid
Measurement: Zn K-edge XANES, fluorescence mode, I20-EDE beamline at Diamond Light Source
Fit method: Linear combination fitting (LCF)
Phase fractions:
| Phase | Fraction |
|---|---|
| Zn(H2O)6 | 0.23 |
| ZnCl4 | 0.77 |
Fit basis (paper's reference spectra):
- octahedral Zn(H2O)6
- tetrahedral ZnCl4
Source evidence: Table 3, page 19
Key reasoning: Increasing salinity and temperature lower the dielectric permittivity of the solvent, favoring ion association and the formation of tetrahedral Cl-coordinated complexes like ZnCl4. Conversely, increasing pressure increases fluid density and strengthens the hydrogen bond network, which favors higher coordination and extensive hydration (octahedral Zn(H2O)6). At 1.06 GPa and 200 °C in a 4 m Cl solution, these competing effects result in a mixture dominated by tetrahedral ZnCl4 (77%) with a significant remaining fraction of octahedral Zn(H2O)6 (23%).
Reasoning source: Discussion section, pages 21-22
Scoring Rubric (total: 100 pts)
| Q | Type | Max | Question | Reference Answer | Scoring Criteria |
|---|---|---|---|---|---|
| q1 | quantification | 30 | Based on the provided conditions (1.06 GPa, 200 °C, 4 m Cl), what are the expected Zn aqueous species and their approximate relative fractions? | The expected Zn aqueous species in this hydrothermal fluid are tetrahedral ZnCl4 at a relative fraction of 0.77 (77%) and octahedral Zn(H2O)6 at a fraction of 0.23 (23%). These specific values result from the competing effects of the sample conditions. The elevated temperature (200 °C) and high salinity (4 m Cl) lower the dielectric permittivity of the solvent, strongly favoring ion association and the formation of the dominant tetrahedral ZnCl4 complex. However, the high pressure (1.06 GPa) increases fluid density and strengthens the hydrogen bond network, which favors higher coordination and extensive hydration, thereby maintaining the 23% fraction of octahedral Zn(H2O)6. | Identify ZnCl4 (tetrahedral) as the dominant phase (~75-80%) and Zn(H2O)6 (octahedral) as the minor phase (~20-25%). |
| q2 | identification | 30 | What reference spectra or basis functions are required to perform a Linear Combination Fitting (LCF) analysis of the XANES spectrum for this sample? | To perform a Linear Combination Fitting (LCF) analysis of the XANES spectrum for this sample, reference spectra for octahedral Zn(H2O)6 and tetrahedral ZnCl4 are required as basis functions. These specific phases are expected because the sample conditions of 1.06 GPa, 200 °C, and 4 m Cl create competing physicochemical effects in the fluid. The 200 °C temperature and 4 m Cl salinity lower the solvent's dielectric permittivity, driving the formation of tetrahedral ZnCl4. Simultaneously, the high pressure of 1.06 GPa increases fluid density and strengthens the hydrogen bond network, which stabilizes the higher-coordination octahedral Zn(H2O)6 phase. | Must identify octahedral Zn(H2O)6 (fully hydrated) and tetrahedral ZnCl4 (fully chlorinated) as the necessary endmembers. |
| q3 | reasoning | 40 | Explain the competing physical and chemical effects of temperature, salinity, and pressure that lead to the observed Zn speciation in this hydrothermal fluid. | The observed Zn speciation in this synthetic hydrothermal fluid is the result of competing physical and chemical effects induced by the specific sample conditions. Increasing the temperature to 200 °C and the salinity to 4 m Cl lowers the dielectric permittivity of the solvent, which favors ion association and drives the formation of tetrahedral Cl-coordinated complexes, resulting in a 77% fraction of ZnCl4. Conversely, the high pressure of 1.06 GPa increases the fluid density and strengthens the hydrogen bond network. This pressure-induced effect favors higher coordination and extensive hydration, which explains why a 23% fraction of octahedral Zn(H2O)6 persists in the mixture. | Must mention that high temperature and salinity lower the dielectric permittivity, favoring tetrahedral Cl-coordinated complexes (ZnCl4). Must also explain that high pressure opposes this by increasing fluid density and strengthening the hydrogen bond network, thereby stabilizing octahedral hydrated complexes (Zn(H2O)6). |
Review
#341
hydrothermal fluid
Zn K
▶
LLM Prompt
Sample Information
Material: hydrothermal fluid
Sample Origin: synthetic
Sample-Specific Conditions
- Pressure, Temperature, Salinity: 1.68 GPa, 300 °C, 4 m Cl
- Zn in aqueous solution with 4 m Cl at 1.68 GPa and 300 °C
Measurement
We plan to measure the Zn K XANES spectrum of this sample.
Questions
Based on all the information above:
1. Based on the provided sample conditions (Zn in aqueous solution with 4 m Cl at 1.68 GPa and 300 °C), what candidate reference spectra (endmembers) are required to model the Zn K-edge XANES spectrum using linear combination fitting?
2. Estimate the relative fractions of the Zn aqueous complexes present in this highly saline fluid at 1.68 GPa and 300 °C.
3. Explain the physical and chemical reasoning for the observed distribution of Zn complexes at these specific conditions, specifically addressing how the competing effects of high temperature, high salinity (4 m Cl), and high pressure (1.68 GPa) influence the coordination environment.
Ground Truth
Material: hydrothermal fluid
Measurement: Zn K-edge XANES in fluorescence geometry at beamline I20-EDE
Fit method: Linear combination fitting (LCF)
Phase fractions:
| Phase | Fraction |
|---|---|
| Zn(H2O)6 | 0.18 |
| ZnCl4 | 0.82 |
Fit basis (paper's reference spectra):
- octahedral Zn(H2O)6
- tetrahedral ZnCl4
Source evidence: Table 3, page 19
Key reasoning: Increasing salinity and temperature strongly favor the transition from octahedral O-coordinated to tetrahedral Cl-coordinated complexes, making the tetrahedral ZnCl4 complex dominant (82%) in this 4 m Cl solution at 300 °C. However, increasing pressure partially inhibits this transition because higher pressure leads to higher fluid density, strengthening of the hydrogen bond network, and favors higher coordination and extensive hydration of dissolved ions. Consequently, a minor fraction (18%) of the denser octahedral Zn(H2O)6 complex persists even at these elevated temperatures and salinities due to the high pressure (1.68 GPa).
Reasoning source: Discussion section, pages 21-22 (lines 478-486, 511-514)
Scoring Rubric (total: 100 pts)
| Q | Type | Max | Question | Reference Answer | Scoring Criteria |
|---|---|---|---|---|---|
| q1 | identification | 20 | Based on the provided sample conditions (Zn in aqueous solution with 4 m Cl at 1.68 GPa and 300 °C), what candidate reference spectra (endmembers) are required to model the Zn K-edge XANES spectrum using linear combination fitting? | To model the Zn K-edge XANES spectrum of this sample using linear combination fitting, the required reference spectra are octahedral Zn(H2O)6 and tetrahedral ZnCl4. These specific endmembers are expected because the high temperature (300 °C) and high salinity (4 m Cl) of the hydrothermal fluid strongly drive a transition from octahedral oxygen-coordinated complexes to tetrahedral chlorine-coordinated complexes. However, the extreme pressure (1.68 GPa) increases fluid density and strengthens the hydrogen bond network, which favors higher coordination and extensive hydration. Consequently, both the tetrahedral ZnCl4 phase and the denser octahedral Zn(H2O)6 phase must be included to capture the competing effects of temperature, salinity, and pressure. | Full points for identifying both octahedral hydrated Zn (e.g., Zn(H2O)6) and tetrahedral chlorinated Zn (e.g., ZnCl4) as the necessary endmembers. |
| q2 | quantification | 40 | Estimate the relative fractions of the Zn aqueous complexes present in this highly saline fluid at 1.68 GPa and 300 °C. | The relative fractions of the Zn aqueous complexes in this hydrothermal fluid are 82% tetrahedral ZnCl4 and 18% octahedral Zn(H2O)6. These specific values result from the competing effects of the sample conditions on the coordination environment. The high temperature (300 °C) and high salinity (4 m Cl) strongly favor the transition to tetrahedral Cl-coordinated complexes, making ZnCl4 the dominant species at 82%. Conversely, the high pressure of 1.68 GPa partially inhibits this transition by increasing fluid density and favoring higher coordination and hydration, which allows a minor 18% fraction of the denser octahedral Zn(H2O)6 complex to persist. | Full points for estimating ~82% tetrahedral ZnCl4 and ~18% octahedral Zn(H2O)6. Partial points for correctly identifying that the tetrahedral chloride complex is highly dominant but a minor fraction of the octahedral hydrated complex remains. |
| q3 | reasoning | 40 | Explain the physical and chemical reasoning for the observed distribution of Zn complexes at these specific conditions, specifically addressing how the competing effects of high temperature, high salinity (4 m Cl), and high pressure (1.68 GPa) influence the coordination environment. | The observed distribution of 82% tetrahedral ZnCl4 and 18% octahedral Zn(H2O)6 is dictated by the competing thermodynamic effects of the sample conditions. Increasing the temperature to 300 °C and salinity to 4 m Cl strongly favors the transition from octahedral O-coordinated complexes to tetrahedral Cl-coordinated complexes, driving the dominance of ZnCl4. However, the application of high pressure (1.68 GPa) leads to higher fluid density and a strengthening of the hydrogen bond network. This pressure effect favors higher coordination and extensive hydration of dissolved ions, partially inhibiting the transition and allowing the denser octahedral Zn(H2O)6 complex to persist as a minor fraction despite the elevated temperature and salinity. | Full points for explaining that high temperature and salinity drive the transition to tetrahedral ZnCl4 (due to lower dielectric permittivity/disrupted hydrogen bonding), while high pressure counteracts this by increasing fluid density and stabilizing the higher-coordination, hydrated octahedral Zn(H2O)6 complex, explaining why a mixture of both exists. |
Review
#342
hydrothermal fluid
Zn K
▶
LLM Prompt
Sample Information
Material: hydrothermal fluid
Sample Origin: synthetic
Sample-Specific Conditions
- Pressure, Temperature, Salinity: 1.96 GPa, 400 °C, 4 m Cl
- Zn in aqueous solution with 4 m Cl at 1.96 GPa and 400 °C
Measurement
We plan to measure the Zn K XANES spectrum of this sample.
Questions
Based on all the information above:
1. What Zn complex dominates the speciation in this highly saline (4 m Cl) hydrothermal fluid at 400 °C and 1.96 GPa, and what physical properties of the fluid at these high temperatures drive this specific coordination?
2. How do the Zn K-edge position (E0) and white line position of this sample compare to those of a fully hydrated octahedral Zn complex at ambient conditions?
3. If performing a linear combination fitting (LCF) analysis to track the structural evolution of this sample from ambient conditions up to 400 °C, what reference spectra (endmembers) should be included in the fit basis?
Ground Truth
Material: hydrothermal fluid
Measurement: Zn K-edge XANES in fluorescence geometry at beamline I20-EDE
Fit method: Linear combination fitting (LCF)
Phase fractions:
| Phase | Fraction |
|---|---|
| ZnCl4 | 1.0 |
| Zn(H2O)6 | 0.0 |
Fit basis (paper's reference spectra):
- octahedral Zn(H2O)6
- tetrahedral ZnCl4
Source evidence: Table 3, page 19; Figure 4 and 5
Key reasoning: At 400 °C and 1.96 GPa in a highly saline 4 m Cl solution, Zn speciation is completely dominated by the tetrahedral ZnCl4 complex. Increasing temperature lowers the fluid density, disrupts the hydrogen bond network, and enhances ion-ion (Zn-Cl) interactions, which favors lower coordination numbers and ion association. The high salinity provides abundant chloride to fully coordinate the zinc, overcoming the pressure-induced tendency to maintain octahedral hydration.
Reasoning source: Discussion section (Effect of salinity, pressure, and temperature on smithsonite solubility and Zn aqueous behaviour), pages 22-23; Results section (Zn complexation), page 18
Scoring Rubric (total: 100 pts)
| Q | Type | Max | Question | Reference Answer | Scoring Criteria |
|---|---|---|---|---|---|
| q1 | reasoning | 35 | What Zn complex dominates the speciation in this highly saline (4 m Cl) hydrothermal fluid at 400 °C and 1.96 GPa, and what physical properties of the fluid at these high temperatures drive this specific coordination? | In this highly saline (4 m Cl) hydrothermal fluid at 400 °C and 1.96 GPa, the speciation is completely dominated by the tetrahedral [ZnCl4]2- aqueous complex, which accounts for a fraction of 1.0. This specific coordination is driven by the high temperature, which lowers the fluid density and disrupts the hydrogen bond network of the water. These physical changes enhance ion-ion (Zn-Cl) interactions and favor lower coordination numbers, while the high salinity provides abundant chloride to fully coordinate the zinc, overcoming the pressure-induced tendency to maintain octahedral hydration. | Full credit requires identifying the tetrahedral ZnCl4 complex as the sole/dominant phase (fraction 1.0) and explaining that high temperatures lower fluid density, disrupt the hydrogen bond network, and enhance ion-ion (Zn-Cl) interactions, favoring lower coordination. |
| q2 | spectral | 35 | How do the Zn K-edge position (E0) and white line position of this sample compare to those of a fully hydrated octahedral Zn complex at ambient conditions? | The Zn K-edge position (E0) of this sample is located at 9662.2 eV, and the white line is positioned at ~9665 eV. Compared to the fully hydrated octahedral Zn complex, this represents a ~2 eV shift of the absorption edge to lower energies (down from ~9664.4 eV) and a corresponding shift of the white line toward lower energy. These spectral shifts occur because the extreme sample conditions (400 °C, 1.96 GPa, 4 m Cl) completely alter the zinc speciation from an octahedral hydrate to a tetrahedral [ZnCl4]2- complex. The high temperature lowers fluid density and disrupts hydrogen bonding, which, combined with the high chloride concentration, promotes strong Zn-Cl ion association and a lower coordination number that dictates these lower-energy spectral features. | Full credit requires mentioning the ~2 eV shift of the absorption edge to lower energies (specifically to 9662.2 eV) and the shift of the white line to lower energy (~9665 eV) relative to the octahedral endmember. |
| q3 | identification | 30 | If performing a linear combination fitting (LCF) analysis to track the structural evolution of this sample from ambient conditions up to 400 °C, what reference spectra (endmembers) should be included in the fit basis? | To track the structural evolution of this sample, the linear combination fitting (LCF) basis should include reference spectra for octahedral Zn(H2O)6 and tetrahedral ZnCl4. At the final sample conditions of 400 °C and 1.96 GPa, the LCF analysis will yield a fraction of 1.0 for ZnCl4 and 0.0 for Zn(H2O)6. These specific phases are expected because the high temperature lowers the fluid density and disrupts the hydrogen bond network, which enhances Zn-Cl interactions and favors a lower coordination number. Consequently, the abundant chloride from the 4 m Cl salinity fully coordinates the zinc, driving a complete structural transition from the octahedral hydrated endmember to the tetrahedral chloride endmember. | Full credit requires identifying both the octahedral Zn(H2O)6 and tetrahedral ZnCl4 reference spectra as the necessary endmembers for the LCF basis. |
Review
Mechanisms leading to exceptional niobium concentration during lateritic weathering: The key role of secondary oxides
ESRF-BM23
Environmental
Quentin Bollaert et al.
DOI: 10.1016/j.chemgeo.2023.121767
7 scenarios
▶
#343
laterite
Nb K-edge
▶
LLM Prompt
Sample Information
Material: laterite
Sample Origin: Morro dos Seis Lagos, Amazonas, Brazil
Sample-Specific Conditions
- weathering horizon: Pisolitic laterite
- Uppermost reworked lateritic horizon
Measurement
We plan to measure the Nb K-edge XANES spectrum of this sample.
Questions
Based on all the information above:
1. What candidate reference spectra are needed to model the Nb K-edge XANES spectrum of this pisolitic laterite sample using linear combination fitting?
2. Based on the intense supergene weathering and reworking in the uppermost pisolitic laterite horizon, estimate the relative phase fractions of the Nb-bearing species.
Ground Truth
Material: laterite
Measurement: Nb K-edge XANES in fluorescence-yield step-by-step mode at BM23 beamline
Fit method: Least-squares linear combination fitting (LCF)
Phase fractions: (±3%)
| Phase | Fraction |
|---|---|
| Ba-bearing kenopyrochlore | 0.1 |
| Nb-bearing rutile (micro-focused) | 0.3 |
| Nb-bearing brookite (micro-focused) | 0.1 |
| Nb-bearing goethite | 0.35 |
| Nb-bearing hematite | 0.15 |
Fit basis (paper's reference spectra):
- Ba-bearing kenopyrochlore
- Nb-bearing rutile (micro-focused)
- Nb-bearing brookite (micro-focused)
- Nb-bearing goethite
- Nb-bearing hematite
- Nb-bearing cerianite
Source evidence: Figure 13c and Section 3.4
Key reasoning: In the uppermost pisolitic laterite, intense supergene weathering and physical/chemical reworking lead to almost complete dissolution of primary pyrochlore. The released Nb is scavenged by secondary oxides. Rutile and brookite together contribute to about 40% of the Nb speciation, as the formation of Ti oxides in the upper horizons leads to preferential scavenging of Nb by Ti oxides over Fe oxides. Nb-bearing Fe oxides (goethite and hematite) account for the remaining 50% of the speciation.
Reasoning source: Section 3.4 and Section 4.2
Scoring Rubric (total: 100 pts)
| Q | Type | Max | Question | Reference Answer | Scoring Criteria |
|---|---|---|---|---|---|
| q1 | identification | 33 | What candidate reference spectra are needed to model the Nb K-edge XANES spectrum of this pisolitic laterite sample using linear combination fitting? | To model the Nb K-edge XANES spectrum of this sample, the required candidate reference spectra are Ba-bearing kenopyrochlore, Nb-bearing rutile (micro-focused), Nb-bearing brookite (micro-focused), Nb-bearing goethite, Nb-bearing hematite, and Nb-bearing cerianite. These specific phases are expected because the sample originates from the uppermost reworked pisolitic laterite horizon, which has undergone intense supergene weathering and physical/chemical reworking. This extreme weathering environment leads to the almost complete dissolution of primary pyrochlore, leaving only residual amounts. The released Nb is subsequently scavenged by secondary oxides, necessitating the inclusion of secondary Ti oxides (rutile and brookite) and Fe oxides (goethite and hematite) in the fitting basis. | Full points for identifying Ba-bearing kenopyrochlore, Nb-bearing rutile, Nb-bearing brookite, Nb-bearing goethite, and Nb-bearing hematite as the necessary basis spectra. |
| q2 | quantification | 67 | Based on the intense supergene weathering and reworking in the uppermost pisolitic laterite horizon, estimate the relative phase fractions of the Nb-bearing species. | The estimated relative phase fractions for this sample are 35% Nb-bearing goethite, 30% Nb-bearing rutile (micro-focused), 15% Nb-bearing hematite, 10% Nb-bearing brookite (micro-focused), and 10% Ba-bearing kenopyrochlore. These specific values result from the intense supergene weathering and physical/chemical reworking in the uppermost pisolitic laterite horizon, which causes the almost complete dissolution of primary pyrochlore, reducing its fraction to just 10%. The released Nb is scavenged by secondary oxides, with Ti oxides (rutile and brookite) forming in the upper horizons and preferentially scavenging Nb to account for 40% of the total speciation. The remaining 50% of the Nb speciation is captured by the secondary Fe oxides, goethite and hematite. | Full points for estimating approximately 10% pyrochlore, 40% Ti oxides (30% rutile, 10% brookite), and 50% Fe oxides (35% goethite, 15% hematite). Partial credit for grouping Ti oxides and Fe oxides correctly. |
Review
#344
laterite
Nb K-edge
▶
LLM Prompt
Sample Information
Material: laterite
Sample Origin: Morro dos Seis Lagos, Amazonas, Brazil
Sample-Specific Conditions
- weathering horizon: Fragmented laterite
- Reworked lateritic horizon
Measurement
We plan to measure the Nb K-edge XANES spectrum of this sample.
Questions
Based on all the information above:
1. What candidate reference spectra are needed to model the Nb K-edge XANES spectrum of this highly weathered, reworked fragmented laterite using linear combination fitting?
2. Based on the environmental conditions (advanced stage of weathering, reworked lateritic horizon), estimate the relative phase fractions of the Nb-bearing species in this sample.
Ground Truth
Material: laterite
Measurement: Nb K-edge XANES, fluorescence-yield mode, BM23 beamline at ESRF
Fit method: Least-squares linear combination fitting (LCF)
Phase fractions: (±3%)
| Phase | Fraction |
|---|---|
| Ba-bearing kenopyrochlore | 0.08 |
| Nb-bearing rutile (micro-focused) | 0.42 |
| Nb-bearing brookite (micro-focused) | 0.1 |
| Nb-bearing goethite | 0.35 |
| Nb-bearing hematite | 0.05 |
Fit basis (paper's reference spectra):
- Ba-bearing kenopyrochlore
- Nb-bearing rutile (micro-focused)
- Nb-bearing brookite (micro-focused)
- Nb-bearing goethite
- Nb-bearing hematite
- Nb-bearing cerianite
Source evidence: Figure 13c and Section 3.4
Key reasoning: The fragmented laterite represents an advanced stage of weathering resulting from the reworking of an earlier laterite. Intense supergene weathering leads to the nearly complete alteration of primary pyrochlore, releasing Nb5+ into supergene fluids. In this upper horizon, secondary Ti oxides (rutile and brookite) precipitate and preferentially scavenge Nb, accounting for about half of the Nb speciation. The remaining Nb is incorporated into secondary Fe oxides, predominantly goethite, due to its higher capacity to accommodate Nb5+ compared to hematite.
Reasoning source: Section 3.4, Section 4.1, Section 4.2, and Section 4.4.2
Scoring Rubric (total: 100 pts)
| Q | Type | Max | Question | Reference Answer | Scoring Criteria |
|---|---|---|---|---|---|
| q1 | identification | 33 | What candidate reference spectra are needed to model the Nb K-edge XANES spectrum of this highly weathered, reworked fragmented laterite using linear combination fitting? | To model the Nb K-edge XANES spectrum of this sample using linear combination fitting, the required reference spectra are Ba-bearing kenopyrochlore, Nb-bearing rutile (micro-focused), Nb-bearing brookite (micro-focused), Nb-bearing goethite, Nb-bearing hematite, and Nb-bearing cerianite. These specific phases are necessary because the fragmented laterite represents an advanced stage of weathering resulting from the reworking of an earlier lateritic horizon. Under these intense supergene weathering conditions, primary pyrochlore is nearly completely altered, releasing Nb5+ into supergene fluids. Consequently, the released Nb is scavenged by precipitating secondary Ti oxides (rutile and brookite) and secondary Fe oxides (goethite and hematite) in this upper horizon, necessitating these specific reference standards to capture the resulting Nb speciation. | Full points for identifying primary residual phases (pyrochlore/kenopyrochlore), secondary Ti oxides (rutile, brookite), and secondary Fe oxides (goethite, hematite). |
| q2 | quantification | 67 | Based on the environmental conditions (advanced stage of weathering, reworked lateritic horizon), estimate the relative phase fractions of the Nb-bearing species in this sample. | The estimated relative phase fractions for this fragmented laterite sample are 42% Nb-bearing rutile, 35% Nb-bearing goethite, 10% Nb-bearing brookite, 8% Ba-bearing kenopyrochlore, and 5% Nb-bearing hematite, with an uncertainty of 3%. These specific values arise because the intense supergene weathering and reworking of the lateritic horizon lead to the nearly complete alteration of primary pyrochlore, leaving only a small residual fraction (8%). As Nb5+ is released into supergene fluids, precipitating secondary Ti oxides (rutile and brookite) preferentially scavenge the element, accounting for roughly half (52% total) of the Nb speciation. The remaining Nb is incorporated into secondary Fe oxides, with goethite (35%) dominating over hematite (5%) due to its higher capacity to accommodate Nb5+ in this advanced weathering environment. | Full points if the estimated fractions are within ±5% of the ground truth (Rutile ~42%, Goethite ~35%, Brookite ~10%, Kenopyrochlore ~8%, Hematite ~5%). Partial credit for correctly identifying that secondary Ti and Fe oxides dominate over residual pyrochlore. |
Review
#345
laterite
Nb K-edge
▶
LLM Prompt
Sample Information
Material: laterite
Sample Origin: Morro dos Seis Lagos, Amazonas, Brazil
Sample-Specific Conditions
- weathering horizon: Upper purple laterite
- Weathered lateritic horizon
Measurement
We plan to measure the Nb K-edge XANES spectrum of this sample.
Questions
Based on all the information above:
1. What candidate reference spectra are needed to model the Nb K-edge XANES spectrum of this upper purple laterite sample using linear combination fitting?
2. Based on the environmental conditions (intense supergene weathering, mid-upper profile of a laterite), estimate the relative phase fractions of the Nb-bearing species in this sample.
3. Explain the geochemical reasoning for the observed Nb speciation in this upper purple laterite horizon. Why do these specific secondary phases dominate the Nb host inventory, and what happens to the primary Nb hosts?
Ground Truth
Material: laterite
Measurement: Nb K-edge XANES, fluorescence-yield step-by-step mode, BM23 beamline
Fit method: Least-squares linear combination fitting (LCF)
Phase fractions: (±3%)
| Phase | Fraction |
|---|---|
| Ba-bearing kenopyrochlore | 0.25 |
| Nb-bearing rutile (micro-focused) | 0.25 |
| Nb-bearing brookite (micro-focused) | 0.15 |
| Nb-bearing goethite | 0.3 |
| Nb-bearing cerianite | 0.05 |
Fit basis (paper's reference spectra):
- Ba-bearing kenopyrochlore
- Nb-bearing rutile (micro-focused)
- Nb-bearing brookite (micro-focused)
- Nb-bearing goethite
- Nb-bearing hematite
- Nb-bearing cerianite
Source evidence: Figure 13 and Section 3.4
Key reasoning: In the upper purple laterite horizon, intense supergene weathering leads to the alteration of primary pyrochlore and the release of Nb. The released Nb is scavenged by secondary oxides. The formation of Ti oxides (rutile and brookite) in this horizon leads to a significant contribution of Ti oxides to Nb speciation, as Nb is preferentially scavenged by Ti oxides over Fe oxides when both coexist. Goethite also incorporates a substantial amount of Nb due to its crystal-chemical capacity to substitute Fe3+ for Nb5+. A residual fraction of primary pyrochlore remains.
Reasoning source: Section 3.4 (Evolution of the average niobium speciation) and Section 4.2 (Evidence of niobium leaching and trapping during weathering)
Scoring Rubric (total: 100 pts)
| Q | Type | Max | Question | Reference Answer | Scoring Criteria |
|---|---|---|---|---|---|
| q1 | identification | 20 | What candidate reference spectra are needed to model the Nb K-edge XANES spectrum of this upper purple laterite sample using linear combination fitting? | To model the Nb K-edge XANES spectrum of this upper purple laterite sample using linear combination fitting, the required reference spectra are Ba-bearing kenopyrochlore, Nb-bearing rutile, Nb-bearing brookite, Nb-bearing goethite, Nb-bearing hematite, and Nb-bearing cerianite. These specific phases are expected because the intense supergene weathering in this horizon alters primary pyrochlore, releasing Nb that is subsequently scavenged by secondary oxides. Ti oxides (rutile and brookite) form in this weathered horizon and preferentially scavenge Nb, while goethite incorporates Nb through the substitution of Fe3+ for Nb5+. Additionally, a residual fraction of the primary Ba-bearing kenopyrochlore remains despite the intense weathering conditions. | Full credit for identifying the necessary basis components: a primary pyrochlore phase (e.g., Ba-bearing kenopyrochlore), secondary Ti oxides (rutile and brookite), secondary Fe oxides (goethite, hematite), and cerianite. |
| q2 | quantification | 40 | Based on the environmental conditions (intense supergene weathering, mid-upper profile of a laterite), estimate the relative phase fractions of the Nb-bearing species in this sample. | The estimated relative phase fractions for this sample are 30% Nb-bearing goethite, 25% Nb-bearing rutile, 25% Ba-bearing kenopyrochlore, 15% Nb-bearing brookite, and 5% Nb-bearing cerianite, with an uncertainty of 3%. These specific values result from the intense supergene weathering conditions of the upper purple laterite horizon, which cause the alteration of primary pyrochlore and the release of Nb. The high combined fraction of Ti oxides (40% rutile and brookite) occurs because Nb is preferentially scavenged by Ti oxides over Fe oxides when both coexist in the weathered profile. Goethite also accounts for a major fraction (30%) due to its high crystal-chemical capacity to substitute Fe3+ for Nb5+, while 25% of the primary Ba-bearing kenopyrochlore remains as a residual phase. | Full credit for estimating fractions close to the ground truth: ~25% residual pyrochlore, ~40% total Ti oxides (split between rutile and brookite), ~30% goethite, and a minor fraction (~5%) of cerianite. Partial credit for correctly identifying that secondary oxides (Ti and Fe) dominate over the primary pyrochlore. |
| q3 | reasoning | 40 | Explain the geochemical reasoning for the observed Nb speciation in this upper purple laterite horizon. Why do these specific secondary phases dominate the Nb host inventory, and what happens to the primary Nb hosts? | In the upper purple laterite horizon, intense supergene weathering drives the alteration of primary Nb hosts like pyrochlore, releasing Nb into the environment. A residual fraction of this primary Ba-bearing kenopyrochlore survives the weathering process. The released Nb is then scavenged by newly formed secondary oxides, which dominate the inventory. Ti oxides, specifically rutile and brookite, capture a large portion of the Nb because Nb is preferentially scavenged by Ti oxides over Fe oxides when they coexist. Furthermore, Nb-bearing goethite forms as a dominant secondary host due to its strong crystal-chemical capacity to substitute Fe3+ for Nb5+ during the lateritization process. | Full credit for explaining that intense weathering alters primary pyrochlore, releasing Nb which is then scavenged by secondary oxides. Must mention that Nb is preferentially scavenged by newly formed Ti oxides (rutile and brookite) when they coexist with Fe oxides, while goethite still accommodates a significant portion due to its ability to substitute Fe3+ for Nb5+. |
Review
#346
laterite
Nb K-edge
▶
LLM Prompt
Sample Information
Material: laterite
Sample Origin: Morro dos Seis Lagos, Amazonas, Brazil
Sample-Specific Conditions
- weathering horizon: Manganiferous laterite
- Ferruginous horizon crosscut by Mn oxide veins
Measurement
We plan to measure the Nb K-edge XANES spectrum of this sample.
Questions
Based on all the information above:
1. Based on the sample conditions (manganiferous laterite consisting of a ferruginous horizon crosscut by Mn oxide veins), what candidate Nb-bearing reference spectra are needed to model the bulk Nb K-edge XANES spectrum using linear combination fitting?
2. Estimate the relative fractions of the Nb-bearing phases in this manganiferous laterite sample.
3. Explain the geochemical reasoning for the presence of these specific Nb hosts in the manganiferous laterite, particularly focusing on the conditions that lead to the formation of the minor Nb-bearing phase.
Ground Truth
Material: laterite
Measurement: Nb K-edge XANES in fluorescence-yield mode at BM23 beamline (ESRF)
Fit method: Least-squares linear combination fitting (LCF)
Phase fractions: (±3%)
| Phase | Fraction |
|---|---|
| Nb-bearing goethite | 0.71 |
| Nb-bearing hematite | 0.25 |
| Nb-bearing cerianite | 0.04 |
Fit basis (paper's reference spectra):
- Ba-bearing kenopyrochlore
- Nb-bearing rutile (micro-focused)
- Nb-bearing brookite (micro-focused)
- Nb-bearing goethite
- Nb-bearing hematite
- Nb-bearing cerianite
Source evidence: Figure 13c and Section 3.4 (page 36)
Key reasoning: In the manganiferous horizon, the abundance of Fe oxides leads to Nb being primarily scavenged by and incorporated into goethite and hematite. The presence of minor Nb-bearing cerianite (4%) indicates that a fraction of the Nb released from primary minerals was mobilized in veins along with mobile elements like Ce and Mn. This mobilization and subsequent precipitation of Ce/Mn oxides occurred under slightly alkaline conditions and high oxidation potential associated with the fluctuation zone of the water table.
Reasoning source: Section 3.4 (page 36) and Section 4.3 (pages 40-41)
Scoring Rubric (total: 100 pts)
| Q | Type | Max | Question | Reference Answer | Scoring Criteria |
|---|---|---|---|---|---|
| q1 | identification | 30 | Based on the sample conditions (manganiferous laterite consisting of a ferruginous horizon crosscut by Mn oxide veins), what candidate Nb-bearing reference spectra are needed to model the bulk Nb K-edge XANES spectrum using linear combination fitting? | To model the bulk Nb K-edge XANES spectrum of this sample, the required candidate reference spectra are Ba-bearing kenopyrochlore, Nb-bearing rutile (micro-focused), Nb-bearing brookite (micro-focused), Nb-bearing goethite, Nb-bearing hematite, and Nb-bearing cerianite. These specific phases are expected because the sample is a manganiferous laterite consisting of a ferruginous horizon crosscut by Mn oxide veins. The abundant Fe oxides in the ferruginous horizon scavenge and incorporate Nb, necessitating goethite and hematite references. Furthermore, the crosscutting veins indicate the mobilization of elements like Ce and Mn under high oxidation potential and slightly alkaline conditions, requiring the inclusion of Nb-bearing cerianite as a candidate phase. | Full points for identifying Nb-bearing goethite, Nb-bearing hematite, and Nb-bearing cerianite as the necessary reference spectra. |
| q2 | quantification | 30 | Estimate the relative fractions of the Nb-bearing phases in this manganiferous laterite sample. | The relative fractions of the Nb-bearing phases in this sample are 71% Nb-bearing goethite, 25% Nb-bearing hematite, and 4% Nb-bearing cerianite, with an uncertainty of 3%. These specific values result directly from the composition and weathering conditions of the manganiferous laterite horizon. The overwhelming dominance of goethite and hematite (combined 96%) occurs because the ferruginous nature of the horizon provides abundant Fe oxides that primarily scavenge the Nb. The minor 4% fraction of Nb-bearing cerianite arises because a small portion of the Nb was mobilized alongside Ce and Mn into the crosscutting veins under slightly alkaline conditions and high oxidation potential near the water table. | Full points for estimating goethite at ~71%, hematite at ~25%, and cerianite at ~4% (allow ±5% margin for the major phases). |
| q3 | reasoning | 40 | Explain the geochemical reasoning for the presence of these specific Nb hosts in the manganiferous laterite, particularly focusing on the conditions that lead to the formation of the minor Nb-bearing phase. | In this manganiferous laterite, the primary Nb hosts are goethite and hematite because the ferruginous horizon contains abundant Fe oxides that readily scavenge and incorporate Nb released from primary minerals. The minor presence of Nb-bearing cerianite is directly linked to the Mn oxide veins crosscutting the sample. This minor phase forms because a fraction of the Nb was mobilized along with mobile elements like Ce and Mn. The subsequent precipitation of these Ce/Mn oxides in the veins occurred due to slightly alkaline conditions and a high oxidation potential associated with the fluctuation zone of the water table. | Full points for explaining that the abundance of Fe oxides drives Nb into goethite and hematite, while the minor cerianite phase forms due to Nb mobilization with Ce/Mn in veins under slightly alkaline, highly oxidizing conditions near the water table. |
Review
#347
laterite
Nb K-edge
▶
LLM Prompt
Sample Information
Material: laterite
Sample Origin: Morro dos Seis Lagos, Amazonas, Brazil
Sample-Specific Conditions
- weathering horizon: Lower purple laterite
- Weathered lateritic horizon
Measurement
We plan to measure the Nb K-edge XANES spectrum of this sample.
Questions
Based on all the information above:
1. Based on the sample conditions (Lower purple laterite horizon), what are the expected Nb-bearing phases and their approximate fractions?
2. What reference spectra should be included in the basis set for a linear combination fitting analysis of Nb speciation across this lateritic profile?
3. Explain the geochemical reasoning for the observed Nb speciation in the lower purple laterite, particularly regarding its deviation from the general weathering trend of the profile.
Ground Truth
Material: laterite
Measurement: Nb K-edge XANES in fluorescence-yield mode at ESRF BM23
Fit method: Least-squares linear combination fitting (LCF)
Phase fractions: (±3%)
| Phase | Fraction |
|---|---|
| Ba-bearing kenopyrochlore | 0.45 |
| Nb-bearing goethite | 0.55 |
Fit basis (paper's reference spectra):
- Ba-bearing kenopyrochlore
- Nb-bearing rutile (micro-focused)
- Nb-bearing brookite (micro-focused)
- Nb-bearing goethite
- Nb-bearing hematite
- Nb-bearing cerianite
Source evidence: Figure 13c and Section 3.4, page 35
Key reasoning: In the lower purple horizon, Nb is mostly hosted in secondary goethite (55%), while a significant proportion of primary pyrochlore remains (45%). This horizon is an exception to the general weathering trend of progressively decreasing pyrochlore contribution towards the top of the profile, as it contains a greater proportion of pyrochlore than the less-weathered brown laterite underneath. The abundance of Fe oxides in these horizons results in Nb incorporation into goethite after its release from primary minerals.
Reasoning source: Section 3.4 and Section 4.2
Scoring Rubric (total: 100 pts)
| Q | Type | Max | Question | Reference Answer | Scoring Criteria |
|---|---|---|---|---|---|
| q1 | quantification | 40 | Based on the sample conditions (Lower purple laterite horizon), what are the expected Nb-bearing phases and their approximate fractions? | In the lower purple laterite horizon, the expected Nb-bearing phases are Nb-bearing goethite at approximately 55% and Ba-bearing kenopyrochlore at approximately 45%, with an uncertainty of 3%. These specific fractions result from the intense weathering conditions in this lateritic horizon, where an abundance of Fe oxides drives the incorporation of Nb into secondary goethite after its release from primary minerals. Despite this weathering, a significant 45% of primary pyrochlore remains intact. This specific distribution occurs because the lower purple horizon is an exception to the general weathering trend, retaining a greater proportion of primary pyrochlore than the less-weathered brown laterite located underneath it. | Full points for identifying Ba-bearing kenopyrochlore (or pyrochlore) and Nb-bearing goethite with fractions around 45% and 55%, respectively. Partial points for identifying the correct phases without accurate fractions. |
| q2 | identification | 30 | What reference spectra should be included in the basis set for a linear combination fitting analysis of Nb speciation across this lateritic profile? | The basis set for linear combination fitting (LCF) should include Ba-bearing kenopyrochlore, Nb-bearing rutile (micro-focused), Nb-bearing brookite (micro-focused), Nb-bearing goethite, Nb-bearing hematite, and Nb-bearing cerianite. These reference spectra are necessary because they represent the full suite of primary host minerals and secondary weathering products expected in the Morro dos Seis Lagos lateritic profile. Specifically for the lower purple laterite horizon, secondary Fe-oxide references like goethite are required because the abundance of Fe oxides in this layer leads to the capture of released Nb. Primary mineral references like Ba-bearing kenopyrochlore must also be included because this specific horizon anomalously retains a large proportion of primary pyrochlore despite the general weathering trend. | Full points for listing the key reference spectra used for the profile: Ba-bearing kenopyrochlore, Nb-bearing goethite, hematite, cerianite, Nb-bearing rutile, and Nb-bearing brookite. |
| q3 | reasoning | 30 | Explain the geochemical reasoning for the observed Nb speciation in the lower purple laterite, particularly regarding its deviation from the general weathering trend of the profile. | The Nb speciation in the lower purple laterite is dominated by secondary Nb-bearing goethite (55%) and primary Ba-bearing kenopyrochlore (45%). The formation of the secondary goethite phase occurs because the high abundance of Fe oxides in this weathered horizon readily incorporates Nb after it is released from the breakdown of primary minerals. However, this horizon deviates significantly from the general weathering trend, which typically shows a progressive decrease in pyrochlore contribution towards the top of the profile. This deviation arises because the lower purple horizon anomalously retains a greater proportion of unweathered primary pyrochlore than the less-weathered brown laterite situated directly beneath it. | Full points for explaining that while pyrochlore generally decreases towards the top of the profile due to weathering, the lower purple horizon is an exception with a higher pyrochlore fraction (45%) than the underlying brown laterite. Must also mention that the released Nb is primarily scavenged by goethite due to the abundance of Fe oxides in this horizon. |
Review
#348
laterite
Nb K-edge
▶
LLM Prompt
Sample Information
Material: laterite
Sample Origin: Morro dos Seis Lagos, Amazonas, Brazil
Sample-Specific Conditions
- weathering horizon: Brown laterite
- Least weathered lateritic horizon above carbonatite
Measurement
We plan to measure the Nb K-edge XANES spectrum of this sample.
Questions
Based on all the information above:
1. What candidate reference spectra should be considered for a linear combination fitting (LCF) analysis of Nb speciation in this lateritic weathering profile?
2. Estimate the quantitative phase fractions of the Nb hosts in this specific 'Brown laterite' horizon (the least weathered horizon above the carbonatite).
Ground Truth
Material: laterite
Measurement: Nb K-edge XANES, fluorescence-yield mode, BM23 beamline at ESRF
Fit method: Least-squares linear combination fitting (LCF)
Phase fractions: (±3%)
| Phase | Fraction |
|---|---|
| Ba-bearing kenopyrochlore | 0.25 |
| Nb-bearing goethite | 0.75 |
Fit basis (paper's reference spectra):
- Ba-bearing kenopyrochlore
- Nb-bearing rutile (micro-focused)
- Nb-bearing brookite (micro-focused)
- Nb-bearing goethite
- Nb-bearing hematite
- Nb-bearing cerianite
Source evidence: Figure 13, page 35
Key reasoning: In the least weathered brown laterite horizon, primary pyrochlore is partially altered but still contributes significantly (25%) to the average Nb speciation. The contribution of Ti oxides is low due to the alteration of primary Ti oxides and the limited precipitation of secondary Ti oxides at this stage. Consequently, the Nb released from the primary phases is primarily scavenged by the abundant Fe oxides, specifically goethite, which acts as the main secondary host.
Reasoning source: Section 4.2, pages 38-39
Scoring Rubric (total: 100 pts)
| Q | Type | Max | Question | Reference Answer | Scoring Criteria |
|---|---|---|---|---|---|
| q1 | identification | 50 | What candidate reference spectra should be considered for a linear combination fitting (LCF) analysis of Nb speciation in this lateritic weathering profile? | For the LCF analysis of Nb speciation in this lateritic weathering profile, the candidate reference spectra should include Ba-bearing kenopyrochlore, Nb-bearing rutile (micro-focused), Nb-bearing brookite (micro-focused), Nb-bearing goethite, Nb-bearing hematite, and Nb-bearing cerianite. These specific phases are considered because the sample originates from a lateritic weathering profile above a carbonatite, where primary Nb-bearing minerals undergo alteration. In this environment, primary phases like pyrochlore and Ti oxides alter and release Nb. The released Nb is subsequently scavenged by secondary phases, necessitating the inclusion of abundant secondary hosts like Fe oxides (goethite, hematite) and cerianite in the fit basis to capture the complete weathering transformation. | Full credit for identifying primary pyrochlore and secondary Fe/Ti/Ce oxides (goethite, hematite, rutile, brookite, cerianite) as the necessary basis set. |
| q2 | quantification | 50 | Estimate the quantitative phase fractions of the Nb hosts in this specific 'Brown laterite' horizon (the least weathered horizon above the carbonatite). | In this specific brown laterite horizon, the quantitative phase fractions are 25% Ba-bearing kenopyrochlore and 75% Nb-bearing goethite, with an uncertainty of 3%. Because this is the least weathered horizon directly above the carbonatite, the primary pyrochlore is only partially altered and thus still contributes significantly to the Nb speciation. Furthermore, the contribution of Ti oxides is negligible due to the alteration of primary Ti oxides and the limited precipitation of secondary Ti oxides at this early weathering stage. As a result, the Nb released from the altering primary phases is primarily scavenged by the abundant Fe oxides, making goethite the dominant secondary host. | Full credit for estimating ~25% pyrochlore (primary host) and ~75% goethite (secondary host). Partial credit for identifying goethite as the dominant host with a minor pyrochlore component. |
Review
#349
carbonatite
Nb K-edge
▶
LLM Prompt
Sample Information
Material: carbonatite
Sample Origin: Morro dos Seis Lagos, Amazonas, Brazil
Sample-Specific Conditions
- weathering horizon: Siderite carbonatite
- Parent rock
Measurement
We plan to measure the Nb K-edge XANES spectrum of this sample.
Questions
Based on all the information above:
1. Based on the geological context of an unweathered siderite carbonatite parent rock from this deposit, what candidate reference spectra should be included in a linear combination fitting (LCF) basis to model the Nb K-edge XANES spectrum?
2. Estimate the relative phase fractions of the primary Nb-bearing minerals in this unweathered carbonatite sample.
3. Explain why the Nb speciation in this sample is dominated by these specific phases, and how this contrasts with the expected speciation in the overlying weathered lateritic horizons.
Ground Truth
Material: carbonatite
Measurement: Nb K-edge XANES, fluorescence-yield mode, BM23 beamline at ESRF
Fit method: Least-squares linear combination fitting (LCF)
Phase fractions: (±3%)
| Phase | Fraction |
|---|---|
| Ba-bearing kenopyrochlore | 0.8 |
| Nb-bearing rutile (micro-focused) | 0.2 |
Fit basis (paper's reference spectra):
- Ba-bearing kenopyrochlore
- Nb-bearing rutile (micro-focused)
- Nb-bearing brookite (micro-focused)
- Nb-bearing goethite
- Nb-bearing hematite
- Nb-bearing cerianite
Source evidence: Figure 13c and Section 3.4
Key reasoning: The siderite carbonatite represents the unweathered parent rock of the lateritic profile. In this primary rock, Nb is hosted in hydrothermal Ba-Ce pyrochlore and minor Nb-bearing Ti oxides (rutile and brookite). Consequently, the average Nb speciation is dominated by pyrochlore (80%), with a smaller contribution from primary Nb-bearing Ti oxides (20%), before any significant supergene weathering and secondary oxide precipitation occurs.
Reasoning source: Section 3.2.2, Section 3.4, and Section 4.1
Scoring Rubric (total: 100 pts)
| Q | Type | Max | Question | Reference Answer | Scoring Criteria |
|---|---|---|---|---|---|
| q1 | identification | 30 | Based on the geological context of an unweathered siderite carbonatite parent rock from this deposit, what candidate reference spectra should be included in a linear combination fitting (LCF) basis to model the Nb K-edge XANES spectrum? | The candidate reference spectra for the LCF basis should include Ba-bearing kenopyrochlore, Nb-bearing rutile (micro-focused), Nb-bearing brookite (micro-focused), Nb-bearing goethite, Nb-bearing hematite, and Nb-bearing cerianite. These specific phases are expected because the sample is an unweathered siderite carbonatite parent rock from the Morro dos Seis Lagos deposit. In this primary rock, Nb is naturally hosted in hydrothermal Ba-Ce pyrochlore and minor Nb-bearing Ti oxides like rutile and brookite. Including secondary oxides (goethite, hematite, cerianite) in the basis set is also necessary to properly model the system and confirm the absence of significant supergene weathering in this parent material. | Full points for identifying pyrochlore (or Ba-bearing kenopyrochlore) and Nb-bearing Ti oxides (rutile/brookite) as the primary components. Partial points for mentioning only one. |
| q2 | quantification | 35 | Estimate the relative phase fractions of the primary Nb-bearing minerals in this unweathered carbonatite sample. | The relative phase fractions for this sample are estimated to be 80% Ba-bearing kenopyrochlore and 20% Nb-bearing rutile (micro-focused), with an uncertainty of 3%. These specific values result directly from the sample's condition as the unweathered siderite carbonatite parent rock of the lateritic profile. Because the rock has not yet been subjected to significant supergene weathering, the Nb speciation remains heavily dominated by the primary hydrothermal Ba-Ce pyrochlore (80%). The remaining 20% reflects the natural minor contribution from primary Nb-bearing Ti oxides that formed in the parent rock before any secondary oxide precipitation could occur. | Full points for estimating ~80% pyrochlore and ~20% Nb-bearing Ti oxides (rutile). Deduct points proportionally for deviations >10%. |
| q3 | reasoning | 35 | Explain why the Nb speciation in this sample is dominated by these specific phases, and how this contrasts with the expected speciation in the overlying weathered lateritic horizons. | The Nb speciation in this sample is dominated by Ba-bearing kenopyrochlore (80%) and Nb-bearing rutile (20%) because it represents the unweathered siderite carbonatite parent rock. In this primary geological environment, Nb is originally hosted in hydrothermal Ba-Ce pyrochlore and minor primary Nb-bearing Ti oxides like rutile and brookite. This contrasts with the expected speciation in overlying weathered lateritic horizons, which would be subjected to significant supergene weathering. In those weathered zones, the primary pyrochlore would break down, leading to extensive secondary oxide precipitation, whereas this parent rock preserves the original hydrothermal Nb speciation. | Full points for explaining that this is the unweathered parent rock where primary magmatic/hydrothermal phases (pyrochlore, Ti-oxides) are preserved, whereas overlying weathered horizons would show Nb scavenging by secondary oxides (like goethite) due to pyrochlore alteration. |
Review
Mechanistic insights into Cr(VI) removal by a combination of zero-valent iron and pyrite
APS
Environmental
Ruiming Zhang et al.
DOI: 10.1016/j.chemosphere.2023.138693
4 scenarios
▶
#350
reacted ZVI surface
Fe K
▶
LLM Prompt
Sample Information
Material: reacted ZVI surface
Sample Origin: laboratory prepared
Sample-Specific Conditions
- Control (no Cr or sulfide): 0 mg/L Cr(VI), 0 mg/L Na2S
- Zero-valent iron mixed in 0.01 M NaCl solution
Measurement
We plan to measure the Fe K XANES spectrum of this sample.
Questions
Based on all the information above:
1. Based on the sample conditions (ZVI mixed in 0.01 M NaCl for 2 hours), what Fe oxidation states should be included as candidate reference spectra for linear combination fitting of the XANES data?
2. Estimate the relative phase fractions of Fe(0) and Fe(III) on the reacted ZVI surface after 2 hours of mixing in the 0.01 M NaCl control solution.
3. Explain the physical reason for the presence of Fe(III) on the surface of the zero-valent iron in this control experiment, given that no external oxidants like Cr(VI) were added.
Ground Truth
Material: reacted ZVI surface
Measurement: Fe K-edge XANES, 9-BM, Advanced Photon Source
Fit method: linear combination fitting (LCF)
Phase fractions:
| Phase | Fraction |
|---|---|
| Fe(0) | 0.887 |
| Fe(III) | 0.113 |
| Fe(II) | 0.0 |
Fit basis (paper's reference spectra):
- Fe(0)
- Fe(II)
- Fe(III)
Source evidence: Table 1, page 15
Key reasoning: After mixing ZVI with 0.01 M NaCl solution for 2 hours, the surface of ZVI undergoes baseline oxidation in the aqueous environment to form iron oxides. The XANES LCF results confirm that while the surface remains predominantly unreacted Fe(0) (88.7%), a minor fraction of oxidized Fe(III) (11.3%) is formed due to this natural oxidation process.
Reasoning source: Section 3.3, pages 12-14
Scoring Rubric (total: 100 pts)
| Q | Type | Max | Question | Reference Answer | Scoring Criteria |
|---|---|---|---|---|---|
| q1 | identification | 30 | Based on the sample conditions (ZVI mixed in 0.01 M NaCl for 2 hours), what Fe oxidation states should be included as candidate reference spectra for linear combination fitting of the XANES data? | The candidate reference spectra for linear combination fitting should include Fe(0), Fe(II), and Fe(III). These specific oxidation states are expected because the zero-valent iron (ZVI) is mixed in an aqueous 0.01 M NaCl solution for 2 hours. In this aqueous environment, the ZVI surface undergoes baseline natural oxidation to form iron oxides. Therefore, while the material remains predominantly unreacted Fe(0), oxidized species like Fe(III) and potentially Fe(II) must be included to account for the oxidation products formed during the experiment. | Full credit for identifying Fe(0) and Fe(III) (and optionally Fe(II)) as the necessary reference states to model the unreacted core and the oxidized surface layer. |
| q2 | quantification | 40 | Estimate the relative phase fractions of Fe(0) and Fe(III) on the reacted ZVI surface after 2 hours of mixing in the 0.01 M NaCl control solution. | The relative phase fractions on the reacted ZVI surface are 0.887 (88.7%) Fe(0) and 0.113 (11.3%) Fe(III), with 0.0% Fe(II) detected. These specific values result from the baseline oxidation of the zero-valent iron when mixed in the 0.01 M NaCl aqueous environment for 2 hours. Because this is a control sample with 0 mg/L Cr(VI) and 0 mg/L Na2S, the oxidation is limited to natural aqueous processes. Consequently, the surface remains predominantly unreacted Fe(0), while a minor fraction converts to oxidized Fe(III) iron oxides. | Full credit for estimating approximately 85-90% Fe(0) and 10-15% Fe(III). Partial credit for recognizing that Fe(0) is the dominant phase with a minor Fe(III) component. |
| q3 | reasoning | 30 | Explain the physical reason for the presence of Fe(III) on the surface of the zero-valent iron in this control experiment, given that no external oxidants like Cr(VI) were added. | The presence of Fe(III) on the zero-valent iron surface is due to baseline oxidation occurring in the aqueous environment. When the ZVI is mixed in the 0.01 M NaCl solution for 2 hours, it naturally reacts with the water, leading to the formation of iron oxides on the surface. This natural oxidation process explains why a minor fraction (11.3%) of oxidized Fe(III) is formed even in the control sample with 0 mg/L Cr(VI) and 0 mg/L Na2S. The remaining 88.7% of the surface stays as unreacted Fe(0) because the baseline aqueous oxidation is relatively mild without external oxidants. | Full credit for explaining that ZVI undergoes natural oxidation (corrosion) in aqueous solutions (like 0.01 M NaCl) to form an iron oxide/hydroxide layer containing Fe(III) on its surface. |
Review
#351
reacted ZVI surface
Fe K
▶
LLM Prompt
Sample Information
Material: reacted ZVI surface
Sample Origin: laboratory prepared
Sample-Specific Conditions
- Presence of Cr(VI): 100 mg/L Cr(VI)
- Zero-valent iron mixed with Cr(VI) in 0.01 M NaCl solution
Measurement
We plan to measure the Fe K XANES spectrum of this sample.
Questions
Based on all the information above:
1. What candidate reference spectra (oxidation states) should be included in a Linear Combination Fitting (LCF) model to properly evaluate the speciation of this reacted ZVI surface?
2. Given the sample conditions (ZVI mixed with 100 mg/L Cr(VI) in 0.01 M NaCl for 2 hours), what is the dominant iron phase expected on the surface, and why does this phase dominate instead of oxidized iron species?
3. Based on the physical chemistry of this system, explain the mechanism by which the specific concentration of Cr(VI) dictates the final Fe oxidation state observed in the XANES spectrum.
Ground Truth
Material: reacted ZVI surface
Measurement: Fe K-edge XANES, Advanced Photon Source (APS) beamline 9-BM
Fit method: linear combination fitting (LCF)
Phase fractions:
| Phase | Fraction |
|---|---|
| Fe(0) | 1.0 |
Fit basis (paper's reference spectra):
- Fe(0)
- Fe(II)
- Fe(III)
Source evidence: Table 1 (page 15) and Section 3.3 (page 14, lines 234-236)
Key reasoning: After ZVI is mixed with the Cr(VI) solution, no Fe(II) or Fe(III) are detected on the reacted ZVI surface. This confirms that Cr(VI) causes the passivation of the ZVI surface, preventing further oxidation of the underlying zero-valent iron.
Reasoning source: Section 3.3, page 14, lines 234-236
Scoring Rubric (total: 100 pts)
| Q | Type | Max | Question | Reference Answer | Scoring Criteria |
|---|---|---|---|---|---|
| q1 | identification | 20 | What candidate reference spectra (oxidation states) should be included in a Linear Combination Fitting (LCF) model to properly evaluate the speciation of this reacted ZVI surface? | The Linear Combination Fitting (LCF) model should include reference spectra for Fe(0), Fe(II), and Fe(III) oxidation states. These candidate references are selected to evaluate the potential oxidation of zero-valent iron (ZVI) after it is mixed with a 100 mg/L Cr(VI) and 0.01 M NaCl solution. Including these phases allows the model to determine whether the iron has oxidized or remained in its elemental state. Ultimately, the analysis yields a fraction of 1.0 for Fe(0) because the Cr(VI) causes passivation of the ZVI surface, preventing the formation of Fe(II) or Fe(III). | Full credit for identifying Fe(0), Fe(II), and Fe(III) as the necessary reference states. |
| q2 | reasoning | 50 | Given the sample conditions (ZVI mixed with 100 mg/L Cr(VI) in 0.01 M NaCl for 2 hours), what is the dominant iron phase expected on the surface, and why does this phase dominate instead of oxidized iron species? | The dominant iron phase expected on the surface is Fe(0), which comprises a fraction of 1.0 in the sample. This occurs because mixing the zero-valent iron with the 100 mg/L Cr(VI) in 0.01 M NaCl solution leads to the passivation of the ZVI surface. The Cr(VI) acts to passivate the material, which completely prevents any further oxidation of the underlying zero-valent iron. As a result of this mechanism, no oxidized iron species like Fe(II) or Fe(III) are detected on the reacted surface. | Full credit for identifying Fe(0) as the dominant (or sole) phase and explaining that Cr(VI) passivates the ZVI surface, which prevents the oxidation of Fe(0) to Fe(II) or Fe(III). |
| q3 | reasoning | 30 | Based on the physical chemistry of this system, explain the mechanism by which the specific concentration of Cr(VI) dictates the final Fe oxidation state observed in the XANES spectrum. | The specific concentration of 100 mg/L Cr(VI) in a 0.01 M NaCl solution dictates that the final Fe oxidation state observed in the XANES spectrum is entirely Fe(0) (fraction of 1.0). The mechanism for this is that the Cr(VI) solution causes the passivation of the ZVI surface upon mixing. This passivating effect creates a state where further oxidation of the underlying zero-valent iron is completely prevented. Consequently, the physical chemistry of this interaction ensures that no Fe(II) or Fe(III) forms, leaving the iron surface exclusively as Fe(0). | Full credit for explicitly mentioning the 'passivation' effect caused by Cr(VI) on the ZVI surface, which halts the corrosion/oxidation process and leaves the surface as unreacted Fe(0). |
Review
#352
reacted ZVI surface
Fe K
▶
LLM Prompt
Sample Information
Material: reacted ZVI surface
Sample Origin: laboratory prepared
Sample-Specific Conditions
- Presence of Cr(VI) and Na2S: 100 mg/L Cr(VI), 100 mg-S/L Na2S
- Zero-valent iron mixed with Cr(VI) and Na2S in 0.01 M NaCl solution
Measurement
We plan to measure the Fe K XANES spectrum of this sample.
Questions
Based on all the information above:
1. What Fe oxidation states or species should be included as reference spectra for linear combination fitting of the reacted ZVI surface in this system?
2. Based on the provided conditions (ZVI mixed with 100 mg/L Cr(VI) and 100 mg-S/L Na2S), estimate the relative fractions of Fe(0) and oxidized Fe species (Fe(II), Fe(III)) on the surface.
3. Discuss the mechanistic role of dissolved sulfide (from Na2S) when coexisting with Cr(VI) during the reaction with ZVI, and how this affects the resulting Fe speciation on the surface compared to treatment with Cr(VI) alone.
Ground Truth
Material: reacted ZVI surface
Measurement: Fe K-edge XANES, 9-BM, Advanced Photon Source
Fit method: linear combination fitting (LCF)
Phase fractions:
| Phase | Fraction |
|---|---|
| Fe(0) | 0.969 |
| Fe(III) | 0.031 |
| Fe(II) | 0.0 |
Fit basis (paper's reference spectra):
- Fe(0)
- Fe(II)
- Fe(III)
Source evidence: Table 1, page 15
Key reasoning: After ZVI was mixed with Cr(VI) solution alone, no Fe(II) and Fe(III) were detected on the reacted ZVI surface, confirming passivation by Cr(VI). The presence of Na2S alone resulted in significant oxidation (41.8% Fe(III)). The coexistence of Na2S and Cr(VI) resulted in 3.1% Fe(III). This confirms that the dissolved sulfide promoted the oxidation of ZVI and reduced the passivation effect of Cr(VI), allowing some corrosion to occur.
Reasoning source: Page 14, lines 234-240
Scoring Rubric (total: 100 pts)
| Q | Type | Max | Question | Reference Answer | Scoring Criteria |
|---|---|---|---|---|---|
| q1 | identification | 20 | What Fe oxidation states or species should be included as reference spectra for linear combination fitting of the reacted ZVI surface in this system? | The reference spectra for linear combination fitting of the reacted ZVI surface should include Fe(0), Fe(II), and Fe(III). These specific oxidation states are expected because the sample consists of zero-valent iron (ZVI) reacting in a 0.01 M NaCl solution containing both 100 mg/L Cr(VI) and 100 mg-S/L Na2S. While Cr(VI) alone typically passivates the ZVI surface and prevents oxidation, the coexistence of dissolved sulfide from Na2S reduces this passivation effect and promotes ZVI oxidation. Consequently, the fitting basis must account for the unreacted Fe(0) core as well as the oxidized Fe(II) and Fe(III) corrosion products that form on the surface due to the sulfide-promoted reaction. | Full points for identifying Fe(0), Fe(II), and Fe(III) as the necessary basis components. |
| q2 | quantification | 40 | Based on the provided conditions (ZVI mixed with 100 mg/L Cr(VI) and 100 mg-S/L Na2S), estimate the relative fractions of Fe(0) and oxidized Fe species (Fe(II), Fe(III)) on the surface. | The relative fractions on the reacted ZVI surface are estimated to be 0.969 (96.9%) Fe(0), 0.031 (3.1%) Fe(III), and 0.0 (0%) Fe(II). These specific values result from the competing effects of the 100 mg/L Cr(VI) and 100 mg-S/L Na2S present in the 0.01 M NaCl solution. Cr(VI) acts as a strong passivating agent that normally prevents ZVI oxidation entirely, whereas Na2S alone would cause significant oxidation, yielding up to 41.8% Fe(III). The coexistence of both species means the dissolved sulfide partially reduces the passivation effect of Cr(VI), allowing a small amount of corrosion to occur and yielding the observed 3.1% Fe(III) fraction while leaving the vast majority as unreacted Fe(0). | Full points for estimating ~97% Fe(0) and ~3% Fe(III), with negligible Fe(II). Partial points for recognizing that Fe(0) remains highly dominant but a small amount of Fe(III) is formed. |
| q3 | reasoning | 40 | Discuss the mechanistic role of dissolved sulfide (from Na2S) when coexisting with Cr(VI) during the reaction with ZVI, and how this affects the resulting Fe speciation on the surface compared to treatment with Cr(VI) alone. | When ZVI is treated with 100 mg/L Cr(VI) alone, the surface becomes completely passivated, resulting in no detectable Fe(II) or Fe(III) formation. However, the introduction of 100 mg-S/L Na2S into the 0.01 M NaCl solution alters this mechanism by providing dissolved sulfide to the system. The dissolved sulfide actively promotes the oxidation of ZVI and reduces the strong passivation effect of the Cr(VI). As a result of this disrupted passivation, a small amount of corrosion is allowed to proceed, shifting the surface speciation from purely unreacted Fe(0) to a mixture containing 3.1% oxidized Fe(III). | Full points for explaining that Cr(VI) alone passivates the ZVI surface (leaving ~100% Fe(0)), but dissolved sulfide promotes ZVI oxidation and reduces this passivation effect, leading to the formation of a small amount of Fe(III) on the surface. |
Review
#353
reacted ZVI surface
Fe K
▶
LLM Prompt
Sample Information
Material: reacted ZVI surface
Sample Origin: laboratory prepared
Sample-Specific Conditions
- Presence of Na2S: 100 mg-S/L Na2S
- Zero-valent iron mixed with Na2S in 0.01 M NaCl solution
Measurement
We plan to measure the Fe K XANES spectrum of this sample.
Questions
Based on all the information above:
1. Based on the sample conditions (ZVI mixed with 100 mg-S/L Na2S in 0.01 M NaCl), what Fe oxidation states should be included as reference components for linear combination fitting of the Fe K-edge XANES data?
2. Estimate the relative fractions of Fe(0), Fe(II), and Fe(III) on the reacted ZVI surface after 2 hours of mixing with Na2S.
3. How does the presence of dissolved sulfide (Na2S) affect the oxidation state of the ZVI surface compared to a baseline of ZVI in just 0.01 M NaCl, and what is the physical reasoning for this change?
Ground Truth
Material: reacted ZVI surface
Measurement: Fe K-edge XANES
Fit method: linear combination fitting (LCF)
Phase fractions:
| Phase | Fraction |
|---|---|
| Fe(0) | 0.526 |
| Fe(II) | 0.056 |
| Fe(III) | 0.418 |
Fit basis (paper's reference spectra):
- Fe(0)
- Fe(II)
- Fe(III)
Source evidence: Table 1, page 15
Key reasoning: Mixing ZVI with Na2S in NaCl solution promotes the oxidation of ZVI compared to mixing in NaCl alone. The dissolved sulfide accelerates ZVI corrosion, leading to a significant decrease in Fe(0) content and a corresponding increase in oxidized Fe species, primarily Fe(III), on the surface.
Reasoning source: Section 3.3, page 14
Scoring Rubric (total: 100 pts)
| Q | Type | Max | Question | Reference Answer | Scoring Criteria |
|---|---|---|---|---|---|
| q1 | identification | 20 | Based on the sample conditions (ZVI mixed with 100 mg-S/L Na2S in 0.01 M NaCl), what Fe oxidation states should be included as reference components for linear combination fitting of the Fe K-edge XANES data? | The reference components for linear combination fitting of the Fe K-edge XANES data should include Fe(0), Fe(II), and Fe(III). These specific oxidation states are expected because mixing zero-valent iron (ZVI) with 100 mg-S/L Na2S in a 0.01 M NaCl solution actively promotes the oxidation of the ZVI surface. The dissolved sulfide accelerates the corrosion of ZVI compared to mixing in NaCl alone. Consequently, the sample retains unreacted Fe(0) from the core, while the accelerated corrosion generates oxidized iron species on the surface, primarily Fe(III) along with a minor amount of Fe(II). | Full points for identifying Fe(0), Fe(II), and Fe(III) as the necessary components. Partial credit if only Fe(0) and Fe(III) are mentioned. |
| q2 | quantification | 40 | Estimate the relative fractions of Fe(0), Fe(II), and Fe(III) on the reacted ZVI surface after 2 hours of mixing with Na2S. | The estimated relative fractions on the reacted ZVI surface are 0.526 for Fe(0), 0.056 for Fe(II), and 0.418 for Fe(III). These specific values result from the presence of 100 mg-S/L Na2S in the 0.01 M NaCl solution, which significantly alters the surface composition compared to a pure NaCl environment. The dissolved sulfide acts to accelerate ZVI corrosion, leading to a substantial decrease in the initial Fe(0) content down to 52.6%. Correspondingly, this accelerated oxidation process produces a large increase in oxidized Fe species on the surface, predominantly in the form of Fe(III) (41.8%) with a small fraction of Fe(II) (5.6%). | Full points if the estimated fractions are within ±10% of the ground truth (Fe(0) ~53%, Fe(II) ~6%, Fe(III) ~42%). Partial credit for correctly identifying that Fe(0) is the majority phase (~50%) and Fe(III) is the secondary phase (~40%). |
| q3 | reasoning | 40 | How does the presence of dissolved sulfide (Na2S) affect the oxidation state of the ZVI surface compared to a baseline of ZVI in just 0.01 M NaCl, and what is the physical reasoning for this change? | The presence of 100 mg-S/L dissolved sulfide (Na2S) significantly decreases the Fe(0) content and increases the amount of oxidized Fe species, primarily Fe(III), on the ZVI surface. The physical reasoning for this change is that mixing ZVI with Na2S in a 0.01 M NaCl solution actively promotes the oxidation of ZVI compared to a baseline of mixing it in NaCl alone. The dissolved sulfide accelerates the overall ZVI corrosion process. As a result of this accelerated corrosion, the zero-valent iron is more rapidly consumed, driving the pronounced formation of oxidized Fe(II) and Fe(III) surface states. | Full points for explaining that dissolved sulfide promotes the oxidation/corrosion of ZVI, leading to a lower Fe(0) fraction and a higher Fe(III) fraction compared to the baseline. |
Review
Investigating corrosion behavior of Ni and Ni-20Cr in molten ZnCl2
BNL-NSLS-II-8-ID
Electrochemistry
Simerjeet K. Gill et al.
DOI: 10.1016/j.corsci.2020.109105
1 scenario
▶
#354
ZnCl2 salt with Ni debris
Ni K
▶
LLM Prompt
Sample Information
Material: ZnCl2 salt with Ni debris
Electrolyte: molten ZnCl2
Cell Type: three-electrode cell
Charge Discharge: cyclic polarization
Sample-Specific Conditions
- electrode material: Ni
- ZnCl2 salt collected after 100 h immersion of Ni wire with cyclic polarization
Measurement
We plan to measure the Ni K XANES spectrum of this sample.
Questions
Based on all the information above:
1. Based on the sample conditions (ZnCl2 salt collected after 100 h immersion of a Ni wire with cyclic polarization), what is the dominant Ni phase expected in the salt, and what physical mechanism explains its presence despite the expectation of anodic dissolution?
2. What reference spectra should be used to evaluate the speciation of Ni in this salt sample, and what specific spectral features distinguish the expected dominant phase from dissolved Ni2+?
3. Describe the expected spectral shape of the Ni K-edge XANES for this sample, including any specific labeled features or energy positions mentioned in the literature for this system.
Ground Truth
Material: ZnCl2 salt with Ni debris
Measurement: Ni K-edge XAS in fluorescence geometry at NSLS-II ISS (8-ID) beamline
Fit method: qualitative comparison
Phase fractions:
| Phase | Fraction |
|---|---|
| metallic_nickel | 1.0 |
Fit basis (paper's reference spectra):
- Ni foil
- NiCl2/ZnCl2 reference
Source evidence: Section 3.4, Page 14; Section 4.1, Page 16
Key reasoning: The XAS spectrum of the salt after 100 h immersion is dominated by metallic Ni. Although Ni2+ cations are expected to dissolve into the salt during corrosion, the signal is dominated by metallic Ni due to the detachment of nano-sized metallic debris from the electrode surface. This detachment occurs as a result of the propagation of a pore-salt network driven by intergranular corrosion.
Reasoning source: Section 3.4 (Page 14) and Section 4.1 (Page 16)
Scoring Rubric (total: 100 pts)
| Q | Type | Max | Question | Reference Answer | Scoring Criteria |
|---|---|---|---|---|---|
| q1 | reasoning | 40 | Based on the sample conditions (ZnCl2 salt collected after 100 h immersion of a Ni wire with cyclic polarization), what is the dominant Ni phase expected in the salt, and what physical mechanism explains its presence despite the expectation of anodic dissolution? | The dominant Ni phase expected in the ZnCl2 salt after 100 hours of cyclic polarization is metallic nickel, which accounts for a fraction of 1.0. While one might expect dissolved Ni2+ cations in the molten ZnCl2 electrolyte due to anodic dissolution during corrosion, the signal is instead entirely dominated by metallic Ni. This occurs because the cyclic polarization drives intergranular corrosion, which propagates a pore-salt network on the Ni wire electrode. This specific mechanism leads to the physical detachment of nano-sized metallic Ni debris from the electrode surface directly into the salt, overwhelming any dissolved Ni2+ signal. | Full points for identifying metallic Ni as the dominant phase and explaining that it originates from nano-sized metallic debris detached from the electrode surface due to the propagation of a pore-salt network (intergranular corrosion). Partial points if only the phase is identified without the correct physical mechanism. |
| q2 | spectral | 30 | What reference spectra should be used to evaluate the speciation of Ni in this salt sample, and what specific spectral features distinguish the expected dominant phase from dissolved Ni2+? | To evaluate the speciation of Ni in this salt sample, the appropriate reference spectra to use are a Ni foil and a NiCl2/ZnCl2 reference. These references are necessary because the sample conditions involve a Ni wire immersed in molten ZnCl2, making metallic Ni (from electrode debris) and dissolved Ni2+ (from anodic corrosion) the two expected phases. The spectrum of the sample is distinguished from dissolved Ni2+ by the complete absence of a double-peak feature in the white line region, which is characteristic of the NiCl2/ZnCl2 reference. The lack of this double-peak feature confirms that the detached metallic Ni debris generated during the 100-hour cyclic polarization dominates the signal over any dissolved Ni2+ cations. | Full points for mentioning metallic Ni (e.g., Ni foil) and a Ni2+ reference (e.g., NiCl2 in ZnCl2). Must state that the sample spectrum will lack the double-peak feature in the white line region that is characteristic of dissolved NiCl2. |
| q3 | spectral | 30 | Describe the expected spectral shape of the Ni K-edge XANES for this sample, including any specific labeled features or energy positions mentioned in the literature for this system. | The expected Ni K-edge XANES spectral shape for this sample is fairly similar to a reference Ni foil, with the energies of the first-to-fourth peaks being almost identical to metallic Ni. It specifically exhibits a shoulder at 8337 eV that has a slightly higher intensity than the reference Ni foil, while lacking the double-peak feature in the white line region characteristic of a NiCl2/ZnCl2 reference. These metallic spectral features arise directly from the sample conditions, where 100 hours of cyclic polarization of the Ni wire in molten ZnCl2 causes intergranular corrosion. This corrosion mechanism propagates a pore-salt network that detaches nano-sized metallic Ni debris into the salt, causing the spectrum to reflect an oxidation state of 0 rather than dissolved oxidized species. | Full points for describing a spectrum similar to metallic Ni foil, specifically mentioning matching energies for the first-to-fourth peaks and a shoulder at 8337 eV (which may have slightly higher intensity than the reference foil). |
Review
The role of nonmetallic ion substitution in perovskite LaCoO3 for improved oxygen evolution reaction activity
APS
Catalyst
Maoyu Wang et al.
DOI: 10.1016/j.electacta.2023.143034
2 scenarios
▶
#355
LaCo0.9P0.1O3
Co K-edge
▶
LLM Prompt
Sample Information
Material: LaCo0.9P0.1O3
Reaction Conditions: ex-situ
Sample-Specific Conditions
- dopant: P
- P-doped LaCoO3 perovskite
Measurement
We plan to measure the Co K-edge XANES spectrum of this sample.
Questions
Based on all the information above:
1. What is the expected oxidation state and primary phase of Co in the P-doped LaCoO3 (LaCo0.9P0.1O3) sample, and what physical reasoning explains this?
2. Describe the expected Co K-edge XANES spectral shape and edge position relative to common Co reference standards (e.g., CoO, Co3O4, Co(NO3)3).
Ground Truth
Material: LaCo0.9P0.1O3
Measurement: Co K-edge XANES, ex-situ, beamline 9-BM at Advanced Photon Source
Fit method: Qualitative comparison to standards
Phase fractions:
| Phase | Fraction |
|---|---|
| Co(III) in perovskite | 1.0 |
Fit basis (paper's reference spectra):
- CoO
- Co3O4
- Co(NO3)3
Source evidence: Figure 2a and Section 2 (Results and discussion), page 3
Key reasoning: XRD confirms the material maintains the rhombohedral perovskite structure of pure LaCoO3 without phase transition upon P substitution. Co K-edge XANES shows the Co valence state is close to Co(III), matching the Co(NO3)3 standard. This indicates that P substitution does not change the bulk oxidation state or local structure of Co.
Reasoning source: Section 2 (Results and discussion), pages 2-3
Scoring Rubric (total: 100 pts)
| Q | Type | Max | Question | Reference Answer | Scoring Criteria |
|---|---|---|---|---|---|
| q1 | reasoning | 43 | What is the expected oxidation state and primary phase of Co in the P-doped LaCoO3 (LaCo0.9P0.1O3) sample, and what physical reasoning explains this? | The expected oxidation state of Co in the LaCo0.9P0.1O3 sample is Co(III), existing entirely (fraction of 1.0) within a rhombohedral perovskite phase. This occurs because substituting 10% of the Co sites with P dopants does not induce a phase transition in the material. As confirmed by XRD, the sample maintains the rhombohedral perovskite structure of pure LaCoO3. Consequently, the P substitution does not alter the bulk oxidation state or the local structure of the cobalt atoms, leaving the Co valence state stable at Co(III). | Full credit for identifying Co(III) in a rhombohedral perovskite structure and explaining that P substitution does not alter the bulk crystal structure or Co oxidation state. |
| q2 | spectral | 57 | Describe the expected Co K-edge XANES spectral shape and edge position relative to common Co reference standards (e.g., CoO, Co3O4, Co(NO3)3). | The Co K-edge XANES spectrum for the LaCo0.9P0.1O3 sample will exhibit an edge position and spectral shape that closely aligns with the Co(III) standard, Co(NO3)3. The edge position will match Co(III) rather than the lower-energy Co(II) found in CoO or the mixed Co(II,III) state in Co3O4. These spectral features arise because the P-doping in the LaCoO3 perovskite does not alter the bulk oxidation state or local coordination environment of the Co atoms. Because the material maintains its rhombohedral perovskite structure without a phase transition, the Co remains entirely as Co(III), resulting in a spectrum with no significant electronic or structural deviations from pure or other doped LaCoO3 samples. | Full credit for stating the edge position aligns with Co(III) standards like Co(NO3)3 and is shifted to higher energy compared to Co(II) (CoO) or Co(II,III) (Co3O4) standards. |
Review
#356
LaCo0.9Fe0.05P0.05O3
Fe K-edge
▶
LLM Prompt
Sample Information
Material: LaCo0.9Fe0.05P0.05O3
Reaction Conditions: ex-situ
Sample-Specific Conditions
- dopant: Fe, P
- Fe and P co-doped LaCoO3 perovskite
Measurement
We plan to measure the Fe K-edge XANES spectrum of this sample.
Questions
Based on all the information above:
1. What is the expected oxidation state of Fe in the LaCo0.9Fe0.05P0.05O3 perovskite, and what standard reference spectra should be used for comparison to determine this state?
2. Describe the expected spectral shape and edge position of the Fe K-edge XANES for this sample. How does it compare to standard iron oxides?
3. Explain how the substitution of P affects the Fe oxidation state in this co-doped perovskite, and how this is reflected in the XANES analysis.
Ground Truth
Material: LaCo0.9Fe0.05P0.05O3
Measurement: Fe K-edge XANES, ex-situ, beamline 9-BM of the Advanced Photon Source
Fit method: qualitative comparison
Phase fractions:
| Phase | Fraction |
|---|---|
| Fe(III) in perovskite | 1.0 |
Fit basis (paper's reference spectra):
- FeO
- Fe2O3
Source evidence: Fig. 2b, page 3
Key reasoning: The Fe K-edge XANES spectra of the doped perovskites were compared to FeO and Fe2O3 standards. The edge position of the samples is slightly higher than that of Fe2O3, indicating an oxidation state slightly higher than Fe(III). The substitution of P does not change the oxidation state of Fe.
Reasoning source: Section 2. Results and discussion, page 3
Scoring Rubric (total: 100 pts)
| Q | Type | Max | Question | Reference Answer | Scoring Criteria |
|---|---|---|---|---|---|
| q1 | identification | 30 | What is the expected oxidation state of Fe in the LaCo0.9Fe0.05P0.05O3 perovskite, and what standard reference spectra should be used for comparison to determine this state? | The expected oxidation state of Fe in the LaCo0.9Fe0.05P0.05O3 perovskite is slightly higher than Fe(III), with the iron existing entirely (1.0 fraction) as Fe(III) within the perovskite lattice. To determine this state, the sample's ex-situ Fe K-edge XANES spectrum should be qualitatively compared against standard reference spectra of FeO and Fe2O3. This specific oxidation state arises in the Fe and P co-doped LaCoO3 material because the substitution of P into the lattice does not alter the oxidation state of the Fe dopant. Consequently, the Fe atoms maintain a stable electronic configuration in the perovskite structure, resulting in an oxidation state that remains slightly higher than the Fe(III) reference. | Full credit for identifying the oxidation state as slightly higher than Fe(III) and mentioning FeO and Fe2O3 as reference spectra. |
| q2 | spectral | 35 | Describe the expected spectral shape and edge position of the Fe K-edge XANES for this sample. How does it compare to standard iron oxides? | The Fe K-edge XANES spectrum for this sample is expected to exhibit a main absorption edge shape similar to that of Fe2O3, but with an edge position shifted to a slightly higher energy (~7125 eV). When compared to standard iron oxides, the sample's distinguishing feature is that its edge position is slightly higher than that of the Fe2O3 standard. These spectral features arise directly from the electronic properties of the Fe and P co-doped LaCoO3 perovskite under ex-situ conditions. Because the P co-doping does not change the Fe oxidation state, the Fe remains fully incorporated in the perovskite lattice with an oxidation state slightly higher than Fe(III), which directly produces the observed shift to higher energy relative to the Fe2O3 reference. | Full credit for stating the edge position is slightly higher than Fe2O3 and the shape is similar to Fe2O3 but shifted to higher energy, characteristic of the perovskite lattice. |
| q3 | reasoning | 35 | Explain how the substitution of P affects the Fe oxidation state in this co-doped perovskite, and how this is reflected in the XANES analysis. | In the LaCo0.9Fe0.05P0.05O3 material, the substitution of P as a co-dopant alongside Fe does not change the oxidation state of the Fe atoms. Because the P substitution leaves the Fe electronic state unaffected, the Fe dopant remains fully incorporated in the LaCoO3 perovskite lattice with an oxidation state slightly higher than Fe(III). In the ex-situ Fe K-edge XANES analysis, this structural and electronic stability is reflected when comparing the sample to FeO and Fe2O3 standards. The XANES spectrum exhibits an edge position slightly higher than that of Fe2O3 (~7125 eV), confirming that the Fe maintains its slightly higher than Fe(III) oxidation state despite the presence of the P co-dopant. | Full credit for explaining that P substitution does not alter the Fe oxidation state, which remains slightly higher than Fe(III) as evidenced by the edge position relative to the Fe2O3 standard. |
Review
Identification of engine oil-derived ash nanoparticles and ash formation process for a gasoline direct-injection engine
APS
Environmental
Heeje Seong et al.
DOI: 10.1016/j.envpol.2020.116390
7 scenarios
▶
#357
ash nanoparticles
Ca K-edge
▶
LLM Prompt
Sample Information
Material: ash nanoparticles
Sample Origin: gasoline direct-injection engine
Sample-Specific Conditions
- Engine oil formulation: Oil A
- Engine oil-derived ash nanoparticles from Oil A
Measurement
We plan to measure the Ca K-edge XANES spectrum of this sample.
Questions
Based on all the information above:
1. What reference compounds should be considered as candidate phases for linear combination fitting of the Ca K-edge XANES spectrum of these engine oil-derived ash nanoparticles?
2. Estimate the relative fractions of the major calcium-containing phases in the ash nanoparticles derived from Oil A based on the Ca K-edge XANES analysis.
3. Explain the reasoning behind the identified phase composition for the ash from Oil A, and discuss any potential limitations or discrepancies in this Ca K-edge XANES assignment when considering other elemental data (e.g., sulfur content).
Ground Truth
Material: ash nanoparticles
Measurement: Ca K-edge XANES at beamline 9-BM-B of the Advanced Photon Source (APS)
Fit method: Linear combination fitting of derivative XANES spectra
Phase fractions: (±15%)
| Phase | Fraction |
|---|---|
| CaHPO4-2H2O | 0.51 |
| Ca5(OH)(PO4)3 | 0.3 |
| CaSO4 | 0.11 |
| Ca3(PO4)2 | 0.08 |
Fit basis (paper's reference spectra):
- CaHPO4-2H2O (CPD)
- Ca5(OH)(PO4)3 (CHP)
- Ca3(PO4)2 (CP)
- CaCO3 (CC)
- Ca2P2O7 (CPP)
- Ca(OH)2 (CH)
- CaSO4 (CS)
Source evidence: Figure 5c
Key reasoning: Linear combination fitting of the derivative Ca K-edge XANES spectra indicates that CaHPO4-2H2O (CPD) and Ca5(OH)(PO4)3 (CHP) are the main Ca-containing chemicals in the ash from Oil A. Ca3(PO4)2 (CP) and CaSO4 (CS) are identified as non-trivial contributors. However, cross-checking with P K-edge spectra and STEM-XEDS results (which show very low sulfur) suggests that the CS fraction might be overestimated and CPD might not be a major ash chemical, highlighting limitations of the single-element XANES approach.
Reasoning source: Section 3.2 Proposing raw ash chemicals, page 16
Scoring Rubric (total: 100 pts)
| Q | Type | Max | Question | Reference Answer | Scoring Criteria |
|---|---|---|---|---|---|
| q1 | identification | 30 | What reference compounds should be considered as candidate phases for linear combination fitting of the Ca K-edge XANES spectrum of these engine oil-derived ash nanoparticles? | The candidate reference phases for linear combination fitting of the Ca K-edge XANES spectrum include CaHPO4-2H2O (CPD), Ca5(OH)(PO4)3 (CHP), Ca3(PO4)2 (CP), CaCO3 (CC), Ca2P2O7 (CPP), Ca(OH)2 (CH), and CaSO4 (CS). These specific calcium phosphate, carbonate, hydroxide, and sulfate phases are considered because the sample consists of engine oil-derived ash nanoparticles originating from a gasoline direct-injection engine using Oil A. The specific formulation of Oil A provides the elemental precursors that, under engine operating conditions, form these various inorganic ash compounds. Linear combination fitting of the derivative spectra is then used to identify which of these candidate chemicals are the actual main Ca-containing constituents in the resulting ash. | Full points for listing key calcium phosphates (e.g., CaHPO4-2H2O, Ca5(OH)(PO4)3, Ca3(PO4)2, Ca2P2O7), calcium sulfate (CaSO4), and calcium carbonate/hydroxide, which are typical ash compounds found in engine environments. |
| q2 | quantification | 35 | Estimate the relative fractions of the major calcium-containing phases in the ash nanoparticles derived from Oil A based on the Ca K-edge XANES analysis. | Based on the linear combination fitting of the derivative Ca K-edge XANES spectra, the estimated relative fractions are 0.51 for CaHPO4-2H2O (CPD), 0.30 for Ca5(OH)(PO4)3 (CHP), 0.11 for CaSO4 (CS), and 0.08 for Ca3(PO4)2 (CP), with a 15% uncertainty. These specific values arise because the ash nanoparticles are derived from the specific formulation of Oil A in a gasoline direct-injection engine, which dictates the chemical precursors available to form these ash phases. The fitting indicates that CPD and CHP are the primary Ca-containing chemicals formed from Oil A, while CS and CP act as non-trivial contributors. However, these fractions reflect the limitations of single-element XANES analysis, as cross-checking with STEM-XEDS data showing very low sulfur suggests the 0.11 fraction for CS may be an overestimation. | Full points for identifying CaHPO4-2H2O (~51%) and Ca5(OH)(PO4)3 (~30%) as the dominant phases, with minor contributions from CaSO4 (~11%) and Ca3(PO4)2 (~8%). |
| q3 | reasoning | 35 | Explain the reasoning behind the identified phase composition for the ash from Oil A, and discuss any potential limitations or discrepancies in this Ca K-edge XANES assignment when considering other elemental data (e.g., sulfur content). | The phase composition of the ash nanoparticles is determined through linear combination fitting of the derivative Ca K-edge XANES spectra, which identifies CaHPO4-2H2O (CPD) and Ca5(OH)(PO4)3 (CHP) as the main products, alongside minor contributions from Ca3(PO4)2 (CP) and CaSO4 (CS). This specific composition results from the breakdown of the Oil A formulation within the gasoline direct-injection engine, which provides the calcium, phosphorus, and sulfur precursors for these ash chemicals. However, there are notable limitations to relying solely on this single-element XANES approach. When cross-checking with STEM-XEDS results that show very low sulfur content in the sample, it becomes evident that the CaSO4 fraction is likely overestimated. Furthermore, complementary P K-edge spectra suggest that CPD might not actually be a major chemical in the ash, highlighting discrepancies in the isolated Ca K-edge assignment. | Full points for explaining that LCF of derivative spectra points to CPD and CHP as main phases, but noting that the presence of CaSO4 contradicts low sulfur findings from XEDS, and CPD might be inconsistent with P K-edge data, indicating limitations of single-element XANES fitting. |
Review
#358
ash nanoparticles
Ca K-edge
▶
LLM Prompt
Sample Information
Material: ash nanoparticles
Sample Origin: gasoline direct-injection engine
Sample-Specific Conditions
- Engine oil formulation: Oil B
- Engine oil-derived ash nanoparticles from Oil B
Measurement
We plan to measure the Ca K-edge XANES spectrum of this sample.
Questions
Based on all the information above:
1. What candidate reference spectra should be included in a linear combination fitting (LCF) analysis of the Ca K-edge XANES for this engine oil-derived ash sample?
2. Based on the specific formulation of Oil B, estimate the phase fractions of the major Ca-containing compounds in the resulting ash nanoparticles as determined by derivative Ca K-edge XANES fitting.
3. Explain the physical and analytical reasoning behind the expected phase composition for the ash derived from Oil B, including how the oil's elemental ratio influences the composition and any limitations of the single-element XANES fitting approach for this specific sample.
Ground Truth
Material: ash nanoparticles
Measurement: Ca K-edge XANES at beamline 9-BM-B of the Advanced Photon Source (APS)
Fit method: Linear combination fitting (LCF) of derivative XANES spectra
Phase fractions: (±15%)
| Phase | Fraction |
|---|---|
| CaHPO4-2H2O | 0.33 |
| Ca5(OH)(PO4)3 | 0.3 |
| Ca3(PO4)2 | 0.21 |
| Ca2P2O7 | 0.08 |
| Ca(OH)2 | 0.08 |
Fit basis (paper's reference spectra):
- CaHPO4-2H2O (CPD)
- Ca5(OH)(PO4)3 (CHP)
- Ca3(PO4)2 (CP)
- CaCO3 (CC)
- Ca2P2O7 (CPP)
- Ca(OH)2 (CH)
- CaSO4 (CS)
Source evidence: Figure 5c, page 18
Key reasoning: Derivative fitting of the Ca K-edge spectrum for Oil B ash yields high fractions of CaHPO4-2H2O (CPD) and Ca5(OH)(PO4)3 (CHP). Because Oil B has the lowest ratio of P and Zn to Ca among the tested oils, it shows the highest CHP fraction. However, cross-checking with P K-edge data suggests the high CPD fraction might be an artifact of single-element XANES analysis limitations, meaning CPD is likely not a major chemical. Ca3(PO4)2 (CP) is a likely coexisting phase due to its spectral similarity to CHP. Minor fitted components like Ca2P2O7 and Ca(OH)2 are considered negligible or insignificant.
Reasoning source: Section 3.2, pages 16-17
Scoring Rubric (total: 100 pts)
| Q | Type | Max | Question | Reference Answer | Scoring Criteria |
|---|---|---|---|---|---|
| q1 | identification | 30 | What candidate reference spectra should be included in a linear combination fitting (LCF) analysis of the Ca K-edge XANES for this engine oil-derived ash sample? | The candidate reference spectra for the linear combination fitting (LCF) analysis of the Ca K-edge XANES should include CaHPO4-2H2O (CPD), Ca5(OH)(PO4)3 (CHP), Ca3(PO4)2 (CP), CaCO3 (CC), Ca2P2O7 (CPP), Ca(OH)2 (CH), and CaSO4 (CS). These specific phases are expected because the ash nanoparticles are derived from the combustion of engine oil formulation Oil B in a gasoline direct-injection engine. Because Oil B has the lowest ratio of P and Zn to Ca among the tested oils, it strongly favors the formation of calcium phosphate phases like CHP and CP. The other calcium-based references, such as carbonates, sulfates, hydroxides, and pyrophosphates, must be included to fully capture the complex chemical byproducts formed under these specific engine combustion conditions. | Full points for listing the primary calcium phosphate, sulfate, carbonate, and hydroxide reference phases considered in the study (e.g., CaHPO4-2H2O, Ca5(OH)(PO4)3, Ca3(PO4)2, Ca2P2O7, Ca(OH)2, CaCO3, CaSO4). |
| q2 | quantification | 40 | Based on the specific formulation of Oil B, estimate the phase fractions of the major Ca-containing compounds in the resulting ash nanoparticles as determined by derivative Ca K-edge XANES fitting. | Based on derivative Ca K-edge XANES fitting, the estimated phase fractions for the Oil B ash nanoparticles are 33% CaHPO4-2H2O (CPD), 30% Ca5(OH)(PO4)3 (CHP), 21% Ca3(PO4)2 (CP), 8% Ca2P2O7 (CPP), and 8% Ca(OH)2 (CH), with a 15% uncertainty. These specific values result directly from the elemental composition of Oil B, which features the lowest ratio of P and Zn to Ca among the tested oils. This uniquely low P/Zn-to-Ca ratio chemically drives the formation of the highest fraction of CHP (30%). The 33% CPD fraction emerges as the highest numerical value in the fit, but this is likely an artifact of single-element XANES limitations rather than a true major phase. Finally, the 21% CP fraction arises as a coexisting phase due to its spectral similarity to CHP, while the minor 8% fractions are considered negligible under these engine conditions. | Full points for estimating CaHPO4-2H2O (~33%), Ca5(OH)(PO4)3 (~30%), and Ca3(PO4)2 (~21%) as the dominant fitted phases, with minor contributions from Ca2P2O7 and Ca(OH)2 (~8% each). |
| q3 | reasoning | 30 | Explain the physical and analytical reasoning behind the expected phase composition for the ash derived from Oil B, including how the oil's elemental ratio influences the composition and any limitations of the single-element XANES fitting approach for this specific sample. | The phase composition of the ash nanoparticles is fundamentally driven by the specific elemental formulation of Oil B used in the gasoline direct-injection engine. Because Oil B possesses the lowest ratio of P and Zn to Ca among the tested oils, the combustion chemistry strongly favors the formation of Ca5(OH)(PO4)3 (CHP), resulting in its high phase fraction. Analytically, derivative fitting of the Ca K-edge spectrum also yields a high fraction of CaHPO4-2H2O (CPD) and a significant amount of Ca3(PO4)2 (CP). However, cross-checking with P K-edge data reveals a limitation in this single-element XANES approach: the high CPD fraction is likely a fitting artifact rather than a major chemical reality. Instead, CP is considered a likely coexisting phase due to its spectral similarity to CHP, while minor fitted components like Ca2P2O7 and Ca(OH)2 are analytically insignificant. | Full points for explaining that Oil B's low P & Zn to Ca ratio favors the formation of Ca5(OH)(PO4)3 (CHP), and noting that while CaHPO4-2H2O (CPD) appears high in the Ca K-edge fit, cross-element analysis suggests it may be an artifact of single-element fitting limitations. Mentioning the spectral similarity between CHP and Ca3(PO4)2 (CP) as a reason for their coexistence is also required for full credit. |
Review
#359
ash nanoparticles
Ca K-edge
▶
LLM Prompt
Sample Information
Material: ash nanoparticles
Sample Origin: gasoline direct-injection engine
Sample-Specific Conditions
- Engine oil formulation: Oil D
- Engine oil-derived ash nanoparticles from Oil D
Measurement
We plan to measure the Ca K-edge XANES spectrum of this sample.
Questions
Based on all the information above:
1. What candidate reference spectra should be considered when performing a linear combination fitting analysis of the Ca K-edge XANES for engine oil-derived ash nanoparticles?
2. Based on the Ca K-edge derivative XANES fitting, estimate the phase fractions of the primary calcium compounds in the ash derived from Oil D.
Ground Truth
Material: ash nanoparticles
Measurement: Ca K-edge XANES, beamline 9-BM-B at the Advanced Photon Source (APS)
Fit method: Linear combination fitting of derivative XANES spectra
Phase fractions: (±15%)
| Phase | Fraction |
|---|---|
| CaHPO4-2H2O | 0.54 |
| Ca5(OH)(PO4)3 | 0.25 |
| Ca2P2O7 | 0.08 |
| CaSO4 | 0.13 |
Fit basis (paper's reference spectra):
- CaHPO4-2H2O (CPD)
- Ca5(OH)(PO4)3 (CHP)
- Ca3(PO4)2 (CP)
- CaCO3 (CC)
- Ca2P2O7 (CPP)
- Ca(OH)2 (CH)
- CaSO4 (CS)
Source evidence: Figure 5c, Page 18
Key reasoning: Derivative XANES spectra fitting for the Ca K-edge indicates CaHPO4-2H2O (CPD) and Ca5(OH)(PO4)3 (CHP) as the main components for Oil D ash, with CaSO4 (CS) and Ca2P2O7 (CPP) as minor contributors. However, cross-checking with P K-edge spectra and STEM-XEDS data reveals inconsistencies. The authors suggest CPD is likely not a major ash chemical due to P K-edge mismatch, and CaSO4 (CS) presence is excluded as a major compound because sulfur content is very low in raw ash particles, highlighting the limitations of single-element XANES analysis.
Reasoning source: Section 3.2, Page 16
Scoring Rubric (total: 100 pts)
| Q | Type | Max | Question | Reference Answer | Scoring Criteria |
|---|---|---|---|---|---|
| q1 | identification | 42 | What candidate reference spectra should be considered when performing a linear combination fitting analysis of the Ca K-edge XANES for engine oil-derived ash nanoparticles? | The candidate reference spectra for the linear combination fitting of the derivative Ca K-edge XANES include CaHPO4-2H2O (CPD), Ca5(OH)(PO4)3 (CHP), Ca3(PO4)2 (CP), CaCO3 (CC), Ca2P2O7 (CPP), Ca(OH)2 (CH), and CaSO4 (CS). These specific calcium phosphate, carbonate, hydroxide, and sulfate phases are considered because they represent the expected combustion byproducts of the additives present in the Oil D formulation within a gasoline direct-injection engine. However, while the Ca K-edge fitting might suggest certain phases, cross-checking with P K-edge spectra and STEM-XEDS data reveals that compounds like CS are not major components because the actual sulfur content in the raw engine oil-derived ash particles is very low. | Full credit for identifying the key calcium phosphate, carbonate, hydroxide, and sulfate reference phases (e.g., CaHPO4-2H2O, Ca5(OH)(PO4)3, Ca3(PO4)2, CaCO3, Ca2P2O7, Ca(OH)2, CaSO4) evaluated in the study. |
| q2 | quantification | 58 | Based on the Ca K-edge derivative XANES fitting, estimate the phase fractions of the primary calcium compounds in the ash derived from Oil D. | Based on the derivative Ca K-edge XANES fitting, the estimated phase fractions for the Oil D ash nanoparticles are 54% CaHPO4-2H2O (CPD), 25% Ca5(OH)(PO4)3 (CHP), 13% CaSO4 (CS), and 8% Ca2P2O7 (CPP), with a 15% uncertainty. These specific numerical fractions arise from the mathematical fitting of the Ca K-edge spectra for the combustion byproducts of the Oil D formulation in the gasoline direct-injection engine. However, these fitted values do not perfectly reflect the true physical composition of the ash nanoparticles; the high 54% fraction for CPD is likely incorrect due to a mismatch with P K-edge spectra, and the 13% fraction for CS is excluded as a major compound because the raw ash particles actually contain very low sulfur content. | Full credit for estimating fractions close to 54% CaHPO4-2H2O, 25% Ca5(OH)(PO4)3, 13% CaSO4, and 8% Ca2P2O7. Deduct points proportionally for deviations greater than the 15% uncertainty margin. |
Review
#360
ash nanoparticles
P K-edge
▶
LLM Prompt
Sample Information
Material: ash nanoparticles
Sample Origin: gasoline direct-injection engine
Sample-Specific Conditions
- Engine oil formulation: Oil A
- Engine oil-derived ash nanoparticles from Oil A
Measurement
We plan to measure the P K-edge XANES spectrum of this sample.
Questions
Based on all the information above:
1. What candidate reference spectra should be included in a linear combination fitting (LCF) analysis of the P K-edge XANES spectrum for this engine oil-derived ash sample?
2. Estimate the phase fractions of the phosphorus-containing compounds in this ash sample derived from Oil A.
3. Explain the reasoning for the expected phase composition in this ash sample and why derivative XANES spectra might be preferred over normalized spectra for the fitting analysis.
Ground Truth
Material: ash nanoparticles
Measurement: P K-edge XANES, beamline 9-BM-B at the Advanced Photon Source (APS)
Fit method: Linear combination fitting (LCF) of derivative XANES spectra
Phase fractions: (±15%)
| Phase | Fraction |
|---|---|
| Zn3(PO4)2 | 0.42 |
| Zn2P2O7 | 0.07 |
| Ca5(OH)(PO4)3 | 0.35 |
| Ca3(PO4)2 | 0.16 |
Fit basis (paper's reference spectra):
- Zn3(PO4)2 (ZP)
- CaHPO4-2H2O (CPD)
- Zn2P2O7 (ZPP)
- Ca5(OH)(PO4)3 (CHP)
- Ca3(PO4)2 (CP)
- Ca2P2O7 (CPP)
Source evidence: Figure 5d, page 18
Key reasoning: The chemical composition was determined by linear combination fitting of the derivative P K-edge XANES spectra. For ash derived from Oil A, which contains significant amounts of both Ca and Zn additives, the P K-edge analysis indicates that zinc phosphate (Zn3(PO4)2) and calcium hydroxyapatite (Ca5(OH)(PO4)3) are the major components. Minor contributions from calcium phosphate (Ca3(PO4)2) and zinc pyrophosphate (Zn2P2O7) are also present. Derivative spectra were used for fitting because they better capture and resolve the differences in the shoulder peaks of the normalized P K-edge spectra compared to the original spectra.
Reasoning source: Section 3.2, page 16 and Figure 5d, page 18
Scoring Rubric (total: 100 pts)
| Q | Type | Max | Question | Reference Answer | Scoring Criteria |
|---|---|---|---|---|---|
| q1 | identification | 30 | What candidate reference spectra should be included in a linear combination fitting (LCF) analysis of the P K-edge XANES spectrum for this engine oil-derived ash sample? | The candidate reference spectra for the linear combination fitting (LCF) analysis should include Zn3(PO4)2, CaHPO4-2H2O, Zn2P2O7, Ca5(OH)(PO4)3, Ca3(PO4)2, and Ca2P2O7. These specific phases are expected because the ash nanoparticles are derived from a gasoline direct-injection engine using Oil A. The formulation of Oil A contains significant amounts of both calcium (Ca) and zinc (Zn) additives. Therefore, the combustion of this specific oil naturally produces a mixture of various calcium and zinc phosphates and pyrophosphates in the resulting ash. | Full credit for identifying a mix of calcium and zinc phosphates/pyrophosphates (e.g., Zn3(PO4)2, Ca5(OH)(PO4)3, Ca3(PO4)2, Zn2P2O7). Partial credit for mentioning only Ca-based or only Zn-based phosphates. |
| q2 | quantification | 40 | Estimate the phase fractions of the phosphorus-containing compounds in this ash sample derived from Oil A. | The estimated phase fractions for the phosphorus-containing compounds are 0.42 for Zn3(PO4)2, 0.35 for Ca5(OH)(PO4)3, 0.16 for Ca3(PO4)2, and 0.07 for Zn2P2O7, with an uncertainty of 15%. These specific fractions arise because the ash nanoparticles are generated from the combustion of Oil A in a gasoline direct-injection engine. Since Oil A is formulated with significant amounts of both Ca and Zn additives, zinc phosphate and calcium hydroxyapatite are formed as the major components. Calcium phosphate and zinc pyrophosphate emerge as minor contributions due to the specific balance of these additives in the engine oil. | Full credit for estimating Zn3(PO4)2 at ~40-45%, Ca5(OH)(PO4)3 at ~30-40%, and minor amounts (<20%) of Ca3(PO4)2 and Zn2P2O7. Partial credit for identifying the major phases without accurate percentages, or for being within 20% of the target values. |
| q3 | reasoning | 30 | Explain the reasoning for the expected phase composition in this ash sample and why derivative XANES spectra might be preferred over normalized spectra for the fitting analysis. | The expected phase composition in the ash nanoparticles is a direct result of the specific engine oil formulation used in the gasoline direct-injection engine. Because Oil A contains significant amounts of both Ca and Zn additives, the resulting ash naturally forms a mixture of major (zinc phosphate and calcium hydroxyapatite) and minor (calcium phosphate and zinc pyrophosphate) Ca/Zn phases. To accurately quantify this mixture, derivative P K-edge XANES spectra are preferred for linear combination fitting over standard normalized spectra. Derivative spectra are used because they better capture and resolve the subtle differences in the shoulder peaks of the normalized spectra, which is necessary to distinguish between these structurally similar phosphate compounds. | Full credit for explaining that the presence of both Ca and Zn additives in the formulated oil leads to a mixture of Ca- and Zn-phosphates, and that derivative spectra are used to better capture and resolve subtle differences in the shoulder peaks of the P K-edge spectra. |
Review
#361
ash nanoparticles
P K-edge
▶
LLM Prompt
Sample Information
Material: ash nanoparticles
Sample Origin: gasoline direct-injection engine
Sample-Specific Conditions
- Engine oil formulation: Oil B
- Engine oil-derived ash nanoparticles from Oil B
Measurement
We plan to measure the P K-edge XANES spectrum of this sample.
Questions
Based on all the information above:
1. Identify the candidate phosphorus-containing reference phases that should be considered when analyzing the P K-edge XANES spectrum of engine oil-derived ash.
2. Estimate the phase fractions of the dominant phosphorus-containing compounds in the ash nanoparticles derived from Oil B.
3. Explain the chemical reasoning for the expected phase composition of the ash derived from Oil B, specifically relating the engine oil's elemental composition to the dominant and minor phosphate phases formed.
Ground Truth
Material: ash nanoparticles
Measurement: P K-edge XANES at beamline 9-BM-B of the Advanced Photon Source (APS)
Fit method: Linear combination fitting of derivative XANES spectra
Phase fractions: (±15%)
| Phase | Fraction |
|---|---|
| Zn3(PO4)2 | 0.07 |
| Ca5(OH)(PO4)3 | 0.9 |
| Ca3(PO4)2 | 0.03 |
Fit basis (paper's reference spectra):
- Zn3(PO4)2 (ZP)
- CaHPO4-2H2O (CPD)
- Zn2P2O7 (ZPP)
- Ca5(OH)(PO4)3 (CHP)
- Ca3(PO4)2 (CP)
- Ca2P2O7 (CPP)
Source evidence: Figure 5d, page 18
Key reasoning: Oil B contains the lowest ratio of P and Zn to Ca among the tested formulated oils. Because of this high Ca relative to P and Zn, the ash from Oil B forms predominantly Ca5(OH)(PO4)3 (CHP) and has the least Zn3(PO4)2 (ZP) among the ashes. The derivative fitting of the P K-edge spectra confirms that CHP is the major ash chemical for this high-Ca oil formulation.
Reasoning source: Section 3.2, page 17
Scoring Rubric (total: 100 pts)
| Q | Type | Max | Question | Reference Answer | Scoring Criteria |
|---|---|---|---|---|---|
| q1 | identification | 20 | Identify the candidate phosphorus-containing reference phases that should be considered when analyzing the P K-edge XANES spectrum of engine oil-derived ash. | When analyzing the P K-edge XANES spectrum of engine oil-derived ash nanoparticles, the candidate reference phases to consider are Zn3(PO4)2 (ZP), CaHPO4-2H2O (CPD), Zn2P2O7 (ZPP), Ca5(OH)(PO4)3 (CHP), Ca3(PO4)2 (CP), and Ca2P2O7 (CPP). These specific zinc and calcium phosphate phases are expected because the ash originates from a gasoline direct-injection engine using formulated engine oils containing varying elemental ratios of P, Zn, and Ca. Specifically for the Oil B formulation, the oil contains a very high amount of Ca relative to P and Zn. This elemental composition dictates that the resulting ash will form predominantly calcium-rich phosphate phases alongside minor zinc-containing phosphates, necessitating this specific basis set for linear combination fitting of the derivative spectra. | Full credit for identifying a comprehensive set of calcium and zinc phosphates/pyrophosphates (e.g., Zn3(PO4)2, Ca5(OH)(PO4)3, Ca3(PO4)2, Ca2P2O7, Zn2P2O7). Partial credit for naming at least 3 correct candidate phases. |
| q2 | quantification | 40 | Estimate the phase fractions of the dominant phosphorus-containing compounds in the ash nanoparticles derived from Oil B. | The phase fractions for the ash nanoparticles derived from Oil B are estimated to be 0.90 for Ca5(OH)(PO4)3, 0.07 for Zn3(PO4)2, and 0.03 for Ca3(PO4)2, with an uncertainty of 15%. These specific values result directly from the elemental composition of the Oil B formulation used in the gasoline direct-injection engine. Because Oil B contains the lowest ratio of P and Zn to Ca among the tested oils, the resulting ash composition is heavily skewed toward calcium-rich phases. Consequently, the high Ca concentration relative to P and Zn drives the reaction to form predominantly Ca5(OH)(PO4)3 (90%), while severely limiting the formation of Zn3(PO4)2 to only 7%. | Full credit if Ca5(OH)(PO4)3 is identified as the overwhelmingly dominant phase (~90%) with minor contributions (<10%) from Zn3(PO4)2 and Ca3(PO4)2. Partial credit if Ca5(OH)(PO4)3 is identified as the major phase but fractions are off by more than 15%. |
| q3 | reasoning | 40 | Explain the chemical reasoning for the expected phase composition of the ash derived from Oil B, specifically relating the engine oil's elemental composition to the dominant and minor phosphate phases formed. | The expected phase composition of the ash nanoparticles derived from Oil B is heavily dominated by Ca5(OH)(PO4)3 (90%), with minor amounts of Zn3(PO4)2 (7%) and Ca3(PO4)2 (3%). This composition arises because the Oil B formulation used in the gasoline direct-injection engine contains the lowest ratio of P and Zn to Ca among the tested oils. During ash formation, this high concentration of Ca relative to P and Zn chemically favors the precipitation of calcium-rich phosphate phases. As a result, Ca5(OH)(PO4)3 becomes the major ash chemical, while the limited availability of zinc restricts the formation of Zn3(PO4)2 to a minor component. Linear combination fitting of the derivative P K-edge XANES spectra confirms that this specific phase distribution is a direct consequence of the high-Ca oil formulation. | Full credit for explaining that Oil B has a very low ratio of P and Zn to Ca, which drives the formation of high-calcium phosphate phases like Ca5(OH)(PO4)3 while minimizing the formation of zinc phosphates like Zn3(PO4)2. |
Review
#362
ash nanoparticles
P K-edge
▶
LLM Prompt
Sample Information
Material: ash nanoparticles
Sample Origin: gasoline direct-injection engine
Sample-Specific Conditions
- Engine oil formulation: Oil C
- Engine oil-derived ash nanoparticles from Oil C
Measurement
We plan to measure the P K-edge XANES spectrum of this sample.
Questions
Based on all the information above:
1. What candidate reference spectra (phases) should be included in a linear combination fitting (LCF) analysis for the P K-edge XANES of ash nanoparticles derived from this specific engine oil?
2. Estimate the phase fractions of the major phosphorus-containing compounds in this ash sample based on the provided engine oil formulation (Oil C).
Ground Truth
Material: ash nanoparticles
Measurement: P K-edge XANES at beamline 9-BM-B of the Advanced Photon Source (APS)
Fit method: Linear combination fitting (LCF) of derivative XANES spectra
Phase fractions: (±15%)
| Phase | Fraction |
|---|---|
| Zn3(PO4)2 | 0.26 |
| Zn2P2O7 | 0.08 |
| Ca5(OH)(PO4)3 | 0.44 |
| Ca3(PO4)2 | 0.22 |
Fit basis (paper's reference spectra):
- Zn3(PO4)2 (ZP)
- Zn2P2O7 (ZPP)
- Ca5(OH)(PO4)3 (CHP)
- Ca3(PO4)2 (CP)
- CaHPO4-2H2O (CPD)
- Ca2P2O7 (CPP)
Source evidence: Figure 5d, page 18
Key reasoning: Ash from Oil C is derived from an oil formulation with a relatively high ratio of P and Zn to Ca. Derivative P K-edge XANES fitting reveals that calcium phosphates, specifically Ca5(OH)(PO4)3 (CHP) and Ca3(PO4)2 (CP), are major components. However, zinc phosphates like Zn3(PO4)2 (ZP) and Zn2P2O7 (ZPP) are also significant contributors. The increased presence of these Zn-phosphates correlates directly with the higher Zn content in the specific oil formulation compared to low-Zn oils.
Reasoning source: Section 3.2, pages 16-17
Scoring Rubric (total: 100 pts)
| Q | Type | Max | Question | Reference Answer | Scoring Criteria |
|---|---|---|---|---|---|
| q1 | identification | 33 | What candidate reference spectra (phases) should be included in a linear combination fitting (LCF) analysis for the P K-edge XANES of ash nanoparticles derived from this specific engine oil? | The candidate reference spectra for the LCF analysis of the P K-edge XANES should include Zn3(PO4)2 (ZP), Zn2P2O7 (ZPP), Ca5(OH)(PO4)3 (CHP), Ca3(PO4)2 (CP), CaHPO4-2H2O (CPD), and Ca2P2O7 (CPP). These specific phases are expected because the ash nanoparticles are derived from a gasoline direct-injection engine using Oil C. This specific engine oil formulation contains a relatively high ratio of phosphorus and zinc to calcium. Consequently, the resulting ash is expected to contain a mixture of both calcium phosphates and a significant contribution of zinc phosphates, directly correlating with the higher Zn content in the oil formulation. | Full points if the answer identifies a mix of calcium phosphates (e.g., Ca5(OH)(PO4)3, Ca3(PO4)2) and zinc phosphates (e.g., Zn3(PO4)2, Zn2P2O7) as necessary reference spectra. Partial credit for listing only calcium or only zinc phosphates. |
| q2 | quantification | 67 | Estimate the phase fractions of the major phosphorus-containing compounds in this ash sample based on the provided engine oil formulation (Oil C). | Based on the LCF analysis of the derivative P K-edge XANES spectra, the estimated phase fractions are 0.44 for Ca5(OH)(PO4)3, 0.26 for Zn3(PO4)2, 0.22 for Ca3(PO4)2, and 0.08 for Zn2P2O7, with an uncertainty of 15%. These specific values result from the composition of the Oil C formulation used in the gasoline direct-injection engine. Because Oil C has a relatively high ratio of P and Zn to Ca compared to low-Zn oils, calcium phosphates remain major components, but zinc phosphates become significant contributors. The increased presence of these Zn-phosphate fractions directly correlates with the higher zinc content present in this specific engine oil formulation. | Full points if the estimated fractions are within ±15% of the ground truth: Ca5(OH)(PO4)3 (~44%), Zn3(PO4)2 (~26%), Ca3(PO4)2 (~22%), and Zn2P2O7 (~8%). Partial credit is awarded proportionally for each phase correctly identified and quantified within the tolerance. |
Review
#363
ash nanoparticles
P K-edge
▶
LLM Prompt
Sample Information
Material: ash nanoparticles
Sample Origin: gasoline direct-injection engine
Sample-Specific Conditions
- Engine oil formulation: Oil D
- Engine oil-derived ash nanoparticles from Oil D
Measurement
We plan to measure the P K-edge XANES spectrum of this sample.
Questions
Based on all the information above:
1. Based on the engine oil formulation (Oil D), what are the primary phosphorus-containing phases expected in the resulting ash nanoparticles, and what are their approximate fractions?
2. When performing linear combination fitting (LCF) on the P K-edge XANES spectrum of this sample, what specific reference compounds should be included in the fit basis to accurately capture the speciation of the ash?
Ground Truth
Material: ash nanoparticles
Measurement: P K-edge XANES at beamline 9-BM-B of the Advanced Photon Source (APS)
Fit method: Linear combination fitting (LCF) of derivative XANES spectra
Phase fractions: (±15%)
| Phase | Fraction |
|---|---|
| Zn3(PO4)2 | 0.58 |
| Zn2P2O7 | 0.15 |
| Ca5(OH)(PO4)3 | 0.16 |
| Ca3(PO4)2 | 0.08 |
| Ca2P2O7 | 0.03 |
Fit basis (paper's reference spectra):
- Zn3(PO4)2 (ZP)
- Zn2P2O7 (ZPP)
- Ca5(OH)(PO4)3 (CHP)
- Ca3(PO4)2 (CP)
- Ca2P2O7 (CPP)
- CaHPO4-2H2O (CPD)
Source evidence: Figure 5d, Page 18
Key reasoning: The composition of the ash is strongly influenced by the inorganic elements in the formulated engine oil. Oil D contains a high ratio of P and Zn relative to Ca (780 ppm Ca, 1430 ppm Zn, 1220 ppm P). Consequently, the ash from Oil D exhibits increased fractions of zinc phosphates (Zn3(PO4)2 and Zn2P2O7) and a decreased fraction of calcium hydroxyapatite (Ca5(OH)(PO4)3) compared to ashes from other oils with higher Ca content.
Reasoning source: Page 16, Section 3.2 and Table 1
Scoring Rubric (total: 100 pts)
| Q | Type | Max | Question | Reference Answer | Scoring Criteria |
|---|---|---|---|---|---|
| q1 | quantification | 54 | Based on the engine oil formulation (Oil D), what are the primary phosphorus-containing phases expected in the resulting ash nanoparticles, and what are their approximate fractions? | The primary phosphorus-containing phases expected in the ash nanoparticles are Zn3(PO4)2 (0.58), Ca5(OH)(PO4)3 (0.16), Zn2P2O7 (0.15), Ca3(PO4)2 (0.08), and Ca2P2O7 (0.03), with a fitting uncertainty of 15%. These specific fractions result directly from the inorganic element formulation of Engine Oil D. Oil D contains a high ratio of phosphorus and zinc relative to calcium, specifically 1220 ppm P, 1430 ppm Zn, and only 780 ppm Ca. Because the ash composition is strongly influenced by the oil formulation, this high Zn/Ca ratio mechanistically leads to increased fractions of zinc phosphates (Zn3(PO4)2 and Zn2P2O7) and a decreased fraction of calcium hydroxyapatite (Ca5(OH)(PO4)3) in the final ash. | Full points for identifying Zn3(PO4)2 as the dominant phase (~58%) and listing Zn2P2O7 (~15%) and Ca5(OH)(PO4)3 (~16%) as the major secondary phases. Partial credit for identifying the correct phases without accurate fractions. |
| q3 | identification | 46 | When performing linear combination fitting (LCF) on the P K-edge XANES spectrum of this sample, what specific reference compounds should be included in the fit basis to accurately capture the speciation of the ash? | To accurately capture the speciation of the ash nanoparticles using linear combination fitting (LCF) of derivative P K-edge XANES spectra, the fit basis must include Zn3(PO4)2, Zn2P2O7, Ca5(OH)(PO4)3, Ca3(PO4)2, Ca2P2O7, and CaHPO4-2H2O. These specific reference compounds are expected because the ash is derived from Engine Oil D, which strongly dictates the final inorganic composition of the sample. Oil D is formulated with a high ratio of P and Zn relative to Ca (1220 ppm P, 1430 ppm Zn, 780 ppm Ca). Consequently, the basis set must account for the resulting high fractions of zinc phosphates (Zn3(PO4)2 and Zn2P2O7) and the presence of various calcium phosphates, including a decreased fraction of calcium hydroxyapatite (Ca5(OH)(PO4)3). | Full points for listing the key reference spectra needed: zinc phosphates (Zn3(PO4)2, Zn2P2O7) and calcium phosphates (Ca5(OH)(PO4)3, Ca3(PO4)2, Ca2P2O7, CaHPO4-2H2O). |
Review
Uranium sorption to organic matter and long-term accumulation in a pristine alpine wetland
ESRF-BM23
Environmental
Pierre Lefebvre et al.
DOI: 10.1016/j.gca.2022.10.018
17 scenarios
▶
#364
wetland soil
U L3-edge
▶
LLM Prompt
Sample Information
Material: wetland soil
Sample Origin: Lake Nègre wetland, Mediterranean Alps, France
Sample-Specific Conditions
- Depth: 2-4 cm
- Bulk wetland soil from core C1 at 2-4 cm depth
Measurement
We plan to measure the U L3-edge XANES spectrum of this sample.
Questions
Based on all the information above:
1. What reference spectra (fit basis) are most appropriate to model the U speciation in this organic-rich wetland soil using Linear Combination Fitting?
2. Estimate the fractions of U(VI) and U(IV) in this specific surface soil sample (Core C1, 2-4 cm depth).
3. Explain why the upper 2-4 cm of this wetland soil contains a significant proportion of U(IV) (~42%) compared to the deeper layers which are more U(VI)-dominated, despite the wetland being fed by oxygenated surface waters.
Ground Truth
Material: wetland soil
Measurement: U L3-edge XANES, fluorescence mode, DESY beamline P64
Fit method: Linear Combination Fitting (LCF)
Phase fractions: (±10%)
| Phase | Fraction |
|---|---|
| U(VI) | 0.58 |
| U(IV) | 0.42 |
Fit basis (paper's reference spectra):
- U(VI)-humic acid
- U(IV)-sediment NEG18-07 189-194 cm
Source evidence: Table 1 (page 23); Section 3.5.2 (page 30); Section 4.3.2 (page 48)
Key reasoning: In most of the wetland soil, U(VI) dominates because U is supplied by oxygenated surface waters and scavenged via sorption to organic matter. However, in the upper 2-4 cm of the soil cores, significant proportions of U(IV) (~42-54%) are observed. This higher U(IV) near the surface is hypothesized to result from higher microbial activity near the surface driving local reducing conditions, or alternatively, from subsurface water flow where deeper, more permeable layers allow greater oxidant penetration than the surface layers.
Reasoning source: Section 4.3.2, page 48, lines 1197-1205
Scoring Rubric (total: 100 pts)
| Q | Type | Max | Question | Reference Answer | Scoring Criteria |
|---|---|---|---|---|---|
| q1 | identification | 20 | What reference spectra (fit basis) are most appropriate to model the U speciation in this organic-rich wetland soil using Linear Combination Fitting? | The most appropriate reference spectra for Linear Combination Fitting of this sample are U(VI)-humic acid and U(IV)-sediment (specifically NEG18-07 189-194 cm). These specific phases are expected based on the environmental conditions of the Lake Nègre wetland. Uranium is initially supplied by oxygenated surface waters and scavenged via sorption to organic matter, which necessitates the U(VI)-humic acid reference. Furthermore, the U(IV)-sediment reference is required because the specific 2-4 cm depth of this core experiences localized reducing conditions. These reducing conditions are driven either by high microbial activity near the surface or by subsurface water flow dynamics, leading to the partial reduction of U(VI) to U(IV). | Full points for identifying a U(VI)-organic standard (e.g., U(VI)-humic acid) and a non-crystalline/natural U(IV) standard (e.g., reduced U(IV)-sediment). |
| q2 | quantification | 30 | Estimate the fractions of U(VI) and U(IV) in this specific surface soil sample (Core C1, 2-4 cm depth). | The estimated uranium speciation for this Core C1 sample at 2-4 cm depth is 0.58 (58%) U(VI) and 0.42 (42%) U(IV), with an uncertainty of 10%. These specific values reflect the competing biogeochemical processes occurring at this shallow depth. The majority fraction of 58% U(VI) is expected because uranium is supplied to the wetland by oxygenated surface waters and scavenged by organic matter. However, the significant 42% fraction of U(IV) arises because this specific 2-4 cm layer experiences localized reducing conditions. This reduction is hypothesized to be caused by elevated microbial activity near the surface or by subsurface flow dynamics where deeper layers allow greater oxidant penetration than the surface. | Full points if U(VI) is estimated at 58% ± 10% and U(IV) at 42% ± 10%. |
| q3 | reasoning | 50 | Explain why the upper 2-4 cm of this wetland soil contains a significant proportion of U(IV) (~42%) compared to the deeper layers which are more U(VI)-dominated, despite the wetland being fed by oxygenated surface waters. | The presence of ~42% U(IV) in the upper 2-4 cm of this wetland soil is due to localized reducing conditions that override the overall oxygenated nature of the water supply. In most of the wetland soil, U(VI) dominates because uranium is supplied by oxygenated surface waters and scavenged via sorption to organic matter. However, the shallow 2-4 cm depth is hypothesized to host higher microbial activity, which drives local reducing conditions and converts U(VI) to U(IV). Alternatively, this distribution may result from specific subsurface water flow dynamics in the wetland. In this scenario, deeper, more permeable layers allow for greater oxidant penetration, leaving the less permeable surface layers more reduced and enriched in U(IV). | Full points for explaining that while U(VI) dominates overall due to oxygenated supply and organic sorption, the surface layer experiences local reducing conditions driven by higher microbial activity near the surface, or due to lower permeability at the surface compared to deeper layers restricting oxidant penetration. |
Review
#365
wetland soil
U L3-edge
▶
LLM Prompt
Sample Information
Material: wetland soil
Sample Origin: Lake Nègre wetland, Mediterranean Alps, France
Sample-Specific Conditions
- Depth: 8-10 cm
- Bulk wetland soil from core C1 at 8-10 cm depth
Measurement
We plan to measure the U L3-edge XANES spectrum of this sample.
Questions
Based on all the information above:
1. What reference spectra (fit basis) are most appropriate for modeling the U L3-edge XANES spectrum of this organic-rich wetland soil sample via Linear Combination Fitting?
2. Based on the environmental conditions (waterlogged wetland soil at 8-10 cm depth), estimate the relative fractions of U(VI) and U(IV) in this sample.
3. Explain the biogeochemical mechanisms responsible for the observed U oxidation states in this wetland soil, specifically addressing why U(VI) dominates but a minor U(IV) fraction is present.
Ground Truth
Material: wetland soil
Measurement: U L3-edge XANES, fluorescence mode, DESY beamline P64
Fit method: Linear Combination Fitting (LCF)
Phase fractions: (±3%)
| Phase | Fraction |
|---|---|
| U(VI) | 0.81 |
| U(IV) | 0.19 |
Fit basis (paper's reference spectra):
- U(VI)-humic acid
- U(IV)-sediment NEG18-07 189-194 cm
Source evidence: Table 1; Section 3.5.2
Key reasoning: Uranium is supplied to the wetland by well-oxygenated streams and is primarily scavenged from the aqueous phase via sorption of U(VI) onto organic matter (specifically binding to carboxyl groups). The dominant U(VI) fraction reflects this primary accumulation mechanism. The minor U(IV) fraction (19%) indicates that partial reduction of U(VI) to U(IV) occurs as a secondary step after sorption, driven by local suboxic or reducing conditions in the waterlogged, organic-rich soil matrix.
Reasoning source: Section 4.3.1 (Sorption on organic matter likely governs U accumulation) and Section 4.3.2 (Implications for U redox processes)
Scoring Rubric (total: 100 pts)
| Q | Type | Max | Question | Reference Answer | Scoring Criteria |
|---|---|---|---|---|---|
| q1 | identification | 20 | What reference spectra (fit basis) are most appropriate for modeling the U L3-edge XANES spectrum of this organic-rich wetland soil sample via Linear Combination Fitting? | The most appropriate reference spectra for modeling this U L3-edge XANES spectrum via Linear Combination Fitting are U(VI)-humic acid and U(IV)-sediment (specifically NEG18-07 189-194 cm). These specific phases are expected because uranium is supplied to the wetland by well-oxygenated streams and is primarily scavenged from the aqueous phase via sorption of U(VI) onto organic matter, specifically binding to carboxyl groups. Furthermore, the waterlogged, organic-rich nature of the wetland soil at 8-10 cm depth creates local suboxic or reducing conditions. This environment drives a secondary step where a portion of the sorbed U(VI) undergoes partial reduction to U(IV), necessitating both U(VI)-organic and U(IV)-sediment references to accurately capture the sample's composition. | Full points for identifying a U(VI)-organic standard (e.g., U(VI)-humic acid) and a natural/non-crystalline U(IV) standard (e.g., reduced U(IV) sediment). |
| q2 | quantification | 40 | Based on the environmental conditions (waterlogged wetland soil at 8-10 cm depth), estimate the relative fractions of U(VI) and U(IV) in this sample. | The estimated relative fractions for this wetland soil sample are 81% U(VI) and 19% U(IV), with an uncertainty of 3%. These specific values result from the primary accumulation mechanism in the wetland, where uranium from well-oxygenated streams is scavenged via the sorption of U(VI) onto organic matter. The dominant 81% U(VI) fraction reflects this initial binding to carboxyl groups within the organic-rich soil. The minor 19% U(IV) fraction arises because the waterlogged conditions at 8-10 cm depth create local suboxic or reducing environments. This leads to the partial reduction of U(VI) to U(IV) as a secondary step following the initial sorption process. | Full points for estimating ~81% U(VI) and ~19% U(IV). Deduct points proportionally for deviations greater than the 3% uncertainty margin. |
| q3 | reasoning | 40 | Explain the biogeochemical mechanisms responsible for the observed U oxidation states in this wetland soil, specifically addressing why U(VI) dominates but a minor U(IV) fraction is present. | The observed U oxidation states in this wetland soil are primarily governed by the initial sorption of uranium onto organic matter followed by partial reduction. Uranium is initially supplied to the wetland by well-oxygenated streams, leading to its primary accumulation via the scavenging of U(VI) from the aqueous phase by binding to carboxyl groups on organic matter. This mechanism explains why U(VI) remains the dominant oxidation state (81%) in the soil. However, the sample is located at an 8-10 cm depth within a waterlogged, organic-rich soil matrix, which generates local suboxic or reducing conditions. These specific environmental conditions drive a secondary biogeochemical step where a portion of the sorbed U(VI) is reduced to U(IV), accounting for the minor (19%) U(IV) fraction observed in the sample. | Full points for explaining that U(VI) dominates because the primary scavenging mechanism is sorption of aqueous U(VI) onto organic matter, and that the minor U(IV) fraction results from subsequent, post-sorption partial reduction driven by local suboxic/reducing conditions in the waterlogged soil. |
Review
#366
wetland soil
U L3-edge
▶
LLM Prompt
Sample Information
Material: wetland soil
Sample Origin: Lake Nègre wetland, Mediterranean Alps, France
Sample-Specific Conditions
- Depth: 14-16 cm
- Bulk wetland soil from core C1 at 14-16 cm depth
Measurement
We plan to measure the U L3-edge XANES spectrum of this sample.
Questions
Based on all the information above:
1. Based on the environmental conditions (waterlogged, slightly acidic wetland soil), what are the most appropriate reference spectra or basis functions to include in a Linear Combination Fit (LCF) of the U L3-edge XANES spectrum for this sample?
2. Estimate the relative fractions of U(VI) and U(IV) in this bulk soil sample from 14-16 cm depth.
3. Explain the biogeochemical processes that lead to the expected mixed oxidation state (U(VI) and U(IV)) in this specific depth of the wetland soil core.
Ground Truth
Material: wetland soil
Measurement: U L3-edge XANES, fluorescence mode, DESY beamline P64 (at 10 K)
Fit method: Linear Combination Fitting (LCF)
Phase fractions: (±10%)
| Phase | Fraction |
|---|---|
| U(VI) | 0.65 |
| U(IV) | 0.35 |
Fit basis (paper's reference spectra):
- U(VI)-humic acid
- U(IV)-sediment NEG18-07 189-194 cm
Source evidence: Table 1 and Section 3.5.2
Key reasoning: Uranium is supplied to the wetland by well-oxygenated streams and is primarily scavenged via sorption of U(VI) onto organic matter. The presence of a significant U(IV) fraction (35%) indicates that partial reduction of U(VI) occurs after sorption. This reduction is driven by local suboxic to reducing conditions in the waterlogged, organic-rich soil, and is likely facilitated by microbial activity and electron transfers mediated by the organic matrix.
Reasoning source: Sections 4.3.1 and 4.3.2
Scoring Rubric (total: 100 pts)
| Q | Type | Max | Question | Reference Answer | Scoring Criteria |
|---|---|---|---|---|---|
| q1 | identification | 30 | Based on the environmental conditions (waterlogged, slightly acidic wetland soil), what are the most appropriate reference spectra or basis functions to include in a Linear Combination Fit (LCF) of the U L3-edge XANES spectrum for this sample? | The most appropriate reference spectra for the Linear Combination Fit (LCF) of this sample are U(VI)-humic acid and U(IV)-sediment (specifically NEG18-07 189-194 cm). These specific basis functions are expected because uranium is initially supplied to the wetland by well-oxygenated streams and is primarily scavenged via sorption of U(VI) onto organic matter, making a U(VI)-humic acid reference essential. Furthermore, the U(IV)-sediment reference is required because the waterlogged, organic-rich soil at the 14-16 cm depth creates local suboxic to reducing conditions. These conditions, likely facilitated by microbial activity and organic matrix-mediated electron transfers, drive the partial reduction of the sorbed U(VI) into U(IV). | Full points for identifying a U(VI)-organic complex (e.g., U(VI)-humic acid) and a non-crystalline or natural U(IV) reference (e.g., reduced sediment or U(IV)-humus). Partial points for generic U(VI) and U(IV) standards without specifying organic associations. |
| q2 | quantification | 30 | Estimate the relative fractions of U(VI) and U(IV) in this bulk soil sample from 14-16 cm depth. | The estimated relative fractions for this bulk wetland soil sample at 14-16 cm depth are 65% U(VI) and 35% U(IV), with an uncertainty of 10%. These specific values result from the initial supply of uranium via well-oxygenated streams, which leads to the primary accumulation of U(VI) through sorption onto organic matter. The significant 35% fraction of U(IV) arises because the waterlogged, organic-rich nature of the soil at this depth promotes local suboxic to reducing conditions. Consequently, partial reduction of the sorbed U(VI) occurs post-sorption, driven by microbial activity and electron transfers mediated by the organic matrix. | Full points if the estimated fractions are within the uncertainty bounds of U(VI) = 0.65 and U(IV) = 0.35. Partial points if the prediction correctly identifies U(VI) as the dominant species but with a significant minority of U(IV) (e.g., 20-45%). |
| q3 | reasoning | 40 | Explain the biogeochemical processes that lead to the expected mixed oxidation state (U(VI) and U(IV)) in this specific depth of the wetland soil core. | The mixed oxidation state in this wetland soil core at 14-16 cm depth originates from the initial delivery of uranium by well-oxygenated streams. Upon entering the wetland, the uranium is primarily scavenged from the water via the sorption of U(VI) onto the abundant organic matter present in the soil. Following this initial sorption, the waterlogged and organic-rich conditions at this specific depth create a local suboxic to reducing environment. This environment facilitates microbial activity and electron transfers mediated by the organic matrix, which drives the partial reduction of the sorbed U(VI) into a significant fraction (35%) of U(IV). | Full points for explaining that U is initially supplied and sorbed as U(VI) onto organic matter, followed by partial post-sorption reduction to U(IV) driven by local waterlogged/reducing conditions and potential microbial activity. Partial points for mentioning only sorption or only reduction without the correct sequence. |
Review
#367
wetland soil
U L3-edge
▶
LLM Prompt
Sample Information
Material: wetland soil
Sample Origin: Lake Nègre wetland, Mediterranean Alps, France
Sample-Specific Conditions
- Depth: 18-20 cm
- Bulk wetland soil from core C1 at 18-20 cm depth
Measurement
We plan to measure the U L3-edge XANES spectrum of this sample.
Questions
Based on all the information above:
1. What candidate reference spectra or basis functions are most appropriate for Linear Combination Fitting (LCF) of the U L3-edge XANES data for this organic-rich wetland soil sample?
2. Given the sample's origin as a waterlogged wetland soil supplied by well-oxygenated streams, estimate the phase fractions of U(VI) and U(IV). Provide your estimates as percentages.
3. Explain the geochemical reasoning for the observed U oxidation states in this sample. Why is U(VI) the dominant species despite the waterlogged conditions, and what does the minor presence of U(IV) indicate about the timing of reduction?
Ground Truth
Material: bulk wetland soil
Measurement: U L3-edge XANES, transmission mode, ESRF beamline BM23
Fit method: Linear Combination Fitting (LCF)
Phase fractions: (±9%)
| Phase | Fraction |
|---|---|
| U(VI) | 0.89 |
| U(IV) | 0.11 |
Fit basis (paper's reference spectra):
- U(VI)-humic acid
- U(IV)-sediment NEG18-07 189-194 cm
Source evidence: Table 1 and Section 3.5.2
Key reasoning: Uranium in the wetland soil is predominantly U(VI) (89%), indicating that U supplied by well-oxygenated streams is primarily scavenged via sorption onto organic matter (specifically carboxyl groups) rather than direct reduction. The minor U(IV) fraction (11%) suggests that partial reduction to U(IV) occurs as a secondary step after U(VI) sorption, likely driven by local reducing micro-environments or seasonal water table fluctuations in the waterlogged soil.
Reasoning source: Section 4.3.1 and Section 4.3.2
Scoring Rubric (total: 100 pts)
| Q | Type | Max | Question | Reference Answer | Scoring Criteria |
|---|---|---|---|---|---|
| q1 | identification | 25 | What candidate reference spectra or basis functions are most appropriate for Linear Combination Fitting (LCF) of the U L3-edge XANES data for this organic-rich wetland soil sample? | The most appropriate reference spectra for Linear Combination Fitting (LCF) of this bulk wetland soil sample are U(VI)-humic acid and U(IV)-sediment (specifically NEG18-07 189-194 cm). These specific phases are expected because the sample originates from a wetland soil at 18-20 cm depth supplied by well-oxygenated streams, where uranium is primarily scavenged via sorption onto organic matter. The U(VI)-humic acid reference accounts for this dominant sorption mechanism onto carboxyl groups. The U(IV)-sediment reference is necessary because local reducing micro-environments or seasonal water table fluctuations in the waterlogged soil drive a secondary step of partial reduction to U(IV). | Full points for identifying a U(VI)-organic matter reference (e.g., U(VI)-humic acid) and a natural non-crystalline U(IV) reference (e.g., reduced U(IV)-sediment). |
| q2 | quantification | 35 | Given the sample's origin as a waterlogged wetland soil supplied by well-oxygenated streams, estimate the phase fractions of U(VI) and U(IV). Provide your estimates as percentages. | The estimated phase fractions for this wetland soil sample are 89% U(VI) and 11% U(IV), with an uncertainty of 9%. These specific values result from the environmental conditions of the Lake Nègre wetland, where well-oxygenated streams supply uranium that is predominantly scavenged by sorption onto organic matter rather than undergoing direct reduction. The dominant 89% U(VI) fraction reflects this primary binding to carboxyl groups in the soil at 18-20 cm depth. The minor 11% U(IV) fraction arises because the waterlogged conditions create local reducing micro-environments or seasonal water table fluctuations, leading to partial reduction as a secondary step after initial sorption. | Full points if U(VI) is estimated around 89% (±9%) and U(IV) around 11% (±9%). Partial credit for identifying U(VI) as the heavily dominant phase (>80%). |
| q3 | reasoning | 40 | Explain the geochemical reasoning for the observed U oxidation states in this sample. Why is U(VI) the dominant species despite the waterlogged conditions, and what does the minor presence of U(IV) indicate about the timing of reduction? | In this bulk wetland soil from 18-20 cm depth, U(VI) is the dominant species (89%) because uranium supplied by well-oxygenated streams is primarily scavenged via sorption onto organic matter, specifically carboxyl groups. This indicates that direct reduction does not immediately occur upon entering the wetland despite the waterlogged state. Instead, the minor presence of U(IV) (11%) indicates that partial reduction to U(IV) happens as a secondary step following the initial U(VI) sorption. This delayed reduction is likely driven by local reducing micro-environments or seasonal water table fluctuations inherent to the Lake Nègre wetland soil. | Full points for explaining that U(VI) dominates because the primary scavenging mechanism is sorption onto organic matter from oxygenated stream water, rather than direct reduction. Must also note that the minor U(IV) indicates reduction occurs as a secondary step after sorption, driven by local reducing micro-environments. |
Review
#368
wetland soil
U L3-edge
▶
LLM Prompt
Sample Information
Material: wetland soil
Sample Origin: Lake Nègre wetland, Mediterranean Alps, France
Sample-Specific Conditions
- Depth: 20-22 cm
- Bulk wetland soil from core C1 at 20-22 cm depth
Measurement
We plan to measure the U L3-edge XANES spectrum of this sample.
Questions
Based on all the information above:
1. What candidate reference spectra (basis functions) are most appropriate for modeling the U L3-edge XANES spectrum of this organic-rich wetland soil via Linear Combination Fitting?
2. Based on the environmental conditions (waterlogged wetland soil with U supplied by oxygenated streams), estimate the relative fractions of U oxidation states in this sample at 20-22 cm depth.
3. Explain the biogeochemical reasoning for the observed distribution of U oxidation states in this sample. Why is one oxidation state dominant, and what process accounts for the minor fraction?
Ground Truth
Material: wetland soil
Measurement: U L3-edge XANES, transmission detection mode, ESRF beamline BM23
Fit method: Linear Combination Fitting (LCF)
Phase fractions: (±7%)
| Phase | Fraction |
|---|---|
| U(VI) | 0.9 |
| U(IV) | 0.1 |
Fit basis (paper's reference spectra):
- U(VI)-humic acid
- U(IV)-sediment NEG18-07 189-194 cm
Source evidence: Table 1 and Section 3.5.2
Key reasoning: Uranium is supplied to the wetland by well-oxygenated streams and accumulates primarily via sorption of U(VI) to organic matter (carboxyl groups) in the soil. The dominant U(VI) fraction (90%) confirms that direct reduction to U(IV) is not the main scavenging mechanism. The minor U(IV) fraction (10%) is attributed to partial reduction occurring after U(VI) sorption, driven by local suboxic/reducing conditions in the waterlogged, organic-rich soil.
Reasoning source: Section 4.3.1 (Sorption on organic matter likely governs U accumulation) and Section 4.3.2 (Implications for U redox processes)
Scoring Rubric (total: 100 pts)
| Q | Type | Max | Question | Reference Answer | Scoring Criteria |
|---|---|---|---|---|---|
| q1 | identification | 20 | What candidate reference spectra (basis functions) are most appropriate for modeling the U L3-edge XANES spectrum of this organic-rich wetland soil via Linear Combination Fitting? | The most appropriate reference spectra for modeling this wetland soil sample via Linear Combination Fitting are U(VI)-humic acid and U(IV)-sediment (specifically NEG18-07 189-194 cm). These specific phases are expected because uranium is supplied to the wetland by well-oxygenated streams and primarily accumulates through the sorption of U(VI) to organic matter, specifically carboxyl groups in the soil. The U(IV) reference is also necessary because the waterlogged, organic-rich nature of the soil at the 20-22 cm depth creates local suboxic or reducing conditions. These environmental conditions drive the partial reduction of uranium after its initial sorption, necessitating both U(VI)-organic and U(IV) basis functions to accurately capture the speciation. | Full credit for identifying an organic-bound U(VI) reference (e.g., U(VI)-humic acid) and a natural/non-crystalline U(IV) reference (e.g., reduced sediment or biogenic U(IV)). |
| q2 | quantification | 30 | Based on the environmental conditions (waterlogged wetland soil with U supplied by oxygenated streams), estimate the relative fractions of U oxidation states in this sample at 20-22 cm depth. | The relative fractions of uranium oxidation states in this wetland soil sample are 90% U(VI) and 10% U(IV), with an uncertainty of 7%. These specific values result from the environmental conditions where uranium is continuously supplied by well-oxygenated streams, leading to its primary accumulation via sorption of U(VI) to organic matter rather than direct reduction. The dominant 90% U(VI) fraction confirms that this sorption to carboxyl groups is the main scavenging mechanism in the soil. The minor 10% U(IV) fraction arises because the waterlogged, organic-rich environment at the 20-22 cm depth creates localized suboxic or reducing conditions. This environment facilitates a slight, partial reduction of the uranium only after the initial U(VI) sorption has occurred. | Full credit for estimating ~90% U(VI) and ~10% U(IV). Partial credit if U(VI) is identified as the heavily dominant phase (>80%) with a minor U(IV) component. |
| q3 | reasoning | 50 | Explain the biogeochemical reasoning for the observed distribution of U oxidation states in this sample. Why is one oxidation state dominant, and what process accounts for the minor fraction? | The dominant oxidation state in this wetland soil is U(VI) at 90%, which occurs because uranium is supplied to the wetland by well-oxygenated streams. This oxygenated supply dictates that uranium accumulates primarily via sorption of U(VI) to organic matter, specifically carboxyl groups, rather than through direct reduction to U(IV) as a primary scavenging mechanism. The minor fraction of 10% U(IV) is accounted for by partial reduction processes occurring after the initial U(VI) sorption. This secondary reduction is driven by the specific conditions at the 20-22 cm depth, where the waterlogged and organic-rich nature of the soil generates local suboxic or reducing environments. | Full credit for explaining that U(VI) dominates because the primary scavenging mechanism is U(VI) sorption to organic matter from oxygenated stream waters, rather than direct reduction. Must also note that the minor U(IV) fraction results from subsequent, post-sorption partial reduction due to local waterlogged/reducing conditions. |
Review
#369
wetland soil
U L3-edge
▶
LLM Prompt
Sample Information
Material: wetland soil
Sample Origin: Lake Nègre wetland, Mediterranean Alps, France
Sample-Specific Conditions
- Depth: 2-4 cm
- Bulk wetland soil from core C2 at 2-4 cm depth
Measurement
We plan to measure the U L3-edge XANES spectrum of this sample.
Questions
Based on all the information above:
1. What reference spectra or basis functions are most appropriate for modeling the U L3-edge XANES spectrum of this organic-rich wetland soil sample via Linear Combination Fitting?
2. Based on the sample's location in the upper layer (2-4 cm) of the partially water-saturated core C2, estimate the relative fractions of U(VI) and U(IV) present in the sample.
3. Explain the physical or biological mechanisms that would lead to a significant proportion of U(IV) in this specific near-surface sample (C2 2-4 cm), despite the typical U(VI) dominance expected from oxygenated surface water supply.
Ground Truth
Material: wetland soil
Measurement: U L3-edge XANES, fluorescence detection mode, beamline P64 at DESY
Fit method: Linear Combination Fitting (LCF)
Phase fractions: (±4%)
| Phase | Fraction |
|---|---|
| U(VI) | 0.46 |
| U(IV) | 0.54 |
Fit basis (paper's reference spectra):
- U(VI)-humic acid
- U(IV)-sediment NEG18-07 189-194 cm
Source evidence: Table 1, Figure 8a, Section 3.5.2
Key reasoning: Unlike most samples in the wetland which are dominated by U(VI), the upper sample of core C2 (2-4 cm) contains U(VI) and U(IV) in similar proportions. This higher proportion of U(IV) near the surface is hypothesized to result from lower permeability in the upper layers limiting oxidant penetration, leading to more reducing conditions. Additionally, higher microbial activity near the surface could also drive these local reducing conditions.
Reasoning source: Section 3.5.2 and Section 4.3.2
Scoring Rubric (total: 100 pts)
| Q | Type | Max | Question | Reference Answer | Scoring Criteria |
|---|---|---|---|---|---|
| q1 | identification | 20 | What reference spectra or basis functions are most appropriate for modeling the U L3-edge XANES spectrum of this organic-rich wetland soil sample via Linear Combination Fitting? | The most appropriate reference spectra for modeling the U L3-edge XANES spectrum of this sample via Linear Combination Fitting are U(VI)-humic acid and U(IV)-sediment (specifically NEG18-07 189-194 cm). These specific phases are expected because this wetland soil sample from core C2 at 2-4 cm depth contains a mixture of both oxidation states. The presence of U(VI) bound to humic acid reflects the organic-rich nature of the wetland soil. Meanwhile, the U(IV) phase arises because lower permeability in this upper layer limits oxidant penetration, and higher microbial activity drives local reducing conditions, allowing U(IV) to form alongside U(VI). | Full credit for identifying a U(VI)-organic complex (e.g., U(VI)-humic acid) and a natural or non-crystalline U(IV) reference (e.g., reduced U(IV)-sediment). |
| q2 | quantification | 40 | Based on the sample's location in the upper layer (2-4 cm) of the partially water-saturated core C2, estimate the relative fractions of U(VI) and U(IV) present in the sample. | The relative fractions present in this sample are 0.46 (46%) U(VI) and 0.54 (54%) U(IV), with an uncertainty of 4%. These specific values, which show similar proportions of both oxidation states, are unusual compared to most wetland samples that are typically dominated by U(VI). This nearly equal split results from the specific conditions at the 2-4 cm depth of core C2, where lower soil permeability restricts the penetration of oxidants. Consequently, this physical limitation combined with higher microbial activity near the surface creates localized reducing conditions that stabilize a significant fraction of U(IV) alongside the U(VI). | Full credit for stating that U(VI) and U(IV) are present in roughly equal proportions (approximately 46% U(VI) and 54% U(IV)). Partial credit for identifying a mixed oxidation state without specific near-equal proportions. |
| q3 | reasoning | 40 | Explain the physical or biological mechanisms that would lead to a significant proportion of U(IV) in this specific near-surface sample (C2 2-4 cm), despite the typical U(VI) dominance expected from oxygenated surface water supply. | In this wetland soil sample from core C2 at 2-4 cm depth, the significant proportion of U(IV) is driven by a combination of physical and biological mechanisms. Physically, the upper layers of this specific core exhibit lower permeability, which severely limits the penetration of oxidants from the surface water. Biologically, there is higher microbial activity near the surface of the wetland soil. Together, this restricted oxidant supply and active microbial respiration create localized reducing conditions. As a result, these mechanisms overcome the typical oxygenated environment, leading to the stabilization of U(IV) at a fraction of 54% alongside U(VI). | Full credit for explaining that lower permeability in the upper soil layers limits oxidant penetration (creating reducing conditions) AND/OR that higher microbial activity near the surface drives local reducing conditions. |
Review
#370
wetland soil
U L3-edge
▶
LLM Prompt
Sample Information
Material: wetland soil
Sample Origin: Lake Nègre wetland, Mediterranean Alps, France
Sample-Specific Conditions
- Depth: 8-10 cm
- Bulk wetland soil from core C2 at 8-10 cm depth
Measurement
We plan to measure the U L3-edge XANES spectrum of this sample.
Questions
Based on all the information above:
1. What reference spectra or basis functions are most appropriate for modeling the U L3-edge XANES spectrum of this organic-rich wetland soil sample via Linear Combination Fitting?
2. Based on the environmental conditions (partially water-saturated, suboxic wetland soil at 8-10 cm depth), estimate the relative fractions of U(VI) and U(IV) in this sample.
3. Explain the biogeochemical processes that lead to the observed mixture of U(VI) and U(IV) in this specific wetland soil environment.
Ground Truth
Material: wetland soil
Measurement: U L3-edge XANES, fluorescence mode, DESY beamline P64
Fit method: Linear Combination Fitting (LCF)
Phase fractions: (±13%)
| Phase | Fraction |
|---|---|
| U(VI) | 0.78 |
| U(IV) | 0.22 |
Fit basis (paper's reference spectra):
- U(VI)-humic acid
- U(IV)-sediment NEG18-07 189-194 cm
Source evidence: Table 1 and Section 3.5.2
Key reasoning: Uranium is supplied to the wetland by well-oxygenated streams as U(VI) and accumulates primarily through sorption to organic matter, which is abundant in the upper part of core C2. The dominant oxidation state remains U(VI) (78%). The presence of a significant fraction of U(IV) (22%) indicates that partial reduction of U(VI) occurs after sorption, driven by local suboxic or reducing conditions in the waterlogged, organic-rich soil.
Reasoning source: Sections 4.1.1, 4.3.1, and 4.3.2
Scoring Rubric (total: 100 pts)
| Q | Type | Max | Question | Reference Answer | Scoring Criteria |
|---|---|---|---|---|---|
| q1 | identification | 30 | What reference spectra or basis functions are most appropriate for modeling the U L3-edge XANES spectrum of this organic-rich wetland soil sample via Linear Combination Fitting? | The most appropriate basis functions for modeling this U L3-edge XANES spectrum via Linear Combination Fitting are U(VI)-humic acid and U(IV)-sediment (specifically NEG18-07 189-194 cm). These specific reference phases are expected because uranium is initially supplied to the wetland by well-oxygenated streams as U(VI) and accumulates primarily through sorption to the abundant organic matter present at the 8-10 cm depth of core C2. Additionally, the waterlogged, organic-rich nature of this wetland soil creates local suboxic or reducing conditions. This specific environment drives the partial reduction of the sorbed U(VI) into U(IV), necessitating both U(VI)-organic and U(IV)-sediment reference spectra to accurately capture the mixed oxidation states. | Full points for identifying a U(VI)-organic complex (e.g., U(VI)-humic acid) and a non-crystalline or natural U(IV) reference (e.g., reduced sediment or U(IV)-humus). Partial points for generic U(VI) and U(IV) references without specifying the organic/natural association. |
| q2 | quantification | 30 | Based on the environmental conditions (partially water-saturated, suboxic wetland soil at 8-10 cm depth), estimate the relative fractions of U(VI) and U(IV) in this sample. | The estimated relative fractions for this wetland soil sample are 78% U(VI) and 22% U(IV), with an uncertainty of 13%. These specific values result from the initial supply of uranium via well-oxygenated streams, which causes U(VI) to accumulate heavily through sorption to the abundant organic matter at this 8-10 cm depth. The dominant fraction remains U(VI) because this sorption to organic matter is the primary accumulation mechanism in the upper soil core. However, a significant 22% fraction of U(IV) is produced because the waterlogged, organic-rich conditions of the wetland soil create local suboxic or reducing environments that drive the partial reduction of U(VI) after it has sorbed. | Full points if the estimated fractions are within the uncertainty range (U(VI) ~78% ± 13%, U(IV) ~22% ± 13%). Partial points if the prediction correctly identifies U(VI) as the dominant phase with a minor but significant U(IV) component. |
| q3 | reasoning | 40 | Explain the biogeochemical processes that lead to the observed mixture of U(VI) and U(IV) in this specific wetland soil environment. | In this wetland soil environment, uranium is initially supplied by well-oxygenated streams in its oxidized form, U(VI). Upon reaching the upper 8-10 cm of the soil core, this U(VI) accumulates primarily through sorption to the abundant organic matter, which explains why U(VI) remains the dominant oxidation state at 78%. Following this initial sorption, the waterlogged and organic-rich nature of the wetland soil establishes local suboxic or reducing conditions. These specific environmental conditions drive a secondary biogeochemical process where the sorbed U(VI) undergoes partial reduction, resulting in the observed 22% fraction of U(IV) in the sample. | Full points for explaining that U is supplied as aqueous U(VI), scavenged primarily via sorption to abundant organic matter (keeping it as U(VI)), followed by partial, post-sorption reduction to U(IV) driven by local suboxic/reducing conditions in the waterlogged soil. |
Review
#371
wetland soil
U L3-edge
▶
LLM Prompt
Sample Information
Material: wetland soil
Sample Origin: Lake Nègre wetland, Mediterranean Alps, France
Sample-Specific Conditions
- Depth: 14-16 cm
- Bulk wetland soil from core C2 at 14-16 cm depth
Measurement
We plan to measure the U L3-edge XANES spectrum of this sample.
Questions
Based on all the information above:
1. What reference spectra (fit basis components) are most appropriate for modeling the U L3-edge XANES spectrum of this organic-rich wetland soil sample?
2. Based on the environmental conditions (suboxic, partially water-saturated wetland soil), estimate the relative fractions of U(VI) and U(IV) in this sample.
3. Explain the biogeochemical reasoning for the observed coexistence of U(VI) and U(IV) in this sample, considering the source of the uranium and the local wetland conditions.
Ground Truth
Material: wetland soil
Measurement: U L3-edge XANES, fluorescence detection mode, DESY beamline P64
Fit method: Linear Combination Fitting (LCF)
Phase fractions: (±5%)
| Phase | Fraction |
|---|---|
| U(VI) | 0.8 |
| U(IV) | 0.2 |
Fit basis (paper's reference spectra):
- U(VI)-humic acid
- U(IV)-sediment NEG18-07 189-194 cm
Source evidence: Table 1 (page 23) and Section 3.5.2 (page 30)
Key reasoning: Uranium is supplied to the wetland by well-oxygenated streams primarily as dissolved U(VI). The dominant U(VI) fraction (80%) is scavenged through sorption to organic matter in the soil. The presence of 20% U(IV) indicates that partial reduction of U(VI) occurs after sorption, driven by local suboxic redox conditions and facilitated by organic matter and microbial activity in the partially water-saturated soil.
Reasoning source: Section 4.3.1 and 4.3.2 (pages 45-47)
Scoring Rubric (total: 100 pts)
| Q | Type | Max | Question | Reference Answer | Scoring Criteria |
|---|---|---|---|---|---|
| q1 | identification | 25 | What reference spectra (fit basis components) are most appropriate for modeling the U L3-edge XANES spectrum of this organic-rich wetland soil sample? | The most appropriate reference spectra for modeling the U L3-edge XANES spectrum of this sample are U(VI)-humic acid and U(IV)-sediment (specifically NEG18-07 189-194 cm). These specific phases are expected because uranium is initially supplied to the Lake Nègre wetland by well-oxygenated streams as dissolved U(VI), which is then scavenged through sorption to organic matter in the soil, forming the U(VI)-humic acid component. The U(IV)-sediment component arises because the partially water-saturated conditions at the 14-16 cm depth create local suboxic redox environments. Within these suboxic zones, organic matter and microbial activity facilitate the partial reduction of the sorbed U(VI) into U(IV). | Full points for identifying a U(VI)-organic complex (e.g., U(VI)-humic acid) and a natural non-crystalline U(IV) reference (e.g., reduced U(IV)-sediment). |
| q2 | quantification | 35 | Based on the environmental conditions (suboxic, partially water-saturated wetland soil), estimate the relative fractions of U(VI) and U(IV) in this sample. | The estimated relative fractions for this wetland soil sample are 80% U(VI) and 20% U(IV), with an uncertainty of 5%. These specific values result from the continuous supply of dissolved U(VI) from well-oxygenated streams, which is predominantly scavenged and stabilized by sorption to organic matter in the soil, maintaining a high U(VI) majority. The 20% U(IV) fraction reflects the extent of partial reduction occurring at the 14-16 cm depth. This partial reduction is driven by the local suboxic redox conditions inherent to the partially water-saturated wetland environment, where microbial activity and organic matter facilitate the conversion of a portion of the U(VI) to U(IV) after initial sorption. | Full points for estimating U(VI) at approximately 80% and U(IV) at approximately 20% (within the 5% uncertainty margin). |
| q3 | reasoning | 40 | Explain the biogeochemical reasoning for the observed coexistence of U(VI) and U(IV) in this sample, considering the source of the uranium and the local wetland conditions. | The coexistence of U(VI) and U(IV) in this wetland soil sample is driven by the interplay between the uranium source and the local redox environment at the 14-16 cm depth. Uranium enters the wetland via well-oxygenated streams primarily as dissolved U(VI), where it is initially scavenged through sorption to organic matter, accounting for the dominant 80% U(VI) fraction. However, the partially water-saturated nature of the soil at this depth creates local suboxic conditions. Within these suboxic zones, organic matter and microbial activity drive the partial reduction of the sorbed U(VI), resulting in the formation of the 20% U(IV) fraction. Therefore, the observed coexistence directly reflects the balance between continuous U(VI) input and subsequent in-situ microbial reduction. | Full points for explaining that U is supplied as U(VI) by oxygenated streams, scavenged primarily via sorption to organic matter (retaining the U(VI) state), and subsequently partially reduced to U(IV) due to local suboxic conditions and microbial activity. |
Review
#372
wetland soil
U L3-edge
▶
LLM Prompt
Sample Information
Material: wetland soil
Sample Origin: Lake Nègre wetland, Mediterranean Alps, France
Sample-Specific Conditions
- Depth: 20-22 cm
- Bulk wetland soil from core C2 at 20-22 cm depth
Measurement
We plan to measure the U L3-edge XANES spectrum of this sample.
Questions
Based on all the information above:
1. What reference spectra (end-members) are most appropriate to model the U L3-edge XANES spectrum of this organic-rich wetland soil sample using Linear Combination Fitting?
2. Based on the environmental conditions (suboxic, partially water-saturated wetland soil at 20-22 cm depth), estimate the relative fractions of U(VI) and U(IV) in this sample.
3. Explain the biogeochemical sequence of events that leads to the observed mixture of U(VI) and U(IV) in this specific wetland soil layer.
Ground Truth
Material: wetland soil
Measurement: U L3-edge XANES, fluorescence mode, DESY beamline P64
Fit method: Linear Combination Fitting (LCF)
Phase fractions: (±9%)
| Phase | Fraction |
|---|---|
| U(VI) | 0.61 |
| U(IV) | 0.39 |
Fit basis (paper's reference spectra):
- U(VI)-humic acid
- U(IV)-sediment NEG18-07 189-194 cm
Source evidence: Table 1 and Section 3.5.2
Key reasoning: Uranium is supplied to the wetland by well-oxygenated streams as U(VI) and is primarily scavenged through sorption to organic matter. The presence of a significant U(IV) fraction (39%) in this suboxic, partially water-saturated soil layer indicates that partial reduction of U(VI) to U(IV) occurs after sorption. This reduction is driven by local reducing conditions in the waterlogged soil, potentially facilitated by microbial activity and electron transfers on the organic matter surfaces.
Reasoning source: Section 4.3.1 (Sorption on organic matter likely governs U accumulation) and Section 4.3.2 (Implications for U redox processes)
Scoring Rubric (total: 100 pts)
| Q | Type | Max | Question | Reference Answer | Scoring Criteria |
|---|---|---|---|---|---|
| q1 | identification | 20 | What reference spectra (end-members) are most appropriate to model the U L3-edge XANES spectrum of this organic-rich wetland soil sample using Linear Combination Fitting? | The most appropriate reference spectra for Linear Combination Fitting of this sample are U(VI)-humic acid and U(IV)-sediment (specifically NEG18-07 189-194 cm). These specific end-members are required because uranium is initially supplied to the Lake Nègre wetland by well-oxygenated streams as U(VI) and is primarily scavenged through sorption to organic matter, making the U(VI)-humic acid reference essential. Furthermore, the 20-22 cm depth represents a suboxic, partially water-saturated soil layer where local reducing conditions and microbial activity drive the partial reduction of the sorbed U(VI) into U(IV). Therefore, a U(IV)-sediment reference is needed to accurately capture the reduced fraction formed within this waterlogged environment. | Full points for identifying a U(VI)-organic standard (e.g., U(VI)-humic acid) and a natural non-crystalline U(IV) standard (e.g., reduced U(IV)-sediment). |
| q2 | quantification | 40 | Based on the environmental conditions (suboxic, partially water-saturated wetland soil at 20-22 cm depth), estimate the relative fractions of U(VI) and U(IV) in this sample. | The estimated relative fractions for this wetland soil sample at 20-22 cm depth are 61% U(VI) and 39% U(IV), with an uncertainty of 9%. This specific distribution arises because uranium enters the wetland from well-oxygenated streams as U(VI) and is initially scavenged by sorption to organic matter, which accounts for the dominant 61% U(VI) pool. However, at this specific depth, the soil is suboxic and partially water-saturated, creating local waterlogged reducing conditions. These conditions, potentially facilitated by microbial activity and electron transfers on organic matter surfaces, cause the partial reduction of the sorbed U(VI), resulting in the significant 39% U(IV) fraction observed. | Full points for estimating U(VI) at ~61% and U(IV) at ~39% (allow ±9% based on the reported uncertainty). Partial points for correctly identifying U(VI) as the dominant phase with a substantial minority of U(IV). |
| q3 | reasoning | 40 | Explain the biogeochemical sequence of events that leads to the observed mixture of U(VI) and U(IV) in this specific wetland soil layer. | The biogeochemical sequence begins with uranium being supplied to the Lake Nègre wetland by well-oxygenated streams in its oxidized form, U(VI). Upon entering the wetland soil, this U(VI) is primarily scavenged from the water through sorption onto organic matter surfaces. Because the soil at the 20-22 cm depth is suboxic and partially water-saturated, it provides a localized waterlogged environment with reducing conditions. Within this layer, microbial activity and electron transfers on the organic matter surfaces facilitate the partial reduction of the sorbed U(VI) into U(IV). This sequence of initial organic scavenging followed by in-situ partial reduction directly produces the observed mixed oxidation state of 61% U(VI) and 39% U(IV) found in the sample. | Full points for explaining that U is initially supplied by oxygenated streams as U(VI), scavenged primarily via sorption to organic matter, and subsequently undergoes partial reduction to U(IV) driven by the local suboxic/reducing conditions of the waterlogged soil. |
Review
#373
wetland soil
U L3-edge
▶
LLM Prompt
Sample Information
Material: wetland soil
Sample Origin: Lake Nègre wetland, Mediterranean Alps, France
Sample-Specific Conditions
- Depth: 24-30 cm
- Bulk wetland soil from core C2 at 24-30 cm depth
Measurement
We plan to measure the U L3-edge XANES spectrum of this sample.
Questions
Based on all the information above:
1. Identify the appropriate reference spectra (fit basis) required to model the U L3-edge XANES data for this wetland soil sample via Linear Combination Fitting.
2. Estimate the relative fractions of U(VI) and U(IV) in this deep (24-30 cm) wetland soil sample. What is a notable analytical caveat associated with the XANES measurement of this specific depth interval?
3. Provide the biogeochemical reasoning for the observed U oxidation states in this wetland core. Why does U(VI) remain the dominant species, and what is the mechanism for the presence of the minor U(IV) fraction?
Ground Truth
Material: wetland soil
Measurement: U L3-edge XANES, fluorescence detection mode, DESY beamline P64
Fit method: Linear Combination Fitting (LCF)
Phase fractions: (±39%)
| Phase | Fraction |
|---|---|
| U(VI) | 0.73 |
| U(IV) | 0.27 |
Fit basis (paper's reference spectra):
- U(VI)-humic acid
- U(IV)-sediment NEG18-07 189-194 cm
Source evidence: Table 1, page 23; Section 3.5.2, page 30
Key reasoning: Uranium in the wetland soils is predominantly U(VI) because it is supplied by well-oxygenated streams and scavenged primarily via sorption onto organic matter. Partial reduction to U(IV) occurs as a second step after sorption, driven by local suboxic conditions. For this specific sample at the bottom of core C2 (24-30 cm), which corresponds to an organic-poor granitic sand with low U content (113 µg/g), the XANES data quality was low, resulting in high fit uncertainties (39% for U(VI)). Nevertheless, the fit still indicates a U(VI)-dominated speciation (73%) with a minor U(IV) component (27%).
Reasoning source: Section 3.1.3, page 20; Table 1 caption, page 23; Section 4.3.1, page 46
Scoring Rubric (total: 100 pts)
| Q | Type | Max | Question | Reference Answer | Scoring Criteria |
|---|---|---|---|---|---|
| q1 | identification | 20 | Identify the appropriate reference spectra (fit basis) required to model the U L3-edge XANES data for this wetland soil sample via Linear Combination Fitting. | To model the U L3-edge XANES data for this wetland soil sample via Linear Combination Fitting, the appropriate reference spectra are U(VI)-humic acid and U(IV)-sediment (NEG18-07 189-194 cm). These specific phases are required because uranium in this Lake Nègre wetland soil is primarily supplied by well-oxygenated streams and scavenged via sorption onto organic matter, necessitating a U(VI)-organic reference. The U(IV)-sediment reference is needed because local suboxic conditions in the soil core drive a secondary partial reduction of the sorbed uranium. Consequently, this combination accurately captures the mixed oxidation states present in the 24-30 cm depth interval. | Full credit for identifying a U(VI)-organic standard (specifically U(VI)-humic acid) and a natural/noncrystalline U(IV) standard (specifically U(IV)-sediment). |
| q2 | quantification | 40 | Estimate the relative fractions of U(VI) and U(IV) in this deep (24-30 cm) wetland soil sample. What is a notable analytical caveat associated with the XANES measurement of this specific depth interval? | The relative fractions for this deep (24-30 cm) wetland soil sample are estimated at 73% U(VI) and 27% U(IV). A notable analytical caveat is the exceptionally high fit uncertainty of 39% associated with these fractions. These specific values and high uncertainties result from the sample's composition at the bottom of core C2, which is an organic-poor granitic sand with a very low uranium content of 113 µg/g. This low concentration leads to poor XANES data quality, though the results still confirm a U(VI)-dominated system with minor U(IV) formed under local suboxic conditions. | Full credit for estimating U(VI) at ~73% and U(IV) at ~27%, and explicitly noting that the measurement has high uncertainty due to low data quality (associated with the low U content in this deep granitic sand layer). |
| q3 | reasoning | 40 | Provide the biogeochemical reasoning for the observed U oxidation states in this wetland core. Why does U(VI) remain the dominant species, and what is the mechanism for the presence of the minor U(IV) fraction? | Uranium in this Lake Nègre wetland core is predominantly found as U(VI) (73%) because it is continuously supplied by well-oxygenated streams and initially scavenged through sorption onto organic matter. The minor U(IV) fraction (27%) arises as a secondary step following this initial sorption. This partial reduction to U(IV) is driven by the development of local suboxic conditions within the deeper (24-30 cm) soil profile. Even in this specific organic-poor granitic sand layer, the initial oxidative supply outpaces complete reduction, maintaining U(VI) as the dominant species despite the suboxic environment. | Full credit for explaining that U is supplied by oxygenated streams and initially scavenged by sorption to organic matter as U(VI). The minor U(IV) fraction forms subsequently via partial reduction of the already-sorbed U(VI) due to local suboxic/reducing conditions in the soil. |
Review
#374
wetland soil
Fe K-edge
▶
LLM Prompt
Sample Information
Material: wetland soil
Sample Origin: Lake Nègre wetland, Mediterranean Alps, France
Sample-Specific Conditions
- Depth: 2-4 cm
- Bulk wetland soil from core C1 at 2-4 cm depth
Measurement
We plan to measure the Fe K-edge XANES spectrum of this sample.
Questions
Based on all the information above:
1. Based on the environmental conditions (waterlogged, slightly acidic wetland soil sampled during a dry period), estimate the fractions of Fe(III) and Fe(II) in the bulk soil at 2-4 cm depth.
2. What reference spectra (fit basis) would be appropriate to include in a Linear Combination Fitting (LCF) analysis of the Fe K-edge XANES data for this wetland soil to capture the expected diversity of Fe-bearing species?
3. Explain the physical and environmental reasoning for the observed Fe oxidation state distribution (dominant Fe(III) with a significant fraction of Fe(II)) in this surface wetland soil.
Ground Truth
Material: wetland soil
Measurement: Fe K-edge XANES in transmission mode at SSRL beamline 4-3
Fit method: LCF
Phase fractions: (±8%)
| Phase | Fraction |
|---|---|
| Fe(III) | 0.79 |
| Fe(II) | 0.21 |
Fit basis (paper's reference spectra):
- synthetic Fe(II)-triphosphate
- natural Fe(III)-illite
- synthetic nano-Fe(II)-talc
- synthetic Fe(III) 2-lines ferrihydrite
- natural Fe(III)-humate
Source evidence: Section 3.1.2, page 19-20
Key reasoning: The soil redox conditions are controlled by seasonal variations of the water table, ranging from fully reducing when waterlogged to more oxidizing during dry periods (such as the September sampling time). These global oxidizing conditions result in Fe being dominated by Fe(III) in the surface layers. However, significant proportions of reduced, labile Fe(II) are still present, which is consistent with the fact that soil pore waters remain overall suboxic due to microbial oxygen consumption.
Reasoning source: Section 4.1.1, pages 43-44
Scoring Rubric (total: 100 pts)
| Q | Type | Max | Question | Reference Answer | Scoring Criteria |
|---|---|---|---|---|---|
| q1 | quantification | 35 | Based on the environmental conditions (waterlogged, slightly acidic wetland soil sampled during a dry period), estimate the fractions of Fe(III) and Fe(II) in the bulk soil at 2-4 cm depth. | The estimated fractions for the bulk wetland soil at 2-4 cm depth are 0.79 (79%) for Fe(III) and 0.21 (21%) for Fe(II), with an uncertainty of 8%. These specific values result from the seasonal variations of the water table in the Lake Nègre wetland. Because the sample was collected from the surface layer (2-4 cm) during a dry period (September), global oxidizing conditions dominate, leading to the high 79% fraction of Fe(III). However, a significant 21% fraction of reduced Fe(II) remains because microbial oxygen consumption keeps the soil pore waters overall suboxic. | Full points for estimating Fe(III) at ~79% and Fe(II) at ~21% (within ±8%). Partial points for correctly identifying Fe(III) as the dominant species (>60%) with a minor but significant Fe(II) component. |
| q2 | identification | 30 | What reference spectra (fit basis) would be appropriate to include in a Linear Combination Fitting (LCF) analysis of the Fe K-edge XANES data for this wetland soil to capture the expected diversity of Fe-bearing species? | An appropriate LCF basis for this wetland soil includes synthetic Fe(II)-triphosphate, natural Fe(III)-illite, synthetic nano-Fe(II)-talc, synthetic Fe(III) 2-lines ferrihydrite, and natural Fe(III)-humate. These specific reference phases are expected because the soil redox conditions fluctuate seasonally between waterlogged (reducing) and dry (oxidizing) states. The September dry period sampling at the shallow 2-4 cm depth promotes the formation of oxidized species like Fe(III)-illite, ferrihydrite, and Fe(III)-humate. Concurrently, suboxic pore waters driven by microbial oxygen consumption preserve reduced phases, necessitating the inclusion of Fe(II)-triphosphate and nano-Fe(II)-talc in the fit. | Full points for mentioning proxies for Fe-clays (e.g., illite, talc), Fe-oxyhydroxides (e.g., ferrihydrite), and Fe-organic components (e.g., Fe-humate, Fe-triphosphate). |
| q3 | reasoning | 35 | Explain the physical and environmental reasoning for the observed Fe oxidation state distribution (dominant Fe(III) with a significant fraction of Fe(II)) in this surface wetland soil. | The observed Fe oxidation state distribution of 79% Fe(III) and 21% Fe(II) is driven by seasonal variations of the water table in the Lake Nègre wetland. At the shallow 2-4 cm depth, the soil experiences global oxidizing conditions during dry periods (such as the September sampling time), which explains why Fe(III) is the dominant oxidation state. Despite these oxidizing conditions at the surface, a significant proportion of reduced, labile Fe(II) persists in the soil. This occurs because microbial oxygen consumption maintains overall suboxic conditions within the soil pore waters, preventing complete oxidation of the iron pool. | Full points for explaining that seasonal water table variations lead to oxidizing conditions during dry periods (favoring Fe(III)), while suboxic pore waters and microbial activity maintain a fraction of reduced, labile Fe(II). |
Review
#375
wetland soil
Fe K-edge
▶
LLM Prompt
Sample Information
Material: wetland soil
Sample Origin: Lake Nègre wetland, Mediterranean Alps, France
Sample-Specific Conditions
- Depth: 14-16 cm
- Bulk wetland soil from core C1 at 14-16 cm depth
Measurement
We plan to measure the Fe K-edge XANES spectrum of this sample.
Questions
Based on all the information above:
1. What reference spectra or basis functions would be appropriate to include in a Linear Combination Fit (LCF) for the Fe K-edge XANES of this wetland soil sample to capture the diversity of Fe-bearing species?
2. Based on the sample conditions (wetland soil from core C1 at 14-16 cm depth), estimate the relative fractions of Fe(III) and Fe(II) in the sample.
3. Explain the biogeochemical reasoning for the expected Fe oxidation state in this specific core (C1) compared to more organic-rich wetland soils.
Ground Truth
Material: wetland soil
Measurement: Fe K-edge XANES in transmission mode at SSRL beamline 4-3
Fit method: LCF
Phase fractions: (±3%)
| Phase | Fraction |
|---|---|
| Fe(III) | 0.88 |
| Fe(II) | 0.12 |
Fit basis (paper's reference spectra):
- synthetic Fe(II)-triphosphate
- natural Fe(III)-illite
- synthetic nano-Fe(II)-talc
- synthetic Fe(III) 2-lines ferrihydrite
- natural Fe(III)-humate
Source evidence: Section 3.1.2, page 19, line 497
Key reasoning: The soil in core C1 is dominated by Fe(III) species (88%), reflecting globally oxidizing conditions despite being waterlogged. This is consistent with the relatively low organic matter content (~10 wt% TOC) in core C1 compared to other areas of the wetland. The Fe is essentially present as Fe(III), hosted by clay minerals (illite proxy) and potentially ferrihydrite or Fe(III)-humate, with only a minor fraction of Fe(II).
Reasoning source: Section 3.1.2 (page 19) and Section 4.1.1 (page 44)
Scoring Rubric (total: 100 pts)
| Q | Type | Max | Question | Reference Answer | Scoring Criteria |
|---|---|---|---|---|---|
| q1 | identification | 30 | What reference spectra or basis functions would be appropriate to include in a Linear Combination Fit (LCF) for the Fe K-edge XANES of this wetland soil sample to capture the diversity of Fe-bearing species? | An appropriate Linear Combination Fit (LCF) basis for this wetland soil sample should include synthetic Fe(II)-triphosphate, natural Fe(III)-illite, synthetic nano-Fe(II)-talc, synthetic Fe(III) 2-lines ferrihydrite, and natural Fe(III)-humate. These specific reference spectra are necessary because the soil from core C1 at 14-16 cm depth is dominated by Fe(III) species hosted primarily by clay minerals (represented by the illite proxy), ferrihydrite, and Fe(III)-humate. Despite being waterlogged, the relatively low organic matter content (~10 wt% TOC) in this specific core maintains globally oxidizing conditions, leading to this predominantly Fe(III) mineralogy. The inclusion of Fe(II)-triphosphate and nano-Fe(II)-talc accounts for the minor fraction of reduced Fe(II) present in the sample. | Full points for identifying a mix of Fe(II) and Fe(III) proxies covering clay minerals (e.g., illite, talc), organic complexes (e.g., humate, triphosphate), and iron oxides (e.g., ferrihydrite). |
| q2 | quantification | 35 | Based on the sample conditions (wetland soil from core C1 at 14-16 cm depth), estimate the relative fractions of Fe(III) and Fe(II) in the sample. | The estimated relative fractions for this wetland soil sample are 88% Fe(III) and 12% Fe(II), with an uncertainty of 3%. These specific values arise because the bulk soil at 14-16 cm depth in core C1 experiences globally oxidizing conditions despite its waterlogged state. This oxidation state distribution is directly linked to the sample's relatively low organic matter content (~10 wt% total organic carbon) compared to other wetland areas. Consequently, the iron is predominantly stabilized as Fe(III) within clay minerals, ferrihydrite, and humate complexes, leaving only a minor 12% fraction of reduced Fe(II). | Full points for estimating Fe(III) around 88% and Fe(II) around 12% (within ±5%). Partial points for identifying that Fe(III) is highly dominant (>80%). |
| q3 | reasoning | 35 | Explain the biogeochemical reasoning for the expected Fe oxidation state in this specific core (C1) compared to more organic-rich wetland soils. | The Fe oxidation state in the core C1 wetland soil at 14-16 cm depth is heavily dominated by Fe(III) (88%) rather than Fe(II) (12%). This occurs because core C1 contains a relatively low organic matter content, specifically around 10 wt% total organic carbon (TOC), compared to other more organic-rich areas of the wetland. The lack of abundant organic matter limits the extent of iron reduction, maintaining globally oxidizing conditions even though the soil is waterlogged. As a result, the iron remains primarily in the oxidized Fe(III) state, hosted by stable phases like illite, ferrihydrite, and Fe(III)-humate, rather than being extensively reduced to Fe(II). | Full points for explaining that despite being waterlogged, the relatively low organic matter content in this core leads to globally oxidizing conditions, resulting in a dominance of Fe(III) species over Fe(II). |
Review
#376
wetland soil
Fe K-edge
▶
LLM Prompt
Sample Information
Material: wetland soil
Sample Origin: Lake Nègre wetland, Mediterranean Alps, France
Sample-Specific Conditions
- Depth: 2-4 cm
- Bulk wetland soil from core C2 at 2-4 cm depth
Measurement
We plan to measure the Fe K-edge XANES spectrum of this sample.
Questions
Based on all the information above:
1. Based on the sample conditions (wetland soil, partially water-saturated, suboxic, sampled during a dry period), estimate the relative fractions of Fe(III) and Fe(II) in this sample.
2. What reference spectra would be appropriate to include in a Linear Combination Fitting (LCF) basis set to model the Fe speciation in this organic-rich wetland soil?
3. Explain the environmental reasoning for the observed mixture of Fe(III) and Fe(II) in this specific wetland soil sample, considering its hydrological setting.
Ground Truth
Material: wetland soil
Measurement: Fe K-edge XANES in transmission mode at SSRL beamline 4-3
Fit method: Linear Combination Fitting (LCF)
Phase fractions: (±10%)
| Phase | Fraction |
|---|---|
| Fe(III) | 0.69 |
| Fe(II) | 0.31 |
Fit basis (paper's reference spectra):
- synthetic Fe(II)-triphosphate
- natural Fe(III)-illite
- synthetic nano-Fe(II)-talc
- synthetic Fe(III) 2-lines ferrihydrite
- natural Fe(III)-humate
Source evidence: Section 3.1.2, Page 19; Section 4.1.1, Page 44
Key reasoning: The soil redox conditions are controlled by seasonal variations of the water table, ranging from fully reducing during snowmelt to more oxidizing during dry periods (like the September sampling time). These global oxidizing conditions result in a dominance of Fe(III) (69%). However, significant proportions of reduced Fe(II) (31%) are preserved, consistent with the fact that the soil waters are overall suboxic and contain abundant organic matter.
Reasoning source: Section 4.1.1, Pages 43-44
Scoring Rubric (total: 100 pts)
| Q | Type | Max | Question | Reference Answer | Scoring Criteria |
|---|---|---|---|---|---|
| q1 | quantification | 30 | Based on the sample conditions (wetland soil, partially water-saturated, suboxic, sampled during a dry period), estimate the relative fractions of Fe(III) and Fe(II) in this sample. | The estimated relative fractions for this wetland soil sample are 69% Fe(III) and 31% Fe(II). These specific values result from the seasonal variations of the water table in the Lake Nègre wetland. Because the sample was collected during a dry period, the global conditions are more oxidizing, leading to the dominance of Fe(III) at 69%. However, a significant 31% fraction of reduced Fe(II) is preserved because the soil waters remain overall suboxic and contain abundant organic matter. | Full points for estimating Fe(III) around 65-75% and Fe(II) around 25-35%. Partial points for correctly identifying that Fe(III) is the dominant species but with a significant minority of Fe(II). |
| q2 | identification | 30 | What reference spectra would be appropriate to include in a Linear Combination Fitting (LCF) basis set to model the Fe speciation in this organic-rich wetland soil? | An appropriate Linear Combination Fitting (LCF) basis set for this sample includes synthetic Fe(II)-triphosphate, natural Fe(III)-illite, synthetic nano-Fe(II)-talc, synthetic Fe(III) 2-lines ferrihydrite, and natural Fe(III)-humate. These specific reference phases are expected because the wetland soil experiences seasonal redox fluctuations that support a mixture of both oxidized and reduced iron species. The dry period conditions promote the formation of Fe(III) phases like ferrihydrite, illite, and humate complexes due to the globally oxidizing environment and abundant organic matter. Conversely, the suboxic soil waters preserve Fe(II) phases such as Fe(II)-triphosphate and nano-Fe(II)-talc. | Full points for listing a combination of Fe(III) and Fe(II) phases relevant to organic-rich soils and clays, such as Fe(III)-humate, Fe(II)-phosphates/organics, ferrihydrite, and Fe-bearing clay minerals (illite, talc). |
| q3 | reasoning | 40 | Explain the environmental reasoning for the observed mixture of Fe(III) and Fe(II) in this specific wetland soil sample, considering its hydrological setting. | The observed mixture of 69% Fe(III) and 31% Fe(II) in this 2-4 cm depth wetland soil is driven by seasonal variations in the water table. During snowmelt, the environment is fully reducing, but during dry periods, the conditions become more globally oxidizing. This shift to oxidizing conditions during the dry period explains the dominance of Fe(III) in the sample. Despite this, a substantial portion of Fe(II) is preserved because the wetland soil waters remain overall suboxic and are rich in organic matter, preventing complete oxidation of the iron. | Full points for explaining that seasonal water table variations (oxidizing during dry periods, reducing during waterlogged periods) lead to a dominance of Fe(III) at the time of sampling, while overall suboxic conditions and organic matter preserve a significant fraction of reduced Fe(II). |
Review
#377
wetland soil
Fe K-edge
▶
LLM Prompt
Sample Information
Material: wetland soil
Sample Origin: Lake Nègre wetland, Mediterranean Alps, France
Sample-Specific Conditions
- Depth: 14-16 cm
- Bulk wetland soil from core C2 at 14-16 cm depth
Measurement
We plan to measure the Fe K-edge XANES spectrum of this sample.
Questions
Based on all the information above:
1. What reference spectra or basis functions would be appropriate to include in a Linear Combination Fit (LCF) of the Fe K-edge XANES spectrum for this organic-rich wetland soil sample?
2. Based on the suboxic conditions and depth of this wetland soil, estimate the fractions of Fe(III) and Fe(II) present in the sample.
3. Explain why Fe-organic proxies are necessary to accurately model the Fe speciation in this specific sample compared to less organic-rich soils.
Ground Truth
Material: wetland soil
Measurement: Fe K-edge XANES, transmission mode, SSRL beamline 4-3
Fit method: LCF
Phase fractions: (±8%)
| Phase | Fraction |
|---|---|
| Fe(III) | 0.72 |
| Fe(II) | 0.28 |
Fit basis (paper's reference spectra):
- synthetic Fe(II)-triphosphate
- natural Fe(III)-illite
- synthetic nano-Fe(II)-talc
- synthetic Fe(III) 2-lines ferrihydrite
- natural Fe(III)-humate
Source evidence: Section 3.1.2, page 19-20
Key reasoning: The soil redox conditions are suboxic, leading to a mixture of Fe(III) and Fe(II). The C2 core is highly organic-rich (~40 wt% TOC), which favors the binding of a significant fraction of Fe(II) and Fe(III) to organic matter, represented by Fe-organic proxies in the fit. Additionally, a significant proportion of Fe is hosted by clay minerals.
Reasoning source: Section 3.1.2, page 20
Scoring Rubric (total: 100 pts)
| Q | Type | Max | Question | Reference Answer | Scoring Criteria |
|---|---|---|---|---|---|
| q1 | identification | 30 | What reference spectra or basis functions would be appropriate to include in a Linear Combination Fit (LCF) of the Fe K-edge XANES spectrum for this organic-rich wetland soil sample? | An appropriate Linear Combination Fit (LCF) basis for this wetland soil sample should include synthetic Fe(II)-triphosphate, natural Fe(III)-illite, synthetic nano-Fe(II)-talc, synthetic Fe(III) 2-lines ferrihydrite, and natural Fe(III)-humate. These specific reference spectra are necessary because the sample originates from a 14-16 cm depth in a wetland core (C2) characterized by suboxic redox conditions, which produces a mixture of Fe(II) and Fe(III) phases. Furthermore, the highly organic-rich nature of this core (~40 wt% TOC) favors the binding of both iron oxidation states to organic matter, necessitating Fe-organic proxies like Fe(III)-humate and Fe(II)-triphosphate. Finally, clay mineral references such as Fe(III)-illite and nano-Fe(II)-talc are required because a significant proportion of the iron in this soil is hosted by clays. | Full points for identifying a mix of Fe(III) and Fe(II) reference spectra that cover clay minerals (e.g., illite, talc), iron oxyhydroxides (e.g., ferrihydrite), and organic-bound iron proxies (e.g., Fe-humate, Fe-triphosphate). |
| q2 | quantification | 35 | Based on the suboxic conditions and depth of this wetland soil, estimate the fractions of Fe(III) and Fe(II) present in the sample. | The estimated iron fractions for this wetland soil sample are 0.72 (72%) Fe(III) and 0.28 (28%) Fe(II), with an uncertainty of 8%. These specific values result from the suboxic redox conditions present at the 14-16 cm depth of the Lake Nègre wetland core. Under these suboxic conditions, a mixed oxidation state is maintained rather than complete reduction or oxidation. The high total organic carbon content (~40 wt% TOC) and the presence of clay minerals in the soil provide abundant binding sites that stabilize this specific distribution of Fe(III) and Fe(II) species. | Full points for estimating Fe(III) around 72% and Fe(II) around 28% (±8%). Partial points for identifying that Fe(III) is the dominant species but a significant fraction of Fe(II) is present. |
| q3 | reasoning | 35 | Explain why Fe-organic proxies are necessary to accurately model the Fe speciation in this specific sample compared to less organic-rich soils. | Fe-organic proxies, such as natural Fe(III)-humate and synthetic Fe(II)-triphosphate, are necessary to accurately model this sample because of the specific composition of the C2 wetland core. At a depth of 14-16 cm, this wetland soil is highly organic-rich, containing approximately 40 wt% total organic carbon (TOC). This high organic content creates an environment that strongly favors the binding of a significant fraction of both Fe(II) and Fe(III) directly to organic matter. Consequently, under the suboxic conditions of this soil, failing to include these Fe-organic reference spectra in the Linear Combination Fit would fail to capture the true distribution of iron species stabilized by the abundant organic carbon. | Full points for explaining that the high total organic carbon (TOC) content in this specific core layer leads to a significant fraction of Fe(II) and Fe(III) binding directly to organic matter, requiring specific Fe-organic reference spectra for accurate fitting. |
Review
#378
wetland soil
U L3-edge
▶
LLM Prompt
Sample Information
Material: wetland soil
Sample Origin: Lake Nègre wetland, Mediterranean Alps, France
Sample-Specific Conditions
- Micro-scale location: Spot 1
- Micro-XANES spot on U-bearing phase in soil sample C1 18-20 cm
Measurement
We plan to measure the U L3-edge XANES spectrum of this sample.
Questions
Based on all the information above:
1. Based on the environmental conditions (waterlogged, slightly acidic wetland soil) and the sample origin, estimate the fractions of U(VI) and U(IV) at this specific micro-XANES spot.
2. What specific reference spectra (fit basis) would be appropriate to model the U L3-edge micro-XANES spectrum of this sample using Linear Combination Fitting?
3. Explain why U(VI) is the dominant oxidation state in this sample and discuss the significance of the homogeneous redox state observed at the micro-scale.
Ground Truth
Material: wetland soil
Measurement: U L3-edge micro-XANES, fluorescence mode, ESRF beamline BM23
Fit method: LCF
Phase fractions: (±15%)
| Phase | Fraction |
|---|---|
| U(VI) | 0.82 |
| U(IV) | 0.18 |
Fit basis (paper's reference spectra):
- U(VI) (synthetic uranyl triscarbonato complex)
- U(IV) (reduced U-rich sediment NEG18-07 184-189 cm)
Source evidence: Figure 7, page 29
Key reasoning: Micro-XANES analysis of U-rich spots identified by micro-XRF shows that U(VI) dominates (80-97%) across all analyzed areas, indicating a homogeneous U oxidation state at the micro-scale. This homogeneity suggests that the redox state of mononuclear U is driven by ambient redox conditions at the sample scale. The minor U(IV) fraction is attributed to reduction occurring after U(VI) sorption onto organic matter, rather than direct reduction of aqueous U(VI) prior to scavenging.
Reasoning source: Section 3.5.2 (page 30) and Section 4.3.2 (page 47)
Scoring Rubric (total: 100 pts)
| Q | Type | Max | Question | Reference Answer | Scoring Criteria |
|---|---|---|---|---|---|
| q1 | quantification | 35 | Based on the environmental conditions (waterlogged, slightly acidic wetland soil) and the sample origin, estimate the fractions of U(VI) and U(IV) at this specific micro-XANES spot. | At this specific micro-XANES spot (Spot 1) in the Lake Nègre wetland soil sample, the estimated fractions are 0.82 (82%) for U(VI) and 0.18 (18%) for U(IV), with an uncertainty of 15%. These specific values arise because the redox state of mononuclear U in this soil is driven by ambient redox conditions at the sample scale, leading to a highly homogeneous U oxidation state where U(VI) dominates across all micro-scale areas. The minor 18% U(IV) fraction results from a secondary reduction process occurring after U(VI) has already sorbed onto organic matter in the soil, rather than from the direct reduction of aqueous U(VI) prior to scavenging. | Full credit if U(VI) is estimated around 0.82 (82%) and U(IV) around 0.18 (18%). Partial credit if U(VI) is identified as the dominant phase (>80%) with a minor U(IV) component. |
| q2 | identification | 30 | What specific reference spectra (fit basis) would be appropriate to model the U L3-edge micro-XANES spectrum of this sample using Linear Combination Fitting? | To model the U L3-edge micro-XANES spectrum of this wetland soil sample using Linear Combination Fitting (LCF), the appropriate reference spectra are U(VI) represented by a synthetic uranyl triscarbonato complex and U(IV) represented by a reduced U-rich sediment (NEG18-07 184-189 cm). These specific reference phases are required because the U-bearing spots in this Lake Nègre soil sample are dominated by mononuclear U(VI) whose redox state is homogeneously controlled by ambient sample-scale conditions. The inclusion of the U(IV) sediment reference is necessary to accurately capture the minor reduced fraction that forms after U(VI) scavenges and sorbs onto the soil's organic matter. | Full credit if the answer identifies a U(VI) reference (such as a synthetic uranyl triscarbonato complex) and a U(IV) reference (such as a reduced U-rich natural sediment or biogenic UO2). |
| q3 | reasoning | 35 | Explain why U(VI) is the dominant oxidation state in this sample and discuss the significance of the homogeneous redox state observed at the micro-scale. | U(VI) is the dominant oxidation state in this Lake Nègre wetland soil sample (accounting for 82% at Spot 1) because the redox state of mononuclear U is driven by the ambient redox conditions at the macroscopic sample scale. The observation of a homogeneous redox state at the micro-scale, where U(VI) consistently dominates (80-97%) across all analyzed U-rich spots, signifies that local micro-environments do not dictate the primary oxidation state. Consequently, the minor U(IV) fraction present is attributed to a secondary mechanism where reduction occurs only after U(VI) has sorbed onto organic matter in the soil, rather than direct reduction of aqueous U(VI) before scavenging. | Full credit if the answer explains that U(VI) dominates due to ambient redox conditions driving the state of mononuclear U, and that the minor U(IV) fraction likely results from reduction occurring after U(VI) sorption onto organic matter. |
Review
#379
wetland soil
U L3-edge
▶
LLM Prompt
Sample Information
Material: wetland soil
Sample Origin: Lake Nègre wetland, Mediterranean Alps, France
Sample-Specific Conditions
- Micro-scale location: Spot 2
- Micro-XANES spot on U-bearing phase in soil sample C1 18-20 cm
Measurement
We plan to measure the U L3-edge XANES spectrum of this sample.
Questions
Based on all the information above:
1. What reference spectra or basis functions would be appropriate for determining the U oxidation state of this micro-XANES spot via Linear Combination Fitting?
2. Based on the environmental conditions (waterlogged, slightly acidic wetland soil) and the specific micro-scale location (Spot 2 on a U-rich vegetal debris), estimate the fractions of U(VI) and U(IV) present.
3. Explain why the U oxidation state is highly homogeneous and heavily dominated by U(VI) at this micro-scale spot, despite the physical diversity of U-bearing particles (such as vegetal debris) in the soil matrix.
Ground Truth
Material: wetland soil
Measurement: U L3-edge micro-XANES, fluorescence mode, ESRF beamline BM23
Fit method: LCF (Linear Combination Fit)
Phase fractions: (±15%)
| Phase | Fraction |
|---|---|
| U(VI) | 0.97 |
| U(IV) | 0.03 |
Fit basis (paper's reference spectra):
- synthetic uranyl triscarbonato complex (U(VI))
- reduced U-rich sediment NEG18-07 184-189 cm (U(IV))
Source evidence: Figure 7, page 29
Key reasoning: Micro-XRF mapping of sample C1 18-20 cm revealed a diversity of U-bearing particles, with Spot 2 located on a U-rich elongated pattern likely corresponding to vegetal debris. Despite the variety of U-bearing phases, the U oxidation state at the micro-scale was found to be highly homogeneous and dominated by U(VI). This redox homogeneity is interpreted as a consequence of U speciation (mononuclear U sorbed on organic matter surfaces), which facilitates electron transfers and enables all U atoms to follow the local ambient redox conditions.
Reasoning source: Section 3.5.1 (page 28), Section 3.5.2 (page 30), and Section 4.3.2 (page 47)
Scoring Rubric (total: 100 pts)
| Q | Type | Max | Question | Reference Answer | Scoring Criteria |
|---|---|---|---|---|---|
| q1 | identification | 20 | What reference spectra or basis functions would be appropriate for determining the U oxidation state of this micro-XANES spot via Linear Combination Fitting? | Appropriate reference spectra for Linear Combination Fitting of this wetland soil sample include a synthetic uranyl triscarbonato complex to represent U(VI) and a reduced U-rich sediment (NEG18-07 184-189 cm) to represent U(IV). These specific basis functions are necessary because the sample originates from a U-bearing phase in soil (sample C1, 18-20 cm depth) where uranium is associated with organic materials like vegetal debris. At this micro-scale location (Spot 2), the uranium exists as mononuclear U sorbed onto organic matter surfaces, which dictates its chemical behavior. This specific speciation facilitates electron transfers and allows the uranium to equilibrate with local ambient redox conditions, requiring references that can accurately capture a highly homogeneous, U(VI)-dominated state alongside minor U(IV) contributions. | Full points for identifying a U(VI) reference (e.g., uranyl triscarbonato complex) and a U(IV) reference (e.g., reduced U-rich sediment or biogenic uraninite). |
| q2 | quantification | 40 | Based on the environmental conditions (waterlogged, slightly acidic wetland soil) and the specific micro-scale location (Spot 2 on a U-rich vegetal debris), estimate the fractions of U(VI) and U(IV) present. | The estimated fractions for this micro-XANES spot are 0.97 for U(VI) and 0.03 for U(IV), with an uncertainty of 15%. These specific values result from the micro-scale conditions at Spot 2, which is located on a U-rich elongated pattern corresponding to vegetal debris within the wetland soil (sample C1 18-20 cm). In this specific environment, the uranium speciation consists of mononuclear U sorbed directly onto organic matter surfaces. This structural configuration facilitates efficient electron transfers, enabling all U atoms to uniformly follow the local ambient redox conditions and resulting in an oxidation state that is highly homogeneous and heavily dominated by U(VI). | Full points if the predicted U(VI) fraction is within ±15% of 0.97 (i.e., 0.82 - 1.00) and U(IV) is within ±15% of 0.03. |
| q3 | reasoning | 40 | Explain why the U oxidation state is highly homogeneous and heavily dominated by U(VI) at this micro-scale spot, despite the physical diversity of U-bearing particles (such as vegetal debris) in the soil matrix. | The U oxidation state at Spot 2 is highly homogeneous and heavily dominated by U(VI) due to the specific speciation of uranium within this wetland soil sample. Micro-XRF mapping of sample C1 (18-20 cm depth) shows that this spot is located on a U-rich elongated pattern corresponding to vegetal debris. In this micro-environment, the uranium exists as mononuclear U sorbed directly onto the surfaces of the organic matter. This specific chemical configuration facilitates efficient electron transfers across the organic matrix. Consequently, all U atoms are able to uniformly follow and equilibrate with the local ambient redox conditions, overriding the physical diversity of the particles to produce a consistently U(VI)-dominated state. | Full points for explaining that U speciation (dispersion of mononuclear sorbed U on organic matter surfaces) facilitates electron transfers, allowing the U atoms to uniformly follow the local ambient oxidizing/suboxic redox conditions. |
Review
#380
wetland soil
U L3-edge
▶
LLM Prompt
Sample Information
Material: wetland soil
Sample Origin: Lake Nègre wetland, Mediterranean Alps, France
Sample-Specific Conditions
- Micro-scale location: Spot 5
- Micro-XANES spot on U-bearing phase in soil sample C1 18-20 cm
Measurement
We plan to measure the U L3-edge XANES spectrum of this sample.
Questions
Based on all the information above:
1. Based on the environmental conditions (waterlogged, slightly acidic wetland soil) and the sample origin, what are the expected U oxidation states and their approximate fractions at a micro-scale spot in this U-bearing phase?
2. What reference spectra (fit basis) would be most appropriate to use for a Linear Combination Fit (LCF) of the U L3-edge micro-XANES spectrum of this sample to capture its redox state?
3. Explain the physical and geochemical reasoning for the observed homogeneous mixture of U(VI) and U(IV) at the micro-scale in this wetland soil, despite the variety of U-bearing phases present.
Ground Truth
Material: wetland soil
Measurement: U L3-edge micro-XANES, fluorescence mode, ESRF beamline BM23
Fit method: Linear Combination Fit (LCF)
Phase fractions: (±15%)
| Phase | Fraction |
|---|---|
| U(VI) | 0.85 |
| U(IV) | 0.15 |
Fit basis (paper's reference spectra):
- U(VI) (synthetic uranyl triscarbonato complex)
- U(IV) (reduced U-rich sediment NEG18-07 184-189 cm)
Source evidence: Figure 7 and Section 4.3.2
Key reasoning: The micro-scale U oxidation state is dominated by U(VI) (~85%), with a minor but significant U(IV) fraction. This homogeneous redox state across various U-bearing phases suggests that U is dispersed and sorbed onto organic matter surfaces rather than incorporated into mineral grains. This speciation facilitates electron transfer, allowing U to equilibrate with local suboxic/reducing conditions. The presence of U(IV) indicates partial reduction of the initially supplied U(VI) after its sorption onto the soil matrix.
Reasoning source: Section 4.3.2 (Implications for U redox processes)
Scoring Rubric (total: 100 pts)
| Q | Type | Max | Question | Reference Answer | Scoring Criteria |
|---|---|---|---|---|---|
| q1 | quantification | 30 | Based on the environmental conditions (waterlogged, slightly acidic wetland soil) and the sample origin, what are the expected U oxidation states and their approximate fractions at a micro-scale spot in this U-bearing phase? | The expected U oxidation states at this micro-scale spot (Spot 5, C1 18-20 cm) are U(VI) and U(IV), with approximate fractions of 85% U(VI) and 15% U(IV), with an uncertainty of 15%. These specific fractions arise because the uranium in this wetland soil is dispersed and sorbed onto organic matter surfaces rather than being incorporated into mineral grains. This surface-bound speciation facilitates electron transfer, allowing the initially supplied U(VI) to equilibrate with the local suboxic or reducing conditions of the wetland environment. Consequently, a partial reduction of the U(VI) occurs after its sorption onto the soil matrix, resulting in the observed minor but significant U(IV) fraction. | 15 points for identifying U(VI) as the dominant phase and U(IV) as the minor phase. 15 points for estimating fractions around 85% U(VI) and 15% U(IV) (accepting 75-95% for U(VI) and 5-25% for U(IV)). |
| q2 | identification | 30 | What reference spectra (fit basis) would be most appropriate to use for a Linear Combination Fit (LCF) of the U L3-edge micro-XANES spectrum of this sample to capture its redox state? | The most appropriate reference spectra for the Linear Combination Fit (LCF) are a U(VI) standard, specifically a synthetic uranyl triscarbonato complex, and a U(IV) standard, specifically a reduced U-rich sediment (NEG18-07 184-189 cm). These specific reference phases are required because the wetland soil sample (C1 18-20 cm) contains uranium that was initially supplied as U(VI) and subsequently sorbed onto organic matter surfaces. Because this dispersed speciation allows the uranium to equilibrate with the local suboxic and reducing conditions of the wetland environment, partial reduction of the U(VI) occurs. Therefore, both U(VI) and U(IV) references are necessary to accurately capture the resulting homogeneous mixture of oxidized and partially reduced uranium at this micro-scale spot. | 15 points for suggesting a U(VI) reference (e.g., uranyl triscarbonato complex or similar U(VI)-organic/adsorbed standard). 15 points for suggesting a U(IV) reference (e.g., reduced U-rich sediment, biogenic UO2, or U(IV)-organic complex). |
| q3 | reasoning | 40 | Explain the physical and geochemical reasoning for the observed homogeneous mixture of U(VI) and U(IV) at the micro-scale in this wetland soil, despite the variety of U-bearing phases present. | The homogeneous mixture of approximately 85% U(VI) and 15% U(IV) at this micro-scale spot (Spot 5) occurs because uranium is dispersed and sorbed onto organic matter surfaces rather than being locked inside mineral grains. In the context of this wetland soil (C1 18-20 cm), this specific surface-bound speciation facilitates efficient electron transfer. This allows the initially supplied U(VI) to readily equilibrate with the local suboxic and reducing conditions present in the soil matrix. As a result, the U(VI) undergoes partial reduction after sorption, leading to a consistent, homogeneous redox state across the various U-bearing phases in the sample. | 15 points for mentioning that U is dispersed/sorbed onto organic matter surfaces rather than incorporated into mineral grains. 15 points for explaining that this speciation facilitates electron transfer and spatially homogeneous reduction rates. 10 points for noting that partial reduction of U(VI) to U(IV) occurs after sorption, driven by local suboxic/reducing conditions. |
Review
The thermal equation of state of xenon: Implications for noble gas incorporation in serpentine minerals and their transport to depth
ESRF-BM23
Pure Phase
A.D. Rosa et al.
DOI: 10.1016/j.gca.2024.06.001
1 scenario
▶
#381
Xe
Xe K-edge
▶
LLM Prompt
Sample Information
Material: Xe
Crystal Structure: fcc
Oxidation State: 0
Sample Form: solid in diamond anvil cell
Measurement Mode: transmission
- Pure solid face-centered cubic (fcc) xenon at high pressure and temperature
Measurement
We plan to measure the Xe K-edge XANES spectrum of this sample.
Questions
Based on all the information above:
1. Describe the expected characteristics of the EXAFS signal for solid fcc xenon at low pressures (<3 GPa) and high temperatures, and explain the physical origin of these features.
2. How does the EXAFS signal of solid fcc xenon change when the pressure is increased above 3 GPa or the temperature is lowered to 0 K, and what is the physical reason for this change?
Ground Truth
Compound: Xe
Oxidation state: 0
Measurement: Xe K-edge XAS in transmission mode at beamline BM23
Edge position: not reported
Spectral shape: XANES features show clear changes upon crystallization and melting. The EXAFS signal is weak and short at low pressure (<3 GPa) due to significant thermal vibrations, exhibiting fast damping at k-values beyond 6 Å-1.
Distinguishing features: The EXAFS function χ(k) shows low amplitudes of maxima and minima (Δk2χ(k) < 0.2 Å-2) and fast damping at low pressures due to weak interatomic van der Waals interactions and strong thermal vibrations. The signal extends to higher k-values (>20 Å-1) at 0 K or elevated pressures (>3 GPa) due to the suppression of thermal vibrations.
Key reasoning: At low pressures (<3 GPa) and high temperatures, solid fcc xenon exhibits significant thermal vibrations due to weak interatomic van der Waals interactions. This results in a weak and rapidly damped EXAFS signal. Increasing pressure or decreasing temperature suppresses these thermal vibrations, leading to longer-range EXAFS signals.
Reasoning source: Section 3.3: Lattice vibrations at low pressure (page 106)
Scoring Rubric (total: 100 pts)
| Q | Type | Max | Question | Reference Answer | Scoring Criteria |
|---|---|---|---|---|---|
| q1 | spectral | 53 | Describe the expected characteristics of the EXAFS signal for solid fcc xenon at low pressures (<3 GPa) and high temperatures, and explain the physical origin of these features. | At low pressures (<3 GPa) and high temperatures, the EXAFS signal for solid fcc xenon is weak, short, and rapidly damped at k-values beyond 6 Å⁻¹. The EXAFS function χ(k) exhibits low amplitudes of maxima and minima, specifically Δk²χ(k) < 0.2 Å⁻². This occurs because pure solid fcc xenon relies on weak interatomic van der Waals interactions. Under these specific high-temperature and low-pressure conditions, the weak bonding allows for significant thermal vibrations in the lattice, which cause rapid damping of the EXAFS oscillations and result in the observed weak signal. | The answer must state that the EXAFS signal is weak, short, has low amplitude (Δk2χ(k) < 0.2 Å-2), and damps quickly (beyond k = 6 Å-1). It must correctly attribute these features to strong thermal vibrations and weak interatomic van der Waals interactions. |
| q2 | prediction | 47 | How does the EXAFS signal of solid fcc xenon change when the pressure is increased above 3 GPa or the temperature is lowered to 0 K, and what is the physical reason for this change? | When the pressure is increased above 3 GPa or the temperature is lowered to 0 K, the EXAFS signal of solid fcc xenon extends to much higher k-values, specifically beyond 20 Å⁻¹. This represents a transition to a longer-range EXAFS signal compared to the rapidly damped signal seen at lower pressures. The physical reason for this change is the suppression of thermal vibrations within the pure solid fcc xenon lattice. Because the material is held together by weak van der Waals interactions, applying elevated pressure or reducing the temperature to absolute zero restricts atomic movement, preventing the fast damping of the signal and allowing the EXAFS oscillations to persist. | The answer must indicate that the EXAFS amplitude increases significantly and the signal extends to higher k-values (e.g., beyond 20 Å-1). It must explain that this occurs because the thermal vibrations are progressively suppressed at higher pressures or lower temperatures. |
Review
HERFD-XAS evidence for an octahedrally coordinated CoSn-polysulfide precursor as a probe for the mechanism of pyrite formation
ESRF-BM23
Synthesis
Qianyu Deng et al.
DOI: 10.1016/j.gca.2025.06.003
8 scenarios
▶
#382
Co-doped pyrite
Co K-edge
▶
LLM Prompt
Sample Information
Material: Co-doped pyrite
Method: precipitation
Precursors: FeCl3.6H2O, CoCl2.6H2O, Na2S.9H2O
Temperature C: 22
Duration Hours: 700
Atmosphere: N2
Post Treatment: Washed twice with degassed HCl (0.01 M) and O2-free milli-Q water
Sample-Specific Conditions
- Initial Co:Fe ratio: 5 mol%
- Co-doped pyrite with 5 mol% initial Co:Fe
Preparation
- FeCl3.6H2O (3.75 mmol) and CoCl2.6H2O (0.19 mmol) mixed with Na2S.9H2O (3.75 mmol) in O2-free milli-Q water. Stirred for ~1 month at room temperature.
Measurement
We plan to measure the Co K-edge XANES spectrum of this sample.
Questions
Based on all the information above:
1. Based on the synthesis conditions (5 mol% initial Co:Fe ratio), what are the expected Co-bearing phases in the final product, and what are their approximate fractions?
2. What reference spectra or basis functions would be appropriate to use for Linear Combination Fitting (LCF) of the Co K-edge EXAFS spectrum of this sample?
3. Explain why the majority of the Co remains in a precursor phase rather than being fully incorporated into the pyrite structure, and how the initial Co concentration affects this.
Ground Truth
Material: Co-doped pyrite
Measurement: Co K-edge HERFD-XANES and EXAFS, fluorescence mode, BM16 FAME-UHD beamline at ESRF
Fit method: Linear combination least squares (LC-LS) fitting
Phase fractions: (±10%)
| Phase | Fraction |
|---|---|
| CoSn precursor | 0.79 |
| Co-doped pyrite | 0.21 |
Fit basis (paper's reference spectra):
- theoretical spectrum of the Co-substituted pyrite DFT-modeled supercell
- experimental spectrum of the Co-doped precursor (PyPrec_05Co)
Source evidence: Figure 5 and Table 5
Key reasoning: The EXAFS spectra of the Co-doped pyrite end-products can be reconstructed by combining the theoretical spectrum of the Co-substituted pyrite supercell obtained from DFT and the experimental spectrum of the Co-doped precursor. Most of the Co pool added to the solution remains in the form of the Co-doped precursor after pyrite precipitation, while a smaller fraction of Co is incorporated in the pyrite structure. The proportion of Co incorporated into pyrite tends to decrease with increasing initial Co concentration, indicating the CoSn precursor phase is metastable and limits Co incorporation.
Reasoning source: Section 3.3 EXAFS analysis of the local structure around Co and Section 4.1 The Co-polysulfide precursor and its role during pyrite formation
Scoring Rubric (total: 100 pts)
| Q | Type | Max | Question | Reference Answer | Scoring Criteria |
|---|---|---|---|---|---|
| q1 | quantification | 35 | Based on the synthesis conditions (5 mol% initial Co:Fe ratio), what are the expected Co-bearing phases in the final product, and what are their approximate fractions? | The expected Co-bearing phases in the final product are a CoSn precursor phase at approximately 79% (± 10%) and Co-doped pyrite at 21% (± 10%). These specific fractions arise from the room-temperature (22 °C) precipitation process over 700 hours using FeCl3, CoCl2, and Na2S precursors. Under these synthesis conditions, most of the 5 mol% initial Co pool added to the solution remains trapped in the form of a metastable Co-doped precursor after pyrite precipitation. Only a smaller fraction of Co is successfully incorporated into the pyrite structure because the metastable CoSn precursor phase limits Co incorporation, an effect that scales with the initial Co concentration. | Full points for identifying CoSn precursor (or amorphous Co-polysulfide) as the major phase (~79%) and Co-doped pyrite as the minor phase (~21%). Partial points for identifying the phases without accurate fractions. |
| q2 | identification | 30 | What reference spectra or basis functions would be appropriate to use for Linear Combination Fitting (LCF) of the Co K-edge EXAFS spectrum of this sample? | The appropriate basis functions for Linear Combination Fitting (LCF) are the theoretical spectrum of a Co-substituted pyrite DFT-modeled supercell and the experimental spectrum of the Co-doped precursor (PyPrec_05Co). These specific references are required because the 700-hour room-temperature (22 °C) precipitation from chloride and sulfide precursors results in an incomplete reaction and a mixed-phase final product. Given the 5 mol% initial Co concentration, the Co does not fully substitute into the pyrite lattice, leaving a large pool of metastable Co-polysulfide precursor. Thus, the fitting basis must account for both the successfully incorporated Co within the pyrite structure (via the DFT model) and the remaining unreacted Co-doped precursor phase. | Full points for mentioning a theoretical/DFT model of Co-substituted pyrite and an experimental spectrum of a Co-doped precursor (or amorphous Co-polysulfide). |
| q3 | reasoning | 35 | Explain why the majority of the Co remains in a precursor phase rather than being fully incorporated into the pyrite structure, and how the initial Co concentration affects this. | The majority of the Co remains in a precursor phase (79%) rather than being fully incorporated into the pyrite structure (21%) because the CoSn precursor formed during the room-temperature (22 °C) precipitation is metastable. Over the 700-hour reaction of the chloride and sulfide precursors, this metastable Co-polysulfide phase persists and limits the structural incorporation of Co into the crystallizing pyrite lattice. Furthermore, the proportion of Co successfully incorporated into pyrite tends to decrease as the initial Co concentration increases. Therefore, at the specific 5 mol% initial Co:Fe ratio used in this synthesis, the metastable nature of the precursor dictates that most of the added Co pool remains trapped in the precursor state after pyrite precipitation. | Full points for explaining that the CoSn precursor phase is metastable and limits Co incorporation into pyrite, and that the proportion of Co incorporated into pyrite decreases with increasing initial Co concentration. |
Review
#383
Co-doped pyrite
Co K-edge
▶
LLM Prompt
Sample Information
Material: Co-doped pyrite
Method: precipitation
Precursors: FeCl3.6H2O, CoCl2.6H2O, Na2S.9H2O
Temperature C: 22
Duration Hours: 3100
Atmosphere: N2
Post Treatment: Washed twice with degassed HCl (0.01 M) and O2-free milli-Q water
Sample-Specific Conditions
- Initial Co:Fe ratio: 0.5 mol%
- Co-doped pyrite with 0.5 mol% initial Co:Fe from Baya et al. 2022
Preparation
- Synthesized with excess Fe(III) or deficit in HS- with respect to the 1:1 ratio, resulting in an excess of elemental sulfur.
Measurement
We plan to measure the Co K-edge XANES spectrum of this sample.
Questions
Based on all the information above:
1. What candidate reference spectra or basis functions are needed to model the Co K-edge EXAFS of this sample using linear combination fitting?
2. Based on the synthesis conditions (ambient temperature, polysulfide pathway, 0.5 mol% initial Co:Fe), estimate the phase fractions of Co speciation in the final solid product.
3. Explain the physical and chemical reasoning for why Co is distributed this way between the final phases, specifically addressing the role of the polysulfide pathway.
Ground Truth
Material: Co-doped pyrite
Measurement: Co K-edge HERFD-XANES and EXAFS at BM16 FAME-UHD beamline
Fit method: Linear combination least squares (LC-LS) fitting of EXAFS
Phase fractions: (±10%)
| Phase | Fraction |
|---|---|
| CoSn precursor (amorphous) | 0.7 |
| Co-substituted pyrite | 0.3 |
Fit basis (paper's reference spectra):
- Theoretical spectrum of the Co-substituted pyrite DFT-modeled supercell
- Experimental spectrum of the Co-doped precursor (PyPrec_05Co)
Source evidence: Figure 5 (pie charts) and Table 5
Key reasoning: During synthesis via the polysulfide pathway, Co early adopts an octahedral coordination to form CoSn polysulfide units. These units aggregate into an amorphous CoSn precursor phase that is metastable and persists after pyrite formation. This persistence limits the direct incorporation of Co into the pyrite structure, resulting in the majority of Co remaining in the precursor phase (70%) while only a minor fraction (30%) substitutes for Fe in pyrite.
Reasoning source: Section 4.1 (The Co-polysulfide precursor and its role during pyrite formation) and Section 4.2
Scoring Rubric (total: 100 pts)
| Q | Type | Max | Question | Reference Answer | Scoring Criteria |
|---|---|---|---|---|---|
| q1 | identification | 20 | What candidate reference spectra or basis functions are needed to model the Co K-edge EXAFS of this sample using linear combination fitting? | To model the Co K-edge EXAFS of this sample using linear combination fitting, the required basis functions are the theoretical spectrum of a Co-substituted pyrite DFT-modeled supercell and the experimental spectrum of the Co-doped precursor (PyPrec_05Co). These specific references are necessary because the ambient temperature (22 °C) precipitation synthesis via the polysulfide pathway causes Co to initially form octahedral CoSn polysulfide units. These units aggregate into a metastable, amorphous CoSn precursor phase that persists alongside the crystalline Co-substituted pyrite. Therefore, accurately modeling the final product requires basis functions that represent both the persistent amorphous precursor and the successfully incorporated Co within the pyrite lattice. | Full points if the answer identifies both a Co-substituted pyrite reference (or theoretical DFT model) and an amorphous Co-polysulfide/FeS precursor reference. |
| q2 | quantification | 30 | Based on the synthesis conditions (ambient temperature, polysulfide pathway, 0.5 mol% initial Co:Fe), estimate the phase fractions of Co speciation in the final solid product. | The Co speciation in the final solid product consists of 70% amorphous CoSn precursor and 30% Co-substituted pyrite, with an uncertainty of 10%. These specific fractions result from the precipitation synthesis at 22 °C using the polysulfide pathway, where Co rapidly adopts an octahedral coordination to form CoSn polysulfide units. Because this amorphous CoSn precursor phase is metastable, it persists even after 3100 hours of reaction time. This persistence severely limits the direct incorporation of Co into the pyrite structure, leaving the vast majority (70%) trapped in the precursor phase and only a minor fraction (30%) successfully substituting for Fe in the pyrite lattice. | Full points if the answer estimates ~70% Co in an amorphous precursor phase and ~30% Co substituted into the pyrite structure. Partial points for identifying the two phases without exact percentages. |
| q3 | reasoning | 50 | Explain the physical and chemical reasoning for why Co is distributed this way between the final phases, specifically addressing the role of the polysulfide pathway. | During the 22 °C precipitation synthesis via the polysulfide pathway, Co early on adopts an octahedral coordination to form CoSn polysulfide units. These units subsequently aggregate into an amorphous CoSn precursor phase. This precursor phase is highly metastable and persists throughout the long 3100-hour reaction duration, even after the main pyrite phase has formed. Consequently, this persistence acts as a barrier that limits the direct incorporation of Co into the pyrite structure, resulting in 70% of the Co remaining trapped in the amorphous precursor while only 30% substitutes for Fe in the pyrite lattice. | Full points if the answer explains that Co early adopts octahedral coordination forming CoSn polysulfide units, which aggregate into a metastable amorphous precursor that persists and limits direct Co incorporation into the pyrite lattice. |
Review
#384
Co-doped pyrite
Co K-edge
▶
LLM Prompt
Sample Information
Material: Co-doped pyrite
Method: precipitation
Precursors: FeCl3.6H2O, CoCl2.6H2O, Na2S.9H2O
Temperature C: 22
Duration Hours: 3100
Atmosphere: N2
Post Treatment: Washed twice with degassed HCl (0.01 M) and O2-free milli-Q water
Sample-Specific Conditions
- Initial Co:Fe ratio: 0.5 mol%
- Co-doped pyrite with 0.5 mol% initial Co:Fe, stoichiometric
Preparation
- FeCl3.6H2O (3.75 mmol) and CoCl2.6H2O (0.019 mmol) mixed with Na2S.9H2O (3.75 mmol) in O2-free milli-Q water. Stirred at room temperature.
Measurement
We plan to measure the Co K-edge XANES spectrum of this sample.
Questions
Based on all the information above:
1. What reference spectra or basis functions are required to accurately model the Co speciation in this sample using linear combination fitting?
2. Based on the synthesis conditions (0.5 mol% initial Co:Fe, room temperature, 3100 h duration), estimate the phase fractions of the Co-bearing species in the final product.
3. Explain the mechanistic reasoning for why Co is distributed between these specific phases rather than fully incorporating into the pyrite structure during this low-temperature synthesis.
Ground Truth
Material: Co-doped pyrite
Measurement: Co K-edge HERFD-XANES and EXAFS at BM16 FAME-UHD beamline (ESRF)
Fit method: Linear combination least squares (LC-LS) fitting of EXAFS spectra
Phase fractions: (±10%)
| Phase | Fraction |
|---|---|
| CoSn precursor | 0.69 |
| Co-doped pyrite | 0.31 |
Fit basis (paper's reference spectra):
- Theoretical spectrum of Co-substituted pyrite DFT-modeled supercell
- Experimental spectrum of the Co-doped precursor (PyPrec_05Co)
Source evidence: Figure 5 and Table 5
Key reasoning: During synthesis via the polysulfide pathway, Co early adopts an octahedral coordination and forms an amorphous CoSn-polysulfide precursor phase. This precursor is metastable and persists in the final solid products, limiting Co incorporation into the pyrite structure. Consequently, the major fraction of Co remains trapped in this unreacted precursor phase, while only a minor fraction successfully substitutes for Fe in the pyrite lattice.
Reasoning source: Section 4.1 (The Co-polysulfide precursor and its role during pyrite formation)
Scoring Rubric (total: 100 pts)
| Q | Type | Max | Question | Reference Answer | Scoring Criteria |
|---|---|---|---|---|---|
| q1 | identification | 30 | What reference spectra or basis functions are required to accurately model the Co speciation in this sample using linear combination fitting? | To accurately model the Co speciation using linear combination fitting, the required basis functions are a theoretical spectrum of a Co-substituted pyrite DFT-modeled supercell and an experimental spectrum of the Co-doped precursor (PyPrec_05Co). These specific references are necessary because of the room temperature (22 °C) precipitation synthesis conditions using FeCl3, CoCl2, and Na2S. During this process, Co early adopts an octahedral coordination to form an amorphous CoSn-polysulfide precursor. Because this metastable precursor persists over the 3100-hour duration and limits full Co incorporation into the pyrite lattice, both the unreacted precursor and the successfully substituted Co-doped pyrite phases are present in the final product. | Full points if the answer identifies both a Co-substituted pyrite component (or theoretical DFT model of it) and a Co-doped precursor (or amorphous CoSn polysulfide) component. |
| q2 | quantification | 30 | Based on the synthesis conditions (0.5 mol% initial Co:Fe, room temperature, 3100 h duration), estimate the phase fractions of the Co-bearing species in the final product. | The estimated phase fractions for the Co-bearing species are 0.69 (69%) for the CoSn precursor and 0.31 (31%) for the Co-doped pyrite, with an uncertainty of 10%. These specific values result from the low-temperature (22 °C) precipitation synthesis via the polysulfide pathway. At room temperature, the amorphous CoSn-polysulfide precursor that forms initially is metastable and persists even after 3100 hours of reaction time. Consequently, the major fraction of the 0.5 mol% initial Co remains trapped in this unreacted precursor phase, while only a minor fraction successfully substitutes for Fe in the pyrite lattice. | Full points if the estimated fractions are approximately 69% CoSn precursor and 31% Co-doped pyrite (allow ±10% margin of error). |
| q3 | reasoning | 40 | Explain the mechanistic reasoning for why Co is distributed between these specific phases rather than fully incorporating into the pyrite structure during this low-temperature synthesis. | During the room temperature (22 °C) precipitation synthesis using FeCl3, CoCl2, and Na2S, the reaction proceeds via a polysulfide pathway. In this pathway, Co early adopts an octahedral coordination and forms an amorphous CoSn-polysulfide precursor phase. This precursor is metastable and persists in the solid products even after a prolonged duration of 3100 hours. Because this unreacted precursor phase is highly stable under these low-temperature conditions, it limits Co incorporation into the pyrite structure. As a result, the majority of the Co remains trapped in the precursor phase, and only a minor fraction successfully substitutes for Fe in the pyrite lattice. | Full points if the answer explains that Co initially forms a metastable amorphous CoSn-polysulfide precursor that persists and limits/delays the full incorporation of Co into the pyrite lattice. |
Review
#385
Co-doped pyrite
Co K-edge
▶
LLM Prompt
Sample Information
Material: Co-doped pyrite
Method: precipitation
Precursors: FeCl3.6H2O, TE solution, Na2S.9H2O
Temperature C: 22
Duration Hours: 141
Atmosphere: N2
Post Treatment: Washed twice with degassed HCl (0.01 M) and O2-free milli-Q water
Sample-Specific Conditions
- Initial Co:Fe ratio: 0.13 mol%
- Multi-trace elements doped pyrite with 0.13 mol% initial Co:Fe
Preparation
- FeCl3.6H2O (0.625 mmol) and TE solution (0.00081 mmol Co) mixed with Na2S.9H2O (0.629 mmol) in O2-free milli-Q water. Stirred at room temperature.
Measurement
We plan to measure the Co K-edge XANES spectrum of this sample.
Questions
Based on all the information above:
1. Based on the synthesis conditions (precipitation at 22 °C for 141 h with 0.13 mol% initial Co:Fe), what are the expected Co-bearing phases and their approximate fractions in the final product?
2. What reference spectra or basis functions should be used to model the Co K-edge EXAFS data of this sample using linear combination fitting?
3. Explain the physical reasoning for why the majority of Co is not incorporated into the pyrite structure in this sample, despite the 141-hour synthesis duration.
Ground Truth
Material: Co-doped pyrite
Measurement: Co K-edge HERFD-XANES and EXAFS in fluorescence mode at BM16 FAME-UHD beamline
Fit method: Linear combination least squares (LC-LS) fitting of EXAFS
Phase fractions: (±10%)
| Phase | Fraction |
|---|---|
| CoSn precursor | 0.64 |
| Co-doped pyrite | 0.36 |
Fit basis (paper's reference spectra):
- theoretical spectrum of the Co-substituted pyrite DFT-modeled supercell
- experimental spectrum of the Co-doped precursor (PyPrec_05Co)
Source evidence: Figure 5 and Table 5
Key reasoning: LC-LS fitting of the EXAFS data indicates that the majority of the Co pool remains in the form of a metastable CoSn polysulfide precursor phase (64%), while a smaller fraction (36%) is incorporated into the pyrite structure. The CoSn precursor forms early and persists, limiting Co incorporation into the pyrite lattice during the synthesis at ambient temperature.
Reasoning source: Section 3.3 and Section 4.1
Scoring Rubric (total: 100 pts)
| Q | Type | Max | Question | Reference Answer | Scoring Criteria |
|---|---|---|---|---|---|
| q1 | quantification | 40 | Based on the synthesis conditions (precipitation at 22 °C for 141 h with 0.13 mol% initial Co:Fe), what are the expected Co-bearing phases and their approximate fractions in the final product? | The expected Co-bearing phases in the final product are a metastable CoSn polysulfide precursor phase and Co-doped pyrite. The approximate fractions are 64% for the CoSn precursor and 36% for the Co-doped pyrite, with an estimated uncertainty of 10%. These specific fractions result from the ambient temperature (22 °C) precipitation conditions, which cause the CoSn precursor to form early and persist throughout the 141-hour duration. Because the synthesis occurs at room temperature, the metastable precursor's persistence kinetically limits the full incorporation of the 0.13 mol% initial Co into the pyrite lattice, leaving the majority of the Co pool trapped in the precursor phase. | Full points for identifying CoSn precursor (~64%) and Co-doped pyrite (~36%). Partial points for identifying the phases without correct fractions. |
| q2 | identification | 30 | What reference spectra or basis functions should be used to model the Co K-edge EXAFS data of this sample using linear combination fitting? | To model the Co K-edge EXAFS data using linear combination least squares fitting, the basis functions should include the theoretical spectrum of a Co-substituted pyrite DFT-modeled supercell and the experimental spectrum of the Co-doped precursor (PyPrec_05Co). These specific references are required because the sample, synthesized via precipitation at 22 °C for 141 hours, does not fully incorporate the initial 0.13 mol% Co into the pyrite structure. Instead, the ambient temperature conditions lead to the early formation and persistence of a metastable CoSn polysulfide precursor phase. Therefore, both the precursor and the substituted pyrite references are necessary to accurately capture the dual-phase nature of the final product. | Full points for mentioning a theoretical/DFT model of Co-substituted pyrite and an experimental spectrum of the Co-doped precursor (or amorphous CoSn polysulfide). |
| q3 | reasoning | 30 | Explain the physical reasoning for why the majority of Co is not incorporated into the pyrite structure in this sample, despite the 141-hour synthesis duration. | Despite the long 141-hour synthesis duration, the majority of the Co (64%) is not incorporated into the pyrite structure because the precipitation reaction is conducted at an ambient temperature of 22 °C. Under these room-temperature conditions, the initial 0.13 mol% Co rapidly forms a metastable CoSn polysulfide precursor phase early in the reaction. This metastable precursor persists throughout the synthesis, creating a kinetic barrier that limits the structural incorporation of Co into the growing pyrite lattice. Consequently, only a smaller fraction (36%) of the Co pool successfully substitutes into the pyrite structure, while the rest remains trapped in the unreacted precursor phase. | Full points for explaining that Co forms a metastable CoSn polysulfide precursor phase early in the reaction, which persists and limits/delays the incorporation of Co into the pyrite lattice at ambient temperature. |
Review
#386
Co-doped pyrite precursor
Co K-edge
▶
LLM Prompt
Sample Information
Material: Co-doped pyrite precursor
Method: precipitation
Precursors: FeCl3.6H2O, CoCl2.6H2O, Na2S.9H2O
Temperature C: 22
Duration Hours: 24
Atmosphere: N2
Sample-Specific Conditions
- Synthesis duration: 24 h
- Pyrite precursor sampled at 24 h
Preparation
- FeCl3.6H2O (3.75 mmol) and CoCl2.6H2O (0.019 mmol) mixed with Na2S.9H2O (3.75 mmol). Sampled after 24 h.
Measurement
We plan to measure the Co K-edge XANES spectrum of this sample.
Questions
Based on all the information above:
1. Based on the synthesis conditions (24 h sampling of a Co-doped pyrite synthesis), what is the dominant Co-bearing phase, and what is the physical reasoning for its formation?
2. Describe the expected pre-edge features in the Co K-edge HERFD-XANES spectrum for this sample and explain their structural origin.
3. What distinguishes the local structure of Co in this precursor phase from crystalline Co-doped pyrite, and how is this difference observed in the X-ray absorption data?
Ground Truth
Material: Co-doped pyrite precursor
Measurement: Co K-edge High Energy Resolution Fluorescence Detected (HERFD) XANES and EXAFS
Fit method: shell-by-shell fitting (EXAFS)
Phase fractions: (±10%)
| Phase | Fraction |
|---|---|
| amorphous CoSn polysulfide | 1.0 |
Fit basis (paper's reference spectra):
- Theoretical phase and amplitude functions calculated using Feff8 from pyrite structure
Source evidence: Section 3.2, Section 3.3, Figure 2, Figure 3
Key reasoning: The Co K-edge XANES pre-edge shows a doublet indicating octahedral coordination. EXAFS shell-by-shell fitting reveals Co is surrounded by ~5.8 S atoms at 2.262 Å, consistent with a pyrite-like local structure, but lacks cation neighbors at 3.8 Å. This indicates Co forms pyrite-like octahedral CoSn polysulfide monomeric units that aggregate into an amorphous phase, rather than substituting for Fe in the mackinawite precursor.
Reasoning source: Section 3.2 and 3.3
Scoring Rubric (total: 100 pts)
| Q | Type | Max | Question | Reference Answer | Scoring Criteria |
|---|---|---|---|---|---|
| q1 | reasoning | 30 | Based on the synthesis conditions (24 h sampling of a Co-doped pyrite synthesis), what is the dominant Co-bearing phase, and what is the physical reasoning for its formation? | Based on the 24-hour precipitation synthesis at 22 °C, the dominant Co-bearing phase is 100% amorphous CoSn polysulfide. Under these ambient, aqueous conditions with FeCl3, CoCl2, and Na2S precursors, Co does not substitute for Fe in the intermediate mackinawite precursor. Instead, the reaction between Co and sulfide over 24 hours leads to the formation of pyrite-like octahedral CoSn polysulfide monomeric units. These monomeric units subsequently aggregate into an amorphous phase rather than crystallizing, which explains the complete dominance of the amorphous CoSn polysulfide phase in the precursor. | Mentions amorphous CoSn polysulfide (or CoSn(am)). Explains that Co rapidly reacts with polysulfides to form octahedral CoSn monomeric units that aggregate into an amorphous phase, rather than substituting for Fe in the tetrahedral sites of the mackinawite precursor. |
| q2 | spectral | 35 | Describe the expected pre-edge features in the Co K-edge HERFD-XANES spectrum for this sample and explain their structural origin. | The Co K-edge HERFD-XANES spectrum for this sample is expected to display a pre-edge doublet with peaks located at 7709.3–7709.6 eV and 7711.7 eV. These features originate from the sixfold octahedral coordination of the Co2+ cations to their sulfide first neighbors. Because the 24-hour precipitation synthesis at 22 °C drives Co to form pyrite-like CoSn polysulfide monomeric units rather than substituting into the tetrahedral sites of a mackinawite precursor, the local structure around Co is strictly octahedral. This specific local geometry directly produces the observed pre-edge doublet, which is characteristic of octahedral Co and distinct from the single peak at 7708.6 eV expected for tetrahedral coordination. | Mentions a pre-edge doublet at approximately 7709.3-7709.6 eV and 7711.7 eV. Explains that this doublet indicates sixfold octahedral coordination of Co to sulfide neighbors. |
| q3 | identification | 35 | What distinguishes the local structure of Co in this precursor phase from crystalline Co-doped pyrite, and how is this difference observed in the X-ray absorption data? | The local structure of Co in this precursor phase consists of pyrite-like octahedral CoSn polysulfide monomeric units that lack the extended crystalline network of true Co-doped pyrite. Because the sample is synthesized via precipitation at a low temperature of 22 °C for 24 hours, the precursors form an amorphous aggregate rather than a fully ordered crystal lattice. In the X-ray absorption data, this structural difference is clearly observed in the EXAFS region. While the first shell shows ~5.8 S atoms at 2.262 Å consistent with a pyrite-like local structure, it completely lacks the second-shell metal neighbors at 3.8 Å that are present in crystalline pyrite. | Mentions that while the first-shell Co-S coordination is similar (octahedral, ~2.26 Å), the precursor lacks second-shell metal (Fe/Co) neighbors at ~3.8 Å. This is observed in EXAFS as a lack of contributions from cation neighbors, indicating monomeric/amorphous nature rather than a crystalline pyrite network. |
Review
#387
Amorphous CoS1+x
Co K-edge
▶
LLM Prompt
Sample Information
Material: Amorphous CoS1+x
Method: hydrothermal
Precursors: CoCl2.6H2O, Na2S.9H2O, S(0)
Temperature C: 100
Duration Hours: 18
Atmosphere: N2
Sample-Specific Conditions
- Temperature: 100 C
- Amorphous CoS1+x synthesized at 100 C
Preparation
- CoCl2.6H2O mixed with polysulfide solution and heated to 100 C for 18 h in a sealed glass vial.
Measurement
We plan to measure the Co K-edge XANES spectrum of this sample.
Questions
Based on all the information above:
1. Describe the expected Co K-edge XANES pre-edge features for the amorphous CoS1+x sample synthesized at 100 °C in the presence of polysulfides. What local coordination environment do these features indicate?
2. How can the Co K-edge XANES pre-edge be used to distinguish this amorphous CoS1+x phase (synthesized with polysulfides) from an amorphous CoS phase synthesized at 25 °C with only sulfides?
3. Based on the synthesis conditions and spectral evidence, what is the proposed local structural motif for Co in this amorphous CoS1+x phase, and how does it compare to the structure of crystalline cattierite (CoS2) or pyrite?
Ground Truth
Material: Amorphous CoS1+x
Measurement: Co K-edge HERFD-XANES and EXAFS at BM16 FAME-UHD beamline
Fit method: Shell-by-shell fitting
Phase fractions: (±10%)
| Phase | Fraction |
|---|---|
| Amorphous CoS1+x | 1.0 |
Fit basis (paper's reference spectra):
- Theoretical phase and amplitude functions calculated using Feff8 from pyrite structure
Source evidence: Fig. 2, Fig. 3, Table 4, Section 3.2, Section 3.3
Key reasoning: The Co-S_100C sample exhibits a pre-edge doublet at 7709.6 eV and 7711.7 eV, indicating a dominant octahedral coordination for Co. EXAFS shell-by-shell fitting shows a first-neighbor Co-S distance of 2.246(8) Å and coordination number 5.3(7), confirming octahedral coordination to S atoms. The lack of Co-Co pairs and the highly disordered short-ranged structure suggest it consists of the aggregation of monomeric pyrite-like CoSn octahedral units.
Reasoning source: Sections 3.2, 3.3, and 4.1
Scoring Rubric (total: 100 pts)
| Q | Type | Max | Question | Reference Answer | Scoring Criteria |
|---|---|---|---|---|---|
| q1 | spectral | 35 | Describe the expected Co K-edge XANES pre-edge features for the amorphous CoS1+x sample synthesized at 100 °C in the presence of polysulfides. What local coordination environment do these features indicate? | The expected Co K-edge XANES spectrum for this sample features a slightly split, low-intensity pre-edge doublet with peaks at 7709.6 eV and 7711.7 eV. These features indicate that the Co(II) cations are in a dominant sixfold octahedral coordination environment with sulfide first neighbors. This specific local structure arises because the hydrothermal synthesis at 100 °C using CoCl2.6H2O and a polysulfide solution (Na2S.9H2O + S(0)) drives the formation of an amorphous CoS1+x phase. EXAFS fitting further confirms this condition-driven structural outcome, showing a Co-S coordination number of 5.3(7) at a distance of 2.246(8) Å. | Must mention a low-intensity pre-edge doublet (specifically at 7709.6 eV and 7711.7 eV) and state that it indicates a dominant sixfold octahedral coordination of Co to S atoms. |
| q2 | reasoning | 35 | How can the Co K-edge XANES pre-edge be used to distinguish this amorphous CoS1+x phase (synthesized with polysulfides) from an amorphous CoS phase synthesized at 25 °C with only sulfides? | The Co K-edge XANES pre-edge can distinguish these phases based on the distinct spectral signatures of their different local coordination environments. The amorphous CoS1+x phase synthesized hydrothermally at 100 °C with polysulfides exhibits a low-intensity pre-edge doublet at 7709.6 eV and 7711.7 eV, which is characteristic of octahedral Co coordination. In contrast, an amorphous CoS phase synthesized at 25 °C with only sulfides forms a tetrahedral Co-sulfide phase, which produces a single, sharper pre-edge peak at 7708.8 eV. The higher temperature (100 °C) and the inclusion of elemental sulfur to form polysulfide precursors provide the necessary conditions to stabilize the octahedral Co-polysulfide structure over the room-temperature tetrahedral phase. | Must explain that the CoS1+x phase has a low-intensity pre-edge doublet indicative of octahedral Co, whereas the CoS phase synthesized at 25 °C without polysulfides has a single, sharper pre-edge peak (around 7708.8 eV) indicative of tetrahedral Co. |
| q3 | reasoning | 30 | Based on the synthesis conditions and spectral evidence, what is the proposed local structural motif for Co in this amorphous CoS1+x phase, and how does it compare to the structure of crystalline cattierite (CoS2) or pyrite? | The proposed local structural motif for Co in this amorphous CoS1+x phase is an aggregation of monomeric, pyrite-like CoSn octahedral units. Heating the CoCl2.6H2O and polysulfide precursors at 100 °C for 18 hours yields a highly disordered, short-ranged structure that lacks the extended Co-Co pairs found in crystalline lattices. However, the XANES pre-edge doublet and EXAFS Co-S coordination number of 5.3(7) confirm that the local Co environment remains octahedrally coordinated to sulfur. Therefore, while the local octahedral coordination is structurally analogous to the fundamental building blocks of crystalline pyrite or cattierite (CoS2), the specific 100 °C synthesis conditions arrest the material's development as amorphous, aggregated monomeric units rather than a fully crystallized extended network. | Must mention that the local structure consists of monomeric pyrite-like (or cattierite-like) CoSn octahedral units that aggregate into an amorphous phase, but lacks the extended cation (Co-Co) neighbors found in crystalline cattierite. |
Review
#388
Amorphous CoS
Co K-edge
▶
LLM Prompt
Sample Information
Material: Amorphous CoS
Method: precipitation
Precursors: CoCl2.6H2O, Na2S.9H2O
Temperature C: 25
Duration Hours: 96
Atmosphere: N2
Post Treatment: Centrifugation and 2-times washing with O2-free milliQ water
Sample-Specific Conditions
- Temperature: 25 C
- Amorphous CoS synthesized at 25 C
Preparation
- Equimolar mixing of Co(II) chloride and sodium sulfide solutions, aged for 96 h.
Measurement
We plan to measure the Co K-edge XANES spectrum of this sample.
Questions
Based on all the information above:
1. Based on the synthesis conditions (equimolar Co(II) and sulfide at 25 °C), what is the expected local coordination environment of Co in the resulting amorphous CoS phase, and what specific XANES spectral feature indicates this?
2. How does the pre-edge feature of this amorphous CoS sample distinguish it from Co-sulfide compounds containing octahedrally coordinated Co, such as Co-doped pyrite?
3. What iron sulfide mineral structure does the local coordination of Co in this amorphous CoS sample most closely resemble?
Ground Truth
Material: Amorphous CoS
Measurement: Co K-edge HERFD-XANES and EXAFS at BM16 FAME-UHD beamline (ESRF)
Fit method: Shell-by-shell fitting
Phase fractions:
| Phase | Fraction |
|---|---|
| Amorphous CoS | 1.0 |
Fit basis (paper's reference spectra):
- Theoretical phase and amplitude functions calculated using Feff8 from mackinawite structure
Source evidence: Section 3.2, Section 3.3, Figure 2
Key reasoning: The sample synthesized at 25 °C with only sulfides forms an amorphous CoS phase. XANES pre-edge analysis shows a single peak indicative of tetrahedral units, and EXAFS shell-by-shell fitting confirms Co is surrounded by a single shell of approximately 4.2 S atoms at 2.226 Å, in agreement with a dominantly tetrahedral coordination similar to the mackinawite structure.
Reasoning source: Sections 3.2 and 3.3
Scoring Rubric (total: 100 pts)
| Q | Type | Max | Question | Reference Answer | Scoring Criteria |
|---|---|---|---|---|---|
| q1 | spectral | 35 | Based on the synthesis conditions (equimolar Co(II) and sulfide at 25 °C), what is the expected local coordination environment of Co in the resulting amorphous CoS phase, and what specific XANES spectral feature indicates this? | Based on the equimolar mixing of Co(II) chloride and sodium sulfide at 25 °C, the resulting amorphous CoS phase features a dominantly tetrahedral local coordination environment for Co. This structural arrangement occurs because the low-temperature precipitation with only sulfides restricts the Co atoms to a single coordination shell of approximately 4.2 sulfur atoms at 2.226 Å. Spectroscopically, this tetrahedral coordination is indicated by the presence of a single pre-edge peak located at 7708.6 - 7708.8 eV. This single peak serves as a direct signature of the tetrahedral Co(II) units formed under these specific ambient synthesis conditions. | Full points for identifying dominantly tetrahedral coordination and mentioning the single pre-edge peak at ~7708.6-7708.8 eV. |
| q2 | reasoning | 35 | How does the pre-edge feature of this amorphous CoS sample distinguish it from Co-sulfide compounds containing octahedrally coordinated Co, such as Co-doped pyrite? | The amorphous CoS sample is distinguished by a single pre-edge peak at approximately 7708.8 eV, contrasting sharply with the pre-edge doublet observed in Co-sulfide compounds containing octahedrally coordinated Co, such as Co-doped pyrite. This distinction arises directly from the synthesis conditions, where equimolar precipitation of Co(II) and sulfide at 25 °C forms an amorphous phase with dominantly tetrahedral Co(II) units. Because the low-temperature conditions restrict Co to a single shell of ~4.2 sulfur atoms, the resulting electronic transitions yield only a single pre-edge peak. Consequently, this specific spectral shape serves as a clear marker separating the low-temperature tetrahedral amorphous CoS from octahedral Co environments. | Full points for stating that this sample has a single pre-edge peak (tetrahedral), whereas octahedrally coordinated Co compounds exhibit a pre-edge doublet. |
| q3 | identification | 30 | What iron sulfide mineral structure does the local coordination of Co in this amorphous CoS sample most closely resemble? | The local coordination of Co in this amorphous CoS sample most closely resembles the structure of mackinawite. This resemblance occurs because the equimolar precipitation of Co(II) and sulfide precursors at a low temperature of 25 °C forms an amorphous phase where Co is dominantly in a tetrahedral coordination environment. Specifically, these synthesis conditions result in Co being surrounded by a single shell of approximately 4.2 sulfur atoms at 2.226 Å. Because this short-range order perfectly mirrors the tetrahedral units of mackinawite, theoretical functions calculated from the mackinawite structure are used as the fit basis to model this low-temperature amorphous phase. | Full points for identifying mackinawite as the structurally similar iron sulfide mineral. |
Review
#389
Co-doped mackinawite
Co K-edge
▶
LLM Prompt
Sample Information
Material: Co-doped mackinawite
Method: precipitation
Precursors: FeCl2.4H2O, CoCl2.6H2O, Na2S.9H2O
Temperature C: 22
Duration Hours: 24
Atmosphere: N2
Sample-Specific Conditions
- Precursor (Fe(II) instead of Fe(III)): FeCl2.4H2O
- Co-doped mackinawite
Preparation
- FeCl2.4H2O and CoCl2.6H2O mixed with Na2S.9H2O.
Measurement
We plan to measure the Co K-edge XANES spectrum of this sample.
Questions
Based on all the information above:
1. Based on the synthesis conditions (precipitation of Fe(II) and Co(II) with sulfide at room temperature), what is the expected dominant phase and what is the local coordination environment of Co?
2. Describe the expected pre-edge spectral features for this sample at the Co K-edge. What specific structural origin does this feature indicate?
3. How would the Co K-edge XANES pre-edge of this sample differ from that of Co incorporated into a pyrite structure?
Ground Truth
Material: Co-doped mackinawite
Measurement: Co K-edge HERFD-XANES and EXAFS at BM16 FAME-UHD beamline (ESRF)
Fit method: shell-by-shell fitting
Phase fractions: (±5%)
| Phase | Fraction |
|---|---|
| Co-doped mackinawite | 1.0 |
Fit basis (paper's reference spectra):
- Theoretical phase and amplitude functions calculated using Feff8 from mackinawite structure
Source evidence: Fig. 1a, Table 3, Fig. 2, Table 4, Sections 3.1, 3.2, 3.3
Key reasoning: XRD Rietveld refinement shows the sample consists of 100% nanocrystalline mackinawite. Co K-edge HERFD-XANES shows a single sharp pre-edge peak at 7708.6 eV, indicative of fourfold tetrahedral coordination. EXAFS shell-by-shell fitting confirms Co(II) substitution for Fe(II) in the mackinawite structure with a first shell of ~4 S atoms at 2.224 Å.
Reasoning source: Sections 3.1, 3.2, and 3.3
Scoring Rubric (total: 100 pts)
| Q | Type | Max | Question | Reference Answer | Scoring Criteria |
|---|---|---|---|---|---|
| q1 | reasoning | 35 | Based on the synthesis conditions (precipitation of Fe(II) and Co(II) with sulfide at room temperature), what is the expected dominant phase and what is the local coordination environment of Co? | The expected dominant phase is 100% Co-doped mackinawite (Fe0.995Co0.005S), where Co(II) exists in a fourfold tetrahedral coordination environment with sulfide. This specific phase and coordination arise because the room-temperature (22 °C) precipitation of Fe(II) and Co(II) chlorides with Na2S under an N2 atmosphere directly yields nanocrystalline mackinawite. Under these synthesis conditions, Co(II) readily substitutes for Fe(II) in the mackinawite lattice, which is confirmed by EXAFS shell-by-shell fitting showing a first shell of approximately 4 S atoms at 2.224 Å. | Full points for identifying Co-doped mackinawite as the dominant phase and stating that Co(II) substitutes for Fe(II) in a fourfold tetrahedral coordination environment. |
| q2 | spectral | 35 | Describe the expected pre-edge spectral features for this sample at the Co K-edge. What specific structural origin does this feature indicate? | The Co K-edge XANES spectrum for this sample is expected to exhibit a single sharp pre-edge peak at 7708.6 eV. This spectral feature originates directly from the fourfold tetrahedral coordination of Co(II) to sulfide atoms. Because the synthesis conditions (precipitation of Fe(II) and Co(II) with Na2S at 22 °C under N2) yield 100% Co-doped mackinawite, the Co(II) ions substitute directly into the tetrahedral Fe(II) sites of the mackinawite lattice, producing this characteristic sharp pre-edge signature. | Full points for mentioning a single sharp pre-edge peak at approximately 7708.6 eV and attributing it to the fourfold tetrahedral coordination of Co to sulfide. |
| q3 | spectral | 30 | How would the Co K-edge XANES pre-edge of this sample differ from that of Co incorporated into a pyrite structure? | The Co K-edge XANES pre-edge of this sample features a single sharp peak at 7708.6 eV, whereas Co incorporated into a pyrite structure would exhibit a pre-edge doublet at 7709.6 eV and 7711.7 eV. This spectral difference occurs because the room-temperature precipitation of Fe(II) and Co(II) with sulfide under N2 specifically forms Co-doped mackinawite, placing Co(II) in a fourfold tetrahedral coordination environment. In contrast, a pyrite structure places Co in an octahedral coordination environment, and it is this distinct tetrahedral geometry resulting from the sample's specific synthesis conditions that produces the single sharp peak rather than a doublet. | Full points for explaining that this sample (mackinawite) has a single sharp pre-edge peak (tetrahedral Co), whereas Co in pyrite would exhibit a pre-edge doublet (e.g., at 7709.6 eV and 7711.7 eV) characteristic of octahedral coordination. |
Review
Oxidation states of iron and manganese in lignocellulose altered by the brown rot fungus Gloeophyllum trabeum measured in-situ using X-ray absorption near edge spectroscopy (XANES)
APS
Environmental
Samuel L. Zelinka et al.
DOI: 10.1016/j.ibiod.2020.105162
9 scenarios
▶
#390
wood
Mn K-edge
▶
LLM Prompt
Sample Information
Material: wood
Sample Origin: southern pine (Pinus spp.)
Sample-Specific Conditions
- exposure time: 0 weeks
- Uninoculated control wood placed in sterile growth chamber
Measurement
We plan to measure the Mn K-edge XANES spectrum of this sample.
Questions
Based on all the information above:
1. What candidate reference spectra are needed to model the Mn oxidation states in this sample using the white line peak position calibration method described in the study?
2. Given that this is an uninoculated control wood sample in a sterile environment, what Mn oxidation state is expected to dominate, and what is the physical/biological reasoning for this?
3. Based on the chemical behavior of Mn in this wood system, under what conditions would you expect to see the emergence of higher oxidation states (e.g., Mn4+) in the wood?
Ground Truth
Material: wood (southern pine)
Measurement: Mn K-edge XANES, fluorescence mode, beamline 9-BM-C at Advanced Photon Source
Fit method: Calibration curve based on white line peak position
Phase fractions: (±10%)
| Phase | Fraction |
|---|---|
| Mn2+ | 1.0 |
Fit basis (paper's reference spectra):
- MnSO4·H2O (Mn2+)
- Birnessite (Na4Mn14O27·9H2O) (Mn4+)
Source evidence: Page 6, Lines 221-222; Figure 2
Key reasoning: The control wood was placed in a sterile, uninoculated growth chamber. Without the presence of the brown rot fungus or other microbial activity to drive manganese oxidation, the manganese remains entirely in its native Mn2+ oxidation state.
Reasoning source: Section 3.1, Page 6, Lines 221-222
Scoring Rubric (total: 100 pts)
| Q | Type | Max | Question | Reference Answer | Scoring Criteria |
|---|---|---|---|---|---|
| q1 | identification | 30 | What candidate reference spectra are needed to model the Mn oxidation states in this sample using the white line peak position calibration method described in the study? | To model the Mn oxidation states using the white line peak position calibration method, the required candidate reference spectra are MnSO4·H2O (for Mn2+) and Birnessite (Na4Mn14O27·9H2O) (for Mn4+). These references establish the bounds for the oxidation states expected in the wood system. For this specific southern pine sample at 0 weeks, the wood was kept as an uninoculated control in a sterile growth chamber. Because there is no brown rot fungus or other microbial activity to drive manganese oxidation, the manganese remains entirely in its native Mn2+ oxidation state (fraction 1.0). Therefore, the sample's spectrum will align exclusively with the Mn2+ reference. | The answer must identify a Mn2+ standard (specifically MnSO4·H2O) and a Mn4+ standard (specifically Birnessite or Na4Mn14O27·9H2O) as the endmembers used for the calibration curve. |
| q2 | reasoning | 40 | Given that this is an uninoculated control wood sample in a sterile environment, what Mn oxidation state is expected to dominate, and what is the physical/biological reasoning for this? | The Mn2+ oxidation state is expected to completely dominate this sample, accounting for a fraction of 1.0. This southern pine wood sample was kept at 0 weeks exposure as an uninoculated control in a sterile growth chamber. The physical and biological reasoning for this outcome is the complete absence of brown rot fungus or other microbial activity. Without these biological agents to drive manganese oxidation, the manganese cannot transition to higher oxidation states. Consequently, the manganese remains entirely in its native Mn2+ form. | The answer must state that Mn2+ dominates (100% fraction) and explain that the sterile, uninoculated environment lacks the fungal or microbial activity required to oxidize Mn to higher states. |
| q3 | prediction | 30 | Based on the chemical behavior of Mn in this wood system, under what conditions would you expect to see the emergence of higher oxidation states (e.g., Mn4+) in the wood? | The emergence of higher oxidation states, such as Mn4+ (modeled by Birnessite), would be expected if the wood were inoculated with brown rot fungus or exposed to other microbial activity. In the current southern pine sample, the wood is an uninoculated control kept in a sterile growth chamber at 0 weeks. Under these sterile conditions, the manganese remains entirely in its native Mn2+ state (fraction 1.0) because there is no biological mechanism to drive oxidation. Therefore, breaking the sterile conditions by introducing microbial agents would provide the necessary biological driver to oxidize the native Mn2+ into higher oxidation states. | The answer must mention the introduction of fungi (such as Gloeophyllum trabeum) or other microbial action, which can drive the oxidation of Mn2+ to Mn4+ over time. |
Review
#391
wood
Mn K-edge
▶
LLM Prompt
Sample Information
Material: wood
Sample Origin: southern pine (Pinus spp.)
Sample-Specific Conditions
- exposure time: 2 weeks
- Wood exposed to Gloeophyllum trabeum for 2 weeks, measured in hydrated/living state
Measurement
We plan to measure the Mn K-edge XANES spectrum of this sample.
Questions
Based on all the information above:
1. What candidate reference spectra (standards) are appropriate for determining the Mn oxidation states in this wood sample exposed to the brown rot fungus G. trabeum?
2. Based on the environmental conditions (2 weeks exposure to G. trabeum, measured in a living/hydrated state), estimate the phase fractions of the Mn oxidation states present in the sample.
3. Explain the biological and chemical reasoning for the observed Mn oxidation states in this sample. Why is the dominant state expected, and what might explain the presence of the minor oxidized state despite G. trabeum being a brown rot fungus?
Ground Truth
Material: wood (southern pine)
Measurement: Mn K-edge XANES, fluorescence mode, beamline 9-BM-C at Advanced Photon Source
Fit method: Linear interpolation of white line peak position
Phase fractions: (±10%)
| Phase | Fraction |
|---|---|
| Mn2+ | 0.92 |
| Mn4+ | 0.08 |
Fit basis (paper's reference spectra):
- MnSO4·H2O (Mn2+ standard)
- Birnessite (Na4Mn14O27·9H2O) (Mn4+ standard)
Source evidence: Section 3.1, Page 6, Lines 228-230; Figure 2
Key reasoning: In the live/hydrated state after 2 weeks of exposure to the brown rot fungus G. trabeum, Mn is predominantly in the Mn2+ oxidation state, but a small fraction (8%) of Mn4+ is observed. G. trabeum is a brown rot fungus and lacks genes encoding Mn peroxidase enzymes (which typically oxidize Mn in white rot fungi), so the vast majority of Mn remains unoxidized (Mn2+). The limited oxidation to Mn4+ may be linked to the addition of organic matter (wood) and microbial action, suggesting a possible minor, previously unreported role for Mn redox cycling in chelator-mediated Fenton (CMF) activity.
Reasoning source: Section 4.1 (Discussion), Page 8, Lines 305-320
Scoring Rubric (total: 100 pts)
| Q | Type | Max | Question | Reference Answer | Scoring Criteria |
|---|---|---|---|---|---|
| q1 | identification | 20 | What candidate reference spectra (standards) are appropriate for determining the Mn oxidation states in this wood sample exposed to the brown rot fungus G. trabeum? | The appropriate reference spectra for fitting this sample are MnSO4·H2O as an Mn2+ standard and Birnessite (Na4Mn14O27·9H2O) as an Mn4+ standard. These specific standards are required because, after 2 weeks of exposure to the brown rot fungus G. trabeum in a hydrated/living state, the manganese in the southern pine wood exists in two distinct oxidation states. The Mn2+ standard is necessary because G. trabeum lacks Mn peroxidase enzymes, leaving the vast majority of the native manganese unoxidized. The Mn4+ standard is needed to account for a minor oxidized fraction that arises from microbial action and organic matter interactions, possibly linked to chelator-mediated Fenton (CMF) activity. | Full credit for identifying a Mn2+ standard (e.g., MnSO4) and a Mn4+ standard (e.g., Birnessite) as the necessary reference spectra. |
| q2 | quantification | 40 | Based on the environmental conditions (2 weeks exposure to G. trabeum, measured in a living/hydrated state), estimate the phase fractions of the Mn oxidation states present in the sample. | The estimated phase fractions for this sample are 0.92 (92%) Mn2+ and 0.08 (8%) Mn4+, with an uncertainty of 10%. These specific values result directly from the 2-week exposure of the southern pine wood to the brown rot fungus G. trabeum in a living/hydrated state. Because G. trabeum lacks the genes for Mn peroxidase enzymes typically found in white rot fungi, it cannot efficiently oxidize manganese, resulting in the overwhelmingly dominant 92% Mn2+ fraction. The small 8% fraction of Mn4+ occurs due to limited oxidation linked to microbial action on the wood organic matter, suggesting a minor role for Mn redox cycling in chelator-mediated Fenton chemistry. | Full credit for estimating ~92% Mn2+ and ~8% Mn4+. Partial credit for identifying that Mn2+ is highly dominant (>90%) with a small but non-zero fraction of Mn4+. |
| q3 | reasoning | 40 | Explain the biological and chemical reasoning for the observed Mn oxidation states in this sample. Why is the dominant state expected, and what might explain the presence of the minor oxidized state despite G. trabeum being a brown rot fungus? | In this southern pine wood sample exposed to G. trabeum for 2 weeks in a hydrated/living state, the manganese is predominantly unoxidized (Mn2+) with a minor oxidized component (Mn4+). The dominant Mn2+ state is expected because G. trabeum is a brown rot fungus that lacks the genes encoding Mn peroxidase enzymes, which are typically responsible for oxidizing Mn in white rot fungi. Consequently, the fungus cannot drive large-scale manganese oxidation during the 2-week exposure. However, the presence of the minor 8% Mn4+ fraction indicates that limited oxidation still occurs. This minor oxidation is likely linked to the microbial action on the wood's organic matter, pointing to a previously unreported role for Mn redox cycling in chelator-mediated Fenton (CMF) activity during the decay process. | Full credit for explaining that G. trabeum lacks Mn peroxidase enzymes (unlike white rot fungi), leading to a predominantly Mn2+ state, but that a small amount of Mn4+ forms possibly due to organic matter addition or a previously unreported Mn redox cycle associated with chelator-mediated Fenton (CMF) mechanisms. |
Review
#392
wood
Mn K-edge
▶
LLM Prompt
Sample Information
Material: wood
Sample Origin: southern pine (Pinus spp.)
Sample-Specific Conditions
- exposure time: 4 weeks
- Wood exposed to Gloeophyllum trabeum for 4 weeks, measured in hydrated/living state
Measurement
We plan to measure the Mn K-edge XANES spectrum of this sample.
Questions
Based on all the information above:
1. What candidate reference spectra (phases) are needed to model the Mn K-edge XANES of this sample, and what are the expected phase fractions for wood exposed to the brown rot fungus G. trabeum for 4 weeks in a living/hydrated state?
2. Why is the manganese predominantly in the 2+ oxidation state in this sample, and what biological characteristics of Gloeophyllum trabeum explain this lack of extensive Mn oxidation?
3. Despite the lack of specific Mn-oxidizing enzymes in this fungus, a small fraction of oxidized Mn (Mn4+) is still detected. Based on the environmental conditions of the sample, what factors might contribute to this minor oxidation?
Ground Truth
Material: wood (southern pine, Pinus spp.)
Measurement: Mn K-edge XANES, fluorescence mode, beamline 9-BM-C
Fit method: Linear interpolation based on white line peak position (modified Schulze et al. method)
Phase fractions: (±10%)
| Phase | Fraction |
|---|---|
| Mn2+ | 0.97 |
| Mn4+ | 0.03 |
Fit basis (paper's reference spectra):
- MnSO4·H2O (Mn2+)
- Birnessite (Na4Mn14O27·9H2O) (Mn4+)
Source evidence: Page 6, Section 3.1, Lines 228-229; Figure 2
Key reasoning: Mn is predominantly in the Mn2+ oxidation state. A very small fraction of Mn4+ (3%) is observed in the living/hydrated state after 4 weeks. Gloeophyllum trabeum is a brown rot fungus and lacks genes encoding Mn peroxidase enzymes, which are typically associated with white-rot fungi that oxidize Mn2+ to Mn3+/Mn4+. The slight oxidation observed may be linked to the addition of organic matter (wood) and microbial action over time, though the exact mechanism of Mn cycling in brown rot decay remains unclear.
Reasoning source: Page 8, Section 4.1, Lines 305-320
Scoring Rubric (total: 100 pts)
| Q | Type | Max | Question | Reference Answer | Scoring Criteria |
|---|---|---|---|---|---|
| q1 | quantification | 35 | What candidate reference spectra (phases) are needed to model the Mn K-edge XANES of this sample, and what are the expected phase fractions for wood exposed to the brown rot fungus G. trabeum for 4 weeks in a living/hydrated state? | To model the Mn K-edge XANES of this sample, the required reference spectra are MnSO4·H2O (Mn2+) and Birnessite (Na4Mn14O27·9H2O) (Mn4+). The expected phase fractions are 97% Mn2+ and 3% Mn4+. These specific fractions arise because the southern pine wood was exposed to Gloeophyllum trabeum, a brown rot fungus that lacks the genes encoding Mn peroxidase enzymes needed to extensively oxidize Mn. Consequently, after 4 weeks of exposure in a hydrated/living state, the manganese remains predominantly in the 2+ oxidation state, with only a very minor fraction undergoing oxidation. | Full credit for identifying Mn2+ and Mn4+ reference phases (e.g., MnSO4 and Birnessite) and correctly estimating the fractions at ~97% Mn2+ and ~3% Mn4+. |
| q2 | reasoning | 35 | Why is the manganese predominantly in the 2+ oxidation state in this sample, and what biological characteristics of Gloeophyllum trabeum explain this lack of extensive Mn oxidation? | Manganese remains predominantly in the 2+ oxidation state (97%) because the southern pine wood was exposed to Gloeophyllum trabeum, a brown rot fungus. Biologically, this specific fungus lacks the genes encoding Mn peroxidase enzymes. While white-rot fungi utilize these enzymes to actively oxidize Mn2+ to Mn3+ or Mn4+, G. trabeum cannot drive this extensive oxidation. Therefore, after 4 weeks of exposure in a living/hydrated state, the sample retains nearly all of its manganese in the unoxidized Mn2+ form. | Full credit for explaining that G. trabeum is a brown rot fungus that lacks the Mn peroxidase enzymes typically responsible for oxidizing Mn2+ to higher oxidation states (which is characteristic of white rot fungi). |
| q3 | reasoning | 30 | Despite the lack of specific Mn-oxidizing enzymes in this fungus, a small fraction of oxidized Mn (Mn4+) is still detected. Based on the environmental conditions of the sample, what factors might contribute to this minor oxidation? | A small fraction of oxidized Mn4+ (3%) is detected in the sample despite the fungus lacking Mn peroxidase enzymes. This minor oxidation is likely linked to the environmental conditions of the sample, specifically the presence of organic matter from the southern pine wood and general microbial action over the 4-week exposure period. Because the sample was maintained and measured in a hydrated, living state, these ongoing biological and environmental interactions can facilitate slight manganese oxidation. However, the exact mechanism of this minor Mn cycling during brown rot decay remains unclear. | Full credit for attributing the minor presence of Mn4+ to the addition of organic matter (wood) and general microbial action over the exposure period. |
Review
#393
soil
Mn K-edge
▶
LLM Prompt
Sample Information
Material: soil
Sample Origin: growth chamber soil
Sample-Specific Conditions
- material: soil
- Soil from growth chamber containing fungal hyphae
Measurement
We plan to measure the Mn K-edge XANES spectrum of this sample.
Questions
Based on all the information above:
1. What candidate reference spectra (oxidation states and specific model compounds) are needed to quantify the Mn speciation in this fungal-inoculated soil sample?
2. Estimate the phase fractions of the Mn oxidation states present in the bulk soil containing fungal hyphae after up to 8 weeks of exposure.
3. Explain the biological and environmental reasoning for the presence of oxidized Mn (Mn4+) in this soil sample, considering that the inoculant (G. trabeum) is a brown rot fungus.
Ground Truth
Material: soil
Measurement: Mn K-edge XANES, fluorescence mode, beamline 9-BM-C (Advanced Photon Source)
Fit method: Peak position calibration (linear relationship of white line peak to fraction of Mn2+)
Phase fractions: (±10%)
| Phase | Fraction |
|---|---|
| Mn2+ | 0.82 |
| Mn4+ | 0.18 |
Fit basis (paper's reference spectra):
- MnSO4·H2O (Mn2+)
- Birnessite (Na4Mn14O27·9H2O) (Mn4+)
Source evidence: Section 4.1, page 8, lines 298-300; Figure 2
Key reasoning: The soil with fungal hyphae exhibited the highest fraction of Mn4+ (up to 18%) among all measurements taken. Although G. trabeum is a brown rot fungus that lacks genes encoding Mn peroxidase enzymes, the observed Mn oxidation is likely linked to the addition of organic matter (wood) and microbial action. This aligns with observations that litter-decomposing fungi can drive Mn oxidation over time when organic matter is present.
Reasoning source: Section 4.1 Discussion, page 8, lines 298-313
Scoring Rubric (total: 100 pts)
| Q | Type | Max | Question | Reference Answer | Scoring Criteria |
|---|---|---|---|---|---|
| q1 | identification | 25 | What candidate reference spectra (oxidation states and specific model compounds) are needed to quantify the Mn speciation in this fungal-inoculated soil sample? | To quantify the Mn speciation in this sample, the required reference spectra are MnSO4·H2O to represent the Mn2+ oxidation state and Birnessite (Na4Mn14O27·9H2O) to represent the Mn4+ oxidation state. These specific phases are expected in the growth chamber soil containing fungal hyphae because the system involves both native reduced soil manganese and biologically driven oxidation processes. Although the inoculant G. trabeum lacks Mn peroxidase enzymes, the addition of organic matter (wood) and microbial action drives the partial oxidation of Mn2+ to Mn4+, necessitating references for both states to accurately capture this transformation. | Full points for identifying the need for Mn2+ and Mn4+ reference spectra, specifically mentioning a divalent manganese sulfate (MnSO4·H2O) and a tetravalent manganese oxide like Birnessite. |
| q2 | quantification | 35 | Estimate the phase fractions of the Mn oxidation states present in the bulk soil containing fungal hyphae after up to 8 weeks of exposure. | The estimated phase fractions in the bulk soil are 82% Mn2+ and 18% Mn4+, with an uncertainty of 10%. These specific values result from the biological activity within the growth chamber soil containing fungal hyphae, where the 18% Mn4+ represents the highest fraction of oxidized manganese observed among the measurements. This partial oxidation is driven by the addition of organic matter (wood) and subsequent microbial action, which allows litter-decomposing fungi to promote Mn oxidation over time despite G. trabeum lacking genes for Mn peroxidase enzymes. | Full points for estimating approximately 82% Mn2+ and 18% Mn4+. Partial credit for identifying that Mn2+ is the dominant phase with a minor but significant (10-20%) Mn4+ component. |
| q3 | reasoning | 40 | Explain the biological and environmental reasoning for the presence of oxidized Mn (Mn4+) in this soil sample, considering that the inoculant (G. trabeum) is a brown rot fungus. | The presence of up to 18% oxidized Mn (Mn4+) in the soil is linked to the addition of organic matter, specifically wood, and subsequent microbial action. G. trabeum is a brown rot fungus that notably lacks the genes encoding for Mn peroxidase enzymes, which typically drive direct manganese oxidation. However, in the growth chamber soil containing fungal hyphae, the presence of organic matter allows litter-decomposing fungi to indirectly drive Mn oxidation over time, resulting in the observed accumulation of Mn4+ alongside the predominant Mn2+ pool. | Full points for explaining that while G. trabeum lacks Mn peroxidase enzymes (unlike white rot fungi), the Mn oxidation is linked to the addition of organic matter (wood) and microbial action, which can drive Mn oxidation over time. |
Review
#394
wood
Fe K-edge
▶
LLM Prompt
Sample Information
Material: wood
Sample Origin: southern pine (Pinus spp.)
Sample-Specific Conditions
- condition: living
- Wood exposed to Gloeophyllum trabeum, measured in hydrated/living state
Measurement
We plan to measure the Fe K-edge XANES spectrum of this sample.
Questions
Based on all the information above:
1. What is the expected dominant oxidation state of iron in this macroscopic sample of living wood undergoing brown rot decay?
2. According to the chelator-mediated Fenton (CMF) mechanism, brown rot fungi reduce iron to depolymerize wood. Why does the macroscopic measurement of this living sample show almost exclusively the oxidized state?
3. What specific reference compounds would be ideal to use as a basis for determining the iron oxidation states in this sample, considering the organic nature of the iron binding?
Ground Truth
Material: wood
Measurement: Fe K-edge XANES, fluorescence mode, beamline 9-BM-C at Advanced Photon Source
Fit method: pre-edge centroid position calibration
Phase fractions: (±10%)
| Phase | Fraction |
|---|---|
| Fe3+ | 1.0 |
Fit basis (paper's reference spectra):
- Fe2+ oxalate
- Fe3+ oxalate
Source evidence: Section 3.2, Page 6-7; Figure 4
Key reasoning: Macroscopic XANES measurements on living wood inoculated with G. trabeum showed that nearly all the iron was in the Fe3+ oxidation state. Although the chelator-mediated Fenton (CMF) mechanism involves the reduction of Fe3+ to Fe2+ by fungal metabolites, the Fe2+ state is transient and rapidly cycles back to Fe3+ upon reacting with H2O2 during the decay process. Therefore, at the macroscopic level, the vast majority of the iron is observed in the ferric state. Iron oxalates (Fe2+ and Fe3+ oxalate) are the ideal reference compounds for this system because most organic iron in this environment is bound with carboxylic acid groups.
Reasoning source: Section 2.5 (Page 5), Section 3.2 (Page 7), and Section 4.2 (Page 9)
Scoring Rubric (total: 100 pts)
| Q | Type | Max | Question | Reference Answer | Scoring Criteria |
|---|---|---|---|---|---|
| q1 | identification | 30 | What is the expected dominant oxidation state of iron in this macroscopic sample of living wood undergoing brown rot decay? | The expected dominant oxidation state of iron in this macroscopic sample is Fe3+, representing a fraction of 1.0 (100%). This occurs because the sample consists of living southern pine wood exposed to the brown rot fungus Gloeophyllum trabeum, which drives a chelator-mediated Fenton (CMF) mechanism. Although fungal metabolites reduce Fe3+ to Fe2+ during this process, the Fe2+ state is highly transient and rapidly cycles back to Fe3+ upon reacting with H2O2. Consequently, macroscopic XANES measurements of the living, hydrated wood capture the vast majority of the iron in the oxidized ferric state. | Full credit for identifying Fe3+ (ferric iron) as the dominant/exclusive oxidation state. |
| q2 | reasoning | 40 | According to the chelator-mediated Fenton (CMF) mechanism, brown rot fungi reduce iron to depolymerize wood. Why does the macroscopic measurement of this living sample show almost exclusively the oxidized state? | The macroscopic measurement shows almost exclusively the oxidized Fe3+ state (fraction of 1.0) because the reduced Fe2+ state is highly transient during the active decay process. In this living southern pine wood sample exposed to Gloeophyllum trabeum, fungal metabolites reduce Fe3+ to Fe2+ as part of the CMF mechanism. However, this Fe2+ rapidly reacts with H2O2 to depolymerize the wood, immediately cycling the iron back to the Fe3+ state. Therefore, when measuring the hydrated, living wood at a macroscopic level, this rapid cycling ensures that nearly all the observed iron remains in the ferric form. | Full credit for explaining that while Fe2+ is produced during the CMF mechanism, it is a transient state that rapidly cycles back to Fe3+ during the decay process, making the bulk macroscopic measurement appear almost entirely as Fe3+. |
| q3 | identification | 30 | What specific reference compounds would be ideal to use as a basis for determining the iron oxidation states in this sample, considering the organic nature of the iron binding? | The ideal reference compounds to use as a fit basis for determining the iron oxidation states in this sample are Fe2+ oxalate and Fe3+ oxalate. This sample consists of living southern pine wood undergoing decay by Gloeophyllum trabeum, meaning the iron is organically bound within a biological matrix. In this specific decay environment, most of the organic iron is bound with carboxylic acid groups. Because of this binding environment, iron oxalates perfectly represent the local coordination chemistry and are the most appropriate standards for calibrating the pre-edge centroid position to quantify the iron states. | Full credit for identifying Fe2+ oxalate and Fe3+ oxalate, as most organic iron in this environment is bound with carboxylic acid groups. |
Review
#395
wood
Fe K-edge
▶
LLM Prompt
Sample Information
Material: wood
Sample Origin: southern pine (Pinus spp.)
Sample-Specific Conditions
- exposure time: 8 weeks
- Wood exposed to Gloeophyllum trabeum for 8 weeks and then dried
Measurement
We plan to measure the Fe K-edge XANES spectrum of this sample.
Questions
Based on all the information above:
1. Based on the sample conditions (wood exposed to brown rot fungi for 8 weeks and then dried), what are the expected iron oxidation states and their approximate phase fractions?
2. Explain the biochemical and physical reasoning for why the iron in this sample is predominantly in the Fe3+ state, despite the fungus actively utilizing a reduction mechanism during wood decay.
3. What specific reference compounds are most appropriate to use as end-members for determining the oxidation state of organic-bound iron in this wood decay system?
Ground Truth
Material: wood (southern pine)
Measurement: Fe K-edge XANES, fluorescence mode, beamline 9-BM-C
Fit method: Pre-edge centroid position analysis (two-point calibration curve)
Phase fractions: (±10%)
| Phase | Fraction |
|---|---|
| Fe2+ | 0.06 |
| Fe3+ | 0.94 |
Fit basis (paper's reference spectra):
- Fe2+ oxalate
- Fe3+ oxalate
Source evidence: Page 6, lines 237-238; Page 7, lines 240-241
Key reasoning: During brown rot decay via the chelator-mediated Fenton (CMF) mechanism, Fe3+ is reduced to Fe2+ to generate hydroxyl radicals. However, this Fe2+ is transient and rapidly cycles back to Fe3+ during the decay process, meaning macroscopic measurements predominantly show the Fe3+ state. The 8-week dried sample was the sole macroscopic exception, containing 6% Fe2+. The presence of this Fe2+ was indicated spectrally by the white line peak of the XANES pattern shifting to a lower energy compared to the Fe3+ standard.
Reasoning source: Section 3.2 (Page 6), Section 3.3 (Page 7), Section 4.2 (Page 9)
Scoring Rubric (total: 100 pts)
| Q | Type | Max | Question | Reference Answer | Scoring Criteria |
|---|---|---|---|---|---|
| q1 | quantification | 31 | Based on the sample conditions (wood exposed to brown rot fungi for 8 weeks and then dried), what are the expected iron oxidation states and their approximate phase fractions? | The expected iron oxidation states for the southern pine wood exposed to Gloeophyllum trabeum for 8 weeks and dried are 6% Fe2+ and 94% Fe3+. These specific fractions arise because the brown rot decay process utilizes a chelator-mediated Fenton (CMF) mechanism where Fe3+ is reduced to Fe2+ to generate hydroxyl radicals. However, this Fe2+ is highly transient and rapidly cycles back to Fe3+ during decay, leading to a predominantly Fe3+ state in macroscopic measurements, with this 8-week dried sample being a rare exception that preserves a small amount of Fe2+. Spectrally, the presence of this residual Fe2+ fraction is indicated by the white line peak of the XANES pattern shifting to a lower energy compared to a pure Fe3+ standard. | Full credit for identifying Fe3+ as the dominant phase (~94%) and Fe2+ as a minor phase (~6%). |
| q2 | reasoning | 44 | Explain the biochemical and physical reasoning for why the iron in this sample is predominantly in the Fe3+ state, despite the fungus actively utilizing a reduction mechanism during wood decay. | In this southern pine sample exposed to Gloeophyllum trabeum for 8 weeks, the iron is predominantly in the Fe3+ state (94%) due to the rapid cycling of iron during the decay process. The fungus employs a chelator-mediated Fenton (CMF) mechanism, which actively reduces Fe3+ to Fe2+ to generate destructive hydroxyl radicals. However, this generated Fe2+ is a highly transient intermediate that rapidly oxidizes back to Fe3+ as the reaction proceeds. Consequently, despite the active reduction mechanism occurring in the wood, macroscopic measurements capture the stable, accumulated Fe3+ state, with only a minor 6% fraction of Fe2+ remaining in this specific dried sample. | Full credit for explaining that while the chelator-mediated Fenton (CMF) mechanism reduces Fe3+ to Fe2+, the Fe2+ state is highly transient and rapidly cycles back to Fe3+ during the decay process. |
| q3 | identification | 25 | What specific reference compounds are most appropriate to use as end-members for determining the oxidation state of organic-bound iron in this wood decay system? | The most appropriate reference compounds for this system are Fe2+ oxalate and Fe3+ oxalate. These specific phases are expected because the sample consists of southern pine wood undergoing brown rot decay by Gloeophyllum trabeum, a process driven by a chelator-mediated Fenton (CMF) mechanism. In this biological environment, iron is organically bound by fungal chelators as it rapidly cycles between the Fe3+ and Fe2+ states to produce hydroxyl radicals. Therefore, using Fe2+ and Fe3+ oxalates as end-members accurately represents the transient reduced state and the predominant oxidized state of the organically coordinated iron present in the 8-week decayed wood. | Full credit for identifying Fe2+ oxalate and Fe3+ oxalate as the appropriate reference standards. |
Review
#396
fungal hyphae
Fe K-edge
▶
LLM Prompt
Sample Information
Material: fungal hyphae
Sample Origin: southern pine (Pinus spp.) section
Sample-Specific Conditions
- spatial location: hyphal mat edges
- Micro-XANES measurement on the edges of a large fungal hyphal mat
Measurement
We plan to measure the Fe K-edge XANES spectrum of this sample.
Questions
Based on all the information above:
1. What candidate reference spectra or model compounds are most appropriate for determining the iron oxidation states in this organic fungal environment, and why?
2. Based on the spatial location (edges of a large hyphal mat) after 5 weeks of exposure to the brown rot fungus, estimate the relative fractions of Fe2+ and Fe3+ present in the sample.
3. Explain the biological and chemical reasoning for the observed iron oxidation states at the edges of the hyphal mat. How does this relate to the proposed wood decay mechanism of brown rot fungi?
Ground Truth
Material: fungal hyphae on southern pine wood section
Measurement: Fe K-edge micro-XANES (µXANES) in fluorescence mode at beamline 2-ID-D
Fit method: Pre-edge centroid position analysis (two-point calibration)
Phase fractions: (±15%)
| Phase | Fraction |
|---|---|
| Fe2+ | 0.6 |
| Fe3+ | 0.4 |
Fit basis (paper's reference spectra):
- Fe2+ oxalate
- Fe3+ oxalate
Source evidence: Page 7, lines 278-280; Figure 5a
Key reasoning: The amount of Fe2+ correlates with the amount of fungal growth and the transport of iron into the wood samples by fungal hyphae. Micro-XANES scans taken on the far left and right sides (edges) of a large hyphal mat showed 60% Fe2+, compared to 40% in the middle of the mat and 20% in areas with less fungal growth. This localized reduction of iron supports the non-enzymatic chelator-mediated Fenton (CMF) mechanism, where brown rot fungi employ low molecular weight metabolites to transiently reduce Fe3+ to Fe2+ to drive wood depolymerization.
Reasoning source: Section 3.3 (Page 7) and Section 4.2 (Page 9)
Scoring Rubric (total: 100 pts)
| Q | Type | Max | Question | Reference Answer | Scoring Criteria |
|---|---|---|---|---|---|
| q1 | identification | 20 | What candidate reference spectra or model compounds are most appropriate for determining the iron oxidation states in this organic fungal environment, and why? | The most appropriate reference spectra for determining the iron oxidation states in this sample are Fe2+ oxalate and Fe3+ oxalate. These specific organic iron-chelator complexes are expected because the sample consists of fungal hyphae growing on a southern pine wood section. In this biological environment, brown rot fungi secrete low molecular weight metabolites, such as oxalate, to transport iron into the wood and drive depolymerization. The presence of these specific phases reflects the chelator-mediated Fenton (CMF) mechanism, where the fungus transiently reduces Fe3+ to Fe2+ to facilitate wood decay. | Full credit for identifying Fe2+ oxalate and Fe3+ oxalate as the appropriate reference/calibration compounds, as most organic iron in this system is bound with carboxylic acid groups. |
| q2 | quantification | 40 | Based on the spatial location (edges of a large hyphal mat) after 5 weeks of exposure to the brown rot fungus, estimate the relative fractions of Fe2+ and Fe3+ present in the sample. | Based on the spatial location at the edges of the large hyphal mat, the estimated relative fractions are 60% Fe2+ and 40% Fe3+, with an uncertainty of 15%. These specific values result from the fact that the amount of Fe2+ strongly correlates with active fungal growth and the transport of iron into the wood by the hyphae. The edges of the mat represent areas of highly localized iron reduction, yielding a higher Fe2+ fraction compared to the middle of the mat (40% Fe2+) or areas with less fungal growth (20% Fe2+). This elevated Fe2+ fraction at the edges is driven by the fungus employing low molecular weight metabolites to transiently reduce Fe3+ to Fe2+ for wood depolymerization. | Full credit for estimating approximately 60% Fe2+ and 40% Fe3+. Partial credit for identifying that Fe2+ is the majority phase or significantly elevated (>50%) compared to bulk wood. |
| q3 | reasoning | 40 | Explain the biological and chemical reasoning for the observed iron oxidation states at the edges of the hyphal mat. How does this relate to the proposed wood decay mechanism of brown rot fungi? | The observed iron oxidation states at the edges of the hyphal mat are the result of active iron transport and localized reduction by the fungus. Brown rot fungi utilize a non-enzymatic chelator-mediated Fenton (CMF) mechanism to break down the southern pine wood. To achieve this, the fungal hyphae secrete low molecular weight metabolites that transiently reduce Fe3+ to Fe2+. Because the edges of the hyphal mat represent areas of active fungal growth and iron transport, there is a higher concentration of reduced Fe2+ (60%) compared to other regions. This localized reduction is essential to drive the Fenton chemistry required for wood depolymerization. | Full credit for explaining that the high fraction of Fe2+ correlates with areas of dense fungal growth/activity, which supports the chelator-mediated Fenton (CMF) mechanism where fungi use low molecular weight metabolites to transiently reduce Fe3+ to Fe2+ for radical generation and wood depolymerization. |
Review
#397
fungal hyphae
Fe K-edge
▶
LLM Prompt
Sample Information
Material: fungal hyphae
Sample Origin: southern pine (Pinus spp.) section
Sample-Specific Conditions
- spatial location: hyphal mat middle
- Micro-XANES measurement in the middle of a large fungal hyphal mat
Measurement
We plan to measure the Fe K-edge XANES spectrum of this sample.
Questions
Based on all the information above:
1. Based on the sample conditions (micro-XANES measurement in the middle of a large fungal hyphal mat after 5 weeks of exposure to G. trabeum), what are the expected iron oxidation states and their approximate phase fractions?
2. Explain the physical and biological reasoning for the presence of this specific fraction of reduced iron (Fe2+) in the middle of the hyphal mat.
3. To determine the iron oxidation states in this organic-rich fungal environment using pre-edge centroid analysis, what specific reference compounds should be used to build the calibration curve?
Ground Truth
Material: fungal hyphae
Measurement: Fe K-edge µXANES, fluorescence mode, beamline 2-ID-D at Advanced Photon Source
Fit method: Pre-edge centroid position analysis
Phase fractions: (±10%)
| Phase | Fraction |
|---|---|
| Fe2+ | 0.4 |
| Fe3+ | 0.6 |
Fit basis (paper's reference spectra):
- Fe2+ oxalate
- Fe3+ oxalate
Source evidence: Page 7, lines 277-280
Key reasoning: The amount of reduced iron (Fe2+) correlates with the amount of fungal growth and the transport of iron into the wood samples by fungal hyphae. In the middle of the large hyphal mat, 40% of the iron is reduced to Fe2+, while the rest remains Fe3+. This localized reduction of iron is consistent with the chelator-mediated Fenton (CMF) mechanism, where brown rot fungi employ low molecular weight metabolites to redox cycle with iron for non-enzymatic biodegradation.
Reasoning source: Section 3.3 (Page 7) and Section 4.2 (Page 9)
Scoring Rubric (total: 100 pts)
| Q | Type | Max | Question | Reference Answer | Scoring Criteria |
|---|---|---|---|---|---|
| q1 | quantification | 30 | Based on the sample conditions (micro-XANES measurement in the middle of a large fungal hyphal mat after 5 weeks of exposure to G. trabeum), what are the expected iron oxidation states and their approximate phase fractions? | The expected iron oxidation states in the middle of the fungal hyphal mat are Fe2+ and Fe3+, with approximate phase fractions of 40% Fe2+ and 60% Fe3+ (with a 10% uncertainty). These specific fractions arise because the amount of reduced iron (Fe2+) directly correlates with the extent of fungal growth and the active transport of iron into the southern pine wood samples by the hyphae. In this central location of the large hyphal mat, the localized reduction of iron to 40% Fe2+ is driven by the chelator-mediated Fenton (CMF) mechanism. Through this mechanism, brown rot fungi utilize low molecular weight metabolites to redox cycle with iron, facilitating the non-enzymatic biodegradation of the wood. | Full credit for identifying Fe2+ and Fe3+ as the two states, with approximately 40% Fe2+ and 60% Fe3+. |
| q2 | reasoning | 40 | Explain the physical and biological reasoning for the presence of this specific fraction of reduced iron (Fe2+) in the middle of the hyphal mat. | The presence of 40% reduced iron (Fe2+) alongside 60% Fe3+ in the middle of the hyphal mat is biologically driven by the chelator-mediated Fenton (CMF) mechanism. In this process, brown rot fungi secrete low molecular weight metabolites that redox cycle with iron to drive the non-enzymatic biodegradation of the southern pine wood. The specific 40% fraction of Fe2+ occurs in this spatial location because the extent of iron reduction strongly correlates with the amount of localized fungal growth and active iron transport into the wood by the hyphae. Consequently, the dense fungal presence in the middle of the large mat provides the necessary concentration of metabolites to sustain this significant localized reduction of iron. | Full credit for explaining that Fe2+ presence correlates with fungal growth/hyphae and is driven by the fungus employing low molecular weight metabolites to reduce iron as part of the chelator-mediated Fenton (CMF) biodegradation mechanism. |
| q3 | identification | 30 | To determine the iron oxidation states in this organic-rich fungal environment using pre-edge centroid analysis, what specific reference compounds should be used to build the calibration curve? | To determine the iron oxidation states using pre-edge centroid position analysis, Fe2+ oxalate and Fe3+ oxalate should be used as the specific reference compounds. These reference phases are appropriate because the sample consists of fungal hyphae growing on southern pine wood, an environment where iron is actively complexed by organic chelators. Specifically, the chelator-mediated Fenton (CMF) mechanism employed by these fungi relies on low molecular weight metabolites to redox cycle with iron for wood biodegradation. Therefore, oxalate compounds accurately represent the organic-rich coordination environment of both the 40% reduced Fe2+ and 60% oxidized Fe3+ states generated by fungal activity in the middle of the hyphal mat. | Full credit for identifying Fe2+ oxalate and Fe3+ oxalate as the required reference standards. |
Review
#398
wood/fungi
Fe K-edge
▶
LLM Prompt
Sample Information
Material: wood/fungi
Sample Origin: southern pine (Pinus spp.) section
Sample-Specific Conditions
- spatial location: less fungal growth
- Micro-XANES measurement in a region with less fungal growth
Measurement
We plan to measure the Fe K-edge XANES spectrum of this sample.
Questions
Based on all the information above:
1. What candidate reference spectra or model compounds are most appropriate to use as a basis for determining the Fe oxidation states in this organic-rich wood/fungi system?
2. Based on the spatial location (a region with less fungal growth) and the 5-week exposure time, estimate the relative fractions of Fe2+ and Fe3+ in the sample.
3. Explain the biological and chemical reasoning for why the Fe2+ fraction is at this specific estimated level in a region with less fungal growth, and how it would compare to a region with a dense hyphal mat.
Ground Truth
Material: wood/fungi (southern pine inoculated with Gloeophyllum trabeum)
Measurement: Fe K-edge micro-XANES (µXANES) in fluorescence mode at APS beamline 2-ID-D
Fit method: Pre-edge centroid position analysis (two-point calibration curve)
Phase fractions: (±15%)
| Phase | Fraction |
|---|---|
| Fe2+ | 0.2 |
| Fe3+ | 0.8 |
Fit basis (paper's reference spectra):
- Fe2+ oxalate
- Fe3+ oxalate
Source evidence: Page 8, lines 291-293; Figure 5b
Key reasoning: The amount of Fe2+ correlates with the amount of fungal growth and the transport of iron into the wood samples by fungal hyphae. In regions with less fungal growth, the average oxidation state is lower, containing a mean of 20% Fe2+, compared to 50% in large hyphal mats. This supports the chelator-mediated Fenton (CMF) mechanism where brown rot fungi use low molecular weight metabolites to reduce Fe3+ to Fe2+ to drive non-enzymatic biodegradation.
Reasoning source: Section 4.2 (Fe oxidation states), page 9, lines 326-343
Scoring Rubric (total: 100 pts)
| Q | Type | Max | Question | Reference Answer | Scoring Criteria |
|---|---|---|---|---|---|
| q1 | identification | 20 | What candidate reference spectra or model compounds are most appropriate to use as a basis for determining the Fe oxidation states in this organic-rich wood/fungi system? | The most appropriate reference spectra for this system are Fe2+ oxalate and Fe3+ oxalate. These specific model compounds are expected because the sample consists of southern pine inoculated with Gloeophyllum trabeum, a brown rot fungus that utilizes low molecular weight metabolites to drive non-enzymatic biodegradation. Under the chelator-mediated Fenton (CMF) mechanism, the fungi use these chelating metabolites to reduce Fe3+ to Fe2+. Therefore, oxalate-bound iron references accurately represent the chemical environment of the iron being transported and reduced by the fungal hyphae within the wood. | Full credit for identifying Fe2+ oxalate and Fe3+ oxalate, as organic iron in this system is primarily bound with carboxylic acid groups. |
| q2 | quantification | 30 | Based on the spatial location (a region with less fungal growth) and the 5-week exposure time, estimate the relative fractions of Fe2+ and Fe3+ in the sample. | In this specific spatial location with less fungal growth, the estimated relative fractions are 20% Fe2+ and 80% Fe3+, with an uncertainty of 15%. These specific values result from the direct correlation between the amount of Fe2+ and the extent of fungal growth and iron transport by fungal hyphae. Because the fungi use low molecular weight metabolites to reduce Fe3+ to Fe2+ via the chelator-mediated Fenton (CMF) mechanism, regions with less fungal presence naturally experience less iron reduction. Consequently, this sample retains a higher proportion of unreduced Fe3+ (80%) compared to areas with dense hyphal mats. | Full credit for estimating approximately 20% Fe2+ and 80% Fe3+. |
| q3 | reasoning | 50 | Explain the biological and chemical reasoning for why the Fe2+ fraction is at this specific estimated level in a region with less fungal growth, and how it would compare to a region with a dense hyphal mat. | The 20% Fe2+ fraction in this region arises because the amount of Fe2+ directly correlates with fungal growth and the transport of iron into the wood samples by fungal hyphae. Biologically and chemically, brown rot fungi drive non-enzymatic biodegradation using a chelator-mediated Fenton (CMF) mechanism, where they secrete low molecular weight metabolites to reduce Fe3+ to Fe2+. In a region with less fungal growth, there are fewer metabolites available to reduce the iron, resulting in a lower mean Fe2+ fraction of 20%. In contrast, a region with a large hyphal mat would exhibit a much higher Fe2+ fraction, typically around 50%, due to the increased concentration of these reducing fungal agents. | Full credit requires explaining that the amount of Fe2+ correlates with fungal growth/hyphae density. The student must mention that brown rot fungi reduce Fe3+ to Fe2+ (via metabolites) as part of the chelator-mediated Fenton (CMF) mechanism for wood biodegradation, meaning regions with less growth will have significantly less Fe2+ (e.g., ~20%) compared to dense hyphal mats (which can reach ~50%). |
Review
Calcination temperature of the perovskite parent compound controls active metal exsolution and catalytic performance for ethanol steam reforming
BNL-NSLS-II-8-ID
Catalyst
Fernando Piazzolla et al.
DOI: 10.1016/j.ijhydene.2025.153326
2 scenarios
▶
#399
La0.4Sr0.4Ti0.8Ni0.2O3-δ
Ni K-edge
▶
LLM Prompt
Sample Information
Material: La0.4Sr0.4Ti0.8Ni0.2O3-δ
Reaction Conditions: measured at room temperature under He
Sample-Specific Conditions
- calcination temperature: 650 °C
- La0.4Sr0.4Ti0.8Ni0.2O3-δ perovskite calcined at 650 °C
Measurement
We plan to measure the Ni K-edge XANES spectrum of this sample.
Questions
Based on all the information above:
1. What is the expected dominant oxidation state and local structural environment of Ni in the as-prepared La0.4Sr0.4Ti0.8Ni0.2O3-δ sample calcined at 650 °C?
2. Describe the expected energy positions for the pre-edge peak and the main peak (white line) in the Ni K-edge XANES spectrum of this as-prepared sample.
3. What does the presence of the well-defined pre-edge peak at 8333.3 eV indicate about the nickel species in this material?
4. What standard reference spectra would be appropriate to measure alongside this sample to qualitatively confirm its initial oxidation state and monitor any subsequent reduction to metallic nanoparticles?
Ground Truth
Material: La0.4Sr0.4Ti0.8Ni0.2O3-δ
Measurement: Ni K-edge XANES, measured ex-situ at room temperature under He at the 8-ID ISS beamline
Fit method: qualitative comparison
Phase fractions:
| Phase | Fraction |
|---|---|
| Ni2+_in_perovskite_lattice | 1.0 |
Fit basis (paper's reference spectra):
- Ni foil
- NiO
Source evidence: Page 5, Section 3.1, Figure 3a and Figure 3d
Key reasoning: The as-prepared LSTN 650 sample exhibits mostly Ni2+ behavior, indicating that nickel is incorporated into the perovskite lattice as Ni2+ cations occupying octahedral sites bound to 6 oxygen atoms. This is supported by the presence of a well-defined pre-edge peak characteristic of Ni2+ ions and EXAFS data showing Ni-O and Ni-O-Ni bonds with coordination numbers expected for the perovskite lattice.
Reasoning source: Page 5, Section 3.1 and Page 6, Section 3.1
Scoring Rubric (total: 100 pts)
| Q | Type | Max | Question | Reference Answer | Scoring Criteria |
|---|---|---|---|---|---|
| q1 | identification | 30 | What is the expected dominant oxidation state and local structural environment of Ni in the as-prepared La0.4Sr0.4Ti0.8Ni0.2O3-δ sample calcined at 650 °C? | The expected dominant oxidation state of Ni in this sample is Ni2+, representing a fraction of 1.0. Its local structural environment consists of Ni2+ cations occupying octahedral sites bound to 6 oxygen atoms within the perovskite lattice. These characteristics arise because the La0.4Sr0.4Ti0.8Ni0.2O3-δ sample was calcined at 650 °C and measured in its as-prepared state at room temperature under He, preventing any reduction. Under these specific synthesis and measurement conditions, nickel fully incorporates into the oxide lattice, which is further supported by EXAFS data showing expected Ni-O and Ni-O-Ni coordination numbers. | Full credit for identifying Ni2+ occupying octahedral sites within the perovskite lattice. |
| q2 | spectral | 30 | Describe the expected energy positions for the pre-edge peak and the main peak (white line) in the Ni K-edge XANES spectrum of this as-prepared sample. | The Ni K-edge XANES spectrum for this sample is expected to display a well-defined pre-edge peak at 8333.3 eV and a strong main peak (white line) at 8346.6 eV. These spectral features emerge directly from the sample's composition and its calcination at 650 °C, which incorporates the nickel entirely into the perovskite lattice as Ni2+ in octahedral sites. Because the measurement is performed on the as-prepared sample at room temperature under He, the material remains unreduced. Consequently, the spectrum reflects pure Ni2+ behavior and distinctly lacks the Ni0 edge features or shoulders that would appear upon reduction. | Full credit for stating the pre-edge peak is at approximately 8333.3 eV (8.3333 keV) and the main peak is at 8346.6 eV (8.3466 keV). |
| q3 | reasoning | 20 | What does the presence of the well-defined pre-edge peak at 8333.3 eV indicate about the nickel species in this material? | The presence of the well-defined pre-edge peak at 8333.3 eV indicates that the nickel species in the material exhibits pure Ni2+ behavior. This occurs because the La0.4Sr0.4Ti0.8Ni0.2O3-δ sample was calcined at 650 °C and measured as-prepared at room temperature under He, keeping the material in a fully oxidized state. Under these conditions, nickel is incorporated directly into the perovskite lattice as Ni2+ cations occupying octahedral sites bound to 6 oxygen atoms. The lack of reducing conditions ensures that the Ni2+ fraction remains 1.0, preventing the white line intensity from dropping or a Ni0 shoulder from forming. | Full credit for explaining that this pre-edge feature is characteristic of Ni2+ ions. |
| q4 | identification | 20 | What standard reference spectra would be appropriate to measure alongside this sample to qualitatively confirm its initial oxidation state and monitor any subsequent reduction to metallic nanoparticles? | The appropriate standard reference spectra to measure alongside this sample are NiO and Ni foil. These references are necessary because the La0.4Sr0.4Ti0.8Ni0.2O3-δ sample calcined at 650 °C initially contains nickel fully incorporated into the perovskite lattice as Ni2+. The NiO reference serves to qualitatively confirm this as-prepared, oxidized state measured under He. Meanwhile, the Ni foil reference is required to monitor any subsequent reduction, as it allows for the identification of metallic Ni0 edge features and shoulders that are distinctly absent in the initial room-temperature state. | Full credit for identifying NiO (for the Ni2+ state) and Ni foil (for the reduced Ni0 state). |
Review
#400
La0.4Sr0.4Ti0.8Ni0.2O3-δ
Ni K-edge
▶
LLM Prompt
Sample Information
Material: La0.4Sr0.4Ti0.8Ni0.2O3-δ
Reaction Conditions: measured at room temperature under He after reduction
Sample-Specific Conditions
- calcination temperature: 650 °C
- La0.4Sr0.4Ti0.8Ni0.2O3-δ perovskite calcined at 650 °C and reduced
Measurement
We plan to measure the Ni K-edge XANES spectrum of this sample.
Questions
Based on all the information above:
1. What candidate reference spectra are needed to model the Ni K-edge XANES spectrum of this reduced LSTN sample?
2. Based on the sample conditions (calcined at 650 °C and reduced), estimate the phase fractions of the nickel species present.
3. Explain the physical reasoning for why the nickel in this sample is not fully reduced to metallic nickel, despite the reducing conditions.
4. How does the specific calcination temperature (650 °C) influence the reducibility and resulting phase fractions of this sample compared to what would be expected for a highly sintered sample?
Ground Truth
Material: La0.4Sr0.4Ti0.8Ni0.2O3-δ
Measurement: Ni K-edge, in-situ measurement at room temperature under He after reduction, 8-ID ISS beamline
Fit method: Qualitative comparison and EXAFS fitting
Phase fractions:
| Phase | Fraction |
|---|---|
| metallic_nickel | 0.5 |
| nickel_oxide_or_perovskite_lattice_Ni2+ | 0.5 |
Fit basis (paper's reference spectra):
- Ni foil (Ni0)
- NiO (Ni2+)
Source evidence: Page 6, Section 3.1
Key reasoning: The low calcination temperature of 650 °C preserves a high specific surface area in the perovskite matrix, which facilitates nickel reduction and the exsolution of metallic Ni0 nanoparticles. However, the reduction is incomplete, resulting in an approximately 50:50 mixture of Ni0 and Ni2+. The remaining Ni2+ contribution is related to the incomplete reduction of the bulk nickel residing within the perovskite lattice.
Reasoning source: Page 6, Section 3.1
Scoring Rubric (total: 100 pts)
| Q | Type | Max | Question | Reference Answer | Scoring Criteria |
|---|---|---|---|---|---|
| q1 | identification | 20 | What candidate reference spectra are needed to model the Ni K-edge XANES spectrum of this reduced LSTN sample? | To model the Ni K-edge XANES spectrum of this sample, the required candidate reference spectra are Ni foil (Ni0) and NiO (Ni2+). These specific references are needed because the La0.4Sr0.4Ti0.8Ni0.2O3-δ perovskite undergoes incomplete reduction under the applied conditions. The low calcination temperature of 650 °C preserves a high specific surface area that facilitates the exsolution of metallic Ni0 nanoparticles. Concurrently, a Ni2+ reference is necessary to account for the remaining unreduced bulk nickel that still resides within the perovskite lattice. | Full points for identifying metallic Ni (Ni foil) and a Ni2+ reference (such as NiO or the unreduced perovskite) as the necessary basis spectra. |
| q2 | quantification | 30 | Based on the sample conditions (calcined at 650 °C and reduced), estimate the phase fractions of the nickel species present. | The estimated phase fractions for this sample are approximately 50% metallic nickel (Ni0) and 50% Ni2+ (nickel oxide or perovskite lattice Ni2+). These specific values result from the sample's low calcination temperature of 650 °C, which maintains a high specific surface area in the perovskite matrix. This high surface area facilitates the partial reduction and exsolution of metallic Ni0 nanoparticles. However, the reduction process remains incomplete, leaving an equal fraction of unreduced Ni2+ residing within the bulk perovskite lattice. | Full points for estimating approximately 50% metallic nickel (Ni0) and 50% oxidized nickel (Ni2+). Deduct points if the answer suggests complete reduction (100% Ni0) or no reduction. |
| q3 | reasoning | 30 | Explain the physical reasoning for why the nickel in this sample is not fully reduced to metallic nickel, despite the reducing conditions. | Despite the reducing conditions, the nickel in the La0.4Sr0.4Ti0.8Ni0.2O3-δ sample is not fully reduced because a significant portion of the nickel remains trapped as bulk nickel residing within the perovskite lattice. While the low calcination temperature of 650 °C preserves a high specific surface area that facilitates the exsolution of metallic Ni0 nanoparticles at the surface, this process does not extend completely through the bulk material. Consequently, the reduction is incomplete, resulting in an approximately 50:50 mixture where the remaining Ni2+ contribution comes from the unreduced nickel still integrated within the host lattice. | Full points for explaining that while surface nickel reduces and exsolves as metallic nanoparticles, the bulk nickel within the perovskite lattice remains unreduced (Ni2+), leading to an incomplete overall reduction. |
| q4 | reasoning | 20 | How does the specific calcination temperature (650 °C) influence the reducibility and resulting phase fractions of this sample compared to what would be expected for a highly sintered sample? | The specific low calcination temperature of 650 °C directly influences the sample's reducibility by preserving a high specific surface area in the La0.4Sr0.4Ti0.8Ni0.2O3-δ perovskite matrix. This high surface area facilitates the reduction process and the subsequent exsolution of metallic Ni0 nanoparticles, a process that would likely be hindered in a highly sintered sample with lower surface area. As a result of these specific structural conditions, the sample achieves a partial reduction state, yielding phase fractions of approximately 50% metallic Ni0 and 50% unreduced Ni2+ remaining within the bulk perovskite lattice. | Full points for stating that the low calcination temperature (650 °C) preserves a high specific surface area, which facilitates easier nickel reduction and exsolution compared to highly sintered samples where reduction is hindered. |
Review
Effects of doping with magnetic cations on the hybrid improper ferroelectricity in Sr3Sn2O7
ESRF-BM23
Pure Phase
J. Blasco et al.
DOI: 10.1016/j.jallcom.2024.176148
4 scenarios
▶
#401
Sr2.9La0.1Sn1.9Mn0.1O7
Mn K
▶
LLM Prompt
Sample Information
Material: Sr2.9La0.1Sn1.9Mn0.1O7
Crystal Structure: orthorhombic A21am
Oxidation State: +3
Sample Form: pellet
Measurement Mode: fluorescence
- Mn-doped Sr3Sn2O7 sample
Measurement
We plan to measure the Mn K XANES spectrum of this sample.
Questions
Based on all the information above:
1. Based on the sample composition and typical XANES analysis, what is the expected oxidation state of Mn in this compound, and what specific spectral evidence (edge position and shape) would confirm this?
2. What specific reference compounds should be measured alongside this sample to properly assign the Mn oxidation state via edge position comparison?
3. What specific pre-edge features are expected in the Mn K-edge XANES spectrum of this sample, and what electronic transitions do they originate from?
Ground Truth
Compound: Sr2.9La0.1Sn1.9Mn0.1O7
Oxidation state: +3
Measurement: Mn K-edge XAS, fluorescence mode, beamline BM23 of the ESRF
Edge position: not reported
Spectral shape: The energy position of the absorption edge is much closer to the Mn3+ reference than to the Mn4+ compounds. The pre-edge features are very similar to those of LaMnO3.
Labeled peaks:
| Label | Energy (eV) | Intensity | Origin | Source |
|---|---|---|---|---|
| pre-edge | not reported | not reported | 1s->3d transitions | paper_data |
Distinguishing features: Exhibits pre-edge features very similar to LaMnO3, indicating similar 1s->3d transitions and similar Mn 3d holes.
Key reasoning: The chemical valence of Mn is determined to be close to +3 because the energy position of the absorption edge is much closer to the Mn3+ reference (LaMnO3) than to the Mn4+ compounds (CaMnO3 or Ca3Mn2O7). Furthermore, the pre-edge features are very similar to those in the LaMnO3 spectrum, indicating similar 1s->3d transitions and similar Mn 3d holes.
Reasoning source: Section 3.1, Page 3
Scoring Rubric (total: 100 pts)
| Q | Type | Max | Question | Reference Answer | Scoring Criteria |
|---|---|---|---|---|---|
| q1 | reasoning | 40 | Based on the sample composition and typical XANES analysis, what is the expected oxidation state of Mn in this compound, and what specific spectral evidence (edge position and shape) would confirm this? | The expected oxidation state of Mn in the Sr2.9La0.1Sn1.9Mn0.1O7 sample is +3. This is confirmed by the energy position of the absorption edge, which is much closer to that of a Mn3+ reference like LaMnO3 rather than Mn4+ compounds. Additionally, the pre-edge features of the sample are very similar to those in the LaMnO3 spectrum. These spectral features arise because the Mn-doped Sr3Sn2O7 sample possesses similar 1s->3d transitions and similar Mn 3d holes to the Mn3+ reference, confirming the +3 valence state dictated by its composition. | Full credit if the answer identifies the +3 oxidation state and explains that the absorption edge position should be close to a Mn3+ reference rather than Mn4+ compounds, and notes the similarity of pre-edge features to a Mn3+ reference. |
| q2 | identification | 30 | What specific reference compounds should be measured alongside this sample to properly assign the Mn oxidation state via edge position comparison? | To properly assign the Mn oxidation state in the Sr2.9La0.1Sn1.9Mn0.1O7 sample, LaMnO3, CaMnO3, and Ca3Mn2O7 should be measured as reference compounds. These specific references are chosen to provide clear benchmarks for Mn3+ (LaMnO3) and Mn4+ (CaMnO3, Ca3Mn2O7) oxidation states. By comparing the sample's absorption edge position and pre-edge features to these bases, the chemical valence of Mn in the Mn-doped Sr3Sn2O7 pellet can be accurately determined. Because the sample's composition yields a +3 oxidation state, its edge position and pre-edge features will align much closer to the LaMnO3 reference than to the Mn4+ compounds. | Full credit if the answer identifies LaMnO3 (as a Mn3+ reference) and CaMnO3 or Ca3Mn2O7 (as Mn4+ references). |
| q3 | spectral | 30 | What specific pre-edge features are expected in the Mn K-edge XANES spectrum of this sample, and what electronic transitions do they originate from? | The Mn K-edge XANES spectrum of the Sr2.9La0.1Sn1.9Mn0.1O7 sample is expected to exhibit pre-edge features that are very similar to those of LaMnO3. These pre-edge features originate directly from 1s->3d electronic transitions. Because the Mn-doped Sr3Sn2O7 sample has an oxidation state of +3, it possesses similar Mn 3d holes to the Mn3+ reference compound. Consequently, the local electronic structure of the Mn dopant in this orthorhombic A21am lattice produces a pre-edge shape and absorption edge position characteristic of these specific 1s->3d transitions. | Full credit if the answer states that the pre-edge features should be similar to LaMnO3 and originate from 1s->3d transitions (indicating similar Mn 3d holes). |
Review
#402
LaMnO3
Mn K
▶
LLM Prompt
Sample Information
Material: LaMnO3
Oxidation State: +3
Sample Form: pellet
Measurement Mode: transmission
- Mn3+ reference compound
Measurement
We plan to measure the Mn K XANES spectrum of this sample.
Questions
Based on all the information above:
1. What is the expected relative energy shift of the absorption edge for this Mn3+ compound compared to a Mn4+ reference such as CaMnO3?
2. What specific electronic transitions are responsible for the pre-edge features observed in the Mn K-edge XANES spectrum of this material?
3. According to the paper, what specific structural distortion is characteristic of the Mn3+ ions in this LaMnO3 reference compound, distinguishing it from Mn3+ diluted in rigid matrices?
Ground Truth
Compound: LaMnO3
Oxidation state: +3
Measurement: Mn K-edge XANES in transmission mode at beamline BM23 of ESRF
Edge position: shifted by 4.3 eV to lower energy relative to Mn4+ (CaMnO3)
Spectral shape: Exhibits pre-edge features typical of 1s->3d transitions and an absorption edge characteristic of Mn3+, shifted 4.3 eV below that of Mn4+.
Labeled peaks:
| Label | Energy (eV) | Intensity | Origin | Source |
|---|---|---|---|---|
| pre-edge | not reported | not reported | 1s->3d transitions | paper_data |
Distinguishing features: Absorption edge is 4.3 eV lower than Mn4+ (CaMnO3); represents Jahn-Teller (JT) distorted Mn3+.
Key reasoning: LaMnO3 is utilized as a standard reference compound for Jahn-Teller (JT) distorted Mn3+. Its absorption edge position is used to evaluate the chemical valence of Mn in other compounds, exhibiting a linear chemical shift of 4.3 eV to lower energy compared to the Mn4+ reference CaMnO3. The pre-edge features are characteristic of 1s->3d transitions.
Reasoning source: Section 3.1, pages 3-4
Scoring Rubric (total: 100 pts)
| Q | Type | Max | Question | Reference Answer | Scoring Criteria |
|---|---|---|---|---|---|
| q1 | spectral | 35 | What is the expected relative energy shift of the absorption edge for this Mn3+ compound compared to a Mn4+ reference such as CaMnO3? | The absorption edge for this LaMnO3 sample is expected to exhibit a linear chemical shift of 4.3 eV to lower energy compared to the Mn4+ reference CaMnO3. This specific shift arises because the sample is a pure Mn3+ reference compound (fraction 1.0) measured in transmission mode. The lower +3 oxidation state compared to +4 means the core electrons are less tightly bound, requiring less energy for excitation. Consequently, the distinct edge position of this LaMnO3 pellet serves as a standard reference to evaluate the chemical valence of Mn in other compounds. | Full credit for stating a shift of 4.3 eV (to lower energy) relative to Mn4+ / CaMnO3. |
| q2 | spectral | 30 | What specific electronic transitions are responsible for the pre-edge features observed in the Mn K-edge XANES spectrum of this material? | The pre-edge features observed in the Mn K-edge XANES spectrum of this material originate from 1s->3d electronic transitions. These features arise directly from the sample conditions, specifically its composition as a pure LaMnO3 pellet with manganese in a +3 oxidation state. In this material, the Mn3+ ions undergo a characteristic Jahn-Teller distortion. This structural distortion breaks the local inversion symmetry around the manganese atoms, allowing the normally forbidden 1s->3d transitions to become visible and defining the pre-edge spectral shape. | Full credit for identifying the pre-edge origin as 1s->3d transitions. |
| q3 | reasoning | 35 | According to the paper, what specific structural distortion is characteristic of the Mn3+ ions in this LaMnO3 reference compound, distinguishing it from Mn3+ diluted in rigid matrices? | The Mn3+ ions in this LaMnO3 reference compound are characterized by a Jahn-Teller (JT) distortion. This specific structural distortion occurs because the sample is composed entirely of pure LaMnO3 (fraction 1.0) with manganese in the +3 oxidation state. Unlike Mn3+ ions diluted in rigid matrices that might constrain the local geometry, the bulk LaMnO3 pellet allows the Mn3+ ions to fully express this distortion. Consequently, this JT-distorted structure dictates the material's distinct spectral features, establishing it as a standard reference for evaluating Mn valence. | Full credit for identifying the presence of Jahn-Teller (JT) distortions for the Mn3+ ions in LaMnO3. |
Review
#403
CaMnO3
Mn K
▶
LLM Prompt
Sample Information
Material: CaMnO3
Oxidation State: +4
Sample Form: pellet
Measurement Mode: transmission
- Mn4+ reference compound
Measurement
We plan to measure the Mn K XANES spectrum of this sample.
Questions
Based on all the information above:
1. Based on its oxidation state, how does the Mn K-edge position of CaMnO3 compare to that of a Mn3+ reference such as LaMnO3, and what is the specific magnitude of this shift?
2. Why is CaMnO3 selected as a reference compound in the XANES analysis of Mn-doped perovskites, and what specific property does it help determine?
Ground Truth
Compound: CaMnO3
Oxidation state: +4
Measurement: Mn K edge, transmission mode, beamline BM23 of the ESRF
Edge position: not explicitly reported, but noted to be shifted by 4.3 eV relative to LaMnO3 (Mn3+)
Spectral shape: The absorption edge is shifted to higher energy compared to Mn3+ compounds (LaMnO3), with a reported 4.3 eV shift between the two reference states.
Distinguishing features: Higher energy absorption edge characteristic of Mn4+ compared to Mn3+ references.
Key reasoning: CaMnO3 is used as a standard reference compound for the Mn4+ oxidation state. Its absorption edge position is compared to LaMnO3 (Mn3+) to establish a 4.3 eV chemical shift, which is used to evaluate the valence of Mn in the doped Sr2.9La0.1Sn1.9Mn0.1O7 sample.
Reasoning source: Section 3.1, page 3
Scoring Rubric (total: 100 pts)
| Q | Type | Max | Question | Reference Answer | Scoring Criteria |
|---|---|---|---|---|---|
| q1 | spectral | 57 | Based on its oxidation state, how does the Mn K-edge position of CaMnO3 compare to that of a Mn3+ reference such as LaMnO3, and what is the specific magnitude of this shift? | The Mn K-edge position of CaMnO3 is shifted to a higher energy compared to a Mn3+ reference compound like LaMnO3. Specifically, there is a reported 4.3 eV chemical shift between these two reference states. This distinguishing spectral feature occurs because the CaMnO3 sample consists of manganese in a +4 oxidation state, which characteristically exhibits a higher energy absorption edge than Mn3+ compounds. Consequently, measuring this pure Mn4+ pellet in transmission mode provides a reliable standard to establish the baseline edge position for this specific valence state. | Full points for stating the edge is at a higher energy (or shifted) compared to Mn3+ and specifying the 4.3 eV shift. |
| q2 | reasoning | 43 | Why is CaMnO3 selected as a reference compound in the XANES analysis of Mn-doped perovskites, and what specific property does it help determine? | CaMnO3 is selected as a standard reference compound because it provides a pure baseline for the Mn4+ oxidation state. It is specifically used to establish a 4.3 eV chemical shift when compared to a Mn3+ reference like LaMnO3. This established energy shift helps determine the valence of Mn in unknown or doped samples, such as Sr2.9La0.1Sn1.9Mn0.1O7. Because the CaMnO3 pellet contains manganese exclusively in the +4 oxidation state, its transmission measurement yields the characteristic higher-energy absorption edge required to accurately evaluate the oxidation states in these doped perovskite systems. | Full points for explaining it serves as a Mn4+ standard to evaluate the chemical valence/oxidation state of Mn in the target samples. |
Review
#404
Ca3Mn2O7
Mn K
▶
LLM Prompt
Sample Information
Material: Ca3Mn2O7
Oxidation State: +4
Sample Form: pellet
Measurement Mode: transmission
- Mn4+ reference compound
Measurement
We plan to measure the Mn K XANES spectrum of this sample.
Questions
Based on all the information above:
1. What is the primary purpose of measuring the Ca3Mn2O7 spectrum in this context, and what key spectral feature is evaluated to achieve this purpose?
2. How does the absorption edge position of this Ca3Mn2O7 sample compare to Mn3+ reference compounds, and what does this distinguishing feature indicate?
3. What specific oxidation state does this reference compound represent, and how is its spectrum utilized alongside other references to evaluate the chemical valence of unknown samples?
Ground Truth
Compound: Ca3Mn2O7
Oxidation state: +4
Measurement: Mn K edge, transmission mode, beamline BM23 of the ESRF
Edge position: not reported
Spectral shape: The spectrum serves as a Mn4+ reference, exhibiting an absorption edge at a higher energy position compared to Mn3+ compounds.
Distinguishing features: Absorption edge shifted to higher energy relative to Mn3+ references, characteristic of the Mn4+ oxidation state.
Key reasoning: Ca3Mn2O7 is used as a standard Mn4+ reference compound. Its absorption edge position is compared against Mn3+ references (like LaMnO3) and target doped samples to evaluate the chemical valence of Mn via the observed chemical shift.
Reasoning source: Section 3.1, Page 3
Scoring Rubric (total: 100 pts)
| Q | Type | Max | Question | Reference Answer | Scoring Criteria |
|---|---|---|---|---|---|
| q1 | reasoning | 35 | What is the primary purpose of measuring the Ca3Mn2O7 spectrum in this context, and what key spectral feature is evaluated to achieve this purpose? | The primary purpose of measuring the Ca3Mn2O7 pellet in transmission mode is to use it as a standard Mn4+ reference compound. The key spectral feature evaluated to achieve this is the absorption edge position, specifically the observed chemical shift. Because the sample consists of pure Ca3Mn2O7 where manganese is strictly in the +4 oxidation state, its spectrum provides a reliable benchmark. This allows researchers to compare its edge position against target doped samples and Mn3+ references (like LaMnO3) to evaluate the chemical valence of Mn in unknown materials. | Full credit if the answer states it is used as a Mn4+ reference compound and that the absorption edge position (or chemical shift) is the key feature evaluated. |
| q2 | spectral | 35 | How does the absorption edge position of this Ca3Mn2O7 sample compare to Mn3+ reference compounds, and what does this distinguishing feature indicate? | The absorption edge of the Ca3Mn2O7 sample is shifted to a higher energy position compared to Mn3+ reference compounds such as LaMnO3. This distinguishing feature directly indicates the presence of the Mn4+ oxidation state. Because the measured pellet is composed of pure Ca3Mn2O7 where manganese exists entirely in the +4 oxidation state, its spectrum naturally exhibits this characteristic higher energy shift. Consequently, this distinct edge position allows the spectrum to act as a standard reference for evaluating the chemical valence of Mn in target doped samples based on the observed chemical shift. | Full credit if the answer notes that the absorption edge is shifted to a higher energy relative to Mn3+ compounds, which is characteristic of the +4 oxidation state. |
| q3 | identification | 30 | What specific oxidation state does this reference compound represent, and how is its spectrum utilized alongside other references to evaluate the chemical valence of unknown samples? | This Ca3Mn2O7 reference compound specifically represents the Mn4+ oxidation state. Its spectrum is utilized by comparing its absorption edge position against those of target doped samples and Mn3+ references like LaMnO3 to determine the chemical shift. Because the sample is a pure Ca3Mn2O7 pellet (fraction of 1.0) measured in transmission mode, it provides a clear, unadulterated baseline for the +4 state. By observing where the absorption edge of an unknown sample falls relative to this higher-energy Mn4+ standard and lower-energy Mn3+ references, the chemical valence of Mn in the target samples can be accurately evaluated. | Full credit if the answer identifies the +4 oxidation state and explains that it is compared against Mn3+ references to establish a chemical shift used to determine the valence of target samples. |
Review
Exploring a route to induce ferromagnetism on Sr3Sn2O7 by co-doping with non-Jahn-Teller-distorted Mn3+ and La3+ cations
ESRF-BM23
Synthesis
J. Blasco et al.
DOI: 10.1016/j.jallcom.2025.185048
1 scenario
▶
#405
Sr3-xLaxSn2-xMnxO7
Mn K-edge
▶
LLM Prompt
Sample Information
Material: Sr3-xLaxSn2-xMnxO7
Method: solid-state
Precursors: SnO2, SrCO3, La2O3, Mn2O3
Temperature C: 1400
Duration Hours: 24
Heating Rate C Per Min: 5
Atmosphere: Ar
Cooling Method: 5 C/min
Sample-Specific Conditions
- Mn content (x): 0.1
- x = 0.1 sample
Preparation
- Stoichiometric amounts of SnO2, SrCO3, La2O3 and Mn2O3 were mixed, ground and heated at 1000 C for 15 h in air. The resulting powder was reground, pressed into pellets and sintered at 1300 C for 24 h. Then, the pellets were reground, repressed and sintered at 1400 C for another 24 h under Ar atmosphere. The heating and cooling ramps were 5 C/min in all steps.
Measurement
We plan to measure the Mn K-edge XANES spectrum of this sample.
Questions
Based on all the information above:
1. Based on the synthesis conditions and composition (x=0.1), what is the expected oxidation state of Mn in this sample, and what reference compounds would be appropriate to verify this?
2. Describe the expected edge position of the Mn K-edge XANES spectrum for this sample compared to a prototypical Jahn-Teller distorted Mn3+ reference like LaMnO3.
3. What is the physical origin of the slight shift in the Mn K-edge energy for this sample compared to standard Mn3+ references, given that the oxidation state remains 3+?
Ground Truth
Material: Sr3-xLaxSn2-xMnxO7
Measurement: Mn K-edge, fluorescence mode, BM23 beamline at ESRF
Fit method: qualitative comparison
Phase fractions: (±5%)
| Phase | Fraction |
|---|---|
| Sr2.9La0.1Sn1.9Mn0.1O7 | 1.0 |
Fit basis (paper's reference spectra):
- LaMnO3
- CaMnO3
- Ca3Mn2O7
- LaMnxGa1-xO3
Source evidence: Section 3.2, Figure 3
Key reasoning: XRD confirms a single A3B2O7 Ruddlesden-Popper phase for x=0.1. The Mn K-edge XANES spectrum shows an edge position close to Mn3+ references but shifted ~1 eV higher. This shift is attributed to the local structure—specifically, an undistorted MnO6 octahedron lacking Jahn-Teller distortion due to the surrounding Sn4+ ions—rather than a change in oxidation state, as confirmed by Mn L2,3-edge data.
Reasoning source: Section 3.1 and 3.2
Scoring Rubric (total: 100 pts)
| Q | Type | Max | Question | Reference Answer | Scoring Criteria |
|---|---|---|---|---|---|
| q1 | identification | 30 | Based on the synthesis conditions and composition (x=0.1), what is the expected oxidation state of Mn in this sample, and what reference compounds would be appropriate to verify this? | The expected oxidation state of Mn in this sample is Mn3+. Appropriate reference compounds to verify this include LaMnO3, CaMnO3, Ca3Mn2O7, and LaMnxGa1-xO3. This Mn3+ state is expected because the solid-state synthesis of the Sr2.9La0.1Sn1.9Mn0.1O7 composition utilizes an Mn2O3 precursor and a final sintering step at 1400 °C under an inert Ar atmosphere, which prevents further oxidation. The resulting material forms a single A3B2O7 Ruddlesden-Popper phase where these specific references are necessary to distinguish between standard Jahn-Teller distorted Mn3+ and the unique undistorted local environment created by the surrounding Sn4+ ions. | 15 points for identifying Mn3+ as the oxidation state; 15 points for suggesting appropriate references (e.g., LaMnO3 for Mn3+, CaMnO3/Ca3Mn2O7 for Mn4+, or undistorted Mn3+ references like LaMnxGa1-xO3). |
| q2 | spectral | 30 | Describe the expected edge position of the Mn K-edge XANES spectrum for this sample compared to a prototypical Jahn-Teller distorted Mn3+ reference like LaMnO3. | The Mn K-edge position for this sample is expected to be shifted approximately 1 eV higher in energy compared to a prototypical Jahn-Teller distorted Mn3+ reference like LaMnO3. This distinct spectral feature arises directly from the structural environment formed during the high-temperature (1400 °C) solid-state synthesis of the Sr2.9La0.1Sn1.9Mn0.1O7 composition. In this specific A3B2O7 Ruddlesden-Popper phase, the Mn atoms are surrounded by Sn4+ ions. This surrounding matrix forces the Mn3+ ions into an undistorted MnO6 octahedral environment, and this lack of Jahn-Teller distortion causes the observed 1 eV shift to higher energy without any change in the actual oxidation state. | 30 points for stating that the edge position is shifted slightly higher (by about 1 eV) than typical JT-distorted Mn3+ references. |
| q3 | reasoning | 40 | What is the physical origin of the slight shift in the Mn K-edge energy for this sample compared to standard Mn3+ references, given that the oxidation state remains 3+? | The physical origin of the ~1 eV shift to higher energy is the local structural environment of the Mn atoms, specifically the presence of an undistorted MnO6 octahedron that lacks Jahn-Teller distortion. During the solid-state synthesis of the Sr2.9La0.1Sn1.9Mn0.1O7 (x=0.1) composition, the material forms a single A3B2O7 Ruddlesden-Popper phase. Within this specific lattice, the Mn3+ ions are surrounded by a matrix of Sn4+ ions. The structural constraints imposed by these surrounding Sn4+ ions prevent the MnO6 octahedra from undergoing the typical Jahn-Teller distortion, and this highly symmetric local environment directly causes the edge shift despite the oxidation state remaining 3+. | 40 points for explaining that the shift is due to the local structure, specifically the lack of Jahn-Teller distortion (resulting in undistorted MnO6 octahedra) caused by the surrounding Sn4+ ions. |
Review
Secondary reactions of propylene on Ga/γ-Al2O3 propane dehydrogenation catalysts
BNL-NSLS-II-8-ID
Catalyst
Roghayeh Bardool et al.
DOI: 10.1016/j.jcat.2023.115201
3 scenarios
▶
#406
Ga/γ-Al2O3
Ga K
▶
LLM Prompt
Sample Information
Material: Ga/γ-Al2O3
Support: γ-Al2O3
Reaction Conditions: 550 °C in 3% C3H8 (spectra identical to as-synthesized)
Sample-Specific Conditions
- Ga loading: 3-15 wt%
- Gallium supported on gamma-alumina with varying loadings
Measurement
We plan to measure the Ga K XANES spectrum of this sample.
Questions
Based on all the information above:
1. What is the dominant Ga phase and coordination environment in the Ga/γ-Al2O3 catalysts under propane dehydrogenation conditions (550 °C in 3% C3H8), and what physical reasoning supports this assignment?
2. Describe the expected Ga K-edge position (inflection point) for this catalyst. How does this edge position distinguish the catalyst's Ga coordination from purely octahedral Ga3+ compounds?
3. How does varying the Ga loading between 3 wt% and 15 wt% affect the Ga K-edge XANES spectral shape and edge energy of the catalysts?
4. What reference spectra would be appropriate to use for qualitative comparison to determine the coordination geometry of Ga in this sample?
Ground Truth
Material: Ga/γ-Al2O3
Measurement: Ga K-edge in-situ XAS at MR-CAT 10-BM beamline
Fit method: Qualitative comparison of XANES energy and shape
Phase fractions:
| Phase | Fraction |
|---|---|
| Ga3+ (Td) | 1.0 |
Fit basis (paper's reference spectra):
- Ga(AcAc)3
- Ga2O3
Source evidence: Section 3.1, Figure 1a, Table S2
Key reasoning: The XANES spectra of the 3-15% Ga/γ-Al2O3 catalysts are identical in shape and have a XANES energy (inflection point) of 10.3747 keV. This energy is lower than that of octahedral Ga(AcAc)3 (10.3768 keV) and is consistent with tetrahedrally coordinated Ga3+ ions. The spectra remained identical after treatment in propane at 550 °C, indicating the isolated Td Ga3+ structure is stable under reaction conditions.
Reasoning source: Section 3.1 Catalyst characterization
Scoring Rubric (total: 100 pts)
| Q | Type | Max | Question | Reference Answer | Scoring Criteria |
|---|---|---|---|---|---|
| q1 | reasoning | 30 | What is the dominant Ga phase and coordination environment in the Ga/γ-Al2O3 catalysts under propane dehydrogenation conditions (550 °C in 3% C3H8), and what physical reasoning supports this assignment? | The dominant phase in the Ga/γ-Al2O3 catalysts is isolated Ga3+ ions with tetrahedral (Td) coordination, representing a fraction of 1.0. This specific structure arises because the Ga species supported on the γ-Al2O3 adopt a stable isolated Td configuration that remains completely unchanged even when exposed to the reaction conditions of 550 °C in 3% C3H8. The physical reasoning supporting this assignment is that the measured XANES inflection point occurs at 10.3747 keV, which is characteristic of Td coordinated Ga3+ and is significantly lower than the energy expected for octahedral Ga3+. | Full credit if the answer identifies isolated Ga3+ ions with tetrahedral (Td) coordination as the sole/dominant phase and explains that the XANES energy is consistent with Td coordination and remains unchanged under reaction conditions. |
| q2 | spectral | 30 | Describe the expected Ga K-edge position (inflection point) for this catalyst. How does this edge position distinguish the catalyst's Ga coordination from purely octahedral Ga3+ compounds? | The expected Ga K-edge position (inflection point) for this catalyst is 10374.7 eV (10.3747 keV). This specific edge position arises because the 3-15 wt% Ga supported on γ-Al2O3 forms isolated Ga3+ ions with tetrahedral (Td) coordination, a structure that remains stable even under 550 °C propane reaction conditions. This edge position distinguishes the catalyst's coordination from purely octahedral Ga3+ compounds because Td coordination occurs at a lower energy; for example, the octahedral reference Ga(AcAc)3 has a higher edge energy of 10.3768 keV. | Full credit if the answer states the edge position is approximately 10374.7 eV (10.3747 keV) and explains that this energy is lower than that of octahedral Ga3+ references (like Ga(AcAc)3 at 10.3768 keV), distinguishing it as tetrahedrally coordinated. |
| q3 | prediction | 20 | How does varying the Ga loading between 3 wt% and 15 wt% affect the Ga K-edge XANES spectral shape and edge energy of the catalysts? | Varying the Ga loading between 3 wt% and 15 wt% has no effect on the Ga K-edge XANES spectral shape or the edge energy. Across this entire loading range on the γ-Al2O3 support, the spectra remain identical in shape and maintain a constant edge inflection point of 10.3747 keV. This consistency occurs because the Ga species exclusively form isolated Ga3+ ions with tetrahedral coordination regardless of the concentration within the 3-15 wt% range, and this uniform Td structure remains highly stable even after treatment in 3% C3H8 at 550 °C. | Full credit if the answer correctly predicts that the spectral shape and edge energy remain identical across the 3-15 wt% loading range. |
| q4 | identification | 20 | What reference spectra would be appropriate to use for qualitative comparison to determine the coordination geometry of Ga in this sample? | Appropriate reference spectra for qualitative comparison to determine the coordination geometry of Ga in this sample include Ga(AcAc)3 and Ga2O3. These references are necessary because they provide known coordination geometries, such as the purely octahedral Ga3+ environment in Ga(AcAc)3, which has a known edge energy of 10.3768 keV. By comparing the sample to these references, one can determine that the 3-15 wt% Ga/γ-Al2O3 catalyst exhibits a lower edge energy (10.3747 keV) characteristic of tetrahedral (Td) coordination, confirming that the support stabilizes isolated Td Ga3+ ions under both as-synthesized and 550 °C propane reaction conditions. | Full credit if the answer suggests using known octahedral and tetrahedral Ga references, specifically mentioning Ga(AcAc)3 (for Oh) and Ga2O3 (mixed Td/Oh). |
Review
#407
Ga(AcAc)3
Ga K
▶
LLM Prompt
Sample Information
Material: Ga(AcAc)3
Sample-Specific Conditions
- Reference material: Ga(AcAc)3
- Gallium(III) acetylacetonate standard
Measurement
We plan to measure the Ga K XANES spectrum of this sample.
Questions
Based on all the information above:
1. Based on the sample information, what coordination geometry does the Ga(AcAc)3 standard represent, and why is it useful as a reference in Ga K-edge XANES studies of catalysts?
2. What is the expected Ga K-edge position (defined as the inflection point of the leading edge) for this Ga(AcAc)3 reference material?
Ground Truth
Material: Ga(AcAc)3
Measurement: Ga K-edge XANES, MR-CAT 10-BM beamline at the Advanced Photon Source
Fit method: Not applicable (pure reference standard)
Phase fractions:
| Phase | Fraction |
|---|---|
| Ga3+ (Oh) | 1.0 |
Source evidence: Section 3.1, Page 3; Figure 1a; Table S2
Key reasoning: Gallium(III) acetylacetonate is a commercial standard used as a reference for octahedral (Oh) Ga3+ coordination. The XANES energy of Oh Ga ions occurs at a higher energy compared to tetrahedral (Td) Ga ions, making it a critical reference for determining the local coordination geometry of Ga in catalysts.
Reasoning source: Section 3.1 Catalyst characterization
Scoring Rubric (total: 100 pts)
| Q | Type | Max | Question | Reference Answer | Scoring Criteria |
|---|---|---|---|---|---|
| q1 | reasoning | 50 | Based on the sample information, what coordination geometry does the Ga(AcAc)3 standard represent, and why is it useful as a reference in Ga K-edge XANES studies of catalysts? | The Ga(AcAc)3 standard represents a pure octahedral (Oh) Ga3+ coordination geometry. Because the sample is a pure Gallium(III) acetylacetonate commercial standard, all gallium atoms are uniformly coordinated in this octahedral environment, yielding a 1.0 fraction of Ga3+ (Oh). This material is highly useful as a reference in XANES studies because the absorption edge energy of octahedral Ga ions occurs at a higher energy compared to tetrahedral (Td) Ga ions. Consequently, comparing catalyst spectra to this standard allows researchers to accurately determine the local coordination geometry of Ga in unknown samples. | Award 15 points for stating it represents octahedral (Oh) Ga3+ coordination. Award 15 points for explaining it is used as a reference to compare edge energies and determine the coordination geometry (e.g., distinguishing from tetrahedral Ga) in unknown catalyst samples. |
| q2 | spectral | 50 | What is the expected Ga K-edge position (defined as the inflection point of the leading edge) for this Ga(AcAc)3 reference material? | The expected Ga K-edge position, defined as the inflection point of the leading edge, for the Ga(AcAc)3 reference material is 10376.8 eV (10.3768 keV). This specific edge position arises because the sample is a pure Gallium(III) acetylacetonate standard consisting entirely of Ga3+ in an octahedral (Oh) coordination geometry. The octahedral coordination environment of the Ga3+ ions causes its XANES absorption edge to occur at a higher energy compared to tetrahedral (Td) Ga species, which typically appear at lower energies such as 10.3747 keV. Therefore, this distinct, higher-energy spectral feature serves as a definitive marker for identifying Oh Ga3+ sites in catalysts. | Award full points for correctly identifying the edge position at approximately 10376.8 eV (or 10.3768 keV). |
Review
#408
Ga2O3
Ga K
▶
LLM Prompt
Sample Information
Material: Ga2O3
Sample-Specific Conditions
- Reference material: Ga2O3
- Gallium oxide standard
Measurement
We plan to measure the Ga K XANES spectrum of this sample.
Questions
Based on all the information above:
1. What is the expected coordination environment of Ga in the Ga2O3 reference standard?
2. What is the expected Ga K-edge XANES energy (inflection point) for the Ga2O3 standard?
Ground Truth
Material: Ga2O3
Measurement: Ga K edge ex-situ at MR-CAT 10-BM beamline
Fit method: not applicable
Phase fractions:
| Phase | Fraction |
|---|---|
| Ga2O3 (50% Td, 50% Oh) | 1.0 |
Source evidence: Section 3.1, page 3
Key reasoning: Ga2O3 was scanned as a standard reference material. It possesses 50% tetrahedral (Td) and 50% octahedral (Oh) coordination. The presence of Td coordinated Ga ions results in a lower XANES energy compared to purely octahedral references.
Reasoning source: Section 3.1, page 3
Scoring Rubric (total: 100 pts)
| Q | Type | Max | Question | Reference Answer | Scoring Criteria |
|---|---|---|---|---|---|
| q1 | identification | 50 | What is the expected coordination environment of Ga in the Ga2O3 reference standard? | The expected coordination environment of Ga in the Ga2O3 reference standard is 50% tetrahedral (Td) and 50% octahedral (Oh). Because the sample is measured as a pure gallium oxide standard, its intrinsic crystal structure dictates this specific, equal distribution of coordination sites. This mixed coordination environment is a fundamental characteristic of the Ga2O3 reference material. Consequently, the presence of the Td coordinated Ga ions directly influences its spectral properties, distinguishing it from purely octahedral references. | Must state that Ga2O3 has 50% tetrahedral (Td) and 50% octahedral (Oh) coordination. |
| q2 | spectral | 50 | What is the expected Ga K-edge XANES energy (inflection point) for the Ga2O3 standard? | The expected Ga K-edge XANES energy for the Ga2O3 standard is 10374.0 eV (10.3740 keV). This specific edge position arises because the gallium oxide standard possesses a mixed coordination environment consisting of 50% tetrahedral (Td) and 50% octahedral (Oh) Ga ions. The presence of the Td coordinated Ga ions inherently results in a lower XANES energy compared to purely octahedral references, such as Ga(AcAc)3 which appears at 10.3768 keV. Therefore, the intrinsic structural composition of the Ga2O3 reference material directly shifts its absorption edge to this lower energy value. | Must state the edge energy is 10.3740 keV (or 10374.0 eV). |
Review
Structural changes to molybdenum and Brønsted acid sites in MFI zeolites during methane dehydroaromatization reaction-regeneration cycles
BNL-NSLS-II-8-ID
Catalyst
Ángel N. Santiago-Colón, Rajamani Gounder
DOI: 10.1016/j.jcat.2024.115335
2 scenarios
▶
#409
MoO3-MFI
Mo K
▶
LLM Prompt
Sample Information
Material: MoO3-MFI
Support: MFI zeolite
Sample-Specific Conditions
- preparation_method: physical mixing
- Physically mixed MoO3 and MFI after air treatment
Measurement
We plan to measure the Mo K XANES spectrum of this sample.
Questions
Based on all the information above:
1. Based on the sample conditions (physically mixed MoO3 and MFI after air treatment), what is the expected dominant oxidation state of Mo in this sample?
2. Explain the physical reasoning for why this specific oxidation state is expected for the MoO3-MFI-0.10 sample after air treatment.
Ground Truth
Material: MoO3-MFI
Measurement: Mo K-edge, transmission and fluorescence mode, ANL Sector 10-BM and BNL Sector 8-ID
Fit method: Edge energy analysis
Phase fractions: (±10%)
| Phase | Fraction |
|---|---|
| Mo6+ | 1.0 |
Fit basis (paper's reference spectra):
- Not applicable
Source evidence: Page 5, Section 3.1
Key reasoning: XANES spectra of the physically mixed MoO3-MFI-0.10 sample after air treatment show that the oxidation state of Mo is 6+. The air treatment at high temperatures maintains Mo in a fully oxidized 6+ state, consistent with H2 TPR data showing reduction from 6+ to 0. Lower oxidation states (e.g., Mo4+) would only emerge after reductive treatments, such as heating in H2/Ar.
Reasoning source: Page 5, Section 3.1
Scoring Rubric (total: 100 pts)
| Q | Type | Max | Question | Reference Answer | Scoring Criteria |
|---|---|---|---|---|---|
| q1 | prediction | 43 | Based on the sample conditions (physically mixed MoO3 and MFI after air treatment), what is the expected dominant oxidation state of Mo in this sample? | The expected dominant oxidation state of Mo in this sample is Mo6+, comprising a fraction of 1.0. This fully oxidized state is expected because the sample consists of physically mixed MoO3 and MFI that underwent an air treatment. The oxidizing environment of the air treatment maintains the molybdenum in its highest oxidation state (6+). Lower oxidation states, such as Mo4+, would only be expected to emerge if the sample were subjected to reductive treatments like heating in H2/Ar. | Full score if the answer correctly identifies Mo6+ as the dominant/sole oxidation state. |
| q2 | reasoning | 57 | Explain the physical reasoning for why this specific oxidation state is expected for the MoO3-MFI-0.10 sample after air treatment. | The physical reasoning for the exclusive presence of Mo6+ stems directly from the oxidizing conditions of the air treatment applied to the physically mixed MoO3 and MFI. Treating the sample in air at high temperatures ensures that the molybdenum remains fully oxidized in the 6+ state, which is consistent with H2 TPR data showing a subsequent reduction from 6+ to 0. Without a reductive treatment, such as heating in an H2/Ar atmosphere, there is no chemical driving force to reduce the Mo species. Consequently, lower oxidation states like Mo4+ cannot form, leaving Mo6+ as the sole oxidation state in the sample. | Full score if the answer explains that air treatment at high temperatures maintains Mo in a fully oxidized 6+ state. |
Review
#410
Mo-MFI
Mo K
▶
LLM Prompt
Sample Information
Material: Mo-MFI
Support: MFI zeolite
Sample-Specific Conditions
- state: reduced at 900 K
- Mo-MFI catalyst after partial reduction
Measurement
We plan to measure the Mo K XANES spectrum of this sample.
Questions
Based on all the information above:
1. What reference spectra should be used as the basis for a linear combination fitting (LCF) analysis of this partially reduced Mo-MFI sample?
2. Based on the treatment conditions (4% H2/Ar at 900 K for 1 h), estimate the phase fractions of the Mo oxidation states present in the sample.
3. Why does the sample reach this specific mixture of oxidation states at 900 K, and what does this indicate about the reduction pathway of ion-exchanged Mo in MFI zeolites?
Ground Truth
Material: Mo-MFI
Measurement: Mo K-edge, transmission or fluorescence mode, ANL Sector 10-BM or BNL Sector 8-ID
Fit method: Linear combination fitting (LCF)
Phase fractions: (±10%)
| Phase | Fraction |
|---|---|
| Mo4+ | 0.88 |
| Mo6+ | 0.12 |
Fit basis (paper's reference spectra):
- Mo-MFI-0.10 (after air treatment) as Mo6+ standard
- MoO2 as Mo4+ standard
Source evidence: Page 5, Section 3.1, text referencing Figure S18 and Table S8
Key reasoning: Treatment in 4% H2/Ar at 900 K for 1 h causes the partial disappearance of the pre-edge indicative of Mo6+, while the edge energy decreases to that characteristic of an oxidation state of 4+. Linear combination fitting estimates the fraction of Mo4+ to be 0.88. This supports the proposed step-wise reduction of ion-exchanged Mo from 6+ to 4+ during the first reduction feature (which occurs <900 K), prior to full reduction to Mo0 at higher temperatures.
Reasoning source: Page 5, Section 3.1
Scoring Rubric (total: 100 pts)
| Q | Type | Max | Question | Scoring Criteria |
|---|---|---|---|---|
| q1 | identification | 25 | What reference spectra should be used as the basis for a linear combination fitting (LCF) analysis of this partially reduced Mo-MFI sample? | Full points for identifying a fully oxidized Mo6+ standard (specifically air-treated Mo-MFI-0.10) and a Mo4+ standard (specifically MoO2). |
| q2 | quantification | 50 | Based on the treatment conditions (4% H2/Ar at 900 K for 1 h), estimate the phase fractions of the Mo oxidation states present in the sample. | Full points for estimating ~88% Mo4+ and ~12% Mo6+. Partial points for identifying that Mo4+ is the heavily dominant phase with a minor residual Mo6+ component. |
| q4 | reasoning | 25 | Why does the sample reach this specific mixture of oxidation states at 900 K, and what does this indicate about the reduction pathway of ion-exchanged Mo in MFI zeolites? | Full points for explaining that ion-exchanged Mo undergoes a step-wise reduction, where the first reduction feature (completed around 900 K) corresponds to the reduction of Mo6+ to Mo4+, before further reduction to Mo0 at higher temperatures. |
Review
Revisiting the influence of Ni particle size on the hydrogenation of CO2 to CH4 over Ni/CeO2
BNL-NSLS-II-8-ID
Catalyst
Dipesh Adhikari et al.
DOI: 10.1016/j.jcat.2024.115708
2 scenarios
▶
#411
Ni/CeO2
Ni K
▶
LLM Prompt
Sample Information
Material: Ni/CeO2
Support: CeO2
Reaction Conditions: in N2 at room temperature
Sample-Specific Conditions
- treatment state: as-synthesized
- As-synthesized 1 wt% Ni/CeO2 catalyst before reduction
Measurement
We plan to measure the Ni K XANES spectrum of this sample.
Questions
Based on all the information above:
1. What is the expected dominant phase of Ni in the as-synthesized 1 wt% Ni/CeO2 catalyst before any reduction treatment?
2. What reference spectra would be most appropriate to use as a basis for analyzing the state of this sample and its subsequent reduction?
3. Describe the key spectral features expected in the Ni K-edge XANES spectrum of this as-synthesized sample. How does it visually differ from a metallic Ni reference?
4. Based on standard catalyst preparation methods, explain why the Ni is found in this specific chemical state prior to the in-situ TPR experiment.
Ground Truth
Material: 1 wt% Ni/CeO2
Measurement: Ni K-edge in-situ fluorescence mode at beamline 8-ID
Fit method: Qualitative comparison to reference spectra
Phase fractions: (±10%)
| Phase | Fraction |
|---|---|
| oxidized_Ni | 1.0 |
Fit basis (paper's reference spectra):
- Ni foil
- NiO
Source evidence: Figure 6(a) and Section 3.1.6, pages 13-14
Key reasoning: The catalyst was synthesized via incipient wetness impregnation and calcined in air at 773 K to decompose the precursor, resulting in fully oxidized Ni species on the CeO2 support. The XANES spectrum of the 'Initial' sample confirms this by exhibiting a strong white line characteristic of oxidized Ni, prior to being reduced to Ni metal during the subsequent H2 TPR treatment.
Reasoning source: Section 2.1 (Catalyst synthesis) and Section 3.1.6 (X-ray Absorption Spectroscopy)
Scoring Rubric (total: 100 pts)
| Q | Type | Max | Question | Reference Answer | Scoring Criteria |
|---|---|---|---|---|---|
| q1 | identification | 20 | What is the expected dominant phase of Ni in the as-synthesized 1 wt% Ni/CeO2 catalyst before any reduction treatment? | The expected dominant phase of Ni in the as-synthesized 1 wt% Ni/CeO2 catalyst is fully oxidized Ni (NiO-like) with an oxidation state of 2+, representing a fraction of 1.0. This phase arises because the catalyst was prepared via incipient wetness impregnation and subsequently calcined in air at 773 K to decompose the precursor. This high-temperature calcination in an oxidizing environment ensures that all the nickel on the CeO2 support is fully oxidized. Consequently, when measured as-synthesized in N2 at room temperature prior to any reduction treatment, the sample remains entirely in this oxidized state. | Full credit for identifying that the Ni is fully oxidized (NiO-like or Ni2+ species). Zero credit for suggesting metallic Ni. |
| q2 | identification | 20 | What reference spectra would be most appropriate to use as a basis for analyzing the state of this sample and its subsequent reduction? | The most appropriate reference spectra to use as a basis for analyzing this sample are NiO and Ni foil. These specific references are required because the as-synthesized 1 wt% Ni/CeO2 catalyst begins as fully oxidized Ni (NiO-like) due to the initial air calcination at 773 K used to decompose the synthesis precursor. During subsequent reduction treatments, such as H2 TPR, this oxidized Ni2+ species will reduce to metallic Ni. Therefore, using NiO and Ni foil allows for a qualitative comparison to accurately track the transition from the initial oxidized state to the final metallic state. | Full credit for identifying NiO (or an oxidized Ni standard) and Ni foil (metallic Ni) as the necessary reference spectra. |
| q3 | spectral | 30 | Describe the key spectral features expected in the Ni K-edge XANES spectrum of this as-synthesized sample. How does it visually differ from a metallic Ni reference? | The Ni K-edge XANES spectrum of this sample will exhibit an edge position shifted to higher energy (~8340-8342 eV) relative to Ni foil, along with a strong white line peak of high intensity (normalized μ ~ 1.3) at approximately 8350 eV. It visually differs from a metallic Ni reference by the presence of this intense white line and the complete absence of characteristic fcc metallic Ni post-edge oscillations. These spectral features occur because the as-synthesized 1 wt% Ni/CeO2 catalyst was calcined in air at 773 K, resulting in a fully oxidized Ni2+ state on the CeO2 support. The higher edge energy and strong white line are direct electronic consequences of this oxidized 2+ state, which lacks the metallic bonding responsible for the post-edge oscillations seen in Ni foil. | Full credit for mentioning the shift of the absorption edge to higher energy (~8340-8342 eV) and the presence of a strong white line peak around 8350 eV, distinguishing it from the metallic Ni spectrum. |
| q4 | reasoning | 30 | Based on standard catalyst preparation methods, explain why the Ni is found in this specific chemical state prior to the in-situ TPR experiment. | Prior to the in-situ TPR experiment, the Ni is found entirely in a fully oxidized, Ni2+ (NiO-like) state. This specific chemical state is the direct result of the catalyst synthesis procedure, which involved incipient wetness impregnation followed by calcination in air at 773 K. The high-temperature calcination in an oxidizing atmosphere decomposes the initial nickel precursor, leaving behind fully oxidized Ni species on the CeO2 support. Because the sample is measured in its as-synthesized state in N2 at room temperature, before any reducing agent is introduced, the nickel remains trapped in this fully oxidized configuration. | Full credit for explaining that the catalyst was calcined in air (at high temperatures, e.g., 773 K) during synthesis to decompose the metal precursor, which naturally leaves the nickel in a fully oxidized state before any reductive treatment is applied. |
Review
#412
Ni/CeO2
Ni K
▶
LLM Prompt
Sample Information
Material: Ni/CeO2
Support: CeO2
Reaction Conditions: cooled to room temperature in H2/N2
Sample-Specific Conditions
- treatment state: reduced
- Reduced 1 wt% Ni/CeO2 catalyst
Measurement
We plan to measure the Ni K XANES spectrum of this sample.
Questions
Based on all the information above:
1. Based on the sample conditions (1 wt% Ni/CeO2 reduced at 673 K in H2), what is the expected dominant Ni phase, and what is the physical reasoning for this state?
2. Describe the expected overall spectral shape of this sample at the Ni K-edge and how it distinguishes itself from the unreduced (oxidized) state.
3. If one were to perform spectral comparison to verify the reduction state of this sample, what reference spectra would be most appropriate to include as a basis?
Ground Truth
Material: 1 wt% Ni/CeO2
Measurement: Ni K-edge, in-situ fluorescence mode, beamline 8-ID at NSLS-II
Fit method: Direct spectral comparison / overlay
Phase fractions: (±5%)
| Phase | Fraction |
|---|---|
| metallic_nickel | 1.0 |
Fit basis (paper's reference spectra):
- Ni foil
- NiO
Source evidence: Page 13-14, Section 3.1.6, Figure 6(a)
Key reasoning: In-situ XANES was used to evaluate the reducibility of the low-loaded Ni/CeO2 catalysts. After TPR at 673 K in H2, the spectrum of the 1 wt% Ni/CeO2 sample completely overlapped with the XANES of Ni metal foil. This indicates that the oxidized Ni species were completely reduced to Ni metal during the reduction protocol, leaving no significant residual fraction of unreduced Ni.
Reasoning source: Page 13-14, Section 3.1.6
Scoring Rubric (total: 100 pts)
| Q | Type | Max | Question | Reference Answer | Scoring Criteria |
|---|---|---|---|---|---|
| q1 | reasoning | 35 | Based on the sample conditions (1 wt% Ni/CeO2 reduced at 673 K in H2), what is the expected dominant Ni phase, and what is the physical reasoning for this state? | The expected dominant Ni phase for the 1 wt% Ni/CeO2 sample is metallic nickel (Ni metal) with an oxidation state of 0, representing a fraction of 1.0. This state arises because the sample was subjected to a temperature-programmed reduction (TPR) protocol at 673 K in an H2 environment. Under these specific reducing conditions, the oxidized Ni species on the CeO2 support are completely reduced to Ni metal. Consequently, no significant residual fraction of unreduced Ni remains, leaving metallic nickel as the sole phase. | Full credit requires identifying the phase as 100% metallic nickel (Ni0) and explaining that the reduction protocol (TPR at 673 K in H2) completely reduces the oxidized Ni species, leaving no residual unreduced Ni, as evidenced by the spectrum overlapping with Ni metal foil. |
| q2 | spectral | 35 | Describe the expected overall spectral shape of this sample at the Ni K-edge and how it distinguishes itself from the unreduced (oxidized) state. | The expected Ni K-edge spectrum for this sample will completely overlap with the distinct oscillatory shape of a Ni metal foil reference at an edge position of 8333 eV. This spectral shape arises because the 1 wt% Ni/CeO2 catalyst was fully reduced in H2 at 673 K, converting all oxidized Ni species to metallic nickel (oxidation state 0). Because of this complete reduction, the spectrum distinguishes itself from the unreduced state by lacking the intense white line that is characteristic of oxidized NiO. The absence of this white line and the match to the metal foil confirm the structural and electronic properties of a fully reduced metallic state. | Full credit requires stating that the spectrum completely overlaps with/matches a Ni metal foil reference and explicitly noting that it lacks the intense white line characteristic of NiO. |
| q3 | identification | 30 | If one were to perform spectral comparison to verify the reduction state of this sample, what reference spectra would be most appropriate to include as a basis? | The most appropriate reference spectra to include as a basis for this comparison are Ni foil and NiO. These references are necessary because the 1 wt% Ni/CeO2 sample undergoes a reduction protocol in H2 at 673 K, transitioning from an oxidized state to a reduced state. The Ni foil reference is required to identify and quantify the fully reduced metallic nickel (oxidation state 0) that forms under these conditions. Meanwhile, the NiO reference is needed to confirm the absence of the intense white line characteristic of unreduced oxidized Ni species, proving that complete reduction has occurred. | Full credit requires identifying Ni metal foil and NiO as the necessary reference spectra. |
Review
Identification and evolution of active sites in isomorphously substituted Fe-ZSM-5 catalysts for methane dehydroaromatization (MDA)
BNL-NSLS-II-8-ID
Catalyst
Xinrui Zhang et al.
DOI: 10.1016/j.jcat.2025.116090
1 scenario
▶
#413
Fe-ZSM-5
Fe K
▶
LLM Prompt
Sample Information
Material: Fe-ZSM-5
Support: ZSM-5
Sample-Specific Conditions
- treatment state: as-synthesized
- As-synthesized Fe-ZSM-5 catalyst prepared by direct synthesis with EDTA
Measurement
We plan to measure the Fe K XANES spectrum of this sample.
Questions
Based on all the information above:
1. What is the dominant Fe phase/speciation in the as-synthesized Fe-ZSM-5 prepared by direct synthesis with EDTA, and why does this synthesis method lead to this speciation?
2. Describe the expected pre-edge feature in the Fe K-edge XANES spectrum for this sample, including its energy position and the electronic transition it corresponds to.
3. What is the expected Fe K-edge energy (inflection point) for this as-synthesized sample?
Ground Truth
Material: Fe-ZSM-5
Measurement: Fe K-edge XANES, fluorescence mode, NSLS-II 8-ID ISS beamline
Fit method: not reported
Phase fractions: (±10%)
| Phase | Fraction |
|---|---|
| framework Fe3+ | 1.0 |
Fit basis (paper's reference spectra):
- FeO
- Fe2O3
Source evidence: Table 2, Figure 5a, Section 3.2
Key reasoning: The addition of EDTA to the synthesis gel stabilizes the Fe precursor, preventing its hydrolysis and subsequent aggregation. UV-Vis spectra exhibit bands exclusively below 250 nm, indicating all Fe sites are integrated in the zeolite framework. XANES shows a pre-edge peak at 7.1146 keV corresponding to Fe3+. The high pre-edge intensity is characteristic of tetrahedral coordination, confirming framework Fe species.
Reasoning source: Section 1 and Section 3.2
Scoring Rubric (total: 99 pts)
| Q | Type | Max | Question | Reference Answer | Scoring Criteria |
|---|---|---|---|---|---|
| q1 | reasoning | 33 | What is the dominant Fe phase/speciation in the as-synthesized Fe-ZSM-5 prepared by direct synthesis with EDTA, and why does this synthesis method lead to this speciation? | The dominant Fe speciation in the as-synthesized Fe-ZSM-5 sample is 100% framework Fe3+ in tetrahedral coordination. This complete incorporation into the zeolite framework is a direct result of the direct synthesis method using EDTA. Specifically, the addition of EDTA to the synthesis gel stabilizes the Fe precursor, preventing its hydrolysis and subsequent aggregation into extra-framework iron oxide clusters. Consequently, all iron is successfully integrated into the ZSM-5 framework as isolated Fe3+ sites, a structural outcome further supported by UV-Vis bands appearing exclusively below 250 nm. | Full points for identifying framework Fe3+ (or tetrahedral Fe3+ integrated in the zeolite framework) and explaining that EDTA stabilizes the Fe precursor, preventing hydrolysis and aggregation. |
| q2 | spectral | 33 | Describe the expected pre-edge feature in the Fe K-edge XANES spectrum for this sample, including its energy position and the electronic transition it corresponds to. | The Fe K-edge XANES spectrum for this sample is expected to exhibit a distinct, high-intensity pre-edge peak at 7114.6 eV (7.1146 keV). This feature originates from the 1s-3d dipole-forbidden electronic transition of Fe3+. The prominent intensity of this pre-edge feature is a direct consequence of the EDTA-assisted synthesis, which forces all iron into the zeolite framework. This specific framework integration results in tetrahedrally coordinated Fe3+ complexes that lack inversion symmetry, thereby relaxing selection rules and producing a much higher pre-edge intensity compared to typical octahedral or extra-framework Fe species. | Full points for mentioning a pre-edge peak around 7114.6 eV (or 7.1146 keV) corresponding to the 1s-3d dipole forbidden transition of Fe3+. |
| q4 | spectral | 33 | What is the expected Fe K-edge energy (inflection point) for this as-synthesized sample? | The expected Fe K-edge energy (inflection point) for this as-synthesized sample is 7123.6 eV. This specific edge position is characteristic of iron in the Fe3+ oxidation state. This electronic state and corresponding edge energy arise because the direct synthesis method utilizing EDTA stabilizes the Fe precursor, completely preventing its hydrolysis and aggregation. As a result, the iron is entirely incorporated into the ZSM-5 support as isolated, tetrahedrally coordinated framework Fe3+ sites, which dictates this observed XANES edge position. | Full points for stating the edge energy is approximately 7123.6 eV (or 7.1236 keV). |
Review
Mechanistic insights into nitrogen activation on atomic Ru clusters in self-pillared pentasil using operando atomistic models and experimental kinetics
BNL-NSLS-II-8-ID
Catalyst
Geet Gupta et al.
DOI: 10.1016/j.jcat.2025.116374
2 scenarios
▶
#414
Ru/SiO2
Ru K
▶
LLM Prompt
Sample Information
Material: Ru/SiO2
Support: Self-pillared pentasil (SPP) zeolite
Sample-Specific Conditions
- Atmosphere: Air
- Fresh subnanometric Ru clusters on self-pillared pentasil, measured in air
Measurement
We plan to measure the Ru K XANES spectrum of this sample.
Questions
Based on all the information above:
1. Based on the sample conditions (fresh subnanometric Ru clusters on SPP, exposed to air), what is the expected dominant Ru oxidation state and chemical nature of the Ru species? Explain the reasoning.
2. What is the expected Ru K-edge position (in eV or keV) for this sample, and which reference standards would be most appropriate to verify this state?
3. Although the XANES edge energy of this sample closely matches that of RuO2, what distinguishing structural feature confirms that the sample does not consist of bulk RuO2 nanoparticles?
Ground Truth
Material: Ru on self-pillared pentasil (SPP) zeolite
Measurement: Ru K-edge XANES, ex-situ in air, APS beamline 10-ID-B and NSLS-II beamline 8-ID ISS
Fit method: Edge energy determination (first inflection point in the leading edge)
Phase fractions: (±10%)
| Phase | Fraction |
|---|---|
| Isolated Ru4+ ions | 1.0 |
Fit basis (paper's reference spectra):
- Ru foil
- RuCl3
- RuO2
Source evidence: Page 11, Figure 3A, Figure 3B, Table S5
Key reasoning: When measured in air, the fresh Ru SN@SPP-IW sample exhibits an edge energy of 22.1292 keV, which is very close to that of the RuO2 standard (22.1300 keV). This indicates that the Ru species are in an oxidized state, close to a +4 valence. Furthermore, EXAFS analysis shows a Ru-O coordination number of approximately 4 with little higher shell scattering, indicating these are isolated Ru+4 ions bonded to the support rather than bulk RuO2.
Reasoning source: Section 3.2, Page 11
Scoring Rubric (total: 100 pts)
| Q | Type | Max | Question | Reference Answer | Scoring Criteria |
|---|---|---|---|---|---|
| q1 | reasoning | 35 | Based on the sample conditions (fresh subnanometric Ru clusters on SPP, exposed to air), what is the expected dominant Ru oxidation state and chemical nature of the Ru species? Explain the reasoning. | The expected dominant Ru oxidation state is +4, existing entirely as isolated Ru4+ ions (1.0 fraction). This occurs because the fresh subnanometric Ru clusters are exposed to an oxidizing air atmosphere, which fully oxidizes the highly dispersed Ru species. The resulting edge energy of 22.1292 keV closely matches the RuO2 standard, confirming the +4 valence state. Furthermore, because the Ru is supported as subnanometric clusters on the self-pillared pentasil (SPP) zeolite, they bond directly to the support with a Ru-O coordination number of approximately 4 and lack higher-shell scattering, preventing the formation of bulk RuO2. | Full credit for identifying isolated Ru4+ ions (or +4 oxidation state) and explaining that exposure to air oxidizes the subnanometric clusters to a state resembling RuO2 but remaining as isolated ions. |
| q2 | spectral | 30 | What is the expected Ru K-edge position (in eV or keV) for this sample, and which reference standards would be most appropriate to verify this state? | The expected Ru K-edge position for this sample is 22129.2 eV (or 22.1292 keV). The most appropriate reference standards to verify this state are Ru foil, RuCl3, and RuO2. This specific edge position arises because the fresh subnanometric Ru clusters are measured in an air atmosphere, causing them to fully oxidize to a +4 valence state. Consequently, the absorption edge shifts to a higher energy compared to metallic Ru foil and closely aligns with the RuO2 reference spectrum (22.1300 keV). | Full credit for stating an edge energy of approximately 22129.2 eV (22.1292 keV) and identifying RuO2 (along with Ru foil/RuCl3) as the key reference standard. |
| q3 | identification | 35 | Although the XANES edge energy of this sample closely matches that of RuO2, what distinguishing structural feature confirms that the sample does not consist of bulk RuO2 nanoparticles? | The distinguishing structural feature is the lack of Ru-Ru coordination or higher-shell scattering features, with EXAFS showing a Ru-O coordination number of approximately 4. This confirms that the sample consists of isolated Ru4+ ions bonded to the support rather than bulk RuO2. This structural outcome is a direct result of the sample conditions, specifically the use of fresh subnanometric Ru clusters dispersed on a self-pillared pentasil (SPP) zeolite support. Even though the air atmosphere oxidizes the Ru to a +4 state (matching the edge energy of RuO2), the subnanometric dispersion on the SPP support prevents the aggregation required to form bulk RuO2 nanoparticles. | Full credit for noting the lack of Ru-Ru coordination or higher-shell scattering, which confirms the Ru+4 species are isolated ions bonded to the support rather than bulk RuO2. |
Review
#415
Ru/SiO2
Ru K
▶
LLM Prompt
Sample Information
Material: Ru/SiO2
Support: Self-pillared pentasil (SPP) zeolite
Reaction Conditions: H2 at 400 °C
Sample-Specific Conditions
- Atmosphere: H2 at 400 °C
- Subnanometric Ru clusters on self-pillared pentasil, measured under H2 at 400 °C
Measurement
We plan to measure the Ru K XANES spectrum of this sample.
Questions
Based on all the information above:
1. Under the specified reaction conditions (H2 at 400 °C), what is the dominant Ru phase and oxidation state present in the subnanometric Ru/SPP catalyst, and what drives this transformation?
2. What distinguishing spectral feature in the Ru K-edge XANES indicates the formation of this phase under H2 at 400 °C, compared to the fresh catalyst?
3. To verify the oxidation state of this sample under these reducing conditions, what standard reference spectrum is essential to compare against?
Ground Truth
Material: Ru/SiO2 (Ru SN@SPP-IW)
Measurement: Ru K-edge XAS, in situ, 10-ID-B (APS) and 8-ID ISS (NSLS-II)
Fit method: Edge energy analysis
Phase fractions: (±10%)
| Phase | Fraction |
|---|---|
| metallic Ru (Ru0) | 1.0 |
Fit basis (paper's reference spectra):
- Ru foil
Source evidence: Page 11, text referring to Figure S5
Key reasoning: In the presence of H2 at 400 °C, the initially isolated Ru +4 ions are reduced. The XANES energy shifts to become similar to that of Ru foil, indicating a complete reduction to the metallic state.
Reasoning source: Page 11, Section 3.2 (XAS discussion)
Scoring Rubric (total: 100 pts)
| Q | Type | Max | Question | Reference Answer | Scoring Criteria |
|---|---|---|---|---|---|
| q1 | reasoning | 40 | Under the specified reaction conditions (H2 at 400 °C), what is the dominant Ru phase and oxidation state present in the subnanometric Ru/SPP catalyst, and what drives this transformation? | Under the specified reaction conditions, the dominant phase is metallic Ru with an oxidation state of 0, representing a fraction of 1.0 (100%). This complete transformation is driven by the highly reducing atmosphere of H2 combined with the elevated temperature of 400 °C. Under these specific conditions, the initially isolated Ru +4 ions present in the fresh catalyst undergo complete reduction. Consequently, the subnanometric Ru clusters on the self-pillared pentasil support are fully converted to the metallic state. | Full points for identifying metallic Ru (Ru0) as the dominant phase (fraction 1.0) and explaining that the H2 atmosphere at 400 °C completely reduces the initially isolated Ru +4 ions. |
| q2 | spectral | 30 | What distinguishing spectral feature in the Ru K-edge XANES indicates the formation of this phase under H2 at 400 °C, compared to the fresh catalyst? | The distinguishing spectral feature is a shift in the Ru K-edge energy from the oxidized state (~22.1292 keV) to a lower energy, resulting in an overall spectral shape that matches metallic Ru foil. This spectral shift occurs because the sample is exposed to a reducing atmosphere of H2 at 400 °C. These specific conditions drive the complete reduction of the initially isolated Ru +4 ions down to an oxidation state of 0. As the Ru ions are reduced to the metallic state, the XANES energy shifts to lower values, directly reflecting the formation of metallic subnanometric Ru clusters. | Full points for stating that the XANES edge energy shifts to a lower energy (from the oxidized ~22.1292 keV state) and becomes similar to that of metallic Ru foil. |
| q3 | identification | 30 | To verify the oxidation state of this sample under these reducing conditions, what standard reference spectrum is essential to compare against? | The essential standard reference spectrum required for comparison is Ru foil. This reference is necessary because the sample is treated with H2 at 400 °C, which acts to completely reduce the initially isolated Ru +4 ions to a metallic state (Ru0). By comparing the sample's XANES edge energy to the Ru foil basis, one can confirm that the edge position has shifted to match the lower energy characteristic of zero-valent ruthenium. This comparison directly verifies that the subnanometric Ru clusters on the self-pillared pentasil support have achieved a 1.0 fraction of metallic Ru under these specific reducing conditions. | Full points for identifying Ru foil as the necessary reference spectrum. |
Review
Enhanced catalytic performance of Zr modified CuO/ZnO/Al2O3 catalyst for methanol and DME synthesis via CO2 hydrogenation
APS
Catalyst
Shoujie Ren et al.
DOI: 10.1016/j.jcou.2019.11.013
1 scenario
▶
#416
CuO/ZnO/Al2O3
Cu K
▶
LLM Prompt
Sample Information
Material: CuO/ZnO/Al2O3
Support: ZnO/Al2O3
Sample-Specific Conditions
- catalyst composition: CZA
- CuO/ZnO/Al2O3 catalyst after reduction
Measurement
We plan to measure the Cu K XANES spectrum of this sample.
Questions
Based on all the information above:
1. Based on the sample conditions (CuO/ZnO/Al2O3 reduced at 250 °C for 10 h in pure H2), what is the expected dominant Cu phase, and would you expect any alloying with Zn?
2. What is the physical reasoning for the lack of Cu-Zn alloy formation in this specific sample despite the presence of both metals?
Ground Truth
Material: CuO/ZnO/Al2O3
Measurement: Cu K-edge XAS, 9-BM beamline, Advanced Photon Source
Fit method: EXAFS comparison (no LCF reported)
Phase fractions:
| Phase | Fraction |
|---|---|
| metallic_copper | 1.0 |
Fit basis (paper's reference spectra):
- Cu foil
Source evidence: Section 3.1, Page 12-13; Figure 2a, 2b, 2c
Key reasoning: XRD patterns of the reduced catalyst showed diffraction peaks corresponding to the (111), (200), and (220) planes of metallic copper. EXAFS analysis was performed to check for Cu-Zn alloying, but no significant shift in k-space was observed relative to a Cu foil reference. This indicates that Cu was fully reduced to the metallic state and not alloyed with other metals, which is attributed to the low reduction temperature (250 °C) that cannot result in bulk alloy formation.
Reasoning source: Section 3.1, Page 12-13
Scoring Rubric (total: 100 pts)
| Q | Type | Max | Question | Reference Answer | Scoring Criteria |
|---|---|---|---|---|---|
| q1 | prediction | 50 | Based on the sample conditions (CuO/ZnO/Al2O3 reduced at 250 °C for 10 h in pure H2), what is the expected dominant Cu phase, and would you expect any alloying with Zn? | Based on the sample conditions, the expected dominant phase is 100% metallic copper, and no alloying with Zn is expected. Under the specified reduction conditions, the CuO in the CuO/ZnO/Al2O3 catalyst is fully reduced to the metallic state. The lack of Cu-Zn alloying occurs because the reduction temperature of 250 °C is too low to drive bulk alloy formation between the copper and zinc phases. This is confirmed by EXAFS analysis, which shows no significant shift in k-space relative to a pure Cu foil reference. | Must identify metallic copper as the dominant phase (fraction ~1.0) and state that Cu-Zn alloying is not expected. |
| q2 | reasoning | 50 | What is the physical reasoning for the lack of Cu-Zn alloy formation in this specific sample despite the presence of both metals? | The physical reasoning for the lack of Cu-Zn alloy formation in the reduced CuO/ZnO/Al2O3 catalyst is the relatively low reduction temperature. Although both copper and zinc are present in the CZA composition, the sample was reduced at only 250 °C. This low temperature provides insufficient thermal energy to induce the solid-state diffusion required for bulk alloy formation between the metals. Consequently, the copper fully reduces to a 100% metallic state without incorporating Zn, as evidenced by the absence of k-space shifts in the EXAFS data relative to a Cu foil reference. | Must mention that the reduction temperature (250 °C) is too low to induce bulk alloy formation between Cu and Zn. |
Review
Multicomponent Cu-Mn-Fe silica supported catalysts to stimulate photo-Fenton-like water treatment under sunlight
ESRF-BM23
Catalyst
Andraž Šuligoj et al.
DOI: 10.1016/j.jece.2023.110369
6 scenarios
▶
#417
Cu-Mn-Fe/SiO2
Cu K-edge
▶
LLM Prompt
Sample Information
Material: Cu-Mn-Fe/SiO2
Support: mesoporous silica
Sample-Specific Conditions
- Preparation method: Extraction-calcination
- Trimetallic Cu-Mn-Fe silica supported catalyst prepared by extraction-calcination
Measurement
We plan to measure the Cu K-edge XANES spectrum of this sample.
Questions
Based on all the information above:
1. What candidate reference spectra should be included in the LCF analysis to accurately capture the Cu speciation and particle size effects in this silica-supported catalyst?
2. Based on the extraction-calcination preparation method, what is the dominant Cu phase and its approximate particle size in this catalyst, and what physical mechanism prevents the formation of larger particles?
Ground Truth
Material: Cu-Mn-Fe/SiO2
Measurement: Cu K-edge transmission mode at BM23 beamline, ESRF
Fit method: LCF
Phase fractions:
| Phase | Fraction |
|---|---|
| 2 nm CuO | 1.0 |
Fit basis (paper's reference spectra):
- Crystal CuO
- 10 nm CuO
- 2 nm CuO
Source evidence: Table 3, page 6
Key reasoning: The extraction procedure removes not-well-attached metal species before calcination. This prevents the sintering and formation of larger crystallites that would otherwise occur during high-temperature calcination. Consequently, the Cu species in the CuMnFeMS-ExC sample remain entirely as very small nanoparticles, with the XANES spectrum being identical to the reference for 2 nm diameter CuO nanoparticles.
Reasoning source: Section 3.1, pages 3 and 6
Scoring Rubric (total: 100 pts)
| Q | Type | Max | Question | Reference Answer | Scoring Criteria |
|---|---|---|---|---|---|
| q1 | identification | 43 | What candidate reference spectra should be included in the LCF analysis to accurately capture the Cu speciation and particle size effects in this silica-supported catalyst? | The LCF analysis should include reference spectra for Crystal CuO, 10 nm CuO, and 2 nm CuO. These references are required to accurately capture both the Cu(II) oxidation state and the particle size distribution on the mesoporous silica support. The inclusion of these specific size-dependent references is directly tied to the extraction-calcination preparation method used for this Cu-Mn-Fe/SiO2 catalyst. Specifically, the extraction step removes poorly attached metal species before calcination, which prevents sintering and the formation of larger crystallites. Therefore, the basis set must include very small nanoparticle references (2 nm) alongside larger ones (10 nm and bulk crystal) to properly model the resulting size-restricted copper species. | Full points for mentioning crystalline (bulk) CuO, 10 nm CuO nanoparticles, and 2 nm CuO nanoparticles as necessary references to capture size-dependent spectral variations. |
| q2 | reasoning | 57 | Based on the extraction-calcination preparation method, what is the dominant Cu phase and its approximate particle size in this catalyst, and what physical mechanism prevents the formation of larger particles? | The dominant Cu phase in this Cu-Mn-Fe/SiO2 catalyst is CuO, which exists entirely as very small nanoparticles with an approximate size of 2 nm (100% fraction). This specific size restriction is a direct result of the extraction-calcination preparation method. During this procedure, the extraction step removes metal species that are not well-attached to the mesoporous silica support prior to calcination. By eliminating these mobile species, the mechanism prevents the sintering and formation of larger crystallites that would otherwise occur during high-temperature calcination. Consequently, the copper species remain exclusively as 2 nm nanoparticles, yielding a XANES spectrum identical to the 2 nm CuO reference. | Full points for identifying 2 nm CuO (or very small CuO nanoparticles, ~100%) and explaining that the extraction step removes loosely attached species, preventing sintering and the formation of larger crystallites during the subsequent calcination step. |
Review
#418
Cu-Mn-Fe/SiO2
Cu K-edge
▶
LLM Prompt
Sample Information
Material: Cu-Mn-Fe/SiO2
Support: mesoporous silica
Sample-Specific Conditions
- Preparation method: Calcination
- Trimetallic Cu-Mn-Fe silica supported catalyst prepared by direct calcination
Measurement
We plan to measure the Cu K-edge XANES spectrum of this sample.
Questions
Based on all the information above:
1. What candidate reference spectra should be included in the basis set to perform a Linear Combination Fit (LCF) of the Cu K-edge XANES for this calcined Cu-Mn-Fe/SiO2 catalyst?
2. Estimate the phase fractions of the Cu species present in this catalyst after direct calcination at 450 °C.
3. Explain physically why these specific Cu phases and particle sizes are formed in this sample, specifically considering the effect of the direct calcination treatment.
Ground Truth
Material: Cu-Mn-Fe/SiO2 (CuMnFeMS-C)
Measurement: Cu K-edge XAS in transmission mode at BM23 beamline (ESRF)
Fit method: Linear combination fit (LCF)
Phase fractions: (±1%)
| Phase | Fraction |
|---|---|
| Crystal CuO | 0.48 |
| 10 nm CuO | 0.52 |
Fit basis (paper's reference spectra):
- Crystal CuO
- 10 nm CuO
- 2 nm CuO
Source evidence: Table 3 and Section 3.1, Page 6
Key reasoning: The LCF analysis of the Cu K-edge XANES spectrum shows that all Cu cations are in the divalent form. The spectrum of the calcined catalyst (CuMnFeMS-C) is completely described by a mixture of 10 nm CuO nanoparticles (52%) and crystalline/bulk CuO (48%). The presence of these larger CuO particles, as opposed to the very small 2 nm clusters seen in extracted samples, is attributed to the sintering of not-well-attached metal species during the high-temperature calcination at 450 °C.
Reasoning source: Section 3.1, Pages 3 and 6
Scoring Rubric (total: 100 pts)
| Q | Type | Max | Question | Reference Answer | Scoring Criteria |
|---|---|---|---|---|---|
| q1 | identification | 20 | What candidate reference spectra should be included in the basis set to perform a Linear Combination Fit (LCF) of the Cu K-edge XANES for this calcined Cu-Mn-Fe/SiO2 catalyst? | The basis set for the Linear Combination Fit (LCF) of the Cu K-edge XANES spectrum should include Crystal CuO, 10 nm CuO, and 2 nm CuO reference spectra. These specific references are required because the direct calcination of the Cu-Mn-Fe/SiO2 catalyst results exclusively in divalent Cu cations (CuO). The inclusion of various size references is necessary to capture the structural effects of the preparation method. Specifically, the high-temperature calcination at 450 °C causes not-well-attached metal species on the mesoporous silica to sinter, meaning the fit must account for the potential presence of both small clusters and larger aggregated phases. | Full credit for identifying crystalline/bulk CuO and nanoscale CuO (e.g., 10 nm and 2 nm CuO) as the necessary reference spectra. |
| q2 | quantification | 40 | Estimate the phase fractions of the Cu species present in this catalyst after direct calcination at 450 °C. | The Cu species in the calcined Cu-Mn-Fe/SiO2 catalyst consist of 52% 10 nm CuO nanoparticles and 48% crystalline (bulk) CuO, with an uncertainty of 1%. These specific values indicate that no ultra-small (2 nm) CuO clusters remain in the material. This phase distribution results directly from the direct calcination treatment at 450 °C, which fully oxidizes the copper into divalent cations. Because the metal species are not well-attached to the mesoporous silica support, the high temperature induces significant sintering. Consequently, the copper aggregates entirely into the larger 10 nm nanoparticles and bulk crystalline CuO phases observed in these fractions. | Full credit for estimating approximately 48% crystalline/bulk CuO and 52% 10 nm CuO nanoparticles (allow ±5% tolerance). |
| q3 | reasoning | 40 | Explain physically why these specific Cu phases and particle sizes are formed in this sample, specifically considering the effect of the direct calcination treatment. | The formation of these specific Cu phases and particle sizes is a direct consequence of the thermal treatment applied to the Cu-Mn-Fe/SiO2 catalyst. During direct calcination at 450 °C, the copper is completely oxidized into divalent Cu cations, forming CuO. However, because the metal species are not well-attached to the mesoporous silica support, they are highly susceptible to mobility under high temperatures. The thermal energy drives a sintering mechanism where smaller copper species aggregate together. As an outcome, very small 2 nm clusters cannot be stabilized, and the copper instead forms a mixture of larger 10 nm CuO nanoparticles and bulk crystalline CuO. | Full credit for explaining that the high-temperature calcination (450 °C) causes sintering of the metal species, leading to the formation of larger CuO crystallites (a mix of 10 nm nanoparticles and bulk crystalline CuO) rather than highly dispersed or ultra-small clusters. |
Review
#419
Cu-Mn-Fe/SiO2
Mn K-edge
▶
LLM Prompt
Sample Information
Material: Cu-Mn-Fe/SiO2
Support: mesoporous silica
Sample-Specific Conditions
- Preparation method: Extraction-calcination
- Trimetallic Cu-Mn-Fe silica supported catalyst prepared by extraction-calcination
Measurement
We plan to measure the Mn K-edge XANES spectrum of this sample.
Questions
Based on all the information above:
1. Based on the material composition and the use of a mesoporous silica support, what are the most appropriate candidate reference spectra needed to perform a Linear Combination Fit (LCF) of the Mn K-edge XANES data for this catalyst?
2. Estimate the relative phase fractions of the Mn species in this extraction-calcination prepared catalyst.
Ground Truth
Material: Cu-Mn-Fe/SiO2
Measurement: Mn K-edge transmission mode at BM23 beamline (ESRF)
Fit method: LCF
Phase fractions: (±1%)
| Phase | Fraction |
|---|---|
| 01MnKIL | 0.92 |
| Mn2O3 | 0.08 |
Fit basis (paper's reference spectra):
- 01MnKIL (Mn incorporated into mesoporous silica framework, containing Mn2+ and Mn3+)
- Mn2O3
Source evidence: Table 3, Page 6; Section 3.1, Page 7
Key reasoning: The LCF analysis indicates that a large majority of Mn cations (92%) are incorporated into the mesoporous silica framework, represented by the 01MnKIL reference (which contains Mn2+ and Mn3+ in a 30%/70% ratio). This high degree of incorporation is consistent with EDXS studies showing homogeneous Mn distribution and XRD results where no diffraction peaks of crystalline Mn-oxides were detected. The remaining 8% is attributed to Mn2O3, resulting in an average oxidation state between 2+ and 3+.
Reasoning source: Section 3.1, Page 7
Scoring Rubric (total: 100 pts)
| Q | Type | Max | Question | Reference Answer | Scoring Criteria |
|---|---|---|---|---|---|
| q1 | identification | 50 | Based on the material composition and the use of a mesoporous silica support, what are the most appropriate candidate reference spectra needed to perform a Linear Combination Fit (LCF) of the Mn K-edge XANES data for this catalyst? | The most appropriate reference spectra for the LCF analysis of this Cu-Mn-Fe/SiO2 catalyst are 01MnKIL (representing Mn incorporated into the mesoporous silica framework, containing Mn2+ and Mn3+) and Mn2O3. These specific phases are expected because the extraction-calcination preparation method on a mesoporous silica support promotes a high degree of metal incorporation into the support framework. This structural integration is supported by EDXS studies showing homogeneous Mn distribution and XRD results lacking crystalline Mn-oxide peaks. Consequently, the majority of the manganese exists as framework-incorporated Mn2+ and Mn3+ species, with only a minor fraction forming segregated Mn2O3. | Award full points for identifying a reference corresponding to Mn incorporated into the silica framework (e.g., silicate-bound Mn2+/Mn3+) and a minor crystalline manganese oxide phase such as Mn2O3. |
| q2 | quantification | 50 | Estimate the relative phase fractions of the Mn species in this extraction-calcination prepared catalyst. | The relative phase fractions for this catalyst are 92% 01MnKIL (Mn incorporated into the mesoporous silica framework) and 8% Mn2O3, with an uncertainty of 1%. These specific values result from the extraction-calcination preparation method, which highly favors the homogeneous dispersion and incorporation of Mn cations into the mesoporous silica support rather than the formation of large bulk oxides. Because of this high degree of incorporation, XRD detects no crystalline Mn-oxides and EDXS shows a homogeneous distribution, explaining the dominant 92% framework fraction. The minor 8% fraction of Mn2O3 accounts for the small amount of segregated oxide, ultimately yielding an average Mn oxidation state between 2+ and 3+. | Award full points for estimating that the vast majority (~90-95%) of Mn is incorporated into the silica framework, with a small minority (~5-10%) present as a manganese oxide phase like Mn2O3. |
Review
#420
Cu-Mn-Fe/SiO2
Mn K-edge
▶
LLM Prompt
Sample Information
Material: Cu-Mn-Fe/SiO2
Support: mesoporous silica
Sample-Specific Conditions
- Preparation method: Calcination
- Trimetallic Cu-Mn-Fe silica supported catalyst prepared by direct calcination
Measurement
We plan to measure the Mn K-edge XANES spectrum of this sample.
Questions
Based on all the information above:
1. What reference spectra are appropriate to use as basis functions for the Linear Combination Fit (LCF) of the Mn K-edge XANES spectrum for this calcined Cu-Mn-Fe/SiO2 catalyst?
2. Estimate the relative phase fractions of the Mn species in this calcined catalyst.
3. Explain the physical reasoning for why the majority of Mn is found in this specific state rather than as bulk crystalline oxides, and how this relates to the structural properties of the catalyst.
Ground Truth
Material: Cu-Mn-Fe/SiO2
Measurement: Mn K-edge XANES, transmission mode, BM23 beamline at ESRF
Fit method: Linear combination fit (LCF)
Phase fractions: (±1%)
| Phase | Fraction |
|---|---|
| 01MnKIL | 0.8 |
| Mn2O3 | 0.2 |
Fit basis (paper's reference spectra):
- 01MnKIL (Mn incorporated into mesoporous silica framework)
- Mn2O3
Source evidence: Table 3, page 6 and Section 3.1, page 7
Key reasoning: The LCF analysis of the Mn K-edge XANES spectrum shows that the average oxidation state of Mn is between 2+ and 3+. The high relative ratio of the reference compound 01MnKIL (80%) indicates that the large majority of Mn cations are incorporated into the silicate framework. The remaining 20% is attributed to Mn2O3. This is consistent with the direct synthesis method and agrees with XRD results where no diffraction peaks of crystalline Mn-oxides were detected.
Reasoning source: Section 3.1, page 7
Scoring Rubric (total: 100 pts)
| Q | Type | Max | Question | Reference Answer | Scoring Criteria |
|---|---|---|---|---|---|
| q1 | identification | 30 | What reference spectra are appropriate to use as basis functions for the Linear Combination Fit (LCF) of the Mn K-edge XANES spectrum for this calcined Cu-Mn-Fe/SiO2 catalyst? | The appropriate reference spectra for the LCF are 01MnKIL (representing Mn incorporated into the mesoporous silica framework) and Mn2O3. These specific phases are expected because the direct calcination preparation method of the trimetallic Cu-Mn-Fe silica-supported catalyst promotes the incorporation of the large majority of Mn cations directly into the silicate framework. The remaining Mn forms a minor Mn2O3 phase, which explains why the average Mn oxidation state falls between 2+ and 3+ and why no crystalline Mn-oxide diffraction peaks are detected in XRD. | Full points for identifying a reference for Mn incorporated into the silica framework (e.g., 01MnKIL) and a crystalline Mn2O3 reference. |
| q2 | quantification | 30 | Estimate the relative phase fractions of the Mn species in this calcined catalyst. | The relative phase fractions for this catalyst are 80% 01MnKIL (Mn incorporated into the mesoporous silica framework) and 20% Mn2O3, with an uncertainty of 1%. These specific values result from the direct calcination synthesis method on the mesoporous silica support, which highly favors the structural integration of Mn cations into the silicate framework (80%) over the formation of bulk oxides. The minor 20% fraction of Mn2O3 accounts for the remaining Mn, yielding an average oxidation state between 2+ and 3+ and agreeing with XRD results that show no detectable crystalline Mn-oxide peaks. | Full points for estimating ~80% framework-incorporated Mn and ~20% Mn2O3. Deduct points proportionally for deviations greater than 10%. |
| q3 | reasoning | 40 | Explain the physical reasoning for why the majority of Mn is found in this specific state rather than as bulk crystalline oxides, and how this relates to the structural properties of the catalyst. | The majority of Mn (80%) is found incorporated into the mesoporous silica framework (01MnKIL) rather than as bulk crystalline oxides due to the direct calcination preparation method. During this direct synthesis of the Cu-Mn-Fe/SiO2 catalyst, the Mn cations integrate directly into the mesoporous silica support rather than agglomerating into large, separate oxide particles. As a result, only a minor fraction (20%) forms Mn2O3, yielding an average oxidation state between 2+ and 3+, which perfectly aligns with the structural properties observed in XRD where no diffraction peaks for crystalline Mn-oxides are detected. | Full points for explaining that the direct synthesis method leads to the majority of Mn cations being incorporated into the mesoporous silica framework (average oxidation state between 2+ and 3+), which is supported by the lack of crystalline Mn-oxide peaks in XRD. |
Review
#421
Cu-Mn-Fe/SiO2
Fe K-edge
▶
LLM Prompt
Sample Information
Material: Cu-Mn-Fe/SiO2
Support: mesoporous silica
Sample-Specific Conditions
- Preparation method: Extraction-calcination
- Trimetallic Cu-Mn-Fe silica supported catalyst prepared by extraction-calcination
Measurement
We plan to measure the Fe K-edge XANES spectrum of this sample.
Questions
Based on all the information above:
1. What reference spectra should be considered as basis functions for the Linear Combination Fitting (LCF) of the Fe K-edge XANES spectrum for this silica-supported Cu-Mn-Fe catalyst?
2. Estimate the relative phase fractions of the iron species in the CuMnFeMS-ExC catalyst prepared by extraction-calcination.
Ground Truth
Material: Cu-Mn-Fe/SiO2
Measurement: Fe K-edge transmission mode at BM23 beamline, ESRF
Fit method: LCF
Phase fractions: (±2%)
| Phase | Fraction |
|---|---|
| gamma-Fe2O3 | 0.72 |
| FePO4 | 0.28 |
Fit basis (paper's reference spectra):
- Fe3O4 (magnetite)
- gamma-Fe2O3 (maghemite)
- FePO4
Source evidence: Table 3 and Section 3.1, page 7
Key reasoning: The Fe K-edge energy position indicates that the majority of Fe cations are in the Fe3+ valence state. A pre-edge resonance at 7114 eV in the XANES spectra shows that tetrahedrally coordinated Fe cations are present in the catalysts. To completely describe the XANES profiles, gamma-Fe2O3 (containing Fe3+ at octahedral and tetrahedral sites) and FePO4 (used as a reference for tetrahedrally coordinated Fe3+ cations) were required. Unlike the calcined-only sample, the extraction-calcination procedure resulted in no detectable Fe3O4 (magnetite) in this sample.
Reasoning source: Section 3.1, page 7
Scoring Rubric (total: 100 pts)
| Q | Type | Max | Question | Reference Answer | Scoring Criteria |
|---|---|---|---|---|---|
| q1 | identification | 43 | What reference spectra should be considered as basis functions for the Linear Combination Fitting (LCF) of the Fe K-edge XANES spectrum for this silica-supported Cu-Mn-Fe catalyst? | The reference spectra that should be considered as basis functions for the LCF are Fe3O4 (magnetite), gamma-Fe2O3 (maghemite), and FePO4. These specific references are chosen because the Fe K-edge energy position indicates that the majority of Fe cations in the Cu-Mn-Fe/SiO2 catalyst are in the Fe3+ valence state. Additionally, a pre-edge resonance at 7114 eV reveals the presence of tetrahedrally coordinated Fe cations. Consequently, gamma-Fe2O3 (containing Fe3+ at both octahedral and tetrahedral sites) and FePO4 (used as a reference for tetrahedrally coordinated Fe3+) are required to completely describe the XANES profiles. Fe3O4 is included in the basis set to check for mixed-valence iron, though the extraction-calcination preparation method ultimately prevents its formation in this specific sample. | Full credit for identifying maghemite (gamma-Fe2O3), a tetrahedral Fe3+ reference (such as FePO4), and magnetite (Fe3O4) as the candidate basis set. |
| q2 | quantification | 57 | Estimate the relative phase fractions of the iron species in the CuMnFeMS-ExC catalyst prepared by extraction-calcination. | The relative phase fractions for the iron species in this catalyst are estimated to be 0.72 (72%) gamma-Fe2O3 and 0.28 (28%) FePO4, with an uncertainty of 2%. These specific values result from the extraction-calcination preparation method, which fully oxidizes the iron and leaves no detectable Fe3O4 (magnetite) in the sample, unlike calcined-only preparation methods. The Fe K-edge energy position confirms that the iron is predominantly in the Fe3+ state. The 28% FePO4 fraction is required as a reference to fit the pre-edge resonance at 7114 eV, representing the tetrahedrally coordinated Fe3+ cations present in the mesoporous silica-supported material. The remaining 72% is captured by gamma-Fe2O3, which accounts for the rest of the Fe3+ cations located at both octahedral and tetrahedral sites. | Full credit for estimating ~72% gamma-Fe2O3 and ~28% FePO4 (or tetrahedral Fe3+ equivalent), with 0% Fe3O4. Partial credit for identifying that Fe3+ phases dominate completely over Fe2+/Fe3+ mixed phases like magnetite. |
Review
#422
Cu-Mn-Fe/SiO2
Fe K-edge
▶
LLM Prompt
Sample Information
Material: Cu-Mn-Fe/SiO2
Support: mesoporous silica
Sample-Specific Conditions
- Preparation method: Calcination
- Trimetallic Cu-Mn-Fe silica supported catalyst prepared by direct calcination
Measurement
We plan to measure the Fe K-edge XANES spectrum of this sample.
Questions
Based on all the information above:
1. Based on the synthesis method involving the incorporation of magnetic iron oxide nanoparticles into mesoporous silica followed by direct calcination at 450 °C in air, what reference spectra should be included in a Linear Combination Fit (LCF) of the Fe K-edge XANES spectrum to accurately model the iron speciation?
2. Estimate the relative fractions of the iron phases in this calcined Cu-Mn-Fe/SiO2 catalyst. Provide specific percentages for each identified phase.
3. Explain the physical and chemical reasoning for the expected iron phase composition in this sample, specifically addressing the expected oxidation state, coordination environment, and the effect of the calcination treatment.
Ground Truth
Material: Cu-Mn-Fe/SiO2
Measurement: Fe K-edge transmission mode at ESRF BM23 beamline
Fit method: Linear Combination Fit (LCF)
Phase fractions: (±8%)
| Phase | Fraction |
|---|---|
| Fe3O4 | 0.06 |
| gamma-Fe2O3 | 0.56 |
| FePO4 | 0.38 |
Fit basis (paper's reference spectra):
- Fe3O4 (magnetite)
- gamma-Fe2O3 (maghemite)
- FePO4
Source evidence: Table 3 and Section 3.1, page 7
Key reasoning: The Fe K-edge energy position indicates that the majority of Fe cations are in the Fe3+ valence state, consistent with the oxidative calcination treatment at 450 °C in air. A pre-edge resonance at 7114 eV shows the presence of tetrahedrally coordinated Fe cations, which is modeled using FePO4 as a reference. The remaining iron is present as magnetic iron oxide nanoparticles, predominantly maghemite (gamma-Fe2O3) with a small residual amount of magnetite (Fe3O4).
Reasoning source: Section 3.1, page 7
Scoring Rubric (total: 100 pts)
| Q | Type | Max | Question | Reference Answer | Scoring Criteria |
|---|---|---|---|---|---|
| q1 | identification | 30 | Based on the synthesis method involving the incorporation of magnetic iron oxide nanoparticles into mesoporous silica followed by direct calcination at 450 °C in air, what reference spectra should be included in a Linear Combination Fit (LCF) of the Fe K-edge XANES spectrum to accurately model the iron speciation? | The Linear Combination Fit (LCF) of the Fe K-edge XANES spectrum should include Fe3O4 (magnetite), gamma-Fe2O3 (maghemite), and FePO4 as reference spectra. These specific phases are expected because the oxidative calcination treatment at 450 °C in air drives the majority of Fe cations into the Fe3+ valence state, forming predominantly maghemite with a small residual amount of magnetite. Additionally, the FePO4 reference is required to model the presence of tetrahedrally coordinated Fe cations, which are evidenced by a pre-edge resonance at 7114 eV. | Award 10 points for identifying maghemite (γ-Fe2O3), 10 points for identifying magnetite (Fe3O4), and 10 points for identifying a reference representing tetrahedrally coordinated Fe3+ (such as FePO4 or isolated framework Fe). |
| q2 | quantification | 40 | Estimate the relative fractions of the iron phases in this calcined Cu-Mn-Fe/SiO2 catalyst. Provide specific percentages for each identified phase. | The relative fractions of the iron phases in the calcined Cu-Mn-Fe/SiO2 catalyst are 56% gamma-Fe2O3 (maghemite), 38% FePO4, and 6% Fe3O4 (magnetite), with an uncertainty of 8%. These specific values result from the oxidative calcination treatment at 450 °C in air, which oxidizes the magnetic iron oxide nanoparticles predominantly into the Fe3+ state, yielding the large gamma-Fe2O3 fraction. The 38% fraction modeled by FePO4 accounts for a significant portion of tetrahedrally coordinated Fe cations present in the sample. Finally, the minor 6% fraction of Fe3O4 represents the small residual amount of magnetite that remained unoxidized after the calcination process. | Award 15 points for estimating maghemite as the dominant phase (50-60%), 15 points for estimating a significant fraction of tetrahedrally coordinated Fe3+ (30-45%), and 10 points for estimating a minor fraction of magnetite (<10%). |
| q3 | reasoning | 30 | Explain the physical and chemical reasoning for the expected iron phase composition in this sample, specifically addressing the expected oxidation state, coordination environment, and the effect of the calcination treatment. | The expected iron phase composition is driven by the direct oxidative calcination treatment at 450 °C in air applied to the Cu-Mn-Fe/SiO2 catalyst. This thermal treatment causes the Fe K-edge energy position to shift, indicating that the majority of Fe cations are oxidized to the Fe3+ valence state. Consequently, the magnetic iron oxide nanoparticles are predominantly converted to maghemite (gamma-Fe2O3), leaving only a small residual amount of magnetite (Fe3O4). Furthermore, a pre-edge resonance at 7114 eV reveals the presence of tetrahedrally coordinated Fe cations within the sample, which is structurally modeled using the FePO4 reference phase. | Award 10 points for explaining that calcination in air at 450 °C promotes the oxidation of iron to the Fe3+ state (forming maghemite from initial magnetite). Award 10 points for noting the presence of tetrahedrally coordinated Fe3+ species (which would be evidenced by a distinct pre-edge feature). Award 10 points for explaining that magnetite remains only as a minor residual phase due to the oxidative conditions. |
Review
Dual-shell silicate and alumina coating for long lasting and high capacity lithium ion batteries
APS
Electrochemistry
Marcos Lucero et al.
DOI: 10.1016/j.jechem.2021.11.014
5 scenarios
▶
#423
LiCoO2
Co K-edge
▶
LLM Prompt
Sample Information
Material: LiCoO2
Electrode Type: cathode
Electrolyte: 1 M LiPF6 in EC:DEC (1:1)
Cell Type: coin cell
Charge Discharge: OCV
Sample-Specific Conditions
- Coating: None
- Uncycled bare LiCoO2 cathode
Measurement
We plan to measure the Co K-edge XANES spectrum of this sample.
Questions
Based on all the information above:
1. Based on the sample conditions (pristine, uncycled LiCoO2), what is the expected oxidation state of Cobalt, and how does its XANES edge position compare to a bare LCO sample that has been cycled at high voltages?
2. Describe the expected distinguishing spectral features of the Co K-edge XANES for this pristine sample compared to a sample that has undergone severe high-voltage cycling without a protective coating.
3. Why is the structural and electronic state of this specific pristine sample critical for evaluating the performance of the various coating strategies (e.g., Al2O3, LSSO, dual coating) discussed in the study?
Ground Truth
Material: LiCoO2
Measurement: Co K-edge hXAS, fluorescence mode, beamline 9BM of the Advanced Photon Source (APS)
Fit method: Integral method (for oxidation state determination)
Phase fractions:
| Phase | Fraction |
|---|---|
| LiCoO2 | 1.0 |
Fit basis (paper's reference spectra):
- Co metal reference (for energy calibration)
- Co3O4 reference
Source evidence: Figure 4(a) and Section 3.3 (page 11)
Key reasoning: The pristine bare LCO sample represents the starting cathode material before any electrochemical cycling. It retains its original layered structure and Co3+ oxidation state. This pristine state serves as the baseline for evaluating structural and chemical degradation (such as Co oxidation to +4) that occurs during high-voltage cycling in uncoated or poorly coated samples.
Reasoning source: Section 3.3, page 11
Scoring Rubric (total: 100 pts)
| Q | Type | Max | Question | Reference Answer | Scoring Criteria |
|---|---|---|---|---|---|
| q1 | identification | 30 | Based on the sample conditions (pristine, uncycled LiCoO2), what is the expected oxidation state of Cobalt, and how does its XANES edge position compare to a bare LCO sample that has been cycled at high voltages? | The expected oxidation state of Cobalt in this sample is +3. The XANES edge position for this pristine sample is approximately 1 eV lower in energy compared to a bare LCO sample that has been cycled. This occurs because the sample is an uncycled, bare LiCoO2 cathode held at open circuit voltage (OCV), meaning it retains its original layered structure and baseline Co3+ state before any electrochemical cycling. In contrast, cycled bare LCO undergoes structural and chemical degradation during high-voltage cycling, specifically the oxidation of Co from +3 to +4, which shifts the edge position to higher energies. | Full points if the answer correctly identifies the Co oxidation state as +3 and states that the pristine edge position is at a lower energy (by ~1 eV) compared to the cycled bare LCO. |
| q2 | spectral | 40 | Describe the expected distinguishing spectral features of the Co K-edge XANES for this pristine sample compared to a sample that has undergone severe high-voltage cycling without a protective coating. | The Co K-edge XANES spectrum for this pristine sample exhibits a sharp absorption edge characteristic of Co3+ in a layered LiCoO2 structure. Its distinguishing feature is an edge position at a lower energy compared to cycled bare LCO, lacking the ~1 eV higher-energy shift that aligns with a Co3O4 reference. These spectral features arise directly from the sample conditions, as the uncycled, uncoated cathode at OCV has not yet been subjected to electrochemical cycling. Consequently, it has not experienced the chemical degradation and oxidation of Co from +3 to +4 that produces the higher-energy shift seen in degraded, uncoated samples. | Full points if the answer explains that the pristine sample lacks the ~1 eV shift to higher energies seen in the cycled bare sample (which indicates oxidation to +4 and aligns with Co3O4). |
| q3 | reasoning | 30 | Why is the structural and electronic state of this specific pristine sample critical for evaluating the performance of the various coating strategies (e.g., Al2O3, LSSO, dual coating) discussed in the study? | The structural and electronic state of this pristine sample is critical because it serves as the fundamental baseline for evaluating structural and chemical degradation. Since the sample is an uncycled, bare LiCoO2 cathode at OCV, it perfectly represents the starting material with its original layered structure and pure Co3+ oxidation state. By establishing this baseline, any deviations—such as the oxidation of Co to +4 that occurs during high-voltage cycling in uncoated or poorly coated samples—can be accurately measured. Therefore, the effectiveness of various coating strategies can be directly evaluated by how well they prevent the XANES edge from shifting away from this pristine Co3+ state. | Full points if the answer explains that the pristine sample serves as the baseline (+3 state, layered structure) to determine whether a coating successfully prevented irreversible chemical degradation (like Co oxidation) during cycling. |
Review
#424
LiCoO2
Co K-edge
▶
LLM Prompt
Sample Information
Material: LiCoO2
Electrode Type: cathode
Electrolyte: 1 M LiPF6 in EC:DEC (1:1)
Cell Type: coin cell
Charge Discharge: discharged
C Rate: 0.5C
Voltage V: 3.0-4.5
Cycle Number: 50
Sample-Specific Conditions
- Coating: None
- Bare LiCoO2 cathode after 50 cycles
Measurement
We plan to measure the Co K-edge XANES spectrum of this sample.
Questions
Based on all the information above:
1. Based on the cycling conditions (bare LiCoO2 cycled 50 times to 4.5 V), what phase dominates the sample, and what reference spectrum would be needed to model its Co K-edge XANES?
2. Explain the physical reasoning for why the bare LiCoO2 cathode transforms into this phase after 50 cycles, compared to a coated sample.
3. Describe the expected spectral features of the cycled bare LiCoO2 sample at the Co K-edge, specifically its edge position relative to pristine LiCoO2 and its overall spectral shape as reported in the study.
Ground Truth
Material: LiCoO2 (cycled bare)
Measurement: Co K-edge hXAS, fluorescence mode, beamline 9BM at Advanced Photon Source (APS)
Fit method: Qualitative comparison and integral method for oxidation state
Fit basis (paper's reference spectra):
- Co3O4 reference
- pristine LiCoO2
Source evidence: Page 11, Section 3.3, Figure 4a
Key reasoning: The cycled bare LCO undergoes irreversible changes due to high voltage cycling up to 4.5 V. Without a protective coating, the cathode is exposed to direct contact with the electrolyte, leading to structural degradation. This is evidenced by the XANES spectrum aligning with the Co3O4 reference, indicating a phase transformation.
Reasoning source: Page 11, Section 3.3 and Page 14, Section 4
Scoring Rubric (total: 100 pts)
| Q | Type | Max | Question | Reference Answer | Scoring Criteria |
|---|---|---|---|---|---|
| q1 | identification | 30 | Based on the cycling conditions (bare LiCoO2 cycled 50 times to 4.5 V), what phase dominates the sample, and what reference spectrum would be needed to model its Co K-edge XANES? | The dominant phase in the cycled bare LiCoO2 sample is Co3O4, and a Co3O4 reference spectrum alongside pristine LiCoO2 would be needed to model its Co K-edge XANES. This phase transformation occurs because the bare LiCoO2 cathode is subjected to high-voltage cycling up to 4.5 V for 50 cycles without any protective coating. The lack of a coating allows direct contact between the cathode and the liquid electrolyte, which drives severe structural degradation and irreversible changes. Consequently, the unprotected material degrades from its pristine state into a Co3O4-like phase. | Full points for identifying Co3O4 as the dominant phase and necessary reference spectrum. |
| q2 | reasoning | 40 | Explain the physical reasoning for why the bare LiCoO2 cathode transforms into this phase after 50 cycles, compared to a coated sample. | The bare LiCoO2 cathode transforms into a Co3O4 phase due to irreversible structural degradation caused by high-voltage cycling up to 4.5 V. Because the sample lacks a protective coating, the active material remains in direct contact with the 1 M LiPF6 electrolyte throughout the 50 charge-discharge cycles. This unprotected exposure at high potentials triggers severe interfacial reactions and structural breakdown. In contrast, an optimally coated sample would be shielded from this direct electrolyte contact, preventing the degradation and allowing the material to maintain its pristine LiCoO2 structure. | Full points for explaining that high voltage cycling (4.5 V) without a protective coating leads to direct electrolyte contact, causing irreversible structural degradation and phase transformation. |
| q3 | spectral | 30 | Describe the expected spectral features of the cycled bare LiCoO2 sample at the Co K-edge, specifically its edge position relative to pristine LiCoO2 and its overall spectral shape as reported in the study. | The Co K-edge XANES spectrum of the cycled bare LiCoO2 sample exhibits an edge shift of approximately 1 eV to higher energies compared to pristine LiCoO2, and its overall spectral shape aligns closely with the Co3O4 reference spectrum. These spectral features arise because the bare cathode undergoes irreversible structural degradation due to direct contact with the electrolyte during the 50 cycles at a high voltage of 4.5 V. This unprotected exposure drives a phase transformation from pristine LiCoO2 to Co3O4. Consequently, the structural breakdown and resulting phase change dictate the observed ~1 eV edge shift and the alignment with the Co3O4 spectral shape. | Full points for stating the spectrum aligns with the Co3O4 reference and mentioning the ~1 eV edge shift compared to pristine LCO. |
Review
#425
LiCoO2
O K-edge
▶
LLM Prompt
Sample Information
Material: LiCoO2
Electrode Type: cathode
Electrolyte: 1 M LiPF6 in EC:DEC (1:1)
Cell Type: coin cell
Charge Discharge: discharged
C Rate: 0.5C
Voltage V: 3.0-4.5
Cycle Number: 50
Sample-Specific Conditions
- Coating: None
- Surface CEI of bare LiCoO2 cathode after 50 cycles
Measurement
We plan to measure the O K-edge XANES spectrum of this sample.
Questions
Based on all the information above:
1. What candidate reference spectra are needed to identify the components of the cathode-electrolyte interphase (CEI) formed on the surface of the bare LiCoO2 cathode after 50 cycles?
2. Explain the physical reasoning behind the formation of these specific CEI phases on the uncoated LiCoO2 cathode and discuss how this composition affects the stability and performance of the battery.
Ground Truth
Material: LiCoO2
Measurement: O K-edge soft XAS (sXAS) in electron yield (EY) mode at ALS beamline 6.3.1 and NSLS II beamline 7-ID-1
Fit method: Qualitative spectral comparison
Fit basis (paper's reference spectra):
- Li2CO3
- Li2O
Source evidence: Page 14, Section 4 (Discussions) and Figure 5(b)
Key reasoning: During high-voltage cycling (up to 4.5 V), the bare LiCoO2 cathode undergoes surface degradation and reacts with the electrolyte to form a cathode-electrolyte interphase (CEI). In the uncoated sample, this CEI is composed of both Li2O and Li2CO3. The presence of Li2O indicates an unstable interphase, which fails to protect the cathode and leads to degrading electrochemical performance, unlike the stable Li2CO3-rich CEI formed on Al2O3-coated samples.
Reasoning source: Page 14, Section 4 (Discussions)
Scoring Rubric (total: 100 pts)
| Q | Type | Max | Question | Reference Answer | Scoring Criteria |
|---|---|---|---|---|---|
| q1 | identification | 29 | What candidate reference spectra are needed to identify the components of the cathode-electrolyte interphase (CEI) formed on the surface of the bare LiCoO2 cathode after 50 cycles? | To identify the components of the cathode-electrolyte interphase (CEI) formed on the bare LiCoO2 cathode after 50 cycles, reference spectra for Li2CO3 and Li2O are required. These specific phases are expected because the uncoated LiCoO2 surface reacts directly with the EC:DEC electrolyte during high-voltage cycling up to 4.5 V. This continuous surface degradation over 50 cycles results in a mixed CEI layer containing both Li2CO3 and Li2O. The emergence of Li2O specifically reflects the lack of a protective coating, indicating an unstable interphase that fails to protect the cathode from ongoing degradation. | Full points if the answer identifies Li2O and Li2CO3 as the necessary reference spectra for the CEI. |
| q3 | reasoning | 71 | Explain the physical reasoning behind the formation of these specific CEI phases on the uncoated LiCoO2 cathode and discuss how this composition affects the stability and performance of the battery. | During 50 cycles of high-voltage operation between 3.0 and 4.5 V, the bare LiCoO2 cathode undergoes severe surface degradation due to direct reactions with the liquid electrolyte. Because the sample lacks a protective coating, these parasitic reactions form a cathode-electrolyte interphase (CEI) composed of both Li2CO3 and Li2O. The presence of Li2O in this mixture is a direct indicator of an unstable interphase that cannot effectively passivate the cathode surface. As a result, this unstable CEI fails to protect the cathode from further electrolyte attack, leading to continuously degrading electrochemical performance over the cycling period. | Full points if the answer explains that high-voltage cycling causes electrolyte reaction/degradation on the bare surface, forming a mixed Li2O/Li2CO3 CEI, and explicitly notes that the presence of Li2O results in an unstable interphase that leads to degrading cell performance. |
Review
#426
0.5 wt% Li2SrSiO4 coated LiCoO2
O K-edge
▶
LLM Prompt
Sample Information
Material: 0.5 wt% Li2SrSiO4 coated LiCoO2
Electrode Type: cathode
Electrolyte: 1 M LiPF6 in EC:DEC (1:1)
Cell Type: coin cell
Charge Discharge: discharged
C Rate: 0.5C
Voltage V: 3.0-4.5
Cycle Number: 50
Sample-Specific Conditions
- Coating: 0.5 wt% Li2SrSiO4
- Surface CEI of 0.5 wt% Li2SrSiO4 coated LiCoO2 cathode after 50 cycles
Measurement
We plan to measure the O K-edge XANES spectrum of this sample.
Questions
Based on all the information above:
1. Based on the sample conditions, what is the primary composition of the cathode-electrolyte interphase (CEI) formed on the 0.5 wt% LSSO coated LiCoO2 after 50 cycles, and how does this impact the stability of the cell?
2. Describe the expected spectral features in the O K-edge electron yield (EY) XAS for the cycled 0.5 wt% LSSO coated sample.
3. How does the CEI composition and its corresponding O K-edge spectrum of the 0.5 wt% LSSO coated sample distinguish it from the CEI formed on 0.5 wt% Al2O3 and dual-coated samples?
Ground Truth
Material: 0.5 wt% Li2SrSiO4 coated LiCoO2
Measurement: Soft XAS (sXAS) in electron yield (EY) mode at O K-edge, beamline 6.3.1 of ALS and 7-ID-1 (SST-1) of NSLS II
Fit method: Qualitative spectral comparison
Fit basis (paper's reference spectra):
- Li2CO3
- Li2O
Source evidence: Page 13-14, Figure 5(b)
Key reasoning: After 50 cycles, the O K-edge spectrum of the 0.5 LSSO coated sample changes due to the formation of a cathode-electrolyte interphase (CEI). Unlike the Al2O3 and dual-coated samples which form a stable Li2CO3-rich CEI, the 0.5 LSSO sample forms a thin, unstable CEI likely containing Li2O. This is evidenced by a small intensity peak at ~531 eV and a broad feature near 537 eV, which differs from the Li2CO3 reference.
Reasoning source: Section 4. Discussions, Pages 13-14
Scoring Rubric (total: 100 pts)
| Q | Type | Max | Question | Reference Answer | Scoring Criteria |
|---|---|---|---|---|---|
| q1 | identification | 30 | Based on the sample conditions, what is the primary composition of the cathode-electrolyte interphase (CEI) formed on the 0.5 wt% LSSO coated LiCoO2 after 50 cycles, and how does this impact the stability of the cell? | The primary composition of the cathode-electrolyte interphase (CEI) formed on the 0.5 wt% Li2SrSiO4 (LSSO) coated LiCoO2 cathode after 50 cycles contains Li2O. This composition arises because, under the specific cycling conditions (3.0-4.5 V, 50 cycles in 1 M LiPF6 EC:DEC electrolyte), the 0.5 wt% LSSO coating fails to promote the stable Li2CO3-rich CEI observed with other coating materials. Consequently, the resulting Li2O-containing CEI is thin and unstable. This instability negatively impacts the cell by failing to provide a robust, protective passivation layer on the cathode surface during extended charge-discharge cycling. | Full points for identifying Li2O as the primary CEI component and explaining that it forms an unstable interphase leading to degrading cell performance. |
| q2 | spectral | 35 | Describe the expected spectral features in the O K-edge electron yield (EY) XAS for the cycled 0.5 wt% LSSO coated sample. | The expected O K-edge electron yield (EY) XAS spectrum for the cycled 0.5 wt% LSSO coated sample exhibits a small intensity peak at ~531 eV and a broad feature near 537 eV. It notably lacks the strong spectral features associated with a Li2CO3 reference. These specific spectral features arise because, after 50 cycles between 3.0 and 4.5 V, the surface of the LSSO-coated LiCoO2 cathode develops a thin, unstable cathode-electrolyte interphase (CEI) containing Li2O. The surface-sensitive EY measurement captures this distinct Li2O-containing CEI composition, producing the ~531 eV and ~537 eV features rather than typical stable carbonate signatures. | Full points for mentioning the small intensity peak at ~531 eV and the broad feature near 537 eV. |
| q3 | reasoning | 35 | How does the CEI composition and its corresponding O K-edge spectrum of the 0.5 wt% LSSO coated sample distinguish it from the CEI formed on 0.5 wt% Al2O3 and dual-coated samples? | The CEI formed on the 0.5 wt% LSSO coated LiCoO2 sample is distinguished by being thin, unstable, and containing Li2O, whereas the Al2O3 and dual-coated samples form a stable, Li2CO3-rich CEI. Spectroscopically, the LSSO-coated sample's O K-edge spectrum lacks strong Li2CO3 features and instead exhibits a small intensity peak at ~531 eV and a broad feature near 537 eV. This difference arises because the specific 0.5 wt% LSSO coating interacts differently with the 1 M LiPF6 in EC:DEC electrolyte over 50 charge/discharge cycles (3.0-4.5 V) compared to the other coatings. While Al2O3 and dual coatings promote a robust carbonate-based passivation layer, the LSSO coating alone fails to stabilize this Li2CO3-rich interphase, resulting in the distinct Li2O-dominated structural and spectral outcome. | Full points for contrasting the Li2O-containing CEI of the LSSO sample (with 531 eV and 537 eV features) against the stable Li2CO3-rich CEI formed on the Al2O3 and dual-coated samples. |
Review
#427
0.5 wt% Al2O3 coated LiCoO2
O K-edge
▶
LLM Prompt
Sample Information
Material: 0.5 wt% Al2O3 coated LiCoO2
Electrode Type: cathode
Electrolyte: 1 M LiPF6 in EC:DEC (1:1)
Cell Type: coin cell
Charge Discharge: discharged
C Rate: 0.5C
Voltage V: 3.0-4.5
Cycle Number: 50
Sample-Specific Conditions
- Coating: 0.5 wt% Al2O3
- Surface CEI of 0.5 wt% Al2O3 coated LiCoO2 cathode after 50 cycles
Measurement
We plan to measure the O K-edge XANES spectrum of this sample.
Questions
Based on all the information above:
1. Based on surface-sensitive O K-edge XAS, what is the dominant compound formed in the cathode-electrolyte interphase (CEI) of the 0.5 wt% Al2O3 coated LiCoO2 after 50 cycles?
2. Explain the physical reasoning for the formation of this specific CEI composition on the Al2O3-coated sample, and contrast it with the CEI formed on uncoated or LSSO-coated samples.
3. What distinguishing spectral features in the O K-edge XAS would indicate the presence of the CEI formed on the uncoated or LSSO-coated samples, as opposed to the Al2O3-coated sample?
Ground Truth
Material: 0.5 wt% Al2O3 coated LiCoO2
Measurement: O K-edge sXAS (electron yield mode) at ALS beamline 6.3.1 / NSLS SST-1
Fit method: Qualitative spectral comparison
Fit basis (paper's reference spectra):
- Li2CO3
Source evidence: Fig. 5(b) and Section 3.3, page 13
Key reasoning: After cycling, the O K-edge spectra change dramatically due to the formation of a cathode-electrolyte interphase (CEI). The cycled 0.5 Al2O3 coated sample reveals the formation of a Li2CO3-rich CEI, as shown by the similarity of its spectrum to the Li2CO3 reference. This is attributed to the direct contact of the Al2O3 outer layer with the electrolyte, which promotes the formation of a stable Li2CO3-rich interphase.
Reasoning source: Section 3.3 (page 13) and Section 4 (page 14)
Scoring Rubric (total: 100 pts)
| Q | Type | Max | Question | Reference Answer | Scoring Criteria |
|---|---|---|---|---|---|
| q1 | identification | 30 | Based on surface-sensitive O K-edge XAS, what is the dominant compound formed in the cathode-electrolyte interphase (CEI) of the 0.5 wt% Al2O3 coated LiCoO2 after 50 cycles? | Based on surface-sensitive O K-edge XAS, the dominant compound formed in the cathode-electrolyte interphase (CEI) is Li2CO3. This specific phase is expected because the sample consists of a 0.5 wt% Al2O3 coated LiCoO2 cathode that has undergone 50 charge-discharge cycles. During this extended cycling, the direct contact of the Al2O3 outer coating layer with the liquid electrolyte promotes the formation of a stable, Li2CO3-rich interphase. Consequently, the O K-edge spectrum of the cycled sample closely resembles the Li2CO3 reference spectrum. | Full points for identifying Li2CO3 as the dominant CEI component. |
| q2 | reasoning | 40 | Explain the physical reasoning for the formation of this specific CEI composition on the Al2O3-coated sample, and contrast it with the CEI formed on uncoated or LSSO-coated samples. | The formation of a Li2CO3-rich CEI on the 0.5 wt% Al2O3 coated LiCoO2 sample is driven by the direct interaction between the Al2O3 outer layer and the electrolyte during the 50 charge-discharge cycles. This specific coating promotes the development of a highly stable interphase dominated by Li2CO3. In contrast, uncoated or LSSO-coated samples subjected to the same cycling conditions develop a less stable CEI containing Li2O. The difference arises because the Al2O3 coating specifically alters the surface reactivity with the electrolyte, preventing the formation of the less stable Li2O components seen in the other samples. | Full points for explaining that contact between Al2O3 and the electrolyte promotes a stable Li2CO3-rich CEI, whereas uncoated or LSSO-coated samples form a different, less stable CEI containing Li2O. |
| q3 | spectral | 30 | What distinguishing spectral features in the O K-edge XAS would indicate the presence of the CEI formed on the uncoated or LSSO-coated samples, as opposed to the Al2O3-coated sample? | The O K-edge XAS spectra for the uncoated or LSSO-coated samples exhibit a small intensity peak at approximately 531 eV and a broad feature near 537 eV. These specific spectral features arise because these samples form a less stable, Li2O-containing CEI after 50 cycles, which contrasts with the stable Li2CO3-rich CEI of the Al2O3-coated sample. The Al2O3-coated sample lacks these distinct Li2O-related peaks, instead yielding a spectrum that closely resembles a pure Li2CO3 reference. Therefore, the presence of the 531 eV and 537 eV features directly reflects the structural and electronic properties of the less stable Li2O-based interphase formed in the absence of the protective Al2O3 layer. | Full points for mentioning a small intensity peak at ~531 eV and a broad feature near 537 eV (indicative of Li2O) in the uncoated/LSSO samples, which differ from the Li2CO3-dominated spectrum of the Al2O3-coated sample. |
Review
Degradation and fate of 2,4-dinitroanisole (DNAN) and its intermediates treated with Mg/Cu bimetal: Surface examination with XAS, DFT, and LDI-MS
APS
Catalyst
Andrew Mai et al.
DOI: 10.1016/j.jes.2022.09.007
1 scenario
▶
#428
Mg/Cu
Cu K-edge
▶
LLM Prompt
Sample Information
Material: Mg/Cu
Reaction Conditions: N2 purging, aqueous solution
Sample-Specific Conditions
- Purging gas and reaction time: N2, 0 min (control)
- Mg/Cu bimetal in aqueous solution without contaminant, purged with N2
Measurement
We plan to measure the Cu K-edge XANES spectrum of this sample.
Questions
Based on all the information above:
1. Based on the reaction conditions (Mg/Cu bimetal in aqueous solution purged with N2), what are the expected Cu oxidation states in the sample, and what reference spectra should be used for XANES analysis?
2. How does the choice of purging gas (N2 vs O2) affect the persistence of the zero-valent copper phase in the Mg/Cu bimetal system?
Ground Truth
Material: Mg/Cu bimetal
Measurement: Cu K-edge XANES in transmission mode at beamline 9-BM, Advanced Photon Source (APS)
Fit method: Not reported for XANES LCF (qualitative comparison and EXAFS fitting used)
Fit basis (paper's reference spectra):
- Copper foil (Cu0)
- CuCl2 (Cu2+)
Source evidence: Section 2.7, Figure 5, Table 1
Key reasoning: XANES spectra show that the majority of Cu in the Mg/Cu bimetal exists as divalent Cu (CuO), evidenced by the significantly decreased feature peak of Cu0 (pre-peak at 8,981 eV). However, under N2 purging, the feature peak of Cu0 still exists, indicating a minor presence of Cu(0). EXAFS fitting for the N2-Control sample supports the dominance of CuO with a first shell of 3.6 O atoms and a second shell of 1.3 Cu atoms.
Reasoning source: Section 2.7 X-ray Absorption Spectroscopy (XAS) Analyses
Scoring Rubric (total: 100 pts)
| Q | Type | Max | Question | Reference Answer | Scoring Criteria |
|---|---|---|---|---|---|
| q1 | identification | 50 | Based on the reaction conditions (Mg/Cu bimetal in aqueous solution purged with N2), what are the expected Cu oxidation states in the sample, and what reference spectra should be used for XANES analysis? | The expected Cu oxidation states in the Mg/Cu bimetal sample are Cu(II) and Cu(0). For XANES analysis, the appropriate reference spectra to use are Copper foil (Cu0) and CuCl2 (Cu2+). These phases arise because, in the aqueous solution, the majority of the copper exists as divalent Cu (CuO), which is supported by EXAFS fitting showing a dominant first shell of 3.6 O atoms. However, because the system is purged with N2 (0 min control), a minor fraction of zero-valent Cu(0) is able to persist, as indicated by the survival of the Cu0 pre-peak at 8,981 eV. | Must identify Cu(II) (or CuO) and Cu(0) as the expected states, and mention Cu foil (or metallic Cu) and a Cu(II) standard (like CuCl2 or CuO) as reference spectra. |
| q3 | reasoning | 50 | How does the choice of purging gas (N2 vs O2) affect the persistence of the zero-valent copper phase in the Mg/Cu bimetal system? | In the Mg/Cu bimetal system, purging with N2 allows a minor fraction of the zero-valent copper phase to persist in the aqueous solution. This persistence occurs because the N2 purging environment prevents the complete oxidation of the metal, leaving a visible Cu0 pre-peak feature at 8,981 eV in the XANES spectra. Even though the majority of the copper converts to divalent Cu (CuO) with a first shell of 3.6 O atoms, the specific condition of N2 purging ensures that a minor presence of Cu(0) remains. | Must explain that under N2 purging, the Cu0 feature peak still exists (Cu0 persists), whereas O2 purging accelerates oxidation, causing the Cu0 feature to completely disappear over time. |
Review
Physical vapor deposition process for engineering Pt based oxygen reduction reaction catalysts on NbOx templated carbon support
BNL-NSLS-II-8-ID
Catalyst
Chunchuan Xu et al.
DOI: 10.1016/j.jpowsour.2020.227709
2 scenarios
▶
#429
35.7 wt% Pt, 1.27 wt% NbOx
Pt Pt L3-edge
▶
LLM Prompt
Sample Information
Material: 35.7 wt% Pt, 1.27 wt% NbOx
Support: Graphitized carbon (GC)
Reaction Conditions: 0.1 M HClO4, 0.54 V vs RHE
Sample-Specific Conditions
- Pt loading: 35.7 wt%
- Pt on NbOx/C catalyst prepared by magnetron sputtering
Measurement
We plan to measure the Pt Pt L3-edge XANES spectrum of this sample.
Questions
Based on all the information above:
1. What is the dominant phase of Pt in this catalyst under the specified conditions, and what reference spectrum is most appropriate for its XANES analysis?
2. Describe the expected spectral shape of the Pt L3-edge XANES for this sample. How does it compare to the standard reference, and what is the key distinguishing feature?
3. What is the physical and electronic origin of the slightly higher white line intensity observed in this sample compared to the reference?
Ground Truth
Material: 35.7 wt% Pt, 1.27 wt% NbOx on Graphitized carbon (GC)
Measurement: Pt L3-edge in situ fluorescence mode at beamlines 8-ID and 6BM (NSLS-II)
Fit method: Direct spectral comparison
Phase fractions:
| Phase | Fraction |
|---|---|
| metallic_platinum | 1.0 |
Fit basis (paper's reference spectra):
- Pt reference foil
Source evidence: Figure 5d, Table 3, Page 16
Key reasoning: The EXAFS at the Pt L3 edge can be well fitted with only a Pt-Pt path, indicating the absence of Pt-Nb alloying effects. The Pt is only slightly d-electron deficient, confirmed by the slightly higher white line intensity of the Pt L3 XANES spectra collected at 0.54 V compared to that of the Pt reference foil. This is due to a partial electron transfer from Pt toward O, where the O comes from the NbOx support.
Reasoning source: Page 16, In situ XAS Characterization section
Scoring Rubric (total: 101 pts)
| Q | Type | Max | Question | Reference Answer | Scoring Criteria |
|---|---|---|---|---|---|
| q1 | identification | 25 | What is the dominant phase of Pt in this catalyst under the specified conditions, and what reference spectrum is most appropriate for its XANES analysis? | The dominant phase of Pt in this catalyst is metallic platinum (Pt nanoparticles), which accounts for a fraction of 1.0. The most appropriate reference spectrum for its XANES analysis is a standard Pt reference foil. Under the specified conditions of 0.1 M HClO4 at 0.54 V vs RHE, the 35.7 wt% Pt sputtered on the NbOx/graphitized carbon support remains entirely metallic without forming a Pt-Nb alloy, as EXAFS fitting requires only a Pt-Pt path. Consequently, the pure Pt foil perfectly represents this unalloyed metallic state and serves as the ideal basis for direct spectral comparison. | Full points for identifying metallic platinum as the dominant phase and Pt reference foil as the appropriate reference. |
| q2 | spectral | 38 | Describe the expected spectral shape of the Pt L3-edge XANES for this sample. How does it compare to the standard reference, and what is the key distinguishing feature? | The expected Pt L3-edge XANES spectrum closely resembles the spectral shape of a standard Pt reference foil. Its key distinguishing feature is a slightly higher white line intensity compared to this reference. Under the reaction conditions of 0.54 V vs RHE in 0.1 M HClO4, the 35.7 wt% Pt nanoparticles interact with the 1.27 wt% NbOx support. This specific composition induces a partial electron transfer from Pt toward the oxygen in the NbOx, creating a slight d-electron deficiency in the Pt that directly produces the increased white line intensity. | Full points for stating that the spectrum closely resembles a Pt reference foil but is distinguished by a slightly higher white line intensity. |
| q3 | reasoning | 38 | What is the physical and electronic origin of the slightly higher white line intensity observed in this sample compared to the reference? | The physical and electronic origin of the slightly higher white line intensity is an increase in Pt 5d orbital vacancies, which makes the platinum slightly d-electron deficient. This electronic state arises from the specific composition of the catalyst, where 35.7 wt% Pt nanoparticles are supported on graphitized carbon containing 1.27 wt% NbOx. Under the operating conditions of 0.54 V vs RHE in 0.1 M HClO4, a partial electron transfer occurs from the metallic Pt toward the oxygen atoms of the NbOx support. This interfacial electron transfer mechanism directly depletes the Pt 5d band, yielding the higher white line intensity compared to a bulk Pt reference foil. | Full points for explaining that the higher intensity arises from increased 5d orbital vacancies due to partial electron transfer from Pt toward O (Pt-O interaction with the NbOx support). |
Review
#430
21.5 wt% Pt, 1.10 wt% Co, 0.23 wt% NbOx
Pt Pt L3-edge
▶
LLM Prompt
Sample Information
Material: 21.5 wt% Pt, 1.10 wt% Co, 0.23 wt% NbOx
Support: Ketjen black (KB)
Reaction Conditions: 0.1 M HClO4, 0.54 V vs RHE
Sample-Specific Conditions
- Alloying element: Co
- PtCo alloy on NbOx/C catalyst prepared by magnetron sputtering
Measurement
We plan to measure the Pt Pt L3-edge XANES spectrum of this sample.
Questions
Based on all the information above:
1. What is the dominant phase of Pt in this catalyst under the specified conditions, and what reference spectrum would be primarily used for comparison to determine its electronic state?
2. Describe the expected relative intensity of the Pt L3-edge XANES white line for this sample at 0.54 V compared to a Pt reference foil, and explain the electronic origin of this feature.
Ground Truth
Material: 21.5 wt% Pt, 1.10 wt% Co, 0.23 wt% NbOx on Ketjen black (KB)
Measurement: in situ Pt L3-edge XANES in 0.1 M HClO4 at 0.54 V vs RHE, fluorescence mode at NSLS-II
Fit method: EXAFS fitting and XANES white line comparison
Phase fractions:
| Phase | Fraction |
|---|---|
| PtCo alloy | 1.0 |
Fit basis (paper's reference spectra):
- Pt reference foil
Source evidence: Page 19, Table 3
Key reasoning: In situ XAS on the NbOx/C supported PtCo alloy (EXO-0302) shows the presence of a Pt-Co alloying phase, reflected by a shortened Pt-Pt distance (2.74 Å) compared to Pt foil (2.76 Å). This strain effect downshifts the Pt d-band center relative to the Fermi level, weakening the Pt-O binding energy and improving ORR activity. The Pt is only slightly d-electron deficient, confirmed by a slightly higher white line intensity at 0.54 V compared to the Pt reference foil.
Reasoning source: Page 19, Results and Discussion
Scoring Rubric (total: 100 pts)
| Q | Type | Max | Question | Reference Answer | Scoring Criteria |
|---|---|---|---|---|---|
| q1 | identification | 46 | What is the dominant phase of Pt in this catalyst under the specified conditions, and what reference spectrum would be primarily used for comparison to determine its electronic state? | The dominant phase of Pt in this catalyst is a PtCo alloy, which accounts for 100% of the Pt fraction. To determine its electronic state, a Pt reference foil is primarily used for comparison. This specific phase arises because the catalyst is prepared via magnetron sputtering of Pt and Co onto a NbOx/Ketjen black support, which directly forms the bimetallic alloy. Under the in situ conditions of 0.1 M HClO4 at 0.54 V vs RHE, the alloy remains stable but exhibits a shortened Pt-Pt bond distance (2.74 Å) compared to pure Pt (2.76 Å) due to strain effects from the Co incorporation. Comparing the sample's spectrum to the Pt foil baseline reveals how this strain downshifts the Pt d-band center and causes a slight d-electron deficiency. | 15 points for identifying PtCo alloy as the dominant phase. 15 points for identifying Pt reference foil as the comparison basis. |
| q2 | spectral | 54 | Describe the expected relative intensity of the Pt L3-edge XANES white line for this sample at 0.54 V compared to a Pt reference foil, and explain the electronic origin of this feature. | At 0.54 V vs RHE, the Pt L3-edge XANES white line intensity for this sample is expected to be slightly higher than that of the Pt reference foil. The electronic origin of this increased intensity is a slight d-electron deficiency in the Pt atoms. This specific electronic state results from the sample's composition as a PtCo alloy on a NbOx/C support, where the incorporation of Co induces a structural strain effect that shortens the Pt-Pt distance to 2.74 Å. This strain downshifts the Pt d-band center relative to the Fermi level, which weakens the Pt-O binding energy in the 0.1 M HClO4 electrolyte and produces the observed slight increase in white line intensity. | 15 points for stating the white line intensity is slightly higher than that of the Pt foil. 20 points for explaining that this indicates a slight d-electron deficiency in the Pt atoms. |
Review
Hierarchically structured MoO2/dopamine-derived carbon spheres as intercalation electrodes for lithium-ion batteries
BNL-NSLS-II-8-ID
Synthesis
N. Norouzi et al.
DOI: 10.1016/j.mtchem.2022.100783
2 scenarios
▶
#431
MoO2/C nanocomposite
Mo K
▶
LLM Prompt
Sample Information
Material: MoO2/C nanocomposite
Method: sol-gel + hydrothermal
Precursors: dopamine hydrochloride, metallic Mo powder, H2O2
Temperature C: 220
Duration Hours: 24
Atmosphere: autogenous (hydrothermal)
Post Treatment: washed with deionized water, dried at 105°C in air
Sample-Specific Conditions
- treatment: hydrothermal only
- Hydrothermally treated (Dopa)xMoOy@PDopa precursor
Preparation
- 0.95 g dopamine hydrochloride dissolved in 7 mL DI water. 0.48 g metallic Mo powder added (Mo:Dopa = 1:1). H2O2 (30 wt%) added dropwise until Mo dissolved. Heated to 60°C, aged 5-7 days, freeze dried to form precursor. 300 mg precursor in 12 mL water hydrothermally treated at 220°C for 24 h. Washed and dried at 105°C in air.
Measurement
We plan to measure the Mo K XANES spectrum of this sample.
Questions
Based on all the information above:
1. What candidate reference spectra should be included in a Linear Combination Fitting (LCF) analysis to determine the molybdenum speciation in this hydrothermally treated MoO2/C nanocomposite?
2. Based on the synthesis conditions (hydrothermal treatment at 220°C with dopamine), estimate the phase fractions of the molybdenum species present in the sample.
3. Explain why these specific phase fractions and the resulting Mo oxidation state are expected for this sample, focusing on the chemical role of dopamine during the hydrothermal treatment.
Ground Truth
Material: MoO2/C nanocomposite
Measurement: Mo K-edge fluorescence XAS at 7-BM beamline
Fit method: Linear combination fitting (LCF)
Phase fractions: (±3%)
| Phase | Fraction |
|---|---|
| MoO2 | 0.945 |
| MoO3 | 0.015 |
Fit basis (paper's reference spectra):
- MoO2
- MoO3
Source evidence: Table 1 and Figure 4, page 18
Key reasoning: During the hydrothermal treatment, dopamine acts as both a carbon precursor and a reducing agent. Its presence in the interlayer region of the molybdenum oxide precursor leads to the reduction of molybdenum, preventing the formation of higher oxidation state compounds like MoO3. This results in a highly dominant MoO2 phase (Mo4+), with only a negligible fraction of MoO3 remaining.
Reasoning source: Section 3 (Results and Discussion), page 15
Scoring Rubric (total: 100 pts)
| Q | Type | Max | Question | Reference Answer | Scoring Criteria |
|---|---|---|---|---|---|
| q1 | identification | 20 | What candidate reference spectra should be included in a Linear Combination Fitting (LCF) analysis to determine the molybdenum speciation in this hydrothermally treated MoO2/C nanocomposite? | The Linear Combination Fitting (LCF) analysis should include MoO2 and MoO3 as candidate reference spectra. These specific phases are expected because the sample is synthesized via a hydrothermal treatment of a molybdenum oxide precursor at 220°C for 24 hours in the presence of dopamine. During this process, dopamine acts as a reducing agent in the interlayer region, which predominantly reduces the molybdenum to form a dominant MoO2 (Mo4+) phase. A reference for MoO3 must also be included to account for any negligible fractions of higher oxidation state compounds that were not fully reduced or formed during the 105°C air drying step. | Full points for identifying MoO2 and MoO3 as the necessary reference spectra. |
| q2 | quantification | 40 | Based on the synthesis conditions (hydrothermal treatment at 220°C with dopamine), estimate the phase fractions of the molybdenum species present in the sample. | The estimated phase fractions for this sample are 0.945 (94.5%) MoO2 and 0.015 (1.5%) MoO3, with a fitting uncertainty of 3%. These specific values result directly from the hydrothermal treatment at 220°C for 24 hours, where dopamine hydrochloride is present in a 1:1 ratio with molybdenum. The dopamine acts as a strong reducing agent within the interlayer region of the precursor, effectively reducing the molybdenum and preventing the formation of higher oxidation states. Consequently, this mechanism yields a highly dominant MoO2 (Mo4+) phase, leaving only a negligible fraction of MoO3 in the final nanocomposite. | Full points for estimating a highly dominant MoO2 phase (~94-95%) and a very minor/negligible MoO3 phase (~1-2%). |
| q3 | reasoning | 40 | Explain why these specific phase fractions and the resulting Mo oxidation state are expected for this sample, focusing on the chemical role of dopamine during the hydrothermal treatment. | The highly dominant MoO2 fraction (94.5%) and negligible MoO3 fraction (1.5%) are expected due to the dual role of dopamine during the 220°C hydrothermal treatment. Dopamine hydrochloride acts as both a carbon precursor and a reducing agent within the interlayer region of the (Dopa)xMoOy@PDopa precursor. Because of this localized reducing environment, the molybdenum is effectively reduced to the Mo4+ oxidation state, which strongly drives the formation of the MoO2 phase. This reduction mechanism actively prevents the formation or retention of higher oxidation state compounds like MoO3, explaining why only a trace amount remains in the final MoO2/C nanocomposite. | Full points for explaining that dopamine acts as a reducing agent during the hydrothermal process, which reduces the molybdenum precursor to form predominantly MoO2 (Mo4+) and prevents the formation/retention of higher oxidation state compounds like MoO3. |
Review
#432
MoO2/C nanocomposite
Mo K
▶
LLM Prompt
Sample Information
Material: MoO2/C nanocomposite
Method: sol-gel + hydrothermal + annealing
Precursors: HT-MoO2/C
Temperature C: 600
Duration Hours: 6
Atmosphere: Ar flow
Sample-Specific Conditions
- treatment: hydrothermal + annealing
- Annealed hydrothermally treated (Dopa)xMoOy@PDopa precursor
Preparation
- HT-MoO2/C powder annealed at 600°C for 6 h under continuous Ar flow in a tube furnace.
Measurement
We plan to measure the Mo K XANES spectrum of this sample.
Questions
Based on all the information above:
1. What candidate reference spectra are required to accurately model the Mo K-edge XANES spectrum of this sample using linear combination fitting (LCF)?
2. Based on the synthesis conditions (hydrothermal treatment followed by annealing at 600°C in Ar flow), estimate the phase fractions of the molybdenum species present in the sample as determined by XANES LCF.
3. Explain the chemical reasoning for why the annealing step (600°C, Ar flow) leads to the specific mixture of molybdenum phases and the resulting average oxidation state observed in the XANES analysis, compared to a sample that was only hydrothermally treated.
Ground Truth
Material: MoO2/C nanocomposite
Measurement: Mo K-edge fluorescence XANES at 7-BM beamline of NSLS-II
Fit method: Linear combination fitting (LCF)
Phase fractions: (±5%)
| Phase | Fraction |
|---|---|
| MoO2 | 0.787 |
| MoO3 | 0.213 |
Fit basis (paper's reference spectra):
- MoO2
- MoO3
Source evidence: Table 1 and Figure 4, page 18
Key reasoning: Annealing the hydrothermally treated sample at 600°C under Ar induces a complex chemical interaction between the dopamine-derived carbon and molybdenum compounds. This interaction results in an increase of the average molybdenum oxidation state from 4.0 (in the unannealed precursor) to 4.4. Consequently, the sample is not purely MoO2 but contains a significant fraction of MoO3, as determined by LCF of the XANES data.
Reasoning source: Section 3 (Results and Discussion), pages 18 and 20
Scoring Rubric (total: 100 pts)
| Q | Type | Max | Question | Reference Answer | Scoring Criteria |
|---|---|---|---|---|---|
| q1 | identification | 20 | What candidate reference spectra are required to accurately model the Mo K-edge XANES spectrum of this sample using linear combination fitting (LCF)? | To accurately model the Mo K-edge XANES spectrum of this sample using linear combination fitting (LCF), reference spectra for MoO2 and MoO3 are required. These specific phases are expected because annealing the hydrothermally treated (Dopa)xMoOy@PDopa precursor at 600°C under Ar flow induces a complex chemical interaction between the dopamine-derived carbon and the molybdenum compounds. This interaction causes the average molybdenum oxidation state to increase from 4.0 in the unannealed precursor to 4.4. As a result, the final nanocomposite is not purely MoO2, but rather a mixture containing a significant fraction of MoO3. | Full points if the answer identifies both MoO2 and MoO3 as the necessary reference spectra. Partial points if only one is identified or if extraneous phases are included. |
| q2 | quantification | 40 | Based on the synthesis conditions (hydrothermal treatment followed by annealing at 600°C in Ar flow), estimate the phase fractions of the molybdenum species present in the sample as determined by XANES LCF. | Based on XANES LCF analysis, the sample consists of 78.7% MoO2 and 21.3% MoO3, with an uncertainty of 5%. These specific fractions result from the annealing of the hydrothermally treated precursor at 600°C for 6 hours under an Ar flow. During this thermal treatment, a complex chemical interaction occurs between the dopamine-derived carbon and the molybdenum species. This interaction drives the average molybdenum oxidation state up from 4.0 to 4.4, which directly corresponds to this specific mixture of Mo(IV) and Mo(VI) oxides rather than a pure MoO2 phase. | Full points if the estimated fractions are approximately 78-79% MoO2 and 21-22% MoO3. Partial points if the dominant phase is correctly identified as MoO2 with a minor but significant MoO3 component. |
| q3 | reasoning | 40 | Explain the chemical reasoning for why the annealing step (600°C, Ar flow) leads to the specific mixture of molybdenum phases and the resulting average oxidation state observed in the XANES analysis, compared to a sample that was only hydrothermally treated. | When the hydrothermally treated (Dopa)xMoOy@PDopa precursor is annealed at 600°C for 6 hours under Ar flow, it undergoes a complex chemical interaction between the dopamine-derived carbon and the molybdenum compounds. In a sample that is only hydrothermally treated, the molybdenum oxidation state remains at 4.0, corresponding to pure MoO2. However, the high-temperature annealing step drives an interaction that increases the average molybdenum oxidation state to 4.4. Consequently, this mechanism yields a mixed-phase nanocomposite containing 78.7% MoO2 and 21.3% MoO3, rather than the pure MoO2 phase found in the unannealed precursor. | Full points if the answer explains that annealing induces a complex interaction between the dopamine-derived carbon and molybdenum compounds, leading to an increase in the Mo oxidation state (to ~4.4) and the formation of a mixed MoO2/MoO3 composition. |
Review
Discovery of a new phase transition and high-valent redox mechanism in Fe-substituted Na2Mn3O7
BNL-NSLS-II-8-ID
Electrochemistry
Hugh Barrett Smith et al.
DOI: 10.1016/j.nanoen.2026.111737
5 scenarios
▶
#433
Na2.25Mn2.75Fe0.25O7
Fe K-edge
▶
LLM Prompt
Sample Information
Material: Na2.25Mn2.75Fe0.25O7
Electrode Type: cathode
Cell Type: in-situ cell
Charge Discharge: OCV
C Rate: C/10
Voltage V: 3.0
Capacity Mah G: 0
Sample-Specific Conditions
- state of charge: pristine
- Pristine state before electrochemical cycling
Measurement
We plan to measure the Fe K-edge XANES spectrum of this sample.
Questions
Based on all the information above:
1. What is the expected oxidation state and local coordination environment of Fe in the pristine Na2.25Mn2.75Fe0.25O7 sample, and what reference spectrum does it most closely align with?
2. Based on the provided conditions, what is the approximate white line energy of the Fe K-edge XANES spectrum for this pristine material?
3. If Fe were to migrate out of the transition metal oxide plane into a tetrahedral site, what specific change would be expected in the Fe K-edge XANES spectrum? Does the pristine sample exhibit this feature?
Ground Truth
Material: Na2.25Mn2.75Fe0.25O7 (NMFO)
Measurement: in-situ Fe K-edge XANES
Fit method: Comparison of white line energy and edge energy to reference spectra
Phase fractions: (±5%)
| Phase | Fraction |
|---|---|
| Na2.25Mn2.75Fe0.25O7 (Fe3+ octahedral) | 1.0 |
Fit basis (paper's reference spectra):
- FeO
- Fe2O3
Source evidence: Figure 2e, Figure 2k, Figure 4, Section 2.2.1 (page 6)
Key reasoning: In the pristine state, Fe is incorporated into the transition metal oxide (TMO) layer in a 3+ oxidation state and is octahedrally coordinated. This is confirmed by the alignment of the Fe K-edge XANES spectrum with the Fe2O3 reference and the absence of a large pre-edge peak. Mössbauer spectroscopy further confirms that 100% of the Fe is in an octahedrally coordinated Fe3+ state prior to cycling.
Reasoning source: Section 2.2.1 (In-situ XANES) and Section 2.2.3 (Mössbauer Spectroscopy)
Scoring Rubric (total: 100 pts)
| Q | Type | Max | Question | Reference Answer | Scoring Criteria |
|---|---|---|---|---|---|
| q1 | identification | 30 | What is the expected oxidation state and local coordination environment of Fe in the pristine Na2.25Mn2.75Fe0.25O7 sample, and what reference spectrum does it most closely align with? | In the pristine Na2.25Mn2.75Fe0.25O7 cathode sample, Fe is expected to be in a 3+ oxidation state with an octahedral local coordination environment. The Fe K-edge XANES spectrum for this material most closely aligns with the Fe2O3 reference spectrum. This occurs because the sample is in its initial uncycled state (0 mAh/g capacity, OCV at 3.0 V), meaning the Fe atoms remain fully incorporated within the transition metal oxide (TMO) layer. Under these pristine conditions, 100% of the Fe is stabilized as octahedrally coordinated Fe3+, which is structurally confirmed by the absence of a large pre-edge peak. | Full credit for identifying Fe3+, octahedral coordination, and alignment with the Fe2O3 reference spectrum. |
| q2 | spectral | 30 | Based on the provided conditions, what is the approximate white line energy of the Fe K-edge XANES spectrum for this pristine material? | The approximate white line energy of the Fe K-edge XANES spectrum for this material is ~7133.5 eV. This specific spectral feature arises because the Na2.25Mn2.75Fe0.25O7 cathode is in a pristine, uncycled state at an open circuit voltage of 3.0 V. Under these initial conditions, the Fe atoms are fully incorporated into the transition metal oxide layer as octahedrally coordinated Fe3+. The 3+ oxidation state directly dictates the edge and white line positions, causing the spectrum to align closely with an Fe2O3 reference standard at this energy level. | Full credit for stating a white line energy of approximately 7133.5 eV. |
| q3 | reasoning | 40 | If Fe were to migrate out of the transition metal oxide plane into a tetrahedral site, what specific change would be expected in the Fe K-edge XANES spectrum? Does the pristine sample exhibit this feature? | If Fe were to migrate out of the transition metal oxide plane into a tetrahedral site, a large pre-edge peak would emerge in the Fe K-edge XANES spectrum. The pristine Na2.25Mn2.75Fe0.25O7 sample does not exhibit this feature, showing only a minimal or absent pre-edge peak. This is because the cathode is in its initial, uncycled state (0 mAh/g at OCV). Without the structural degradation typically induced by electrochemical cycling, 100% of the Fe remains securely incorporated within the transition metal oxide layer as octahedrally coordinated Fe3+, preventing the formation of the pre-edge peak associated with tetrahedral sites. | Full credit for explaining that tetrahedral migration would cause the appearance of a large pre-edge peak, and correctly noting that this feature is absent in the pristine sample. |
Review
#434
Na2.25Mn2.75Fe0.25O7
Mn K-edge
▶
LLM Prompt
Sample Information
Material: Na2.25Mn2.75Fe0.25O7
Electrode Type: cathode
Cell Type: in-situ cell
Charge Discharge: OCV
C Rate: C/10
Voltage V: 3.0
Capacity Mah G: 0
Sample-Specific Conditions
- state of charge: pristine
- Pristine state before electrochemical cycling
Measurement
We plan to measure the Mn K-edge XANES spectrum of this sample.
Questions
Based on all the information above:
1. What is the expected dominant oxidation state of Mn in the pristine Na2.25Mn2.75Fe0.25O7 cathode, and what minor deviation might be present before electrochemical cycling?
2. Describe the expected position of the Mn K-edge white line for this pristine sample and what reference spectra would be most appropriate to confirm this assignment.
3. How is the Mn K-edge expected to shift during the very beginning of the first charge (desodiation), and what physical process does this represent?
Ground Truth
Material: Na2.25Mn2.75Fe0.25O7
Measurement: In-situ Mn K-edge XANES
Fit method: White line energy tracking and comparison to reference spectra
Phase fractions: (±10%)
| Phase | Fraction |
|---|---|
| Mn4+ (MnO2-like) | 1.0 |
Fit basis (paper's reference spectra):
- MnO
- Mn2O3
- MnO2
Source evidence: Figure 2a, Figure 2j, Section 2.2.1 (page 6)
Key reasoning: In the pristine structure, NMFO ideally contains Mn in the +4 oxidation state, which is supported by the spectrum's alignment with the MnO2 reference. However, a minor amount of residual Mn3+ is present, particularly near the particle surface. This residual Mn3+ is oxidized to Mn4+ during the very beginning of the first charge, causing a slight shift to higher energy.
Reasoning source: Section 2.2.1 In-situ XANES, page 6
Scoring Rubric (total: 100 pts)
| Q | Type | Max | Question | Reference Answer | Scoring Criteria |
|---|---|---|---|---|---|
| q1 | identification | 30 | What is the expected dominant oxidation state of Mn in the pristine Na2.25Mn2.75Fe0.25O7 cathode, and what minor deviation might be present before electrochemical cycling? | The expected dominant oxidation state of Mn in the pristine Na2.25Mn2.75Fe0.25O7 cathode is +4 (with a fraction of 1.0, MnO2-like), alongside a minor amount of residual Mn3+. Because the sample is in its pristine, uncycled state at an open circuit voltage of 3.0 V and 0 mAh/g capacity, the ideal structure inherently contains Mn in the +4 oxidation state. The minor deviation of residual Mn3+ arises naturally in the as-prepared material, particularly near the particle surface, before any electrochemical charging has occurred. | Full points for identifying Mn4+ as the dominant state and noting the presence of minor/residual Mn3+ (especially near the surface). |
| q2 | spectral | 35 | Describe the expected position of the Mn K-edge white line for this pristine sample and what reference spectra would be most appropriate to confirm this assignment. | The expected position of the Mn K-edge white line for this sample is at approximately 6560.5 eV. To confirm this assignment, the spectrum should be compared against MnO2, Mn2O3, and MnO reference spectra. Because the pristine Na2.25Mn2.75Fe0.25O7 cathode at 0 mAh/g capacity ideally contains Mn in a +4 oxidation state, its electronic configuration produces a spectral shape that closely resembles the MnO2 reference. Consequently, this structural state yields a white line energy (~6560.5 eV) characteristic of Mn4+, which is positioned at a higher energy compared to the Mn3+ (Mn2O3) and Mn2+ (MnO) references. | Full points for stating the white line energy is approximately 6560.5 eV and identifying MnO2 (or a similar Mn4+ standard) as the primary reference, with Mn2O3 and MnO as lower-valent comparisons. |
| q3 | prediction | 35 | How is the Mn K-edge expected to shift during the very beginning of the first charge (desodiation), and what physical process does this represent? | During the very beginning of the first charge, the Mn K-edge is expected to exhibit a slight shift to higher energy. This shift represents the physical process of oxidizing the minor residual Mn3+ to Mn4+. In its pristine state at 3.0 V and 0 mAh/g capacity, the Na2.25Mn2.75Fe0.25O7 cathode is predominantly Mn4+ but contains residual Mn3+ near the particle surface. As the in-situ cell begins its first charge at a C/10 rate, this specific surface residual Mn3+ is oxidized, which alters the electronic state of the manganese ions and causes the absorption edge to shift to a higher energy. | Full points for predicting a slight shift to higher energy during the initial charge, representing the oxidation of the residual Mn3+ to Mn4+. |
Review
#435
Na2.25Mn2.75Fe0.25O7
Fe Fe K-edge, Mn K-edge
▶
LLM Prompt
Sample Information
Material: Na2.25Mn2.75Fe0.25O7
Electrode Type: cathode
Charge Discharge: OCV
Voltage V: 3.0
Capacity Mah G: 0
Sample-Specific Conditions
- state of charge: pristine
- Pristine state measured via ex-situ Mössbauer spectroscopy
Measurement
We plan to measure the Fe Fe K-edge, Mn K-edge XANES spectrum of this sample.
Questions
Based on all the information above:
1. Based on the sample conditions (pristine Na2.25Mn2.75Fe0.25O7 at OCV), what is the expected oxidation state and coordination environment of Fe, and what physical reasoning supports this?
2. Describe the expected spectral shape of the Fe K-edge XANES for this pristine sample. What specific feature indicates the coordination environment of Fe?
3. If Fe were to migrate out of the transition metal oxide plane into a different site during cycling, how would the Fe K-edge XANES spectrum change compared to this pristine state?
Ground Truth
Material: Na2.25Mn2.75Fe0.25O7
Measurement: ex-situ Mössbauer spectroscopy and in-situ Fe K-edge XANES
Fit method: Mössbauer spectral fitting
Phase fractions: (±5%)
| Phase | Fraction |
|---|---|
| Fe(III) Octahedral | 1.0 |
Fit basis (paper's reference spectra):
- Fe(III) Octahedral
Source evidence: Figure 4 (Mössbauer) and Figure 2e (XANES), pages 7 and 9
Key reasoning: In the pristine state, the material is synthesized with Fe in the +3 oxidation state. Mössbauer spectroscopy shows an isomer shift characteristic of octahedrally coordinated Fe3+. Fe K-edge XANES confirms this coordination by the absence of a large pre-edge peak, which would otherwise indicate tetrahedral Fe.
Reasoning source: Section 2.2.3 Mössbauer Spectroscopy and Section 2.2.1 In-situ XANES
Scoring Rubric (total: 100 pts)
| Q | Type | Max | Question | Reference Answer | Scoring Criteria |
|---|---|---|---|---|---|
| q1 | reasoning | 30 | Based on the sample conditions (pristine Na2.25Mn2.75Fe0.25O7 at OCV), what is the expected oxidation state and coordination environment of Fe, and what physical reasoning supports this? | In the pristine state at OCV (3.0 V, 0 mAh/g), the expected oxidation state of Fe in the Na2.25Mn2.75Fe0.25O7 cathode is +3, and it occupies an octahedral coordination environment (100% fraction). This is because the material is initially synthesized with Fe entirely in the +3 oxidation state, and at 0 mAh/g, no electrochemical reactions have occurred to alter this baseline state. This octahedral coordination is physically supported by Mössbauer spectroscopy, which shows an isomer shift characteristic of octahedrally coordinated Fe3+. Additionally, the Fe K-edge XANES spectrum lacks a large pre-edge peak, confirming the Fe ions remain in their native octahedral sites. | Full points for identifying Fe3+ in an octahedral coordination environment. Must mention that this is the synthesized pristine state, supported by Mössbauer isomer shifts and the lack of tetrahedral pre-edge features in XANES. |
| q2 | spectral | 40 | Describe the expected spectral shape of the Fe K-edge XANES for this pristine sample. What specific feature indicates the coordination environment of Fe? | The Fe K-edge XANES spectrum for this pristine Na2.25Mn2.75Fe0.25O7 sample exhibits a main absorption edge characteristic of Fe3+ with a white line energy at approximately 7133.5 eV. The most critical spectral feature indicating the coordination environment is the absence of a prominent pre-edge peak. Because the sample is at OCV in its pristine state (0 mAh/g), the Fe ions remain in their as-synthesized octahedral coordination environment. This octahedral geometry produces a spectrum lacking a large pre-edge peak, a feature that would otherwise indicate the presence of tetrahedral Fe. | Full points for stating the spectrum will show a main edge consistent with Fe3+ and explicitly noting the absence of a large pre-edge peak. Must explain that the lack of this pre-edge peak confirms octahedral coordination and the absence of tetrahedral Fe. |
| q3 | prediction | 30 | If Fe were to migrate out of the transition metal oxide plane into a different site during cycling, how would the Fe K-edge XANES spectrum change compared to this pristine state? | If Fe were to migrate out of the transition metal oxide plane during cycling, the Fe K-edge XANES spectrum would change by developing a prominent pre-edge peak. In the pristine state at OCV, the Na2.25Mn2.75Fe0.25O7 cathode consists entirely of octahedrally coordinated Fe3+, which inherently lacks this large pre-edge feature. Out-of-plane migration in these layered sodium transition metal oxides typically results in the formation of tetrahedral Fe species. Therefore, the structural transition from the pristine octahedral sites to tetrahedral sites would electronically manifest as the emergence of a large pre-edge peak. | Full points for predicting the emergence or increase of a large pre-edge peak, which is characteristic of Fe migrating to a tetrahedral site (out-of-plane migration). |
Review
#436
Na2.25Mn2.75Fe0.25O7
Fe Fe K-edge, Mn K-edge
▶
LLM Prompt
Sample Information
Material: Na2.25Mn2.75Fe0.25O7
Electrode Type: cathode
Charge Discharge: charged
Voltage V: 4.7
Cycle Number: 1
Sample-Specific Conditions
- state of charge: fully charged
- Fully charged state measured via ex-situ Mössbauer spectroscopy
Measurement
We plan to measure the Fe Fe K-edge, Mn K-edge XANES spectrum of this sample.
Questions
Based on all the information above:
1. Based on the sample conditions (fully charged to 4.7 V), what are the expected Fe oxidation states, their coordination environments, and their approximate phase fractions?
2. Explain the structural significance of the Fe coordination environment in this fully charged state. Specifically, why is the absence of Fe migration to a tetrahedral site important for the material's performance?
3. If one were to model the spectroscopic data (such as Mössbauer or XANES) for this fully charged sample, what specific reference states or basis functions are required to capture the Fe speciation?
Ground Truth
Material: Na2.25Mn2.75Fe0.25O7
Measurement: ex-situ Mössbauer spectroscopy and in-situ Fe K-edge XANES
Fit method: Mössbauer spectral fitting
Phase fractions: (±10%)
| Phase | Fraction |
|---|---|
| Fe(III) Octahedral | 0.8665 |
| Fe(IV) Octahedral | 0.1335 |
Fit basis (paper's reference spectra):
- Fe(III) Octahedral
- Fe(IV) Octahedral
Source evidence: Section 2.2.3, Figure 4, Page 9
Key reasoning: Upon fully charging to 4.7 V, Fe partially oxidizes to an average oxidation state of Fe3.13+. This is reflected by a 13.35% contribution of a species with an isomer shift characteristic of octahedrally coordinated Fe4+, while the remaining 86.65% stays as octahedrally coordinated Fe3+. Crucially, Fe does not migrate to a tetrahedral site when oxidized, which is a common source of irreversibility in layered sodium TMO cathodes.
Reasoning source: Section 2.2.3, Page 9
Scoring Rubric (total: 100 pts)
| Q | Type | Max | Question | Reference Answer | Scoring Criteria |
|---|---|---|---|---|---|
| q1 | quantification | 35 | Based on the sample conditions (fully charged to 4.7 V), what are the expected Fe oxidation states, their coordination environments, and their approximate phase fractions? | The expected Fe oxidation states for this sample are Fe(III) and Fe(IV), both exclusively in an octahedral coordination environment. The approximate phase fractions are 86.65% for Fe(III) Octahedral and 13.35% for Fe(IV) Octahedral. These specific values result from the sample conditions because fully charging the Na2.25Mn2.75Fe0.25O7 cathode to 4.7 V during the first cycle causes the Fe to partially oxidize to an average oxidation state of Fe3.13+. Consequently, 13.35% of the iron oxidizes to Fe4+ while the remaining 86.65% stays as Fe3+, with all iron ions remaining in their original octahedral sites without migrating. | Full credit for identifying both Fe(III) and Fe(IV) in octahedral coordination, with approximately 87% Fe(III) and 13% Fe(IV). |
| q2 | reasoning | 40 | Explain the structural significance of the Fe coordination environment in this fully charged state. Specifically, why is the absence of Fe migration to a tetrahedral site important for the material's performance? | In the fully charged state at 4.7 V, the Fe ions in the Na2.25Mn2.75Fe0.25O7 cathode remain exclusively in an octahedral coordination environment. This structural retention occurs because the partial oxidation of Fe to an average state of Fe3.13+ driven by the 4.7 V charge does not trigger Fe migration to a tetrahedral site. The absence of this migration is highly significant for the material's performance because transition metal migration to tetrahedral sites is a common source of irreversibility in layered sodium transition metal oxide (TMO) cathodes. Therefore, maintaining the octahedral coordination during the charge cycle prevents this structural degradation and promotes better reversibility. | Full credit for explaining that Fe remains octahedrally coordinated upon oxidation to Fe4+ and does not migrate to a tetrahedral site, which prevents local structural degradation and a common source of electrochemical irreversibility. |
| q3 | identification | 25 | If one were to model the spectroscopic data (such as Mössbauer or XANES) for this fully charged sample, what specific reference states or basis functions are required to capture the Fe speciation? | To model the spectroscopic data for this sample, the required basis functions are Fe(III) Octahedral and Fe(IV) Octahedral reference states. These specific phases are expected because charging the Na2.25Mn2.75Fe0.25O7 cathode to 4.7 V induces a partial oxidation of the iron centers to an average state of Fe3.13+. This applied voltage results in a mixture where a portion of the Fe exhibits an isomer shift characteristic of octahedrally coordinated Fe4+, while the majority remains as octahedrally coordinated Fe3+. Because the iron does not migrate to tetrahedral sites upon oxidation during this charge cycle, only octahedral coordination references are needed to accurately capture the Fe speciation. | Full credit for specifying the need for both octahedrally coordinated Fe(III) and octahedrally coordinated Fe(IV) reference states. |
Review
#437
Na2.25Mn2.75Fe0.25O7
Fe Fe K-edge, Mn K-edge
▶
LLM Prompt
Sample Information
Material: Na2.25Mn2.75Fe0.25O7
Electrode Type: cathode
Charge Discharge: discharged
Voltage V: 1.5
Cycle Number: 1
Sample-Specific Conditions
- state of charge: fully discharged (1.5 V)
- Over-sodiated state at 1.5 V, measured via ex-situ Mössbauer spectroscopy
Measurement
We plan to measure the Fe Fe K-edge, Mn K-edge XANES spectrum of this sample.
Questions
Based on all the information above:
1. What is the expected Fe oxidation state and local coordination environment in Na2.25Mn2.75Fe0.25O7 when fully discharged to an over-sodiated state at 1.5 V, and what physical phenomenon causes this specific local environment?
2. Compare the Fe oxidation state of the fully discharged (1.5 V) sample to the pristine material. Why does the spectroscopic signature change if the oxidation state remains the same?
Ground Truth
Material: Na2.25Mn2.75Fe0.25O7
Measurement: ex-situ Mössbauer spectroscopy
Fit method: Mössbauer spectral fitting
Phase fractions: (±10%)
| Phase | Fraction |
|---|---|
| Fe(III) New Octahedral | 1.0 |
Fit basis (paper's reference spectra):
- Fe(III) Octahedral
- Fe(IV) Octahedral
- Fe(III) New Octahedral
Source evidence: Figure 4 and Section 2.2.3, page 9
Key reasoning: When discharged to an over-sodiated state at 1.5 V, Fe maintains a Fe3+ oxidation state but its surrounding charge distribution changes, leading to a 'New Octahedral' Mössbauer signature. This local environment change is attributed to distortions caused by the surrounding Jahn-Teller active Mn3+ ions, which are formed at these low voltages.
Reasoning source: Section 2.2.3 Mössbauer Spectroscopy, page 9
Scoring Rubric (total: 100 pts)
| Q | Type | Max | Question | Reference Answer | Scoring Criteria |
|---|---|---|---|---|---|
| q1 | reasoning | 57 | What is the expected Fe oxidation state and local coordination environment in Na2.25Mn2.75Fe0.25O7 when fully discharged to an over-sodiated state at 1.5 V, and what physical phenomenon causes this specific local environment? | The expected Fe oxidation state is Fe3+ in a "New Octahedral" local coordination environment, which accounts for a 1.0 fraction of the fitted state. When the Na2.25Mn2.75Fe0.25O7 cathode is fully discharged to an over-sodiated state at 1.5 V, the Fe ions maintain their Fe3+ oxidation state. However, discharging to this low voltage leads to the formation of Jahn-Teller active Mn3+ ions in the surrounding structure. These Mn3+ ions cause structural distortions that alter the charge distribution around the Fe ions, producing the distinct "New Octahedral" Mössbauer signature. | Full credit requires identifying Fe(III) in a modified or 'new' octahedral environment and explaining that this change in local environment (compared to pristine) is driven by distortions from surrounding Jahn-Teller active Mn3+ ions present at low voltages. |
| q3 | reasoning | 43 | Compare the Fe oxidation state of the fully discharged (1.5 V) sample to the pristine material. Why does the spectroscopic signature change if the oxidation state remains the same? | In the fully discharged (1.5 V) over-sodiated state, the Fe oxidation state remains Fe3+, but it exhibits a 1.0 fraction of a "New Octahedral" spectroscopic signature. Although the Fe3+ oxidation state is maintained during the discharge to 1.5 V, the surrounding charge distribution changes significantly. This change occurs because discharging to such low voltages forms Jahn-Teller active Mn3+ ions in the material. The resulting structural distortions from these neighboring Mn3+ ions alter the local coordination environment of the Fe3+ ions, causing the Mössbauer spectroscopic signature to shift to the "New Octahedral" phase despite the oxidation state remaining constant. | Must state that the oxidation state remains Fe3+ (same as pristine), but the spectroscopic signature changes due to a change in the surrounding charge distribution/local distortions caused by adjacent Jahn-Teller active Mn3+ ions. |
Review
Oxygen-chemical-potential tuning enables phase-ratio engineering that suppresses Fe migration in high-energy layered cathodes
BNL-NSLS-II-8-ID
Electrochemistry
Bachu Sravan Kumar et al.
DOI: 10.1016/j.nanoen.2026.112146
4 scenarios
▶
#438
Na0.78(Li0.04Mg0.02Fe0.38Mn0.5)O2
Fe L-edge
▶
LLM Prompt
Sample Information
Material: Na0.78(Li0.04Mg0.02Fe0.38Mn0.5)O2
Electrode Type: cathode
Charge Discharge: pristine
Sample-Specific Conditions
- calcination_temperature: 650 °C
- Pristine Na0.78(Li0.04Mg0.02Fe0.38Mn0.5)O2 cathode powder synthesized at 650 °C
Measurement
We plan to measure the Fe L-edge XANES spectrum of this sample.
Questions
Based on all the information above:
1. What is the expected dominant Fe oxidation state in the pristine NLMFM-650 sample, and what candidate reference spectra would be necessary to confirm this via linear combination fitting (LCF)?
2. Explain the physical and thermodynamic reasoning for why the synthesis temperature of 650 °C results in this specific Fe oxidation state in the pristine material.
Ground Truth
Material: Na0.78(Li0.04Mg0.02Fe0.38Mn0.5)O2
Measurement: Fe L-edge ex-situ soft XAS at Beamline 23-ID-2 (IOS)
Fit method: Linear combination fitting (LCF)
Phase fractions:
| Phase | Fraction |
|---|---|
| Fe3+ species | 1.0 |
Fit basis (paper's reference spectra):
- Fe reference spectra (implied Fe3+ and lower valence standards)
Source evidence: Page 9 text ('Pristine NLMFM-650 shows ~Fe3+... oxidation states') and Figure 1c
Key reasoning: The oxidation state of transition metals in these materials is dictated by the oxygen chemical potential (μO2) during synthesis. Lower calcination temperatures (like 650 °C) correspond to a higher μO2, which maintains a higher oxygen stoichiometry and higher transition metal oxidation states. Consequently, the pristine NLMFM-650 sample exhibits a fully oxidized Fe state of ~3+.
Reasoning source: Page 5 (Introduction/Design principles) and Page 7 (Results discussing Fig 1c)
Scoring Rubric (total: 100 pts)
| Q | Type | Max | Question | Reference Answer | Scoring Criteria |
|---|---|---|---|---|---|
| q1 | identification | 43 | What is the expected dominant Fe oxidation state in the pristine NLMFM-650 sample, and what candidate reference spectra would be necessary to confirm this via linear combination fitting (LCF)? | The expected dominant Fe oxidation state in the pristine NLMFM-650 sample is Fe3+, representing a fraction of 1.0. To confirm this via linear combination fitting (LCF), candidate reference spectra must include an Fe3+ standard alongside lower valence Fe standards. This specific oxidation state arises because the material was synthesized at a relatively low calcination temperature of 650 °C. At this lower temperature, the oxygen chemical potential (μO2) during synthesis is higher, which maintains a higher oxygen stoichiometry in the cathode powder. Consequently, this thermodynamic environment stabilizes the transition metals in higher oxidation states, resulting in a fully oxidized Fe3+ state in the pristine material. | Full credit for identifying Fe3+ as the dominant/sole species and mentioning the need for Fe3+ (and potentially lower valence Fe2+) reference spectra for LCF. |
| q2 | reasoning | 57 | Explain the physical and thermodynamic reasoning for why the synthesis temperature of 650 °C results in this specific Fe oxidation state in the pristine material. | The synthesis temperature of 650 °C results in a fully oxidized Fe3+ state (fraction of 1.0) in the pristine Na0.78(Li0.04Mg0.02Fe0.38Mn0.5)O2 cathode. The oxidation state of transition metals in these materials is thermodynamically dictated by the oxygen chemical potential (μO2) during the synthesis process. A lower calcination temperature, such as 650 °C, corresponds to a higher μO2 environment. This higher oxygen chemical potential prevents oxygen loss, maintaining a higher oxygen stoichiometry within the material's structure. As a direct result of this preserved oxygen stoichiometry, the transition metals are maintained at higher oxidation states, yielding the observed ~Fe3+ state in the pristine powder. | Full credit for explaining that lower calcination temperatures correspond to a higher oxygen chemical potential (μO2), which leads to higher oxygen stoichiometry and maintains the transition metals (Fe) in a higher oxidation state (~3+). |
Review
#439
Na0.78(Li0.04Mg0.02Fe0.38Mn0.5)O2
Fe L-edge
▶
LLM Prompt
Sample Information
Material: Na0.78(Li0.04Mg0.02Fe0.38Mn0.5)O2
Electrode Type: cathode
Charge Discharge: pristine
Sample-Specific Conditions
- calcination_temperature: 750 °C
- Pristine Na0.78(Li0.04Mg0.02Fe0.38Mn0.5)O2 cathode powder synthesized at 750 °C
Measurement
We plan to measure the Fe L-edge XANES spectrum of this sample.
Questions
Based on all the information above:
1. What candidate reference spectra are needed to perform linear combination fitting (LCF) on the Fe L-edge XANES spectrum of this sample to determine the transition metal oxidation state?
2. Based on the synthesis calcination temperature of 750 °C, estimate the relative phase fractions of the Fe oxidation states (Fe3+ vs Fe2+) in this pristine cathode material.
3. Explain the thermodynamic reasoning for why the Fe oxidation state in this material deviates slightly from the nominal 3+ state when synthesized at 750 °C.
Ground Truth
Material: Na0.78(Li0.04Mg0.02Fe0.38Mn0.5)O2
Measurement: Fe L-edge soft XAS, ex-situ, Beamline 23-ID-2 (IOS)
Fit method: Linear combination fitting (LCF)
Phase fractions:
| Phase | Fraction |
|---|---|
| Fe3+ species | 0.98 |
| Fe2+ species | 0.02 |
Fit basis (paper's reference spectra):
- Fe3+ reference spectrum
- Fe2+ reference spectrum
Source evidence: Figure 1c and its caption, page 8
Key reasoning: The calcination temperature dictates the oxygen chemical potential (μO2) in the synthesis environment. As the calcination temperature increases, the entropy of gaseous O2 increases, causing μO2 to decrease. This decrease in μO2 demands O2 release from the solid NaTMO2 to maintain equilibrium, which in turn reduces the oxidation states of the transition metals. At 750 °C, the Fe oxidation state is slightly reduced from the nominal 3+ state to approximately 2.98+, resulting in a dominant Fe3+ fraction with a very minor Fe2+ component.
Reasoning source: Page 7 (text referring to Fig 1c) and Page 15 (Design Principles section)
Scoring Rubric (total: 100 pts)
| Q | Type | Max | Question | Reference Answer | Scoring Criteria |
|---|---|---|---|---|---|
| q1 | identification | 20 | What candidate reference spectra are needed to perform linear combination fitting (LCF) on the Fe L-edge XANES spectrum of this sample to determine the transition metal oxidation state? | To perform linear combination fitting (LCF) on the Fe L-edge XANES spectrum of this pristine Na0.78(Li0.04Mg0.02Fe0.38Mn0.5)O2 cathode, Fe3+ and Fe2+ reference spectra are needed. These specific reference spectra are required because the synthesis calcination temperature of 750 °C dictates the oxygen chemical potential (μO2) in the environment. As the temperature increases, the entropy of gaseous O2 increases, causing μO2 to decrease and demanding O2 release from the solid to maintain equilibrium. This oxygen release slightly reduces the transition metals from their nominal states, meaning the sample will contain a mixture of predominantly Fe3+ with a minor amount of Fe2+. | Full credit for identifying that Fe3+ and Fe2+ reference spectra are required to capture the mixed oxidation state. |
| q2 | quantification | 40 | Based on the synthesis calcination temperature of 750 °C, estimate the relative phase fractions of the Fe oxidation states (Fe3+ vs Fe2+) in this pristine cathode material. | The estimated relative phase fractions for this pristine cathode material are 0.98 (98%) for the Fe3+ species and 0.02 (2%) for the Fe2+ species. These specific values result from the calcination temperature of 750 °C, which lowers the oxygen chemical potential (μO2) in the synthesis environment due to the increased entropy of gaseous O2. To maintain equilibrium, O2 is released from the solid Na0.78(Li0.04Mg0.02Fe0.38Mn0.5)O2, which slightly reduces the Fe oxidation state from the nominal 3+ state to approximately 2.98+. Consequently, the material is dominated by the Fe3+ fraction while containing a very minor 2% Fe2+ component. | Full credit for estimating approximately 98% Fe3+ and 2% Fe2+ (or an average oxidation state of ~2.98+). Partial credit for stating it is overwhelmingly Fe3+ with a slight reduction/trace of Fe2+. |
| q3 | reasoning | 40 | Explain the thermodynamic reasoning for why the Fe oxidation state in this material deviates slightly from the nominal 3+ state when synthesized at 750 °C. | The deviation of the Fe oxidation state from the nominal 3+ state in the pristine Na0.78(Li0.04Mg0.02Fe0.38Mn0.5)O2 cathode is driven by the thermodynamics of the 750 °C calcination temperature. The calcination temperature dictates the oxygen chemical potential (μO2) in the synthesis environment. As the temperature reaches 750 °C, the entropy of gaseous O2 increases, which causes μO2 to decrease. This decrease in μO2 demands O2 release from the solid material to maintain thermodynamic equilibrium. The loss of oxygen forces a slight reduction in the transition metal oxidation states, lowering the average Fe oxidation state to approximately 2.98+ and resulting in a mix of 98% Fe3+ and 2% Fe2+. | Full credit for explaining that the calcination temperature controls the oxygen chemical potential (μO2); higher temperatures lower μO2, driving oxygen release from the lattice and causing a slight reduction of the transition metal (Fe) oxidation state. |
Review
#440
Na0.78(Li0.04Mg0.02Fe0.38Mn0.5)O2
Fe L-edge
▶
LLM Prompt
Sample Information
Material: Na0.78(Li0.04Mg0.02Fe0.38Mn0.5)O2
Electrode Type: cathode
Charge Discharge: pristine
Sample-Specific Conditions
- calcination_temperature: 850 °C
- Pristine Na0.78(Li0.04Mg0.02Fe0.38Mn0.5)O2 cathode powder synthesized at 850 °C
Measurement
We plan to measure the Fe L-edge XANES spectrum of this sample.
Questions
Based on all the information above:
1. Based on the synthesis conditions (calcination at 850 °C), what are the expected Fe oxidation states and their approximate fractions in the pristine Na0.78(Li0.04Mg0.02Fe0.38Mn0.5)O2 cathode?
2. Explain the thermodynamic mechanism by which synthesizing this material at 850 °C leads to the observed mixture of Fe oxidation states, rather than a pure Fe3+ state.
3. If performing linear combination fitting (LCF) on the Fe L-edge XANES spectrum of this pristine sample to quantify the oxidation states, what specific reference spectra basis would be required?
Ground Truth
Material: Na0.78(Li0.04Mg0.02Fe0.38Mn0.5)O2
Measurement: Ex-situ Fe L-edge soft XAS at Beamline 23-ID-2 (IOS)
Fit method: Linear combination fitting (LCF)
Phase fractions:
| Phase | Fraction |
|---|---|
| Fe3+ species | 0.95 |
| Fe2+ species | 0.05 |
Fit basis (paper's reference spectra):
- Fe3+ reference spectrum
- Fe2+ reference spectrum
Source evidence: Figure 1c and text on page 7
Key reasoning: The calcination temperature dictates the oxygen chemical potential (μO2) in the synthesis environment. As the calcination temperature increases to 850 °C, the μO2 decreases due to the increased entropy of gaseous O2. This decrease in μO2 drives oxygen release from the solid oxide to maintain equilibrium between the phases. The loss of oxygen stoichiometry necessitates a reduction in the transition metal oxidation states to maintain charge neutrality, resulting in a slight reduction of Fe from its nominal 3+ state to an average oxidation state of ~2.95 (a mixture of predominantly Fe3+ with a small fraction of Fe2+).
Reasoning source: Page 7 (Design and synthesis section) and Page 15 (Design Principles section)
Scoring Rubric (total: 100 pts)
| Q | Type | Max | Question | Reference Answer | Scoring Criteria |
|---|---|---|---|---|---|
| q1 | quantification | 30 | Based on the synthesis conditions (calcination at 850 °C), what are the expected Fe oxidation states and their approximate fractions in the pristine Na0.78(Li0.04Mg0.02Fe0.38Mn0.5)O2 cathode? | The expected Fe oxidation states in the pristine Na0.78(Li0.04Mg0.02Fe0.38Mn0.5)O2 cathode are predominantly Fe3+ with a small fraction of Fe2+. Specifically, the approximate fractions are 0.95 for Fe3+ species and 0.05 for Fe2+ species, yielding an average Fe oxidation state of ~2.95. These specific values result from the calcination temperature of 850 °C, which decreases the oxygen chemical potential (μO2) in the synthesis environment due to the increased entropy of gaseous O2. This decrease drives oxygen release from the solid oxide to maintain equilibrium, and the resulting loss of oxygen stoichiometry necessitates a slight reduction of Fe from its nominal 3+ state to maintain charge neutrality. | Full credit for identifying a mixture of predominantly Fe3+ (~95%) and a small amount of Fe2+ (~5%), corresponding to an average oxidation state of ~2.95. |
| q2 | reasoning | 40 | Explain the thermodynamic mechanism by which synthesizing this material at 850 °C leads to the observed mixture of Fe oxidation states, rather than a pure Fe3+ state. | Synthesizing the pristine Na0.78(Li0.04Mg0.02Fe0.38Mn0.5)O2 cathode at 850 °C dictates the oxygen chemical potential (μO2) in the synthesis environment. As the calcination temperature increases to 850 °C, the μO2 decreases due to the increased entropy of gaseous O2. This thermodynamic shift drives oxygen release from the solid oxide to maintain equilibrium between the phases. Consequently, this loss of oxygen stoichiometry necessitates a reduction in the transition metal oxidation states to maintain charge neutrality. This mechanism results in a slight reduction of Fe from its nominal 3+ state to an average oxidation state of ~2.95, yielding a mixture of 95% Fe3+ and 5% Fe2+ rather than a pure Fe3+ state. | Full credit for explaining that higher calcination temperatures lower the oxygen chemical potential (μO2), which drives oxygen release from the solid lattice. This oxygen loss forces a compensatory reduction in the transition metal oxidation states (Fe3+ to Fe2+) to maintain charge neutrality. |
| q3 | identification | 30 | If performing linear combination fitting (LCF) on the Fe L-edge XANES spectrum of this pristine sample to quantify the oxidation states, what specific reference spectra basis would be required? | To perform linear combination fitting (LCF) on the Fe L-edge XANES spectrum of this pristine sample, a basis consisting of an Fe3+ reference spectrum and an Fe2+ reference spectrum is required. These specific reference phases are expected because the calcination temperature of 850 °C decreases the oxygen chemical potential (μO2) due to the increased entropy of gaseous O2. This decrease drives oxygen release from the solid oxide to maintain equilibrium, causing a loss of oxygen stoichiometry in the Na0.78(Li0.04Mg0.02Fe0.38Mn0.5)O2 material. To maintain charge neutrality, the transition metals undergo a slight reduction from the nominal Fe3+ state, resulting in a mixture of predominantly Fe3+ (0.95 fraction) and a small amount of Fe2+ (0.05 fraction) that must be accounted for in the fit. | Full credit for stating that both Fe3+ and Fe2+ reference spectra are required to capture the mixed oxidation state induced by the high-temperature synthesis. |
Review
#441
Na0.78(Li0.04Mg0.02Fe0.38Mn0.5)O2
Fe L-edge
▶
LLM Prompt
Sample Information
Material: Na0.78(Li0.04Mg0.02Fe0.38Mn0.5)O2
Electrode Type: cathode
Charge Discharge: pristine
Sample-Specific Conditions
- calcination_temperature: 950 °C
- Pristine Na0.78(Li0.04Mg0.02Fe0.38Mn0.5)O2 cathode powder synthesized at 950 °C
Measurement
We plan to measure the Fe L-edge XANES spectrum of this sample.
Questions
Based on all the information above:
1. Based on the synthesis temperature of 950 °C, what are the expected Fe oxidation states and their approximate fractions in the pristine NLMFM-950 sample?
2. Explain the thermodynamic mechanism that causes the Fe oxidation state in NLMFM-950 to deviate from a pure Fe3+ state during synthesis at 950 °C.
3. If performing linear combination fitting (LCF) on the Fe L-edge XAS spectrum of this pristine sample, what reference states are required to accurately capture the Fe speciation?
Ground Truth
Material: Na0.78(Li0.04Mg0.02Fe0.38Mn0.5)O2
Measurement: Fe L-edge ex-situ soft XAS at Beamline 23-ID-2 (IOS)
Fit method: Linear combination fitting (LCF)
Phase fractions:
| Phase | Fraction |
|---|---|
| Fe3+ species | 0.9 |
| Fe2+ species | 0.1 |
Fit basis (paper's reference spectra):
- Fe3+ reference spectrum
- Fe2+ reference spectrum
Source evidence: Page 9 text ('Fe2.9+'), Figure 1c, and Figure 1 caption
Key reasoning: The oxidation state of Fe decreases to ~2.9+ (indicating a mix of ~90% Fe3+ and ~10% Fe2+) when synthesized at the higher temperature of 950 °C. This occurs because higher calcination temperatures lower the oxygen chemical potential (μO2) due to the increased entropy of gaseous O2. To maintain equilibrium, O2 is released from the solid oxide, which forces the reduction of the transition metals (Fe and Mn) to lower oxidation states compared to samples synthesized at lower temperatures.
Reasoning source: Pages 5, 7, and 15 (Design Principles section)
Scoring Rubric (total: 100 pts)
| Q | Type | Max | Question | Reference Answer | Scoring Criteria |
|---|---|---|---|---|---|
| q1 | quantification | 30 | Based on the synthesis temperature of 950 °C, what are the expected Fe oxidation states and their approximate fractions in the pristine NLMFM-950 sample? | In the pristine Na0.78(Li0.04Mg0.02Fe0.38Mn0.5)O2 cathode synthesized at 950 °C, the expected Fe oxidation states are approximately 90% Fe3+ and 10% Fe2+, yielding an average oxidation state of ~2.9+. These specific fractions arise because the high calcination temperature of 950 °C lowers the oxygen chemical potential due to the increased entropy of gaseous O2. To maintain thermodynamic equilibrium under these conditions, oxygen is released from the solid oxide lattice. This oxygen loss forces the partial reduction of the transition metals, specifically reducing a portion of the iron to Fe2+ compared to what would be expected at lower synthesis temperatures. | The response must identify a mixture of Fe3+ and Fe2+, specifically noting an average oxidation state of ~2.9+ or approximately 90% Fe3+ and 10% Fe2+. |
| q2 | reasoning | 40 | Explain the thermodynamic mechanism that causes the Fe oxidation state in NLMFM-950 to deviate from a pure Fe3+ state during synthesis at 950 °C. | The deviation from a pure Fe3+ state in the pristine Na0.78(Li0.04Mg0.02Fe0.38Mn0.5)O2 sample is driven by the high calcination temperature of 950 °C. At this elevated temperature, the oxygen chemical potential (μO2) is lowered due to the increased entropy of gaseous O2. To maintain thermodynamic equilibrium, the solid oxide must release O2 gas. This release of oxygen forces the reduction of the transition metals within the material, resulting in the partial reduction of iron to an average oxidation state of ~2.9+ (a mix of ~90% Fe3+ and ~10% Fe2+). | The response must explain that higher calcination temperatures decrease the oxygen chemical potential (μO2), driving O2 release from the solid to maintain equilibrium, which consequently reduces the transition metal oxidation states. |
| q3 | identification | 30 | If performing linear combination fitting (LCF) on the Fe L-edge XAS spectrum of this pristine sample, what reference states are required to accurately capture the Fe speciation? | To accurately capture the Fe speciation in the pristine Na0.78(Li0.04Mg0.02Fe0.38Mn0.5)O2 sample using linear combination fitting (LCF), both Fe3+ and Fe2+ reference spectra are required. These specific reference states are necessary because the high synthesis temperature of 950 °C lowers the oxygen chemical potential through the increased entropy of gaseous O2. Consequently, oxygen is released from the solid oxide to maintain equilibrium, which forces a partial reduction of the transition metals. This thermodynamic mechanism results in an average Fe oxidation state of ~2.9+, meaning the sample contains a mixture of predominantly Fe3+ (~90%) alongside a minor Fe2+ (~10%) component. | The response must state that both Fe3+ and Fe2+ reference spectra are needed to fit the data. |
Review
Silver clusters shape determination from in-situ XANES data
BNL-NSLS-II-8-ID
Synthesis
Janis Timoshenko et al.
DOI: 10.1016/j.radphyschem.2018.11.003
3 scenarios
▶
#442
Ag
Ag K
▶
LLM Prompt
Sample Information
Material: Ag
Method: commercial
Sample-Specific Conditions
- Reference material: Bulk
- Bulk silver reference foil
Preparation
- Commercial reference foil
Measurement
We plan to measure the Ag K XANES spectrum of this sample.
Questions
Based on all the information above:
1. Describe the distinguishing features in the Ag K-edge XANES spectrum of bulk silver foil compared to highly dispersed sub-nanometer silver clusters.
2. To construct a theoretical basis for analyzing the size-dependent XANES features of silver from bulk down to nanoclusters, what types of structural models should be included in the reference set?
Ground Truth
Material: Ag
Measurement: Ag K-edge XANES
Fit method: NN-XANES
Phase fractions:
| Phase | Fraction |
|---|---|
| Ag (bulk FCC) | 1.0 |
Fit basis (paper's reference spectra):
- Theoretical spectra calculated with FEFF and FDMNES for bulk Ag
- Theoretical spectra for cuboctahedral Ag clusters (13, 55, 147, and 309 atoms)
Source evidence: Figure 1, Figure 3, Table 1
Key reasoning: The Ag foil is used as a bulk FCC reference material to establish baseline structural parameters and spectral shape. Its XANES spectrum exhibits pronounced fine structure oscillations characteristic of extended crystalline lattices, which dampen in smaller clusters. Structural analysis yields coordination numbers (C1=11.24, C2=5.7, C3=22.1) and an interatomic distance (2.883 Å) that closely match the expected values for ideal FCC bulk silver (C1=12, C2=6, C3=24, R=2.889 Å).
Reasoning source: Section 4. Results and discussion, Table 1
Scoring Rubric (total: 100 pts)
| Q | Type | Max | Question | Reference Answer | Scoring Criteria |
|---|---|---|---|---|---|
| q2 | spectral | 57 | Describe the distinguishing features in the Ag K-edge XANES spectrum of bulk silver foil compared to highly dispersed sub-nanometer silver clusters. | The Ag K-edge XANES spectrum of the bulk silver foil exhibits pronounced fine structure oscillations with higher amplitudes and distinct higher-shell coordination features. In contrast, sub-nanometer Ag clusters display much smoother spectra. These distinct features arise because the sample is a commercial bulk silver reference foil, which possesses an extended crystalline FCC lattice. This extended structure provides high coordination numbers (C1=11.24, C2=5.7, C3=22.1) and a well-defined interatomic distance (2.883 Å) that closely match ideal FCC bulk silver. Consequently, the extended crystalline lattice produces strong spectral oscillations, whereas the lack of long-range order in smaller clusters causes these features to dampen due to size effects. | Full credit for mentioning that the bulk foil exhibits more pronounced fine structure oscillations and distinct higher-shell features, whereas sub-nanometer clusters have smoother spectra due to size effects. |
| q3 | reasoning | 43 | To construct a theoretical basis for analyzing the size-dependent XANES features of silver from bulk down to nanoclusters, what types of structural models should be included in the reference set? | To construct a theoretical basis for analyzing size-dependent XANES features, the reference set should include theoretical spectra calculated for bulk Ag alongside cuboctahedral Ag clusters of 13, 55, 147, and 309 atoms. This basis is necessary because the commercial bulk silver foil serves as the baseline reference (1.0 fraction) for an ideal extended FCC crystalline lattice. The bulk model accounts for the pronounced fine structure oscillations and high coordination numbers (C1=11.24, C2=5.7, C3=22.1) characteristic of the bulk foil. Meanwhile, the inclusion of the specific cuboctahedral cluster models allows the NN-XANES fit method to accurately track how these distinct higher-shell features dampen as the material transitions from an extended lattice down to sub-nanometer dimensions. | Full credit for identifying that the basis should include theoretical spectra for bulk Ag as well as various sizes of Ag clusters (e.g., cuboctahedral clusters with varying atom counts like 13, 55, 147, 309). |
Review
#443
Ag clusters on DNA
Ag K
▶
LLM Prompt
Sample Information
Material: Ag clusters on DNA
Method: DNA templated synthesis
Sample-Specific Conditions
- Cluster size: 11-13 atoms
- Sub-nanometer Ag cluster sample prepared by DNA assisted synthesis
Preparation
- Prepared by DNA assisted synthesis containing Ag clusters with 11-13 atoms.
Measurement
We plan to measure the Ag K XANES spectrum of this sample.
Questions
Based on all the information above:
1. Based on the synthesis conditions yielding 11-13 atom clusters, what specific structural model best represents the dominant phase in this sample, and what physical parameters derived from the spectrum justify this assignment?
2. Describe the expected spectral shape of the Ag K-edge XANES for this sub-nanometer cluster sample and how it visually differs from the spectrum of bulk Ag foil.
3. To accurately model and determine the structure of these sub-nanometer clusters from XANES data, what type of reference spectra or basis functions must be utilized?
Ground Truth
Material: Ag clusters on DNA
Measurement: Ag K-edge XANES at X18A beamline at NSLS
Fit method: NN-XANES
Phase fractions:
| Phase | Fraction |
|---|---|
| Ag (cuboctahedral, 13 atoms) | 1.0 |
Fit basis (paper's reference spectra):
- Theoretical XANES spectra for Ag nanoparticles of different sizes and shapes (close-packed and icosahedral structures)
Source evidence: Table 1 and Figure 3, page 5
Key reasoning: The sample consists of sub-nanometer clusters with 11-13 atoms. Analysis of the XANES data yields significantly reduced coordination numbers (C1=5.3, C2=1.4, C3=8) and a slightly shortened interatomic distance (2.86 Å) compared to bulk Ag. These structural parameters best match a cuboctahedral model with 13 atoms.
Reasoning source: Section 4. Results and discussion, page 5
Scoring Rubric (total: 100 pts)
| Q | Type | Max | Question | Reference Answer | Scoring Criteria |
|---|---|---|---|---|---|
| q1 | reasoning | 40 | Based on the synthesis conditions yielding 11-13 atom clusters, what specific structural model best represents the dominant phase in this sample, and what physical parameters derived from the spectrum justify this assignment? | The dominant phase in this sample is best represented by a 13-atom cuboctahedral Ag model, which accounts for a 1.0 fraction of the sample. This specific structural model is expected because the DNA-templated synthesis restricts the growth of the silver, yielding sub-nanometer clusters containing only 11-13 atoms. Analysis of the XANES data justifies this assignment by revealing significantly reduced coordination numbers (C1=5.3, C2=1.4, C3=8) and a slightly shortened interatomic distance (2.86 Å) compared to bulk silver. These derived physical parameters perfectly match the geometry of a 13-atom cuboctahedral cluster, confirming the structural outcome of the synthesis conditions. | 20 points for identifying the 13-atom cuboctahedral model. 20 points for explaining that the spectrum reflects significantly reduced coordination numbers (e.g., first shell CN ~5.3) consistent with this small cluster size. |
| q2 | spectral | 30 | Describe the expected spectral shape of the Ag K-edge XANES for this sub-nanometer cluster sample and how it visually differs from the spectrum of bulk Ag foil. | The Ag K-edge XANES spectrum for this sample exhibits a broad, smooth profile that lacks the sharp fine structure features typically seen in bulk materials. Visually, it is distinguished from a bulk Ag foil spectrum by the absence of pronounced oscillations and a much smoother overall shape. These spectral features directly result from the sample conditions, specifically the DNA-assisted synthesis that restricts the cluster size to sub-nanometer dimensions of 11-13 atoms. Because these ultra-small clusters possess very low coordination numbers compared to bulk silver, the scattering pathways that normally produce sharp spectral oscillations are significantly diminished, leading to the observed smooth profile. | 15 points for describing a broad, smooth spectral profile. 15 points for noting the absence of sharp fine structure or pronounced oscillations that are typically seen in bulk Ag. |
| q3 | identification | 30 | To accurately model and determine the structure of these sub-nanometer clusters from XANES data, what type of reference spectra or basis functions must be utilized? | To accurately model this sample, the fit basis must utilize theoretical XANES spectra calculated for Ag nanoparticles of various sizes and shapes, specifically including close-packed and icosahedral structures. This choice of reference spectra is necessary because the DNA-templated synthesis produces sub-nanometer clusters restricted to 11-13 atoms, which lack bulk-like periodic properties. Since these ultra-small clusters exhibit significantly reduced coordination numbers and shortened interatomic distances, standard bulk reference foils cannot accurately represent their structure. Therefore, theoretical models of discrete nanoparticle geometries are required to capture the unique structural state of the sample and successfully identify the 13-atom cuboctahedral phase. | 30 points for stating the need for theoretical/ab-initio XANES spectra calculated for Ag nanoparticles of various small sizes and specific shapes (e.g., close-packed, icosahedral). |
Review
#444
Ag clusters in RTIL
Ag K
▶
LLM Prompt
Sample Information
Material: Ag clusters in RTIL
Method: supersonic expansion and deposition
Temperature C: -23.15
Sample-Specific Conditions
- Aggregation state: Separated (250 K)
- Ag clusters deposited into ionic liquid, measured at 250 K to prevent aggregation
Preparation
- Ag clusters with sizes 2.0±0.6 nm were produced in a supersonic expansion process and deposited into ionic liquid. The sample with ≈ 1 ppm Ag clusters in RTIL was filled into a liquid sample holder. Measured at 250 K.
Measurement
We plan to measure the Ag K XANES spectrum of this sample.
Questions
Based on all the information above:
1. Based on the synthesis conditions (Ag clusters deposited in RTIL and kept at 250 K to prevent aggregation), what structural model best describes the dominant phase, and what is the physical reasoning for this assignment?
2. Describe the expected spectral shape of the Ag K-edge XANES for these separated Ag clusters. How does it distinguish itself from the spectra of bulk Ag foil and sub-nanometer Ag clusters?
3. To model the XANES data and extract structural information (such as shape and size) for these Ag clusters, what type of candidate reference spectra or basis functions would be necessary?
Ground Truth
Material: Ag clusters in RTIL
Measurement: Ag K-edge XANES at beamline P64 at DESY
Fit method: NN-XANES
Phase fractions:
| Phase | Fraction |
|---|---|
| Ag (truncated octahedral, 79 atoms) | 1.0 |
Fit basis (paper's reference spectra):
- Simulated XANES spectra for Ag NPs of different sizes and shapes (close-packed and icosahedral structures)
Source evidence: Table 1 and Figure 3, page 5
Key reasoning: The NN-XANES analysis yielded coordination numbers (C1=8.3, C2=2.8, C3=14) for the separated clusters at 250 K. These values are intermediate between bulk Ag foil and sub-nanometer AgDNA clusters. A representative nanoparticle model matching these coordination numbers is a truncated octahedral particle with 79 atoms, corresponding to a size of ca. 1.2 nm, which is consistent with the expected size of the deposited clusters.
Reasoning source: Section 4. Results and discussion, page 5
Scoring Rubric (total: 100 pts)
| Q | Type | Max | Question | Reference Answer | Scoring Criteria |
|---|---|---|---|---|---|
| q1 | reasoning | 40 | Based on the synthesis conditions (Ag clusters deposited in RTIL and kept at 250 K to prevent aggregation), what structural model best describes the dominant phase, and what is the physical reasoning for this assignment? | The dominant phase is modeled entirely (a fraction of 1.0) as Ag truncated octahedral nanoparticles containing 79 atoms. This specific structural assignment arises because the sample was prepared via supersonic expansion and deposited into RTIL at 250 K to maintain separated, non-aggregated clusters. Under these low-temperature conditions, the clusters retain a finite nanoscale size, which NN-XANES analysis reveals as having intermediate coordination numbers (C1=8.3, C2=2.8, C3=14) between bulk silver and sub-nanometer clusters. A 79-atom truncated octahedron corresponds to a size of approximately 1.2 nm, which perfectly matches the structural properties and coordination environment expected for these separated clusters. | The answer must identify the phase as Ag clusters (specifically matching a truncated octahedral model with ~79 atoms) and explain that this model is consistent with coordination numbers that are intermediate between bulk Ag and sub-nanometer clusters, corresponding to a size of ~1.2-2.0 nm. |
| q2 | spectral | 30 | Describe the expected spectral shape of the Ag K-edge XANES for these separated Ag clusters. How does it distinguish itself from the spectra of bulk Ag foil and sub-nanometer Ag clusters? | The Ag K-edge XANES spectrum for these separated clusters exhibits a main absorption peak followed by broad oscillations, structurally similar to bulk Ag foil. However, because the clusters are deposited in RTIL and kept at 250 K to remain separated at a finite nanoscale size, these post-edge oscillations are noticeably damped compared to bulk silver. Furthermore, the spectrum distinguishes itself from sub-nanometer AgDNA clusters by appearing much more similar to bulk Ag, reflecting the significantly larger size of the clusters (ca. 1.2 to 2.0 nm) maintained by the low-temperature synthesis conditions. Therefore, the specific damped but bulk-like spectral features directly result from the intermediate, non-aggregated size of the Ag nanoparticles preserved at 250 K. | The answer should state that the spectrum is similar to bulk Ag foil but with damped oscillations due to the finite nanoparticle size. It should also note that it is distinguishable from sub-nanometer clusters by having more bulk-like features, indicating a larger size. |
| q3 | reasoning | 30 | To model the XANES data and extract structural information (such as shape and size) for these Ag clusters, what type of candidate reference spectra or basis functions would be necessary? | To accurately model the XANES data for this sample, the necessary basis functions consist of simulated XANES spectra for Ag nanoparticles of various sizes and shapes, specifically including close-packed and icosahedral structures. These specific references are required because the sample conditions (deposition into RTIL and measurement at 250 K) are designed to produce and maintain separated, zero-valent nanoscale clusters rather than a continuous bulk material. Because the low temperature prevents aggregation, standard bulk references are insufficient to capture the finite size effects. Using a library of simulated nanoparticle spectra allows the NN-XANES fitting method to accurately match the intermediate coordination numbers (C1=8.3, C2=2.8, C3=14) produced by these specific synthesis conditions. | The answer must specify that simulated XANES spectra for Ag nanoparticles of various sizes and shapes (e.g., close-packed and icosahedral structures) are needed to serve as a basis. |
Review
Quantitative analysis of Cu XANES spectra using linear combination fitting of binary mixtures simulated by FEFF9
APS
Pure Phase
Srisuda Rojsatien et al.
DOI: 10.1016/j.radphyschem.2022.110548
5 scenarios
▶
#445
CuSe
Cu K-edge
▶
LLM Prompt
Sample Information
Material: CuSe
Crystal Structure: Hexagonal P63/mmc
Measurement Mode: fluorescence
- Experimental XANES standard for CuSe
Measurement
We plan to measure the Cu K-edge XANES spectrum of this sample.
Questions
Based on all the information above:
1. Describe the expected spectral shape of the Cu K-edge XANES spectrum for CuSe, specifically comparing the prominence of features in the near-edge region versus the post-edge region.
2. What distinguishes the Cu K-edge XANES spectrum of CuSe from that of Cu2Te?
3. What is the defined edge position (E0) used for the Cu K-edge XANES analysis of this CuSe standard?
Ground Truth
Compound: CuSe
Oxidation state: not reported
Measurement: Cu K-edge, fluorescence mode, end station 2-ID-D at the Advanced Photon Source
Edge position: 8979
Spectral shape: Spectral features within the 1st range (-5 to 15 eV from E0) are more prominent than the features within the 2nd range (15 to 40 eV from E0).
Labeled peaks:
| Label | Energy (eV) | Intensity | Origin | Source |
|---|---|---|---|---|
| 1st peak | not reported | prominent | not discussed in this paper | paper_data |
Distinguishing features: Features in the 1st range are more prominent than in the 2nd range, distinguishing it from Cu2Te which has significant features across all ranges.
Key reasoning: This sample is an experimental standard of CuSe measured to serve as a reference for linear combination fitting (LCF) of unknown Cu-doped CdTe devices. It represents a pure phase of hexagonal CuSe (P63/mmc space group) to explore selenium incorporation in the anion site.
Reasoning source: Section 2.1 (page 7) and Section 2.3 (page 9)
Scoring Rubric (total: 100 pts)
| Q | Type | Max | Question | Reference Answer | Scoring Criteria |
|---|---|---|---|---|---|
| q1 | spectral | 35 | Describe the expected spectral shape of the Cu K-edge XANES spectrum for CuSe, specifically comparing the prominence of features in the near-edge region versus the post-edge region. | The Cu K-edge XANES spectrum for CuSe exhibits more prominent spectral features in the near-edge region (-5 to 15 eV from E0) compared to the post-edge region (15 to 40 eV from E0), along with a prominent first peak. These specific spectral features arise because the sample is a pure phase experimental standard of hexagonal CuSe with a P63/mmc space group. The distinct local coordination environment of copper, specifically with selenium incorporated in the anion site, dictates these electronic transitions and the resulting spectral shape. This pure standard is measured in fluorescence mode to serve as a reliable reference for linear combination fitting of unknown Cu-doped CdTe devices. | Full points if the answer states that spectral features in the 1st range (-5 to 15 eV from E0) are more prominent than features in the 2nd range (15 to 40 eV from E0). |
| q2 | spectral | 35 | What distinguishes the Cu K-edge XANES spectrum of CuSe from that of Cu2Te? | The Cu K-edge XANES spectrum of CuSe is distinguished from Cu2Te by having more prominent features in the first range (-5 to 15 eV from E0) than in the second range (15 to 40 eV from E0), whereas Cu2Te exhibits significant features across all ranges. This spectral difference arises because the CuSe sample is a pure hexagonal phase (P63/mmc space group) representing selenium incorporation in the anion site. The unique local structural and electronic environment of copper bonded to selenium dictates this specific absorption profile. As an experimental standard measured in fluorescence mode, these distinct features allow CuSe to serve as a reliable reference for linear combination fitting of unknown Cu-doped CdTe devices. | Full points if the answer notes that CuSe has more prominent features in the 1st range compared to the 2nd range, whereas Cu2Te has significant features across all ranges. |
| q3 | identification | 30 | What is the defined edge position (E0) used for the Cu K-edge XANES analysis of this CuSe standard? | The defined edge position (E0) used for the Cu K-edge XANES analysis of this CuSe standard is 8979 eV. This specific edge position is characteristic of the pure phase of hexagonal CuSe (P63/mmc space group) being analyzed. The 8979 eV value arises directly from the electronic binding energy of copper when selenium is incorporated into the anion site of this specific crystal structure. Establishing this exact edge position in fluorescence mode is essential because the sample serves as an experimental standard for linear combination fitting (LCF) of unknown Cu-doped CdTe devices. | Full points if the answer correctly identifies 8979 eV as the edge position. |
Review
#446
Cu2Se
Cu K-edge
▶
LLM Prompt
Sample Information
Material: Cu2Se
Crystal Structure: Trigonal R-3m
- Experimental XANES standard for Cu2Se from Wright et al. (2016)
Measurement
We plan to measure the Cu K-edge XANES spectrum of this sample.
Questions
Based on all the information above:
1. Describe the relative prominence of spectral features in the near-edge region versus the post-edge region for the Cu2Se XANES spectrum.
2. When comparing the Cu2Se XANES spectrum to other copper chalcogenides like CuSe and Cu2Te, which phase exhibits a highly similar spectrum and which exhibits a significantly different spectrum?
3. What is the specific energy value assigned to the edge position (E0) for this Cu K-edge spectrum?
Ground Truth
Compound: Cu2Se
Oxidation state: not reported
Measurement: Cu K-edge XANES (experimental standard taken from Wright et al., 2016)
Edge position: 8979
Spectral shape: The spectrum has features within the 1st range (-5 to 15 eV from E0) that are more prominent than the features within the 2nd range (15 to 40 eV from E0).
Labeled peaks:
| Label | Energy (eV) | Intensity | Origin | Source |
|---|---|---|---|---|
| 1st peak | not reported (located in the 1st range, -5 to 15 eV from E0) | prominent | not discussed in this paper | paper_data |
Distinguishing features: The spectral difference between Cu2Se and CuSe is relatively small (Δ = 0.0068), while the difference between Cu2Se and Cu2Te is relatively big (Δ = 0.0404).
Key reasoning: This is an experimental standard for Cu2Se used as a reference spectrum for linear combination fitting. It exhibits prominent features in the 1st range (-5 to 15 eV from E0) compared to the 2nd range (15 to 40 eV from E0). Its spectral difference with CuSe is relatively small, while its difference with Cu2Te is relatively large.
Reasoning source: Section 2.3 (Experimentally Measured Cu K-edge XANES Spectra) and Section 4 (LCF using simulated XANES standards)
Scoring Rubric (total: 100 pts)
| Q | Type | Max | Question | Reference Answer | Scoring Criteria |
|---|---|---|---|---|---|
| q1 | spectral | 35 | Describe the relative prominence of spectral features in the near-edge region versus the post-edge region for the Cu2Se XANES spectrum. | In the Cu K-edge XANES spectrum of Cu2Se, the features in the near-edge region (the 1st range, -5 to 15 eV from E0) are significantly more prominent than those in the post-edge region (the 2nd range, 15 to 40 eV from E0). This spectral shape arises directly from the sample being a pure trigonal R-3m Cu2Se phase, where its specific crystal structure dictates the prominent 1st peak. Because this measurement is an experimental standard used as a reference spectrum for linear combination fitting, these prominent near-edge features act as the primary structural fingerprint for identifying the material. | Full credit if the answer states that the features in the 1st range (near-edge, -5 to 15 eV from E0) are more prominent than the features in the 2nd range (post-edge, 15 to 40 eV from E0). |
| q2 | spectral | 40 | When comparing the Cu2Se XANES spectrum to other copper chalcogenides like CuSe and Cu2Te, which phase exhibits a highly similar spectrum and which exhibits a significantly different spectrum? | The Cu2Se XANES spectrum is highly similar to that of CuSe, exhibiting a relatively small spectral difference (Δ = 0.0068), while it is significantly different from Cu2Te, which shows a relatively large spectral difference (Δ = 0.0404). This relationship occurs because the sample is a pure trigonal R-3m Cu2Se experimental standard, meaning its structural and electronic properties are much closer to CuSe than to Cu2Te. As a result, when using this standard as a reference spectrum for linear combination fitting, distinguishing it from CuSe relies heavily on the prominent features in the 1st range, whereas differentiating it from Cu2Te is much easier. | Full credit if the answer correctly identifies that Cu2Se has a relatively small spectral difference (high similarity) with CuSe, and a relatively big spectral difference with Cu2Te. |
| q3 | spectral | 25 | What is the specific energy value assigned to the edge position (E0) for this Cu K-edge spectrum? | The specific energy value assigned to the edge position (E0) for this Cu K-edge spectrum is 8979 eV. This specific edge position results from the intrinsic electronic properties of copper within the trigonal R-3m crystal structure of the pure Cu2Se sample. Because this measurement is an experimental standard from Wright et al. (2016) used for linear combination fitting, establishing this exact E0 is essential for properly defining the 1st range (-5 to 15 eV) and 2nd range (15 to 40 eV) where its prominent spectral features are located. | Full credit if the answer explicitly states 8979 eV. |
Review
#447
Cu2Te
Cu K-edge
▶
LLM Prompt
Sample Information
Material: Cu2Te
Crystal Structure: Hexagonal P6/mmm
- Experimental XANES standard for Cu2Te from Liu et al. (2003)
Measurement
We plan to measure the Cu K-edge XANES spectrum of this sample.
Questions
Based on all the information above:
1. What is the expected edge position (E0) for the Cu K-edge XANES spectrum of this sample as defined in the study?
2. Describe the expected spectral shape of the Cu2Te standard and what distinguishes it from other copper chalcogenides such as CuSe and Cu2Se.
3. Why is the Cu2Te standard particularly useful for differentiating phases in linear combination fitting compared to other copper chalcogenides?
Ground Truth
Compound: Cu2Te
Oxidation state: not reported
Measurement: Cu K-edge
Edge position: 8979
Spectral shape: Has significant absorption features across the entire energy window (-5 to 40 eV from E0).
Labeled peaks:
| Label | Energy (eV) | Intensity | Origin | Source |
|---|---|---|---|---|
| 1st peak | not reported | not reported | not discussed in this paper | paper_data |
Distinguishing features: Has significant features at all ranges (from -5 to 40 eV of E0), distinguishing it from CuSe and Cu2Se.
Key reasoning: The experimental standard for Cu2Te was taken from Liu et al. (2003) and used as a reference for linear combination fitting. It exhibits significant absorption features across the entire energy window (-5 to 40 eV from E0), which distinguishes it from other phases like CuSe and Cu2Se.
Reasoning source: Section 2.3, page 8; Section 6, page 19
Scoring Rubric (total: 100 pts)
| Q | Type | Max | Question | Reference Answer | Scoring Criteria |
|---|---|---|---|---|---|
| q1 | spectral | 20 | What is the expected edge position (E0) for the Cu K-edge XANES spectrum of this sample as defined in the study? | The expected edge position (E0) for the Cu K-edge XANES spectrum of this sample is 8979 eV. This specific energy value arises because the sample is a pure Cu2Te phase (fraction of 1.0) with a hexagonal P6/mmm crystal structure. As an experimental standard taken from Liu et al. (2003), its edge position directly reflects the unique electronic environment and binding energy of copper bonded to tellurium in this specific crystallographic arrangement. | Full score if the answer correctly identifies 8979 eV as the edge position. |
| q2 | spectral | 40 | Describe the expected spectral shape of the Cu2Te standard and what distinguishes it from other copper chalcogenides such as CuSe and Cu2Se. | The Cu K-edge XANES spectrum of the Cu2Te standard is characterized by significant absorption features across the entire energy window, spanning from -5 to 40 eV relative to E0. These prominent features across all ranges are what distinguish it from other copper chalcogenides like CuSe and Cu2Se. This distinct spectral shape arises directly from the sample being a pure Cu2Te phase (1.0 fraction) with a hexagonal P6/mmm crystal structure. The unique structural and electronic environment of copper bonded to tellurium in this specific lattice produces these broad absorption characteristics, allowing it to serve as a distinct experimental standard. | Full score if the answer mentions that Cu2Te has significant absorption features across the entire energy window (or specifically from -5 to 40 eV from E0), which distinguishes it from CuSe and Cu2Se. |
| q3 | reasoning | 40 | Why is the Cu2Te standard particularly useful for differentiating phases in linear combination fitting compared to other copper chalcogenides? | The Cu2Te standard is particularly useful for linear combination fitting because it exhibits significant absorption features across the entire energy window (-5 to 40 eV from E0). These prominent features at all ranges clearly distinguish it from other copper chalcogenide phases like CuSe and Cu2Se. This distinctiveness arises because the sample is a pure reference phase (1.0 fraction) with a specific hexagonal P6/mmm crystal structure. The unique electronic and structural environment of the Cu-Te bonds in this lattice generates these characteristic spectral features, making it an ideal experimental standard for accurately differentiating phases during fitting. | Full score if the answer explains that its significant features across all ranges (-5 to 40 eV) provide a larger spectral difference compared to other phases, allowing for more accurate differentiation in fitting. |
Review
#448
CuTe
Cu K-edge
▶
LLM Prompt
Sample Information
Material: CuTe
Crystal Structure: Orthorhombic Pmmn
- Simulated XANES standard for CuTe
Measurement
We plan to measure the Cu K-edge XANES spectrum of this sample.
Questions
Based on all the information above:
1. Based on the provided sample information for the CuTe standard, describe its expected spectral shape at the Cu K-edge, particularly how it visually contrasts with more Cu-rich phases like Cu2Te and Cu1.43Te.
2. What is the reference edge position (E0) used for aligning this Cu K-edge XANES spectrum, and what is the crystal structure of this specific CuTe phase?
Ground Truth
Compound: CuTe
Oxidation state: not reported
Measurement: Cu K-edge XANES (simulated)
Edge position: 8979
Spectral shape: The simulated Cu K-edge XANES spectrum of CuTe exhibits a relatively low absorption intensity in the near-edge region (8980-8990 eV) compared to Cu2Te and Cu1.43Te. It displays a broad, low-intensity profile that lacks a sharp, prominent white line.
Distinguishing features: CuTe is clearly distinguishable from other Cu-Te phases (like Cu2Te and Cu1.43Te) because it completely lacks the prominent, sharp first peak around 8985-8990 eV that is characteristic of the more Cu-rich phases.
Key reasoning: This sample represents a pure phase simulated standard of CuTe, meaning its phase fraction is intrinsically 1.0. It was generated based on the orthorhombic Pmmn crystal structure to serve as a candidate reference spectrum for linear combination fitting (LCF) of experimental data from Cu-doped CdTe devices. In the specific case study presented in the paper, LCF revealed that the actual weight of this CuTe phase in the operational device was zero, indicating it did not form or persist in the measured region.
Reasoning source: Section 2.1 (Methods) and Section 6 (A case study)
Scoring Rubric (total: 100 pts)
| Q | Type | Max | Question | Reference Answer | Scoring Criteria |
|---|---|---|---|---|---|
| q1 | spectral | 67 | Based on the provided sample information for the CuTe standard, describe its expected spectral shape at the Cu K-edge, particularly how it visually contrasts with more Cu-rich phases like Cu2Te and Cu1.43Te. | The simulated Cu K-edge XANES spectrum of CuTe exhibits a broad, low-intensity profile in the near-edge region (8980-8990 eV) and lacks a sharp, prominent white line. It visually contrasts with more Cu-rich phases like Cu2Te and Cu1.43Te by completely lacking the prominent, sharp first peak around 8985-8990 eV that is characteristic of those materials. These distinct spectral features arise directly from the sample conditions, specifically its pure orthorhombic Pmmn crystal structure. Because it is a simulated standard based on this exact structural model, its unique electronic and structural properties produce this specific low-intensity absorption profile, allowing it to serve as a distinguishable candidate reference spectrum for linear combination fitting of Cu-doped CdTe devices. | Full points if the answer notes the low absorption intensity in the near-edge region and explicitly mentions the lack of a sharp, prominent first peak (white line) compared to Cu2Te/Cu1.43Te. |
| q3 | identification | 33 | What is the reference edge position (E0) used for aligning this Cu K-edge XANES spectrum, and what is the crystal structure of this specific CuTe phase? | The reference edge position (E0) for this Cu K-edge XANES spectrum is 8979 eV, and the crystal structure of this specific CuTe phase is orthorhombic Pmmn. This specific crystal structure and edge position are expected because the sample is a pure phase simulated standard of CuTe (phase fraction of 1.0) generated explicitly from the orthorhombic Pmmn structural model. This simulation was performed to create a candidate reference spectrum for linear combination fitting (LCF) of experimental data from Cu-doped CdTe devices. Although this standard was generated to test for the presence of this phase, LCF revealed that the actual weight of this orthorhombic CuTe phase in the operational device was zero, indicating it did not form or persist under those specific device conditions. | Full points if the answer correctly identifies E0 as 8979 eV and the structure as Orthorhombic Pmmn. |
Review
#449
Cu1.43Te
Cu K-edge
▶
LLM Prompt
Sample Information
Material: Cu1.43Te
Crystal Structure: Orthorhombic Pmmn
- Simulated XANES standard for substoichiometric Cu1.43Te
Measurement
We plan to measure the Cu K-edge XANES spectrum of this sample.
Questions
Based on all the information above:
1. Why might one need to rely on a simulated XANES standard for a substoichiometric phase like Cu1.43Te rather than an experimentally measured standard?
2. In the context of linear combination fitting, how does the Cu1.43Te spectrum compare to the Cu2Te spectrum, and is the difference sufficient for differentiation?
Ground Truth
Compound: Cu1.43Te
Oxidation state: not reported
Measurement: Simulated XANES standard (FEFF9)
Edge position: 8979
Spectral shape: The simulated spectrum is shown in Figure 5. It exhibits a distinct shape compared to Cu2Te and CuTe, allowing it to be used in linear combination fitting.
Distinguishing features: The spectral difference (Δ) between Cu2Te and Cu1.43Te is 0.0164, which is large enough to allow LCF to differentiate between the two phases.
Key reasoning: Cu1.43Te was simulated as a standard because experimental standards for substoichiometric CuxTe phases cannot be readily obtained. The simulation used an orthorhombic Pmmn structure (ICDD no. 53355) with a 9x9x6 supercell, randomly removing atoms at partially occupied sites to achieve the correct stoichiometry.
Reasoning source: Section 2.1 (XANES simulations), page 7-8; Section 6 (A case study), page 19
Scoring Rubric (total: 100 pts)
| Q | Type | Max | Question | Reference Answer | Scoring Criteria |
|---|---|---|---|---|---|
| q1 | reasoning | 46 | Why might one need to rely on a simulated XANES standard for a substoichiometric phase like Cu1.43Te rather than an experimentally measured standard? | One must rely on a simulated XANES standard because pure experimental standards for substoichiometric CuxTe phases like Cu1.43Te cannot be readily obtained. Given the specific substoichiometric composition of Cu1.43Te, isolating a pure physical sample for measurement is experimentally difficult. Therefore, a theoretical approach using FEFF9 is required to generate the 100% pure standard (fraction of 1.0). This is achieved by taking the orthorhombic Pmmn crystal structure in a 9x9x6 supercell and randomly removing atoms at partially occupied sites to exactly match the target Cu1.43Te stoichiometry. | Full credit for explaining that experimental standards for certain substoichiometric or unstable phases (like Cu1.43Te) cannot be readily obtained. |
| q2 | spectral | 54 | In the context of linear combination fitting, how does the Cu1.43Te spectrum compare to the Cu2Te spectrum, and is the difference sufficient for differentiation? | The simulated Cu K-edge XANES spectrum of Cu1.43Te exhibits a distinct shape compared to Cu2Te, with an edge position at 8979 eV. The calculated spectral difference (Δ) between the Cu2Te and Cu1.43Te spectra is 0.0164. This distinct spectral shape arises directly from the unique structural properties of the substoichiometric Cu1.43Te phase, specifically the random removal of atoms from partially occupied sites in the orthorhombic Pmmn supercell. Because this specific atomic arrangement alters the local electronic environment around the absorbing Cu atoms, the resulting spectral difference is large enough to successfully differentiate the two phases during linear combination fitting. | Full credit for stating that the spectral difference (Δ) between Cu2Te and Cu1.43Te is 0.0164, which is large enough to allow LCF to accurately differentiate between the two phases. |
Review
Structure design enables stable anionic and cationic redox chemistry in a T2-type Li-excess layered oxide cathode
APS
Electrochemistry
Xin Cao et al.
DOI: 10.1016/j.scib.2021.11.014
4 scenarios
▶
#450
Li0.72[Li0.12Ni0.36Mn0.52]O2
Ni K-edge
▶
LLM Prompt
Sample Information
Material: Li0.72[Li0.12Ni0.36Mn0.52]O2
Electrode Type: cathode
Electrolyte: 1 mol/L LiClO4 in propylene carbonate
Cell Type: 2032 coin-type cell
Charge Discharge: OCV
C Rate: 10 mA/g
Sample-Specific Conditions
- State of charge: Pristine
- Pristine T2-type Li0.72[Li0.12Ni0.36Mn0.52]O2 cathode
Measurement
We plan to measure the Ni K-edge XANES spectrum of this sample.
Questions
Based on all the information above:
1. What is the expected oxidation state of Ni in the pristine T2-type Li0.72[Li0.12Ni0.36Mn0.52]O2 cathode, and how does this align with the material's stoichiometric design?
2. What specific electronic transition is responsible for the rising edge in the Ni K-edge XANES spectrum of this material, and how can this feature be utilized to analyze the sample?
Ground Truth
Material: Li0.72[Li0.12Ni0.36Mn0.52]O2
Measurement: Ni K-edge hard X-ray absorption spectroscopy (XAS)
Fit method: Integral method
Phase fractions: (±10%)
| Phase | Fraction |
|---|---|
| Ni3+ | 1.0 |
Fit basis (paper's reference spectra):
- standard references of Ni XAS spectra
Source evidence: Page 15, Section 3.3; Figure 3b, 3d, 3f
Key reasoning: The valence of Ni in LLNMO is approximately +3.0 at the pristine state, which is in good agreement with the material design and ICP results. The oxidation state was estimated by applying the integral method to the rising edge, which arises from the electric dipole-allowed transition from 1s to 4p orbital.
Reasoning source: Section 3.3. Valence state analysis of Mn and Ni, Pages 13-15
Scoring Rubric (total: 100 pts)
| Q | Type | Max | Question | Reference Answer | Scoring Criteria |
|---|---|---|---|---|---|
| q1 | identification | 46 | What is the expected oxidation state of Ni in the pristine T2-type Li0.72[Li0.12Ni0.36Mn0.52]O2 cathode, and how does this align with the material's stoichiometric design? | The expected oxidation state of Ni in the pristine T2-type Li0.72[Li0.12Ni0.36Mn0.52]O2 cathode is +3.0, corresponding to a 1.0 fraction of Ni3+. This oxidation state is in excellent agreement with the material's stoichiometric design and ICP results for this specific composition. Because the sample is in its pristine, uncycled state at open circuit voltage (OCV), no electrochemical redox has yet occurred, leaving the Ni valence at its initial designed value. This +3.0 state is confirmed by applying the integral method to the rising edge of the XANES spectrum, establishing a baseline for subsequent redox changes during battery cycling. | Full points for identifying the Ni oxidation state as +3.0 and noting that it agrees with the stoichiometric design and ICP results for the pristine material. |
| q2 | spectral | 54 | What specific electronic transition is responsible for the rising edge in the Ni K-edge XANES spectrum of this material, and how can this feature be utilized to analyze the sample? | The rising edge in the Ni K-edge XANES spectrum of this material originates from the electric dipole-allowed transition from the 1s core orbital to the unoccupied 4p orbital. This spectral feature can be utilized to estimate the oxidation state of the transition metal by applying the integral method to the rising edge. Because the sample is a pristine Li0.72[Li0.12Ni0.36Mn0.52]O2 cathode at open circuit voltage, this 1s to 4p transition establishes the baseline +3.0 oxidation state of the uncycled material. Consequently, this feature serves as a critical reference point to track the highly reversible redox process, as the edge shifts to higher photon energies during charging (indicating oxidation to +3.5) and returns to this pristine location upon discharging. | Full points for identifying the electric dipole-allowed transition from the 1s to 4p orbital and explaining that the rising edge (or its integral) is used to deduce the oxidation state of Ni. |
Review
#451
Li0.72[Li0.12Ni0.36Mn0.52]O2
Ni K-edge
▶
LLM Prompt
Sample Information
Material: Li0.72[Li0.12Ni0.36Mn0.52]O2
Electrode Type: cathode
Electrolyte: 1 mol/L LiClO4 in propylene carbonate
Cell Type: 2032 coin-type cell
Charge Discharge: charged
C Rate: 10 mA/g
Voltage V: 4.8
Cycle Number: 1
Capacity Mah G: 138.5
Sample-Specific Conditions
- State of charge: 1st charge 4.8 V
- Cathode charged to 4.8 V in the first cycle
Measurement
We plan to measure the Ni K-edge XANES spectrum of this sample.
Questions
Based on all the information above:
1. Based on the sample conditions (1st charge to 4.8 V), identify the expected Ni oxidation states and estimate their relative fractions in the cathode.
2. What reference spectra would be necessary to calibrate the edge positions and determine the average oxidation state of Ni in this sample?
3. Explain the physical reasoning for the observed Ni oxidation state at 4.8 V. How does the Ni redox reaction relate to the total observed charge capacity of 138.5 mAh/g?
Ground Truth
Material: Li0.72[Li0.12Ni0.36Mn0.52]O2
Measurement: Ni K-edge hard X-ray absorption spectroscopy (XAS), ex-situ
Fit method: Integral method to estimate average oxidation state
Phase fractions: (±15%)
| Phase | Fraction |
|---|---|
| Ni3+ | 0.5 |
| Ni4+ | 0.5 |
Fit basis (paper's reference spectra):
- Ni2+ reference spectrum
- Ni3+ reference spectrum
- Ni4+ reference spectrum
Source evidence: Page 14-15, Section 3.3; Figure 3b, 3d, 3f
Key reasoning: Upon initial charging to 4.8 V, the Ni K-edge absorption edge moves to a higher photon energy, indicating an obvious increase in the Ni oxidation state. Using the integral method, the average Ni oxidation state is estimated to increase from +3.0 in the pristine state to +3.5 at 4.8 V, which corresponds to a 50:50 mixture of Ni3+ and Ni4+. This partial oxidation of Ni accounts for approximately 55 mAh/g of the charge capacity. Because the total charge capacity is 138.5 mAh/g, the remaining capacity is attributed to oxygen-centered oxidation reactions.
Reasoning source: Section 3.3: Valence state analysis of Mn and Ni, Pages 13-15
Scoring Rubric (total: 100 pts)
| Q | Type | Max | Question | Reference Answer | Scoring Criteria |
|---|---|---|---|---|---|
| q1 | quantification | 40 | Based on the sample conditions (1st charge to 4.8 V), identify the expected Ni oxidation states and estimate their relative fractions in the cathode. | Based on the sample conditions of the first charge to 4.8 V, the expected Ni oxidation states are a 50:50 mixture of Ni3+ (0.5 fraction) and Ni4+ (0.5 fraction), with an estimated uncertainty of 15%. These specific values result from the electrochemical charging process to 4.8 V, which drives the average Ni oxidation state from +3.0 in the pristine material to +3.5. This partial oxidation of Ni accounts for approximately 55 mAh/g of the total 138.5 mAh/g charge capacity. The remaining capacity is attributed to oxygen-centered oxidation reactions, which explains why the Ni oxidation state does not exceed +3.5 despite the high 4.8 V charging voltage. | Full credit for identifying an average oxidation state of +3.5 or a 50:50 mixture of Ni3+ and Ni4+. Partial credit for correctly identifying that Ni is oxidized beyond +3 but not fully to +4. |
| q2 | identification | 20 | What reference spectra would be necessary to calibrate the edge positions and determine the average oxidation state of Ni in this sample? | To calibrate the edge positions and determine the average oxidation state using the integral method, reference spectra for Ni2+, Ni3+, and Ni4+ are necessary. These specific references are required because the Li0.72[Li0.12Ni0.36Mn0.52]O2 cathode undergoes significant redox changes during the first charge to 4.8 V. As the cell is charged to this high voltage, the Ni K-edge absorption edge shifts to a higher photon energy, reflecting an increase in the average Ni oxidation state from +3.0 to +3.5. Therefore, having the full range of Ni2+, Ni3+, and Ni4+ references allows for accurate quantification of the resulting 50:50 mixture of Ni3+ and Ni4+ phases present at the 4.8 V state of charge. | Full credit for mentioning Ni reference spectra with known oxidation states of +2, +3, and +4 to establish a linear relationship for the edge positions. |
| q3 | reasoning | 40 | Explain the physical reasoning for the observed Ni oxidation state at 4.8 V. How does the Ni redox reaction relate to the total observed charge capacity of 138.5 mAh/g? | During the first charge to 4.8 V, the Ni K-edge absorption edge shifts to a higher photon energy, indicating an increase in the Ni oxidation state from +3.0 to an average of +3.5. This average oxidation state corresponds to a 50:50 mixture of Ni3+ and Ni4+ in the Li0.72[Li0.12Ni0.36Mn0.52]O2 cathode. This partial oxidation of Ni only accounts for approximately 55 mAh/g of the charge capacity. Because the total observed charge capacity at 4.8 V is 138.5 mAh/g, the remaining capacity is physically attributed to oxygen-centered oxidation reactions rather than further Ni oxidation. | Full credit for explaining that Ni oxidizes from +3 to +3.5, which only accounts for a portion of the capacity (~55 mAh/g), and correctly deducing that the excess capacity must be compensated by oxygen-centered redox reactions (anionic redox). |
Review
#452
Li0.72[Li0.12Ni0.36Mn0.52]O2
Mn K-edge
▶
LLM Prompt
Sample Information
Material: Li0.72[Li0.12Ni0.36Mn0.52]O2
Electrode Type: cathode
Electrolyte: 1 mol/L LiClO4 in propylene carbonate
Cell Type: 2032 coin-type cell
Charge Discharge: OCV
C Rate: 10 mA/g
Sample-Specific Conditions
- State of charge: Pristine
- Pristine T2-type Li0.72[Li0.12Ni0.36Mn0.52]O2 cathode
Measurement
We plan to measure the Mn K-edge XANES spectrum of this sample.
Questions
Based on all the information above:
1. What is the expected dominant oxidation state of Mn in the pristine T2-type Li0.72[Li0.12Ni0.36Mn0.52]O2 cathode, and what is the physical reasoning for this state?
2. If one were to quantify the average oxidation state of Mn in this sample using the integral method, what specific reference spectra would be required to establish a calibration curve?
Ground Truth
Material: Li0.72[Li0.12Ni0.36Mn0.52]O2
Measurement: Mn K-edge hard X-ray absorption spectroscopy (XAS)
Fit method: Integral method
Phase fractions: (±10%)
| Phase | Fraction |
|---|---|
| Mn4+ | 1.0 |
Fit basis (paper's reference spectra):
- Standard references of Mn XAS spectra for oxidation states +2, +3, and +4
Source evidence: Page 14-15, Section 3.3; Figure 3a, 3c, 3e
Key reasoning: The pristine T2-type LLNMO cathode is designed with Mn in the +4 oxidation state. This is confirmed by ICP measurements and the integral method applied to the Mn K-edge XAS rising edge, which yields an approximate average oxidation state of +4.0 for Mn in the pristine state.
Reasoning source: Section 3.3. Valence state analysis of Mn and Ni, Page 15
Scoring Rubric (total: 100 pts)
| Q | Type | Max | Question | Reference Answer | Scoring Criteria |
|---|---|---|---|---|---|
| q1 | reasoning | 60 | What is the expected dominant oxidation state of Mn in the pristine T2-type Li0.72[Li0.12Ni0.36Mn0.52]O2 cathode, and what is the physical reasoning for this state? | The expected dominant oxidation state of Mn in the pristine T2-type Li0.72[Li0.12Ni0.36Mn0.52]O2 cathode is +4.0, representing a 1.0 fraction of Mn4+. This state arises because the pristine T2-type LLNMO cathode is compositionally designed to have Mn in the +4 oxidation state prior to any electrochemical cycling. This design is confirmed by ICP measurements and the integral method applied to the Mn K-edge XAS rising edge, which yields an average oxidation state of +4.0. Spectroscopically, the pristine sample exhibits a rising edge characteristic of Mn4+ that remains unchanged upon initial charging to 4.8 V, demonstrating that the Mn is already fully oxidized in the pristine state. | Full points for identifying Mn4+ (+4.0) and explaining that it aligns with the stoichiometric design of the pristine material and is confirmed by the rising edge position. |
| q2 | identification | 40 | If one were to quantify the average oxidation state of Mn in this sample using the integral method, what specific reference spectra would be required to establish a calibration curve? | To quantify the average oxidation state of Mn in this sample using the integral method, standard reference XAS spectra for Mn in the +2, +3, and +4 oxidation states are required. These specific references are necessary because the pristine T2-type Li0.72[Li0.12Ni0.36Mn0.52]O2 cathode is designed with an initial Mn oxidation state of +4.0, which can reduce to lower valence states during discharge (e.g., to 2.0 V). By establishing a calibration curve with these +2, +3, and +4 references, the integral method can be applied to the Mn K-edge rising edge to accurately confirm the 100% Mn4+ fraction in the pristine state and track any subsequent shifts to lower energies during battery operation. | Full points for stating that standard reference spectra for Mn in +2, +3, and +4 oxidation states are needed. |
Review
#453
Li0.72[Li0.12Ni0.36Mn0.52]O2
Mn K-edge
▶
LLM Prompt
Sample Information
Material: Li0.72[Li0.12Ni0.36Mn0.52]O2
Electrode Type: cathode
Electrolyte: 1 mol/L LiClO4 in propylene carbonate
Cell Type: 2032 coin-type cell
Charge Discharge: discharged
C Rate: 10 mA/g
Voltage V: 2.0
Cycle Number: 1
Capacity Mah G: 184.0
Sample-Specific Conditions
- State of charge: 1st discharge 2.0 V
- Cathode fully discharged to 2.0 V in the first cycle
Measurement
We plan to measure the Mn K-edge XANES spectrum of this sample.
Questions
Based on all the information above:
1. What candidate reference spectra (by oxidation state) are needed to construct a calibration curve for quantifying the average Mn oxidation state in this sample using the integral method?
2. Based on the sample conditions (fully discharged to 2.0 V in the first cycle), estimate the average oxidation state of Mn and the corresponding fractions of Mn oxidation states present in the cathode.
3. Explain the physical reasoning for the observed Mn oxidation state at the end of the first discharge to 2.0 V. How does the timing of the Mn K-edge shift relate to the overall charge compensation mechanism during discharge?
Ground Truth
Material: Li0.72[Li0.12Ni0.36Mn0.52]O2
Measurement: Ex-situ Mn K-edge hard X-ray absorption spectroscopy (XAS) at Advanced Photon Source
Fit method: Integral method (quasi-quantitative estimation of average oxidation state)
Phase fractions: (±15%)
| Phase | Fraction |
|---|---|
| Mn3+ | 0.5 |
| Mn4+ | 0.5 |
Fit basis (paper's reference spectra):
- Standard references of Mn with oxidation states +2, +3, and +4
Source evidence: Page 14-15, Section 3.3; Figure 3a, 3c, 3e
Key reasoning: During the first discharge to 2.0 V, an obvious shift of the Mn K-edge to lower energy is detected, indicating that Mn-based reduction reactions occur primarily at low potentials. The average oxidation state of Mn decreases to approximately +3.5, corresponding to a roughly equal mixture of Mn3+ and Mn4+. This partial reduction of Mn, alongside Ni reduction and oxygen-centered reduction, accounts for the total observed discharge capacity.
Reasoning source: Section 3.3. Valence state analysis of Mn and Ni, Pages 14-15
Scoring Rubric (total: 100 pts)
| Q | Type | Max | Question | Reference Answer | Scoring Criteria |
|---|---|---|---|---|---|
| q1 | identification | 20 | What candidate reference spectra (by oxidation state) are needed to construct a calibration curve for quantifying the average Mn oxidation state in this sample using the integral method? | To construct a calibration curve for quantifying the average Mn oxidation state using the integral method, standard references of Mn with oxidation states +2, +3, and +4 are needed. These specific references are required because the sample is a Li0.72[Li0.12Ni0.36Mn0.52]O2 cathode that has been fully discharged to a low potential of 2.0 V in the first cycle. Under these deep discharge conditions, Mn-based reduction reactions occur, causing the Mn K-edge to shift to lower energies. Consequently, the Mn oxidation state decreases to an average of approximately +3.5, necessitating +3 and +4 references to capture the mixed state, and a +2 reference to properly bound the lower end of the calibration curve. | Full credit for identifying that standard references for Mn2+, Mn3+, and Mn4+ are required. |
| q2 | quantification | 40 | Based on the sample conditions (fully discharged to 2.0 V in the first cycle), estimate the average oxidation state of Mn and the corresponding fractions of Mn oxidation states present in the cathode. | Based on the sample conditions, the average oxidation state of Mn in the cathode decreases to approximately +3.5. This corresponds to a roughly equal mixture of Mn oxidation states, specifically 50% Mn3+ and 50% Mn4+, with an estimated uncertainty of 15%. These specific fractions result from the deep discharge of the Li0.72[Li0.12Ni0.36Mn0.52]O2 cathode to 2.0 V during the first cycle. At these low potentials, Mn undergoes partial reduction, which, alongside Ni reduction and oxygen-centered reduction, provides the charge compensation necessary to achieve the total observed discharge capacity of 184.0 mAh/g. | Full credit for stating an average oxidation state of +3.5, corresponding to approximately 50% Mn3+ and 50% Mn4+. |
| q3 | reasoning | 40 | Explain the physical reasoning for the observed Mn oxidation state at the end of the first discharge to 2.0 V. How does the timing of the Mn K-edge shift relate to the overall charge compensation mechanism during discharge? | At the end of the first discharge to 2.0 V, the Mn K-edge exhibits an obvious shift to lower energy, resulting in an average oxidation state of approximately +3.5 (a 1:1 mixture of Mn3+ and Mn4+). This occurs because Mn-based reduction reactions in the Li0.72[Li0.12Ni0.36Mn0.52]O2 cathode take place primarily at low potentials during the discharge cycle. The timing of this shift demonstrates that Mn reduction is activated late in the discharge process as the voltage drops toward 2.0 V. Ultimately, this partial reduction of Mn acts in concert with Ni reduction and oxygen-centered reduction to account for the total observed discharge capacity of 184.0 mAh/g. | Full credit for explaining that the Mn K-edge shifts significantly only at low potentials (down to 2.0 V), indicating Mn reduction occurs late in the discharge process. Must mention that the resulting +3.5 state shows Mn partially compensates the charge alongside Ni and oxygen-centered reduction. |
Review
Aerosol iron speciation and seasonal variation of iron oxidation state over the western Antarctic Peninsula
APS
Environmental
Songyun Fan et al.
DOI: 10.1016/j.scitotenv.2022.153890
3 scenarios
▶
#454
Aerosol
Fe K
▶
LLM Prompt
Sample Information
Material: Aerosol
Sample Origin: Palmer Station, western Antarctic Peninsula
Sample-Specific Conditions
- Season: Summer
- Bulk aerosol sample collected during the austral summer
Measurement
We plan to measure the Fe K XANES spectrum of this sample.
Questions
Based on all the information above:
1. Based on the sample origin and season, what are the expected dominant and minor Fe-bearing phases in this aerosol sample, and what are their approximate mass fractions?
2. What reference spectra should be included in a linear combination fitting (LCF) analysis to accurately model the Fe K-edge XANES spectrum of this sample?
3. Explain the environmental and geological factors that lead to the observed Fe mineralogy in this summer aerosol sample from the western Antarctic Peninsula.
Ground Truth
Material: Aerosol
Measurement: Fe K-edge XANES, bulk mode, 2-ID-D beamline at Advanced Photon Source
Fit method: Linear combination (LC) fitting
Phase fractions: (±10%)
| Phase | Fraction |
|---|---|
| Biotite | 0.47 |
| Hematite | 0.29 |
| Ilmenite | 0.13 |
| Pyrite | 0.11 |
Fit basis (paper's reference spectra):
- Fe(II) oxide
- Fe(II) oxalate
- Fe(II) sulfate
- Fe(III) oxalate
- Fe(III) sulfate
- Fe(III) phosphate
- Goethite
- Hematite
- Biotite
- Ferrihydrite
- Pyrite
- Ilmenite
Source evidence: Figure 3, page 5
Key reasoning: The Fe mineralogy of bulk aerosols in the austral summer is dominated by local crustal emissions from the Antarctic Peninsula. Biotite and hematite are the most abundant Fe-minerals, consistent with their presence in local soils, sediments, and rocks. Minor fractions of pyrite and ilmenite are also present, originating from quartz-pyrite rocks and titanium-iron oxide minerals in the region. The high fraction of Fe(II) minerals like biotite implies high bioavailability of the aerosol Fe.
Reasoning source: Section 3.2, pages 4-5
Scoring Rubric (total: 100 pts)
| Q | Type | Max | Question | Reference Answer | Scoring Criteria |
|---|---|---|---|---|---|
| q1 | quantification | 40 | Based on the sample origin and season, what are the expected dominant and minor Fe-bearing phases in this aerosol sample, and what are their approximate mass fractions? | The expected dominant Fe-bearing phases in this sample are Biotite (47% ± 10%) and Hematite (29% ± 10%), while the minor phases are Ilmenite (13% ± 10%) and Pyrite (11% ± 10%). These specific fractions arise because bulk aerosols collected during the austral summer at Palmer Station are heavily dominated by local crustal emissions from the Antarctic Peninsula. The high abundance of biotite and hematite directly reflects their prevalence in local soils, sediments, and rocks. Meanwhile, the minor fractions of pyrite and ilmenite are incorporated from regional quartz-pyrite rocks and titanium-iron oxide minerals, ultimately resulting in a high fraction of Fe(II) minerals that implies high bioavailability of the aerosol Fe. | Full points if Biotite (~47%) and Hematite (~29%) are identified as dominant, and Ilmenite (~13%) and Pyrite (~11%) as minor phases. Deduct points for missing phases or fractions off by more than 10%. |
| q2 | identification | 30 | What reference spectra should be included in a linear combination fitting (LCF) analysis to accurately model the Fe K-edge XANES spectrum of this sample? | The linear combination fitting (LCF) basis should include reference spectra for Fe(II) oxide, Fe(II) oxalate, Fe(II) sulfate, Fe(III) oxalate, Fe(III) sulfate, Fe(III) phosphate, Goethite, Hematite, Biotite, Ferrihydrite, Pyrite, and Ilmenite. This comprehensive set of references is required because the summer aerosol samples from the western Antarctic Peninsula are dominated by local crustal emissions. Specifically, standards like biotite, hematite, pyrite, and ilmenite are necessary to capture the primary mineralogy originating from local soils, sediments, quartz-pyrite rocks, and titanium-iron oxide minerals. Including this wide range of Fe(II) and Fe(III) standards ensures accurate modeling of the highly bioavailable Fe(II) fractions, such as biotite, that are characteristic of these austral summer aerosols. | Full points if Biotite, Hematite, Ilmenite, and Pyrite are listed as the necessary reference spectra. Deduct points for missing references or suggesting irrelevant ones (e.g., Fe-sulfates or Fe-oxalates, which were found to be negligible). |
| q3 | reasoning | 30 | Explain the environmental and geological factors that lead to the observed Fe mineralogy in this summer aerosol sample from the western Antarctic Peninsula. | The observed Fe mineralogy in this sample is primarily driven by local crustal emissions from the Antarctic Peninsula during the austral summer. Because the aerosols originate locally, their composition mirrors the regional geology, resulting in dominant fractions of biotite (47%) and hematite (29%) derived from local soils, sediments, and rocks. Additionally, minor contributions of ilmenite (13%) and pyrite (11%) are incorporated from regional titanium-iron oxide minerals and quartz-pyrite rocks. Ultimately, these geological factors produce an aerosol with a high fraction of Fe(II) minerals like biotite, which implies that the aerosol Fe has high environmental bioavailability. | Full points for explaining that the mineralogy is dominated by local crustal emissions (soils, sediments, rocks) rather than remote sources or atmospheric processing, and mentioning that the presence of these specific minerals (especially Fe(II) phases like biotite) is linked to local geology and implies high bioavailability. |
Review
#455
Aerosol
Fe K
▶
LLM Prompt
Sample Information
Material: Aerosol
Sample Origin: Palmer Station, western Antarctic Peninsula
Sample-Specific Conditions
- Season: Winter
- Bulk aerosol sample collected during the austral winter
Measurement
We plan to measure the Fe K XANES spectrum of this sample.
Questions
Based on all the information above:
1. What candidate reference spectra should be included in the basis set to model the Fe K-edge XANES of this Antarctic winter bulk aerosol sample using linear combination fitting?
2. Estimate the relative phase fractions of the dominant iron-bearing minerals in this bulk aerosol sample collected during the austral winter.
3. Explain the environmental and physical reasons why these specific iron phases dominate the winter aerosol sample, and why the relative proportion of Fe(II) phases is lower in winter compared to summer.
Ground Truth
Material: Aerosol
Measurement: Fe K-edge XANES, fluorescence mode (bulk mode with unfocused beam), beamline 2-ID-D at the Advanced Photon Source
Fit method: Linear combination (LC) fitting
Phase fractions: (±10%)
| Phase | Fraction |
|---|---|
| Hematite | 0.4 |
| Biotite | 0.39 |
| Pyrite | 0.21 |
Fit basis (paper's reference spectra):
- Hematite
- Biotite
- Pyrite
- Ilmenite
- Fe(II) oxide
- Fe(II) oxalate
- Fe(II) sulfate
- Fe(III) oxalate
- Fe(III) sulfate
- Fe(III) phosphate
- Goethite
- Ferrihydrite
Source evidence: Figure 3, page 5
Key reasoning: The aerosol Fe speciation is dominated by local and regional crustal dust emissions, which are rich in hematite and biotite (minerals widely distributed in Antarctic Peninsula soils and rocks). During the austral winter, the fraction of Fe(II) minerals like biotite decreases compared to summer. This is attributed to the cessation of atmospheric photoreduction due to the lack of solar irradiance, as well as snow and ice cover restricting the emission of local Fe(II)-enriched dust.
Reasoning source: Section 3.2 (Iron mineralogy in Fe-containing particles) and Section 3.3 (Seasonal variation of aerosol Fe oxidation state), pages 4-6
Scoring Rubric (total: 100 pts)
| Q | Type | Max | Question | Reference Answer | Scoring Criteria |
|---|---|---|---|---|---|
| q1 | identification | 25 | What candidate reference spectra should be included in the basis set to model the Fe K-edge XANES of this Antarctic winter bulk aerosol sample using linear combination fitting? | The candidate reference spectra for linear combination fitting should include Hematite, Biotite, Pyrite, Ilmenite, Fe(II) oxide, Fe(II) oxalate, Fe(II) sulfate, Fe(III) oxalate, Fe(III) sulfate, Fe(III) phosphate, Goethite, and Ferrihydrite. These specific phases are expected because the aerosol Fe speciation at the Palmer Station is primarily driven by local and regional crustal dust emissions from Antarctic Peninsula soils and rocks. A broad mix of Fe(II) and Fe(III) references is required to accurately model the sample because the austral winter conditions significantly alter the aerosol's oxidation state. Specifically, the lack of solar irradiance stops atmospheric photoreduction, and winter snow and ice cover restricts local Fe(II)-enriched dust emissions, dictating the specific mineral phases present in the sample. | Full credit if the answer identifies crustal iron minerals typical of the region, specifically requiring Hematite, Biotite, and Pyrite. Partial credit for mentioning general Fe(III) oxides and Fe(II) silicates without naming the exact phases. |
| q2 | quantification | 35 | Estimate the relative phase fractions of the dominant iron-bearing minerals in this bulk aerosol sample collected during the austral winter. | The relative phase fractions for this austral winter bulk aerosol sample are estimated to be 40% Hematite, 39% Biotite, and 21% Pyrite, with a 10% uncertainty. These specific values arise because the aerosol is dominated by regional crustal dust emissions that are naturally rich in hematite and biotite from Antarctic Peninsula soils. The observed fractions reflect a notable decrease in Fe(II) minerals, such as biotite, compared to summer conditions. This seasonal shift to the quantified values occurs because the lack of winter solar irradiance halts atmospheric photoreduction, while extensive snow and ice cover physically restricts the emission of local Fe(II)-enriched dust. | Full credit for estimating fractions close to 40% Hematite, 39% Biotite, and 21% Pyrite (within +/- 10%). Partial credit if the answer correctly identifies that Fe(III) oxides (Hematite) and Fe(II) silicates (Biotite) are present in roughly equal major proportions, with a minor contribution from Pyrite. |
| q3 | reasoning | 40 | Explain the environmental and physical reasons why these specific iron phases dominate the winter aerosol sample, and why the relative proportion of Fe(II) phases is lower in winter compared to summer. | These specific iron phases dominate the winter aerosol sample because Fe speciation in this region is controlled by local and regional crustal dust emissions. Minerals such as hematite and biotite are widely distributed in the soils and rocks of the Antarctic Peninsula, serving as the primary source material for the aerosols. The relative proportion of Fe(II) phases is lower in the austral winter primarily due to the lack of solar irradiance, which causes a cessation of atmospheric photoreduction. Additionally, the physical presence of winter snow and ice cover restricts the emission of local Fe(II)-enriched dust, further reducing the Fe(II) fraction in the winter aerosols. | Full credit if the answer explains that: 1) the phases are derived from local/regional crustal dust emissions (soils/rocks); 2) the lower Fe(II) fraction in winter is due to the lack of solar irradiance halting photoreduction; and 3) snow/ice cover limits the emission of local Fe(II)-enriched dust. |
Review
#456
Aerosol
Fe K
▶
LLM Prompt
Sample Information
Material: Aerosol
Sample Origin: Palmer Station, western Antarctic Peninsula
Sample-Specific Conditions
- Particle size: Coarse mode (>1.8 um)
- Coarse-mode size-segregated aerosol sample
Measurement
We plan to measure the Fe K XANES spectrum of this sample.
Questions
Based on all the information above:
1. What candidate reference spectra should be considered for linear combination fitting of this coarse-mode Antarctic aerosol sample?
2. Estimate the dominant iron-bearing phases and their approximate fractions in this coarse-mode aerosol sample.
3. Explain the environmental and geological reasoning for why these specific iron phases dominate the coarse-mode aerosol fraction at Palmer Station.
Ground Truth
Material: Aerosol
Measurement: Fe K-edge XANES in bulk mode at beamline 2-ID-D, Advanced Photon Source
Fit method: Linear combination (LC) fitting
Phase fractions: (±10%)
| Phase | Fraction |
|---|---|
| Hematite | 0.62 |
| Biotite | 0.38 |
Fit basis (paper's reference spectra):
- Hematite
- Biotite
- Ilmenite
- Pyrite
- Fe(II) oxide
- Fe(II) oxalate
- Fe(II) sulfate
- Fe(III) oxalate
- Fe(III) sulfate
- Fe(III) phosphate
- Goethite
- Ferrihydrite
Source evidence: Figure 3, page 5
Key reasoning: The coarse-mode aerosol particles are primarily derived from regional crustal sources, as evidenced by their correlation with crustal elements like Si and Al. Hematite is the most common Fe mineral on Earth and accumulates as a secondary mineral in soils during weathering. Biotite is widely distributed in the Antarctic Peninsula's soils, sediments, and rocks, and is readily released into the air as dust source material through mechanical weathering producing extensive rock flour.
Reasoning source: Section 3.1 and 3.2, pages 3-5
Scoring Rubric (total: 100 pts)
| Q | Type | Max | Question | Reference Answer | Scoring Criteria |
|---|---|---|---|---|---|
| q1 | identification | 25 | What candidate reference spectra should be considered for linear combination fitting of this coarse-mode Antarctic aerosol sample? | For the linear combination fitting of this coarse-mode Antarctic aerosol sample, the candidate reference spectra should include Hematite, Biotite, Ilmenite, Pyrite, Fe(II) oxide, Fe(II) oxalate, Fe(II) sulfate, Fe(III) oxalate, Fe(III) sulfate, Fe(III) phosphate, Goethite, and Ferrihydrite. These specific references must be considered because coarse-mode aerosols (>1.8 um) from Palmer Station are primarily derived from regional crustal sources and mechanical weathering. The basis set accounts for primary crustal minerals, such as biotite found in local Antarctic rocks and rock flour, as well as secondary weathering products like hematite and various iron sulfates or oxalates. Including this broad range of primary minerals and secondary environmental products ensures all potential crustal dust contributions are accurately evaluated. | Full credit for identifying primary crustal and soil weathering minerals, specifically highlighting hematite and biotite as the most critical references. Partial credit for mentioning other plausible environmental iron standards like goethite, ferrihydrite, ilmenite, or pyrite. |
| q2 | quantification | 35 | Estimate the dominant iron-bearing phases and their approximate fractions in this coarse-mode aerosol sample. | The dominant iron-bearing phases in this coarse-mode (>1.8 um) aerosol sample are estimated to be Hematite at approximately 62% and Biotite at approximately 38%, with a fitting uncertainty of 10%. These specific fractions result directly from the sample's origin as windblown dust derived from regional crustal sources in the western Antarctic Peninsula. Biotite makes up a significant fraction (38%) because it is widely distributed in local soils, sediments, and rocks, and is readily released into the air via mechanical weathering that produces extensive rock flour. Hematite dominates the remaining fraction (62%) because it is the most common Fe mineral on Earth and accumulates heavily as a secondary mineral in soils during weathering processes before being lofted into the coarse aerosol mode. | Full credit for identifying Hematite and Biotite as the two dominant phases, with Hematite at approximately 60% (accept 55-65%) and Biotite at approximately 40% (accept 35-45%). |
| q3 | reasoning | 40 | Explain the environmental and geological reasoning for why these specific iron phases dominate the coarse-mode aerosol fraction at Palmer Station. | The dominance of hematite and biotite in the coarse-mode (>1.8 um) aerosol fraction at Palmer Station is directly linked to their regional crustal origins. Coarse-mode particles are typically generated by mechanical processes, and their correlation with crustal elements like Si and Al indicates they are primarily windblown dust. Biotite is widely distributed throughout the soils, sediments, and rocks of the Antarctic Peninsula, making it readily available to be released into the air as rock flour through mechanical weathering. Meanwhile, hematite is the most abundant iron mineral globally and naturally accumulates as a secondary mineral in soils during weathering. Consequently, the mechanical lofting of these locally weathered soils and rock flours results in an aerosol composition heavily dominated by these two specific iron phases. | Full credit requires explaining that coarse-mode aerosols in this region are dominated by local/regional crustal dust emissions. The answer must connect hematite to secondary mineral accumulation in soils during weathering, and biotite to mechanical weathering that produces fine rock flour from the local Antarctic Peninsula geology. |
Review
Spatial variability of aerosol iron mineralogy and oxidation states over the Arctic Ocean
APS
Environmental
Songyun Fan et al.
DOI: 10.1016/j.scitotenv.2023.164301
3 scenarios
▶
#457
Aerosol
Fe K-edge
▶
LLM Prompt
Sample Information
Material: Aerosol
Sample Origin: Arctic Ocean (near Alaska)
Sample-Specific Conditions
- Air mass source: North Pacific and Bering Sea
- Aerosol sample collected near the continental edge (Alaska)
Measurement
We plan to measure the Fe K-edge XANES spectrum of this sample.
Questions
Based on all the information above:
1. Given the sample's origin near the Alaskan continental edge and its air mass source, what are the expected dominant Fe-bearing phases and their approximate relative fractions in this aerosol?
2. Explain the environmental and geological reasoning for why this specific mineralogical composition dominates the aerosol sample collected under these conditions.
3. If you were to perform Linear Combination Fitting (LCF) on the Fe K-edge XANES spectrum of this sample, what specific reference spectra would be most critical to include in your candidate basis set to capture the expected mineralogy?
Ground Truth
Material: Aerosol
Measurement: Fe K-edge XANES at beamline 2-ID-D Station of the Advanced Photon Source
Fit method: Linear combination (LC) fitting
Phase fractions: (±10%)
| Phase | Fraction |
|---|---|
| biotite | 0.87 |
| hematite | 0.13 |
Fit basis (paper's reference spectra):
- Fe(II) oxide (FeO)
- Fe(II) oxalate
- Fe(II) sulfate
- Fe(III) oxalate
- Fe(III) sulfate
- Fe(III) phosphate
- goethite
- hematite
- biotite
- ferrihydrite
- pyrite
- ilmenite
Source evidence: Section 3.1 'Aerosol Fe minerology', Page 4; Table 2, Page 8
Key reasoning: The air mass for this sample originated from the North Pacific and Bering Sea regions, carrying aeolian dust derived from glacial sediments in Alaska. During summer, low river levels and reduced snow cover expose these sediments. The principal Fe-containing mineral in Alaskan glacial flour is the Fe(II)-silicate biotite, which explains its dominance in this sample.
Reasoning source: Section 4.1 'Sources of aerosol Fe', Page 5
Scoring Rubric (total: 100 pts)
| Q | Type | Max | Question | Reference Answer | Scoring Criteria |
|---|---|---|---|---|---|
| q1 | quantification | 30 | Given the sample's origin near the Alaskan continental edge and its air mass source, what are the expected dominant Fe-bearing phases and their approximate relative fractions in this aerosol? | The expected dominant Fe-bearing phases in this aerosol sample are biotite at a relative fraction of 0.87 and hematite at 0.13, with a 10% uncertainty. These specific fractions result from the sample's air mass originating from the North Pacific and Bering Sea, which carries aeolian dust derived from Alaskan glacial sediments. During summer, low river levels and reduced snow cover expose these sediments to wind. Because the principal Fe-containing mineral in Alaskan glacial flour is the Fe(II)-silicate biotite, it heavily dominates the aerosol composition alongside a minor hematite component. | Award full points for identifying biotite as the major phase (~87%) and hematite as the minor phase (~13%). Deduct points if other phases are incorrectly proposed as major components. |
| q2 | reasoning | 40 | Explain the environmental and geological reasoning for why this specific mineralogical composition dominates the aerosol sample collected under these conditions. | The dominance of biotite (87%) and hematite (13%) in this aerosol sample is directly linked to its air mass source from the North Pacific and Bering Sea. This air mass transports aeolian dust derived from glacial sediments located near the Alaskan continental edge. During summer conditions, low river levels and reduced snow cover expose these glacial sediments to wind erosion. The principal Fe-containing mineral in this Alaskan glacial flour is the Fe(II)-silicate biotite, which provides the geological mechanism for why biotite so heavily dominates the sample's mineralogical composition. | Award points for connecting the composition to aeolian dust derived from Alaskan glacial sediments/flour. Must mention that these sediments are exposed during summer (due to low river levels/reduced snow cover) and are naturally rich in the Fe(II)-silicate biotite. |
| q3 | identification | 30 | If you were to perform Linear Combination Fitting (LCF) on the Fe K-edge XANES spectrum of this sample, what specific reference spectra would be most critical to include in your candidate basis set to capture the expected mineralogy? | For Linear Combination Fitting (LCF) of this sample, the critical candidate basis set must include biotite and hematite, as well as Fe(II) oxide (FeO), Fe(II) oxalate, Fe(II) sulfate, Fe(III) oxalate, Fe(III) sulfate, Fe(III) phosphate, goethite, ferrihydrite, pyrite, and ilmenite. These specific reference phases are necessary because the sample's air mass from the North Pacific and Bering Sea carries aeolian dust from exposed Alaskan glacial sediments. Summer conditions expose these sediments, and the principal Fe-containing mineral in Alaskan glacial flour is the Fe(II)-silicate biotite. Consequently, the basis set must account for this glacial mineralogy, ultimately yielding a fit dominated by biotite (87%) and hematite (13%). | Award full points for explicitly naming biotite and hematite as the essential reference spectra. Additional credit for mentioning other plausible environmental Fe references (e.g., ferrihydrite, ilmenite, goethite, or Fe-sulfates/oxalates) that are standard for aerosol analysis. |
Review
#458
Aerosol
Fe K-edge
▶
LLM Prompt
Sample Information
Material: Aerosol
Sample Origin: Remote Arctic Ocean
Sample-Specific Conditions
- Air mass source: Marine Arctic air
- Aerosol samples collected over the remote Arctic Ocean
Measurement
We plan to measure the Fe K-edge XANES spectrum of this sample.
Questions
Based on all the information above:
1. Based on the sample conditions (aged aerosols collected over the remote Arctic Ocean under marine Arctic air influence), what are the expected dominant Fe-bearing phases and their approximate fractions?
2. If performing Linear Combination Fitting (LCF) on the Fe K-edge XANES spectra of these samples, what reference spectra should be included in the candidate basis set to accurately capture the mineralogy?
Ground Truth
Material: Aerosol
Measurement: Fe K-edge XANES at beamline 2-ID-D, Advanced Photon Source
Fit method: Linear combination fitting (LCF) guided by PCA and k-means clustering
Phase fractions: (±10%)
| Phase | Fraction |
|---|---|
| ferrihydrite | 0.82 |
| ilmenite | 0.18 |
Fit basis (paper's reference spectra):
- Fe(II) oxide (FeO)
- Fe(II) oxalate
- Fe(II) sulfate
- Fe(III) oxalate
- Fe(III) sulfate
- Fe(III) phosphate
- goethite
- hematite
- biotite
- ferrihydrite
- pyrite
- ilmenite
Source evidence: Page 4, Section 3.1 'Aerosol Fe minerology'; Table 2
Key reasoning: These samples were collected over the remote Arctic Ocean and were predominantly under the influence of marine Arctic air. Air mass back trajectories suggest these particles traveled a long distance and were relatively aged. Atmospheric chemical processing (such as acidic reactions) during long-range transport likely transformed primary Fe-containing minerals (like Fe-silicates or chlorite from Asian dust) into secondary ferrihydrite, which dominates the mineralogy of these aged aerosols.
Reasoning source: Page 5, Section 4.1 'Sources of aerosol Fe' and Section 4.2 'Aerosol Fe oxidation state and bioavailability'
Scoring Rubric (total: 100 pts)
| Q | Type | Max | Question | Reference Answer | Scoring Criteria |
|---|---|---|---|---|---|
| q1 | quantification | 50 | Based on the sample conditions (aged aerosols collected over the remote Arctic Ocean under marine Arctic air influence), what are the expected dominant Fe-bearing phases and their approximate fractions? | The expected dominant Fe-bearing phases for these samples are ferrihydrite at approximately 82% and ilmenite at 18%, with an uncertainty of 10%. These specific fractions result from the samples being collected over the remote Arctic Ocean under the influence of marine Arctic air, indicating that the particles traveled long distances and are relatively aged. During this long-range transport, atmospheric chemical processing, such as acidic reactions, transformed primary Fe-containing minerals (like Fe-silicates or chlorite from Asian dust) into secondary ferrihydrite. Consequently, secondary ferrihydrite heavily dominates the mineralogy of these aged aerosols, leaving only a minor fraction of unreacted primary minerals like ilmenite. | Full credit for identifying ferrihydrite as the dominant phase (~82%) and ilmenite as the minor phase (~18%). Partial credit for identifying ferrihydrite as the majority phase without exact percentages. |
| q3 | identification | 50 | If performing Linear Combination Fitting (LCF) on the Fe K-edge XANES spectra of these samples, what reference spectra should be included in the candidate basis set to accurately capture the mineralogy? | The candidate basis set for Linear Combination Fitting (LCF) should include Fe(II) oxide (FeO), Fe(II) oxalate, Fe(II) sulfate, Fe(III) oxalate, Fe(III) sulfate, Fe(III) phosphate, goethite, hematite, biotite, ferrihydrite, pyrite, and ilmenite. This comprehensive set of references is necessary because the aerosol samples were collected over the remote Arctic Ocean and subjected to long-range transport under marine Arctic air. During this transport, primary Fe-containing minerals from sources like Asian dust undergo atmospheric chemical processing and acidic reactions, creating a complex mixture of primary minerals and secondary weathering products. Including this broad range of iron oxides, sulfates, oxalates, phosphates, and silicates ensures the LCF can accurately capture both the remaining primary phases and the dominant secondary phases (like ferrihydrite) formed in these aged aerosols. | Must list ferrihydrite and ilmenite as essential components, and should ideally mention other common aerosol Fe references (e.g., hematite, goethite, biotite, Fe-sulfates, Fe-oxalates) that would be part of a comprehensive candidate basis set. |
Review
#459
Aerosol
Fe K-edge
▶
LLM Prompt
Sample Information
Material: Aerosol
Sample Origin: Remote Arctic Ocean
Sample-Specific Conditions
- Air mass source: Mix of marine Arctic air with continental air mass
- Aerosol samples collected over the remote Arctic Ocean
Measurement
We plan to measure the Fe K-edge XANES spectrum of this sample.
Questions
Based on all the information above:
1. What candidate reference spectra are needed to model the Fe K-edge XANES spectrum of this aerosol sample using linear combination fitting?
2. Estimate the relative phase fractions of the major Fe-containing minerals in this aerosol sample.
Ground Truth
Material: Aerosol
Measurement: Fe K-edge XANES, beamline 2-ID-D Station of the Advanced Photon Source
Fit method: Linear combination (LC) fitting
Phase fractions: (±10%)
| Phase | Fraction |
|---|---|
| hematite | 0.41 |
| Fe(III) phosphate | 0.26 |
| biotite | 0.2 |
| ferrihydrite | 0.13 |
Fit basis (paper's reference spectra):
- Fe(II) oxide (FeO)
- Fe(II) oxalate
- Fe(II) sulfate
- Fe(III) oxalate
- Fe(III) sulfate
- Fe(III) phosphate
- goethite
- hematite
- biotite
- ferrihydrite
- pyrite
- ilmenite
Source evidence: Section 3.1, page 4; Table 2, page 8
Key reasoning: Air mass back trajectories indicate these samples received air from the remote Arctic and continental northern Russia and Canada. Hematite is a common Fe mineral widely found in soils, representing fresh continental dust. Fe(III) phosphate is not typically found in natural environments at high concentrations and is likely a product of atmospheric acidic processes during transport.
Reasoning source: Section 4.1, page 5
Scoring Rubric (total: 100 pts)
| Q | Type | Max | Question | Reference Answer | Scoring Criteria |
|---|---|---|---|---|---|
| q1 | identification | 33 | What candidate reference spectra are needed to model the Fe K-edge XANES spectrum of this aerosol sample using linear combination fitting? | To model the Fe K-edge XANES spectrum of this aerosol sample using linear combination fitting, the candidate reference spectra must include Fe(II) oxide (FeO), Fe(II) oxalate, Fe(II) sulfate, Fe(III) oxalate, Fe(III) sulfate, Fe(III) phosphate, goethite, hematite, biotite, ferrihydrite, pyrite, and ilmenite. These specific reference phases are required because the aerosol sample was collected over the remote Arctic Ocean and influenced by a mix of marine Arctic and continental air masses from northern Russia and Canada. This continental air mass introduces common soil minerals representing fresh continental dust, such as hematite, biotite, and ferrihydrite. Furthermore, atmospheric acidic processes occurring during the transport of these aerosols necessitate the inclusion of secondary reaction products like Fe(III) phosphate, sulfates, and oxalates in the fitting basis. | Full points if the answer identifies hematite, Fe(III) phosphate, biotite, and ferrihydrite as the necessary reference spectra. Partial credit for identifying at least two of these phases. |
| q2 | quantification | 67 | Estimate the relative phase fractions of the major Fe-containing minerals in this aerosol sample. | The relative phase fractions of the major Fe-containing minerals in this aerosol sample are estimated to be 41% hematite, 26% Fe(III) phosphate, 20% biotite, and 13% ferrihydrite, with an estimated uncertainty of 10%. These specific values result directly from the sample's exposure to a mixture of marine Arctic air and continental air masses from northern Russia and Canada. The dominant fraction of hematite (41%), alongside biotite and ferrihydrite, is expected because hematite is a common Fe mineral widely found in soils, representing a strong influx of fresh continental dust. Meanwhile, the significant 26% fraction of Fe(III) phosphate, a phase not typically found at high concentrations in natural environments, arises as a secondary product of atmospheric acidic processes altering the aerosol particles during their transport. | Full points if the estimated fractions are within ±10% of the ground truth values: hematite (41%), Fe(III) phosphate (26%), biotite (20%), and ferrihydrite (13%). Partial credit is awarded proportionally for each phase correctly estimated within the tolerance. |
Review
Self-assembly of solid nanoclusters in molybdenum under gas ion implantation
BNL-NSLS-II-8-ID
Synthesis
Cheng Sun et al.
DOI: 10.1016/j.scriptamat.2020.113651
1 scenario
▶
#460
Kr nanoclusters in Mo matrix
Kr K
▶
LLM Prompt
Sample Information
Material: Kr nanoclusters in Mo matrix
Method: ion implantation
Temperature C: 400
Cooling Method: cooled to room temperature (300 K)
Sample-Specific Conditions
- Implantation fluence: 2.5 × 10^16 Kr/cm2
- Molybdenum sheet implanted with Kr gas ions to form nanoclusters
Preparation
- Kr gas ion implantation of perforated Mo specimens was performed with an energy of 300 keV at 673 K to a fluence of 2.5 × 10^16 Kr/cm2.
Measurement
We plan to measure the Kr K XANES spectrum of this sample.
Questions
Based on all the information above:
1. Based on the implantation conditions and subsequent cooling to room temperature, what phase of Kr is expected to dominate in the nanoclusters, and what physical conditions (e.g., pressure, structure) drive this phase state?
2. Describe the expected spectral shape of the Kr K-edge XANES for this sample. How does this spectrum distinguish the physical state of Kr in the nanoclusters from gaseous Kr?
3. If one were to model this XANES spectrum using theoretical calculations (e.g., DFT), what specific crystal structure and internal pressure should be assumed for the Kr reference to achieve a good agreement with the experimental data?
Ground Truth
Material: Kr nanoclusters in Mo matrix
Measurement: Kr K-edge (14325.6 eV) in fluorescence mode
Fit method: DFT simulation comparison
Phase fractions: (±10%)
| Phase | Fraction |
|---|---|
| Solid Kr (FCC) | 1.0 |
Fit basis (paper's reference spectra):
- Face-centered cubic (FCC) solid Kr at 2 GPa
Source evidence: Figure 3(a) and 3(b), page 5
Key reasoning: The XANES spectrum of the Kr-implanted Mo exhibits a distinct 'white line' peak and post-edge oscillations, which are characteristic of solid Kr. Gaseous Kr lacks these features due to strong core-hole lifetime broadening. DFT calculations assuming an FCC structure at 2 GPa match the experimental spectrum well, confirming the Kr atoms in the nanoclusters are in a solid state at room temperature.
Reasoning source: Page 4, right column; Page 5, left column
Scoring Rubric (total: 100 pts)
| Q | Type | Max | Question | Reference Answer | Scoring Criteria |
|---|---|---|---|---|---|
| q1 | reasoning | 33 | Based on the implantation conditions and subsequent cooling to room temperature, what phase of Kr is expected to dominate in the nanoclusters, and what physical conditions (e.g., pressure, structure) drive this phase state? | The dominant phase expected in the nanoclusters is 100% solid Kr in a face-centered cubic (FCC) structure. This solid phase arises because the Kr gas ions were implanted into the Mo matrix at 673 K to a high fluence of 2.5 × 10^16 Kr/cm2, forming dense nanoclusters. Upon cooling to room temperature (300 K), the physical confinement within the Mo matrix subjects the Kr nanoclusters to an internal pressure of approximately 2 GPa. This high pressure forces the Kr atoms into a condensed, solid FCC state rather than remaining gaseous. | Full credit requires identifying the phase as solid Kr (specifically FCC structure) and mentioning that it is driven by high internal pressures (approx. 2 GPa) within the nanoclusters at room temperature. |
| q2 | spectral | 40 | Describe the expected spectral shape of the Kr K-edge XANES for this sample. How does this spectrum distinguish the physical state of Kr in the nanoclusters from gaseous Kr? | The expected Kr K-edge XANES spectrum (at 14325.6 eV) will exhibit a pronounced, intense 'white line' peak at 14327.5 eV, followed by distinct post-edge oscillations. These spectral features arise because the Kr ions implanted into the Mo matrix at high fluence and cooled to 300 K form dense nanoclusters confined under 2 GPa of pressure, resulting in a condensed solid state. In this solid state, the white line originates from bound states or the unoccupied density of states, and the post-edge oscillations represent backscattering from neighboring Kr atoms. This clearly distinguishes the sample from gaseous Kr, which would present an essentially structureless absorption spectrum because strong core-hole lifetime broadening wipes out transitions to the Rydberg series in the gas phase. | Full credit requires mentioning the pronounced 'white line' peak and post-edge oscillations. It must also explain that gaseous Kr is essentially structureless due to strong core-hole lifetime broadening wiping out Rydberg transitions. |
| q4 | identification | 27 | If one were to model this XANES spectrum using theoretical calculations (e.g., DFT), what specific crystal structure and internal pressure should be assumed for the Kr reference to achieve a good agreement with the experimental data? | To achieve good agreement with the experimental data using DFT calculations, the Kr reference should be modeled as a face-centered cubic (FCC) solid structure at an internal pressure of 2 GPa. This specific structural model is required because the sample was prepared by implanting Kr gas into a Mo matrix to a high fluence of 2.5 × 10^16 Kr/cm2 and then cooled to 300 K. The physical confinement of the Kr atoms within the Mo matrix at room temperature generates this 2 GPa internal pressure, forcing the Kr into a 100% solid FCC phase. Consequently, modeling this exact FCC structure at 2 GPa accurately reproduces the experimental 'white line' and post-edge oscillations caused by backscattering from the dense Kr neighbors in the nanoclusters. | Full credit requires specifying a face-centered cubic (FCC) structure and an internal pressure of approximately 2 GPa. |
Review
Dissolution of rare earth elements: Exploring the ability of deep eutectic solvents and organic acid solutions, the case of lactic acid
ESRF-BM23
Synthesis
Julien Couturier et al.
DOI: 10.1016/j.seppur.2025.132740
7 scenarios
▶
#461
La leachate
La K-edge
▶
LLM Prompt
Sample Information
Material: La leachate
Method: Microwave-assisted dissolution
Precursors: La2O3, Choline chloride, Lactic acid, H2O
Temperature C: 70
Duration Hours: 0.25
Atmosphere: air
Post Treatment: Filtration at 0.2 µm
Sample-Specific Conditions
- Solvent and initial phase: DES LA, La2O3
- Leachate of La2O3 dissolved in lactic acid-based DES
Preparation
- 0.2 mmol of La2O3 added to 2 mL of DES LA (Choline chloride:lactic acid + 12 wt% H2O). Homogenized and heated by microwave at 70 °C for 15 min, followed by 0.2 µm filtration.
Measurement
We plan to measure the La K-edge XANES spectrum of this sample.
Questions
Based on all the information above:
1. What candidate reference spectra should be included in a linear combination fitting analysis to determine the La speciation in this deep eutectic solvent leachate?
2. Estimate the phase fractions of the La species present in the leachate after microwave-assisted dissolution.
3. Based on the composition of the deep eutectic solvent (choline chloride and lactic acid), explain the dissolution mechanism and the expected coordination environment of La in the leachate.
Ground Truth
Material: La leachate
Measurement: La K-edge EXAFS (transmission or fluorescence mode, BM23 beamline at ESRF)
Fit method: Linear combination fitting (LCF) of the EXAFS region (k = 2.5 to 10)
Phase fractions:
| Phase | Fraction |
|---|---|
| La-lactate sol. | 0.75 |
| Other model compounds | 0.25 |
Fit basis (paper's reference spectra):
- La-lactate sol.
- Other model compounds
Source evidence: Figure 3 and Section 3.2.1
Key reasoning: The EXAFS signal of the leachate closely matches the La-lactate solution model compound, indicating that La dissolves via ligand-promoted dissolution to form soluble lactate complexes rather than remaining as dispersed nanoparticles. The lactic acid (hydrogen bond donor) acts as the primary ligand in the La solvation sphere. There is no indication that choline chloride (hydrogen bond acceptor) is directly involved in the inner coordination sphere.
Reasoning source: Section 3.2.1
Scoring Rubric (total: 100 pts)
| Q | Type | Max | Question | Reference Answer | Scoring Criteria |
|---|---|---|---|---|---|
| q1 | identification | 30 | What candidate reference spectra should be included in a linear combination fitting analysis to determine the La speciation in this deep eutectic solvent leachate? | The linear combination fitting analysis should include a La-lactate solution reference and other model compounds. These specific reference spectra are expected because the sample was prepared by dissolving La2O3 in a deep eutectic solvent containing lactic acid and choline chloride at 70 °C. Under these microwave-assisted dissolution conditions, La undergoes ligand-promoted dissolution rather than forming dispersed nanoparticles. Consequently, lactic acid acts as the primary ligand in the La solvation sphere, forming soluble lactate complexes, while choline chloride does not directly participate in the inner coordination sphere. | Full credit for identifying La-lactate solution as the primary reference spectrum needed, along with other potential La model compounds (e.g., free La ions or other complexes) to account for the remaining fraction. |
| q2 | quantification | 30 | Estimate the phase fractions of the La species present in the leachate after microwave-assisted dissolution. | The estimated phase fractions in the leachate are 0.75 for the La-lactate solution species and 0.25 for other model compounds. These specific values result from the microwave-assisted dissolution of 0.2 mmol La2O3 in the lactic acid-based deep eutectic solvent at 70 °C for 15 minutes. During this process, the lactic acid acts as a hydrogen bond donor and serves as the primary ligand, driving a ligand-promoted dissolution mechanism. This leads to the majority of the dissolved lanthanum existing as soluble lactate complexes in the solvation sphere, rather than remaining as unreacted precursors or dispersed nanoparticles. | Full credit for estimating approximately 75% La-lactate complex and 25% other La species/model compounds. |
| q3 | reasoning | 40 | Based on the composition of the deep eutectic solvent (choline chloride and lactic acid), explain the dissolution mechanism and the expected coordination environment of La in the leachate. | The dissolution of La2O3 in the deep eutectic solvent at 70 °C proceeds via a ligand-promoted dissolution mechanism. In this solvent mixture, lactic acid acts as a hydrogen bond donor and serves as the primary ligand coordinating with the lanthanum ions. As a result, the expected coordination environment consists predominantly of soluble La-lactate complexes in the inner solvation sphere, rather than dispersed nanoparticles. Furthermore, there is no indication that choline chloride, which acts as a hydrogen bond acceptor, is directly involved in the inner coordination sphere of the dissolved La species. | Full credit for explaining that dissolution occurs via ligand-promoted dissolution where lactic acid (the hydrogen bond donor) forms soluble lactate complexes with La, while choline chloride (the hydrogen bond acceptor) does not directly participate in the inner coordination sphere. |
Review
#462
La leachate
La K-edge
▶
LLM Prompt
Sample Information
Material: La leachate
Method: Microwave-assisted dissolution
Precursors: La2(CO3)3, Choline chloride, Lactic acid, H2O
Temperature C: 70
Duration Hours: 0.25
Atmosphere: air
Post Treatment: Filtration at 0.2 µm
Sample-Specific Conditions
- Solvent and initial phase: DES LA, La2(CO3)3
- Leachate of La2(CO3)3 dissolved in lactic acid-based DES
Preparation
- 0.2 mmol of La2(CO3)3 added to 2 mL of DES LA (Choline chloride:lactic acid + 12 wt% H2O). Homogenized and heated by microwave at 70 °C for 15 min, followed by 0.2 µm filtration.
Measurement
We plan to measure the La K-edge XANES spectrum of this sample.
Questions
Based on all the information above:
1. What candidate reference spectra should be included in the linear combination fitting (LCF) basis to accurately model the speciation of La in this DES leachate?
2. Based on the dissolution conditions (La2(CO3)3 in DES LA), estimate the phase fractions of the La species present in the resulting leachate.
3. Explain the chemical mechanism driving the formation of the dominant La species in this deep eutectic solvent. Specifically, discuss the respective roles of the hydrogen bond donor (lactic acid) and hydrogen bond acceptor (choline chloride) in the dissolution and coordination of La.
Ground Truth
Material: La leachate
Measurement: La K-edge (38925 eV) EXAFS (transmission or fluorescence mode) at ESRF beamline BM23
Fit method: Linear combination fitting (LCF) of the EXAFS region (k = 2.5 to 10)
Phase fractions:
| Phase | Fraction |
|---|---|
| La-lactate sol. | 0.7 |
| Other model compounds | 0.3 |
Fit basis (paper's reference spectra):
- La-lactate sol.
- La-citrate sol.
- La3+ sol.
- La2O3
- La2(CO3)3.xH2O
- LaCl3.7H2O
- LaCl3 anhydrous
- LaPO4.xH2O
Source evidence: Figure 3 and Section 3.2.1 (page 7)
Key reasoning: The dissolution of La2(CO3)3 in the lactic acid-based DES proceeds via a ligand-promoted dissolution mechanism. Lactic acid acts as a hydrogen bond donor (HBD) and a ligand, complexing the free La3+ ions to form soluble La-lactate complexes. The EXAFS signal closely matches the La-lactate solution model compound, confirming this speciation and indicating that the choline chloride (HBA) is not directly involved in the La coordination sphere.
Reasoning source: Section 3.1.2.2 (page 5) and Section 3.2.1 (page 7)
Scoring Rubric (total: 100 pts)
| Q | Type | Max | Question | Reference Answer | Scoring Criteria |
|---|---|---|---|---|---|
| q1 | identification | 25 | What candidate reference spectra should be included in the linear combination fitting (LCF) basis to accurately model the speciation of La in this DES leachate? | The linear combination fitting (LCF) basis should include La-lactate solution, La-citrate solution, La3+ solution, La2O3, La2(CO3)3.xH2O, LaCl3.7H2O, LaCl3 anhydrous, and LaPO4.xH2O. These specific references are required because the sample is prepared by dissolving La2(CO3)3 in a lactic acid-based deep eutectic solvent (DES LA) containing choline chloride and water at 70 °C. Under these conditions, a ligand-promoted dissolution mechanism occurs where lactic acid acts as a ligand to complex La3+ ions, making La-lactate the primary expected product. The inclusion of unreacted precursor (La2(CO3)3.xH2O), potential chloride species from the choline chloride (LaCl3), and other aqueous or oxide states ensures all possible reaction outcomes and unreacted materials are accurately modeled. | Full points for identifying La-lactate solution as the primary expected reference, along with other plausible La references such as unreacted La2(CO3)3, La3+ aqueous solution, or other La-organic complexes (e.g., La-citrate) to capture any secondary species. |
| q2 | quantification | 35 | Based on the dissolution conditions (La2(CO3)3 in DES LA), estimate the phase fractions of the La species present in the resulting leachate. | The resulting leachate consists of approximately 0.7 (70%) La-lactate solution and 0.3 (30%) other model compounds. These specific fractions arise from the microwave-assisted dissolution of La2(CO3)3 in the lactic acid-based DES at 70 °C for 15 minutes. During this heating process, a ligand-promoted dissolution mechanism is driven by lactic acid, which acts as a hydrogen bond donor and actively complexes the free La3+ ions. This strong complexation mechanism yields the dominant 70% La-lactate fraction, while the remaining 30% accounts for other minor species or unreacted components remaining after the short 15-minute reaction and subsequent 0.2 µm filtration. | Full points for estimating that the dominant species is a La-lactate complex (~70%), with the remainder (~30%) being other minor model compounds or unassigned species. |
| q3 | reasoning | 40 | Explain the chemical mechanism driving the formation of the dominant La species in this deep eutectic solvent. Specifically, discuss the respective roles of the hydrogen bond donor (lactic acid) and hydrogen bond acceptor (choline chloride) in the dissolution and coordination of La. | The formation of the dominant La species is driven by a ligand-promoted dissolution mechanism occurring when La2(CO3)3 is heated at 70 °C in the DES LA solvent. In this environment, lactic acid serves a dual role as both the hydrogen bond donor (HBD) and the primary ligand, actively complexing the free La3+ ions to form soluble La-lactate complexes. Conversely, choline chloride acts as the hydrogen bond acceptor (HBA) but does not directly participate in the La coordination sphere. Because the lactic acid directly coordinates the metal while the choline chloride remains uncoordinated, the resulting EXAFS signal closely matches the La-lactate solution, which dominates the final filtered leachate. | Full points for explaining that dissolution occurs via a ligand-promoted mechanism where lactic acid (the HBD) acts as a ligand to form soluble La-lactate complexes, while the choline chloride (HBA) acts merely as a spectator and is not directly involved in the inner coordination sphere of the dissolved La. |
Review
#463
La leachate
La K-edge
▶
LLM Prompt
Sample Information
Material: La leachate
Method: Microwave-assisted dissolution
Precursors: LaCl3, Choline chloride, Lactic acid, H2O
Temperature C: 70
Duration Hours: 0.25
Atmosphere: air
Post Treatment: Filtration at 0.2 µm
Sample-Specific Conditions
- Solvent and initial phase: DES LA, LaCl3
- Leachate of LaCl3 dissolved in lactic acid-based DES
Preparation
- 0.2 mmol of LaCl3 added to 2 mL of DES LA (Choline chloride:lactic acid + 12 wt% H2O). Homogenized and heated by microwave at 70 °C for 15 min, followed by 0.2 µm filtration.
Measurement
We plan to measure the La K-edge XANES spectrum of this sample.
Questions
Based on all the information above:
1. What candidate reference spectra (basis functions) are needed to model the La speciation in this leachate using linear combination fitting?
2. Estimate the phase fractions of the La species present in the leachate after microwave-assisted dissolution of LaCl3 in the lactic acid-based deep eutectic solvent (DES LA).
3. Explain the chemical reasoning for the observed La speciation in the DES LA leachate. Specifically, address the dissolution mechanism and the respective roles of the hydrogen bond donor (lactic acid) and hydrogen bond acceptor (choline chloride) in the La coordination sphere.
Ground Truth
Material: La leachate
Measurement: La K-edge, transmission or fluorescence mode, ESRF beamline BM23
Fit method: Linear combination fitting (LCF) of the EXAFS region
Phase fractions:
| Phase | Fraction |
|---|---|
| La-lactate sol. | 0.65 |
| Other model compounds | 0.35 |
Fit basis (paper's reference spectra):
- La-lactate sol.
- Other model compounds
Source evidence: Figure 3 and Section 3.2.1
Key reasoning: The EXAFS signal of the leachate closely matches the La-lactate sol. model compound, indicating that La dissolves via ligand-promoted dissolution to form soluble lactate complexes rather than remaining as dispersed nanoparticles. The LCF results confirm La-lactate sol. is the dominant species (61-75% across all best fits). There is no indication that the hydrogen bond acceptor (ChCl) is directly involved in the La coordination sphere.
Reasoning source: Section 3.2.1
Scoring Rubric (total: 100 pts)
| Q | Type | Max | Question | Reference Answer | Scoring Criteria |
|---|---|---|---|---|---|
| q1 | identification | 30 | What candidate reference spectra (basis functions) are needed to model the La speciation in this leachate using linear combination fitting? | To model the La speciation in this leachate using linear combination fitting, the required reference spectra are a La-lactate solution and other model compounds. These specific basis functions are necessary because the sample was prepared by dissolving LaCl3 in a lactic acid-based deep eutectic solvent (DES LA) at 70 °C. Under these conditions, La undergoes ligand-promoted dissolution, reacting with the lactic acid to form soluble lactate complexes rather than remaining as dispersed nanoparticles. Consequently, the La-lactate solution spectrum serves as the primary reference to capture this dominant coordination environment resulting from the solvent composition. | Must identify La-lactate solution (or La-lactate complexes) as the primary reference, and mention other model compounds (or aqueous La species) to account for the remainder. |
| q2 | quantification | 30 | Estimate the phase fractions of the La species present in the leachate after microwave-assisted dissolution of LaCl3 in the lactic acid-based deep eutectic solvent (DES LA). | The phase fractions in the leachate are estimated to be 0.65 (or 65%) for the La-lactate solution and 0.35 (or 35%) for other model compounds. These specific values result from the microwave-assisted dissolution of 0.2 mmol LaCl3 in the lactic acid-based deep eutectic solvent at 70 °C for 15 minutes. During this process, the lactic acid drives a ligand-promoted dissolution mechanism that converts the majority of the La precursor into soluble La-lactate complexes. The 65% fraction reflects that La-lactate is the dominant species successfully formed and retained after 0.2 µm filtration under these specific heating and solvent conditions. | Must estimate La-lactate solution at approximately 65% (accept 60-75%) and other model compounds at approximately 35%. |
| q3 | reasoning | 40 | Explain the chemical reasoning for the observed La speciation in the DES LA leachate. Specifically, address the dissolution mechanism and the respective roles of the hydrogen bond donor (lactic acid) and hydrogen bond acceptor (choline chloride) in the La coordination sphere. | The observed La speciation in the leachate is driven by a ligand-promoted dissolution mechanism occurring in the lactic acid-based deep eutectic solvent at 70 °C. In this system, lactic acid acts as the hydrogen bond donor and directly coordinates with the dissolved La to form soluble La-lactate complexes, which prevents the La from remaining as dispersed nanoparticles. Conversely, there is no indication that choline chloride, the hydrogen bond acceptor, is directly involved in the La coordination sphere. Therefore, the resulting speciation is dominated by the La-lactate phase, reflecting the strong complexation role of the lactic acid precursor during the 15-minute microwave heating process. | Must explain that dissolution occurs via ligand-promoted dissolution forming La-lactate complexes. Must state that lactic acid (HBD) acts as the ligand coordinating La, while choline chloride (HBA) does not directly participate in the La coordination sphere. |
Review
#464
La leachate
La K-edge
▶
LLM Prompt
Sample Information
Material: La leachate
Method: Microwave-assisted dissolution
Precursors: LaCl3, Lactic acid, H2O
Temperature C: 70
Duration Hours: 0.25
Atmosphere: air
Post Treatment: Filtration at 0.2 µm
Sample-Specific Conditions
- Solvent and initial phase: Aqueous Lactic Acid (1M), LaCl3
- Leachate of LaCl3 dissolved in 1 M aqueous lactic acid
Preparation
- 0.2 mmol of LaCl3 added to 2 mL of 1 M aqueous lactic acid. Homogenized and heated by microwave at 70 °C for 15 min, followed by 0.2 µm filtration.
Measurement
We plan to measure the La K-edge XANES spectrum of this sample.
Questions
Based on all the information above:
1. What candidate reference spectra should be included in a linear combination fitting analysis to determine the speciation of La in this leachate?
2. Based on the sample conditions (LaCl3 dissolved in 1 M lactic acid), estimate the phase fractions of the dominant La species in the resulting leachate.
Ground Truth
Material: La leachate
Measurement: La K-edge XAS (EXAFS region) in transmission or fluorescence mode at ESRF beamline BM23
Fit method: Linear combination fitting (LCF) of the EXAFS region
Phase fractions:
| Phase | Fraction |
|---|---|
| La-lactate sol. | 0.61 |
| Other model compounds | 0.39 |
Fit basis (paper's reference spectra):
- La-lactate sol.
- Other model compounds
Source evidence: Figure 3 and Section 3.2.1, page 7
Key reasoning: The EXAFS signals of the leachates were very similar to the La-lactate sol. model compound, suggesting that La was dissolved by ligand-promoted dissolution rather than remaining as small nanoparticles that may have been dispersed in the supernatant. The LCF results confirmed that the La-lactate sol. model compound was the main component (61-75%) in all best fits, indicating that lactic acid acts as a ligand and plays a central role in the speciation of La in the leachate, forming soluble lactate complexes.
Reasoning source: Section 3.2.1, page 7
Scoring Rubric (total: 100 pts)
| Q | Type | Max | Question | Reference Answer | Scoring Criteria |
|---|---|---|---|---|---|
| q1 | identification | 46 | What candidate reference spectra should be included in a linear combination fitting analysis to determine the speciation of La in this leachate? | The linear combination fitting analysis should include the "La-lactate sol." reference spectrum along with "Other model compounds". The sample was prepared by dissolving LaCl3 in 1 M aqueous lactic acid using microwave-assisted heating at 70 °C, followed by 0.2 µm filtration. Under these conditions, lactic acid acts as a ligand that drives ligand-promoted dissolution rather than leaving La as small dispersed nanoparticles in the supernatant. Consequently, soluble La-lactate complexes dominate the speciation in the leachate, making the La-lactate solution the essential primary reference for the fit. | Full points if the answer identifies La-lactate solution as the primary reference spectrum needed, along with other potential model compounds (e.g., free La3+ ions or other La complexes) to account for the remaining fraction. |
| q2 | quantification | 54 | Based on the sample conditions (LaCl3 dissolved in 1 M lactic acid), estimate the phase fractions of the dominant La species in the resulting leachate. | The estimated phase fractions for the La leachate are 0.61 (61%) for the La-lactate solution and 0.39 (39%) for other model compounds. These specific values result from reacting 0.2 mmol of LaCl3 in 2 mL of 1 M aqueous lactic acid at 70 °C for 15 minutes. During this microwave-assisted process, the lactic acid acts as a strong ligand to drive ligand-promoted dissolution, ensuring the La does not remain as small nanoparticles dispersed in the supernatant. Therefore, lactic acid plays a central role in the speciation of the filtered leachate, successfully forming soluble lactate complexes that constitute the majority (61%) of the dissolved species. | Full points if the estimated fraction for the La-lactate complex is around 61% (allow 50-75% range), with the remainder assigned to other La species. |
Review
#465
La leachate
La K-edge
▶
LLM Prompt
Sample Information
Material: La leachate
Method: Microwave-assisted dissolution
Precursors: La2O3, Choline chloride, Lactic acid, H2O
Temperature C: 70
Duration Hours: 0.25
Atmosphere: air
Post Treatment: Filtration at 0.2 µm
Sample-Specific Conditions
- Water content: 1.4 wt% H2O
- Leachate of La2O3 dissolved in low-water lactic acid DES
Preparation
- 0.2 mmol of La2O3 added to 2 mL of ChCl:LA DES with 1.4 wt% H2O. Homogenized and heated by microwave at 70 °C for 15 min, followed by 0.2 µm filtration.
Measurement
We plan to measure the La K-edge XANES spectrum of this sample.
Questions
Based on all the information above:
1. What candidate reference spectra should be included in the linear combination fitting basis to model the speciation of La in this leachate?
2. Based on the sample conditions (dissolution in ChCl:LA DES with 1.4 wt% H2O), estimate the phase fractions of the dissolved La species in the leachate.
3. Explain the physical reasoning for the observed La speciation in this low-water DES (1.4 wt% H2O) and discuss how the reduced water content impacts the dissolution process compared to a DES with higher water content.
Ground Truth
Material: La leachate
Measurement: La K-edge (38925 eV) EXAFS, transmission or fluorescence mode, beamline BM23
Fit method: Linear combination fitting (LCF) of the EXAFS region (k = 2.5 to 10)
Phase fractions:
| Phase | Fraction |
|---|---|
| La-lactate sol. | 0.72 |
| Other model compounds | 0.28 |
Fit basis (paper's reference spectra):
- La-lactate sol.
- Other model compounds
Source evidence: Figure 5C and Section 3.3, page 9
Key reasoning: The EXAFS spectra of the leachate with reduced water content (1.4 wt%) were very similar to the standard DES LA spectrum (12 wt% H2O), showing a predominance of the La-lactate soluble complex (72-73%). This indicates that changing the water content had no effect on REE speciation in the leachates, as the hydrogen bond donor (lactic acid) forms organometallic complexes with the REE. However, the low amount of solubilized La in this low-water DES was limited by the tiny fraction of H2O available for the solubilization of the La tri-lactate complexes.
Reasoning source: Section 3.3 'Variations in H2O content and in the nature of HBA and HBD', page 9
Scoring Rubric (total: 100 pts)
| Q | Type | Max | Question | Reference Answer | Scoring Criteria |
|---|---|---|---|---|---|
| q1 | identification | 30 | What candidate reference spectra should be included in the linear combination fitting basis to model the speciation of La in this leachate? | The linear combination fitting basis should include the "La-lactate sol." (soluble complex) and "Other model compounds" as reference spectra. These specific phases are expected because the sample was prepared by dissolving La2O3 in a choline chloride and lactic acid deep eutectic solvent (DES) at 70 °C. In this environment, the lactic acid acts as a hydrogen bond donor that forms organometallic complexes with the rare earth element. Even with a low water content of 1.4 wt%, the speciation remains dominated by the La-lactate soluble complex, as the reduced water content does not alter the fundamental coordination chemistry compared to standard DES mixtures. | Full points for identifying a La-lactate solution/complex as the primary reference spectrum, and mentioning other La model compounds (such as La3+ aqueous ions or unreacted precursors) as secondary components. |
| q2 | quantification | 30 | Based on the sample conditions (dissolution in ChCl:LA DES with 1.4 wt% H2O), estimate the phase fractions of the dissolved La species in the leachate. | The phase fractions of the dissolved La species in the leachate are estimated to be 0.72 (72%) for the La-lactate soluble complex and 0.28 (28%) for other model compounds. These specific values result from the interaction between the La2O3 precursor and the lactic acid in the deep eutectic solvent during the 15-minute microwave-assisted dissolution at 70 °C. The lactic acid acts as a hydrogen bond donor that readily forms organometallic complexes with the dissolved lanthanum. The reduced water content (1.4 wt% H2O) does not alter the fundamental REE speciation compared to standard DES mixtures (12 wt% H2O), leading to the continued predominance of the La-lactate complex. | Full points for estimating approximately 72-73% La-lactate complex and 27-28% other model compounds/species. |
| q3 | reasoning | 40 | Explain the physical reasoning for the observed La speciation in this low-water DES (1.4 wt% H2O) and discuss how the reduced water content impacts the dissolution process compared to a DES with higher water content. | The observed La speciation is dominated by the La-lactate soluble complex because the lactic acid in the deep eutectic solvent acts as a hydrogen bond donor that forms stable organometallic complexes with the rare earth elements. Reducing the water content to a low 1.4 wt% during the 70 °C microwave dissolution has no effect on the actual REE speciation, which remains very similar to that of a standard DES with 12 wt% H2O. However, the reduced water content significantly impacts the overall dissolution process by limiting the total amount of solubilized La. This limitation occurs because the tiny fraction of available H2O is insufficient for the optimal solubilization of the formed La tri-lactate complexes. | Full points for explaining that the speciation remains dominated by La-lactate complexes because the hydrogen bond donor (lactic acid) drives the complexation regardless of water content. Furthermore, the answer must note that the low water content limits the overall solubility/capacity of these complexes in the aqueous fraction, leading to lower total dissolution but identical speciation for the fraction that does dissolve. |
Review
#466
La leachate
La K-edge
▶
LLM Prompt
Sample Information
Material: La leachate
Method: Microwave-assisted dissolution
Precursors: La2O3, Guanidine hydrochloride, Lactic acid, H2O
Temperature C: 70
Duration Hours: 0.25
Atmosphere: air
Post Treatment: Filtration at 0.2 µm
Sample-Specific Conditions
- Hydrogen bond acceptor: Guanidine hydrochloride (GuCl)
- Leachate of La2O3 dissolved in guanidine-based lactic acid DES
Preparation
- 0.2 mmol of La2O3 added to 2 mL of GuCl:LA DES with 12 wt% H2O. Homogenized and heated by microwave at 70 °C for 15 min, followed by 0.2 µm filtration.
Measurement
We plan to measure the La K-edge XANES spectrum of this sample.
Questions
Based on all the information above:
1. What reference spectra or basis functions should be considered for linear combination fitting of the La K-edge XAS data for this leachate sample?
2. Based on the sample conditions (La2O3 dissolved in GuCl:LA DES with 12 wt% H2O), estimate the phase fractions of the La species present in the leachate.
3. Explain the chemical reasoning for the expected speciation in this leachate. Specifically, how does the use of guanidine hydrochloride as the hydrogen bond acceptor (HBA) instead of choline chloride affect the La speciation, and what role does the lactic acid play?
Ground Truth
Material: La leachate
Measurement: La K-edge XAS (EXAFS region), transmission or fluorescence mode, BM23 beamline at ESRF
Fit method: Linear combination fitting (LCF) of the EXAFS region (k = 2.5 to 10)
Phase fractions:
| Phase | Fraction |
|---|---|
| La-lactate sol. | 0.73 |
| Other model compounds | 0.27 |
Fit basis (paper's reference spectra):
- La-lactate sol.
- Other model compounds
Source evidence: Figure 5C, page 11
Key reasoning: The EXAFS spectrum of the leachate is very similar to the La-lactate sol. model compound, indicating that La is dissolved by ligand-promoted dissolution forming soluble lactate complexes. Changing the hydrogen bond acceptor (HBA) from choline chloride to guanidine hydrochloride (GuCl) has no effect on REE speciation in the leachates. The ability of the hydrogen bond donor (HBD, lactic acid) to form organometallic REE-HBD complexes determines the speciation in solution, while the HBA is not directly involved in the dissolution processes.
Reasoning source: Section 3.3, page 9
Scoring Rubric (total: 100 pts)
| Q | Type | Max | Question | Reference Answer | Scoring Criteria |
|---|---|---|---|---|---|
| q1 | identification | 30 | What reference spectra or basis functions should be considered for linear combination fitting of the La K-edge XAS data for this leachate sample? | The basis functions for linear combination fitting of the La K-edge XAS data should include a "La-lactate sol." reference and "Other model compounds". These specific references are expected because the sample is prepared by dissolving La2O3 in a deep eutectic solvent containing lactic acid (the hydrogen bond donor) and guanidine hydrochloride (the hydrogen bond acceptor). During the microwave-assisted dissolution at 70 °C, the lactic acid drives ligand-promoted dissolution to form soluble La-lactate complexes. The guanidine hydrochloride does not directly participate in the dissolution process, making the La-lactate solution the primary structural reference needed to model the resulting speciation. | Full credit for identifying La-lactate solution as the primary reference spectrum. Partial credit for mentioning other La-organic complexes or unreacted La2O3. |
| q2 | quantification | 30 | Based on the sample conditions (La2O3 dissolved in GuCl:LA DES with 12 wt% H2O), estimate the phase fractions of the La species present in the leachate. | The estimated phase fractions for the La species in the leachate are 0.73 (73%) for the La-lactate solution and 0.27 (27%) for other model compounds. These specific values result from the dissolution of La2O3 in the guanidine hydrochloride and lactic acid deep eutectic solvent at 70 °C. The high fraction of La-lactate solution (73%) occurs because the lactic acid acts as a hydrogen bond donor that actively drives ligand-promoted dissolution, forming stable organometallic REE-HBD complexes in solution. The remaining 27% represents other minor species, confirming that the hydrogen bond acceptor (GuCl) does not alter the primary speciation pathway dominated by the lactic acid. | Full credit for estimating ~73% La-lactate complex and ~27% other species/model compounds. Partial credit for stating that La-lactate is the dominant species (>60%). |
| q3 | reasoning | 40 | Explain the chemical reasoning for the expected speciation in this leachate. Specifically, how does the use of guanidine hydrochloride as the hydrogen bond acceptor (HBA) instead of choline chloride affect the La speciation, and what role does the lactic acid play? | In this leachate, the speciation is primarily determined by the lactic acid, which acts as the hydrogen bond donor (HBD) and drives ligand-promoted dissolution to form soluble La-lactate complexes. The use of guanidine hydrochloride (GuCl) as the hydrogen bond acceptor (HBA) instead of choline chloride has no effect on the final rare earth element speciation. This is because the HBA is not directly involved in the dissolution process or the coordination environment of the dissolved metal. Consequently, the microwave-assisted dissolution of La2O3 at 70 °C in this specific DES yields a solution dominated by organometallic REE-HBD complexes, regardless of the specific HBA used. | Full credit for explaining that the HBA (GuCl) does not affect the speciation, as it is not directly involved in the dissolution process. The speciation is dominated by ligand-promoted dissolution driven by the hydrogen bond donor (lactic acid), forming soluble La-lactate complexes. |
Review
#467
La leachate
La K-edge
▶
LLM Prompt
Sample Information
Material: La leachate
Method: Microwave-assisted dissolution
Precursors: La2O3, Choline chloride, Citric acid, H2O
Temperature C: 70
Duration Hours: 0.25
Atmosphere: air
Post Treatment: Filtration at 0.2 µm
Sample-Specific Conditions
- Hydrogen bond donor: Citric acid (CA)
- Leachate of La2O3 dissolved in citric acid-based DES
Preparation
- 0.2 mmol of La2O3 added to 2 mL of ChCl:CA (citric acid) DES with 10 wt% H2O. Homogenized and heated by microwave at 70 °C for 15 min, followed by 0.2 µm filtration.
Measurement
We plan to measure the La K-edge XANES spectrum of this sample.
Questions
Based on all the information above:
1. Based on the sample conditions (La2O3 dissolved in a ChCl:citric acid DES with 10 wt% H2O), what are the expected dominant La species in the leachate and their approximate phase fractions?
2. What candidate reference spectra should be included as basis functions for a linear combination fitting (LCF) analysis of this sample?
3. Explain the chemical reasoning for the observed speciation and why the use of citric acid as the hydrogen bond donor leads to a lower dissolution yield compared to lactic acid.
Ground Truth
Material: La leachate
Measurement: La K-edge EXAFS (transmission or fluorescence mode, beamline BM23 at ESRF)
Fit method: Linear combination fitting (LCF) of the EXAFS region (k = 2.5 to 10)
Phase fractions:
| Phase | Fraction |
|---|---|
| La-citrate sol. | 0.82 |
| Other model compounds | 0.18 |
Fit basis (paper's reference spectra):
- La-citrate sol.
- La-lactate sol.
- La3+ sol.
- La2O3
- La2(CO3)3.xH2O
- LaCl3.7H2O
- LaCl3 anhydrous
- LaPO4.xH2O
Source evidence: Figure 5C, page 11
Key reasoning: Changing the hydrogen bond donor (HBD) from lactic acid to citric acid results in the dominant presence (82%) of a La-citrate complex in solution. La citrate complexes are easier to form (β1 = 7.1) than La tri-lactate complexes (β3 = 5.7), but they are also particularly insoluble in water. This high insolubility of the formed La-citrate complexes explains both the observed speciation and the significantly reduced La dissolution yield (15 wt%) compared to the lactic acid-based DES.
Reasoning source: Section 3.3, page 9
Scoring Rubric (total: 100 pts)
| Q | Type | Max | Question | Reference Answer | Scoring Criteria |
|---|---|---|---|---|---|
| q1 | quantification | 35 | Based on the sample conditions (La2O3 dissolved in a ChCl:citric acid DES with 10 wt% H2O), what are the expected dominant La species in the leachate and their approximate phase fractions? | The dominant La species in the leachate is a La-citrate complex in solution, accounting for approximately 0.82 (82%) of the phase fraction, with other model compounds making up the remaining 0.18 (18%). This speciation occurs because the sample was prepared by dissolving La2O3 in a deep eutectic solvent using citric acid as the hydrogen bond donor. Citric acid readily reacts with the dissolved lanthanum to form La-citrate complexes, which are thermodynamically very favorable to form (β1 = 7.1). Consequently, despite the short 15-minute microwave heating at 70 °C, the strong complexation drive ensures that La-citrate dominates the final filtered leachate. | Full points for identifying La-citrate complex as the dominant species at ~82% and other minor compounds at ~18%. Partial points for identifying the correct major phase without exact fractions. |
| q2 | identification | 25 | What candidate reference spectra should be included as basis functions for a linear combination fitting (LCF) analysis of this sample? | The candidate reference spectra for the LCF analysis should include La-citrate solution, La-lactate solution, La3+ solution, La2O3, La2(CO3)3.xH2O, LaCl3.7H2O, anhydrous LaCl3, and LaPO4.xH2O. These specific references are chosen to account for the precursors, potential reaction products, and the specific solvent environment used in the sample preparation. Because the sample is a leachate formed by reacting La2O3 in a choline chloride and citric acid deep eutectic solvent with 10 wt% water, references like La2O3 (unreacted precursor), La-citrate solution (primary reaction product), and La3+ solution are essential. The inclusion of these phases allows the LCF to accurately capture the dominant formation of the highly favorable La-citrate complex (β1 = 7.1) driven by the citric acid hydrogen bond donor. | Full points for listing La-citrate solution, La-lactate solution, free La3+ ions, and relevant solid precursors/precipitates (e.g., La2O3, La carbonates, La chlorides). |
| q3 | reasoning | 40 | Explain the chemical reasoning for the observed speciation and why the use of citric acid as the hydrogen bond donor leads to a lower dissolution yield compared to lactic acid. | The observed speciation of 82% La-citrate complex is driven by the use of citric acid as the hydrogen bond donor in the deep eutectic solvent. La-citrate complexes are thermodynamically easier to form (stability constant β1 = 7.1) compared to complexes formed with other donors like lactic acid (La tri-lactate β3 = 5.7). However, these La-citrate complexes are particularly insoluble in water. Therefore, when La2O3 is heated at 70 °C in the ChCl:citric acid mixture with 10 wt% H2O, the readily formed La-citrate precipitates out and is removed during the 0.2 µm filtration step, resulting in a significantly reduced La dissolution yield (15 wt%) in the final leachate. | Full points for explaining that La-citrate complexes form more easily (higher stability constant) than La-lactate complexes, but are highly insoluble in water, leading to precipitation and a low overall dissolution yield while dominating the soluble fraction. |
Review
Evidence of hydrogen content and monovalent Ni oxidation state in non-superconducting bulk anchored infinite-layer nickelates
ESRF-BM23
Synthesis
Javier Gainza et al.
DOI: 10.1016/j.xcrp.2023.101724
1 scenario
▶
#468
LaNi0.9Al0.1O2
Ni K
▶
LLM Prompt
Sample Information
Material: LaNi0.9Al0.1O2
Method: topotactic reduction
Precursors: LaNi0.9Al0.1O3, CaH2
Temperature C: 280
Duration Hours: 6
Atmosphere: vacuum
Cooling Method: cooled down to room temperature
Post Treatment: washed with 0.1 M NH4Cl and methanol for 1-2 h, filtered
Sample-Specific Conditions
- reduction: CaH2 at 280°C
- Reduced anchored infinite-layer nickelate
Preparation
- Precursor LaNi0.9Al0.1O3 prepared by citrate-nitrate route (La2O3, Al(NO3)3·9H2O, Ni(NO3)2·6H2O in citric/nitric acid), calcined at 600°C (12h) and 800°C (2h) in air, then 900°C under 200 bar O2 for 12h. Reduced by mixing with CaH2, sealed under vacuum, heated to 280°C for 6h, washed with 0.1 M NH4Cl in methanol.
Measurement
We plan to measure the Ni K XANES spectrum of this sample.
Questions
Based on all the information above:
1. Based on the topotactic reduction of LaNi0.9Al0.1O3 with CaH2 at 280°C, what is the expected oxidation state of Ni in the resulting LaNi0.9Al0.1O2 phase, and what reference spectra would be most appropriate to confirm this assignment?
2. What is the expected Ni K-edge position (in eV) for this reduced sample, and how does this position justify the assigned oxidation state?
3. Describe the expected differences in the post-edge XANES region of LaNi0.9Al0.1O2 compared to its precursor LaNiO3 or standard NiO, and explain the structural origin of these differences.
Ground Truth
Material: LaNi0.9Al0.1O2
Measurement: Ni K-edge, transmission mode, ESRF beamline BM23
Fit method: direct comparison of edge position
Phase fractions:
| Phase | Fraction |
|---|---|
| LaNi0.9Al0.1O2 | 1.0 |
Fit basis (paper's reference spectra):
- Ni foil (Ni0)
- NiO (Ni2+)
- NiTiO3 (Ni2+)
- LaNiO3 (Ni3+)
Source evidence: Figure 7, Table 3, page 9-12
Key reasoning: The edge position of LaNi0.9Al0.1O2 is at 8,336.6 eV, which lies between that of Ni foil (Ni0, 8333.0 eV) and NiO (Ni2+, 8339.1 eV). This progressive blueshift with oxidation state strongly indicates a Ni valence state of 1+. Furthermore, the XANES features after the edge differ strongly from octahedral Ni compounds, reflecting the lower coordination number (4) in the square planar/pyramidal environment of the infinite-layer structure.
Reasoning source: X-ray absorption results section, page 9-11
Scoring Rubric (total: 100 pts)
| Q | Type | Max | Question | Reference Answer | Scoring Criteria |
|---|---|---|---|---|---|
| q1 | reasoning | 30 | Based on the topotactic reduction of LaNi0.9Al0.1O3 with CaH2 at 280°C, what is the expected oxidation state of Ni in the resulting LaNi0.9Al0.1O2 phase, and what reference spectra would be most appropriate to confirm this assignment? | The expected oxidation state of Ni in the resulting LaNi0.9Al0.1O2 phase is 1+. To confirm this assignment, the most appropriate reference spectra are Ni foil (Ni0), NiO (Ni2+), NiTiO3 (Ni2+), and LaNiO3 (Ni3+). This 1+ state arises because the topotactic reduction of the LaNi0.9Al0.1O3 precursor with CaH2 at 280°C in a vacuum selectively removes oxygen from the lattice, reducing the initial Ni3+ ions. By comparing the sample's XANES edge position against these standard Ni0, Ni2+, and Ni3+ references, the progressive blueshift associated with increasing oxidation states can be used to definitively identify the intermediate Ni1+ valence. | Full points for identifying the Ni1+ oxidation state and suggesting appropriate references that bracket this state (e.g., Ni0 foil and Ni2+ oxides like NiO or NiTiO3). |
| q2 | spectral | 35 | What is the expected Ni K-edge position (in eV) for this reduced sample, and how does this position justify the assigned oxidation state? | The expected Ni K-edge position for the reduced LaNi0.9Al0.1O2 sample is 8336.6 eV. This specific energy value justifies the assigned 1+ oxidation state because it lies directly between the edge positions of Ni foil (Ni0, 8333.0 eV) and NiO (Ni2+, 8339.1 eV). The topotactic reduction of the precursor with CaH2 at 280°C removes oxygen from the lattice, lowering the initial Ni3+ valence. Since XANES edge positions exhibit a progressive blueshift with increasing oxidation state, this intermediate edge position of 8336.6 eV definitively confirms the successful reduction to a Ni1+ state. | Full points for stating an edge position around 8336.6 eV and explaining that it falls between the edge positions of Ni0 (metallic Ni) and Ni2+ (e.g., NiO), indicating a 1+ valence state. |
| q3 | reasoning | 35 | Describe the expected differences in the post-edge XANES region of LaNi0.9Al0.1O2 compared to its precursor LaNiO3 or standard NiO, and explain the structural origin of these differences. | The post-edge XANES region of LaNi0.9Al0.1O2 exhibits strong differences and unique spectral shapes compared to octahedral Ni2+/Ni3+ compounds like LaNiO3 or NiO. These differences originate from the structural transformation induced by the topotactic reduction with CaH2 at 280°C, which removes apical oxygens to form an anchored infinite-layer nickelate. As a result, the Ni atoms transition from a 6-coordinate octahedral geometry to a lower coordination number of 4 in a square planar or pyramidal environment. The distinct post-edge features directly reflect this reduced coordination number, alongside the complex second-nearest-neighbor environment containing Al, La, and H. | Full points for noting strong differences in the post-edge features compared to octahedral Ni compounds, and attributing this to the lower coordination number (4) and the complex second-nearest-neighbor environment (Al, La, H) in the infinite-layer structure. |
Review
Local Structure of Sulfur Vacancies on the Basal Plane of Monolayer MoS 2
ESRF-BM23
Catalyst
Angel T. Garcia-Esparza et al.
DOI: 10.1021/ACSNANO.2C01388
1 scenario
▶
#469
MoS2
Mo K
▶
LLM Prompt
Sample Information
Material: MoS2
Support: SiNx or Si/Au
Reaction Conditions: 10% H2/He, 101.3 kPa, 25 °C
Sample-Specific Conditions
- Temperature: 25 °C
- Monolayer MoS2 under 10% H2/He atmosphere at 25 °C
Measurement
We plan to measure the Mo K XANES spectrum of this sample.
Questions
Based on all the information above:
1. Based on the provided sample conditions (25 °C, 10% H2/He), what is the expected dominant phase, and what physical reasoning justifies this?
2. Describe the expected spectral shape of the Mo K-edge XANES for this sample, including the approximate edge position and main peak features.
Ground Truth
Material: MoS2
Measurement: Mo K-edge operando XANES in conversion electron yield mode at SSRL beamline 4-1
Fit method: not reported
Phase fractions:
| Phase | Fraction |
|---|---|
| MoS2 | 1.0 |
Fit basis (paper's reference spectra):
- MoS2
Source evidence: Figure 3a, page 4
Key reasoning: At 25 °C under H2 atmosphere, the monolayer MoS2 remains in its pristine, stoichiometric state. The Mo K-edge XANES shows that the Mo electronic structure and the 6-fold Mo-Mo coordination remain unperturbed, preserving the crystal domain integrity of the monolayer.
Reasoning source: Page 4, Results and Discussion
Scoring Rubric (total: 100 pts)
| Q | Type | Max | Question | Reference Answer | Scoring Criteria |
|---|---|---|---|---|---|
| q1 | reasoning | 43 | Based on the provided sample conditions (25 °C, 10% H2/He), what is the expected dominant phase, and what physical reasoning justifies this? | The expected dominant phase for this sample is pristine MoS2, comprising 100% of the composition. This occurs because, at the mild temperature of 25 °C under a 10% H2/He atmosphere, the monolayer MoS2 remains in its stoichiometric state without undergoing reduction or structural degradation. Under these specific conditions, the Mo electronic structure and the 6-fold Mo-Mo coordination remain completely unperturbed. Consequently, the crystal domain integrity of the monolayer is preserved, preventing the formation of any secondary phases. | Full credit for identifying MoS2 as the pure phase (fraction 1.0) and explaining that at 25 °C under H2, the monolayer MoS2 remains stoichiometric and its Mo electronic structure is unperturbed. |
| q2 | spectral | 57 | Describe the expected spectral shape of the Mo K-edge XANES for this sample, including the approximate edge position and main peak features. | The expected Mo K-edge XANES spectrum exhibits a sharp absorption edge near 20000 eV, followed by a prominent white line peak around 20030 eV with a normalized absorption intensity of approximately 1.1. These spectral features arise because the sample is held at 25 °C in a 10% H2/He atmosphere, which preserves the pristine, stoichiometric state and the 6-fold Mo-Mo coordination of the monolayer MoS2. Because the Mo electronic structure remains unperturbed under these mild conditions, the spectrum reflects the intact crystal domain integrity of the monolayer. Furthermore, this spectral shape shows negligible differences compared to samples annealed at higher temperatures, indicating that the Mo electronic structure is largely unaffected even if basal plane S-vacancies were to form. | Full credit for mentioning a sharp absorption edge near 20000 eV and a prominent white line peak around 20030 eV with a normalized intensity of ~1.1. |
Review
Evidence from in Situ X-ray Absorption Spectroscopy for the Involvement of Terminal Disulfide in the Reduction of Protons by an Amorphous Molybdenum Sulfide Electrocatalyst
ESRF-BM23
Catalyst
Benedikt Lassalle-Kaiser et al.
DOI: 10.1021/JA510328M
2 scenarios
▶
#470
MoSx
Mo K
▶
LLM Prompt
Sample Information
Material: MoSx
Sample-Specific Conditions
- State: As prepared
- As prepared amorphous molybdenum sulfide electrocatalyst
Measurement
We plan to measure the Mo K XANES spectrum of this sample.
Questions
Based on all the information above:
1. What is the expected dominant phase for the as-prepared amorphous molybdenum sulfide (MoSx) electrocatalyst?
2. If you were to perform Linear Combination Fitting (LCF) on the Mo K-edge XANES spectrum of this as-prepared sample, what reference spectrum is essential to include as a basis?
3. Explain the physical reasoning for why MoS3 is the expected phase for this specific sample condition.
Ground Truth
Material: MoSx
Measurement: Mo K-edge ex-situ
Fit method: not reported
Phase fractions: (±10%)
| Phase | Fraction |
|---|---|
| MoS3 | 1.0 |
Fit basis (paper's reference spectra):
- MoS3
Source evidence: text
Key reasoning: The as prepared amorphous molybdenum sulfide electrocatalyst (MoSx) is composed entirely of the MoS3 phase prior to any further treatment or reaction conditions.
Reasoning source: text
Scoring Rubric (total: 100 pts)
| Q | Type | Max | Question | Reference Answer | Scoring Criteria |
|---|---|---|---|---|---|
| q1 | identification | 40 | What is the expected dominant phase for the as-prepared amorphous molybdenum sulfide (MoSx) electrocatalyst? | The expected dominant phase for the as-prepared amorphous molybdenum sulfide (MoSx) electrocatalyst is MoS3. This phase accounts for 100% of the sample composition, yielding a phase fraction of 1.0. This occurs because, in its initial as-prepared state prior to any further treatment or reaction conditions, the amorphous MoSx material is composed entirely of the MoS3 phase. Consequently, the Mo K-edge XANES spectrum will exclusively reflect the structural and electronic properties of this single MoS3 phase. | Full credit for identifying MoS3 as the dominant or sole phase (100%). |
| q2 | reasoning | 30 | If you were to perform Linear Combination Fitting (LCF) on the Mo K-edge XANES spectrum of this as-prepared sample, what reference spectrum is essential to include as a basis? | A reference spectrum for MoS3 is essential to include as the basis for Linear Combination Fitting (LCF) of this sample. The sample is an amorphous molybdenum sulfide (MoSx) electrocatalyst in its as-prepared state. Prior to any further treatment or reaction conditions, this specific as-prepared material is composed entirely of the MoS3 phase, representing a phase fraction of 1.0. Therefore, the MoS3 reference is the only necessary basis component to accurately model the Mo K-edge XANES spectrum, as it fully captures the composition of the initial material. | Full credit for stating MoS3 is the essential reference spectrum. |
| q3 | reasoning | 30 | Explain the physical reasoning for why MoS3 is the expected phase for this specific sample condition. | For this specific sample condition, the material is an amorphous molybdenum sulfide (MoSx) electrocatalyst in its initial "as-prepared" state. The reasoning for expecting MoS3 is that prior to undergoing any further treatment or reaction conditions, the synthesis of this amorphous MoSx material inherently yields a composition consisting entirely of the MoS3 phase. Because no external stimuli or electrochemical reactions have yet altered its structure, the initial state remains 100% MoS3. Consequently, the Mo K-edge XANES measurement will exclusively probe the structural and electronic environment of this unreacted MoS3 phase. | Full credit for explaining that it is the initial 'as prepared' state of the amorphous molybdenum sulfide electrocatalyst prior to any reaction or treatment. |
Review
#471
MoSx
Mo K
▶
LLM Prompt
Sample Information
Material: MoSx
Reaction Conditions: pH = 2 aqueous HNO3, -0.3 V vs RHE
Sample-Specific Conditions
- Applied potential: -0.3 V vs RHE
- Amorphous molybdenum sulfide electrocatalyst under catalytic conditions
Measurement
We plan to measure the Mo K XANES spectrum of this sample.
Questions
Based on all the information above:
1. Based on the reaction conditions (pH = 2 aqueous HNO3, -0.3 V vs RHE), what is the expected dominant phase of the MoSx electrocatalyst?
2. What candidate reference spectrum is essential for modeling the in-situ Mo K-edge XANES data of this sample?
3. Explain the structural state of the MoSx catalyst under the applied potential of -0.3 V vs RHE.
Ground Truth
Material: MoSx
Measurement: Mo K-edge, in-situ
Fit method: not reported
Phase fractions: (±10%)
| Phase | Fraction |
|---|---|
| MoS2 (amorphous) | 1.0 |
Fit basis (paper's reference spectra):
- MoS2 (amorphous)
Source evidence: Sample conditions and phase fractions provided in text
Key reasoning: Under the applied catalytic conditions of -0.3 V vs RHE in pH = 2 aqueous HNO3, the amorphous molybdenum sulfide (MoSx) electrocatalyst is maintained entirely as amorphous MoS2.
Reasoning source: Sample description
Scoring Rubric (total: 100 pts)
| Q | Type | Max | Question | Reference Answer | Scoring Criteria |
|---|---|---|---|---|---|
| q1 | identification | 30 | Based on the reaction conditions (pH = 2 aqueous HNO3, -0.3 V vs RHE), what is the expected dominant phase of the MoSx electrocatalyst? | The expected dominant phase of the MoSx electrocatalyst is amorphous MoS2, which accounts for 100% (fraction of 1.0) of the material. This specific phase arises because the amorphous molybdenum sulfide (MoSx) electrocatalyst is subjected to active catalytic conditions of -0.3 V vs RHE in a pH = 2 aqueous HNO3 electrolyte. Under this applied potential and acidic environment, the material is maintained entirely in the amorphous MoS2 state without transforming into other phases. | Full points for identifying amorphous MoS2 as the sole or dominant phase (fraction = 1.0). |
| q2 | identification | 30 | What candidate reference spectrum is essential for modeling the in-situ Mo K-edge XANES data of this sample? | The essential candidate reference spectrum for modeling the in-situ Mo K-edge XANES data is amorphous MoS2. This reference is required because the MoSx electrocatalyst is measured under active catalytic conditions of -0.3 V vs RHE in pH = 2 aqueous HNO3. Under this specific applied potential, the material is maintained entirely as amorphous MoS2, representing a phase fraction of 1.0. Consequently, the amorphous MoS2 spectrum alone is sufficient and necessary to accurately fit the structural state of the catalyst in this environment. | Full points for stating that an amorphous MoS2 reference spectrum is required. |
| q3 | reasoning | 40 | Explain the structural state of the MoSx catalyst under the applied potential of -0.3 V vs RHE. | Under the applied potential of -0.3 V vs RHE, the structural state of the MoSx catalyst is entirely amorphous MoS2, representing a phase fraction of 1.0. This structural state occurs because the material is an amorphous molybdenum sulfide electrocatalyst operating under specific catalytic conditions in pH = 2 aqueous HNO3. The combination of this acidic environment and the -0.3 V vs RHE applied potential maintains the catalyst completely in the amorphous MoS2 phase. Thus, the applied electrochemical conditions preserve the fully amorphous MoS2 structure without inducing crystallization or phase changes. | Full points for explaining that under these specific catalytic conditions, the material exists entirely as amorphous MoS2. |
Review
Structural Interconversion between Agglomerated Palladium Domains and Mononuclear Pd(II) Cations in Chabazite Zeolites
APS
Catalyst
Trevor M. Lardinois et al.
DOI: 10.1021/acs.chemmater.0c04465
5 scenarios
▶
#472
Pd/CHA
Pd Pd K-edge
▶
LLM Prompt
Sample Information
Material: Pd/CHA
Support: CHA zeolite
Reaction Conditions: ambient
Sample-Specific Conditions
- treatment: ambient
- As-exchanged Pd-CHA zeolite under ambient atmosphere
Measurement
We plan to measure the Pd Pd K-edge XANES spectrum of this sample.
Questions
Based on all the information above:
1. Identify the dominant Pd phase and its oxidation state in the as-exchanged Pd-CHA zeolite under ambient conditions. What reference spectra would be appropriate to verify this oxidation state?
2. What is the expected Pd K-edge position (in eV) for this sample, and what does this specific edge energy indicate about the state of the Pd species?
Ground Truth
Material: Pd/CHA
Measurement: Pd K-edge transmission mode at sector 10BM
Fit method: not reported
Phase fractions: (±10%)
| Phase | Fraction |
|---|---|
| [Pd(NH3)4]2+ | 1.0 |
Fit basis (paper's reference spectra):
- PdO standard
- [Pd(NH3)4]2+ complexes
Source evidence: Page 5, Section 3.1
Key reasoning: The sample was prepared by incipient wetness impregnation of an aqueous Pd(NH3)4(NO3)2 solution. Under ambient conditions prior to thermal treatment, the as-exchanged sample retains the precursor's coordination, predominantly forming mononuclear Pd2+ in the form of [Pd(NH3)4]2+ complexes charge-compensated by the zeolite lattice or nitrate anions. This is supported by the Pd K-edge XANES edge energy of 24.353 keV, which indicates divalent Pd, and EXAFS fitting showing a Pd-N coordination number of ~4.
Reasoning source: Section 3.1, Page 5
Scoring Rubric (total: 100 pts)
| Q | Type | Max | Question | Reference Answer | Scoring Criteria |
|---|---|---|---|---|---|
| q1 | identification | 50 | Identify the dominant Pd phase and its oxidation state in the as-exchanged Pd-CHA zeolite under ambient conditions. What reference spectra would be appropriate to verify this oxidation state? | The dominant Pd phase in the as-exchanged Pd-CHA zeolite is [Pd(NH3)4]2+ complexes (fraction 1.0) with an oxidation state of Pd2+. Appropriate reference spectra to verify this oxidation state include a PdO standard and [Pd(NH3)4]2+ complexes. This specific phase and oxidation state arise because the sample is kept under ambient conditions prior to any thermal treatment. Having been prepared by incipient wetness impregnation of an aqueous Pd(NH3)4(NO3)2 solution, the unheated sample retains the precursor's coordination, predominantly forming mononuclear Pd2+ complexes that are charge-compensated by the zeolite lattice or nitrate anions. | Full points for identifying [Pd(NH3)4]2+ as the dominant phase, Pd2+ as the oxidation state, and suggesting PdO or [Pd(NH3)4]2+ reference spectra. |
| q2 | spectral | 50 | What is the expected Pd K-edge position (in eV) for this sample, and what does this specific edge energy indicate about the state of the Pd species? | The expected Pd K-edge position for this sample is 24,353 eV. This specific edge energy indicates that the Pd species is divalent (Pd2+), which distinguishes it from reduced metallic Pd species. These spectral features arise because the as-exchanged Pd-CHA sample is maintained under ambient conditions prior to thermal treatment, causing it to retain the original precursor's coordination. As a result, the sample consists entirely of mononuclear [Pd(NH3)4]2+ complexes charge-compensated by the zeolite lattice or nitrate anions, producing an edge energy characteristic of divalent Pd that is similar to PdO and [Pd(NH3)4]2+ reference standards. | Full points for stating an edge position of 24353 eV (or 24.353 keV) and explaining that it indicates the presence of divalent Pd (Pd2+), distinguishing it from metallic Pd. |
Review
#473
Pd/CHA
Pd Pd K-edge
▶
LLM Prompt
Sample Information
Material: Pd/CHA
Support: CHA zeolite
Reaction Conditions: ambient
Sample-Specific Conditions
- treatment: hydrated
- Hydrated mononuclear Pd2+ cations in CHA zeolite
Measurement
We plan to measure the Pd Pd K-edge XANES spectrum of this sample.
Questions
Based on all the information above:
1. What is the dominant Pd phase expected for a Pd/CHA zeolite containing mononuclear Pd2+ after exposure to a hydrated environment at ambient conditions, and what physical changes occur to the Pd coordination environment compared to the dehydrated state?
2. Based on X-ray absorption spectroscopy, what are the expected oxidation state and local geometry of the Pd species in this hydrated sample?
Ground Truth
Material: Pd/CHA
Measurement: Pd K-edge transmission mode at sector 10BM
Fit method: Not reported
Phase fractions: (±10%)
| Phase | Fraction |
|---|---|
| [Pd(H2O)4]2+ / [Pd(H2O)3(OH)]+ | 1.0 |
Source evidence: Table 1 and Section 3.2.1, page 7
Key reasoning: Exposure of mononuclear Pd2+ sites in CHA zeolites to a flowing wet inert stream (1-2 kPa H2O in balance Ar at 303 K) leads to full hydration. Water exposure changes the coordination of mononuclear Pd2+ ions, solvating them away from the zeolite framework oxygen to form [Pd(H2O)4]2+ or [Pd(H2O)3(OH)]+ complexes. This is evidenced by DRUV-Vis d-d transition bands shifting to ~400 nm (consistent with aqueous [Pd(H2O)4]2+) and EXAFS spectra showing a lack of second-shell Pd-Al/Si scattering.
Reasoning source: Section 3.2.1, page 7
Scoring Rubric (total: 100 pts)
| Q | Type | Max | Question | Reference Answer | Scoring Criteria |
|---|---|---|---|---|---|
| q1 | identification | 57 | What is the dominant Pd phase expected for a Pd/CHA zeolite containing mononuclear Pd2+ after exposure to a hydrated environment at ambient conditions, and what physical changes occur to the Pd coordination environment compared to the dehydrated state? | The dominant Pd phase expected is 100% [Pd(H2O)4]2+ or [Pd(H2O)3(OH)]+ complexes. Under ambient hydrated conditions (exposure to a wet inert stream at 303 K), the mononuclear Pd2+ sites in the CHA zeolite undergo full hydration. This water exposure fundamentally changes the coordination of the Pd2+ ions by solvating them away from the zeolite framework oxygen. Consequently, the Pd species detach from the framework to form these fully hydrated complexes, a physical change evidenced by the lack of second-shell Pd-Al/Si scattering. | Full credit for identifying [Pd(H2O)4]2+ or [Pd(H2O)3(OH)]+ and explaining that water exposure changes the coordination of the Pd2+ ions by solvating them away from the zeolite framework oxygen. |
| q2 | spectral | 43 | Based on X-ray absorption spectroscopy, what are the expected oxidation state and local geometry of the Pd species in this hydrated sample? | The expected oxidation state of the Pd species is Pd(II) (or 2+), and the local geometry is a square planar, oxygen-ligated structure. These spectral features arise because the ambient hydration treatment causes the mononuclear Pd2+ cations to solvate away from the CHA zeolite framework to form [Pd(H2O)4]2+ or [Pd(H2O)3(OH)]+ complexes. The K-edge XANES edge energies directly reflect this resulting square planar, oxygen-ligated Pd2+ state. Furthermore, the absence of second-shell Pd-Pd or Pd-Al/Si scattering in the EXAFS region confirms that the Pd2+ ions are fully solvated and isolated from both agglomerated PdO and the zeolite framework. | Full credit for stating an oxidation state of Pd(II) / 2+ and a square planar, oxygen-ligated geometry. |
Review
#474
Pd/CHA
Pd Pd K-edge
▶
LLM Prompt
Sample Information
Material: Pd/CHA
Support: CHA zeolite
Reaction Conditions: ambient
Sample-Specific Conditions
- treatment: dehydrated, ambient
- Dehydrated mononuclear Pd2+ cations in CHA zeolite at ambient temperature
Measurement
We plan to measure the Pd Pd K-edge XANES spectrum of this sample.
Questions
Based on all the information above:
1. What is the dominant Pd phase or structural motif expected for this dehydrated Pd/CHA sample at ambient temperature, and what is its oxidation state?
Ground Truth
Material: Pd/CHA
Measurement: Pd K-edge transmission mode at sector 10BM
Fit method: not reported
Phase fractions: (±10%)
| Phase | Fraction |
|---|---|
| [Pd(Ozeo)4]2+ / [Pd(Ozeo)3(OH)]+ | 1.0 |
Source evidence: Table 1 and Section 3.2.1
Key reasoning: High temperature air treatments convert agglomerated PdO domains into mononuclear Pd2+ cations. For the dehydrated sample at ambient temperature, DRUV-Vis shows a d-d transition at 465 nm and EXAFS shows a Pd-O coordination of 3.5 ± 0.4 with no second-shell Pd-Pd scattering, indicating predominantly mononuclear Pd2+ ligated by zeolite framework oxygen.
Reasoning source: Section 3.2.1 and Table 1
Scoring Rubric (total: 100 pts)
| Q | Type | Max | Question | Reference Answer | Scoring Criteria |
|---|---|---|---|---|---|
| q1 | identification | 100 | What is the dominant Pd phase or structural motif expected for this dehydrated Pd/CHA sample at ambient temperature, and what is its oxidation state? | For this dehydrated Pd/CHA sample at ambient temperature, the dominant structural motif is [Pd(Ozeo)4]2+ / [Pd(Ozeo)3(OH)]+ with an oxidation state of Pd2+. This specific phase arises because high-temperature air treatments convert agglomerated PdO domains into isolated mononuclear Pd2+ cations within the CHA zeolite support. Under these dehydrated ambient conditions, the Pd2+ cations are predominantly ligated by the zeolite framework oxygen. This structural assignment is supported by EXAFS data showing a Pd-O coordination of 3.5 ± 0.4 with no second-shell Pd-Pd scattering, alongside DRUV-Vis evidence of a d-d transition at 465 nm. | Full credit for identifying mononuclear Pd2+ ligated by zeolite framework oxygen (e.g., [Pd(Ozeo)4]2+ or [Pd(Ozeo)3(OH)]+) and stating the +2 oxidation state. |
Review
#475
PdO/zeolite
Pd Pd K-edge
▶
LLM Prompt
Sample Information
Material: PdO/zeolite
Support: zeolite
Reaction Conditions: ambient
Sample-Specific Conditions
- phase: PdO
- Agglomerated PdO domains on zeolite
Measurement
We plan to measure the Pd Pd K-edge XANES spectrum of this sample.
Questions
Based on all the information above:
1. Based on the sample conditions (calcination in air), explain the mechanistic pathway that leads to the formation of agglomerated PdO domains on the zeolite support, and describe what happens to this phase if the air treatment temperature is increased beyond 600 K.
2. What is the expected oxidation state and Pd K-edge XANES edge energy for this agglomerated PdO phase?
3. Since the Pd K-edge XANES edge energy of PdO is similar to other Pd2+ species (such as mononuclear [Pd(NH3)4]2+ complexes), what other complementary spectroscopic features distinguish agglomerated PdO domains from mononuclear Pd2+ species?
Ground Truth
Material: PdO/zeolite
Measurement: Pd K-edge XANES in transmission mode at sector 10BM
Fit method: not reported
Phase fractions: (±10%)
| Phase | Fraction |
|---|---|
| palladium_oxide | 1.0 |
Fit basis (paper's reference spectra):
- PdO standard
Source evidence: Page 5, Page 6 (Scheme 1), Table 1
Key reasoning: Agglomerated PdO domains form during air treatments at temperatures >500 K via the oxidation of metallic Pd domains. These metallic domains initially form from the reduction of Pd precursors by in situ generated H2 (e.g., from ammonia decomposition) around 500 K. At higher temperatures (>600 K), the agglomerated PdO domains undergo solid-state ion-exchange and Ostwald ripening to redisperse into mononuclear Pd2+ cations at zeolite framework Al sites.
Reasoning source: Section 3.1 and Scheme 1
Scoring Rubric (total: 100 pts)
| Q | Type | Max | Question | Reference Answer | Scoring Criteria |
|---|---|---|---|---|---|
| q1 | reasoning | 40 | Based on the sample conditions (calcination in air), explain the mechanistic pathway that leads to the formation of agglomerated PdO domains on the zeolite support, and describe what happens to this phase if the air treatment temperature is increased beyond 600 K. | The formation of agglomerated PdO domains on the zeolite support occurs during air treatments at temperatures above 500 K through the oxidation of metallic Pd domains. These precursor metallic domains are initially formed around 500 K via reduction by in situ generated H2, such as from ammonia decomposition. Because the sample currently consists of agglomerated PdO domains on zeolite, this indicates the treatment temperature was sufficient to oxidize the metal but not high enough for complete redispersion. If the air treatment temperature is increased beyond 600 K, these agglomerated PdO domains will undergo solid-state ion-exchange and Ostwald ripening, causing them to redisperse into mononuclear Pd2+ cations at the zeolite framework Al sites. | Must explain that PdO forms via the oxidation of metallic Pd domains at temperatures >500 K in air, and that at higher temperatures (>600 K) the agglomerated PdO redisperses into mononuclear Pd2+ cations. |
| q2 | spectral | 30 | What is the expected oxidation state and Pd K-edge XANES edge energy for this agglomerated PdO phase? | The expected oxidation state for the agglomerated PdO phase on the zeolite support is Pd2+, with a Pd K-edge XANES edge energy of 24,353 eV (24.353 keV). This specific edge energy and oxidation state arise because the sample consists of agglomerated PdO domains formed via the oxidation of metallic Pd during air treatment above 500 K. The complete oxidation of the metallic precursors under these conditions yields a fully divalent Pd species. Consequently, the resulting XANES spectrum exhibits an edge position that is characteristic of Pd2+ and closely matches the spectral shape of a bulk PdO standard. | Must identify the oxidation state as Pd2+ (divalent) and the edge energy as approximately 24.353 keV (24353 eV). |
| q3 | identification | 30 | Since the Pd K-edge XANES edge energy of PdO is similar to other Pd2+ species (such as mononuclear [Pd(NH3)4]2+ complexes), what other complementary spectroscopic features distinguish agglomerated PdO domains from mononuclear Pd2+ species? | Agglomerated PdO domains can be distinguished from mononuclear Pd2+ species using EXAFS and DRUV-Vis spectroscopy. In EXAFS, the agglomerated PdO phase exhibits distinct second-shell Pd-Pd scattering, whereas DRUV-Vis shows a broad charge transfer band at 325 nm and lacks the distinct d-d transitions characteristic of mononuclear Pd2+. These distinguishing features arise because the sample conditions (air treatment >500 K) produce agglomerated oxide domains rather than isolated cations. This agglomeration creates extended Pd-O-Pd networks responsible for the Pd-Pd scattering and broad charge transfer bands, which would otherwise be absent if the sample had been treated above 600 K to redisperse into mononuclear Pd2+ cations at zeolite Al sites. | Must mention the presence of second-shell Pd-Pd scattering in EXAFS and/or a broad charge transfer band near 325 nm in DRUV-Vis for PdO. |
Review
#476
Pd/zeolite
Pd Pd K-edge
▶
LLM Prompt
Sample Information
Material: Pd/zeolite
Support: zeolite
Reaction Conditions: 473 K
Sample-Specific Conditions
- phase: metallic Pd
- Metallic Pd domains on zeolite
Measurement
We plan to measure the Pd Pd K-edge XANES spectrum of this sample.
Questions
Based on all the information above:
1. Based on the sample conditions (Pd/zeolite reduced at 473 K), what is the dominant Pd phase expected, and what is the physical reasoning for its formation?
2. What reference spectrum should be used as a basis to confirm the presence of this phase in XANES analysis?
Ground Truth
Material: Pd/zeolite (Pd-CHA)
Measurement: Pd K-edge transmission mode at sector 10BM, Advanced Photon Source
Fit method: qualitative comparison
Phase fractions: (±10%)
| Phase | Fraction |
|---|---|
| metallic_palladium | 1.0 |
Fit basis (paper's reference spectra):
- Pd foil
Source evidence: Section 3.3, page 10
Key reasoning: Treatment of Pd-zeolites in H2 at 473 K or higher reduces all divalent Pd species to metallic Pd domains. The H2 TPR experiments show reduction of PdO and mononuclear Pd2+ occurs below 473 K (e.g., 290-320 K for PdO, 350-410 K for mononuclear Pd2+). Thus, at 473 K in H2, the Pd is fully reduced to metallic Pd. The XAS spectra are consistent with metallic Pd under these conditions.
Reasoning source: Section 3.2.1 and 3.3
Scoring Rubric (total: 100 pts)
| Q | Type | Max | Question | Reference Answer | Scoring Criteria |
|---|---|---|---|---|---|
| q1 | reasoning | 67 | Based on the sample conditions (Pd/zeolite reduced at 473 K), what is the dominant Pd phase expected, and what is the physical reasoning for its formation? | The dominant phase expected for the Pd/zeolite sample is metallic Pd (oxidation state 0) at a fraction of 1.0. This complete reduction occurs because treating Pd-zeolites in H2 at 473 K or higher reduces all divalent Pd species to metallic Pd domains. Specifically, H2 TPR experiments show that the reduction of PdO and mononuclear Pd2+ occurs at temperatures well below 473 K (290-320 K and 350-410 K, respectively). Therefore, under these specific reaction conditions at 473 K, the palladium is fully reduced, resulting in the exclusive formation of metallic Pd domains on the zeolite support. | Must identify metallic Pd (Pd0) as the dominant phase (fraction ~1.0) and explain that reduction of both PdO and mononuclear Pd2+ occurs at temperatures below 473 K (as shown by H2 TPR), leading to complete reduction to metallic Pd domains. |
| q2 | identification | 33 | What reference spectrum should be used as a basis to confirm the presence of this phase in XANES analysis? | To confirm the presence of this phase in XANES analysis, a Pd foil reference spectrum should be used as the fit basis for qualitative comparison. This specific reference is required because the sample consists entirely of metallic Pd (oxidation state 0). The formation of this pure metallic phase is dictated by the reaction conditions at 473 K in H2, which provide sufficient thermal energy to fully reduce all divalent Pd species (such as PdO and mononuclear Pd2+) that typically reduce below 410 K. Consequently, the resulting XAS spectral shape of the sample is fully consistent with the metallic Pd foil standard. | Must mention Pd foil or a metallic Pd standard. |
Review
Resolving the Evolution of Atomic Layer-Deposited Thin-Film Growth by Continuous In Situ X-Ray Absorption Spectroscopy
BNL-NSLS-II-8-ID
Thin Film
Xiaohui Qu et al.
DOI: 10.1021/acs.chemmater.0c04547
5 scenarios
▶
#477
TiO2 on ZnO
Ti K
▶
LLM Prompt
Sample Information
Material: TiO2 on ZnO
Deposition Method: ALD
Substrate: ZnO nanowires
Deposition Temperature C: 150
Sample-Specific Conditions
- Growth stage: Stage I
- Material added per cycle during the early prenucleation stage (Stage I)
Measurement
We plan to measure the Ti K XANES spectrum of this sample.
Questions
Based on all the information above:
1. What candidate reference spectra or structural components are needed to model the differential XANES spectrum of the material added per cycle during this early prenucleation stage?
2. Estimate the relative fractions of the structural components comprising the material added per cycle during Stage I.
3. Explain the physical origin of these structural components and why they are present in these proportions during the early prenucleation stage of ALD growth on ZnO.
Ground Truth
Material: TiO2 on ZnO
Measurement: in situ Ti K-edge XANES, fluorescence yield, ISS beamline at NSLS-II
Fit method: Linear regression using MCR-ALS derived components
Phase fractions: (±15%)
| Phase | Fraction |
|---|---|
| surface/interface tetrahedral Ti | 0.29 |
| bulk amorphous TiO2 | 0.71 |
Fit basis (paper's reference spectra):
- MCR bulk component (amorphous TiO2)
- MCR surface/interface component (tetrahedral Ti motifs)
Source evidence: Page 16, text
Key reasoning: During the early prenucleation stage (Stage I), ALD growth is slow and involves the formation of prenucleation clusters on the ZnO substrate. The material added per cycle contributes to both developing surface/interface motifs, which are enriched in under-coordinated tetrahedral Ti, and the early emergence of the bulk amorphous TiO2 component. Linear regression of the differential spectrum in Stage I shows it is composed of approximately 29% surface/interface component and 71% bulk component.
Reasoning source: Page 16, text; Page 17-18, Discussion of titania ALD growth
Scoring Rubric (total: 100 pts)
| Q | Type | Max | Question | Reference Answer | Scoring Criteria |
|---|---|---|---|---|---|
| q1 | identification | 30 | What candidate reference spectra or structural components are needed to model the differential XANES spectrum of the material added per cycle during this early prenucleation stage? | To model the differential XANES spectrum of the material added per cycle, two MCR-ALS derived components are needed: an MCR bulk component representing amorphous TiO2 and an MCR surface/interface component representing tetrahedral Ti motifs. These specific components are expected because ALD growth of TiO2 on ZnO nanowires at 150 °C is slow during the early prenucleation stage (Stage I). This slow growth involves the formation of prenucleation clusters on the substrate. Consequently, the material added per cycle contributes to both developing surface/interface motifs enriched in under-coordinated tetrahedral Ti and the early emergence of the bulk amorphous TiO2 phase. | 15 points for identifying a bulk amorphous TiO2 component; 15 points for identifying a surface/interface component characterized by under-coordinated or tetrahedral Ti motifs. |
| q2 | quantification | 30 | Estimate the relative fractions of the structural components comprising the material added per cycle during Stage I. | The relative fractions of the structural components comprising the material added per cycle are approximately 29% surface/interface tetrahedral Ti and 71% bulk amorphous TiO2, with an uncertainty of 15%. These specific values result from the slow ALD growth dynamics during the early prenucleation stage (Stage I) on the ZnO nanowire substrate at 150 °C. As prenucleation clusters form on the substrate, the newly deposited material partitions between developing under-coordinated tetrahedral Ti motifs at the interface and building the early bulk amorphous TiO2 structure. | 15 points for estimating ~30% surface/interface tetrahedral Ti; 15 points for estimating ~70% bulk amorphous TiO2. |
| q3 | reasoning | 40 | Explain the physical origin of these structural components and why they are present in these proportions during the early prenucleation stage of ALD growth on ZnO. | During Stage I of ALD growth of TiO2 on ZnO nanowires at 150 °C, the deposition process is slow and characterized by the formation of prenucleation clusters. The physical origin of the 29% surface/interface component is the formation of under-coordinated tetrahedral Ti motifs as the deposited material interacts with the ZnO substrate. Simultaneously, the 71% bulk component arises from the early emergence of the amorphous TiO2 phase within these growing clusters. The material added per cycle naturally partitions into these specific proportions because it must simultaneously develop the substrate interface and build the initial bulk amorphous structure. | 20 points for explaining that Stage I involves the formation of prenucleation clusters on the ZnO substrate; 20 points for noting that the added Ti contributes to both developing under-coordinated surface/interface motifs and the early emergence of the bulk amorphous film. |
Review
#478
TiO2 on ZnO
Ti K
▶
LLM Prompt
Sample Information
Material: TiO2 on ZnO
Deposition Method: ALD
Substrate: ZnO nanowires
Deposition Temperature C: 150
Sample-Specific Conditions
- ALD cycle number: 57
- Total film composition at the start of the MCR analysis window
Measurement
We plan to measure the Ti K XANES spectrum of this sample.
Questions
Based on all the information above:
1. Based on the sample conditions (ALD TiO2 on ZnO at 57 cycles), what distinct structural components or candidate reference spectra are required to model the Ti K-edge XANES data?
Ground Truth
Material: TiO2 on ZnO nanowires
Measurement: in situ Ti K-edge XANES, fluorescence yield, ISS beamline at NSLS-II
Fit method: MCR-ALS
Phase fractions: (±15%)
| Phase | Fraction |
|---|---|
| surface/interface tetrahedral Ti | 0.3 |
| bulk amorphous TiO2 | 0.7 |
Fit basis (paper's reference spectra):
- MCR bulk component (amorphous TiO2)
- MCR surface/interface component (tetrahedral Ti motifs)
Source evidence: Figure 4d and text on page 14
Key reasoning: At ALD cycle 57, the growth is transitioning from the slow prenucleation stage (Stage I) to the steady-state growth stage. The film consists of a mixture of bulk-like amorphous TiO2 and a significant fraction of surface/interface species. The surface/interface component, characterized by tetrahedral Ti motifs, accounts for about 30% of the Ti at this stage, representing prenucleation clusters and active sites for subsequent growth.
Reasoning source: Results and Discussions, pages 14 and 17-19
Scoring Rubric (total: 100 pts)
| Q | Type | Max | Question | Reference Answer | Scoring Criteria |
|---|---|---|---|---|---|
| q1 | identification | 100 | Based on the sample conditions (ALD TiO2 on ZnO at 57 cycles), what distinct structural components or candidate reference spectra are required to model the Ti K-edge XANES data? | To model the Ti K-edge XANES data for this sample, two distinct structural components are required: an MCR bulk component corresponding to amorphous TiO2, and an MCR surface/interface component characterized by tetrahedral Ti motifs. These specific phases are expected because, at 57 ALD cycles at 150 °C, the TiO2 film growth on the ZnO nanowires is transitioning from a slow prenucleation stage to a steady-state growth stage. During this transition, the film consists of a mixture where bulk-like amorphous TiO2 is forming alongside a significant fraction of surface/interface species. These tetrahedral Ti surface/interface species represent prenucleation clusters and active sites for subsequent ALD growth, necessitating both components to accurately capture the structural state of the film. | Full credit for identifying both a bulk amorphous TiO2 component and a surface/interface component (or tetrahedral Ti component). |
Review
#479
TiO2 on ZnO
Ti K
▶
LLM Prompt
Sample Information
Material: TiO2 on ZnO
Deposition Method: ALD
Substrate: ZnO nanowires
Deposition Temperature C: 150
Sample-Specific Conditions
- ALD cycle number: 100
- Total film composition during the transition stage
Measurement
We plan to measure the Ti K XANES spectrum of this sample.
Questions
Based on all the information above:
1. What candidate reference spectra or structural components are required to model the Ti K-edge XANES data of the TiO2 film at 100 ALD cycles?
Ground Truth
Material: TiO2 on ZnO
Measurement: Ti K-edge in situ XANES, fluorescence mode, ISS beamline at NSLS-II
Fit method: MCR-ALS
Phase fractions: (±15%)
| Phase | Fraction |
|---|---|
| surface/interface tetrahedral Ti | 0.2 |
| bulk amorphous TiO2 | 0.8 |
Fit basis (paper's reference spectra):
- MCR bulk component (amorphous TiO2)
- MCR surface/interface component (tetrahedral Ti motifs)
Source evidence: Figure 4d and text on page 14
Key reasoning: During the ALD growth of TiO2 on ZnO, the initial prenucleation stage is characterized by the formation of isolated or loosely networked tetrahedral Ti motifs (surface/interface component). As the number of ALD cycles increases into the transition stage (e.g., 100 cycles), bulk amorphous TiO2 begins to accumulate and dominate the film composition. The surface/interface component persists on the growing surface, but its relative fraction drops to approximately 20% as the bulk film thickness increases.
Reasoning source: Results and Discussions - Discussion of titania ALD growth, pages 17-19
Scoring Rubric (total: 100 pts)
| Q | Type | Max | Question | Reference Answer | Scoring Criteria |
|---|---|---|---|---|---|
| q1 | identification | 100 | What candidate reference spectra or structural components are required to model the Ti K-edge XANES data of the TiO2 film at 100 ALD cycles? | To model the Ti K-edge XANES data of this sample, two structural components are required: an MCR bulk component corresponding to amorphous TiO2 and an MCR surface/interface component representing tetrahedral Ti motifs. These specific phases are expected because during the ALD growth of TiO2 on ZnO nanowires at 150 °C, the initial prenucleation stage forms isolated or loosely networked tetrahedral Ti motifs. As the deposition reaches 100 ALD cycles (the transition stage), bulk amorphous TiO2 begins to accumulate and dominate the film composition. Consequently, both the persisting surface/interface tetrahedral Ti motifs and the growing bulk amorphous TiO2 layer must be included to accurately represent the total film composition at this stage. | Award 15 points for identifying a bulk amorphous TiO2 component and 15 points for identifying a surface/interface component characterized by tetrahedral Ti motifs. |
Review
#480
TiO2 on ZnO
Ti K
▶
LLM Prompt
Sample Information
Material: TiO2 on ZnO
Deposition Method: ALD
Substrate: ZnO nanowires
Deposition Temperature C: 150
Sample-Specific Conditions
- ALD cycle number: 170
- Total film composition at maximum surface component thickness
Measurement
We plan to measure the Ti K XANES spectrum of this sample.
Questions
Based on all the information above:
1. Based on the ALD growth of TiO2 on ZnO nanowires, what distinct Ti coordination environments or structural motifs are expected to contribute to the Ti K-edge XANES spectrum at 170 cycles, and what basis components would be needed to model the data?
Ground Truth
Material: TiO2 on ZnO nanowires
Measurement: Ti K-edge XANES in total fluorescence yield mode at ISS beamline (NSLS-II)
Fit method: MCR-ALS
Phase fractions: (±10%)
| Phase | Fraction |
|---|---|
| surface/interface tetrahedral Ti | 0.1 |
| bulk amorphous TiO2 | 0.9 |
Fit basis (paper's reference spectra):
- MCR bulk component (amorphous TiO2)
- MCR surface/interface component (tetrahedral Ti motifs)
Source evidence: Figure 4b and Figure 4d, page 13 and 14
Key reasoning: During the ALD process, a surface/interface component consisting of relatively isolated or loosely networked tetrahedral Ti motifs forms. This component reaches a maximum equivalent thickness of ~0.18 nm around 170 cycles, near the end of the transition growth period. Because the bulk amorphous TiO2 film grows continuously and linearly during the steady-state Stage II, the relative fraction of the surface/interface component drops to approximately 10% by 170 cycles, with the bulk component making up the remaining 90% of the total film.
Reasoning source: Results and Discussions: Stages of titania ALD growth (page 13) and Discussion of titania ALD growth (page 17)
Scoring Rubric (total: 100 pts)
| Q | Type | Max | Question | Reference Answer | Scoring Criteria |
|---|---|---|---|---|---|
| q1 | identification | 100 | Based on the ALD growth of TiO2 on ZnO nanowires, what distinct Ti coordination environments or structural motifs are expected to contribute to the Ti K-edge XANES spectrum at 170 cycles, and what basis components would be needed to model the data? | To model the Ti K-edge XANES spectrum of this sample, two distinct basis components are required: an MCR bulk component corresponding to amorphous TiO2 and an MCR surface/interface component consisting of tetrahedral Ti motifs. These specific structural environments arise from the ALD growth dynamics of TiO2 on ZnO nanowires at 150 °C. During the deposition process, a surface/interface layer of relatively isolated or loosely networked tetrahedral Ti motifs forms, reaching a maximum equivalent thickness of ~0.18 nm around 170 cycles near the end of the transition growth period. Simultaneously, the bulk amorphous TiO2 film grows continuously and linearly during the steady-state Stage II. Consequently, at 170 cycles, both the interfacial tetrahedral motifs and the bulk amorphous TiO2 environments are present and must be included to accurately represent the total film composition. | Full credit for identifying two main components: a bulk amorphous TiO2 component and a surface/interface component characterized by tetrahedral Ti motifs. |
Review
#481
TiO2 on ZnO
Ti K
▶
LLM Prompt
Sample Information
Material: TiO2 on ZnO
Deposition Method: ALD
Substrate: ZnO nanowires
Deposition Temperature C: 150
Film Thickness Nm: 6.0
Sample-Specific Conditions
- ALD cycle number: 320
- Total film composition at the end of the ALD growth
Measurement
We plan to measure the Ti K XANES spectrum of this sample.
Questions
Based on all the information above:
1. What candidate structural components or basis spectra are required to model the in situ Ti K-edge XANES of this ALD-grown TiO2 film?
Ground Truth
Material: TiO2 on ZnO
Measurement: Ti K-edge XANES, total fluorescence yield, ISS beamline at NSLS-II
Fit method: MCR-ALS
Phase fractions: (±10%)
| Phase | Fraction |
|---|---|
| surface/interface tetrahedral Ti | 0.03 |
| bulk amorphous TiO2 | 0.97 |
Fit basis (paper's reference spectra):
- MCR bulk component (amorphous TiO2)
- MCR surface/interface component (tetrahedral Ti motifs)
Source evidence: Figure 4d and text on page 19
Key reasoning: At 320 ALD cycles, the film has reached a thickness of 6 nm and is in the steady-state growth regime (Stage II), meaning it is dominated by the bulk amorphous TiO2 component. However, a steady-state concentration of surface/interface tetrahedral Ti motifs persists throughout the growth, with an equivalent thickness of ~0.16 nm (0.5 ML). Because this absolute amount remains constant while the bulk film continues to grow, it accounts for only a small fraction (~3%) of the total 6 nm film at the end of the deposition.
Reasoning source: Page 19, Discussion of titania ALD growth
Scoring Rubric (total: 100 pts)
| Q | Type | Max | Question | Reference Answer | Scoring Criteria |
|---|---|---|---|---|---|
| q1 | identification | 100 | What candidate structural components or basis spectra are required to model the in situ Ti K-edge XANES of this ALD-grown TiO2 film? | To model the in situ Ti K-edge XANES of this film, the required basis spectra are an MCR bulk component (amorphous TiO2) and an MCR surface/interface component (tetrahedral Ti motifs). These specific components are expected because the sample is a 6.0 nm TiO2 film grown on ZnO nanowires via ALD at 150 °C for 320 cycles. At this cycle number and thickness, the film has reached the steady-state growth regime (Stage II), meaning the structure is heavily dominated by the bulk amorphous TiO2 phase. However, a steady-state concentration of surface/interface tetrahedral Ti motifs, equivalent to a thickness of ~0.16 nm (0.5 ML), persists throughout the entire growth process. Consequently, both the dominant bulk amorphous phase and the persistent surface/interface motifs must be included to accurately represent the total film composition at the end of the ALD deposition. | Full credit for identifying two main components: a bulk amorphous TiO2 component and a surface/interface component featuring tetrahedral Ti motifs. |
Review
Impact of Transition Metal Doping on the Structural and Optical Properties of Halide Perovskites
APS
Thin Film
Sarah Wieghold et al.
DOI: 10.1021/acs.chemmater.1c01645
2 scenarios
▶
#482
MA0.83FA0.17Pb(I0.17Br0.83)3
Pd M2,3-edge
▶
LLM Prompt
Sample Information
Material: MA0.83FA0.17Pb(I0.17Br0.83)3
Deposition Method: spin-coating
Substrate: indium tin oxide-coated glass
Composition Variable: perovskite composition
Composition Value: MAFA (Br-rich)
Sample-Specific Conditions
- host matrix: MAFA
- 2.5% Pd doped MA0.83FA0.17Pb(I0.17Br0.83)3 film
Measurement
We plan to measure the Pd M2,3-edge XANES spectrum of this sample.
Questions
Based on all the information above:
1. Based on the sample conditions, what is the expected chemical state and dominant phase of Pd in the 2.5% Pd-doped MAFA film?
2. Describe the expected spectral features of the Pd M2,3-edge for this sample, including the specific edge energies and the electronic transitions involved.
3. Explain the physical reasoning for why Pd forms this specific phase in the Br-rich MAFA composition rather than incorporating into the perovskite lattice.
4. How would the Pd M2,3-edge XAS spectrum of this sample distinguish it from a sample where Pd is successfully incorporated into the perovskite lattice (e.g., in an I-rich FAMA film)?
Ground Truth
Material: MA0.83FA0.17Pb(I0.17Br0.83)3
Measurement: Pd M2,3-edge XAS by synchrotron x-ray scanning tunneling microscopy (SX-STM) in total electron yield (TEY) mode
Fit method: Qualitative comparison of absorption onset
Phase fractions:
| Phase | Fraction |
|---|---|
| metallic Pd | 1.0 |
Fit basis (paper's reference spectra):
- Pd standard film
Source evidence: Figure 4b and text on pages 15-16
Key reasoning: Pd at a doping level of 2.5% in the MAFA film has a similar absorption onset at the M3 edge as that of the standard Pd sample, which is consistent with the incorporation of metallic Pd. This is attributed to the bromine-rich composition of MAFA, which may have a lower affinity for Pd incorporation into the perovskite lattice compared to iodine-rich compositions, resulting in the formation of large metallic Pd aggregates rather than lattice substitution.
Reasoning source: Pages 15-16
Scoring Rubric (total: 100 pts)
| Q | Type | Max | Question | Reference Answer | Scoring Criteria |
|---|---|---|---|---|---|
| q1 | identification | 20 | Based on the sample conditions, what is the expected chemical state and dominant phase of Pd in the 2.5% Pd-doped MAFA film? | The expected chemical state of Pd in the 2.5% Pd-doped MAFA film is an oxidation state of 0, corresponding to a dominant phase of 100% metallic Pd. This specific phase arises because the host matrix is a bromine-rich perovskite composition (MA0.83FA0.17Pb(I0.17Br0.83)3). The Br-rich MAFA composition has a lower affinity for Pd incorporation into the perovskite lattice compared to iodine-rich compositions. Consequently, rather than substituting into the lattice, the Pd dopant segregates to form large metallic Pd aggregates. | Full points for identifying metallic Pd (oxidation state 0) as the dominant phase. |
| q2 | spectral | 30 | Describe the expected spectral features of the Pd M2,3-edge for this sample, including the specific edge energies and the electronic transitions involved. | The expected Pd M2,3-edge XANES spectrum will exhibit an M3 edge at 532.3 eV and an M2 edge at 559.9 eV, both originating from 3p to 4d electronic transitions. The spectral shape will feature an absorption onset at the M3 edge that is highly similar to a standard metallic Pd film. These specific spectral features are produced because the 2.5% Pd dopant in the Br-rich MAFA host matrix fails to incorporate into the perovskite lattice. Due to the lower affinity of the bromine-rich composition for Pd, the dopant instead forms metallic Pd aggregates with an oxidation state of 0, yielding a spectrum that matches the metallic standard. | Full points for mentioning the M3 edge at ~532.3 eV, the M2 edge at ~559.9 eV, and identifying the origin as the 3p to 4d transition. |
| q3 | reasoning | 25 | Explain the physical reasoning for why Pd forms this specific phase in the Br-rich MAFA composition rather than incorporating into the perovskite lattice. | In the 2.5% Pd-doped MA0.83FA0.17Pb(I0.17Br0.83)3 film, the Pd dopant forms metallic Pd aggregates (oxidation state 0) rather than substituting into the perovskite lattice. This outcome is directly driven by the bromine-rich composition of the MAFA host matrix. The Br-rich environment exhibits a lower chemical affinity for Pd incorporation compared to iodine-rich perovskite compositions. Because the lattice cannot readily accommodate the Pd ions, the dopant segregates out of the matrix to form large metallic aggregates, resulting in a 100% metallic Pd phase. | Full points for explaining that the Br-rich composition has a lower affinity for Pd incorporation into the lattice (or smaller average Pb-halide bond length compared to I-rich compositions), leading to the formation of metallic Pd aggregates. |
| q4 | prediction | 25 | How would the Pd M2,3-edge XAS spectrum of this sample distinguish it from a sample where Pd is successfully incorporated into the perovskite lattice (e.g., in an I-rich FAMA film)? | The Pd M2,3-edge XAS spectrum of the 2.5% Pd-doped MAFA film will display an absorption onset matching that of a standard metallic Pd sample, indicating an oxidation state of 0. In contrast, a sample where Pd successfully incorporates into the lattice, such as an iodine-rich FAMA film, would exhibit an absorption peak shifted to higher energies, indicative of a higher oxidation state like Pd2+. This spectral distinction occurs because the Br-rich MAFA composition has a lower affinity for Pd, forcing it to form metallic aggregates rather than substituting into the lattice. Conversely, an iodine-rich matrix accommodates the Pd ions within the lattice, altering their local coordination and increasing their oxidation state. | Full points for stating that the MAFA sample matches the metallic Pd standard (similar absorption onset), whereas a lattice-incorporated sample would show an absorption peak shifted to higher energies, indicating a higher oxidation state (e.g., Pd2+). |
Review
#483
FA0.83MA0.17Pb(I0.83Br0.17)3
Pd M2,3-edge
▶
LLM Prompt
Sample Information
Material: FA0.83MA0.17Pb(I0.83Br0.17)3
Deposition Method: spin-coating
Substrate: indium tin oxide-coated glass
Composition Variable: perovskite composition
Composition Value: FAMA (I-rich)
Sample-Specific Conditions
- host matrix: FAMA
- 2.5% Pd doped FA0.83MA0.17Pb(I0.83Br0.17)3 film
Measurement
We plan to measure the Pd M2,3-edge XANES spectrum of this sample.
Questions
Based on all the information above:
1. Based on the sample conditions (2.5% Pd doped into an iodine-rich FAMA perovskite), what is the expected dominant chemical state of the Pd, and what physical reasoning explains why this composition favors this state over the formation of metallic aggregates?
2. Describe the expected spectral features of the Pd M2,3-edge XANES for this sample. Specifically, identify the electronic transitions responsible for these edges and explain how the absorption onset compares to a metallic Pd reference.
3. To verify that the Pd in this FAMA perovskite film has not segregated into metallic clusters, what specific reference spectrum is required for comparison, and what distinguishing spectral feature would confirm the absence of the metallic phase?
Ground Truth
Material: FA0.83MA0.17Pb(I0.83Br0.17)3 (FAMA)
Measurement: Pd M2,3-edge X-ray absorption spectroscopy (XAS) via synchrotron x-ray scanning tunneling microscopy (SX-STM) measuring total electron yield (TEY)
Fit method: Qualitative comparison of absorption onset
Phase fractions:
| Phase | Fraction |
|---|---|
| Pd2+ (incorporated in perovskite lattice) | 1.0 |
Fit basis (paper's reference spectra):
- Pd standard (metallic Pd)
Source evidence: Figure 4b and text on pages 15-16
Key reasoning: The absorption peak for the Pd-doped FAMA film is shifted to higher energies compared to a metallic Pd standard. This shift implies a higher oxidation state, consistent with Pd2+ incorporating into the perovskite crystal lattice by replacing Pb2+. The iodine-rich FAMA composition facilitates this incorporation (as opposed to forming metallic aggregates) because lead ions in an iodine-rich perovskite have a larger average Pb-I bond length, allowing them to be replaced more readily.
Reasoning source: Results and Discussion, pages 15-16
Scoring Rubric (total: 100 pts)
| Q | Type | Max | Question | Reference Answer | Scoring Criteria |
|---|---|---|---|---|---|
| q1 | reasoning | 35 | Based on the sample conditions (2.5% Pd doped into an iodine-rich FAMA perovskite), what is the expected dominant chemical state of the Pd, and what physical reasoning explains why this composition favors this state over the formation of metallic aggregates? | The expected dominant chemical state of Pd in the 2.5% Pd-doped FAMA film is Pd2+, which is fully incorporated into the perovskite lattice with a fraction of 1.0. This state is favored over the formation of metallic aggregates due to the specific iodine-rich composition of the FA0.83MA0.17Pb(I0.83Br0.17)3 host matrix. In this iodine-rich environment, the lead ions exhibit a larger average Pb-I bond length. This expanded local structure allows the Pd2+ ions to more readily replace Pb2+ ions within the crystal lattice, thereby preventing the segregation of palladium into metallic clusters. | Award full points if the answer identifies the state as Pd2+ incorporated into the perovskite lattice (replacing Pb2+) and explains that the iodine-rich FAMA composition facilitates this due to a larger average Pb-I bond length and/or different halide complexation affinities. |
| q2 | spectral | 35 | Describe the expected spectral features of the Pd M2,3-edge XANES for this sample. Specifically, identify the electronic transitions responsible for these edges and explain how the absorption onset compares to a metallic Pd reference. | The Pd M2,3-edge XANES spectrum for this sample will exhibit distinct M3 and M2 absorption edges located at 532.3 eV and 559.9 eV, respectively. Both of these edges originate from 3p to 4d electronic transitions. Compared to a metallic Pd reference, the absorption onset for this sample is shifted to higher energies. This spectral shift to higher energies occurs because the iodine-rich FAMA host matrix facilitates the incorporation of the 2.5% Pd dopant as Pd2+ replacing Pb2+, and this higher oxidation state alters the electronic structure relative to zero-valent metallic Pd. | Award full points if the answer correctly identifies the transitions as 3p to 4d (for the M2 and M3 edges) and explicitly states that the absorption onset is shifted to higher energies compared to a metallic Pd standard. |
| q3 | identification | 30 | To verify that the Pd in this FAMA perovskite film has not segregated into metallic clusters, what specific reference spectrum is required for comparison, and what distinguishing spectral feature would confirm the absence of the metallic phase? | To verify the absence of metallic clusters, the sample spectrum must be compared against a metallic Pd standard reference. The distinguishing spectral feature that confirms the absence of the metallic phase is an absorption onset that is shifted to higher energies relative to the metallic Pd standard. This shift indicates a higher oxidation state (Pd2+) rather than zero-valent metallic Pd. This specific state arises because the iodine-rich FA0.83MA0.17Pb(I0.83Br0.17)3 composition provides a larger average Pb-I bond length, which allows the Pd to fully incorporate into the perovskite lattice by replacing Pb2+ instead of segregating into metallic aggregates. | Award full points if the answer identifies a metallic Pd standard as the required reference and notes that the sample's spectrum must show a shift to higher energies (indicating a higher oxidation state) rather than matching the lower-energy onset of the metallic standard. |
Review
A Polar Magnetic and Insulating Double Corundum Oxide: Mn2MnSbO6 with Ordered Mn(II) and Mn(III) Ions
BNL-NSLS-II-8-ID
Pure Phase
Hai L. Feng et al.
DOI: 10.1021/acs.chemmater.1c02046
6 scenarios
▶
#484
Mn2MnSbO6
Mn K
▶
LLM Prompt
Sample Information
Material: Mn2MnSbO6
Crystal Structure: Ni3TeO6-type, R3
Oxidation State: Mn2+, Mn3+
Sample Form: powder
Measurement Mode: transmission and fluorescence
- Target compound, double corundum oxide
Measurement
We plan to measure the Mn K XANES spectrum of this sample.
Questions
Based on all the information above:
1. Describe the expected spectral shape of the Mn K-edge XANES for Mn2MnSbO6 and explain how it reflects the oxidation states of the compound.
2. How does the specific crystal structure (Ni3TeO6-type) of Mn2MnSbO6 influence the energy position of its Mn2+ spectral features compared to standard perovskite Mn2+ compounds?
3. What reference spectra would be appropriate to use in a difference spectrum analysis to isolate and confirm the presence of the Mn3+ component in this compound, and how would this analysis be performed?
Ground Truth
Compound: Mn2MnSbO6
Oxidation state: Mn2+, Mn3+
Measurement: Mn K-edge XANES in transmission and fluorescence mode at ISS 8ID
Edge position: not reported
Spectral shape: The spectrum shows dual features: a prominent local peak-feature in the Mn2+ energy range (similar to Mn2FeWO6) and an absolute peak at an energy characteristic of Mn3+ (similar to LaMnO3).
Distinguishing features: The Mn2+ feature is shifted down in energy compared to perovskite-Mn2+ standards, which is typical for Ni3TeO6 structure compounds. A normalized difference spectrum Δµ= 3[µ(Mn2MnSbO6)- µ(Mn2+2FeWO6) 2/3] exhibits an extremely prominent peak at precisely the same energy as the LaMn3+O3 peak feature, highlighting the Mn3+ component.
Key reasoning: The Mn-K main edge of Mn2MnSbO6 exhibits dual features, confirming the presence of both Mn2+ and Mn3+ ions. It has a prominent local peak-feature in the same energy range as the Ni3TeO6-type Mn2+2FeWO6 standard, indicating a Mn2+ component. The absolute peak occurs at an energy characteristic of a Mn3+ peak feature, similar to LaMn3+O3. A normalized difference spectrum subtracting the Mn2+2FeWO6 contribution highlights the Mn3+ component, confirming the ordered Mn2+/Mn3+ arrangement.
Reasoning source: Mn-K XANES section, pages 11-12
Scoring Rubric (total: 100 pts)
| Q | Type | Max | Question | Reference Answer | Scoring Criteria |
|---|---|---|---|---|---|
| q1 | spectral | 35 | Describe the expected spectral shape of the Mn K-edge XANES for Mn2MnSbO6 and explain how it reflects the oxidation states of the compound. | The expected Mn K-edge XANES spectrum for Mn2MnSbO6 exhibits dual features that directly reflect its mixed oxidation states. Specifically, the spectrum displays a prominent local peak-feature in the lower energy range characteristic of Mn2+, alongside an absolute peak at a higher energy characteristic of Mn3+. These distinct spectral features arise because the sample is a double corundum oxide containing an ordered arrangement of both Mn2+ and Mn3+ ions. The Mn2+ feature aligns with Ni3TeO6-type standards like Mn2FeWO6, while the Mn3+ absolute peak aligns with standards like LaMnO3, confirming the dual oxidation states present in the material. | Full credit if the answer mentions the dual features of the main edge: a local peak characteristic of Mn2+ and an absolute peak characteristic of Mn3+, confirming the mixed Mn2+/Mn3+ oxidation states. |
| q2 | reasoning | 30 | How does the specific crystal structure (Ni3TeO6-type) of Mn2MnSbO6 influence the energy position of its Mn2+ spectral features compared to standard perovskite Mn2+ compounds? | The Ni3TeO6-type crystal structure of Mn2MnSbO6 causes its Mn2+ spectral features to be shifted down in energy compared to standard perovskite-Mn2+ compounds. This downward energy shift occurs because the specific structural and electronic environment of the Ni3TeO6-type lattice directly influences the X-ray absorption edge position of the Mn2+ ions. Consequently, the Mn2+ local peak-feature in Mn2MnSbO6 aligns with other Ni3TeO6-type standards, such as Mn2FeWO6, rather than typical perovskite standards. This demonstrates how the sample's specific double corundum oxide structure dictates the precise energy position of its Mn2+ component in the XANES spectrum. | Full credit if the answer notes that the Mn2+ spectral feature in the Ni3TeO6-type structure is shifted down in energy compared to standard perovskite-Mn2+ compounds. |
| q3 | analysis | 35 | What reference spectra would be appropriate to use in a difference spectrum analysis to isolate and confirm the presence of the Mn3+ component in this compound, and how would this analysis be performed? | To isolate the Mn3+ component in Mn2MnSbO6, appropriate reference spectra include Mn2FeWO6 as a Ni3TeO6-type proxy for Mn2+ and LaMnO3 as a perovskite proxy for Mn3+. The analysis is performed by calculating a normalized difference spectrum using the formula Δµ = 3[µ(Mn2MnSbO6) - µ(Mn2FeWO6) × 2/3]. This specific subtraction is necessary because the sample's composition contains an ordered arrangement of both Mn2+ and Mn3+ ions; removing the 2/3 fractional contribution of the Mn2+ proxy isolates the remaining signal. The resulting difference spectrum exhibits an extremely prominent peak at precisely the same energy as the LaMnO3 standard, thereby confirming the presence of the Mn3+ component in the double corundum oxide. | Full credit if the answer identifies an isostructural Mn2+ reference (like Mn2FeWO6) to subtract from the sample spectrum, and a Mn3+ reference (like LaMnO3) to compare against the resulting difference peak. |
Review
#485
MnO
Mn K
▶
LLM Prompt
Sample Information
Material: MnO
Crystal Structure: NaCl
Oxidation State: Mn2+
Measurement Mode: transmission and fluorescence
- Mn2+ standard with NaCl structure
Measurement
We plan to measure the Mn K XANES spectrum of this sample.
Questions
Based on all the information above:
1. Based on the provided sample information, what specific spectral feature is expected at the main edge for this MnO standard?
Ground Truth
Compound: MnO
Oxidation state: Mn2+
Measurement: Mn-K edge XANES, transmission and fluorescence mode, QAS 7BM Beamline at NSLS-II and X-19A at NSLS-I
Edge position: not reported
Spectral shape: Shows a splitting of the edge features.
Distinguishing features: Splitting of the edge features in the NaCl structure (described in the text as having all-face-sharing O-octahedra).
Key reasoning: MnO is used as a standard reference for the Mn2+ oxidation state with an NaCl structure. The spectrum is characterized by a splitting of the edge features, which the authors note occurs in the NaCl structure (described in the text as having all-face-sharing O-octahedra).
Reasoning source: Page 11, Mn-K XANES section
Scoring Rubric (total: 100 pts)
| Q | Type | Max | Question | Reference Answer | Scoring Criteria |
|---|---|---|---|---|---|
| q1 | spectral | 100 | Based on the provided sample information, what specific spectral feature is expected at the main edge for this MnO standard? | The expected spectral feature at the main edge for this MnO standard is a distinct splitting of the edge features. This sample serves as a pure reference material for the Mn2+ oxidation state crystallized in an NaCl structure. The observed splitting arises directly from this specific crystallographic arrangement. Specifically, the NaCl structure consists of all-face-sharing O-octahedra around the manganese ions, and this local coordination environment structurally induces the characteristic edge splitting seen in the XANES spectrum. | The answer must explicitly mention the splitting of the edge features. |
Review
#486
CaMnO3
Mn K
▶
LLM Prompt
Sample Information
Material: CaMnO3
Crystal Structure: perovskite
Oxidation State: Mn4+
Measurement Mode: transmission and fluorescence
- Mn4+ standard with perovskite structure
Measurement
We plan to measure the Mn K XANES spectrum of this sample.
Questions
Based on all the information above:
1. Describe the expected relative position of the main-edge peak for this CaMnO3 sample compared to Mn3+ and Mn2+ standards.
2. Based on the provided sample information, what is the local coordination environment and structural motif of the Mn ions in this standard?
3. What general trend in XANES spectroscopy does the inclusion of this specific compound as a standard help illustrate when compared to compounds like LaMnO3 and MnO?
Ground Truth
Compound: CaMnO3
Oxidation state: Mn4+
Measurement: Mn-K edge XANES in transmission and fluorescence modes at QAS, 7BM Beamline at NSLS-II and beamline X-19A at NSLS-I
Edge position: not reported
Spectral shape: The spectrum exhibits a main peak at a higher energy than the Mn3+ (LaMnO3) and Mn2+ (LaSrMnSbO6, MnO) standards, demonstrating the expected chemical shift to higher energies with increasing transition metal valence.
Distinguishing features: The peak energy is at the highest energy among the presented standards, distinguishing it as the Mn4+ reference.
Key reasoning: CaMnO3 is utilized as a standard reference material for the Mn4+ oxidation state. It features a perovskite-based structure characterized by corner-sharing O-octahedra. In the XANES spectra, its main-edge peak is located at a higher energy compared to Mn3+ and Mn2+ standards. This demonstrates the typical chemical shift to higher energies associated with increasing transition metal valence.
Reasoning source: Mn-K XANES section, pages 11-12
Scoring Rubric (total: 100 pts)
| Q | Type | Max | Question | Reference Answer | Scoring Criteria |
|---|---|---|---|---|---|
| q1 | spectral | 40 | Describe the expected relative position of the main-edge peak for this CaMnO3 sample compared to Mn3+ and Mn2+ standards. | The main-edge peak for the CaMnO3 sample is expected to be located at a higher energy compared to Mn3+ (e.g., LaMnO3) and Mn2+ (e.g., MnO) standards. This spectral feature arises because the sample is a pure CaMnO3 reference material containing manganese exclusively in the Mn4+ oxidation state. In XANES spectroscopy, an increase in the transition metal valence results in a typical chemical shift of the absorption edge to higher energies. Therefore, the higher oxidation state of Mn4+ in this perovskite sample directly causes its peak to appear at the highest energy among the presented standards. | Full credit if the answer states that the main-edge peak will be at a higher energy than both Mn3+ and Mn2+ standards due to the chemical shift associated with the higher Mn4+ valence. |
| q2 | reasoning | 30 | Based on the provided sample information, what is the local coordination environment and structural motif of the Mn ions in this standard? | The Mn ions in this CaMnO3 standard are situated within a structural motif characterized by corner-sharing O-octahedra. This specific local coordination environment arises directly from the sample's perovskite-based crystal structure. Because the sample is a pure (1.0 fraction) perovskite material, the Mn4+ cations are naturally coordinated by oxygen atoms to form these interconnected octahedral units. This well-defined geometry and pure composition make it an ideal structural reference material for the Mn4+ state. | Full credit if the answer identifies the structure as perovskite-based with octahedrally coordinated Mn ions in a corner-sharing O-octahedra arrangement. |
| q3 | reasoning | 30 | What general trend in XANES spectroscopy does the inclusion of this specific compound as a standard help illustrate when compared to compounds like LaMnO3 and MnO? | The inclusion of CaMnO3 as a standard illustrates the typical chemical shift of the XANES main-edge peak to higher energies as the transition metal valence increases. This trend is demonstrated because the sample consists of pure CaMnO3 with a confirmed Mn4+ oxidation state, serving as a high-valence reference compared to Mn3+ (LaMnO3) and Mn2+ (MnO) standards. The higher oxidation state of the Mn4+ ions in this perovskite structure inherently shifts the absorption edge to a higher energy than the lower-valence standards. Consequently, comparing these specific sample conditions clearly demonstrates the fundamental relationship between increasing transition metal valence and positive energy shifts in XANES spectra. | Full credit if the answer explains that it illustrates the chemical shift of the main edge to higher energies with increasing transition metal valence (from Mn2+ to Mn3+ to Mn4+). |
Review
#487
LaMnO3
Mn K
▶
LLM Prompt
Sample Information
Material: LaMnO3
Crystal Structure: perovskite
Oxidation State: Mn3+
Measurement Mode: transmission and fluorescence
- Mn3+ standard with perovskite structure
Measurement
We plan to measure the Mn K XANES spectrum of this sample.
Questions
Based on all the information above:
1. Describe the expected relative peak energy position of the LaMnO3 standard compared to other Mn oxidation state standards, and explain the physical origin of the main edge features.
2. What specific structural motif characterizes the LaMnO3 standard in this study, and how does it contrast with the local structure of other standards like Mn2+O?
3. What is the primary purpose of measuring the LaMnO3 spectrum in the context of analyzing unknown Mn-containing compounds?
Ground Truth
Compound: LaMnO3
Oxidation state: Mn3+
Measurement: Mn-K edge XANES in transmission and fluorescence mode at QAS, 7BM Beamline at NSLS-II or X-19A at NSLS-I
Edge position: not reported
Spectral shape: The spectrum exhibits a main edge dominated by peak-like 1s to 4p transitions. The peak energy is intermediate between Mn4+ and Mn2+ standards, characteristic of Mn3+.
Distinguishing features: Corner-sharing O-octahedra perovskite structure, with a peak energy chemically shifted down from Mn4+ (CaMn4+O3) and up from Mn2+ (LaSrMn2+SbO6).
Key reasoning: LaMnO3 is used as a standard for octahedrally coordinated, corner-sharing perovskite-based Mn3+. Its main-edge peak energy is positioned between the Mn4+ (CaMn4+O3) and Mn2+ (LaSrMn2+SbO6) standards, demonstrating the expected chemical shift to higher energies with increasing transition metal valence.
Reasoning source: Page 11, Mn-K XANES section
Scoring Rubric (total: 100 pts)
| Q | Type | Max | Question | Reference Answer | Scoring Criteria |
|---|---|---|---|---|---|
| q1 | spectral | 40 | Describe the expected relative peak energy position of the LaMnO3 standard compared to other Mn oxidation state standards, and explain the physical origin of the main edge features. | The main-edge peak energy of the LaMnO3 standard is positioned intermediate between the Mn4+ (CaMn4+O3) and Mn2+ (LaSrMn2+SbO6) standards. The main edge itself is dominated by peak-like 1s to 4p electronic transitions. These spectral features arise directly from the sample's composition as a pure Mn3+ perovskite standard. Because XANES is highly sensitive to oxidation state, the Mn3+ valence dictates this intermediate energy position, demonstrating the expected chemical shift to higher energies with increasing transition metal valence compared to Mn2+, but lower than Mn4+. | The answer must state that the main edge is dominated by 1s to 4p transitions and that the peak energy is intermediate between Mn4+ (e.g., CaMn4+O3) and Mn2+ (e.g., LaSrMn2+SbO6) standards, reflecting the Mn3+ oxidation state. |
| q2 | reasoning | 30 | What specific structural motif characterizes the LaMnO3 standard in this study, and how does it contrast with the local structure of other standards like Mn2+O? | The LaMnO3 standard is characterized by an octahedrally coordinated, corner-sharing perovskite structural motif. While the question mentions Mn2+O, the provided data specifically uses LaSrMn2+SbO6 as the Mn2+ reference and does not detail the structure of Mn2+O. The corner-sharing O-octahedra motif arises directly from the sample's crystalline LaMnO3 perovskite composition. Because the sample is a pure Mn3+ perovskite standard, this specific coordination environment dictates its distinct 1s to 4p transition features and its intermediate chemical shift between the Mn2+ and Mn4+ standards. | The answer must identify LaMnO3 as having a perovskite-based structure with corner-sharing O-octahedra, contrasting it with edge-sharing or face-sharing structures found in other standards. |
| q3 | identification | 30 | What is the primary purpose of measuring the LaMnO3 spectrum in the context of analyzing unknown Mn-containing compounds? | The primary purpose of measuring the LaMnO3 spectrum is to establish a reference standard for octahedrally coordinated, corner-sharing perovskite-based Mn3+. Because the sample is a pure LaMnO3 perovskite with a known Mn3+ oxidation state, its phase fraction is exactly 1.0, providing an ideal baseline for this specific valence and coordination environment. Measuring its Mn-K edge XANES establishes its main-edge peak energy, which sits intermediate between Mn4+ (CaMn4+O3) and Mn2+ (LaSrMn2+SbO6) standards. This demonstrates the expected chemical shift to higher energies with increasing transition metal valence, which is essential for identifying the Mn3+ oxidation state in unknown compounds. | The answer must state that it is used as a reference standard to identify the presence of Mn3+ components by comparing the chemical shift of the peak energy. |
Review
#488
LaSrMnSbO6
Mn K
▶
LLM Prompt
Sample Information
Material: LaSrMnSbO6
Crystal Structure: perovskite
Oxidation State: Mn2+
Measurement Mode: transmission and fluorescence
- Mn2+ standard with perovskite structure
Measurement
We plan to measure the Mn K XANES spectrum of this sample.
Questions
Based on all the information above:
1. Based on its oxidation state, how does the main edge peak energy of the LaSrMnSbO6 standard compare to other perovskite standards like LaMnO3 or CaMnO3, and what physical principle does this illustrate?
2. What specific local coordination environment does LaSrMnSbO6 represent in the context of Mn K-edge XANES analysis, and how does this contrast with a standard like MnO?
3. Why is LaSrMnSbO6 an appropriate reference compound to include when analyzing the valence and local structure of a new complex Mn oxide?
Ground Truth
Compound: LaSrMnSbO6
Oxidation state: Mn2+
Measurement: Mn K-edge, transmission and fluorescence mode
Edge position: not reported
Spectral shape: The main edge peak is shifted to lower energies compared to Mn3+ (LaMn3+O3) and Mn4+ (CaMn4+O3) perovskite standards.
Distinguishing features: Represents a corner-sharing O-octahedra perovskite environment for Mn2+, distinguishing it from edge-sharing structures like MnO (NaCl structure) or face-sharing structures.
Key reasoning: LaSrMnSbO6 is utilized as a standard for octahedrally coordinated Mn2+ in a corner-sharing perovskite structure. Its main-edge peak energy is shifted down compared to Mn3+ and Mn4+ perovskite standards, which is consistent with its lower valence state and establishes a trend for chemical shift with decreasing valence.
Reasoning source: Mn-K XANES section, page 11
Scoring Rubric (total: 100 pts)
| Q | Type | Max | Question | Reference Answer | Scoring Criteria |
|---|---|---|---|---|---|
| q1 | spectral | 40 | Based on its oxidation state, how does the main edge peak energy of the LaSrMnSbO6 standard compare to other perovskite standards like LaMnO3 or CaMnO3, and what physical principle does this illustrate? | The main edge peak energy of the LaSrMnSbO6 standard is shifted to lower energies compared to the Mn3+ (LaMnO3) and Mn4+ (CaMnO3) perovskite standards. This spectral feature occurs directly because the LaSrMnSbO6 sample contains manganese in a lower Mn2+ oxidation state. This illustrates the physical principle of chemical shift, where the X-ray absorption edge energy decreases with decreasing valence. Because the sample is a pure Mn2+ perovskite standard (fraction 1.0), its spectrum perfectly isolates the electronic signature of this lower oxidation state, establishing a clear trend for chemical shifts. | The answer must state that the peak energy is shifted to lower energies compared to LaMnO3 (Mn3+) and CaMnO3 (Mn4+), illustrating the chemical down-shift in energy associated with decreasing transition metal valence. |
| q2 | identification | 30 | What specific local coordination environment does LaSrMnSbO6 represent in the context of Mn K-edge XANES analysis, and how does this contrast with a standard like MnO? | In the context of Mn K-edge XANES analysis, LaSrMnSbO6 represents an octahedrally coordinated Mn2+ environment within a corner-sharing perovskite structure. This contrasts with a standard like MnO, which features an edge-sharing (NaCl-type) structure rather than a corner-sharing one. This specific coordination environment arises directly from the sample's defined perovskite crystal structure and pure Mn2+ composition. Consequently, it serves as a pure (1.0 fraction) structural reference, allowing researchers to distinguish corner-sharing O-octahedra geometries from edge-sharing or face-sharing Mn2+ configurations. | The answer must identify LaSrMnSbO6 as having a corner-sharing octahedral (perovskite-based) environment, contrasting it with MnO which has an edge-sharing (NaCl structure) environment. |
| q3 | reasoning | 30 | Why is LaSrMnSbO6 an appropriate reference compound to include when analyzing the valence and local structure of a new complex Mn oxide? | LaSrMnSbO6 is an appropriate reference compound because it provides a pure (1.0 fraction) standard for octahedrally coordinated Mn2+ in a corner-sharing perovskite structure. Because its main-edge peak energy is shifted down relative to Mn3+ and Mn4+ perovskite standards, it establishes a clear baseline for the chemical shift associated with decreasing valence. This makes it ideal for analyzing new complex Mn oxides, as its specific sample conditions (Mn2+ oxidation state and perovskite crystal structure) isolate the exact spectral features of this electronic and structural environment. Using this standard allows researchers to accurately identify corner-sharing Mn2+ geometries and distinguish them from other structural motifs like edge-sharing configurations. | The answer should explain that it serves as a reliable baseline/standard for the Mn2+ oxidation state specifically within an octahedrally coordinated, corner-sharing structural motif. |
Review
#489
Mn2FeWO6
Mn K
▶
LLM Prompt
Sample Information
Material: Mn2FeWO6
Crystal Structure: Ni3TeO6-type
Oxidation State: Mn2+
Measurement Mode: transmission and fluorescence
- Mn2+ standard with Ni3TeO6-type structure
Measurement
We plan to measure the Mn K XANES spectrum of this sample.
Questions
Based on all the information above:
1. How does the Mn K-edge main peak position of the Ni3TeO6-type Mn2FeWO6 standard compare to that of a perovskite-based Mn2+ standard (e.g., LaSrMnSbO6)?
2. What structural information can be inferred from the specific energy shift of the Mn2FeWO6 main edge peak compared to corner-sharing perovskite standards?
3. In the context of analyzing a mixed-valence double corundum oxide, what specific role does the Mn2FeWO6 spectrum play?
Ground Truth
Compound: Mn2FeWO6
Oxidation state: Mn2+
Measurement: Mn K-edge, transmission and fluorescence mode, QAS 7BM at NSLS-II or X-19A at NSLS-I
Edge position: not reported
Spectral shape: The spectral peak of the Mn2FeWO6 spectrum is shifted well down in energy from the perovskite-Mn2+ standard.
Distinguishing features: The down-shift in energy compared to the perovskite-Mn2+ standard (LaSrMnSbO6) is typical of Ni3TeO6 structure compounds.
Key reasoning: Mn2FeWO6 is utilized as a standard for the Mn2+ oxidation state within a Ni3TeO6-type crystal structure. Its main edge peak is shifted well down in energy compared to perovskite-based Mn2+ standards (such as LaSrMnSbO6), which is a characteristic feature of Ni3TeO6-type structure compounds.
Reasoning source: Page 11, Mn-K XANES section
Scoring Rubric (total: 100 pts)
| Q | Type | Max | Question | Reference Answer | Scoring Criteria |
|---|---|---|---|---|---|
| q1 | spectral | 40 | How does the Mn K-edge main peak position of the Ni3TeO6-type Mn2FeWO6 standard compare to that of a perovskite-based Mn2+ standard (e.g., LaSrMnSbO6)? | The Mn K-edge main peak of the Mn2FeWO6 standard is shifted well down in energy compared to a perovskite-based Mn2+ standard such as LaSrMnSbO6. This spectral feature arises directly from the sample's specific Ni3TeO6-type crystal structure. Because the sample consists entirely of pure Mn2FeWO6 (fraction 1.0) with Mn in a 2+ oxidation state, the distinct structural and electronic environment of the Ni3TeO6-type lattice inherently produces this downward energy shift. Consequently, this shift serves as a characteristic signature distinguishing it from perovskite structures. | The answer must state that the spectral peak of Mn2FeWO6 is shifted well down in energy compared to the perovskite-Mn2+ standard. |
| q2 | reasoning | 30 | What structural information can be inferred from the specific energy shift of the Mn2FeWO6 main edge peak compared to corner-sharing perovskite standards? | The specific downward energy shift of the Mn2FeWO6 main edge peak indicates that the material possesses a Ni3TeO6-type crystal structure rather than a corner-sharing perovskite structure. Based on the sample conditions, the material is a pure Mn2FeWO6 compound (fraction 1.0) containing Mn in a 2+ oxidation state. The unique coordination and electronic environment of the Mn2+ ions within this Ni3TeO6-type lattice inherently cause the main edge peak to shift well down in energy relative to perovskite-based standards like LaSrMnSbO6. Therefore, this spectral shift acts as a direct structural marker confirming the Ni3TeO6-type framework. | The answer must mention that this down-shift in energy is typical or characteristic of Ni3TeO6-type structure compounds. |
| q3 | identification | 30 | In the context of analyzing a mixed-valence double corundum oxide, what specific role does the Mn2FeWO6 spectrum play? | The Mn2FeWO6 spectrum functions as a standard reference (fit basis of 1.0) for identifying the Mn2+ oxidation state within a Ni3TeO6-type crystal structure. This role is dictated by the sample conditions, as the material is a pure Mn2FeWO6 compound containing exclusively Mn2+ ions. Because the Ni3TeO6-type lattice produces a characteristic downward energy shift in the main edge peak compared to perovskite standards, this spectrum provides a highly specific structural and electronic baseline. Consequently, it is utilized as a reliable reference to isolate and identify the Mn2+ structural contribution in related complex materials. | The answer must identify that it serves as a standard reference for the Mn2+ component in a Ni3TeO6-type structure. |
Review
Intercalation of Ca into a Highly Defective Manganese Oxide at Room Temperature
APS
Electrochemistry
Bob Jin Kwon et al.
DOI: 10.1021/acs.chemmater.1c03803
1 scenario
▶
#490
MnOx
Ca K-edge
▶
LLM Prompt
Sample Information
Material: MnOx
Electrode Type: working electrode
Electrolyte: 0.5 M Ca(TFSI)2 in diglyme
Cell Type: coin cell
Charge Discharge: discharged
C Rate: C/25
Voltage V: -1.4
State Of Charge: 0.25
Cycle Number: 1
Capacity Mah G: 133
Sample-Specific Conditions
- state of charge: discharged
- MnOx electrode discharged to -1.4 V vs carbon
Measurement
We plan to measure the Ca K-edge XANES spectrum of this sample.
Questions
Based on all the information above:
1. To determine the nature of the Ca species in the discharged MnOx electrode, what reference spectra should be used for comparison, and what does this comparison reveal about the electrochemical reaction mechanism?
2. Describe the expected spectral shape of the Ca K-edge XANES for this discharged sample, specifically identifying the main peak regions (pre-edge and white line) and the electronic transitions responsible for them.
Ground Truth
Material: MnOx
Measurement: Ca K-edge XAS, fluorescence mode, beamline 20-BM at the Advanced Photon Source
Fit method: Qualitative spectral comparison (fingerprinting)
Phase fractions:
| Phase | Fraction |
|---|---|
| CaMn2O4-like local environment | 1.0 |
Fit basis (paper's reference spectra):
- Ca(TFSI)2 salt
- CaO
- CaMn2O4
Source evidence: Figure 4c, Figure 4d, and text on pages 19-20
Key reasoning: The nature of Ca2+ in the discharged electrodes was assessed by comparing the spectrum with Ca(TFSI)2 (residual electrolyte), CaO (possible conversion byproduct), and CaMn2O4 (standard oxide with Ca2+ and Mn3+ in a tunnel framework). The spectrum showed a different onset of the W1 feature and overall edge position compared to Ca(TFSI)2, and lacked the distinct features of CaO, ruling out electrolyte impurities and conversion reactions. The greatest similarity in edge features was found with CaMn2O4, implying the spectrum is most consistent with Ca2+ intercalated in a transition metal oxide.
Reasoning source: Pages 19-20, 'Valence state of Mn and Ca at bulk' section
Scoring Rubric (total: 100 pts)
| Q | Type | Max | Question | Reference Answer | Scoring Criteria |
|---|---|---|---|---|---|
| q1 | reasoning | 50 | To determine the nature of the Ca species in the discharged MnOx electrode, what reference spectra should be used for comparison, and what does this comparison reveal about the electrochemical reaction mechanism? | To determine the nature of the Ca species in the MnOx electrode discharged to -1.4 V, the spectrum should be compared against Ca(TFSI)2, CaO, and CaMn2O4 reference spectra. These specific references are chosen based on the sample conditions: Ca(TFSI)2 accounts for residual electrolyte from the 0.5 M Ca(TFSI)2 in diglyme solution, CaO represents a possible byproduct if a conversion reaction occurred, and CaMn2O4 serves as a standard for Ca2+ intercalated into a transition metal oxide tunnel framework. The comparison reveals that the sample spectrum lacks the distinct features of CaO and has a different W1 onset and edge position compared to Ca(TFSI)2, effectively ruling out conversion reactions and electrolyte impurities. Instead, the spectrum exhibits the greatest similarity to CaMn2O4, yielding a 1.0 fraction of a CaMn2O4-like local environment. This confirms that the electrochemical reaction mechanism during discharge is the intercalation of Ca2+ ions into the MnOx structure rather than a conversion process. | Full credit requires identifying the three key references (Ca(TFSI)2, CaO, CaMn2O4) and explaining that the sample matches CaMn2O4 while ruling out electrolyte impurities (Ca(TFSI)2) and conversion reactions (CaO), confirming an intercalation mechanism. |
| q2 | spectral | 50 | Describe the expected spectral shape of the Ca K-edge XANES for this discharged sample, specifically identifying the main peak regions (pre-edge and white line) and the electronic transitions responsible for them. | The Ca K-edge XANES spectrum for the discharged MnOx sample features a weakly allowed pre-edge peak (P) at ~4038 eV and a white line consisting of three main features: W1 (~4043 eV), W2 (~4047 eV), and W3 (~4049 eV). The pre-edge peak originates from 1s → 3d electronic transitions, which become weakly allowed because the intercalated Ca2+ ions do not occupy a center of inversion within the host lattice. The strong white line features (W1, W2, W3) arise from 1s → 4p transitions, with their relative intensity and position depending heavily on the specific Ca coordination environment. Because the sample was discharged to -1.4 V in a Ca-based electrolyte, Ca2+ intercalates into the MnOx framework, creating a local environment highly similar to CaMn2O4. Consequently, the resulting spectral shape matches the CaMn2O4 reference, lacking the distinct edge features of CaO or the specific W1 onset of the Ca(TFSI)2 electrolyte. | Full credit requires mentioning the weak pre-edge peak (P) originating from 1s → 3d transitions (due to lack of inversion center) and the white line consisting of three main features (W1, W2, W3) originating from 1s → 4p transitions. |
Review
Understanding the Control of Speciation of Molybdenum Oxides in MFI-Type Zeolites
BNL-NSLS-II-8-ID
Catalyst
Emanuele J. Hiennadi et al.
DOI: 10.1021/acs.chemmater.3c01545
3 scenarios
▶
#491
Mo/H-ZSM-5
Mo K
▶
LLM Prompt
Sample Information
Material: Mo/H-ZSM-5
Support: H-ZSM-5 (Si/Al = 15)
Reaction Conditions: Room temperature
Sample-Specific Conditions
- Preparation method: Physical mixing
- Physically mixed Mo/H-ZSM-5 catalyst precursor before TPO
Measurement
We plan to measure the Mo K XANES spectrum of this sample.
Questions
Based on all the information above:
1. Based on the preparation method (physical mixing) and conditions (room temperature, as-prepared), what is the expected dominant Mo phase in this sample, and what reference spectrum would be most appropriate to model its XANES data?
2. How is the XANES spectral shape of this as-prepared sample expected to differ from the final anchored Mo-oxide state formed after temperature-programmed oxidation?
Ground Truth
Material: Mo/H-ZSM-5
Measurement: Mo K-edge in-situ transmission XAS at SSRL beamline 9-3
Fit method: MCR-ALS and PCA
Phase fractions:
| Phase | Fraction |
|---|---|
| Eigenspectrum #2 (MoO3-like) | 1.0 |
Fit basis (paper's reference spectra):
- Eigenspectrum #1 (post-TPO-like)
- Eigenspectrum #2 (MoO3-like)
- Eigenspectrum #3 (AHM-like)
Source evidence: Figure 7(a) and Section 3.2, page 21
Key reasoning: The catalyst was prepared by physical mixing of solid MoO3 and H-ZSM-5. At room temperature (as-prepared state), the MoO3 precursor has not yet mobilized. Elevated temperatures (above 400 °C) are required for the MoO3 crystallites to decompose, disperse, migrate into the zeolite channels, and exchange onto zeolitic Brønsted acid sites. Therefore, the initial state consists entirely of the unreacted MoO3 precursor.
Reasoning source: Section 3.2, page 21
Scoring Rubric (total: 100 pts)
| Q | Type | Max | Question | Reference Answer | Scoring Criteria |
|---|---|---|---|---|---|
| q1 | identification | 50 | Based on the preparation method (physical mixing) and conditions (room temperature, as-prepared), what is the expected dominant Mo phase in this sample, and what reference spectrum would be most appropriate to model its XANES data? | The expected dominant Mo phase in this sample is unreacted MoO3, and the most appropriate reference spectrum to model its XANES data is Eigenspectrum #2 (MoO3-like), which accounts for a fraction of 1.0. This phase is expected because the catalyst precursor was prepared by physically mixing solid MoO3 and H-ZSM-5 at room temperature. Under these as-prepared, room-temperature conditions, the MoO3 precursor has not yet mobilized. Elevated temperatures (above 400 °C) are required for the MoO3 crystallites to decompose, disperse, migrate into the zeolite channels, and exchange onto the zeolitic Brønsted acid sites, leaving the initial state entirely as the unreacted MoO3 precursor. | Full credit for identifying MoO3 as the dominant phase (fraction ~1.0) and stating that a bulk MoO3 reference spectrum is appropriate. |
| q3 | spectral | 50 | How is the XANES spectral shape of this as-prepared sample expected to differ from the final anchored Mo-oxide state formed after temperature-programmed oxidation? | The XANES spectrum of this as-prepared sample is expected to be a close match to bulk MoO3 and will lack the pronounced pre-edge feature at 20,005 eV that emerges in the final anchored Mo-oxide state. This spectral difference arises because the sample was prepared by physical mixing at room temperature, meaning the MoO3 precursor has not yet mobilized or reacted with the H-ZSM-5 support. Elevated temperatures (above 400 °C) are required for the MoO3 to disperse, migrate into the zeolite channels, and exchange onto Brønsted acid sites. Consequently, the as-prepared sample remains entirely unreacted MoO3, whereas the final anchored state exhibits the pronounced pre-edge feature indicative of a structural change to a more tetrahedral character. | Full credit for noting that the as-prepared spectrum matches bulk MoO3 and lacks the pronounced pre-edge feature (at 20,005 eV) associated with the more tetrahedral character of the final anchored state. |
Review
#492
Mo/H-ZSM-5
Mo K
▶
LLM Prompt
Sample Information
Material: Mo/H-ZSM-5
Support: H-ZSM-5 (Si/Al = 15)
Reaction Conditions: Room temperature
Sample-Specific Conditions
- Preparation method: Incipient wetness impregnation
- Incipient wetness impregnated Mo/H-ZSM-5 catalyst precursor before TPO
Measurement
We plan to measure the Mo K XANES spectrum of this sample.
Questions
Based on all the information above:
1. Based on the preparation method (incipient wetness impregnation with AHM) and the sample state (as-prepared, room temperature), what Mo phase is expected to dominate the sample, and why?
2. Describe the expected pre-edge feature of this as-prepared sample compared to the final calcined catalyst. What does this indicate about the local geometry of the Mo species?
3. What reference spectrum or basis component is needed to represent this initial state in a spectral deconvolution analysis (such as MCR-ALS)?
Ground Truth
Material: Mo/H-ZSM-5
Measurement: Mo K-edge XANES, transmission mode, SSRL beamline 9-3
Fit method: MCR-ALS (Multivariate curve resolution-alternating least squares) and PCA
Phase fractions:
| Phase | Fraction |
|---|---|
| Eigenspectrum #3 (AHM-like) | 1.0 |
Fit basis (paper's reference spectra):
- Eigenspectrum #1 (post-TPO-like)
- Eigenspectrum #2 (MoO3-like)
- Eigenspectrum #3 (AHM-like)
Source evidence: Figure 7(c) and Section 3.2, Page 21
Key reasoning: The initial XANES spectra of the samples pre-TPO show that the starting Mo species are dependent on the Mo precursor used in synthesis. For incipient wetness impregnated (IWI) samples, the dominant component of the as-prepared catalyst is a close match to the XANES spectra of ammonium heptamolybdate (AHM). This indicates that before temperature-programmed oxidation, the Mo species remain as the unreacted AHM precursor deposited on the zeolite.
Reasoning source: Section 3.2, Pages 20-21
Scoring Rubric (total: 100 pts)
| Q | Type | Max | Question | Reference Answer | Scoring Criteria |
|---|---|---|---|---|---|
| q1 | reasoning | 35 | Based on the preparation method (incipient wetness impregnation with AHM) and the sample state (as-prepared, room temperature), what Mo phase is expected to dominate the sample, and why? | The dominant Mo phase expected in this sample is unreacted ammonium heptamolybdate (AHM), representing a fraction of 1.0. This occurs because the sample was prepared via incipient wetness impregnation and is in its as-prepared state at room temperature, prior to any temperature-programmed oxidation (TPO). Under these pre-TPO conditions, the starting Mo species remain entirely dependent on the initial precursor used during synthesis. Consequently, the Mo species have not yet reacted or anchored to the zeolite support, leaving the unreacted AHM precursor deposited on the H-ZSM-5 support as the sole phase. | Must identify Ammonium heptamolybdate (AHM) as the dominant phase and explain that at room temperature before temperature-programmed oxidation (TPO), the starting precursor remains unreacted on the zeolite. |
| q2 | spectral | 40 | Describe the expected pre-edge feature of this as-prepared sample compared to the final calcined catalyst. What does this indicate about the local geometry of the Mo species? | The expected pre-edge feature at 20,005 eV for this as-prepared sample will be weak or absent, unlike the pronounced pre-edge seen in the final calcined catalyst. This spectral difference arises because the sample is at room temperature and has not yet undergone temperature-programmed oxidation (TPO). In this unreacted, pre-TPO state, the Mo species exist as bulk-like ammonium heptamolybdate (AHM) deposited on the zeolite, which lacks the tetrahedral character of the final anchored Mo-oxide state. Therefore, the weak pre-edge indicates a less tetrahedral local geometry for the Mo species compared to the calcined samples. | Must state that the pre-edge feature (at 20,005 eV) is weak or absent compared to the calcined state, indicating a lack of tetrahedral character (or less tetrahedral geometry) in the initial AHM precursor. |
| q3 | identification | 25 | What reference spectrum or basis component is needed to represent this initial state in a spectral deconvolution analysis (such as MCR-ALS)? | In a spectral deconvolution analysis like MCR-ALS, "Eigenspectrum #3 (AHM-like)" is the required basis component to represent this initial state, accounting for a fraction of 1.0. This specific basis component is needed because the sample was prepared via incipient wetness impregnation and is being measured at room temperature before temperature-programmed oxidation (TPO). Under these specific pre-TPO conditions, the Mo species have not yet reacted with the H-ZSM-5 support and remain entirely as the unreacted ammonium heptamolybdate (AHM) precursor. Consequently, the XANES spectrum of the as-prepared catalyst is a close match to bulk AHM, necessitating the AHM-like eigenspectrum to fully describe the sample. | Must identify that a spectrum matching bulk AHM (or an AHM-like eigenspectrum) is required to fit this state. |
Review
#493
Mo/H-ZSM-5
Mo K
▶
LLM Prompt
Sample Information
Material: Mo/H-ZSM-5
Support: H-ZSM-5 (Si/Al = 15)
Reaction Conditions: 700 °C in 20% O2/He
Sample-Specific Conditions
- Treatment: Post-TPO
- Physically mixed Mo/H-ZSM-5 catalyst after TPO
Measurement
We plan to measure the Mo K XANES spectrum of this sample.
Questions
Based on all the information above:
1. Based on the sample conditions (physically mixed Mo/H-ZSM-5 after TPO at 700 °C), what phase or state dominates the Mo speciation, and what physical process leads to its formation at these elevated temperatures?
Ground Truth
Material: Mo/H-ZSM-5
Measurement: Mo K-edge in transmission mode at SSRL beamline 9-3
Fit method: PCA and MCR-ALS
Phase fractions:
| Phase | Fraction |
|---|---|
| Eigenspectrum #1 (post-TPO-like / anchored Mo-oxides) | 1.0 |
Fit basis (paper's reference spectra):
- Eigenspectrum #1 (post-TPO-like / anchored Mo-oxides)
- Eigenspectrum #2 (MoO3-like)
- Eigenspectrum #3 (AHM-like)
Source evidence: Figure 7(a) and Section 3.2, page 21
Key reasoning: During TPO of physically mixed samples, the initial MoO3 precursor requires elevated temperatures to decompose before mobilizing into the zeolite channels. Between 400 and 500 °C, the MoO3-like component decays and the final state component increases, corresponding to the exchange of Mo species onto zeolitic Brønsted acid sites. By 700 °C, the sample fully transitions to a uniform final eigenspectral composition representing anchored Mo-oxides. This final state does not match known bulk oxidic Mo compounds, indicating unique anchored species or heterogeneity in the anchored structures.
Reasoning source: Section 3.2, page 21
Scoring Rubric (total: 100 pts)
| Q | Type | Max | Question | Reference Answer | Scoring Criteria |
|---|---|---|---|---|---|
| q1 | reasoning | 100 | Based on the sample conditions (physically mixed Mo/H-ZSM-5 after TPO at 700 °C), what phase or state dominates the Mo speciation, and what physical process leads to its formation at these elevated temperatures? | Based on the sample conditions, the Mo speciation is entirely dominated by a post-TPO-like state consisting of anchored Mo-oxides, which accounts for a fraction of 1.0. This final state arises because, during the TPO of the physically mixed Mo/H-ZSM-5 sample, the initial MoO3 precursor requires elevated temperatures to decompose and mobilize into the zeolite channels. As the temperature increases in the 20% O2/He atmosphere, the MoO3-like component decays between 400 and 500 °C, allowing Mo species to exchange onto the zeolitic Brønsted acid sites. By the time the temperature reaches 700 °C, this physical mobilization and exchange process is complete, resulting in a uniform composition of unique anchored Mo-oxides that do not match known bulk oxidic Mo compounds. | Must identify that anchored Mo-oxides (or a uniform post-TPO state) dominate (fraction ~1.0). Must explain that elevated temperatures are required to decompose the initial MoO3 precursor, mobilize it into the zeolite channels, and exchange it onto Brønsted acid sites. |
Review
Distribution of Copper States, Phases, and Defects across the Depth of a Cu-Doped CdTe Solar Cell
APS
Thin Film
Srisuda Rojsatien et al.
DOI: 10.1021/acs.chemmater.3c01688
7 scenarios
▶
#494
CdTe solar cell (Glass/SnO2/CdS/CdTe/Cu/ZnTe/Mo)
Cu K-edge
▶
LLM Prompt
Sample Information
Material: CdTe solar cell (Glass/SnO2/CdS/CdTe/Cu/ZnTe/Mo)
Deposition Method: sputtering (CdS, ZnTe, Mo), closed space sublimation (CdTe), evaporation (Cu)
Substrate: soda-lime glass
Film Thickness Nm: 5000
Composition Variable: Depth position
Composition Value: ZnTe layer (position 1)
Sample-Specific Conditions
- Depth position: ZnTe layer (position 1)
- Cross-section position in ZnTe layer near Mo interface
Measurement
We plan to measure the Cu K-edge XANES spectrum of this sample.
Questions
Based on all the information above:
1. What candidate Cu-related phases and point defects should be included in the reference library for Linear Combination Fitting (LCF) of the Cu K-edge XANES spectrum measured in the ZnTe back contact layer of this CdTe solar cell?
2. Based on the sample architecture and processing conditions (Cu evaporated on CdCl2-treated CdTe, followed by ZnTe/Mo sputtering and annealing at 200 C), estimate the relative fractions of the Cu species in the ZnTe layer near the Mo interface.
3. Explain the physical and chemical reasoning for the formation of the dominant CuxTe phases and the presence of CuS in the ZnTe back contact layer, considering that sulfur was not intentionally incorporated in this region.
Ground Truth
Material: CdTe solar cell (Glass/SnO2/CdS/CdTe/Cu/ZnTe/Mo)
Measurement: Cu K-edge XANES in fluorescence mode using a nano-probe (50 nm spot size)
Fit method: Linear combination fitting (LCF) using non-negative least squares
Phase fractions: (±15%)
| Phase | Fraction |
|---|---|
| Cu1.43Te | 0.18 |
| Cu1.4Te | 0.15 |
| ◊CuTe | 0.1 |
| Cu7Te4 | 0.1 |
| CuS | 0.1 |
| CuCl | 0.1 |
| CuZn | 0.1 |
| CuCl2 | 0.07 |
| Cui,Zn | 0.05 |
| Cu2O | 0.05 |
Fit basis (paper's reference spectra):
- Cu1.43Te
- CuCl2
- Cui,Zn
- Cu1.4Te
- CuCl
- CuTe
- ◊CuTe
- CuS
- CuZn
- Cu7Te4
- Cu2O
Source evidence: Figure 4(b) and Page 11 text
Key reasoning: In the ZnTe layer, most Cu atoms form CuxTe phases (predominantly Cu1.43Te and Cu1.4Te) due to reactions between Cu and excess Te at the ZnTe|CdTe interface. The presence of CuS indicates that sulfur atoms migrate from the front CdS layer through the CdTe grain boundaries and react with Cu at the back contact, which is a spontaneous process at processing temperatures. Traces of Cu2O, CuCl, and Cu point defects in the ZnTe matrix are also present due to the complex diffusion and reaction history during the CdCl2 treatment and annealing.
Reasoning source: Page 11, Results and discussion (paragraphs discussing Fig. 4(a)-(b))
Scoring Rubric (total: 100 pts)
| Q | Type | Max | Question | Reference Answer | Scoring Criteria |
|---|---|---|---|---|---|
| q1 | identification | 30 | What candidate Cu-related phases and point defects should be included in the reference library for Linear Combination Fitting (LCF) of the Cu K-edge XANES spectrum measured in the ZnTe back contact layer of this CdTe solar cell? | The reference library for Linear Combination Fitting should include Cu1.43Te, Cu1.4Te, ◊CuTe, Cu7Te4, CuTe, CuS, CuCl, CuCl2, CuZn, Cu2O, and Cui,Zn point defects. These specific phases are expected in the ZnTe layer near the Mo interface because evaporated Cu reacts with excess Te at the ZnTe|CdTe interface to form various CuxTe phases. Additionally, sulfur migrates from the front sputtered CdS layer through the CdTe grain boundaries to form CuS at the back contact. Finally, the complex diffusion and reaction history during processing, including CdCl2 treatment and annealing, leads to the formation of Cu chlorides, oxides, and Cu point defects within the ZnTe matrix. | Full points for identifying a mix of CuxTe phases (e.g., Cu1.43Te, Cu1.4Te, CuTe), CuS, copper chlorides (CuCl, CuCl2), copper oxides (Cu2O), and Cu point defects in ZnTe (CuZn, Cui,Zn). Partial points for missing some minor phases or defect types. |
| q2 | quantification | 35 | Based on the sample architecture and processing conditions (Cu evaporated on CdCl2-treated CdTe, followed by ZnTe/Mo sputtering and annealing at 200 C), estimate the relative fractions of the Cu species in the ZnTe layer near the Mo interface. | The estimated relative fractions in the ZnTe layer are 18% Cu1.43Te, 15% Cu1.4Te, 10% ◊CuTe, 10% Cu7Te4, 10% CuS, 10% CuCl, 10% CuZn, 7% CuCl2, 5% Cui,Zn, and 5% Cu2O, with a 15% uncertainty. These specific values result from the sample conditions where the majority of Cu is consumed by reactions with excess Te at the ZnTe|CdTe interface, forming predominantly Cu1.43Te and Cu1.4Te. The 10% CuS fraction arises because sulfur spontaneously migrates from the front CdS layer through CdTe grain boundaries to react with Cu at the back contact at processing temperatures. The remaining minor fractions reflect the trace byproducts of the complex diffusion history during the CdCl2 treatment and subsequent annealing steps. | Full points for estimating that CuxTe phases dominate (combined ~50-55%, with Cu1.43Te and Cu1.4Te being the most prominent), followed by significant fractions of CuS (~10%), Cu point defects in ZnTe (~15%), and minor traces of Cu chlorides and oxides. Deduct points if CuxTe is not the dominant species or if CuS is omitted. |
| q3 | reasoning | 35 | Explain the physical and chemical reasoning for the formation of the dominant CuxTe phases and the presence of CuS in the ZnTe back contact layer, considering that sulfur was not intentionally incorporated in this region. | The dominant CuxTe phases, predominantly Cu1.43Te and Cu1.4Te, form in the ZnTe layer because the evaporated Cu reacts directly with excess Te present at the ZnTe|CdTe interface. The presence of CuS in this back contact region occurs because sulfur atoms migrate from the front sputtered CdS layer through the CdTe grain boundaries. This migration and subsequent reaction with Cu at the back contact is a spontaneous process at the processing temperatures used for these solar cells. The complex diffusion and reaction history across the 5000 nm film during treatments drives these elements to intermix, resulting in these specific phase formations despite sulfur not being intentionally added to the ZnTe layer. | Full points for explaining that CuxTe forms due to reactions between Cu and excess Te at the ZnTe|CdTe interface, and that CuS forms because S atoms migrate from the front CdS layer through CdTe grain boundaries to react with Cu at the back contact during processing/annealing. Partial points if the S migration mechanism is missing. |
Review
#495
CdTe solar cell (Glass/SnO2/CdS/CdTe/Cu/ZnTe/Mo)
Cu K-edge
▶
LLM Prompt
Sample Information
Material: CdTe solar cell (Glass/SnO2/CdS/CdTe/Cu/ZnTe/Mo)
Deposition Method: sputtering (CdS, ZnTe, Mo), closed space sublimation (CdTe), evaporation (Cu)
Substrate: soda-lime glass
Film Thickness Nm: 5000
Composition Variable: Depth position
Composition Value: ZnTe layer (position 3)
Sample-Specific Conditions
- Depth position: ZnTe layer (position 3)
- Cross-section position in middle of ZnTe layer
Measurement
We plan to measure the Cu K-edge XANES spectrum of this sample.
Questions
Based on all the information above:
1. What candidate reference spectra should be included in the linear combination fitting (LCF) basis to accurately model the Cu K-edge XANES of the ZnTe layer in this CdTe solar cell?
2. Based on the sample conditions (position 3 in the middle of the ZnTe layer), estimate the dominant phase and the approximate fractions of the Cu-containing phases present.
3. Explain the physical mechanism that leads to the formation of the dominant phase in this specific region (ZnTe3), given that its constituent elements (other than Cu) were not intentionally incorporated in the back contact.
Ground Truth
Material: CdTe solar cell (Glass/SnO2/CdS/CdTe/Cu/ZnTe/Mo)
Measurement: Cu K-edge XANES in fluorescence mode using a nano-probe
Fit method: Linear combination fitting (LCF)
Phase fractions: (±15%)
| Phase | Fraction |
|---|---|
| CuS | 0.55 |
| Cu1.43Te | 0.15 |
| Cu1.4Te | 0.1 |
| ◊CuTe | 0.1 |
| Cu7Te4 | 0.1 |
Fit basis (paper's reference spectra):
- Cu1.43Te
- CuCl2
- Cui,Zn
- Cu1.4Te
- CuCl
- CuTe
- ◊CuTe
- CuS
- CuZn
- Cu7Te4
- Cu2O
Source evidence: Figure 4(b) and text on page 11
Key reasoning: In the ZnTe layer, Cu typically forms CuxTe phases (like Cu1.43Te and Cu1.4Te) due to reactions at the ZnTe|CdTe interface. However, in the specific region ZnTe3, there is a dominant signature of CuS (>50 atomic %). This indicates that sulfur atoms migrate from the front CdS layer through the CdTe grain boundaries and react spontaneously with Cu at the back contact to form CuS.
Reasoning source: Page 11, Results and discussion
Scoring Rubric (total: 100 pts)
| Q | Type | Max | Question | Reference Answer | Scoring Criteria |
|---|---|---|---|---|---|
| q1 | identification | 20 | What candidate reference spectra should be included in the linear combination fitting (LCF) basis to accurately model the Cu K-edge XANES of the ZnTe layer in this CdTe solar cell? | The candidate reference spectra for the LCF basis should include Cu1.43Te, CuCl2, Cui,Zn, Cu1.4Te, CuCl, CuTe, ◊CuTe, CuS, CuZn, Cu7Te4, and Cu2O. These phases are selected because the evaporated Cu layer in the Glass/SnO2/CdS/CdTe/Cu/ZnTe/Mo stack is expected to react at the ZnTe|CdTe interface, typically forming various CuxTe phases. Furthermore, CuS must be included because sulfur atoms migrate from the front CdS layer through the CdTe grain boundaries to react with Cu at the back contact. The remaining phases account for other potential interactions, dopant behaviors, and oxidation states within the complex multi-layer solar cell structure. | Full credit for identifying a mix of CuxTe phases (Cu1.43Te, Cu1.4Te, CuTe, Cu7Te4), CuS, and trace components like CuClx or Cu2O. Partial credit for identifying only CuxTe phases or only CuS. |
| q2 | quantification | 40 | Based on the sample conditions (position 3 in the middle of the ZnTe layer), estimate the dominant phase and the approximate fractions of the Cu-containing phases present. | In the middle of the ZnTe layer (position 3), the dominant phase is CuS at a fraction of 0.55, with the remainder comprising Cu1.43Te (0.15), Cu1.4Te (0.10), ◊CuTe (0.10), and Cu7Te4 (0.10), all subject to a 15% uncertainty. These specific fractions arise because the evaporated Cu at the back contact undergoes competing reactions in this region of the solar cell. While Cu typically forms CuxTe phases due to localized reactions at the ZnTe|CdTe interface, sulfur atoms migrating from the front CdS layer through the CdTe grain boundaries react spontaneously with the Cu. This extensive sulfur migration ultimately causes CuS to dominate the composition (>50 atomic %) in the ZnTe3 region. | Full credit for identifying CuS as the dominant phase (~55%) and CuxTe phases (Cu1.43Te, Cu1.4Te, CuTe, Cu7Te4) making up the remainder (~45%). Partial credit for identifying CuS as dominant without correct secondary phases, or vice versa. |
| q3 | reasoning | 40 | Explain the physical mechanism that leads to the formation of the dominant phase in this specific region (ZnTe3), given that its constituent elements (other than Cu) were not intentionally incorporated in the back contact. | The dominant phase in the middle of the ZnTe layer (position 3) is CuS, which forms through a cross-layer migration mechanism. Specifically, sulfur atoms originate from the front sputtered CdS layer and migrate through the grain boundaries of the 5000 nm thick CdTe layer. Upon reaching the back contact, these sulfur atoms react spontaneously with the evaporated Cu layer. Consequently, while Cu typically forms CuxTe phases at the ZnTe|CdTe interface, this aggressive sulfur migration leads to a dominant CuS signature (>50 atomic %) in the ZnTe3 region despite sulfur not being intentionally deposited there. | Full credit for explaining that sulfur atoms migrate from the front CdS layer through the CdTe grain boundaries and react spontaneously with Cu at the back contact to form CuS. Partial credit for mentioning sulfur diffusion without specifying the source (CdS) or the pathway (grain boundaries). |
Review
#496
CdTe solar cell (Glass/SnO2/CdS/CdTe/Cu/ZnTe/Mo)
Cu K-edge
▶
LLM Prompt
Sample Information
Material: CdTe solar cell (Glass/SnO2/CdS/CdTe/Cu/ZnTe/Mo)
Deposition Method: sputtering (CdS, ZnTe, Mo), closed space sublimation (CdTe), evaporation (Cu)
Substrate: soda-lime glass
Film Thickness Nm: 5000
Composition Variable: Depth position
Composition Value: ZnTe layer (position 7)
Sample-Specific Conditions
- Depth position: ZnTe layer (position 7)
- Cross-section position in ZnTe layer near CdTe interface
Measurement
We plan to measure the Cu K-edge XANES spectrum of this sample.
Questions
Based on all the information above:
1. What candidate reference spectra (phases and point defects) should be included in the linear combination fitting basis for the Cu K-edge XANES analysis of the ZnTe layer near the CdTe interface in this solar cell?
2. Based on the sample conditions (ZnTe layer near the CdTe interface in a Cu-doped CdTe solar cell), estimate the dominant Cu phases and their approximate fractions.
3. Explain the physical and chemical reasoning for the formation of the dominant Cu1.43Te phase and the presence of CuS in the ZnTe layer at the back contact, despite sulfur not being intentionally incorporated there.
Ground Truth
Material: CdTe solar cell (Glass/SnO2/CdS/CdTe/Cu/ZnTe/Mo)
Measurement: Cu K-edge XANES in fluorescence mode using a 50 nm incident beam spot size at the nano-probe end station 26-ID-C
Fit method: Linear combination fitting (LCF) using non-negative least squares
Phase fractions: (±15%)
| Phase | Fraction |
|---|---|
| Cu1.43Te | 0.45 |
| Cu1.4Te | 0.2 |
| ◊CuTe | 0.15 |
| CuS | 0.1 |
| Cu7Te4 | 0.1 |
Fit basis (paper's reference spectra):
- Cu1.43Te
- CuCl2
- Cui,Zn
- Cu1.4Te
- CuCl
- CuTe
- ◊CuTe
- CuS
- CuZn
- Cu7Te4
- Cu2O
Source evidence: Figure 4(b) and page 11 text
Key reasoning: In the ZnTe layer near the CdTe interface, most Cu atoms react with excess Te to form various CuxTe phases. The orthorhombic Cu1.43Te is the majority phase, followed by tetragonal Cu1.4Te, which are stable and beneficial for device performance. Additionally, a notable fraction of CuS is present; this occurs because sulfur atoms migrate from the front CdS layer through the CdTe grain boundaries and spontaneously react with Cu at the back contact.
Reasoning source: Results and discussion - Cu local structures located in different layers (Page 11)
Scoring Rubric (total: 100 pts)
| Q | Type | Max | Question | Reference Answer | Scoring Criteria |
|---|---|---|---|---|---|
| q1 | identification | 20 | What candidate reference spectra (phases and point defects) should be included in the linear combination fitting basis for the Cu K-edge XANES analysis of the ZnTe layer near the CdTe interface in this solar cell? | The linear combination fitting basis for the Cu K-edge XANES analysis should include Cu1.43Te, CuCl2, Cui,Zn, Cu1.4Te, CuCl, CuTe, ◊CuTe, CuS, CuZn, Cu7Te4, and Cu2O. These specific candidate references are required because, at the depth position of the ZnTe layer near the CdTe interface, evaporated Cu reacts heavily with excess Te to form various CuxTe phases. Furthermore, references like CuS must be included because sulfur from the front sputtered CdS layer migrates through the CdTe grain boundaries to the back contact. The remaining phases account for potential interactions with the ZnTe layer, dopants, and oxidation within the complex multi-layer solar cell structure. | Full credit for identifying a comprehensive mix of CuxTe phases (Cu1.43Te, Cu1.4Te, CuTe, Cu7Te4), CuS, and potential trace phases/defects (Cu2O, CuClx, metallic Cu, CuZn, Cui,Zn) as the necessary basis set. |
| q2 | quantification | 30 | Based on the sample conditions (ZnTe layer near the CdTe interface in a Cu-doped CdTe solar cell), estimate the dominant Cu phases and their approximate fractions. | The dominant Cu phases in the ZnTe layer near the CdTe interface are Cu1.43Te (0.45), Cu1.4Te (0.20), ◊CuTe (0.15), CuS (0.10), and Cu7Te4 (0.10), with a fitting uncertainty of 15%. These specific fractions result from the evaporated Cu reacting with excess Te at this specific depth position to form a majority of stable, device-beneficial CuxTe phases, particularly orthorhombic Cu1.43Te and tetragonal Cu1.4Te. The 10% fraction of CuS arises because sulfur atoms migrate from the front CdS layer through the 5000 nm thick CdTe layer's grain boundaries. Upon reaching the back contact, this migrated sulfur spontaneously reacts with the Cu, resulting in the observed CuS fraction. | Full credit for identifying Cu1.43Te as the dominant phase (~45%), followed by Cu1.4Te (~20%), CuTe (~15%), and minor fractions (~10% each) of CuS and Cu7Te4. Partial credit for correctly identifying the dominance of CuxTe phases over others. |
| q3 | reasoning | 50 | Explain the physical and chemical reasoning for the formation of the dominant Cu1.43Te phase and the presence of CuS in the ZnTe layer at the back contact, despite sulfur not being intentionally incorporated there. | The formation of the dominant orthorhombic Cu1.43Te phase occurs because evaporated Cu atoms at the ZnTe/CdTe interface react strongly with excess Te present in that region. This specific CuxTe stoichiometry, along with tetragonal Cu1.4Te, forms because these phases are stable and beneficial for the solar cell's overall device performance. The unexpected presence of CuS at this back contact depth position is driven by elemental migration across the 5000 nm device stack. Specifically, sulfur atoms originate from the front sputtered CdS layer, migrate through the grain boundaries of the closed space sublimation-deposited CdTe layer, and spontaneously react with Cu upon reaching the ZnTe layer. | Full credit for explaining that Cu reacts with excess Te at the ZnTe|CdTe interface to form stable CuxTe phases (primarily Cu1.43Te), and that CuS forms because S atoms migrate from the front CdS layer through CdTe grain boundaries to spontaneously react with Cu at the back contact. |
Review
#497
CdTe solar cell (Glass/SnO2/CdS/CdTe/Cu/ZnTe/Mo)
Cu K-edge
▶
LLM Prompt
Sample Information
Material: CdTe solar cell (Glass/SnO2/CdS/CdTe/Cu/ZnTe/Mo)
Deposition Method: sputtering (CdS, ZnTe, Mo), closed space sublimation (CdTe), evaporation (Cu)
Substrate: soda-lime glass
Film Thickness Nm: 5000
Composition Variable: Depth position
Composition Value: CdTe layer (position 1)
Sample-Specific Conditions
- Depth position: CdTe layer (position 1)
- Cross-section position in CdTe layer near ZnTe interface
Measurement
We plan to measure the Cu K-edge XANES spectrum of this sample.
Questions
Based on all the information above:
1. What candidate reference spectra should be included in the linear combination fitting basis to model the Cu K-edge XANES spectrum of the CdTe layer near the ZnTe interface?
2. Estimate the phase fractions of the Cu species present in the CdTe layer immediately adjacent to the ZnTe back contact (position CdTe1).
3. Explain the physical and chemical reasons for the formation of the dominant Cu species ([CuCd-Cli]0 and Cu2O) at this specific depth within the CdTe absorber.
Ground Truth
Material: CdTe solar cell (Glass/SnO2/CdS/CdTe/Cu/ZnTe/Mo)
Measurement: Cu K-edge fluorescence-mode XANES, nano-probe end station 26-ID-C at Advanced Photon Source
Fit method: Linear combination fitting (LCF) using non-negative least square method
Phase fractions: (±15%)
| Phase | Fraction |
|---|---|
| [CuCd-Cli]0 | 0.6 |
| Cu2O | 0.2 |
| CuCl | 0.1 |
| CuCl2 | 0.1 |
Fit basis (paper's reference spectra):
- [CuCd-Cli]0
- Cu0
- [CuCd-Cli]+2
- CuS
- Cui,Cd
- CuO
- CuCl
- Cu2O
- CuCl2
Source evidence: Figure 4(f), CdTe1 bar; Page 12 text
Key reasoning: In the region adjacent to the ZnTe back contact (CdTe1), the Cu concentration is high and the Cl concentration is expected to be high since the CdCl2 treatment was initiated there. This leads to a high spectral signature of the neutral [CuCd-Cli]0 complex, which is electrically inactive and explains the low activation ratio of Cu doping. The remainder of the Cu atoms exist mostly as CuxO (particularly Cu2O), which forms because Cu can react with O atoms introduced during the CdCl2 treatment.
Reasoning source: Results and discussion, 'Cu local structures located in different layers' section, page 12
Scoring Rubric (total: 100 pts)
| Q | Type | Max | Question | Reference Answer | Scoring Criteria |
|---|---|---|---|---|---|
| q1 | identification | 30 | What candidate reference spectra should be included in the linear combination fitting basis to model the Cu K-edge XANES spectrum of the CdTe layer near the ZnTe interface? | The linear combination fitting basis for the Cu K-edge XANES spectrum should include [CuCd-Cli]0, Cu0, [CuCd-Cli]+2, CuS, Cui,Cd, CuO, CuCl, Cu2O, and CuCl2. These specific reference phases are expected because the measurement is taken at a depth position in the CdTe layer near the ZnTe interface, where Cu concentration is high. At this specific cross-section position, the initiation of the CdCl2 treatment introduces high concentrations of Cl and O atoms into the matrix. Consequently, the evaporated Cu reacts with these elements and the CdTe lattice to form various Cu-Cl complexes, copper oxides, and defect structures like the neutral [CuCd-Cli]0 complex. | Full credit for identifying Cu-Cl defect complexes (like CuCd-Cli), copper oxides (Cu2O, CuO), copper chlorides (CuCl, CuCl2), and Cu point defects (Cui,Cd). Partial credit for missing specific defect complexes but including the general secondary phases. |
| q2 | quantification | 35 | Estimate the phase fractions of the Cu species present in the CdTe layer immediately adjacent to the ZnTe back contact (position CdTe1). | The estimated phase fractions for the Cu species in the CdTe layer near the ZnTe interface are 60% [CuCd-Cli]0, 20% Cu2O, 10% CuCl, and 10% CuCl2, with a fitting uncertainty of 15%. These specific values result from the high concentrations of both Cu and Cl at this depth position, as the CdCl2 treatment was initiated near this back contact. This chemical environment strongly favors the formation of the electrically inactive, neutral [CuCd-Cli]0 complex, making it the dominant phase at 60%. The remaining fractions consist largely of Cu2O and copper chlorides, which form because the abundant Cu atoms react with the oxygen and chlorine introduced during the CdCl2 treatment. | Full credit for estimating ~60% [CuCd-Cli]0, ~20% Cu2O, and ~10% each of CuCl and CuCl2. Partial credit for identifying [CuCd-Cli]0 as the dominant majority phase (>50%) and Cu2O as the main secondary phase. |
| q3 | reasoning | 35 | Explain the physical and chemical reasons for the formation of the dominant Cu species ([CuCd-Cli]0 and Cu2O) at this specific depth within the CdTe absorber. | At the specific depth position within the CdTe layer near the ZnTe interface, the Cu concentration is naturally high due to its proximity to the back contact. Additionally, the Cl concentration is high in this region because the CdCl2 treatment was initiated there. The combination of abundant Cu and Cl drives the formation of the dominant neutral [CuCd-Cli]0 complex, which is electrically inactive and accounts for the low activation ratio of Cu doping in the solar cell. Furthermore, oxygen atoms are introduced alongside the CdCl2 treatment at this interface. The remaining Cu atoms readily react with this introduced oxygen, leading to the formation of Cu2O as the secondary dominant species. | Full credit for explaining that the high concentration of [CuCd-Cli]0 is due to high Cu and Cl concentrations near the back contact where CdCl2 treatment was initiated, and that Cu2O forms by reaction with oxygen introduced during the same treatment. Must mention that the [CuCd-Cli]0 complex is electrically inactive. |
Review
#498
CdTe solar cell (Glass/SnO2/CdS/CdTe/Cu/ZnTe/Mo)
Cu K-edge
▶
LLM Prompt
Sample Information
Material: CdTe solar cell (Glass/SnO2/CdS/CdTe/Cu/ZnTe/Mo)
Deposition Method: sputtering (CdS, ZnTe, Mo), closed space sublimation (CdTe), evaporation (Cu)
Substrate: soda-lime glass
Film Thickness Nm: 5000
Composition Variable: Depth position
Composition Value: CdTe layer (position 5)
Sample-Specific Conditions
- Depth position: CdTe layer (position 5)
- Cross-section position in middle of CdTe layer
Measurement
We plan to measure the Cu K-edge XANES spectrum of this sample.
Questions
Based on all the information above:
1. What candidate reference spectra (phases and defect structures) should be included in the LCF basis to accurately model the Cu K-edge XANES of the CdTe absorber layer in a CdCl2-treated Cu-doped CdTe solar cell?
2. Based on the sample conditions (middle of the CdTe absorber layer, position 5), estimate the phase fractions of the dominant Cu species.
3. Explain the physical and chemical reasoning for the formation of copper oxides (Cu2O) and CuCd-Cli complexes in the CdTe absorber layer, and discuss how their presence impacts the electrical activation efficiency of Cu doping.
Ground Truth
Material: Cu-doped CdTe solar cell (cross-section, CdTe layer position 5)
Measurement: Cu K-edge XANES, fluorescence mode, 50 nm spot size, beamline 26-ID-C at Advanced Photon Source
Fit method: Linear combination fitting (LCF)
Phase fractions: (±10%)
| Phase | Fraction |
|---|---|
| Cu2O | 0.45 |
| [CuCd-Cli]+2 | 0.2 |
| [CuCd-Cli]0 | 0.15 |
| CuO | 0.1 |
| CuCl | 0.1 |
Fit basis (paper's reference spectra):
- [CuCd-Cli]0
- Cu0
- [CuCd-Cli]+2
- CuS
- Cui,Cd
- CuO
- CuCl
- Cu2O
- CuCl2
Source evidence: Figure 4(f), CdTe5 bar
Key reasoning: In the middle of the CdTe absorber, the majority of Cu atoms exist as CuxO (primarily Cu2O) because Cu reacts with oxygen introduced during the CdCl2 treatment. The formation of CuxO is energetically more favorable than Cu-O point defects. Additionally, CuCd-Cli complexes (both neutral and +2 charge states) are present. These complexes act as double donors that compensate the hole concentration, which explains the low activation efficiency of Cu dopants in CdTe.
Reasoning source: Page 12, Results and discussion (CdTe absorber layer)
Scoring Rubric (total: 100 pts)
| Q | Type | Max | Question | Reference Answer | Scoring Criteria |
|---|---|---|---|---|---|
| q1 | identification | 20 | What candidate reference spectra (phases and defect structures) should be included in the LCF basis to accurately model the Cu K-edge XANES of the CdTe absorber layer in a CdCl2-treated Cu-doped CdTe solar cell? | The linear combination fitting (LCF) basis for the Cu K-edge XANES spectrum should include [CuCd-Cli]0, Cu0, [CuCd-Cli]+2, CuS, Cui,Cd, CuO, CuCl, Cu2O, and CuCl2. These specific reference phases and defect structures are expected in the middle of the CdTe absorber layer (position 5) because Cu reacts with oxygen and chlorine introduced during the cell's processing. Specifically, the formation of copper oxides like Cu2O and CuO is energetically more favorable than Cu-O point defects in this region. Furthermore, CuCd-Cli complexes (both neutral and +2 charge states) form as double donors within the CdTe matrix, which is a critical structural feature of this doped layer. | Full credit for identifying a mix of copper oxides (Cu2O, CuO), copper chlorides (CuCl, CuCl2), and specific Cu-Cl defect complexes (e.g., [CuCd-Cli]0 and [CuCd-Cli]+2). Partial credit if only standard phases are mentioned without the defect complexes. |
| q2 | quantification | 40 | Based on the sample conditions (middle of the CdTe absorber layer, position 5), estimate the phase fractions of the dominant Cu species. | In the middle of the CdTe absorber layer (position 5), the estimated phase fractions are 45% Cu2O, 20% [CuCd-Cli]+2, 15% [CuCd-Cli]0, 10% CuO, and 10% CuCl, with an uncertainty of 10%. These specific values result from the chemical environment at this depth, where the majority of Cu atoms preferentially react with oxygen introduced during the CdCl2 treatment to form CuxO (primarily Cu2O), as this is energetically more favorable than forming Cu-O point defects. The remaining Cu fraction is largely distributed into CuCd-Cli complexes and CuCl due to interactions with chlorine. The significant 35% combined presence of [CuCd-Cli] complexes directly reflects their formation as double donors that compensate the hole concentration in the CdTe layer. | Full credit for estimating Cu2O as the dominant phase (~40-50%), followed by [CuCd-Cli] complexes (~30-35% combined for +2 and 0 states), and minor contributions (~10% each) from CuO and CuCl. Deduct points proportionally for missing the dominant oxide phase or the defect complexes. |
| q3 | reasoning | 40 | Explain the physical and chemical reasoning for the formation of copper oxides (Cu2O) and CuCd-Cli complexes in the CdTe absorber layer, and discuss how their presence impacts the electrical activation efficiency of Cu doping. | In the middle of the CdTe absorber layer (position 5), copper oxides (primarily Cu2O) form because Cu readily reacts with oxygen introduced during the CdCl2 treatment of the solar cell. This oxidation occurs because the formation of bulk CuxO phases is energetically more favorable than the formation of isolated Cu-O point defects within the CdTe matrix. Concurrently, Cu interacts with chlorine to form CuCd-Cli complexes in both neutral and +2 charge states. The presence of these specific CuCd-Cli complexes severely limits the electrical activation efficiency of Cu doping because they act as double donors. Consequently, these donor complexes compensate the desired hole concentration in the CdTe layer, explaining the low activation efficiency of Cu dopants in the device. | Full credit requires mentioning that Cu reacts with oxygen and chlorine introduced during the CdCl2 treatment. The answer must state that CuxO formation is energetically favorable, and that the CuCd-Cli complexes act as double donors that compensate the hole concentration, thereby explaining the low activation efficiency of Cu dopants. |
Review
#499
CdTe solar cell (Glass/SnO2/CdS/CdTe/Cu/ZnTe/Mo)
Cu K-edge
▶
LLM Prompt
Sample Information
Material: CdTe solar cell (Glass/SnO2/CdS/CdTe/Cu/ZnTe/Mo)
Deposition Method: sputtering (CdS, ZnTe, Mo), closed space sublimation (CdTe), evaporation (Cu)
Substrate: soda-lime glass
Film Thickness Nm: 5000
Composition Variable: Depth position
Composition Value: CdTe layer (position 9)
Sample-Specific Conditions
- Depth position: CdTe layer (position 9)
- Cross-section position in CdTe layer near CdS interface
Measurement
We plan to measure the Cu K-edge XANES spectrum of this sample.
Questions
Based on all the information above:
1. What candidate reference spectra (phases and defect structures) should be included in the linear combination fitting basis to accurately model the Cu K-edge XANES of the CdTe absorber layer?
2. Based on the sample conditions (CdTe layer near the CdS interface, position 9), estimate the phase fractions of the dominant Cu species present.
3. Explain the physical and chemical reasons for the formation of the dominant Cu species (such as CuxO and Cu-Cl complexes) in the CdTe absorber layer, and how this relates to the device processing steps.
4. How do the specific Cu species identified in the CdTe absorber (e.g., CuxO and CuCd-Cli complexes) impact the electrical properties and Cu doping activation of the solar cell?
Ground Truth
Material: CdTe solar cell (Glass/SnO2/CdS/CdTe/Cu/ZnTe/Mo)
Measurement: Cu K-edge XANES in fluorescence mode using a 50 nm X-ray nanoprobe (beamline 26-ID-C at Advanced Photon Source)
Fit method: Linear combination fitting (LCF) using non-negative least squares
Phase fractions: (±15%)
| Phase | Fraction |
|---|---|
| Cu2O | 0.3 |
| [CuCd-Cli]0 | 0.25 |
| [CuCd-Cli]+2 | 0.2 |
| CuO | 0.1 |
| CuCl | 0.1 |
| CuCl2 | 0.05 |
Fit basis (paper's reference spectra):
- metallic Cu
- CuS
- Cu2S
- CuO
- Cu2O
- CuCl
- CuCl2
- Cui,neut
- Cu1-i,neut
- Cui,Cd
- Cui,Te
- CuCd
- CuTe
- CuCd-Tei
- (CuCd-Cli)0
- (CuCd-Cli)2+
- Cui in Sigma3(112)
- Cui in Sigma3(111)
- CuCd in Sigma3(112)
Source evidence: Figure 4(f) for CdTe9
Key reasoning: In the CdTe absorber layer, the majority of Cu atoms exist as CuxO phases (particularly Cu2O) and CuCd-Cli complexes. The formation of CuxO is energetically favorable and results from Cu reacting with oxygen introduced during the CdCl2 treatment. The CuCd-Cli complexes (in 0 and +2 charge states) act as inactive or compensating double donor defects, which explains the low activation ratio of Cu doping in chlorinated CdTe.
Reasoning source: Results and discussion - Cu local structures located in different layers (Page 12)
Scoring Rubric (total: 100 pts)
| Q | Type | Max | Question | Reference Answer | Scoring Criteria |
|---|---|---|---|---|---|
| q1 | identification | 20 | What candidate reference spectra (phases and defect structures) should be included in the linear combination fitting basis to accurately model the Cu K-edge XANES of the CdTe absorber layer? | The linear combination fitting basis for the Cu K-edge XANES should include metallic Cu, CuS, Cu2S, CuO, Cu2O, CuCl, CuCl2, and various defect structures such as Cui,neut, Cu1-i,neut, Cui,Cd, Cui,Te, CuCd, CuTe, CuCd-Tei, (CuCd-Cli)0, (CuCd-Cli)2+, and Cui/CuCd in Sigma3(111)/(112) grain boundaries. These specific phases and defect structures must be included because, within the CdTe absorber layer near the CdS interface, Cu interacts with oxygen and chlorine introduced during device processing. This specific chemical environment energetically favors the formation of CuxO phases and CuCd-Cli complexes, necessitating a comprehensive basis set of oxides, chlorides, and specific lattice defects to accurately model the local Cu coordination. | Full credit for identifying a mix of Cu-oxide phases (CuO, Cu2O), Cu-chloride phases (CuCl, CuCl2), and specific Cu point defects/complexes in CdTe (such as CuCd-Cli, Cui, CuCd). |
| q2 | quantification | 30 | Based on the sample conditions (CdTe layer near the CdS interface, position 9), estimate the phase fractions of the dominant Cu species present. | In the CdTe layer near the CdS interface (position 9), the estimated phase fractions are 30% Cu2O, 25% [CuCd-Cli]0, 20% [CuCd-Cli]+2, 10% CuO, 10% CuCl, and 5% CuCl2, with a fitting uncertainty of 15%. These specific values result from the chemical environment of the CdTe absorber layer, where Cu reacts strongly with oxygen and chlorine introduced during the CdCl2 treatment. The high combined fraction of CuxO (40%) arises because its formation is highly energetically favorable in this oxygen-exposed environment. Additionally, the significant presence of [CuCd-Cli] complexes (45% total) occurs because Cu readily forms these inactive or compensating double donor defects in chlorinated CdTe. | Full credit for estimating Cu2O at ~30%, (CuCd-Cli)0 at ~25%, (CuCd-Cli)2+ at ~20%, and minor contributions (~5-10% each) of CuO, CuCl, and CuCl2. Deduct points proportionally for missing major phases or significantly inaccurate percentages. |
| q3 | reasoning | 30 | Explain the physical and chemical reasons for the formation of the dominant Cu species (such as CuxO and Cu-Cl complexes) in the CdTe absorber layer, and how this relates to the device processing steps. | The dominant Cu species in the CdTe absorber layer are CuxO phases (especially Cu2O) and CuCd-Cli complexes. The formation of CuxO is highly energetically favorable and occurs because Cu reacts with oxygen that is introduced into the CdTe layer during the CdCl2 treatment step. Simultaneously, the chlorine from this treatment facilitates the formation of CuCd-Cli complexes in both 0 and +2 charge states. Therefore, the specific processing conditions of the CdTe solar cell directly dictate this chemical environment, driving the conversion of Cu into these specific oxide and chloride-complex phases. | Full credit for explaining that CuxO forms because it is energetically favorable for Cu to react with oxygen introduced during the CdCl2 treatment. Must also mention the formation of CuCd-Cli complexes due to the presence of Cl from the same treatment. |
| q4 | reasoning | 20 | How do the specific Cu species identified in the CdTe absorber (e.g., CuxO and CuCd-Cli complexes) impact the electrical properties and Cu doping activation of the solar cell? | The presence of CuxO phases and CuCd-Cli complexes significantly impacts the electrical properties of the CdTe solar cell by lowering the overall Cu doping activation ratio. Because the formation of CuxO is energetically favorable due to oxygen introduced during CdCl2 treatment, a large portion of Cu is tied up in these oxide phases rather than acting as shallow acceptors. Furthermore, the CuCd-Cli complexes (in 0 and +2 charge states) act as inactive or compensating double donor defects within the CdTe layer. Consequently, these specific chemical reactions driven by the sample's processing conditions prevent Cu from effectively doping the absorber layer, explaining the low activation ratio observed in chlorinated CdTe devices. | Full credit for stating that these species explain the low activation ratio of Cu dopants, specifically noting that (CuCd-Cli)0 is electrically inactive and (CuCd-Cli)2+ acts as a compensating double donor defect. |
Review
#500
CdTe solar cell (Glass/SnO2/CdS/CdTe/Cu/ZnTe/Mo)
Cu K-edge
▶
LLM Prompt
Sample Information
Material: CdTe solar cell (Glass/SnO2/CdS/CdTe/Cu/ZnTe/Mo)
Deposition Method: sputtering (CdS, ZnTe, Mo), closed space sublimation (CdTe), evaporation (Cu)
Substrate: soda-lime glass
Film Thickness Nm: 5000
Composition Variable: Depth position
Composition Value: CdS layer (position 1)
Sample-Specific Conditions
- Depth position: CdS layer (position 1)
- Cross-section position in CdS layer
Measurement
We plan to measure the Cu K-edge XANES spectrum of this sample.
Questions
Based on all the information above:
1. What candidate reference spectra (including phases and point defects) should be included in the linear combination fitting basis to model the Cu K-edge XANES spectrum of the CdS layer in this device architecture?
2. Based on the sample conditions (Cu diffused into the CdS layer of a CdTe solar cell), estimate the phase fractions of the Cu species present at this specific depth position.
3. Explain the physical and chemical reasoning for the formation of the dominant Cu species (point defects, oxides, and Sn-containing compounds) in the CdS layer, considering the device architecture and processing history.
Ground Truth
Material: CdTe solar cell (Glass/SnO2/CdS/CdTe/Cu/ZnTe/Mo)
Measurement: Cu K-edge XANES in fluorescence mode using a 50 nm nano-probe (beamline 26-ID-C, Advanced Photon Source)
Fit method: Linear combination fitting (LCF) using non-negative least square method
Phase fractions: (±15%)
| Phase | Fraction |
|---|---|
| Cui,S | 0.35 |
| CuO | 0.2 |
| Cui,Cd | 0.15 |
| CuSnO6 | 0.15 |
| Cd(CuO2)2 | 0.1 |
| CuCl2 | 0.05 |
Fit basis (paper's reference spectra):
- metallic Cu
- CuS
- Cu2S
- CuO
- Cu2O
- CuCl
- CuCl2
- CdCu2
- Cd5Cu2
- Cd(CuO2)2
- Cd(Cu3O4)2
- Cd2Cu(SO)2
- CdCu2(SO4)2
- CuSn
- Cu3Sn
- Cu5Sn4
- Cu6Sn5
- Cu10Sn3
- CuSnO6
- Cui,neut
- Cui,Cd
- Cui,S
- CuCd
Source evidence: Figure 4(j) and text on page 14
Key reasoning: The majority of Cu species in the CdS layer are Cu point defects in the CdS matrix (Cui,S and Cui,Cd), followed by CuO. There is no apparent evidence of CuxS and CuClx phases, except for a small percentage of CuCl2. The presence of CuSnO6 and Cd(CuO2)2 suggests that once Cu atoms diffuse rapidly through the CdTe grain boundaries to the CdS region, they react with the elements available there, including Sn from the nearby SnO2 layer and O introduced during processing.
Reasoning source: Page 14, 'Cu local structures located in different layers' section
Scoring Rubric (total: 100 pts)
| Q | Type | Max | Question | Reference Answer | Scoring Criteria |
|---|---|---|---|---|---|
| q1 | identification | 20 | What candidate reference spectra (including phases and point defects) should be included in the linear combination fitting basis to model the Cu K-edge XANES spectrum of the CdS layer in this device architecture? | The linear combination fitting basis should include metallic Cu, copper sulfides (CuS, Cu2S), copper oxides (CuO, Cu2O), copper chlorides (CuCl, CuCl2), Cd-Cu compounds (CdCu2, Cd5Cu2, Cd(CuO2)2, Cd(Cu3O4)2, Cd2Cu(SO)2, CdCu2(SO4)2), Cu-Sn compounds (CuSn, Cu3Sn, Cu5Sn4, Cu6Sn5, Cu10Sn3, CuSnO6), and Cu point defects (Cui,neut, Cui,Cd, Cui,S, CuCd). These specific references are required because the sample is a Glass/SnO2/CdS/CdTe/Cu/ZnTe/Mo solar cell where Cu is evaporated at the back contact and diffuses through the CdTe layer into the front CdS region. Consequently, the basis must account for Cu reacting with the local CdS matrix (forming point defects or sulfides), the adjacent SnO2 layer (forming Sn-containing compounds), and oxygen introduced during processing (forming oxides). | Full credit for identifying a comprehensive list of plausible Cu-related phases for the CdS layer, including metallic Cu, copper sulfides, copper oxides, copper chlorides, Cu-Sn phases (due to the adjacent SnO2 layer), and Cu point defects in the CdS matrix. |
| q2 | quantification | 40 | Based on the sample conditions (Cu diffused into the CdS layer of a CdTe solar cell), estimate the phase fractions of the Cu species present at this specific depth position. | At the CdS layer depth position, the estimated Cu phase fractions are 35% Cui,S, 20% CuO, 15% Cui,Cd, 15% CuSnO6, 10% Cd(CuO2)2, and 5% CuCl2, with a fitting uncertainty of 15%. These specific values result from the rapid diffusion of Cu atoms from the back contact through the CdTe grain boundaries into the CdS region of the device architecture. Once in the CdS layer, the majority of Cu incorporates directly into the local matrix as point defects (Cui,S and Cui,Cd) rather than forming CuxS phases. The remaining fractions are driven by reactions with available elements in this specific region, forming oxides (CuO, Cd(CuO2)2) from processing oxygen and CuSnO6 due to proximity to the adjacent SnO2 layer. | Full credit for estimating fractions close to the ground truth: ~35% Cui,S, ~20% CuO, ~15% Cui,Cd, ~15% CuSnO6, ~10% Cd(CuO2)2, and ~5% CuCl2. Partial credit for correctly identifying that Cu point defects and CuO dominate the composition. |
| q3 | reasoning | 40 | Explain the physical and chemical reasoning for the formation of the dominant Cu species (point defects, oxides, and Sn-containing compounds) in the CdS layer, considering the device architecture and processing history. | The formation of dominant Cu species in the CdS layer is driven by the rapid diffusion of evaporated Cu from the back contact through the CdTe grain boundaries into the front-side CdS region. Because the local matrix at this depth is CdS, the majority of the diffused Cu incorporates as point defects, specifically Cui,S and Cui,Cd, rather than forming secondary CuxS phases. Furthermore, the device architecture includes an adjacent SnO2 layer, which provides Sn that reacts with the arriving Cu to form CuSnO6. Finally, oxygen introduced during the processing history reacts with the diffused Cu and local Cd to form significant oxide fractions, including CuO and Cd(CuO2)2. | Full credit for explaining that Cu atoms diffuse rapidly to the CdS region and react with available elements there, forming point defects in the CdS matrix, reacting with oxygen introduced during processing to form CuO/Cd(CuO2)2, and reacting with Sn from the adjacent SnO2 layer to form CuSnO6. |
Review
YCrWO6: Polar and Magnetic Oxide with CaTa2O6-Related Structure
BNL-NSLS-II-8-ID
Pure Phase
Sun Woo Kim et al.
DOI: 10.1021/acs.chemmater.7b04941
3 scenarios
▶
#501
YCrWO6
Cr K-edge
▶
LLM Prompt
Sample Information
Material: YCrWO6
Crystal Structure: Orthorhombic Pna21
Oxidation State: Cr3+
Sample Form: powder
Measurement Mode: transmission and fluorescence
- New polar and magnetic oxide
Measurement
We plan to measure the Cr K-edge XANES spectrum of this sample.
Questions
Based on all the information above:
1. Describe the expected pre-edge features in the Cr K-edge XANES of YCrWO6, including their structure, separation, and the electronic transitions responsible for them.
2. How can the main edge and pre-edge of the Cr K-edge XANES spectrum be used to confirm the oxidation state of Cr in YCrWO6?
3. What reference spectra would be appropriate to use for qualitative comparison to determine the Cr oxidation state in this sample?
Ground Truth
Compound: YCrWO6
Oxidation state: Cr3+
Measurement: Cr K-edge, transmission and fluorescence mode, beamline 10-BM (MRCAT) at APS
Edge position: not reported
Spectral shape: Main edge features are dominated by 1s to 4p transitions, riding on a step-feature continuum onset. The main edge crosses the centrum of the edge-rises of the Cr3+ standard spectra. Pre-edge manifests a bimodal a-b structure with ~4 eV separation.
Labeled peaks:
| Label | Energy (eV) | Intensity | Origin | Source |
|---|---|---|---|---|
| a | not reported | weak | quadrupole allowed 1s/3d or dipole allowed 1s/3d-p-hybridized transitions shifted to the pre-edge region by the 1s-hole/d-electron Coulomb interaction | paper_data |
| b | not reported | weak | quadrupole allowed 1s/3d or dipole allowed 1s/3d-p-hybridized transitions shifted to the pre-edge region by the 1s-hole/d-electron Coulomb interaction | paper_data |
Distinguishing features: Bimodal a-b structure in the pre-edge with ~4 eV separation, typical of Cr3+ standards. Onset energy of the a-feature occurs at a low energy typical of a Cr3+ material.
Key reasoning: The main edge of YCrWO6 crosses the centrum of the edge-rises of the Cr3+ standard spectra (LaCrO3, Cr2O3), indicating it is basically a Cr3+ compound. The pre-edge manifests a bimodal a-b structure with ~4 eV separation, typical of Cr3+ standards, and the onset energy of the a-feature occurs at a low energy typical of a Cr3+ material.
Reasoning source: Cr-K edge XANES section, pages 8-9
Scoring Rubric (total: 100 pts)
| Q | Type | Max | Question | Reference Answer | Scoring Criteria |
|---|---|---|---|---|---|
| q1 | spectral | 40 | Describe the expected pre-edge features in the Cr K-edge XANES of YCrWO6, including their structure, separation, and the electronic transitions responsible for them. | The expected pre-edge of the Cr K-edge XANES spectrum for YCrWO6 exhibits a bimodal a-b structure with a separation of approximately 4 eV. These weak pre-edge features originate from quadrupole-allowed 1s to 3d transitions, or dipole-allowed 1s to 3d-p-hybridized transitions, which are shifted to the pre-edge region by the 1s-hole/d-electron Coulomb interaction. These specific spectral features arise because the sample is formulated as a Cr3+ compound, and this bimodal structure with a low-energy onset for the a-feature is highly characteristic of the Cr3+ oxidation state. Consequently, the observed pre-edge directly reflects the electronic configuration of the Cr3+ ions within the orthorhombic Pna21 crystal structure of this YCrWO6 powder. | Full points for mentioning the bimodal a-b structure, the ~4 eV separation, and that they originate from quadrupole allowed 1s/3d or dipole allowed 1s/3d-p-hybridized transitions. |
| q2 | reasoning | 40 | How can the main edge and pre-edge of the Cr K-edge XANES spectrum be used to confirm the oxidation state of Cr in YCrWO6? | The oxidation state of Cr in YCrWO6 can be confirmed by analyzing the positions and shapes of both the main edge and the pre-edge features relative to known standards. Specifically, the main edge of YCrWO6, which is dominated by 1s to 4p transitions, will cross the centrum of the edge-rises of known Cr3+ standard spectra. Additionally, the pre-edge will manifest a bimodal a-b structure with a ~4 eV separation, where the onset energy of the a-feature occurs at a low energy typical of Cr3+ materials. These spectral characteristics are expected because the sample is synthesized as a Cr3+ compound, and its specific electronic structure dictates these absorption thresholds and pre-edge transition energies. Therefore, qualitative comparison of these features confirms the Cr3+ state in this new polar and magnetic oxide. | Full points for explaining that the main edge crosses the centrum of the edge-rises of Cr3+ standards, and the pre-edge has a bimodal structure and onset energy typical of Cr3+ materials. |
| q3 | identification | 20 | What reference spectra would be appropriate to use for qualitative comparison to determine the Cr oxidation state in this sample? | Appropriate reference spectra for qualitative comparison include LaCrO3 (Cr3+), Cr2O3 (Cr3+), CrO2 (Cr4+), and K2Cr2O7 (Cr6+). These specific standards are chosen because they cover a range of known chromium oxidation states from 3+ to 6+, allowing for a clear determination of the sample's edge position relative to these benchmarks. Given that YCrWO6 is formulated as a Cr3+ compound, its main edge is expected to align with the centrum of the edge-rises of the Cr3+ standards (LaCrO3 and Cr2O3). This comparison is necessary to confirm that the chromium in this orthorhombic Pna21 oxide powder maintains the expected Cr3+ oxidation state rather than oxidizing to higher valence states like Cr4+ or Cr6+. | Full points for listing Cr3+ (e.g., LaCrO3, Cr2O3), Cr4+ (e.g., CrO2), and Cr6+ (e.g., K2Cr2O7) standards. |
Review
#502
K2Cr2O7
Cr K-edge
▶
LLM Prompt
Sample Information
Material: K2Cr2O7
Oxidation State: Cr6+
Measurement Mode: transmission and fluorescence
- Cr6+ standard
Measurement
We plan to measure the Cr K-edge XANES spectrum of this sample.
Questions
Based on all the information above:
1. Describe the expected pre-edge feature for the K2Cr2O7 standard and explain its physical origin as discussed in the paper.
2. How does the main edge position of K2Cr2O7 compare to lower valence Cr standards (e.g., Cr3+, Cr4+) in the XANES spectra?
3. What distinguishes the local coordination environment of Cr in K2Cr2O7 from the other Cr standards discussed in the paper, and what is the spectral consequence of this difference?
Ground Truth
Compound: K2Cr2O7
Oxidation state: Cr6+
Measurement: Cr K-edge XANES, APS beamline 10-BM (MRCAT) or NSLS beamline X-19A
Edge position: shifted to higher energy than Cr3+ and Cr4+ standards
Spectral shape: Main edge shifted to higher energy relative to lower valence standards. Exhibits an intense pre-edge feature.
Labeled peaks:
| Label | Energy (eV) | Intensity | Origin | Source |
|---|---|---|---|---|
| pre-edge | ~5.993 keV (estimated from Figure 3a) | intense | hybridization-induced pre-edge feature caused by tetrahedral coordination | paper_data |
Distinguishing features: Intense hybridization-induced pre-edge feature due to tetrahedral coordination, unlike the octahedral coordination in the other Cr standards.
Key reasoning: K2Cr2O7 is used as a Cr6+ standard. Its Cr-O coordination is tetrahedral, which causes an intense hybridization-induced pre-edge feature. The main edge is shifted to higher energy relative to lower valence standards (Cr3+, Cr4+).
Reasoning source: Figure 3 caption (page 25) and text on page 8
Scoring Rubric (total: 100 pts)
| Q | Type | Max | Question | Reference Answer | Scoring Criteria |
|---|---|---|---|---|---|
| q1 | spectral | 40 | Describe the expected pre-edge feature for the K2Cr2O7 standard and explain its physical origin as discussed in the paper. | The expected pre-edge feature for the K2Cr2O7 standard is highly intense and is located at approximately 5.993 keV. This feature arises because the sample is a pure K2Cr2O7 material utilized as a Cr6+ standard, which inherently possesses a tetrahedral Cr-O coordination environment. This specific tetrahedral structural property allows for strong orbital mixing, which produces the intense hybridization-induced pre-edge feature observed in the spectrum. Therefore, the distinct composition and resulting geometry of the sample directly dictate this prominent spectral signature. | The answer must state that K2Cr2O7 exhibits an intense pre-edge feature and attribute its origin to hybridization induced by the tetrahedral coordination of Cr. |
| q2 | spectral | 30 | How does the main edge position of K2Cr2O7 compare to lower valence Cr standards (e.g., Cr3+, Cr4+) in the XANES spectra? | In the XANES spectra, the main edge position of K2Cr2O7 is shifted to a higher energy relative to lower valence standards such as Cr3+ and Cr4+. This spectral shift occurs because the sample is specifically composed of K2Cr2O7 to serve as a pure Cr6+ reference standard. The highly oxidized Cr6+ state of the sample inherently alters the electronic structure compared to lower valence states, requiring higher energy for the main absorption transition. Consequently, the specific Cr6+ oxidation state of the sample directly causes the main edge to appear at a higher energy than the Cr3+ and Cr4+ standards. | The answer must indicate that the main edge of K2Cr2O7 is shifted to higher energy relative to the lower valence standards. |
| q3 | reasoning | 30 | What distinguishes the local coordination environment of Cr in K2Cr2O7 from the other Cr standards discussed in the paper, and what is the spectral consequence of this difference? | The local coordination environment of Cr in the K2Cr2O7 sample is tetrahedral, which distinguishes it from the octahedral coordination found in the other Cr standards. Because this sample is formulated as K2Cr2O7 to serve as a Cr6+ standard, its specific chemical composition dictates this tetrahedral Cr-O geometry. The primary spectral consequence of this structural difference is the presence of an intense, hybridization-induced pre-edge feature at ~5.993 keV. This intense peak arises directly from the tetrahedral coordination of the Cr6+ sample, which enables orbital hybridization that does not occur in the octahedral environments of the other standards. | The answer must identify that Cr in K2Cr2O7 is tetrahedrally coordinated (whereas the others are octahedral) and that this tetrahedral coordination causes the intense pre-edge feature. |
Review
#503
Sr2MnWO6
W L3-edge
▶
LLM Prompt
Sample Information
Material: Sr2MnWO6
Crystal Structure: Perovskite
Oxidation State: W6+
Measurement Mode: transmission and fluorescence
- W6+ standard, double perovskite
Measurement
We plan to measure the W L3-edge XANES spectrum of this sample.
Questions
Based on all the information above:
1. Describe the expected shape and structure of the white line feature for Sr2MnWO6 at the W L3-edge.
2. What specific electronic final states are responsible for the A and B features within the white line of the Sr2MnWO6 W L3-edge spectrum?
3. What does the chemical shift of the white line centrum in the W L3-edge spectrum of Sr2MnWO6 indicate about its oxidation state?
Ground Truth
Compound: Sr2MnWO6
Oxidation state: W6+
Measurement: W L3-edge XANES, transmission and fluorescence mode, APS beamline 10-BM and NSLS-II ISS 8-ID
Edge position: not reported
Spectral shape: Intense white line (WL) feature with unresolved A/B splitting.
Labeled peaks:
| Label | Energy (eV) | Intensity | Origin | Source |
|---|---|---|---|---|
| A | not reported | strong | t2g-hole final state (t2g-related) | paper_data |
| B | not reported | strong | eg-hole final state (eg-related) | paper_data |
Distinguishing features: Unresolved A (t2g-related)/B(eg-related) octahedral-ligand-field splitting typical of perovskite-based compounds, and a chemical shift typical of a W6+ compound.
Key reasoning: The Sr2MnWO6 standard spectrum illustrates the unresolved A (t2g-related)/B(eg-related) octahedral-ligand-field splitting in the 5d final states typical of such perovskite-based compounds. The centrum of the Sr2MnWO6 standard WL feature also manifests a chemical shift typical of a W6+ compound.
Reasoning source: Page 9-10, W-L3,2,1 edge XANES section
Scoring Rubric (total: 100 pts)
| Q | Type | Max | Question | Reference Answer | Scoring Criteria |
|---|---|---|---|---|---|
| q1 | spectral | 30 | Describe the expected shape and structure of the white line feature for Sr2MnWO6 at the W L3-edge. | The W L3-edge XANES spectrum for Sr2MnWO6 is expected to exhibit an intense white line (WL) feature characterized by an unresolved A/B splitting. This specific spectral shape arises because Sr2MnWO6 is a double perovskite material containing W6+. In such perovskite-based compounds, the octahedral ligand field splits the 5d final states into t2g (feature A) and eg (feature B) levels. However, under these structural conditions, this octahedral-ligand-field splitting remains unresolved in the observed spectrum, resulting in the merged, intense white line shape. | Full points for mentioning an intense white line with unresolved A/B splitting, which is typical of perovskite-based compounds. |
| q2 | reasoning | 40 | What specific electronic final states are responsible for the A and B features within the white line of the Sr2MnWO6 W L3-edge spectrum? | Within the white line of the Sr2MnWO6 spectrum, feature A originates from the t2g-hole final state, while feature B originates from the eg-hole final state. These specific electronic final states arise due to the octahedral coordination of the W6+ ions within the double perovskite crystal structure of the sample. The octahedral ligand field splits the tungsten 5d orbitals into lower-energy t2g and higher-energy eg states. Consequently, transitions to these split 5d final states generate the A (t2g-related) and B (eg-related) features, even though this splitting appears unresolved in the measured spectrum of this specific perovskite compound. | Full points for correctly identifying that feature A is related to the t2g-hole final state and feature B is related to the eg-hole final state, arising from octahedral ligand-field splitting. |
| q3 | identification | 30 | What does the chemical shift of the white line centrum in the W L3-edge spectrum of Sr2MnWO6 indicate about its oxidation state? | The chemical shift of the white line centrum in the W L3-edge spectrum indicates that the tungsten in Sr2MnWO6 is in a W6+ oxidation state. This occurs because the sample is a Sr2MnWO6 double perovskite standard specifically synthesized with W6+, and its electronic structure dictates the energy required for core-level transitions. The centrum of the white line feature manifests a chemical shift that is perfectly typical of a W6+ compound. Therefore, the observed spectral position directly reflects the highly oxidized W6+ state present in this perovskite material. | Full points for stating that the chemical shift of the white line centrum is typical of a W6+ compound. |
Review
Dynamic Ferrimagnetic Order in a Highly Distorted Double Perovskite Y2CoRuO6
BNL-NSLS-II-8-ID
Pure Phase
Zheng Deng et al.
DOI: 10.1021/acs.chemmater.8b02728
1 scenario
▶
#504
Y2CoRuO6
Co, Ru K, L2,3
▶
LLM Prompt
Sample Information
Material: Y2CoRuO6
Crystal Structure: monoclinic P21/n
Oxidation State: 2+
Sample Form: powder
Measurement Mode: fluorescence and total electron yield
- Y2CoRuO6 double perovskite
Measurement
We plan to measure the Co, Ru K, L2,3 XANES spectrum of this sample.
Questions
Based on all the information above:
1. Based on the provided sample information for the Y2CoRuO6 double perovskite, what is the expected oxidation state and d-electron configuration for Co, and what role did XANES play in this determination?
2. Which specific Co X-ray absorption edges were measured to investigate the electronic structure of this sample?
Ground Truth
Compound: Y2CoRuO6
Oxidation state: 2+
Measurement: Co K-edge and L2,3-edges in fluorescence and total electron yield modes
Edge position: not reported
Spectral shape: not reported
Distinguishing features: not reported
Key reasoning: The formal oxidation state of the B-site cations was determined to be Co2+ (d7) based on Bond Valence Sum (BVS) calculations yielding a value of 2.21 for Co. These cation oxidation states were explicitly corroborated by the X-ray absorption near edge spectroscopy (XANES) studies.
Reasoning source: Page 9, Section: Static magnetism and magnetic structure
Scoring Rubric (total: 100 pts)
| Q | Type | Max | Question | Reference Answer | Scoring Criteria |
|---|---|---|---|---|---|
| q1 | reasoning | 57 | Based on the provided sample information for the Y2CoRuO6 double perovskite, what is the expected oxidation state and d-electron configuration for Co, and what role did XANES play in this determination? | The expected oxidation state for Co in the Y2CoRuO6 double perovskite is 2+, corresponding to a d7 electron configuration. This specific oxidation state is expected because Bond Valence Sum (BVS) calculations for the B-site cations in this monoclinic P21/n crystal structure yielded a value of 2.21 for Co. The XANES measurements were utilized to explicitly corroborate these calculated cation oxidation states, confirming the powder sample consists entirely of the Y2CoRuO6 phase (1.0 fraction) with Co stabilized in the 2+ state. | Full credit if the answer correctly identifies the oxidation state as Co2+ with a d7 electronic configuration, and notes that XANES was used to corroborate this state. |
| q2 | identification | 43 | Which specific Co X-ray absorption edges were measured to investigate the electronic structure of this sample? | The Co K-edge and L2,3-edges were measured using fluorescence and total electron yield modes. These specific edges were probed to explicitly corroborate the formal oxidation state of Co2+ (d7) in the Y2CoRuO6 double perovskite powder. Because Bond Valence Sum calculations for the monoclinic P21/n structure predicted a valence of 2.21 for Co, measuring these X-ray absorption edges provides direct experimental verification of this 2+ state within the pure (1.0 fraction) Y2CoRuO6 phase. | Full credit if the answer identifies both the Co K-edge and Co L2,3-edges. |
Review
Identification of Surface Structures in Pt3Cr Intermetallic Nanocatalysts
APS
Catalyst
Nicole J. LiBretto et al.
DOI: 10.1021/acs.chemmater.8b04774
7 scenarios
▶
#505
Pt-Cr/SiO2
Pt L3
▶
LLM Prompt
Sample Information
Material: Pt-Cr/SiO2
Support: SiO2
Reaction Conditions: measured at room temperature in He after reduction
Sample-Specific Conditions
- Reduction temperature: 550°C
- 2 wt% Pt, 1 wt% Cr on SiO2 reduced at 550°C
Measurement
We plan to measure the Pt L3 XANES spectrum of this sample.
Questions
Based on all the information above:
1. What candidate reference spectra (basis functions) are required to model the Pt L3 XANES spectrum of this sample using Linear Combination Fitting?
2. Estimate the phase fractions of the Pt-containing species in this catalyst after reduction at 550°C.
Ground Truth
Material: 2Pt1Cr/SiO2
Measurement: Pt L3 edge in situ transmission mode at 10-BM-B beamline, APS
Fit method: Linear combination fitting of XANES or EXAFS coordination number ratios
Phase fractions: (±10%)
| Phase | Fraction |
|---|---|
| Pt3Cr | 0.37 |
| Pt | 0.63 |
Fit basis (paper's reference spectra):
- monometallic Pt
- Pt3Cr (2Pt3Cr/SiO2 reduced at 800°C)
Source evidence: Table 8, page 31; Page 29 text
Key reasoning: The reduction of PtOx is more kinetically favorable than Cr2O3, so monometallic Pt nanoparticles form initially. These Pt nanoparticles activate H2, which catalytically reduces nearby Cr2O3 at lower temperatures, allowing metallic Cr to incorporate into the Pt nanoparticles to form a Pt3Cr alloy. However, for the 1 wt% Cr loading (2Pt1Cr/SiO2), even though there is a molar excess of Cr overall, there is an insufficient amount of reducible CrOx in close proximity to the Pt nanoparticles. Consequently, a complete alloy cannot form, resulting in a mixed phase of 37% Pt3Cr and 63% monometallic Pt after reduction at 550°C.
Reasoning source: DISCUSSION section, pages 27-29
Scoring Rubric (total: 100 pts)
| Q | Type | Max | Question | Reference Answer | Scoring Criteria |
|---|---|---|---|---|---|
| q1 | identification | 33 | What candidate reference spectra (basis functions) are required to model the Pt L3 XANES spectrum of this sample using Linear Combination Fitting? | To model the Pt L3 XANES spectrum of this sample using linear combination fitting, the required reference spectra are monometallic Pt and a Pt3Cr alloy (specifically, 2Pt3Cr/SiO2 reduced at 800°C). These specific phases are expected because, during the 550°C reduction, PtOx is more kinetically favorable to reduce than Cr2O3, initially forming monometallic Pt nanoparticles. These Pt nanoparticles activate H2 to catalytically reduce nearby Cr2O3, allowing metallic Cr to incorporate and form the Pt3Cr alloy. However, for the 2 wt% Pt and 1 wt% Cr loading, there is an insufficient amount of reducible CrOx in close proximity to the Pt nanoparticles to form a complete alloy, necessitating both monometallic Pt and Pt3Cr basis functions to model the resulting mixed phase. | Full points for identifying monometallic Pt and a fully alloyed Pt3Cr reference (e.g., a high-temperature reduced Pt3Cr sample). |
| q2 | quantification | 67 | Estimate the phase fractions of the Pt-containing species in this catalyst after reduction at 550°C. | After reduction at 550°C, the estimated phase fractions for the 2 wt% Pt, 1 wt% Cr on SiO2 catalyst are 37% Pt3Cr and 63% monometallic Pt, with an uncertainty of 10%. These specific values result from the reduction kinetics where PtOx reduces first to form Pt nanoparticles, which then activate H2 to reduce nearby Cr2O3 and form a Pt3Cr alloy. Even though there is an overall molar excess of Cr in this 1 wt% Cr sample, there is an insufficient amount of reducible CrOx in close proximity to the Pt nanoparticles. As a result, the alloying process is spatially limited and cannot proceed to completion at 550°C, yielding the final mixed fraction of 0.37 Pt3Cr and 0.63 monometallic Pt. | Full points for estimating ~37% Pt3Cr and ~63% metallic Pt. Deduct points proportionally if the estimates fall outside the 10% uncertainty window. |
Review
#506
Pt-Cr/SiO2
Pt L3
▶
LLM Prompt
Sample Information
Material: Pt-Cr/SiO2
Support: SiO2
Reaction Conditions: measured at room temperature in He after reduction
Sample-Specific Conditions
- Reduction temperature: 700°C
- 2 wt% Pt, 1 wt% Cr on SiO2 reduced at 700°C
Measurement
We plan to measure the Pt L3 XANES spectrum of this sample.
Questions
Based on all the information above:
1. What candidate reference spectra are needed to model the Pt L3 XANES of this sample using linear combination fitting?
2. Estimate the phase fractions of the components in this sample after reduction at 700°C.
3. Explain the physical reasoning for why a complete intermetallic alloy is not formed for this specific catalyst composition (2 wt% Pt, 1 wt% Cr) even at a high reduction temperature of 700°C.
Ground Truth
Material: 2Pt1Cr/SiO2
Measurement: Pt L3 edge in situ transmission mode at 10-BM-B beamline, APS
Fit method: Linear combination fitting of XANES or EXAFS coordination number ratios
Phase fractions: (±10%)
| Phase | Fraction |
|---|---|
| Pt3Cr | 0.47 |
| Pt | 0.53 |
Fit basis (paper's reference spectra):
- monometallic Pt
- Pt3Cr (2Pt3Cr/SiO2 reduced at 800°C)
Source evidence: Table 8, page 31
Key reasoning: With increasing reduction temperature, more metallic Cr is incorporated into the Pt nanoparticles. However, for the 1 wt% Cr loading (2Pt1Cr/SiO2), there is an insufficient amount of reducible CrOx in close proximity to the Pt nanoparticles to form a complete Pt3Cr alloy. Thus, at 700°C, the nanoparticles consist of a mixture of a Pt3Cr alloy phase and monometallic Pt.
Reasoning source: Discussion section, pages 28-29
Scoring Rubric (total: 100 pts)
| Q | Type | Max | Question | Reference Answer | Scoring Criteria |
|---|---|---|---|---|---|
| q1 | identification | 30 | What candidate reference spectra are needed to model the Pt L3 XANES of this sample using linear combination fitting? | To model the Pt L3 XANES of this sample, the required reference spectra are monometallic Pt and a Pt3Cr alloy (specifically, 2Pt3Cr/SiO2 reduced at 800°C). These specific phases are expected because reducing the 2 wt% Pt, 1 wt% Cr on SiO2 sample at 700°C drives the incorporation of metallic Cr into the Pt nanoparticles. However, due to the relatively low 1 wt% Cr loading, there is an insufficient amount of reducible CrOx in close proximity to the Pt to form a complete Pt3Cr alloy. Consequently, the sample exists as a mixture of the newly formed Pt3Cr alloy phase and the remaining unalloyed monometallic Pt. | Full points for identifying monometallic Pt and a fully alloyed Pt3Cr reference (or equivalent intermetallic phase). |
| q2 | quantification | 35 | Estimate the phase fractions of the components in this sample after reduction at 700°C. | After reduction at 700°C, the estimated phase fractions for this sample are 47% Pt3Cr alloy and 53% monometallic Pt, with an uncertainty of 10%. These specific values result directly from the sample's composition of 2 wt% Pt and 1 wt% Cr on SiO2. While the high reduction temperature of 700°C promotes the incorporation of metallic Cr into the Pt nanoparticles, the 1 wt% Cr loading provides an insufficient amount of reducible CrOx in close proximity to the Pt. Therefore, a complete alloy cannot form, leaving roughly half of the material as a Pt3Cr alloy and the remainder as unalloyed monometallic Pt. | Full points for estimating approximately 47% Pt3Cr and 53% metallic Pt. Partial credit for identifying a mixed phase with roughly equal proportions. |
| q3 | reasoning | 35 | Explain the physical reasoning for why a complete intermetallic alloy is not formed for this specific catalyst composition (2 wt% Pt, 1 wt% Cr) even at a high reduction temperature of 700°C. | A complete intermetallic alloy is not formed at 700°C because of the specific 1 wt% Cr loading in the 2Pt1Cr/SiO2 catalyst. Generally, increasing the reduction temperature drives more metallic Cr to incorporate into the Pt nanoparticles. However, at this specific composition, there is an insufficient amount of reducible CrOx located in close proximity to the Pt nanoparticles. Without enough nearby Cr to fully react with the 2 wt% Pt, the alloying process is physically limited. As a result, the nanoparticles can only partially alloy, yielding a mixture of 47% Pt3Cr and 53% monometallic Pt rather than a complete Pt3Cr phase. | Full points for explaining that while higher temperatures drive Cr incorporation, there is an insufficient amount of reducible CrOx located near the Pt nanoparticles to form a complete Pt3Cr alloy, leaving a significant fraction of monometallic Pt. |
Review
#507
Pt-Cr/SiO2
Pt L3
▶
LLM Prompt
Sample Information
Material: Pt-Cr/SiO2
Support: SiO2
Reaction Conditions: measured at room temperature in He after reduction
Sample-Specific Conditions
- Reduction temperature: 800°C
- 2 wt% Pt, 1 wt% Cr on SiO2 reduced at 800°C
Measurement
We plan to measure the Pt L3 XANES spectrum of this sample.
Questions
Based on all the information above:
1. What reference spectra or basis functions are appropriate for modeling the Pt L3 XANES of this sample to determine its phase composition?
2. Based on the sample conditions (1 wt% Cr loading, reduced at 800°C), estimate the phase fractions of the resulting nanoparticles.
3. Why does this sample (2Pt1Cr/SiO2) not form a fully alloyed Pt3Cr nanoparticle even at the high reduction temperature of 800°C?
Ground Truth
Material: 2Pt1Cr/SiO2
Measurement: Pt L3 edge in situ transmission mode at 10-BM-B beamline, APS
Fit method: Linear combination fitting of XANES or EXAFS coordination number ratios
Phase fractions: (±10%)
| Phase | Fraction |
|---|---|
| Pt3Cr | 0.51 |
| Pt | 0.49 |
Fit basis (paper's reference spectra):
- monometallic Pt
- Pt3Cr (2Pt3Cr/SiO2 reduced at 800°C)
Source evidence: Table 8, Page 31; Table 2, Page 14; Page 29 text
Key reasoning: At 800°C, the 2Pt1Cr/SiO2 catalyst forms a two-phase mixture of monometallic Pt and an intermetallic Pt3Cr alloy. Despite the high reduction temperature, a full Pt3Cr alloy does not form (reaching only 51% Pt3Cr) because there is an insufficient amount of reducible CrOx in close proximity to the Pt nanoparticles. The incorporation of metallic Cr into the Pt nanoparticles to form Pt3Cr causes the Pt L3 XANES edge to shift to a higher energy (11.5644 keV) compared to monometallic Pt (11.5640 keV). This energy shift is proportional to the fraction of the Pt3Cr phase present.
Reasoning source: Pages 28-29 (Discussion) and Table 8 (Page 31)
Scoring Rubric (total: 101 pts)
| Q | Type | Max | Question | Reference Answer | Scoring Criteria |
|---|---|---|---|---|---|
| q1 | identification | 25 | What reference spectra or basis functions are appropriate for modeling the Pt L3 XANES of this sample to determine its phase composition? | The appropriate reference spectra for modeling the Pt L3 XANES of this sample are monometallic Pt and an intermetallic Pt3Cr alloy (specifically, a 2Pt3Cr/SiO2 reference reduced at 800°C). These specific basis functions are required because reducing the 2 wt% Pt, 1 wt% Cr on SiO2 sample at 800°C results in a two-phase mixture rather than a single uniform alloy. Despite the high reduction temperature, a complete Pt3Cr alloy does not form because there is an insufficient amount of reducible CrOx in close proximity to the Pt nanoparticles. Consequently, the sample retains unalloyed monometallic Pt alongside the Pt3Cr phase, and both references are needed to accurately fit the proportional shift in the XANES edge energy. | Full points for identifying monometallic Pt and a fully alloyed Pt3Cr reference as the necessary basis functions. |
| q2 | quantification | 38 | Based on the sample conditions (1 wt% Cr loading, reduced at 800°C), estimate the phase fractions of the resulting nanoparticles. | The estimated phase fractions for the 2Pt1Cr/SiO2 sample reduced at 800°C are 51% Pt3Cr alloy and 49% monometallic Pt, with an uncertainty of 10%. These specific values result from the limited availability of reducible CrOx in close proximity to the Pt nanoparticles during the high-temperature reduction process. Because the 1 wt% Cr loading does not provide enough accessible chromium to fully alloy with the 2 wt% Pt, the intermetallic transformation arrests at approximately half conversion. This partial alloying dictates the final composition and is reflected in the Pt L3 XANES spectrum, where the edge energy shifts proportionally to the 51% fraction of the Pt3Cr phase. | Full points for estimating approximately 51% Pt3Cr and 49% metallic Pt. Partial credit for recognizing it is a mixed phase with roughly equal proportions. |
| q3 | reasoning | 38 | Why does this sample (2Pt1Cr/SiO2) not form a fully alloyed Pt3Cr nanoparticle even at the high reduction temperature of 800°C? | Even at the high reduction temperature of 800°C, the 2Pt1Cr/SiO2 sample does not form a fully alloyed Pt3Cr nanoparticle because there is an insufficient amount of reducible CrOx in close proximity to the Pt nanoparticles. The specific sample composition of 2 wt% Pt and only 1 wt% Cr limits the local availability of chromium needed to complete the intermetallic transformation. As a result of this spatial and compositional limitation, the alloying process is restricted, yielding a two-phase mixture consisting of 51% Pt3Cr and 49% monometallic Pt. This incomplete incorporation of metallic Cr into the Pt nanoparticles is directly observable in the Pt L3 XANES spectrum, where the edge energy shifts to 11.5644 keV proportionally to the limited Pt3Cr fraction formed. | Full points for explaining that there is an insufficient amount of reducible CrOx in close proximity to the Pt nanoparticles to form a complete alloy. |
Review
#508
Pt-Cr/SiO2
Pt L3
▶
LLM Prompt
Sample Information
Material: Pt-Cr/SiO2
Support: SiO2
Reaction Conditions: measured at room temperature in He after reduction
Sample-Specific Conditions
- Reduction temperature: 250°C
- 2 wt% Pt, 3 wt% Cr on SiO2 reduced at 250°C
Measurement
We plan to measure the Pt L3 XANES spectrum of this sample.
Questions
Based on all the information above:
1. Based on the sample conditions (2 wt% Pt, 3 wt% Cr on SiO2 reduced at 250°C), what are the expected phases present in the nanoparticles and what are their estimated fractions?
2. What reference spectra should be used as basis functions to perform a Linear Combination Fitting (LCF) of the XANES spectrum for this sample to determine the extent of alloying?
Ground Truth
Material: 2Pt3Cr/SiO2
Measurement: Pt L3 edge in situ transmission mode at 10-BM-B beamline, APS
Fit method: Linear combination fitting of XANES or EXAFS coordination number ratios
Phase fractions: (±10%)
| Phase | Fraction |
|---|---|
| Pt3Cr | 0.3 |
| Pt | 0.7 |
Fit basis (paper's reference spectra):
- monometallic Pt
- Pt3Cr (2Pt3Cr/SiO2 reduced at 800°C)
Source evidence: Table 8, page 31
Key reasoning: The reduction of PtOx is more kinetically favorable than Cr2O3, so Pt is initially reduced. The formed Pt nanoparticles activate H2, which catalyzes the reduction of nearby Cr2O3 at lower temperatures than would occur without Pt. At 250°C, only small amounts of metallic Cr are incorporated into the initially formed Pt nanoparticles, primarily at the surface, resulting in a mixture of monometallic Pt (70%) and a newly forming Pt3Cr alloy phase (30%).
Reasoning source: Discussion, pages 27-28
Scoring Rubric (total: 100 pts)
| Q | Type | Max | Question | Reference Answer | Scoring Criteria |
|---|---|---|---|---|---|
| q1 | quantification | 57 | Based on the sample conditions (2 wt% Pt, 3 wt% Cr on SiO2 reduced at 250°C), what are the expected phases present in the nanoparticles and what are their estimated fractions? | For the 2 wt% Pt, 3 wt% Cr on SiO2 sample reduced at 250°C, the expected phases are monometallic Pt at a fraction of 0.7 (70%) and a Pt3Cr alloy phase at a fraction of 0.3 (30%). These specific fractions arise because the reduction of PtOx is more kinetically favorable than Cr2O3, leading to the initial formation of pure Pt nanoparticles. These newly formed Pt nanoparticles then activate H2, which catalyzes the reduction of nearby Cr2O3 at lower temperatures than would occur without Pt. However, because the reduction temperature is only 250°C, only small amounts of metallic Cr are incorporated into the initially formed Pt nanoparticles, primarily at the surface. This limited incorporation at this specific temperature results in the observed mixture dominated by 70% monometallic Pt alongside 30% of the newly forming Pt3Cr alloy phase. | Full points for identifying both Pt3Cr and metallic Pt, with estimated fractions of approximately 30% Pt3Cr and 70% metallic Pt. |
| q2 | identification | 43 | What reference spectra should be used as basis functions to perform a Linear Combination Fitting (LCF) of the XANES spectrum for this sample to determine the extent of alloying? | To perform Linear Combination Fitting (LCF) of the Pt L3 XANES spectrum for this sample, the reference spectra should include monometallic Pt and a Pt3Cr alloy (specifically, a 2Pt3Cr/SiO2 sample reduced at 800°C). These specific basis functions are required because the sample conditions (reduction at 250°C) lead to a partial alloying process rather than a single pure phase. Kinetically, PtOx reduces more easily than Cr2O3, forming initial Pt nanoparticles that subsequently activate H2 to catalyze the reduction of nearby Cr2O3. At the relatively low reduction temperature of 250°C, only a small amount of metallic Cr is incorporated into the surface of the Pt nanoparticles. Therefore, the sample exists as a physical mixture of the initially formed monometallic Pt and the newly forming Pt3Cr alloy phase, necessitating both references to accurately fit the spectrum. | Full points for specifying a monometallic Pt reference and a fully alloyed Pt3Cr reference (such as the same catalyst reduced at a much higher temperature, e.g., 800°C). |
Review
#509
Pt-Cr/SiO2
Pt L3
▶
LLM Prompt
Sample Information
Material: Pt-Cr/SiO2
Support: SiO2
Reaction Conditions: measured at room temperature in He after reduction
Sample-Specific Conditions
- Reduction temperature: 550°C
- 2 wt% Pt, 3 wt% Cr on SiO2 reduced at 550°C
Measurement
We plan to measure the Pt L3 XANES spectrum of this sample.
Questions
Based on all the information above:
1. What candidate reference spectra or basis functions are needed to model the Pt L3 XANES spectrum of this sample?
2. Estimate the phase fractions of the Pt-containing species for the 2Pt3Cr/SiO2 catalyst reduced at 550°C.
3. Explain the physical reasoning for why reduction at 550°C produces this specific mixture of phases rather than a fully alloyed nanoparticle.
Ground Truth
Material: 2Pt3Cr/SiO2
Measurement: Pt L3 edge in situ transmission mode at 10-BM-B beamline, APS
Fit method: Linear combination fitting of XANES or EXAFS coordination number ratios
Phase fractions: (±10%)
| Phase | Fraction |
|---|---|
| Pt3Cr | 0.6 |
| Pt | 0.4 |
Fit basis (paper's reference spectra):
- monometallic Pt
- Pt3Cr (2Pt3Cr/SiO2 reduced at 800°C)
Source evidence: Table 8 (page 31) and text on page 30
Key reasoning: At 550°C, Pt activates H2 to reduce nearby Cr2O3, incorporating metallic Cr into the initially formed Pt nanoparticles. The reduction temperature is insufficient to form a full intermetallic alloy. Instead, a core-shell morphology forms with a nearly complete Pt3Cr surface monolayer and a mixed Pt/Pt3Cr interior, yielding an average of 60% Pt3Cr and 40% monometallic Pt.
Reasoning source: Discussion section, pages 27-30
Scoring Rubric (total: 100 pts)
| Q | Type | Max | Question | Reference Answer | Scoring Criteria |
|---|---|---|---|---|---|
| q1 | identification | 20 | What candidate reference spectra or basis functions are needed to model the Pt L3 XANES spectrum of this sample? | To model the Pt L3 XANES spectrum of the 2Pt3Cr/SiO2 sample reduced at 550°C, the required basis functions are monometallic Pt and a Pt3Cr alloy reference (specifically, 2Pt3Cr/SiO2 reduced at 800°C). These specific references are needed because, at the 550°C reduction temperature, the Pt activates H2 to reduce nearby Cr2O3, leading to the incorporation of metallic Cr into the initially formed Pt nanoparticles. However, 550°C is insufficient to form a fully intermetallic alloy throughout the particle. Consequently, the sample develops a core-shell morphology containing both a mixed Pt/Pt3Cr interior and a Pt3Cr surface monolayer, necessitating both monometallic Pt and Pt3Cr reference spectra to accurately fit the data. | Full points for identifying monometallic Pt and a fully alloyed Pt3Cr reference (e.g., the sample reduced at 800°C). |
| q2 | quantification | 40 | Estimate the phase fractions of the Pt-containing species for the 2Pt3Cr/SiO2 catalyst reduced at 550°C. | For the 2 wt% Pt, 3 wt% Cr on SiO2 catalyst reduced at 550°C, the estimated phase fractions are 60% Pt3Cr and 40% monometallic Pt, with an uncertainty of 10%. These specific fractions result from the 550°C reduction temperature being high enough for Pt to activate H2 and reduce nearby Cr2O3, but too low to achieve complete intermetallic alloying. Instead of a fully alloyed nanoparticle, this thermal treatment produces a core-shell morphology featuring a nearly complete Pt3Cr surface monolayer alongside a mixed Pt/Pt3Cr interior. Therefore, the limited extent of Cr incorporation at this specific temperature yields an average bulk composition of 60% alloyed Pt3Cr and 40% unalloyed monometallic Pt. | Full points for estimating approximately 60% Pt3Cr and 40% metallic Pt. Partial credit for identifying that it is a mixture of Pt and Pt3Cr with Pt3Cr being the majority phase. |
| q3 | reasoning | 40 | Explain the physical reasoning for why reduction at 550°C produces this specific mixture of phases rather than a fully alloyed nanoparticle. | During the reduction of the 2Pt3Cr/SiO2 catalyst at 550°C, the Pt initially forms nanoparticles and activates H2 to reduce the adjacent Cr2O3 species. This activated hydrogen allows metallic Cr to be incorporated into the Pt nanoparticles. However, the thermal energy provided at 550°C is kinetically insufficient to drive the complete diffusion required to form a fully intermetallic Pt3Cr alloy. As a result, the mechanism yields a core-shell morphology characterized by a nearly complete Pt3Cr surface monolayer and a mixed Pt/Pt3Cr interior. This incomplete alloying process ultimately leaves an average mixture of 60% Pt3Cr and 40% monometallic Pt rather than a single homogeneous phase. | Full points for explaining that 550°C is sufficient for Pt to activate H2 and reduce some nearby Cr2O3 to form a Pt3Cr surface layer (core-shell morphology), but the temperature is too low for complete Cr diffusion into the core to form a full intermetallic alloy. |
Review
#510
Pt-Cr/SiO2
Pt L3
▶
LLM Prompt
Sample Information
Material: Pt-Cr/SiO2
Support: SiO2
Reaction Conditions: measured at room temperature in He after reduction
Sample-Specific Conditions
- Reduction temperature: 700°C
- 2 wt% Pt, 3 wt% Cr on SiO2 reduced at 700°C
Measurement
We plan to measure the Pt L3 XANES spectrum of this sample.
Questions
Based on all the information above:
1. What candidate reference spectra or basis functions are needed to model the phase composition of this sample using XANES linear combination fitting?
2. Estimate the phase fractions of the components in this catalyst after reduction at 700°C.
3. Explain the physical reasoning for why this specific phase composition is observed at 700°C compared to lower reduction temperatures.
Ground Truth
Material: 2Pt3Cr/SiO2
Measurement: Pt L3 edge in situ transmission mode at 10-BM-B beamline, APS
Fit method: Linear combination fitting of XANES or EXAFS coordination number ratios
Phase fractions: (±10%)
| Phase | Fraction |
|---|---|
| Pt3Cr | 0.91 |
| Pt | 0.09 |
Fit basis (paper's reference spectra):
- monometallic Pt
- Pt3Cr (2Pt3Cr/SiO2 reduced at 800°C)
Source evidence: Table 8, page 31; Page 29 for fitting method
Key reasoning: With increasing reduction temperature, more metallic Cr is incorporated into the Pt nanoparticles. Cr diffusion continues at higher temperatures, converting the initial Pt core and Pt3Cr surface shell into a nearly complete Pt3Cr intermetallic alloy. By 700°C, the nanoparticles are nearly a full Pt3Cr alloy with very little remaining monometallic Pt.
Reasoning source: Page 26 and Page 28
Scoring Rubric (total: 100 pts)
| Q | Type | Max | Question | Reference Answer | Scoring Criteria |
|---|---|---|---|---|---|
| q1 | identification | 20 | What candidate reference spectra or basis functions are needed to model the phase composition of this sample using XANES linear combination fitting? | To model the phase composition of this sample using XANES linear combination fitting, the required basis functions are monometallic Pt and a Pt3Cr alloy reference (specifically, 2Pt3Cr/SiO2 reduced at 800°C). These specific references are necessary because of the structural evolution the 2 wt% Pt, 3 wt% Cr on SiO2 sample undergoes during reduction at 700°C. At this elevated temperature, metallic Cr diffuses and incorporates into the Pt nanoparticles, converting the initial structure into a nearly complete Pt3Cr intermetallic alloy while leaving a small residual amount of unalloyed monometallic Pt. | Full points for identifying monometallic Pt and a fully alloyed Pt3Cr reference (or the sample reduced at 800°C as the Pt3Cr proxy). |
| q2 | quantification | 40 | Estimate the phase fractions of the components in this catalyst after reduction at 700°C. | After reduction at 700°C, the estimated phase fractions for this catalyst are 0.91 (91%) Pt3Cr and 0.09 (9%) monometallic Pt, with an uncertainty of 10%. These specific values arise because the 700°C reduction temperature provides sufficient thermal energy for extensive Cr diffusion in the 2 wt% Pt, 3 wt% Cr on SiO2 sample. This high-temperature diffusion incorporates metallic Cr into the Pt nanoparticles, nearly completing the conversion of the initial Pt core and Pt3Cr surface shell into a full Pt3Cr intermetallic alloy and leaving only 9% residual monometallic Pt. | Full points for estimating ~91% Pt3Cr and ~9% metallic Pt. Partial credit for identifying it as predominantly Pt3Cr with a small minority of unalloyed Pt. |
| q3 | reasoning | 40 | Explain the physical reasoning for why this specific phase composition is observed at 700°C compared to lower reduction temperatures. | The specific phase composition of 91% Pt3Cr and 9% monometallic Pt is driven by the temperature-dependent diffusion of metallic Cr into the Pt nanoparticles. In the 2 wt% Pt, 3 wt% Cr on SiO2 sample, increasing the reduction temperature to 700°C promotes continuous Cr diffusion and incorporation. While lower temperatures yield an incomplete reaction characterized by a Pt core and a Pt3Cr surface shell, the 700°C condition provides enough energy to convert the nanoparticles into a nearly complete Pt3Cr intermetallic alloy. As a result, the initial monometallic Pt is almost entirely consumed, leaving very little unalloyed Pt behind. | Full points for explaining that higher reduction temperatures drive further Cr diffusion into the nanoparticle subsurface/core, converting the initial core-shell structure (Pt core/Pt3Cr shell) into a nearly complete Pt3Cr intermetallic alloy. |
Review
#511
Pt-Cr/SiO2
Pt L3
▶
LLM Prompt
Sample Information
Material: Pt-Cr/SiO2
Support: SiO2
Reaction Conditions: measured at room temperature in He after reduction
Sample-Specific Conditions
- Reduction temperature: 800°C
- 2 wt% Pt, 3 wt% Cr on SiO2 reduced at 800°C
Measurement
We plan to measure the Pt L3 XANES spectrum of this sample.
Questions
Based on all the information above:
1. What candidate reference spectra or basis functions would be appropriate to model the phase evolution of this catalyst series using linear combination fitting?
2. What is the expected dominant phase for the 2Pt3Cr/SiO2 catalyst after reduction at 800°C, and what physical mechanism drives its formation at this temperature?
3. Describe the expected Pt L3 XANES edge energy shift for this sample compared to monometallic Pt, and explain what this shift indicates about the nanoparticle structure.
Ground Truth
Material: 2Pt3Cr/SiO2
Measurement: Pt L3 edge in situ transmission mode at 10-BM-B beamline, APS
Fit method: Linear combination fitting of XANES or EXAFS coordination number ratios
Phase fractions: (±10%)
| Phase | Fraction |
|---|---|
| Pt3Cr | 1.0 |
Fit basis (paper's reference spectra):
- monometallic Pt
- Pt3Cr (2Pt3Cr/SiO2 reduced at 800°C)
Source evidence: Table 8, page 31; Table 2, page 14
Key reasoning: Reduction at 800°C provides sufficient thermal energy for Cr diffusion into the Pt core, forming a full Pt3Cr intermetallic alloy. This is supported by the EXAFS CNPt-Cr/CNPt-Pt ratio reaching 0.52, which matches the theoretical value of 0.5 for a fully alloyed Pt3Cr nanoparticle. XRD also confirms the formation of the Pt3Cr intermetallic phase with the appearance of superlattice diffraction peaks.
Reasoning source: RESULTS (In Situ XAS, In Situ XRD) and DISCUSSION sections, pages 14, 17, 28-29
Scoring Rubric (total: 100 pts)
| Q | Type | Max | Question | Reference Answer | Scoring Criteria |
|---|---|---|---|---|---|
| q1 | identification | 20 | What candidate reference spectra or basis functions would be appropriate to model the phase evolution of this catalyst series using linear combination fitting? | The appropriate basis functions for linear combination fitting of this catalyst series are monometallic Pt and the Pt3Cr intermetallic alloy. These specific reference phases are expected because the sample consists of 2 wt% Pt and 3 wt% Cr on a SiO2 support subjected to high-temperature treatment. Specifically, the reduction at 800°C provides sufficient thermal energy to drive the diffusion of Cr into the Pt core. This mechanism results in the complete transformation of the initial metals into a fully alloyed Pt3Cr intermetallic phase, making monometallic Pt and Pt3Cr the ideal endpoints for modeling the structural evolution. | Full credit for identifying monometallic Pt and fully alloyed Pt3Cr as the end-member reference spectra. |
| q2 | reasoning | 40 | What is the expected dominant phase for the 2Pt3Cr/SiO2 catalyst after reduction at 800°C, and what physical mechanism drives its formation at this temperature? | The expected dominant phase for the 2Pt3Cr/SiO2 catalyst after reduction at 800°C is a fully alloyed Pt3Cr intermetallic phase, representing a phase fraction of 1.0. This complete transformation occurs because the 800°C reduction temperature provides the necessary thermal energy to drive the physical diffusion of Cr atoms into the Pt core. The formation of this full intermetallic alloy is evidenced by an EXAFS CNPt-Cr/CNPt-Pt ratio of 0.52, which closely matches the theoretical value of 0.5 for a fully alloyed Pt3Cr nanoparticle. Furthermore, the structural ordering driven by these conditions is confirmed by the appearance of superlattice diffraction peaks in XRD. | Full credit for identifying Pt3Cr (100% or full alloy) and explaining that the high reduction temperature (800°C) allows for sufficient Cr diffusion into the Pt core to form the full intermetallic alloy. |
| q3 | spectral | 40 | Describe the expected Pt L3 XANES edge energy shift for this sample compared to monometallic Pt, and explain what this shift indicates about the nanoparticle structure. | The Pt L3 XANES edge energy for this sample is expected to shift by +0.6 eV to 11564.6 eV compared to monometallic Pt (11564.0 eV). This shift to higher energies is accompanied by a change in spectral shape that reflects an altered Pt coordination environment. These spectral features arise because the 800°C reduction condition provides the thermal energy required for metallic Cr to diffuse completely into the Pt core. The incorporation of Cr forms a fully alloyed Pt3Cr intermetallic nanoparticle, and this maximum observed +0.6 eV shift correlates proportionally with the complete structural and electronic transformation of the Pt environment. | Full credit for stating the edge shifts to higher energy (specifically +0.6 eV or to ~11564.6 eV) and that this indicates maximum incorporation of metallic Cr, corresponding to a fully alloyed Pt3Cr nanoparticle. |
Review
Understanding the Low-Voltage Hysteresis of Anionic Redox in Na2Mn3O7
BNL-NSLS-II-8-ID
Electrochemistry
Bohang Song et al.
DOI: 10.1021/acs.chemmater.9b00772
1 scenario
▶
#512
Na2Mn3O7
Mn K-edge
▶
LLM Prompt
Sample Information
Material: Na2Mn3O7
Electrode Type: cathode
Electrolyte: 1 M NaClO4 in PC:FEC (98:2 v/v)
Cell Type: coin cell
Charge Discharge: OCV
Sample-Specific Conditions
- state of charge: pristine
- Pristine cathode material before cycling
Measurement
We plan to measure the Mn K-edge XANES spectrum of this sample.
Questions
Based on all the information above:
1. What is the expected oxidation state of Mn in the pristine Na2Mn3O7 sample, and what standard reference spectrum would its main edge most closely match?
2. Describe the expected intensity of the pre-edge feature in the Mn K-edge XANES spectrum of this sample and explain its structural origin.
3. What candidate reference spectra would be appropriate to include in a visual comparison or basis set to confirm the oxidation state of this pristine sample?
Ground Truth
Material: Na2Mn3O7
Measurement: Mn K-edge XANES in transmission mode at 8-ID beamline of NSLS II
Fit method: visual comparison
Phase fractions:
| Phase | Fraction |
|---|---|
| Na2Mn3O7 | 1.0 |
Fit basis (paper's reference spectra):
- Mn2O3
- MnO2
Source evidence: Figure 2c, page 11
Key reasoning: The XANES spectrum of the pristine sample largely matches the behavior of the MnO2 reference, indicating that Mn is tetravalent. A relatively weak pre-edge indicates that Mn exclusively occupies the octahedral site in the structure.
Reasoning source: Page 11, Evidence of oxygen redox activity
Scoring Rubric (total: 100 pts)
| Q | Type | Max | Question | Reference Answer | Scoring Criteria |
|---|---|---|---|---|---|
| q1 | prediction | 30 | What is the expected oxidation state of Mn in the pristine Na2Mn3O7 sample, and what standard reference spectrum would its main edge most closely match? | The expected oxidation state of Mn in the pristine Na2Mn3O7 sample is 4+, and its main edge will most closely match the MnO2 standard reference spectrum. Because the sample is a pristine cathode material at open circuit voltage (OCV) before any electrochemical cycling, the Mn ions remain in their initial, fully oxidized state. Based on the composition of the uncycled Na2Mn3O7, the Mn is tetravalent. Consequently, the XANES spectrum of this pristine material largely matches the behavior of the MnO2 reference, confirming the 4+ oxidation state. | Award 15 points for identifying the oxidation state as 4+ (tetravalent) and 15 points for stating that the spectrum matches or behaves similarly to an MnO2 reference. |
| q2 | spectral | 40 | Describe the expected intensity of the pre-edge feature in the Mn K-edge XANES spectrum of this sample and explain its structural origin. | The pre-edge feature in the Mn K-edge XANES spectrum is expected to be relatively weak. This specific spectral feature arises directly from the structural properties of the pristine Na2Mn3O7 cathode material before any electrochemical cycling. In this uncycled state at open circuit voltage, the Mn ions exclusively occupy the octahedral sites within the structure. This exclusive octahedral coordination of the tetravalent Mn in the pristine material is the direct structural origin of the relatively weak pre-edge intensity. | Award 20 points for stating that the pre-edge feature is relatively weak. Award 20 points for explaining that this indicates Mn exclusively occupies octahedral sites in the structure. |
| q3 | reasoning | 30 | What candidate reference spectra would be appropriate to include in a visual comparison or basis set to confirm the oxidation state of this pristine sample? | Appropriate candidate reference spectra for a visual comparison or basis set include Mn2O3 and MnO2. These references are necessary to evaluate the oxidation state of the pristine Na2Mn3O7 cathode material at open circuit voltage (OCV) before cycling. Because the uncycled material is expected to contain tetravalent Mn, comparing it against MnO2 (Mn4+) and Mn2O3 (Mn3+) allows for clear verification of the oxidation state. Ultimately, the visual comparison confirms that the pristine sample's spectrum largely matches the behavior of the MnO2 reference, verifying that the Mn in the uncycled Na2Mn3O7 is 4+. | Award full points for identifying MnO2 and Mn2O3 as appropriate reference spectra for comparison. |
Review
Oxygen K-edge X-ray Absorption Spectra
BNL-NSLS-II-8-ID
Pure Phase
Federica Frati, Myrtille O. J. Y. Hunault, Frank M. F. de Groot
DOI: 10.1021/acs.chemrev.9b00439
4 scenarios
▶
#513
BeO
O K
▶
LLM Prompt
Sample Information
Material: BeO
- Beryllium oxide theoretical and experimental comparison
Measurement
We plan to measure the O K XANES spectrum of this sample.
Questions
Based on all the information above:
1. Identify the expected chemical compound for this sample.
2. Describe the expected impact of core-hole effects on the O K-edge XANES spectral shape of this material.
3. If one were to model the composition of this sample, what reference spectrum would be strictly necessary?
Ground Truth
Compound: BeO
Oxidation state: not reported
Measurement: O K-edge
Edge position: not reported
Spectral shape: The presence of the core-hole alters both spectra, but in the oxygen case, the modifications to the spectral shape are less significant.
Distinguishing features: not reported
Key reasoning: The paper compares theoretical and experimental O K-edge XANES spectra for beryllium oxide. It notes that the presence of the core-hole alters the spectra, but for the oxygen case, the modifications to the spectral shape are less significant.
Reasoning source: Text discussing Figure 5
Scoring Rubric (total: 100 pts)
| Q | Type | Max | Question | Reference Answer | Scoring Criteria |
|---|---|---|---|---|---|
| q1 | identification | 30 | Identify the expected chemical compound for this sample. | The expected chemical compound for this sample is pure beryllium oxide (BeO), which accounts for a fraction of 1.0. This specific phase is expected because the sample conditions explicitly define the material as BeO for a direct theoretical and experimental comparison. Since the study focuses on evaluating the fundamental O K-edge XANES properties of this exact material, the sample consists entirely of the BeO phase without any other components. | Award full points for correctly identifying BeO (beryllium oxide) as the compound. |
| q2 | spectral | 40 | Describe the expected impact of core-hole effects on the O K-edge XANES spectral shape of this material. | The presence of a core-hole is expected to alter the O K-edge XANES spectral shape of this material, though these modifications are noted to be relatively less significant. This specific spectral behavior arises because the sample is pure beryllium oxide (BeO) undergoing theoretical and experimental comparison. In this context, while the core-hole effect is an inherent part of the X-ray absorption process, its electronic perturbation on the oxygen sites in the BeO lattice produces only minor changes to the overall spectral shape. | Award full points for stating that while the core-hole alters the spectra, the modifications to the spectral shape are less significant in the oxygen case. |
| q3 | reasoning | 30 | If one were to model the composition of this sample, what reference spectrum would be strictly necessary? | If one were to model the composition of this sample, a reference spectrum for pure beryllium oxide (BeO) would be strictly necessary to represent the 1.0 fraction of the material. This single reference is required because the sample conditions explicitly state the material is BeO, prepared for a theoretical and experimental comparison of its O K-edge XANES spectrum. Therefore, the entire measured signal originates from oxygen in the BeO lattice, making additional reference phases unnecessary. Any theoretical model used as a reference would also need to account for core-hole effects, even though their impact on the oxygen spectral shape is less significant. | Award full points for stating that a BeO (beryllium oxide) reference spectrum is required, as it is the sole phase present. |
Review
#514
GeO2
O K
▶
LLM Prompt
Sample Information
Material: GeO2
- Germanium dioxide theoretical and experimental comparison
Measurement
We plan to measure the O K XANES spectrum of this sample.
Questions
Based on all the information above:
1. What is the chemical formula of the pure phase material being analyzed in this sample?
2. According to the paper, how does the inclusion of the core-hole affect the reproduction of the relative peak intensities in the O K-edge XANES spectrum of GeO2?
3. What physical mechanism or electronic structure concept is used in the paper to explain the features of the O K-edge XANES spectrum for GeO2?
Ground Truth
Compound: GeO2
Oxidation state: not reported
Measurement: O K-edge
Edge position: not reported
Spectral shape: The relative intensities of some peaks are better reproduced without the inclusion of the core-hole, indicating that the core-hole potential in the adopted supercell approach is too attractive.
Distinguishing features: not reported
Key reasoning: Ground-state DOS calculations can give features consistent with experiment and provide information to explain the features in terms of orbital hybridization. The relative intensities of some peaks are better reproduced without the inclusion of the core-hole, indicating that the core-hole potential in the adopted supercell approach is too attractive.
Reasoning source: Text describing theoretical and experimental comparison / figure_6
Scoring Rubric (total: 100 pts)
| Q | Type | Max | Question | Reference Answer | Scoring Criteria |
|---|---|---|---|---|---|
| q1 | identification | 20 | What is the chemical formula of the pure phase material being analyzed in this sample? | The chemical formula of the pure phase material being analyzed is GeO2, which is present at a fraction of 1.0. This pure phase is expected because the sample conditions explicitly specify a theoretical and experimental comparison of germanium dioxide. Ground-state density of states (DOS) calculations are used to model this specific GeO2 composition, explaining its spectral features through orbital hybridization. The analysis of this pure phase reveals that modeling without a core-hole better reproduces the experimental relative peak intensities, as the core-hole potential in the adopted supercell approach is too attractive for this material. | Full credit if the answer correctly identifies GeO2 (Germanium dioxide). |
| q2 | spectral | 40 | According to the paper, how does the inclusion of the core-hole affect the reproduction of the relative peak intensities in the O K-edge XANES spectrum of GeO2? | The inclusion of the core-hole negatively affects the reproduction of the relative peak intensities in the O K-edge XANES spectrum of GeO2. The relative intensities of some peaks are actually better reproduced without the inclusion of the core-hole. Based on the theoretical and experimental comparison of germanium dioxide, this discrepancy arises because the core-hole potential in the adopted supercell approach is too attractive. Consequently, ground-state DOS calculations without this overly attractive potential yield features more consistent with the experiment, allowing the features to be accurately explained in terms of orbital hybridization. | Full credit if the answer states that the relative intensities of some peaks are better reproduced WITHOUT the inclusion of the core-hole, because the core-hole potential is too attractive. |
| q3 | reasoning | 40 | What physical mechanism or electronic structure concept is used in the paper to explain the features of the O K-edge XANES spectrum for GeO2? | The paper uses the concept of orbital hybridization derived from ground-state density of states (DOS) calculations to explain the features of the O K-edge XANES spectrum for GeO2. Because the sample involves a theoretical and experimental comparison of germanium dioxide, these ground-state DOS calculations are utilized to model features consistent with the experiment. This theoretical approach successfully links the observed spectral features directly to the orbital hybridization within the GeO2 structure. Furthermore, this modeling reveals that the relative peak intensities are better reproduced without including the core-hole, as the core-hole potential in the adopted supercell approach is too attractive for this material. | Full credit if the answer mentions that the features are explained in terms of orbital hybridization (derived from ground-state DOS calculations). |
Review
#515
H2O
O K
▶
LLM Prompt
Sample Information
Material: H2O
Crystal Structure: liquid
Sample Form: liquid
- Liquid water spectra calculated with different core-hole approximations
Measurement
We plan to measure the O K XANES spectrum of this sample.
Questions
Based on all the information above:
1. What is the dominant phase present in this sample under the described conditions?
2. If one were to perform a linear combination fit (LCF) to model this sample's composition, what reference spectrum would be essential?
3. What is the physical state of the H2O sample being analyzed at the O K-edge?
Ground Truth
Compound: H2O
Oxidation state: not reported
Measurement: O K-edge
Edge position: not reported
Spectral shape: Calculated spectra for liquid water.
Distinguishing features: not reported
Key reasoning: The sample is pure liquid water. The paper focuses on calculating the O K-edge XANES spectra of liquid water rather than experimental phase quantification, hence the phase fraction of H2O is 1.0.
Reasoning source: figure_3
Scoring Rubric (total: 100 pts)
| Q | Type | Max | Question | Reference Answer | Scoring Criteria |
|---|---|---|---|---|---|
| q1 | identification | 30 | What is the dominant phase present in this sample under the described conditions? | The dominant phase present in this sample is H2O, which accounts for a phase fraction of 1.0. This is expected because the sample conditions explicitly define the material as pure liquid water. The study focuses entirely on calculating the O K-edge XANES spectra of liquid water using different core-hole approximations rather than performing experimental phase quantification. Consequently, no other phases are present or modeled, resulting in a pure H2O composition. | Award full points for identifying H2O as the sole/dominant phase. |
| q2 | reasoning | 30 | If one were to perform a linear combination fit (LCF) to model this sample's composition, what reference spectrum would be essential? | If one were to perform a linear combination fit, a reference spectrum for pure liquid H2O would be the only essential component. This is because the sample conditions specify that the material is pure liquid water being analyzed at the O K-edge. The study focuses on calculating the spectra of liquid water with different core-hole approximations rather than experimental phase quantification, meaning the sample consists entirely of a single phase with a fraction of 1.0. Therefore, no other reference spectra are required to model the composition. | Award full points for stating that a liquid H2O reference spectrum is needed. |
| q3 | identification | 40 | What is the physical state of the H2O sample being analyzed at the O K-edge? | The physical state of the H2O sample being analyzed at the O K-edge is a liquid. This state is expected because the sample conditions explicitly define both the crystal structure and the sample form as liquid. The entire focus of the study is on calculating the XANES spectra of liquid water using various core-hole approximations. As a result, the sample is modeled strictly as pure liquid H2O with a phase fraction of 1.0. | Award full points for identifying the state as liquid. |
Review
#516
CH3OH, O2, Cu2O
O K
▶
LLM Prompt
Sample Information
Material: CH3OH, O2, Cu2O
Sample Form: gas and surface
Measurement Mode: in situ TEY and gas phase detectors
- Mixture of methanol and oxygen reacting on a Cu foil at 520 K
Measurement
We plan to measure the O K XANES spectrum of this sample.
Questions
Based on all the information above:
1. Based on the sample conditions (methanol and oxygen reacting on Cu foil at 520 K), what candidate reference spectra are needed to model this system, and what are their estimated phase fractions?
2. Why do these specific reaction conditions produce this phase composition?
3. Describe the expected overall spectral shape for this sample at the O K-edge.
Ground Truth
Compound: CH3OH, O2, Cu2O
Oxidation state: not reported
Measurement: O K-edge, in situ TEY and gas phase detectors
Edge position: not reported
Spectral shape: The spectral shapes are a combination of O2, CH3OH, and the Cu2O surface species.
Distinguishing features: not reported
Key reasoning: The sample consists of a mixture of methanol and oxygen reacting on a Cu foil at 520 K. Under these conditions, the composition includes gas phase CH3OH and O2, as well as the Cu2O surface species that forms during the reaction.
Reasoning source: Sample description and figure_2
Scoring Rubric (total: 100 pts)
| Q | Type | Max | Question | Reference Answer | Scoring Criteria |
|---|---|---|---|---|---|
| q1 | quantification | 40 | Based on the sample conditions (methanol and oxygen reacting on Cu foil at 520 K), what candidate reference spectra are needed to model this system, and what are their estimated phase fractions? | To model this system, the required candidate reference spectra are CH3OH, O2, and Cu2O. The estimated phase fractions are approximately 33.3% CH3OH, 33.3% O2, and 33.4% Cu2O, with a 10% uncertainty. These specific phases and roughly equal fractions arise because the sample consists of a mixture of methanol and oxygen gases reacting on a Cu foil at 520 K. Under these specific in situ conditions, the composition naturally includes the unreacted gas phase CH3OH and O2 reactants, alongside the Cu2O surface species that forms on the foil during the reaction. | Full points for identifying CH3OH, O2, and Cu2O as the necessary reference spectra and estimating their phase fractions at approximately 33.3% each. |
| q2 | reasoning | 30 | Why do these specific reaction conditions produce this phase composition? | The phase composition of CH3OH, O2, and Cu2O is a direct result of the in situ reaction conditions involving a mixture of methanol and oxygen on a Cu foil at 520 K. At this temperature, the methanol and oxygen exist as gas-phase reactants interacting with the solid catalyst. The oxygen reacts with the copper foil to form a Cu2O surface species during the reaction. Consequently, the measurement captures a combination of the gas-phase CH3OH and O2 reactants along with the newly formed Cu2O surface oxide. | Full points for explaining that the mixture contains gas phase CH3OH and O2, along with Cu2O which forms as a surface species on the Cu foil during the reaction at 520 K. |
| q3 | spectral | 30 | Describe the expected overall spectral shape for this sample at the O K-edge. | The expected overall spectral shape at the O K-edge will be a combination of the spectral features of O2, CH3OH, and Cu2O. This composite shape arises directly from the sample conditions, where methanol and oxygen gases are reacting on a Cu foil at 520 K. Because the in situ TEY and gas phase detectors capture both the gas and surface species, the spectrum reflects the electronic structure of the unreacted gas-phase CH3OH and O2 molecules, as well as the solid Cu2O surface species that forms on the foil during the reaction. | Full points for stating that the spectral shape is a combination of the features from O2, CH3OH, and the Cu2O surface species. |
Review
Elucidating the Role of Single-Atom Pd for Electrocatalytic Hydrodechlorination
BNL-NSLS-II-8-ID
Catalyst
Dahong Huang et al.
DOI: 10.1021/acs.est.1c04294
2 scenarios
▶
#517
Pd/rGO
Pd K
▶
LLM Prompt
Sample Information
Material: Pd/rGO
Support: rGO
Reaction Conditions: room temperature
Sample-Specific Conditions
- catalyst structure: single-atom
- Single-atom Pd catalyst on reduced graphene oxide
Measurement
We plan to measure the Pd K XANES spectrum of this sample.
Questions
Based on all the information above:
1. Based on the sample conditions, what is the expected dominant oxidation state of the Pd species, and what structural evidence supports this assignment?
2. Describe the expected relative white line intensity of this single-atom catalyst compared to metallic Pd nanoparticles and bulk PdO.
3. To evaluate the oxidation state and spectral features of this sample, what reference spectra should be included for comparison?
4. What distinguishing spectral feature in the XANES data differentiates this single-atom Pd catalyst from conventional Pd nanoparticles on the same support, and what electronic property does the paper attribute this to?
Ground Truth
Material: Pd1/rGO
Measurement: Pd K-edge, fluorescence mode, Beamline 8-ID at NSLS-II
Fit method: Qualitative comparison of white line intensity
Phase fractions: (±10%)
| Phase | Fraction |
|---|---|
| Pd2+ (single atom) | 1.0 |
Fit basis (paper's reference spectra):
- Pd foil
- PdO
- PdCl2
- Pdnano/rGO
Source evidence: Figure 1f, Table 1, Page 10
Key reasoning: The white line (WL) intensity of Pd1 is much higher than Pd0 in Pd foil and Pdnano and close to the Pd2+ in the PdO reference, indicating an oxidation state of ~2+. EXAFS confirms Pd-O coordination (CN ~3.4) and the absence of Pd-Pd bonds, verifying the single-atom nature.
Reasoning source: Page 10, lines 197-203
Scoring Rubric (total: 100 pts)
| Q | Type | Max | Question | Reference Answer | Scoring Criteria |
|---|---|---|---|---|---|
| q1 | reasoning | 30 | Based on the sample conditions, what is the expected dominant oxidation state of the Pd species, and what structural evidence supports this assignment? | The expected dominant oxidation state of the Pd species is ~2+, which accounts for a 1.0 fraction of the sample. Because the sample is synthesized as a single-atom Pd catalyst on a reduced graphene oxide (rGO) support at room temperature, the isolated Pd atoms coordinate directly with oxygen atoms on the support rather than forming metallic clusters. This structural configuration is supported by EXAFS data showing Pd-O coordination with a coordination number of ~3.4 and a complete absence of Pd-Pd bonds. Consequently, this specific single-atom dispersion and oxygen coordination mechanism result in the observed ~2+ oxidation state. | Award full points if the answer identifies the oxidation state as ~2+ and mentions that it is supported by Pd-O coordination and the absence of Pd-Pd bonds (single-atom nature). |
| q2 | spectral | 30 | Describe the expected relative white line intensity of this single-atom catalyst compared to metallic Pd nanoparticles and bulk PdO. | The XANES spectrum of this single-atom catalyst exhibits a strong white line intensity that is much higher than that of metallic Pd nanoparticles (Pdnano) and Pd foil, and closely resembles the intensity of bulk PdO. Given the sample conditions of isolated Pd single atoms supported on rGO at room temperature, the Pd atoms bond with oxygen on the support rather than forming metallic Pd-Pd bonds. This Pd-O coordination creates a highly vacant 5d orbital state, leading to an oxidation state of ~2+. Therefore, the resulting spectral feature is a significantly elevated white line intensity compared to zero-valent metallic Pd nanoparticles, closely matching the Pd2+ state seen in the PdO reference. | Award full points if the answer states the white line intensity is much higher than Pd nanoparticles/foil and is close to/resembles that of PdO. |
| q3 | identification | 20 | To evaluate the oxidation state and spectral features of this sample, what reference spectra should be included for comparison? | The reference spectra that should be included for comparison are Pd foil, PdO, PdCl2, and Pdnano/rGO. Because the sample is a single-atom Pd catalyst on an rGO support measured at room temperature, it is necessary to compare it against both zero-valent and oxidized Pd standards to determine its exact chemical state. Pd foil and Pdnano/rGO serve as metallic (Pd0) references to rule out nanoparticle formation, while PdO and PdCl2 serve as Pd2+ references to confirm the oxidized state. The inclusion of these specific references allows for a qualitative comparison of the white line intensity, proving that the single-atom Pd coordinates with oxygen on the rGO support to achieve its ~2+ oxidation state. | Award full points if the answer lists Pd foil, PdO, PdCl2, and Pdnano/rGO as the appropriate reference spectra. |
| q4 | prediction | 20 | What distinguishing spectral feature in the XANES data differentiates this single-atom Pd catalyst from conventional Pd nanoparticles on the same support, and what electronic property does the paper attribute this to? | The distinguishing spectral feature is a highly elevated white line intensity compared to conventional metallic Pd nanoparticles. The paper attributes this feature to highly vacant 5d orbitals and an oxidation state of ~2+. Because the sample consists of single-atom Pd dispersed on rGO at room temperature, the isolated Pd atoms coordinate with oxygen (Pd-O) rather than forming metallic Pd-Pd bonds. This specific structural condition draws electron density away from the Pd atoms, creating the highly vacant 5d orbitals, which directly produces the strong white line intensity that differentiates the single-atom catalyst from zero-valent Pd nanoparticles. | Award full points if the answer identifies the higher white line intensity and attributes it to an oxidation state of ~2+ and highly vacant 5d orbitals (as stated by the authors). |
Review
#518
Pd/rGO
Pd K
▶
LLM Prompt
Sample Information
Material: Pd/rGO
Support: rGO
Reaction Conditions: room temperature
Sample-Specific Conditions
- catalyst structure: nanoparticle
- Pd nanoparticle catalyst on reduced graphene oxide
Measurement
We plan to measure the Pd K XANES spectrum of this sample.
Questions
Based on all the information above:
1. Based on the sample description of Pd nanoparticles on reduced graphene oxide, what is the expected dominant phase and oxidation state of Pd? Provide reasoning for this assignment.
2. Describe the expected XANES spectral shape for this sample at the Pd K-edge. How would its white line intensity compare to that of a Pd foil reference?
3. What distinguishing spectral features in the XANES region would differentiate this nanoparticle sample from an oxidized Pd species (such as PdO) or a single-atom Pd catalyst?
Ground Truth
Material: Pdnano/rGO
Measurement: Pd K-edge XAFS, fluorescence mode, Beamline 8-ID at NSLS-II
Fit method: qualitative comparison
Phase fractions: (±10%)
| Phase | Fraction |
|---|---|
| metallic_palladium | 1.0 |
Fit basis (paper's reference spectra):
- Pd foil
- PdO
- PdCl2
Source evidence: Figure 1f, Table 1, Page 10
Key reasoning: The XANES white line intensity of Pdnano/rGO is similar to that of Pd foil, indicating a Pd0 oxidation state. EXAFS fitting confirms a Pd-Pd coordination number of 8.2 ± 0.5 at a distance of 2.76 Å, characteristic of metallic Pd nanoparticles.
Reasoning source: Page 10, lines 197-200 and Table 1
Scoring Rubric (total: 100 pts)
| Q | Type | Max | Question | Reference Answer | Scoring Criteria |
|---|---|---|---|---|---|
| q1 | identification | 35 | Based on the sample description of Pd nanoparticles on reduced graphene oxide, what is the expected dominant phase and oxidation state of Pd? Provide reasoning for this assignment. | The expected dominant phase is metallic palladium (Pd0) nanoparticles, which accounts for a fraction of 1.0 (100%). This phase and oxidation state arise because the sample consists of a Pd nanoparticle catalyst supported on reduced graphene oxide (rGO) at room temperature, which maintains the palladium in a fully reduced state. This is structurally confirmed by EXAFS fitting, which shows a Pd-Pd coordination number of 8.2 ± 0.5 at a distance of 2.76 Å, characteristic of metallic Pd nanoparticles rather than oxidized species. | Full points for identifying metallic Pd (Pd0) as the dominant phase and explaining that nanoparticles typically consist of fully reduced metal, as evidenced by similarities to a Pd foil reference. |
| q2 | spectral | 35 | Describe the expected XANES spectral shape for this sample at the Pd K-edge. How would its white line intensity compare to that of a Pd foil reference? | The expected XANES spectral shape for this sample will closely match that of a metallic Pd foil reference. Specifically, the spectrum will exhibit a low white line intensity that is highly similar to the Pd foil. These spectral features occur because the sample consists of Pd nanoparticles supported on reduced graphene oxide at room temperature, resulting in a fully reduced metallic palladium (Pd0) state. The metallic nature of these nanoparticles, confirmed by a Pd-Pd coordination number of 8.2 ± 0.5 at 2.76 Å, directly produces this low white line intensity characteristic of Pd foil. | Full points for stating the spectrum will closely match Pd foil, exhibiting a low white line intensity characteristic of metallic palladium. |
| q3 | spectral | 30 | What distinguishing spectral features in the XANES region would differentiate this nanoparticle sample from an oxidized Pd species (such as PdO) or a single-atom Pd catalyst? | The primary distinguishing spectral feature of this sample is its much lower white line intensity compared to oxidized Pd species (like PdO) or single-atom Pd catalysts. This lower intensity indicates the absence of significant oxidized Pd species in the sample. This spectral difference arises because the sample is composed of Pd nanoparticles on a reduced graphene oxide support at room temperature, which stabilizes the palladium in a fully reduced, metallic (Pd0) state. Because the catalyst structure consists of metallic nanoparticles with a Pd-Pd coordination number of 8.2 ± 0.5, it exhibits the low white line intensity typical of Pd foil rather than the higher intensity seen in single atoms or oxides. | Full points for noting that the nanoparticle sample will have a much lower white line intensity compared to oxidized species (PdO) or single-atom catalysts, which typically have higher white line intensities due to higher oxidation states. |
Review
Palladium Single-Atom (In)Stability Under Aqueous Reductive Conditions
BNL-NSLS-II-8-ID
Catalyst
Kali Rigby et al.
DOI: 10.1021/acs.est.3c03346
7 scenarios
▶
#519
Pd/TiO2
Pd K
▶
LLM Prompt
Sample Information
Material: Pd/TiO2
Support: TiO2
Sample-Specific Conditions
- Catalyst type: Single atom
- Pd single-atom catalyst on TiO2
Measurement
We plan to measure the Pd K XANES spectrum of this sample.
Questions
Based on all the information above:
1. Based on the synthesis method (electrostatic adsorption and UV-A photoreduction) for this single-atom catalyst, what is the expected dominant Pd phase and its oxidation state?
2. Describe the expected XANES spectral shape for this sample, specifically focusing on the white line intensity relative to standard Pd references.
3. Although the XANES white line intensity of this sample is similar to PdO, what structural feature distinguishes it from bulk PdO, and how is this confirmed spectroscopically?
4. What reference spectra would be most appropriate to use as a basis for comparing and determining the oxidation state of Pd in this sample?
Ground Truth
Material: Pd/TiO2
Measurement: Pd K-edge, fluorescence mode, Beamline 8-ID at NSLS-II
Fit method: qualitative comparison
Phase fractions: (±10%)
| Phase | Fraction |
|---|---|
| Pd single atoms (Pd-O) | 1.0 |
Fit basis (paper's reference spectra):
- PdO
- Pd foil
Source evidence: Figure 1b, Figure 1c, Page 9
Key reasoning: The white line intensity of Pd1/TiO2 in the XANES spectrum was near that of the PdO (Pd2+) reference, indicating positively charged Pd single-atoms. EXAFS analysis confirmed this by showing only first-shell Pd-O coordination (CN = 3.6) and an absence of the second-shell Pd-Pd interaction seen in bulk PdO.
Reasoning source: Results and Discussion, Catalyst synthesis and characterization, Page 9
Scoring Rubric (total: 100 pts)
| Q | Type | Max | Question | Reference Answer | Scoring Criteria |
|---|---|---|---|---|---|
| q1 | identification | 25 | Based on the synthesis method (electrostatic adsorption and UV-A photoreduction) for this single-atom catalyst, what is the expected dominant Pd phase and its oxidation state? | The expected dominant Pd phase is 100% Pd single atoms (Pd-O) with an oxidation state of Pd2+. Because the sample is specifically synthesized as a Pd single-atom catalyst supported on TiO2, the palladium exists entirely as isolated atoms rather than metallic nanoparticles. This isolated single-atom structure on the oxide support results in positively charged Pd species coordinated to oxygen, leading to the observed Pd2+ oxidation state. | Full credit for identifying Pd single atoms (or Pd-O species) as the dominant phase (fraction ~1.0) and stating the oxidation state is Pd2+. |
| q2 | spectral | 25 | Describe the expected XANES spectral shape for this sample, specifically focusing on the white line intensity relative to standard Pd references. | The expected XANES spectral shape for this sample features a strong white line intensity that is comparable to that of a PdO reference. This strong white line arises because the sample is a Pd single-atom catalyst supported on TiO2, which leaves the isolated palladium atoms in a positively charged, oxidized state (Pd2+). The direct coordination of these single atoms to the oxygen of the TiO2 support (Pd-O) produces this characteristic oxidized spectral signature, distinguishing it from metallic Pd. | Full credit for stating the XANES spectrum will exhibit a strong white line intensity that is near or comparable to that of a PdO (Pd2+) reference, and significantly higher than metallic Pd. |
| q3 | reasoning | 30 | Although the XANES white line intensity of this sample is similar to PdO, what structural feature distinguishes it from bulk PdO, and how is this confirmed spectroscopically? | The key structural feature that distinguishes this sample from bulk PdO is the complete absence of a second-shell Pd-Pd interaction. Because the sample is a Pd single-atom catalyst on a TiO2 support, the palladium exists as isolated atoms rather than forming a continuous bulk oxide lattice. This isolated nature is confirmed spectroscopically via EXAFS analysis, which shows only first-shell Pd-O coordination (with a coordination number of 3.6) and lacks the Pd-Pd scattering paths characteristic of bulk PdO. | Full credit for explaining that the sample consists of isolated single atoms lacking the second-shell Pd-Pd interaction present in bulk PdO, which is confirmed by EXAFS analysis showing only first-shell Pd-O coordination. |
| q4 | identification | 20 | What reference spectra would be most appropriate to use as a basis for comparing and determining the oxidation state of Pd in this sample? | The most appropriate reference spectra to use as a basis for qualitative comparison are PdO and Pd foil. Because the sample is a Pd single-atom catalyst supported on TiO2, it is necessary to evaluate its oxidation state against both a fully oxidized standard (Pd2+) and a fully metallic standard (Pd0). Comparing the sample to these references confirms that the isolated single atoms exhibit a strong white line intensity near that of PdO, verifying their positively charged Pd2+ state. | Full credit for identifying PdO (or a Pd2+ standard) and Pd foil (or a Pd0 standard) as the appropriate reference spectra. |
Review
#520
Pd/TiO2
Pd K
▶
LLM Prompt
Sample Information
Material: Pd/TiO2
Support: TiO2
Sample-Specific Conditions
- Catalyst type: Nanoparticle
- Pd nanoparticle catalyst on TiO2
Measurement
We plan to measure the Pd K XANES spectrum of this sample.
Questions
Based on all the information above:
1. Based on the sample conditions (Pd nanoparticles on TiO2), what is the dominant Pd phase and oxidation state expected in this catalyst? Explain the physical reasoning.
2. Describe the expected XANES spectral shape of this PdNP/TiO2 sample. How does its white line intensity compare to that of oxidized Pd species such as PdO or Pd single-atom catalysts?
3. To verify the phase purity of this sample using XANES analysis, what candidate reference spectra should be included in the basis set?
Ground Truth
Material: Pd/TiO2
Measurement: Pd K-edge XANES in fluorescence mode at Beamline 8-ID of NSLS-II
Fit method: Qualitative comparison and EXAFS fitting
Phase fractions: (±10%)
| Phase | Fraction |
|---|---|
| metallic_palladium | 1.0 |
Fit basis (paper's reference spectra):
- Pd foil
- PdO
Source evidence: Page 9, Figure 1b, Figure 1c
Key reasoning: The XANES white line intensity of PdNP/TiO2 appeared close to the metallic, zero-valent Pd foil reference. EXAFS analysis showed only Pd-Pd coordination with a coordination number of 11.4, similar to bulk Pd (12), confirming it consists of metallic Pd nanoparticles.
Reasoning source: Results and Discussion, Catalyst synthesis and characterization, Page 9
Scoring Rubric (total: 100 pts)
| Q | Type | Max | Question | Reference Answer | Scoring Criteria |
|---|---|---|---|---|---|
| q1 | identification | 35 | Based on the sample conditions (Pd nanoparticles on TiO2), what is the dominant Pd phase and oxidation state expected in this catalyst? Explain the physical reasoning. | The dominant phase in this Pd/TiO2 catalyst is metallic palladium (Pd0 nanoparticles) with an oxidation state of 0, comprising a fraction of 1.0. This phase is expected because the sample is synthesized as a Pd nanoparticle catalyst on a TiO2 support, which favors the formation of a zero-valent metallic structure rather than isolated ions. The physical reasoning is confirmed by the structural properties of the nanoparticles, which exhibit only Pd-Pd coordination with a coordination number of 11.4. This high coordination number is nearly identical to bulk metallic Pd (12), demonstrating that the nanoparticle conditions yield a fully metallic, unoxidized phase. | Full points for identifying metallic Pd (Pd0) as the dominant phase and explaining that nanoparticles typically exhibit bulk-like metallic properties with dominant Pd-Pd coordination. |
| q2 | spectral | 35 | Describe the expected XANES spectral shape of this PdNP/TiO2 sample. How does its white line intensity compare to that of oxidized Pd species such as PdO or Pd single-atom catalysts? | The expected Pd K-edge XANES spectrum for this sample closely matches the spectral shape of a metallic Pd foil reference, with an edge position at 24350 eV. Its white line intensity is significantly lower than that of oxidized Pd species, such as PdO or positively charged Pd single atoms (Pd1/TiO2). This occurs because the sample consists of zero-valent Pd nanoparticles on TiO2, which lack the electron depletion found in oxidized or single-atom states. The bulk-like Pd-Pd coordination (11.4) of these nanoparticles dictates this metallic electronic structure, resulting in the characteristic low white line intensity of zero-valent Pd. | Full points for stating the spectrum resembles metallic Pd foil and noting that it has a lower white line intensity compared to oxidized species like PdO or positively charged single atoms. |
| q3 | reasoning | 30 | To verify the phase purity of this sample using XANES analysis, what candidate reference spectra should be included in the basis set? | To verify the phase purity of this Pd/TiO2 nanoparticle sample, the candidate reference spectra in the basis set should include Pd foil and PdO. These references are chosen because the sample conditions involve Pd nanoparticles on TiO2, which are expected to be metallic but must be distinguished from oxidized species. The Pd foil reference represents the expected zero-valent metallic state driven by the nanoparticles' bulk-like Pd-Pd coordination (11.4). Meanwhile, the PdO reference is required to evaluate the white line intensity and definitively rule out any oxidation, confirming the sample is 100% metallic palladium. | Full points for mentioning metallic Pd (e.g., Pd foil) and an oxidized reference (e.g., PdO) to rule out oxidation. |
Review
#521
Pd/TiO2
Pd K
▶
LLM Prompt
Sample Information
Material: Pd/TiO2
Support: TiO2
Reaction Conditions: aqueous suspension, 10% H2/N2 bubbling
Sample-Specific Conditions
- Time of H2 bubbling: 0 min
- Pd single-atom catalyst in aqueous suspension at start of H2 bubbling
Measurement
We plan to measure the Pd K XANES spectrum of this sample.
Questions
Based on all the information above:
1. Identify the candidate phases or structural motifs that should be used as basis components to model the in situ XANES spectra of this Pd/TiO2 catalyst during H2 bubbling.
2. Estimate the phase fractions of the Pd species at the very beginning of the H2 bubbling process (t=0 min).
3. Explain the physical reasoning for the expected phase composition at the start of the in situ H2 treatment (t=0 min).
Ground Truth
Material: Pd/TiO2
Measurement: in situ Pd K-edge XANES in fluorescence mode at Beamline 8-ID (NSLS-II)
Fit method: Multivariate curve resolution (MCR) and Singular value decomposition (SVD)
Phase fractions: (±10%)
| Phase | Fraction |
|---|---|
| Pd single atoms (Pd-O) | 0.85 |
| Pd clusters (Pd-Pd) | 0.15 |
Fit basis (paper's reference spectra):
- Pd-O (Pd single-atoms)
- Pd-Pd (Pd clusters)
Source evidence: Figure 4c, page 18
Key reasoning: At the start of the in situ measurement (t=0 min), the catalyst is predominantly in its initial single-atom state, characterized by Pd-O bonding. The introduction of H2 gas initiates the reduction of these single atoms into zero-valent Pd clusters (Pd-Pd). The small fraction of Pd-Pd at t=0 reflects the very beginning of this transformation or the baseline resolution of the MCR analysis.
Reasoning source: Results and Discussion, page 16
Scoring Rubric (total: 100 pts)
| Q | Type | Max | Question | Reference Answer | Scoring Criteria |
|---|---|---|---|---|---|
| q1 | identification | 30 | Identify the candidate phases or structural motifs that should be used as basis components to model the in situ XANES spectra of this Pd/TiO2 catalyst during H2 bubbling. | The candidate structural motifs to model the in situ Pd K-edge XANES spectra are Pd-O (representing Pd single-atoms) and Pd-Pd (representing Pd clusters). These specific phases are expected because the sample begins as a Pd single-atom catalyst supported on TiO2 in an aqueous suspension, which is characterized by initial Pd-O bonding. The introduction of 10% H2/N2 bubbling acts as a reducing agent that initiates the transformation of these single atoms into zero-valent Pd clusters. Consequently, the fitting basis must capture both the initial oxidized single-atom state and the emerging reduced metallic state driven by the H2 reaction conditions. | Full credit for identifying Pd single atoms (Pd-O) and Pd clusters (Pd-Pd) as the two necessary components. |
| q2 | quantification | 30 | Estimate the phase fractions of the Pd species at the very beginning of the H2 bubbling process (t=0 min). | At the very beginning of the H2 bubbling process (t=0 min), the estimated phase fractions are 85% Pd single atoms (Pd-O) and 15% Pd clusters (Pd-Pd), with an uncertainty of 10%. These specific values arise because the Pd/TiO2 catalyst in the aqueous suspension is predominantly in its initial, unreduced single-atom state at the start of the experiment. The small 15% fraction of Pd-Pd clusters at t=0 min reflects the very beginning of the reduction transformation initiated by the 10% H2/N2 gas. Additionally, this minor cluster fraction may represent the baseline resolution of the multivariate curve resolution (MCR) analysis used to fit the data. | Full credit for estimating ~85% Pd single atoms (Pd-O) and ~15% Pd clusters (Pd-Pd). Partial credit for identifying that Pd single atoms are the dominant majority phase (>80%). |
| q3 | reasoning | 40 | Explain the physical reasoning for the expected phase composition at the start of the in situ H2 treatment (t=0 min). | At the start of the in situ measurement (t=0 min), the Pd/TiO2 catalyst in aqueous suspension is expected to be composed of 85% Pd-O single atoms and 15% Pd-Pd clusters. This composition arises because the material is initially prepared as a Pd single-atom catalyst, meaning it is predominantly in an oxidized state characterized by Pd-O bonding with the TiO2 support. The introduction of 10% H2/N2 bubbling provides the reducing environment necessary to drive the transformation of these single atoms into zero-valent Pd clusters. The small 15% fraction of Pd-Pd observed at t=0 min captures the very onset of this H2-induced reduction process, or it reflects the baseline resolution limits of the MCR spectral fitting method. | Full credit for explaining that the catalyst is initially synthesized as single atoms (Pd-O) and that at t=0, the reduction by H2 has just begun, leaving the catalyst predominantly in its initial oxidized single-atom state with only a minor fraction of newly formed or baseline Pd-Pd clusters. |
Review
#522
Pd/TiO2
Pd K
▶
LLM Prompt
Sample Information
Material: Pd/TiO2
Support: TiO2
Reaction Conditions: aqueous suspension, 10% H2/N2 bubbling
Sample-Specific Conditions
- Time of H2 bubbling: 10 min
- Pd single-atom catalyst in aqueous suspension after 10 min H2 bubbling
Measurement
We plan to measure the Pd K XANES spectrum of this sample.
Questions
Based on all the information above:
1. Based on the reaction conditions (10 min of 10% H2/N2 bubbling in aqueous suspension), what are the expected Pd phases present in the sample, and what are their estimated fractions?
2. What basis functions or reference spectra are required to model the time-resolved XANES data for this sample during the H2 bubbling process?
3. Explain the physical reasoning for the observed phase composition (coexistence of single atoms and clusters) at this specific time point (10 minutes).
Ground Truth
Material: Pd/TiO2
Measurement: Pd K-edge, in situ fluorescence mode, Beamline 8-ID at NSLS-II
Fit method: Multivariate curve resolution (MCR) and Singular value decomposition (SVD)
Phase fractions: (±15%)
| Phase | Fraction |
|---|---|
| Pd single atoms (Pd-O) | 0.65 |
| Pd clusters (Pd-Pd) | 0.35 |
Fit basis (paper's reference spectra):
- Pd-O (Pd single-atoms)
- Pd-Pd (Pd clusters)
Source evidence: Figure 4c, page 18
Key reasoning: Introducing 10% H2 to the Pd1/TiO2 suspension leads to a reduction in oxidation state toward zero-valent clusters. SVD and MCR analysis of the time-resolved in situ XANES spectra resolved two components: Pd-O (single atoms) and Pd-Pd (clusters). As the time of H2 bubbling increases, the fraction of Pd-O decreases and the Pd-Pd fraction increases, indicating the dynamic transformation of single atoms into clusters. At 10 minutes of 10% H2 bubbling, the conversion is partially complete, with a majority of single atoms still present alongside newly formed clusters.
Reasoning source: Page 16, Results and Discussion section
Scoring Rubric (total: 100 pts)
| Q | Type | Max | Question | Reference Answer | Scoring Criteria |
|---|---|---|---|---|---|
| q1 | quantification | 40 | Based on the reaction conditions (10 min of 10% H2/N2 bubbling in aqueous suspension), what are the expected Pd phases present in the sample, and what are their estimated fractions? | The expected phases in the sample are Pd single atoms (Pd-O) at an estimated fraction of 0.65 and Pd clusters (Pd-Pd) at a fraction of 0.35, with an uncertainty of 15%. These specific fractions arise because introducing 10% H2/N2 bubbling to the aqueous suspension acts as a reducing environment that drives a dynamic transformation of the initial Pd single-atom catalyst. The hydrogen reduces the Pd oxidation state toward zero-valent clusters over time. At exactly 10 minutes of H2 bubbling, this conversion is only partially complete, resulting in a state where the majority of the original Pd-O single atoms still remain alongside the newly formed Pd-Pd clusters. | Full points for identifying Pd single atoms (Pd-O) and Pd clusters (Pd-Pd) and estimating their fractions near 65% and 35%, respectively. Partial credit for identifying the correct phases without accurate fractions. |
| q2 | identification | 30 | What basis functions or reference spectra are required to model the time-resolved XANES data for this sample during the H2 bubbling process? | To model the time-resolved XANES data using Multivariate Curve Resolution (MCR) and Singular Value Decomposition (SVD), the required basis functions are Pd-O (representing Pd single-atoms) and Pd-Pd (representing Pd clusters). These specific references are necessary because the sample undergoes a dynamic structural and electronic transformation when exposed to the 10% H2/N2 bubbling in the aqueous suspension. The introduction of H2 gas reduces the initial Pd single atoms, causing them to progressively aggregate into zero-valent clusters. Because the 10-minute reaction time captures a partially complete conversion, both the initial Pd-O state and the newly formed Pd-Pd state must be included to accurately fit the coexisting phases in the spectra. | Full points for stating that the spectra can be modeled using two components: Pd-O (representing Pd single-atoms) and Pd-Pd (representing Pd clusters). |
| q3 | reasoning | 30 | Explain the physical reasoning for the observed phase composition (coexistence of single atoms and clusters) at this specific time point (10 minutes). | The coexistence of Pd single atoms (65%) and Pd clusters (35%) at the 10-minute mark is the direct result of an ongoing, time-dependent reduction process. When the initial Pd1/TiO2 single-atom catalyst is suspended in water and subjected to 10% H2/N2 bubbling, the hydrogen reduces the oxidation state of the palladium toward zero-valent clusters. As the duration of H2 bubbling increases, the fraction of Pd-O single atoms dynamically decreases while the Pd-Pd cluster fraction increases. At the specific time point of 10 minutes, this dynamic transformation is only partially complete, leaving a majority of the single atoms intact while a significant portion has already converted into newly formed clusters. | Full points for explaining that H2 exposure induces the reduction and aggregation of Pd single atoms into clusters, and that at 10 minutes, this dynamic transformation is partially complete, resulting in a mixture of both species. |
Review
#523
Pd/TiO2
Pd K
▶
LLM Prompt
Sample Information
Material: Pd/TiO2
Support: TiO2
Reaction Conditions: aqueous suspension, 10% H2/N2 bubbling
Sample-Specific Conditions
- Time of H2 bubbling: 12.5 min
- Pd single-atom catalyst in aqueous suspension after 12.5 min H2 bubbling
Measurement
We plan to measure the Pd K XANES spectrum of this sample.
Questions
Based on all the information above:
1. Based on the reaction conditions (12.5 min of 10% H2 bubbling in aqueous suspension), what are the expected Pd phases or structural motifs present in the sample, and what reference components would be needed to model its XANES spectrum?
2. Estimate the relative fractions of the identified Pd phases in this sample after 12.5 minutes of H2 bubbling.
3. Explain the physical and chemical reasoning for the observed phase composition at this specific time point during the in situ H2 treatment.
Ground Truth
Material: Pd/TiO2
Measurement: Pd K-edge, in-situ fluorescence mode, Beamline 8-ID (ISS) at NSLS-II
Fit method: Multivariate curve resolution (MCR) and Singular value decomposition (SVD)
Phase fractions: (±10%)
| Phase | Fraction |
|---|---|
| Pd single atoms (Pd-O) | 0.5 |
| Pd clusters (Pd-Pd) | 0.5 |
Fit basis (paper's reference spectra):
- Pd-O (Pd single-atoms)
- Pd-Pd (Pd clusters)
Source evidence: Figure 4c, page 18
Key reasoning: In situ XANES monitoring of Pd1/TiO2 during 10% H2 bubbling reveals a dynamic transformation from single-atoms to clusters. SVD and MCR analysis resolved two principal components corresponding to Pd-O (single-atoms) and Pd-Pd (clusters). The temporal concentration profile shows that as H2 bubbling time increases, the Pd-O fraction decreases and the Pd-Pd fraction increases, crossing at approximately 12.5 minutes where both fractions are ~0.5. This indicates the progressive reduction and aggregation of Pd species toward zero-valent clusters upon exposure to H2.
Reasoning source: Results and Discussion, page 16; Figure 4c
Scoring Rubric (total: 100 pts)
| Q | Type | Max | Question | Reference Answer | Scoring Criteria |
|---|---|---|---|---|---|
| q1 | identification | 30 | Based on the reaction conditions (12.5 min of 10% H2 bubbling in aqueous suspension), what are the expected Pd phases or structural motifs present in the sample, and what reference components would be needed to model its XANES spectrum? | The expected structural motifs in the sample are Pd single-atoms and Pd clusters. To model its XANES spectrum, the required reference components are Pd-O (representing the Pd single-atoms) and Pd-Pd (representing the Pd clusters). These specific phases are expected because the initial Pd single-atom catalyst undergoes a dynamic transformation when exposed to the 10% H2/N2 bubbling in the aqueous suspension. The H2 treatment drives the progressive reduction and aggregation of the oxidized Pd species toward zero-valent clusters, resulting in a mixture of both single-atom and cluster motifs at this intermediate time point. | Full points for identifying Pd single atoms (characterized by Pd-O bonds) and Pd clusters (characterized by Pd-Pd bonds) as the two necessary components. |
| q2 | quantification | 30 | Estimate the relative fractions of the identified Pd phases in this sample after 12.5 minutes of H2 bubbling. | After 12.5 minutes of 10% H2 bubbling, the sample consists of approximately 0.5 (50%) Pd single-atoms (Pd-O) and 0.5 (50%) Pd clusters (Pd-Pd), with an uncertainty of 10%. These specific values result from the temporal dynamics of the catalyst's transformation under the reducing conditions. As the H2 bubbling time increases, the initial Pd-O fraction steadily decreases while the Pd-Pd fraction increases due to progressive reduction and aggregation. The 12.5-minute mark represents the exact crossing point in this temporal concentration profile, where the conversion of single atoms to zero-valent clusters is halfway complete. | Full points for estimating approximately 50% Pd single atoms (Pd-O) and 50% Pd clusters (Pd-Pd). |
| q3 | reasoning | 40 | Explain the physical and chemical reasoning for the observed phase composition at this specific time point during the in situ H2 treatment. | The observed 50/50 phase composition of Pd single-atoms and Pd clusters arises from the progressive reduction and aggregation of the initial Pd1/TiO2 catalyst. When the aqueous suspension is exposed to 10% H2 bubbling, the hydrogen acts as a reducing agent, driving the dynamic transformation of oxidized Pd-O single atoms into zero-valent Pd-Pd clusters. Singular value decomposition (SVD) and multivariate curve resolution (MCR) of the in situ XANES data track this process over time. At exactly 12.5 minutes of H2 exposure, the temporal concentration profile reaches a crossing point. This indicates that the reduction and subsequent aggregation mechanism has converted exactly half of the initial single-atom species into metallic clusters. | Full points for explaining that H2 exposure causes a dynamic transformation (reduction and aggregation) from Pd single-atoms to zero-valent Pd clusters, and that 12.5 minutes represents the midpoint of this transition under 10% H2 conditions where the two species coexist in equal amounts. |
Review
#524
Pd/TiO2
Pd K
▶
LLM Prompt
Sample Information
Material: Pd/TiO2
Support: TiO2
Reaction Conditions: aqueous suspension, 10% H2/N2 bubbling
Sample-Specific Conditions
- Time of H2 bubbling: 15 min
- Pd single-atom catalyst in aqueous suspension after 15 min H2 bubbling
Measurement
We plan to measure the Pd K XANES spectrum of this sample.
Questions
Based on all the information above:
1. What candidate reference spectra or pure components are needed to model the XANES data for this sample during the H2 bubbling process?
2. Estimate the relative phase fractions of the Pd species present in the catalyst after 15 minutes of 10% H2 bubbling.
3. Explain the physical and chemical reasons why the initial Pd single-atom configuration transforms under these aqueous reductive conditions.
Ground Truth
Material: Pd/TiO2
Measurement: Pd K-edge in-situ fluorescence XAS at Beamline 8-ID (NSLS-II)
Fit method: Multivariate curve resolution (MCR) and Singular value decomposition (SVD)
Phase fractions: (±15%)
| Phase | Fraction |
|---|---|
| Pd single atoms (Pd-O) | 0.2 |
| Pd clusters (Pd-Pd) | 0.8 |
Fit basis (paper's reference spectra):
- Pd-O (Pd single-atoms)
- Pd-Pd (Pd clusters)
Source evidence: Figure 4c, page 18
Key reasoning: Introducing 10% H2 to the Pd1/TiO2 aqueous suspension reduces the Pd oxidation state toward zero-valent clusters. The presence of H2 weakens the interaction between the Pd single-atoms and the TiO2 support, promoting their aggregation to lower the surface free energy of the system. After 15 minutes of bubbling, the conversion is well underway, with the majority of the single-atoms having aggregated into small, coordinatively unsaturated Pd clusters.
Reasoning source: Results and Discussion, pages 16-17
Scoring Rubric (total: 100 pts)
| Q | Type | Max | Question | Reference Answer | Scoring Criteria |
|---|---|---|---|---|---|
| q1 | identification | 30 | What candidate reference spectra or pure components are needed to model the XANES data for this sample during the H2 bubbling process? | To model the XANES data for this sample, two pure components are needed: Pd-O (representing Pd single-atoms) and Pd-Pd (representing Pd clusters). These specific reference phases are required because the initial sample is a Pd single-atom catalyst supported on TiO2 in an aqueous suspension. Upon introducing 10% H2 gas, the reductive environment weakens the interaction between the Pd single-atoms and the TiO2 support, reducing the Pd oxidation state toward zero-valent clusters. This causes the single atoms to aggregate to lower the surface free energy, meaning both the initial single-atom (Pd-O) and newly formed cluster (Pd-Pd) states must be included to accurately fit the data. | Full points for identifying two main components: Pd single-atoms (or Pd-O species) and Pd clusters (or Pd-Pd species). |
| q2 | quantification | 30 | Estimate the relative phase fractions of the Pd species present in the catalyst after 15 minutes of 10% H2 bubbling. | After 15 minutes of 10% H2 bubbling, the relative phase fractions are estimated to be 0.2 (20%) Pd single atoms (Pd-O) and 0.8 (80%) Pd clusters (Pd-Pd), with an uncertainty of 15%. These specific values arise because the 10% H2 gas in the aqueous suspension actively reduces the Pd oxidation state and weakens the bonds between the Pd atoms and the TiO2 support. This promotes aggregation to lower the system's surface free energy. By the 15-minute mark, this conversion is well underway, resulting in the majority of the initial single-atoms having already aggregated into small, coordinatively unsaturated Pd clusters, leaving only a 20% fraction of the original single-atom state. | Full points for estimating approximately 20% Pd single-atoms (Pd-O) and 80% Pd clusters (Pd-Pd). Partial credit if the correct dominant phase (clusters) is identified but the values are slightly off. |
| q3 | reasoning | 40 | Explain the physical and chemical reasons why the initial Pd single-atom configuration transforms under these aqueous reductive conditions. | The transformation of the initial Pd single-atom configuration is primarily driven by the introduction of 10% H2 gas into the aqueous suspension. This reductive environment chemically reduces the Pd oxidation state toward zero-valent clusters. Physically, the presence of H2 weakens the stabilizing interaction between the Pd single-atoms and the TiO2 support. As a result, the single atoms become mobile and aggregate into small, coordinatively unsaturated Pd clusters, which is a thermodynamically favorable process that lowers the overall surface free energy of the system. | Full points for explaining that H2 exposure reduces the Pd oxidation state and weakens the interaction between the Pd atoms and the TiO2 support, which promotes their aggregation into clusters to lower the system's surface free energy. |
Review
#525
Pd/TiO2
Pd K
▶
LLM Prompt
Sample Information
Material: Pd/TiO2
Support: TiO2
Reaction Conditions: aqueous suspension, 10% H2/N2 bubbling
Sample-Specific Conditions
- Time of H2 bubbling: 20 min
- Pd single-atom catalyst in aqueous suspension after 20 min H2 bubbling
Measurement
We plan to measure the Pd K XANES spectrum of this sample.
Questions
Based on all the information above:
1. Based on the reaction conditions (aqueous suspension, 10% H2/N2 bubbling for 20 min), identify the expected Pd phases and estimate their relative fractions.
2. What basis components or reference spectra are required to model the in situ XANES data for this sample?
3. Explain the physical mechanism driving the transformation of the initial Pd species under these specific reaction conditions.
Ground Truth
Material: Pd/TiO2
Measurement: Pd K-edge, in situ fluorescence mode, Beamline 8-ID (NSLS-II)
Fit method: Multivariate curve resolution (MCR) following Singular value decomposition (SVD)
Phase fractions: (±10%)
| Phase | Fraction |
|---|---|
| Pd single atoms (Pd-O) | 0.1 |
| Pd clusters (Pd-Pd) | 0.9 |
Fit basis (paper's reference spectra):
- Pd-O (Pd single-atoms)
- Pd-Pd (Pd clusters)
Source evidence: Figure 4c, page 18
Key reasoning: Introducing 10% H2 to the Pd1/TiO2 suspension leads to a reduction in the oxidation state toward zero-valent clusters. As the time of H2 bubbling increases to 20 minutes, the fraction of Pd-O (single atoms) decreases to ~10% while the Pd-Pd (clusters) fraction increases to ~90%. The presence of H2 weakens the interaction between the Pd single atoms and the TiO2 support, promoting aggregation into clusters, though overreduction into crystalline Pd nanoparticles does not occur.
Reasoning source: Results and Discussion, pages 16-17
Scoring Rubric (total: 100 pts)
| Q | Type | Max | Question | Reference Answer | Scoring Criteria |
|---|---|---|---|---|---|
| q1 | quantification | 40 | Based on the reaction conditions (aqueous suspension, 10% H2/N2 bubbling for 20 min), identify the expected Pd phases and estimate their relative fractions. | Under the specified conditions, the expected Pd phases are Pd clusters (Pd-Pd) at a relative fraction of 0.9 (90%) and Pd single atoms (Pd-O) at a fraction of 0.1 (10%), with a 10% uncertainty. These specific fractions arise because the 10% H2/N2 bubbling acts as a reducing agent in the aqueous suspension over the 20-minute period. The presence of H2 weakens the interaction between the initial Pd single atoms and the TiO2 support, promoting their aggregation into zero-valent clusters without causing overreduction into crystalline Pd nanoparticles. | Full points if the answer identifies Pd single atoms (Pd-O) and Pd clusters (Pd-Pd) with fractions of ~0.1 and ~0.9, respectively. Deduct points for missing phases or significantly inaccurate fraction estimates (>20% deviation). |
| q2 | identification | 30 | What basis components or reference spectra are required to model the in situ XANES data for this sample? | To model the in situ Pd K-edge XANES data, the required basis components are Pd-O (representing Pd single-atoms) and Pd-Pd (representing Pd clusters). These specific references are necessary because the sample conditions dictate a transition from an initial single-atom state to an aggregated state. Specifically, bubbling 10% H2 through the aqueous suspension for 20 minutes weakens the interaction between the Pd single atoms and the TiO2 support, causing them to partially reduce and aggregate into zero-valent clusters, meaning both structural phases are present in the measured sample. | Full points if the answer specifies components representing Pd-O (Pd single-atoms) and Pd-Pd (Pd clusters). Deduct points if bulk Pd foil or crystalline Pd nanoparticles are incorrectly suggested as the primary reduced component, as the paper specifies amorphous clusters. |
| q3 | reasoning | 30 | Explain the physical mechanism driving the transformation of the initial Pd species under these specific reaction conditions. | The physical mechanism driving the transformation is the reduction of the Pd oxidation state toward zero-valent clusters caused by the 10% H2/N2 bubbling. In the aqueous suspension, the presence of H2 weakens the interaction between the initial Pd single atoms and the TiO2 support. Over the 20-minute reaction time, this weakened interaction promotes the aggregation of the single atoms (Pd-O) into Pd clusters (Pd-Pd), resulting in a final mixture of 90% clusters and 10% single atoms. Notably, this mechanism drives aggregation but does not lead to overreduction into crystalline Pd nanoparticles. | Full points if the answer explains that H2 exposure weakens the interaction between Pd single atoms and the TiO2 support, leading to surface migration and aggregation into coordinatively unsaturated Pd clusters, without overreducing into crystalline nanoparticles. |
Review
Phosphorus Interactions with Iron in Undisturbed and Disturbed Arctic Tundra Ecosystems
APS
Environmental
Matthew John Berens et al.
DOI: 10.1021/acs.est.3c09072
11 scenarios
▶
#526
sediment
Fe K-edge
▶
LLM Prompt
Sample Information
Material: sediment
Sample Origin: Lake 89, Toolik region, Alaska North Slope
Sample-Specific Conditions
- Disturbance type: Retrogressive thaw slump
- Retrogressive thaw slump mud slurry
Measurement
We plan to measure the Fe K-edge XANES spectrum of this sample.
Questions
Based on all the information above:
1. Based on the sample conditions (retrogressive thaw slump mud slurry from a thawing front), what candidate reference spectra (basis functions) are needed to model the Fe K-edge XANES spectrum of this sediment?
2. Estimate the relative phase fractions of the primary Fe species in this retrogressive thaw slump sediment sample.
3. Explain the physical and environmental reasoning for why Fe(II)-bearing clays dominate this sample, alongside a significant fraction of SRO Fe(III) oxyhydroxides, given its origin as a natural disturbance event (thawing front).
Ground Truth
Material: sediment
Measurement: Fe K-edge XANES
Fit method: LCF
Phase fractions: (±10%)
| Phase | Fraction |
|---|---|
| Fe(II)-bearing clays | 0.45 |
| SRO Fe(III) oxyhydroxides | 0.31 |
| organic-bound Fe(III) | 0.09 |
Fit basis (paper's reference spectra):
- Fe(II)-bearing clays
- SRO Fe(III) oxyhydroxides
- organic-bound Fe(III)
Source evidence: text/figure_3
Key reasoning: The sample originates from a retrogressive thaw slump mud slurry, representing a natural disturbance event at a thawing front. The composition is dominated by Fe(II)-bearing clays (45%), reflecting the exposure of unweathered or less-weathered parent material by the slump. The significant presence of short-range-ordered (SRO) Fe(III) oxyhydroxides (31%) and organic-bound Fe(III) (9%) indicates active weathering and redox cycling as the thawing front exposes the sediment to new environmental conditions.
Reasoning source: text/figure_3
Scoring Rubric (total: 100 pts)
| Q | Type | Max | Question | Reference Answer | Scoring Criteria |
|---|---|---|---|---|---|
| q1 | identification | 20 | Based on the sample conditions (retrogressive thaw slump mud slurry from a thawing front), what candidate reference spectra (basis functions) are needed to model the Fe K-edge XANES spectrum of this sediment? | To model the Fe K-edge XANES spectrum of this sediment, the required candidate reference spectra are Fe(II)-bearing clays, short-range-ordered (SRO) Fe(III) oxyhydroxides, and organic-bound Fe(III). These specific phases are expected because the sample originates from a retrogressive thaw slump mud slurry, which acts as a natural disturbance event at a thawing front. The slump physically exposes unweathered or less-weathered parent material, accounting for the presence of the Fe(II)-bearing clays. Simultaneously, the exposure of this sediment to new environmental conditions at the thawing front drives active weathering and redox cycling, which produces the SRO Fe(III) oxyhydroxides and organic-bound Fe(III) phases. | Full points for identifying Fe(II)-bearing clays, SRO Fe(III) oxyhydroxides, and organic-bound Fe(III) as the necessary reference spectra. |
| q2 | quantification | 40 | Estimate the relative phase fractions of the primary Fe species in this retrogressive thaw slump sediment sample. | The relative phase fractions for this sediment sample are estimated to be 45% Fe(II)-bearing clays, 31% SRO Fe(III) oxyhydroxides, and 9% organic-bound Fe(III), with an uncertainty of 10%. These specific values result directly from the sample's origin as a retrogressive thaw slump mud slurry. The dominant 45% fraction of Fe(II)-bearing clays reflects the large-scale exposure of unweathered or less-weathered parent material caused by the slump disturbance. The significant secondary fractions of SRO Fe(III) oxyhydroxides (31%) and organic-bound Fe(III) (9%) arise because the thawing front exposes this parent material to new environmental conditions, initiating active weathering and redox cycling. | Full points for estimating Fe(II)-bearing clays at ~45%, SRO Fe(III) oxyhydroxides at ~31%, and organic-bound Fe(III) at ~9%. Partial credit for being within ±10% of the target values. |
| q3 | reasoning | 40 | Explain the physical and environmental reasoning for why Fe(II)-bearing clays dominate this sample, alongside a significant fraction of SRO Fe(III) oxyhydroxides, given its origin as a natural disturbance event (thawing front). | The dominance of Fe(II)-bearing clays (45%) alongside a significant fraction of SRO Fe(III) oxyhydroxides (31%) and organic-bound Fe(III) (9%) is directly tied to the sample's origin as a retrogressive thaw slump mud slurry. This natural disturbance event at the thawing front physically exposes deep, unweathered or less-weathered parent material to the surface, which explains the high retention of primary Fe(II)-bearing clays. Once exposed to new surface environmental conditions, this previously frozen sediment undergoes active weathering and redox cycling. This rapid environmental shift and subsequent oxidation mechanism drive the formation of the secondary SRO Fe(III) oxyhydroxides and organic-bound Fe(III) phases observed in the sample. | Full points for connecting the dominance of Fe(II)-bearing clays to the exposure of unweathered parent material by the slump, and linking the SRO Fe(III) oxyhydroxides/organic-bound Fe to active weathering/redox cycling at the thawing front. |
Review
#527
sediment
Fe K-edge
▶
LLM Prompt
Sample Information
Material: sediment
Sample Origin: Wolverine, Toolik region, Alaska North Slope
Sample-Specific Conditions
- Disturbance type: Retrogressive thaw slump
- Retrogressive thaw slump mud slurry
Measurement
We plan to measure the Fe K-edge XANES spectrum of this sample.
Questions
Based on all the information above:
1. Based on the environmental conditions of a retrogressive thaw slump mud slurry, what candidate reference spectra are needed to model the Fe K-edge XANES spectrum using Linear Combination Fitting?
2. Estimate the relative phase fractions of the iron species in this sediment sample located 5 m from the thaw slump headwall.
3. Explain the physical reasoning for the expected iron phase composition in this natural disturbance event (thawing front).
Ground Truth
Material: sediment
Measurement: Fe K-edge XANES
Fit method: LCF
Phase fractions: (±10%)
| Phase | Fraction |
|---|---|
| SRO Fe(III) oxyhydroxides | 0.52 |
| Fe(II)-bearing clays | 0.17 |
| organic-bound Fe(III) | 0.17 |
Fit basis (paper's reference spectra):
- SRO Fe(III) oxyhydroxides
- Fe(II)-bearing clays
- organic-bound Fe(III)
Source evidence: text/figure_3
Key reasoning: The sample is a retrogressive thaw slump mud slurry resulting from a natural disturbance event at a thawing front. In this disturbed permafrost environment, the iron speciation is dominated by short-range ordered (SRO) Fe(III) oxyhydroxides, indicating significant oxidation. Secondary contributions come from Fe(II)-bearing clays and organic-bound Fe(III), reflecting the mixed mineralogical and organic components of the thawing sediment.
Reasoning source: Sample metadata and text/figure_3
Scoring Rubric (total: 100 pts)
| Q | Type | Max | Question | Reference Answer | Scoring Criteria |
|---|---|---|---|---|---|
| q1 | identification | 30 | Based on the environmental conditions of a retrogressive thaw slump mud slurry, what candidate reference spectra are needed to model the Fe K-edge XANES spectrum using Linear Combination Fitting? | To model the Fe K-edge XANES spectrum of this sediment using Linear Combination Fitting, the required reference spectra are short-range ordered (SRO) Fe(III) oxyhydroxides, Fe(II)-bearing clays, and organic-bound Fe(III). These specific phases are expected because the sample is a retrogressive thaw slump mud slurry originating from a disturbed permafrost environment at a thawing front. The natural disturbance event causes significant oxidation, which leads to the formation of SRO Fe(III) oxyhydroxides. Furthermore, the mixed mineralogical and organic components inherent to the thawing sediment necessitate the inclusion of Fe(II)-bearing clays and organic-bound Fe(III) references. | Full points for identifying SRO Fe(III) oxyhydroxides, Fe(II)-bearing clays, and organic-bound Fe(III) as the necessary reference spectra. |
| q2 | quantification | 40 | Estimate the relative phase fractions of the iron species in this sediment sample located 5 m from the thaw slump headwall. | The estimated relative phase fractions for this sediment sample are 0.52 for SRO Fe(III) oxyhydroxides, 0.17 for Fe(II)-bearing clays, and 0.17 for organic-bound Fe(III), with an uncertainty of 10%. These specific values result directly from the environmental conditions of the retrogressive thaw slump mud slurry. The dominant fraction of SRO Fe(III) oxyhydroxides (52%) arises because the disturbed permafrost environment at the thawing front promotes significant oxidation of the sediment. The secondary fractions (17% each) reflect the remaining mixed mineralogical and organic components that are characteristic of this thawing Alaskan North Slope sediment. | Full points for estimating ~52% SRO Fe(III) oxyhydroxides, ~17% Fe(II)-bearing clays, and ~17% organic-bound Fe(III). |
| q3 | reasoning | 30 | Explain the physical reasoning for the expected iron phase composition in this natural disturbance event (thawing front). | The expected iron phase composition in this natural disturbance event is driven by the environmental conditions of the retrogressive thaw slump mud slurry. As the permafrost thaws at the disturbance front, the sediment is exposed to significant oxidation. This oxidation mechanism results in an iron speciation that is heavily dominated by short-range ordered (SRO) Fe(III) oxyhydroxides. Additionally, the inherent composition of the thawing sediment includes mixed mineralogical and organic materials, which leads to the secondary preservation and presence of Fe(II)-bearing clays and organic-bound Fe(III). | Full points for connecting the thawing front/disturbance event to the dominance of oxidized SRO Fe(III) oxyhydroxides and the presence of Fe(II)-bearing clays and organic-bound Fe(III). |
Review
#528
biogenic mat
Fe K-edge
▶
LLM Prompt
Sample Information
Material: biogenic mat
Sample Origin: Toolik region, Alaska North Slope
Sample-Specific Conditions
- Habitat type: Submerged vegetation
- Biogenic Fe mats associated with submerged vegetation
Measurement
We plan to measure the Fe K-edge XANES spectrum of this sample.
Questions
Based on all the information above:
1. What candidate reference spectra or structural motifs should be included in the basis set to model the Fe K-edge XANES spectrum of this submerged biogenic mat?
2. Based on the sample conditions (submerged vegetation in saturated wet sedge meadows), estimate the phase fraction of the dominant Fe species.
3. Explain why short-range ordered (SRO) Fe(III) oxyhydroxides are the dominant phase in this specific environment.
Ground Truth
Material: biogenic mat
Measurement: Fe K-edge XANES
Fit method: LCF
Phase fractions: (±10%)
| Phase | Fraction |
|---|---|
| SRO Fe(III) oxyhydroxides | 0.73 |
Fit basis (paper's reference spectra):
- SRO Fe(III) oxyhydroxides
Source evidence: text/figure_3
Key reasoning: In saturated wet sedge meadows, biogenic Fe mats associated with submerged vegetation are predominantly composed of short-range ordered (SRO) Fe(III) oxyhydroxides. The submerged, undisturbed environmental conditions of these habitats favor the formation and persistence of these poorly crystalline Fe(III) phases.
Reasoning source: text/figure_3
Scoring Rubric (total: 100 pts)
| Q | Type | Max | Question | Reference Answer | Scoring Criteria |
|---|---|---|---|---|---|
| q1 | identification | 30 | What candidate reference spectra or structural motifs should be included in the basis set to model the Fe K-edge XANES spectrum of this submerged biogenic mat? | To model the Fe K-edge XANES spectrum of this biogenic mat, the basis set should include short-range ordered (SRO) Fe(III) oxyhydroxides. This specific phase is expected because the sample originates from biogenic Fe mats associated with submerged vegetation in saturated wet sedge meadows of the Toolik region. The submerged and undisturbed environmental conditions of this specific habitat heavily favor the formation and persistence of these poorly crystalline Fe(III) phases. Consequently, SRO Fe(III) oxyhydroxides serve as the primary structural motif required to accurately fit the spectral data for this environmental sample. | Full points for identifying SRO Fe(III) oxyhydroxides as the primary necessary reference phase. |
| q2 | quantification | 30 | Based on the sample conditions (submerged vegetation in saturated wet sedge meadows), estimate the phase fraction of the dominant Fe species. | The dominant Fe species in this sample is estimated to be short-range ordered (SRO) Fe(III) oxyhydroxides, comprising approximately 73% (±10% uncertainty) of the total iron. This specific high phase fraction results directly from the environmental conditions of the biogenic mats associated with submerged vegetation in the Toolik region. Specifically, the saturated, submerged, and undisturbed nature of these wet sedge meadows creates a stable habitat that favors the formation and persistence of poorly crystalline Fe(III) phases. Because these undisturbed conditions prevent further crystallization, SRO Fe(III) oxyhydroxides accumulate to form the vast majority of the iron present in the mat. | Full points for estimating the SRO Fe(III) oxyhydroxides fraction at approximately 73% (0.73), with partial credit for estimates within ±10%. |
| q3 | reasoning | 40 | Explain why short-range ordered (SRO) Fe(III) oxyhydroxides are the dominant phase in this specific environment. | Short-range ordered (SRO) Fe(III) oxyhydroxides dominate this environment due to the specific hydrological and ecological conditions of the habitat. The sample consists of biogenic Fe mats associated with submerged vegetation in saturated wet sedge meadows of the Toolik region, Alaska. These submerged, undisturbed environmental conditions restrict extensive crystallization processes that would otherwise form more highly ordered iron minerals. As a result, the environment strongly favors the initial formation and long-term persistence of poorly crystalline Fe(III) phases. This mechanism ultimately leads to SRO Fe(III) oxyhydroxides becoming the predominant iron species, accounting for roughly 73% of the sample. | Full points for connecting the submerged, saturated wet sedge meadow conditions to the precipitation and preservation of poorly crystalline/SRO Fe(III) oxyhydroxide biogenic mats. |
Review
#529
biogenic mat
Fe K-edge
▶
LLM Prompt
Sample Information
Material: biogenic mat
Sample Origin: Toolik region, Alaska North Slope
Sample-Specific Conditions
- Habitat type: Pond sediment-water interface
- Biogenic Fe mats formed at pond sediment-water interfaces
Measurement
We plan to measure the Fe K-edge XANES spectrum of this sample.
Questions
Based on all the information above:
1. Based on the environmental conditions (pond sediment-water interface in saturated wet sedge meadows), what is the expected dominant Fe phase and its estimated fraction in these biogenic Fe mats?
2. What key reference spectrum must be included in the basis set when performing Linear Combination Fitting (LCF) on the Fe K-edge XANES spectrum of this biogenic mat sample?
3. Explain how the specific habitat type and spatial location of this sample relate to its expected Fe speciation.
Ground Truth
Material: biogenic mat
Measurement: Fe K-edge XANES
Fit method: LCF
Phase fractions: (±15%)
| Phase | Fraction |
|---|---|
| SRO Fe(III) oxyhydroxides | 0.47 |
Fit basis (paper's reference spectra):
- SRO Fe(III) oxyhydroxides
Source evidence: text/figure_3
Key reasoning: Biogenic Fe mats formed at pond sediment-water interfaces in saturated wet sedge meadows (undisturbed weathering history) contain a significant fraction of short-range ordered (SRO) Fe(III) oxyhydroxides. The specific habitat type of the pond sediment-water interface drives this speciation, resulting in SRO Fe(III) oxyhydroxides making up approximately 47% of the Fe phases.
Reasoning source: Sample description and text/figure_3
Scoring Rubric (total: 100 pts)
| Q | Type | Max | Question | Reference Answer | Scoring Criteria |
|---|---|---|---|---|---|
| q1 | quantification | 40 | Based on the environmental conditions (pond sediment-water interface in saturated wet sedge meadows), what is the expected dominant Fe phase and its estimated fraction in these biogenic Fe mats? | The expected dominant Fe phase in these biogenic Fe mats is short-range ordered (SRO) Fe(III) oxyhydroxides, which make up approximately 0.47 (or 47%) of the Fe phases, with an uncertainty of 15%. This specific fraction arises because the mats form at the pond sediment-water interface within saturated wet sedge meadows. This specific habitat type, characterized by an undisturbed weathering history, directly drives the iron speciation toward these poorly crystalline phases. Consequently, the unique environmental conditions at this interface result in SRO Fe(III) oxyhydroxides comprising nearly half of the total iron present. | Full credit for identifying SRO Fe(III) oxyhydroxides and estimating the fraction at approximately 0.47 (47%). |
| q2 | identification | 30 | What key reference spectrum must be included in the basis set when performing Linear Combination Fitting (LCF) on the Fe K-edge XANES spectrum of this biogenic mat sample? | When performing Linear Combination Fitting (LCF) on the Fe K-edge XANES spectrum of this sample, the basis set must include a reference spectrum for short-range ordered (SRO) Fe(III) oxyhydroxides. This reference is required because the sample consists of biogenic Fe mats that formed at a pond sediment-water interface in saturated wet sedge meadows. The specific environmental conditions of this habitat type, which features an undisturbed weathering history, drive the iron speciation to form these specific phases. Therefore, the SRO Fe(III) oxyhydroxides standard is necessary to accurately model the XANES spectrum and account for the 47% of iron present in this form. | Full credit for specifying SRO Fe(III) oxyhydroxides as a necessary reference spectrum. |
| q3 | reasoning | 30 | Explain how the specific habitat type and spatial location of this sample relate to its expected Fe speciation. | The sample's spatial location at the pond sediment-water interface within saturated wet sedge meadows directly dictates its expected Fe speciation. In this specific habitat type, which features an undisturbed weathering history, environmental conditions drive the formation of biogenic Fe mats containing poorly crystalline iron. These interface conditions favor the precipitation and preservation of short-range ordered (SRO) Fe(III) oxyhydroxides. As a direct outcome of forming in this specific environment, SRO Fe(III) oxyhydroxides accumulate to make up approximately 47% of the total Fe phases in the biogenic mat. | Full credit for connecting the pond sediment-water interface habitat in saturated wet sedge meadows to the formation/presence of a significant fraction of short-range ordered (SRO) Fe(III) oxyhydroxides. |
Review
#530
biogenic mat
Ca K-edge
▶
LLM Prompt
Sample Information
Material: biogenic mat
Sample Origin: Toolik region, Alaska North Slope
Sample-Specific Conditions
- Habitat type: Submerged vegetation
- Biogenic Fe mats associated with submerged vegetation
Measurement
We plan to measure the Ca K-edge XANES spectrum of this sample.
Questions
Based on all the information above:
1. What candidate reference spectra should be included in a linear combination fitting (LCF) model for the Ca K-edge XANES spectrum of this biogenic Fe mat associated with submerged vegetation?
2. Estimate the relative phase fractions of the calcium species in this submerged biogenic mat sample.
3. Based on the environmental conditions (submerged vegetation in saturated wet sedge meadows), explain the physical and environmental reasoning for why these specific calcium phases are present in these proportions.
Ground Truth
Material: biogenic mat
Measurement: Ca K-edge XANES
Fit method: LCF
Phase fractions: (±10%)
| Phase | Fraction |
|---|---|
| organic-bound Ca | 0.43 |
| Ca2+ associated with clay minerals | 0.31 |
| Ca phosphates | 0.23 |
Fit basis (paper's reference spectra):
- organic-bound Ca
- Ca2+ associated with clay minerals
- Ca phosphates
Source evidence: text/figure_3
Key reasoning: In submerged biogenic Fe mats associated with vegetation in saturated wet sedge meadows, calcium speciation is heavily influenced by the biological and sedimentary surroundings. Calcium is predominantly organic-bound (43%) due to the presence of submerged plant materials. Additionally, significant fractions exist as Ca2+ associated with clay minerals (31%) and Ca phosphates (23%), reflecting the interaction of the biogenic mat with the surrounding saturated soil and aqueous environment.
Reasoning source: Sample conditions and text/figure_3
Scoring Rubric (total: 100 pts)
| Q | Type | Max | Question | Reference Answer | Scoring Criteria |
|---|---|---|---|---|---|
| q1 | identification | 30 | What candidate reference spectra should be included in a linear combination fitting (LCF) model for the Ca K-edge XANES spectrum of this biogenic Fe mat associated with submerged vegetation? | The linear combination fitting (LCF) model for the Ca K-edge XANES spectrum of this sample should include reference spectra for organic-bound Ca, Ca2+ associated with clay minerals, and Ca phosphates. These specific phases are expected because the biogenic Fe mat is located in a habitat of submerged vegetation within saturated wet sedge meadows, where calcium speciation is heavily influenced by the biological and sedimentary surroundings. The presence of submerged plant materials directly contributes to the formation of the organic-bound Ca phase. Additionally, the continuous interaction of the biogenic mat with the surrounding saturated soil and aqueous environment introduces the clay-associated Ca2+ and Ca phosphate phases. | Full points for identifying organic-bound Ca, Ca associated with clay minerals, and Ca phosphates as the necessary reference phases. |
| q2 | quantification | 40 | Estimate the relative phase fractions of the calcium species in this submerged biogenic mat sample. | The estimated relative phase fractions for this submerged biogenic mat are 43% organic-bound Ca, 31% Ca2+ associated with clay minerals, and 23% Ca phosphates, with an uncertainty of approximately 10%. These specific values result directly from the environmental conditions of the sample's habitat. Calcium is predominantly organic-bound (43%) due to the high abundance of submerged plant materials associated with the biogenic Fe mats. The remaining significant fractions of Ca2+ associated with clay minerals (31%) and Ca phosphates (23%) reflect the extensive interaction between the mat and the surrounding saturated soil and aqueous environment. | Full points for estimating organic-bound Ca at ~43%, clay-associated Ca at ~31%, and Ca phosphates at ~23% (allow a ±10% absolute margin for each phase). |
| q3 | reasoning | 30 | Based on the environmental conditions (submerged vegetation in saturated wet sedge meadows), explain the physical and environmental reasoning for why these specific calcium phases are present in these proportions. | In this biogenic Fe mat from the Toolik region, calcium speciation is heavily dictated by its biological and sedimentary surroundings within saturated wet sedge meadows. The habitat consists of submerged vegetation, which provides abundant plant material that naturally binds calcium, resulting in organic-bound Ca being the predominant phase at 43%. Furthermore, the mat interacts continuously with the surrounding saturated soil and aqueous environment. This environmental interaction facilitates the accumulation of sedimentary and mineral components, leading to the substantial remaining proportions of Ca2+ associated with clay minerals (31%) and Ca phosphates (23%). | Full points for connecting the dominant organic-bound Ca fraction to the biogenic/vegetative nature of the mats, and explaining that the clay and phosphate associations arise from interactions with the submerged sedimentary environment. |
Review
#531
biogenic mat
Ca K-edge
▶
LLM Prompt
Sample Information
Material: biogenic mat
Sample Origin: Toolik region, Alaska North Slope
Sample-Specific Conditions
- Habitat type: Pond sediment-water interface
- Biogenic Fe mats formed at pond sediment-water interfaces
Measurement
We plan to measure the Ca K-edge XANES spectrum of this sample.
Questions
Based on all the information above:
1. What candidate reference spectra (phases) should be considered when modeling the Ca K-edge XANES spectrum of a biogenic Fe mat from a pond sediment-water interface?
2. Estimate the relative phase fractions of the Ca species present in this biogenic Fe mat sample.
3. Based on the environmental conditions (biogenic Fe mats at a pond sediment-water interface), explain the reasoning behind the expected dominant Ca phase.
Ground Truth
Material: biogenic mat
Measurement: Ca K-edge XANES
Fit method: LCF
Phase fractions: (±10%)
| Phase | Fraction |
|---|---|
| organic-bound Ca | 0.57 |
| Ca phosphates | 0.16 |
| Ca2+ associated with clay minerals | 0.14 |
Fit basis (paper's reference spectra):
- organic-bound Ca
- Ca phosphates
- Ca2+ associated with clay minerals
Source evidence: text/figure_3
Key reasoning: In biogenic Fe mats formed at pond sediment-water interfaces within saturated wet sedge meadows, calcium is predominantly associated with organic matter (57%). Secondary contributions come from Ca phosphates (16%) and Ca2+ associated with clay minerals (14%). This distribution reflects the biogenic origin of the mats and the specific habitat type of the pond sediment-water interface.
Reasoning source: text/figure_3
Scoring Rubric (total: 100 pts)
| Q | Type | Max | Question | Reference Answer | Scoring Criteria |
|---|---|---|---|---|---|
| q1 | identification | 30 | What candidate reference spectra (phases) should be considered when modeling the Ca K-edge XANES spectrum of a biogenic Fe mat from a pond sediment-water interface? | When modeling the Ca K-edge XANES spectrum of this sample, the candidate reference spectra should include organic-bound Ca, Ca phosphates, and Ca2+ associated with clay minerals. These specific phases are expected because the sample is a biogenic Fe mat formed at a pond sediment-water interface within saturated wet sedge meadows in the Alaskan North Slope. The biogenic origin of the mats naturally leads to a strong presence of organic-bound calcium and biological phosphates. Furthermore, the specific habitat type at the sediment-water interface introduces interactions with underlying sediment components, explaining the presence of Ca2+ associated with clay minerals. | Full points for identifying organic-bound Ca, Ca phosphates, and Ca associated with clay minerals as the primary candidate phases. |
| q2 | quantification | 40 | Estimate the relative phase fractions of the Ca species present in this biogenic Fe mat sample. | The relative phase fractions for this sample are estimated to be 57% organic-bound Ca, 16% Ca phosphates, and 14% Ca2+ associated with clay minerals, with an uncertainty of 10%. These specific values result directly from the sample's formation conditions as a biogenic Fe mat at a pond sediment-water interface within saturated wet sedge meadows. Because the mat is biogenic in origin, calcium is predominantly associated with organic matter, yielding the high 57% fraction. The secondary contributions of Ca phosphates (16%) and clay-associated Ca2+ (14%) reflect the specific environmental interactions and mineral availability at the sediment-water boundary within this habitat. | Full points for estimating organic-bound Ca at ~57%, Ca phosphates at ~16%, and Ca associated with clay minerals at ~14% (allow ±10% variation). |
| q3 | reasoning | 30 | Based on the environmental conditions (biogenic Fe mats at a pond sediment-water interface), explain the reasoning behind the expected dominant Ca phase. | The dominant Ca phase in this sample is organic-bound Ca, which accounts for 57% of the calcium speciation. This dominance is a direct result of the sample being a biogenic Fe mat formed at a pond sediment-water interface within saturated wet sedge meadows. The biogenic origin of the material dictates that the primary matrix consists of biological and organic components. Consequently, the calcium within these mats preferentially associates with this abundant organic matter rather than forming purely inorganic mineral phases, reflecting the unique biological and environmental conditions of this Alaskan North Slope habitat. | Full points for explaining that the biogenic nature of the mats in this specific habitat type leads to organic-bound Ca being the predominant phase, with secondary mineral/clay associations. |
Review
#532
sediment
Ca K-edge
▶
LLM Prompt
Sample Information
Material: sediment
Sample Origin: Toolik region, Alaska North Slope
Sample-Specific Conditions
- Disturbance type: Gravel mining
- Pond sediments in areas impacted by gravel mining
Measurement
We plan to measure the Ca K-edge XANES spectrum of this sample.
Questions
Based on all the information above:
1. Based on the environmental conditions (pond sediments impacted by gravel mining in the Toolik region), what candidate reference spectra should be considered for modeling the Ca K-edge XANES data?
2. Estimate the relative phase fractions of the Ca species present in the top 1 cm of these disturbed surface sediments.
3. Explain the expected Ca speciation profile for these sediments and how it reflects the gravel mining disturbance.
Ground Truth
Material: sediment
Measurement: Ca K-edge XANES
Fit method: LCF
Phase fractions: (±10%)
| Phase | Fraction |
|---|---|
| organic-bound Ca | 0.38 |
| Ca phosphates | 0.32 |
| Ca2+ associated with clay minerals | 0.27 |
Fit basis (paper's reference spectra):
- organic-bound Ca
- Ca phosphates
- Ca2+ associated with clay minerals
Source evidence: text/figure_3
Key reasoning: The top 1 cm of surface sediments in ponds impacted by gravel mining in the 1970s exhibit a mixed Ca speciation. The disturbance results in a composition dominated by organic-bound Ca (38%), followed by Ca phosphates (32%) and Ca2+ associated with clay minerals (27%).
Reasoning source: text/figure_3
Scoring Rubric (total: 100 pts)
| Q | Type | Max | Question | Reference Answer | Scoring Criteria |
|---|---|---|---|---|---|
| q1 | identification | 30 | Based on the environmental conditions (pond sediments impacted by gravel mining in the Toolik region), what candidate reference spectra should be considered for modeling the Ca K-edge XANES data? | The candidate reference spectra for modeling the Ca K-edge XANES data of these pond sediments should include organic-bound Ca, Ca phosphates, and Ca2+ associated with clay minerals. These specific phases are expected because the top 1 cm of surface sediments in this Toolik region pond were impacted by gravel mining in the 1970s, which created a mixed Ca speciation environment. This historical disturbance altered the sediment composition, leading to a system where calcium is distributed among organic matter, phosphate minerals, and clay mineral associations. | Full credit for identifying organic-bound Ca, Ca phosphates, and Ca2+ associated with clay minerals as the necessary reference phases. |
| q2 | quantification | 40 | Estimate the relative phase fractions of the Ca species present in the top 1 cm of these disturbed surface sediments. | The estimated relative phase fractions for the top 1 cm of these disturbed surface sediments are 38% organic-bound Ca, 32% Ca phosphates, and 27% Ca2+ associated with clay minerals, with an estimated uncertainty of 10%. These specific values result directly from the historical gravel mining disturbance in the 1970s, which altered the natural pond sediments. This disturbance drives the sediment composition to be dominated primarily by organic-bound Ca, followed closely by Ca phosphates and clay-associated Ca2+, reflecting the mixed Ca speciation characteristic of this impacted environment. | Full credit for estimating organic-bound Ca at ~38%, Ca phosphates at ~32%, and Ca2+ associated with clay minerals at ~27%. |
| q3 | reasoning | 30 | Explain the expected Ca speciation profile for these sediments and how it reflects the gravel mining disturbance. | The expected Ca speciation profile for the top 1 cm of these pond sediments is a mixed composition consisting of 38% organic-bound Ca, 32% Ca phosphates, and 27% Ca2+ associated with clay minerals. This profile arises because the sediments were impacted by gravel mining in the Toolik region during the 1970s. The physical disturbance from the mining activity altered the sediment composition, resulting in an environment dominated by organic-bound calcium alongside significant phosphate and clay-associated fractions. Therefore, the Ca K-edge XANES linear combination fitting reflects this specific disturbed state and its resulting mixed speciation. | Full credit for explaining that the disturbance leads to a highly mixed speciation profile, specifically highlighting the distribution between organic-bound, phosphate-bound, and clay-associated calcium. |
Review
#533
soil
P K-edge
▶
LLM Prompt
Sample Information
Material: soil
Sample Origin: Toolik region, Alaska North Slope
Sample-Specific Conditions
- Landscape position: Hillslope
- Organic soils from upland, midslope, and lowland positions
Measurement
We plan to measure the P K-edge XANES spectrum of this sample.
Questions
Based on all the information above:
1. Based on the sample conditions (undisturbed organic soils from surface and subsurface organic horizons in the Toolik region), what is the expected dominant phosphorus phase and its approximate fraction?
2. Explain why this specific phase is expected to dominate the P K-edge XANES speciation for this sample.
3. If you were to perform Linear Combination Fitting (LCF) on the P K-edge XANES spectrum of this soil sample, what key reference standard category must be included in your fit basis to capture the majority of the phosphorus?
Ground Truth
Material: soil
Measurement: P K-edge XANES
Fit method: Linear Combination Fitting (LCF)
Phase fractions: (±10%)
| Phase | Fraction |
|---|---|
| organic P | 0.66 |
Fit basis (paper's reference spectra):
- organic P reference spectra
Source evidence: text/figure_3
Key reasoning: The sample consists of undisturbed organic soils from surface and subsurface organic horizons across upland, midslope, and lowland hillslope positions in the Toolik region, Alaska North Slope. Because these are specifically organic horizons, organic P is the dominant phosphorus phase, accounting for 66% of the total phosphorus speciation.
Reasoning source: text/figure_3
Scoring Rubric (total: 100 pts)
| Q | Type | Max | Question | Reference Answer | Scoring Criteria |
|---|---|---|---|---|---|
| q1 | prediction | 40 | Based on the sample conditions (undisturbed organic soils from surface and subsurface organic horizons in the Toolik region), what is the expected dominant phosphorus phase and its approximate fraction? | The expected dominant phosphorus phase is organic P, which accounts for approximately 66% of the total phosphorus speciation. This specific fraction results directly from the sample's origin as undisturbed organic soils collected from surface and subsurface organic horizons across upland, midslope, and lowland hillslope positions in the Toolik region. Because the sampled material is specifically derived from these organic horizons, organic phosphorus naturally accumulates and dictates the soil chemistry. Consequently, organic P is the primary phase observed in the P K-edge XANES measurement. | Award full points for identifying organic P as the dominant phase and estimating its fraction at approximately 66% (0.66). Deduct points if the phase is incorrect or the fraction is significantly off. |
| q2 | reasoning | 30 | Explain why this specific phase is expected to dominate the P K-edge XANES speciation for this sample. | Organic P is expected to dominate the P K-edge XANES speciation, comprising 66% of the total phosphorus inventory. This dominance occurs because the sample consists of undisturbed organic soils sourced from surface and subsurface organic horizons across various hillslope positions in the Toolik region of the Alaska North Slope. Because these specific landscape positions and horizons are inherently organic, the accumulation of organic matter fundamentally controls the phosphorus speciation. Therefore, the high organic content in these horizons directly results in organic P being the primary phase detected. | Award full points for connecting the dominance of organic P to the sample's spatial location (surface and subsurface organic horizons) and undisturbed weathering history in the hillslope landscape. |
| q3 | identification | 30 | If you were to perform Linear Combination Fitting (LCF) on the P K-edge XANES spectrum of this soil sample, what key reference standard category must be included in your fit basis to capture the majority of the phosphorus? | When performing Linear Combination Fitting (LCF) on this sample's P K-edge XANES spectrum, the fit basis must include organic P reference spectra. The inclusion of these specific references is required because the sample originates from undisturbed organic soils located in surface and subsurface organic horizons across hillslope positions in the Toolik region. Because these are specifically organic horizons, organic P naturally accumulates and becomes the dominant phosphorus phase, accounting for 66% of the total speciation. Thus, organic P standards are strictly necessary to accurately model the primary structural and electronic features of the phosphorus in this sample. | Award full points for stating that organic P reference spectra must be included in the fit basis. |
Review
#534
biogenic mat
P K-edge
▶
LLM Prompt
Sample Information
Material: biogenic mat
Sample Origin: Toolik region, Alaska North Slope
Sample-Specific Conditions
- Habitat type: Pond sediment-water interface
- Biogenic Fe mats formed at pond sediment-water interfaces
Measurement
We plan to measure the P K-edge XANES spectrum of this sample.
Questions
Based on all the information above:
1. What candidate reference spectra (basis functions) are needed to properly model the P K-edge XANES spectrum of this biogenic Fe mat sample?
2. Estimate the relative phase fractions of the phosphorus species in this biogenic Fe mat from the pond sediment-water interface.
3. Explain why these specific phosphorus phases and their relative proportions are expected for biogenic Fe mats formed at the pond sediment-water interface in saturated wet sedge meadows.
Ground Truth
Material: biogenic mat
Measurement: P K-edge XANES
Fit method: LCF
Phase fractions: (±10%)
| Phase | Fraction |
|---|---|
| Fe-bound P | 0.66 |
| Al-bound P | 0.28 |
| organic P | 0.06 |
Fit basis (paper's reference spectra):
- Fe-bound P
- Al-bound P
- organic P
Source evidence: text/figure_3
Key reasoning: Biogenic Fe mats formed at the pond sediment-water interface in saturated wet sedge meadows accumulate phosphorus primarily through association with iron. The dominant fraction of Fe-bound P (66%) reflects the strong affinity of phosphorus for these biogenic iron phases in undisturbed aquatic environments. Secondary contributions come from Al-bound P (28%) and a minor organic P component (6%).
Reasoning source: Sample description and text/figure_3
Scoring Rubric (total: 100 pts)
| Q | Type | Max | Question | Reference Answer | Scoring Criteria |
|---|---|---|---|---|---|
| q1 | identification | 20 | What candidate reference spectra (basis functions) are needed to properly model the P K-edge XANES spectrum of this biogenic Fe mat sample? | To properly model the P K-edge XANES spectrum of this sample, the required reference spectra are Fe-bound P, Al-bound P, and organic P. These specific phases are expected because the sample consists of biogenic Fe mats formed at the pond sediment-water interface in saturated wet sedge meadows. In this undisturbed aquatic environment, phosphorus accumulates primarily through a strong chemical affinity for biogenic iron phases, necessitating the Fe-bound P reference. Furthermore, secondary environmental interactions in this habitat require Al-bound P and organic P references to fully capture the remaining phosphorus speciation. | Full credit for identifying Fe-bound P, Al-bound P, and organic P as the necessary reference phases. |
| q2 | quantification | 40 | Estimate the relative phase fractions of the phosphorus species in this biogenic Fe mat from the pond sediment-water interface. | The estimated relative phase fractions for this biogenic Fe mat are 66% Fe-bound P, 28% Al-bound P, and 6% organic P, with an uncertainty of approximately 10%. These specific values result directly from the sample's formation conditions at the pond sediment-water interface, where phosphorus accumulates primarily through association with iron. The dominant 66% fraction of Fe-bound P reflects the strong affinity of phosphorus for biogenic iron phases in this undisturbed aquatic habitat. The remaining values represent secondary environmental contributions from aluminum associations (28%) and a minor organic phosphorus component (6%). | Full credit for estimating Fe-bound P at approximately 66%, Al-bound P at approximately 28%, and organic P at approximately 6%. |
| q3 | reasoning | 40 | Explain why these specific phosphorus phases and their relative proportions are expected for biogenic Fe mats formed at the pond sediment-water interface in saturated wet sedge meadows. | The specific phosphorus phases and their proportions (66% Fe-bound P, 28% Al-bound P, and 6% organic P) are expected due to the unique biogeochemical conditions of the pond sediment-water interface in saturated wet sedge meadows. In these undisturbed aquatic environments, biogenic Fe mats form and act as primary sinks for phosphorus. The mechanism driving this distribution is the strong chemical affinity of phosphorus for these biogenic iron phases, which leads to the dominant accumulation of Fe-bound P. Consequently, aluminum-associated phosphorus and organic phosphorus only make up secondary and minor contributions to the overall speciation in these mats. | Full credit for explaining that the dominant Fe-bound P fraction is due to the strong affinity of phosphorus for biogenic iron phases at the sediment-water interface, with secondary contributions from Al-bound and organic P. |
Review
#535
biogenic mat
P K-edge
▶
LLM Prompt
Sample Information
Material: biogenic mat
Sample Origin: Toolik region, Alaska North Slope
Sample-Specific Conditions
- Habitat type: Submerged vegetation
- Biogenic Fe mats associated with submerged vegetation
Measurement
We plan to measure the P K-edge XANES spectrum of this sample.
Questions
Based on all the information above:
1. What candidate reference spectra are needed to model the P K-edge XANES spectrum of this submerged biogenic Fe mat sample?
2. Estimate the quantitative phase fractions of the phosphorus species in this biogenic Fe mat.
3. Explain the physical and environmental reasoning for why phosphorus speciation is heavily dominated by one specific phase in this submerged biogenic mat.
Ground Truth
Material: biogenic mat
Measurement: P K-edge XANES
Fit method: Linear Combination Fitting (LCF)
Phase fractions: (±10%)
| Phase | Fraction |
|---|---|
| Fe-bound P | 0.82 |
| Al-bound P | 0.12 |
| organic P | 0.06 |
Fit basis (paper's reference spectra):
- Fe-bound P
- Al-bound P
- organic P
Source evidence: text/figure_3
Key reasoning: In saturated wet sedge meadows, biogenic Fe mats associated with submerged vegetation are highly enriched in iron. Consequently, phosphorus speciation is heavily dominated by Fe-bound P (82%), as phosphate strongly adsorbs to or co-precipitates with these abundant biogenic iron phases. Minor contributions from Al-bound P (12%) and organic P (6%) reflect the background mineralogy and biological material present in the submerged plant environment.
Reasoning source: text/figure_3 and sample description
Scoring Rubric (total: 100 pts)
| Q | Type | Max | Question | Reference Answer | Scoring Criteria |
|---|---|---|---|---|---|
| q1 | identification | 20 | What candidate reference spectra are needed to model the P K-edge XANES spectrum of this submerged biogenic Fe mat sample? | To model the P K-edge XANES spectrum of this sample, the required candidate reference spectra are Fe-bound P, Al-bound P, and organic P. These specific phases are expected because the sample is a biogenic Fe mat associated with submerged vegetation in saturated wet sedge meadows, making it highly enriched in iron. Due to this iron enrichment, phosphate strongly adsorbs to or co-precipitates with the abundant biogenic iron phases, necessitating a dominant Fe-bound P reference. Furthermore, Al-bound P and organic P references are required to account for the background mineralogy and biological material inherently present in this submerged plant habitat. | Full points for identifying Fe-bound P, Al-bound P, and organic P as the necessary reference spectra. |
| q2 | quantification | 40 | Estimate the quantitative phase fractions of the phosphorus species in this biogenic Fe mat. | The estimated phase fractions for this biogenic Fe mat are 82% Fe-bound P, 12% Al-bound P, and 6% organic P, with an uncertainty of 10%. These specific values result from the sample being a biogenic mat associated with submerged vegetation, which creates an environment highly enriched in iron. Consequently, the phosphorus speciation is heavily dominated by the 82% Fe-bound P fraction because phosphate strongly adsorbs to or co-precipitates with these abundant biogenic iron phases. The minor fractions of Al-bound P (12%) and organic P (6%) directly reflect the limited but present background mineralogy and biological material in the submerged habitat. | Full points for estimating Fe-bound P at ~82%, Al-bound P at ~12%, and organic P at ~6% (allow +/- 10% variation). |
| q3 | reasoning | 40 | Explain the physical and environmental reasoning for why phosphorus speciation is heavily dominated by one specific phase in this submerged biogenic mat. | In this submerged biogenic mat from the Toolik region, phosphorus speciation is heavily dominated by Fe-bound P, which accounts for 82% of the phosphorus. This occurs because the sample consists of biogenic Fe mats associated with submerged vegetation in saturated wet sedge meadows, an environment that is highly enriched in iron. The physical mechanism driving this speciation is the strong adsorption or co-precipitation of phosphate with these abundant biogenic iron phases. As a result of these environmental conditions, iron-bound phosphorus becomes the primary species, leaving only minor contributions from the background mineralogy (Al-bound P) and biological material (organic P). | Full points for explaining that the saturated wet sedge meadow environment promotes the formation of biogenic Fe mats, leading to strong adsorption/co-precipitation of P with iron phases (Fe-bound P), with minor contributions from background Al-minerals and organic matter. |
Review
#536
sediment
P K-edge
▶
LLM Prompt
Sample Information
Material: sediment
Sample Origin: Toolik region, Alaska North Slope
Sample-Specific Conditions
- Disturbance type: Gravel mining
- Pond sediments in areas impacted by gravel mining
Measurement
We plan to measure the P K-edge XANES spectrum of this sample.
Questions
Based on all the information above:
1. Given the sample origin (Toolik region, Alaska North Slope) and the specific disturbance (gravel mining), what candidate reference spectra should be included in a linear combination fitting (LCF) model for this P K-edge XANES analysis?
2. Estimate the relative phase fractions of the phosphorus species in the top 1 cm of these pond sediments impacted by gravel mining.
3. Explain the expected phosphorus speciation in this sample and how the distribution of P phases reflects the gravel mining disturbance.
Ground Truth
Material: sediment
Measurement: P K-edge XANES
Fit method: LCF
Phase fractions: (±10%)
| Phase | Fraction |
|---|---|
| Ca-bound P | 0.45 |
| Al-bound P | 0.275 |
| Fe-bound P | 0.275 |
Fit basis (paper's reference spectra):
- Ca-bound P
- Al-bound P
- Fe-bound P
Source evidence: text/figure_3
Key reasoning: Pond sediments impacted by gravel mining in the 1970s exhibit a mixed phosphorus speciation. The disturbance leads to a composition dominated by Ca-bound P (45%). The remaining phosphorus is evenly distributed between Al-bound P (27.5%) and Fe-bound P (27.5%), reflecting the specific mineralogical inputs and weathering history associated with the gravel mining impact.
Reasoning source: text/figure_3
Scoring Rubric (total: 100 pts)
| Q | Type | Max | Question | Reference Answer | Scoring Criteria |
|---|---|---|---|---|---|
| q1 | identification | 30 | Given the sample origin (Toolik region, Alaska North Slope) and the specific disturbance (gravel mining), what candidate reference spectra should be included in a linear combination fitting (LCF) model for this P K-edge XANES analysis? | The linear combination fitting (LCF) model for this P K-edge XANES analysis should include reference spectra for Ca-bound P, Al-bound P, and Fe-bound P. These specific phases are expected because the sample consists of pond sediments from the Toolik region, Alaska North Slope, that have been impacted by gravel mining. This specific disturbance alters the local environment, introducing distinct mineralogical inputs and changing the weathering history of the sediment. Consequently, this leads to a mixed phosphorus speciation where phosphorus binds with available calcium, aluminum, and iron minerals, necessitating these three reference spectra to accurately model the sample. | Full credit if the answer identifies Ca-bound P, Al-bound P, and Fe-bound P as the necessary reference phases. |
| q2 | quantification | 40 | Estimate the relative phase fractions of the phosphorus species in the top 1 cm of these pond sediments impacted by gravel mining. | The estimated relative phase fractions for the phosphorus species in these gravel mining-impacted pond sediments are 45% Ca-bound P, 27.5% Al-bound P, and 27.5% Fe-bound P, with an estimated uncertainty of 10%. These specific values result directly from the gravel mining disturbance in the Toolik region, which significantly altered the local mineralogy. The mining impact introduces specific mineralogical inputs that lead to a composition heavily dominated by Ca-bound P. The remaining phosphorus is evenly distributed between Al-bound P and Fe-bound P, reflecting the distinct weathering history and mixed phosphorus speciation caused by this environmental disruption. | Full credit if the estimated fractions are approximately 45% Ca-bound P, 27.5% Al-bound P, and 27.5% Fe-bound P (allow ±10% margin of error for each). |
| q3 | reasoning | 30 | Explain the expected phosphorus speciation in this sample and how the distribution of P phases reflects the gravel mining disturbance. | The expected phosphorus speciation in these Toolik region pond sediments is a mixture consisting of 45% Ca-bound P, 27.5% Al-bound P, and 27.5% Fe-bound P. This specific distribution is a direct outcome of the gravel mining disturbance that impacted the area in the 1970s. The mining activity altered the natural environment, introducing specific mineralogical inputs that shifted the sediment composition to be dominated by calcium-bound phosphorus. Furthermore, the altered weathering history caused by the gravel mining resulted in the remaining phosphorus being evenly distributed between aluminum- and iron-bound phases, reflecting the unique environmental impact of the disturbance. | Full credit if the answer discusses a mixed speciation dominated by Ca-bound P, with equal secondary contributions from Al- and Fe-bound P, linking this specific distribution to the mineralogical alteration caused by the gravel mining. |
Review
Reconstruction and Dissolution of Copper Catalysts during Electrocatalytic Nitrate Reduction
BNL-NSLS-II-8-ID
Catalyst
Leslie K. Arrazolo et al.
DOI: 10.1021/acs.est.6c04463
5 scenarios
▶
#537
Cu
Cu K
▶
LLM Prompt
Sample Information
Material: Cu
Support: graphene
Reaction Conditions: 0.1 M KNO3 + 0.1 M K2SO4, pH 11.5, OCV
Sample-Specific Conditions
- Applied potential: OCV
- Single-atom Cu catalyst on graphene before reaction in nitrate electrolyte
Measurement
We plan to measure the Cu K XANES spectrum of this sample.
Questions
Based on all the information above:
1. Identify the appropriate reference spectra or structural motifs required to construct a basis set for linear combination fitting (LCF) of this single-atom catalyst system during in situ electrochemical experiments.
2. Describe the dominant structural phase of this Cu catalyst at the initial open circuit voltage (OCV) in the nitrate electrolyte. Explain the physical reasoning for why this phase is stable and present before the reaction begins.
Ground Truth
Material: Cu1 (single-atom Cu on graphene)
Measurement: Cu K-edge in situ fluorescence mode at Beamline 8-ID
Fit method: Linear combination fitting (LCF)
Phase fractions: (±10%)
| Phase | Fraction |
|---|---|
| Cu-N (single atom) | 1.0 |
| metallic Cu (Cu-Cu) | 0.0 |
Fit basis (paper's reference spectra):
- single-atom Cu (Cu-N coordination, CuPc reference)
- metallic Cu (Cu-Cu coordination, Cu foil reference)
Source evidence: Figure 5b, page 17
Key reasoning: At open circuit voltage (OCV) prior to the application of a reductive potential, the Cu1 catalyst exists entirely in its as-synthesized single-atom configuration, characterized by Cu-N4 coordination. The catalyst does not undergo spontaneous reduction or aggregation upon exposure to the nitrate electrolyte without an applied cathodic bias.
Reasoning source: Page 14, 'In Situ XAS Reveals Conformational Changes of Cu1 and CuNP' section
Scoring Rubric (total: 100 pts)
| Q | Type | Max | Question | Reference Answer | Scoring Criteria |
|---|---|---|---|---|---|
| q1 | identification | 43 | Identify the appropriate reference spectra or structural motifs required to construct a basis set for linear combination fitting (LCF) of this single-atom catalyst system during in situ electrochemical experiments. | The appropriate basis set for linear combination fitting (LCF) of this system includes a single-atom Cu reference (characterized by Cu-N coordination, using a CuPc reference) and a metallic Cu reference (characterized by Cu-Cu coordination, using a Cu foil reference). These specific references are required because the sample is a single-atom Cu catalyst supported on graphene being tested in an electrochemical nitrate reduction environment. At the initial open circuit voltage (OCV) condition, the catalyst exists entirely in its as-synthesized single-atom configuration (Cu-N4 coordination) because no reductive potential has been applied yet. The metallic Cu reference is necessary to account for any potential reduction or aggregation of the single atoms into nanoparticles that might occur once a cathodic bias is applied during the in situ experiments. | Full credit for identifying both single-atom Cu (or Cu-N/CuPc) and metallic Cu (or Cu-Cu/Cu foil) as the necessary basis components. |
| q2 | reasoning | 57 | Describe the dominant structural phase of this Cu catalyst at the initial open circuit voltage (OCV) in the nitrate electrolyte. Explain the physical reasoning for why this phase is stable and present before the reaction begins. | At the initial open circuit voltage (OCV) in the nitrate electrolyte, the dominant structural phase of the catalyst is 100% single-atom Cu characterized by Cu-N4 coordination. This phase is stable and present because the sample is in its as-synthesized state prior to the application of any reductive potential. Without an applied cathodic bias, the single-atom Cu catalyst on the graphene support does not undergo spontaneous reduction or aggregation upon exposure to the 0.1 M KNO3 and 0.1 M K2SO4 (pH 11.5) electrolyte. Consequently, the catalyst maintains its isolated single-atom configuration, resulting in a 1.0 fraction for the Cu-N coordinated phase and a 0.0 fraction for metallic Cu. | Full credit for stating the catalyst is 100% in the single-atom (Cu-N) phase and explaining that it remains in this state because spontaneous reduction/aggregation does not occur without an applied cathodic bias. |
Review
#538
Cu
Cu K
▶
LLM Prompt
Sample Information
Material: Cu
Support: graphene
Reaction Conditions: 0.1 M KNO3 + 0.1 M K2SO4, pH 11.5, -0.8 V vs RHE
Sample-Specific Conditions
- Applied potential: -0.8 V
- Single-atom Cu catalyst on graphene during NO3RR
Measurement
We plan to measure the Cu K XANES spectrum of this sample.
Questions
Based on all the information above:
1. What candidate reference spectra or basis functions are needed to perform linear combination fitting (LCF) on the in situ XANES spectrum of this single-atom Cu catalyst during NO3RR?
2. Estimate the phase fractions of the Cu species present in this sample under the specified reaction conditions (-0.8 V in 0.1 M KNO3).
Ground Truth
Material: Cu1 (single-atom Cu on graphene)
Measurement: in situ Cu K-edge XAS in fluorescence mode at Beamline 8-ID of NSLS-II
Fit method: Linear combination fitting (LCF)
Phase fractions: (±15%)
| Phase | Fraction |
|---|---|
| Cu-N (single atom) | 0.4 |
| metallic Cu (Cu-Cu) | 0.6 |
Fit basis (paper's reference spectra):
- single-atom Cu (Cu-N coordination, CuPc reference)
- metallic Cu (Cu-Cu coordination, Cu foil reference)
Source evidence: Figure 5b and text on page 14, lines 346-347
Key reasoning: Under NO3RR conditions at -0.8 V, the Cu1 single-atom catalyst undergoes rapid aggregation into metallic Cu clusters. The applied reductive potential drives the reduction and clustering, while the presence of nitrate promotes the mobility of Cu atoms, leading to a significant decrease in the single-atom (Cu-N) fraction and a corresponding increase in the metallic (Cu-Cu) fraction. This results in a mixed phase of remaining single atoms and newly formed metallic clusters during the reaction.
Reasoning source: Page 14, lines 342-348 and Page 15, lines 366-377
Scoring Rubric (total: 100 pts)
| Q | Type | Max | Question | Reference Answer | Scoring Criteria |
|---|---|---|---|---|---|
| q1 | identification | 33 | What candidate reference spectra or basis functions are needed to perform linear combination fitting (LCF) on the in situ XANES spectrum of this single-atom Cu catalyst during NO3RR? | To perform linear combination fitting (LCF) on this sample, the required reference spectra are single-atom Cu (representing Cu-N coordination, using a CuPc reference) and metallic Cu (representing Cu-Cu coordination, using a Cu foil reference). These specific basis functions are necessary because the initial single-atom Cu catalyst on graphene undergoes structural changes under the NO3RR reaction conditions at -0.8 V vs RHE. The applied reductive potential drives the reduction and clustering of the Cu atoms, while the presence of nitrate in the electrolyte promotes their mobility. Consequently, the catalyst rapidly aggregates into metallic Cu clusters, resulting in a mixed phase of remaining single atoms (Cu-N) and newly formed metallic clusters (Cu-Cu) that must both be accounted for in the fit. | Full credit for identifying both a single-atom Cu (or Cu-N coordinated) reference and a metallic Cu (or Cu-Cu coordinated) reference. |
| q2 | quantification | 67 | Estimate the phase fractions of the Cu species present in this sample under the specified reaction conditions (-0.8 V in 0.1 M KNO3). | Under the specified reaction conditions, the estimated phase fractions are 0.4 (40%) single-atom Cu (Cu-N coordination) and 0.6 (60%) metallic Cu (Cu-Cu coordination), with an uncertainty of 15%. These specific values result from the rapid aggregation of the initial Cu1 single-atom catalyst into metallic clusters during NO3RR. The applied reductive potential of -0.8 V drives this reduction and clustering process, while the presence of nitrate in the 0.1 M KNO3 electrolyte promotes the mobility of the Cu atoms. This combination of conditions leads to a significant decrease in the initial single-atom fraction and a corresponding increase in the metallic fraction, yielding the observed 40:60 mixed phase. | Full credit for estimating approximately 40% single-atom Cu (Cu-N) and 60% metallic Cu. Partial credit if the dominant phase is correctly identified as metallic Cu with a significant minority of single-atom Cu. |
Review
#539
Cu
Cu K
▶
LLM Prompt
Sample Information
Material: Cu
Support: graphene
Reaction Conditions: 0.1 M KNO3 + 0.1 M K2SO4, pH 11.5, OCV post-reaction
Sample-Specific Conditions
- Applied potential: OCV (post)
- Single-atom Cu catalyst on graphene after NO3RR
Measurement
We plan to measure the Cu K XANES spectrum of this sample.
Questions
Based on all the information above:
1. Based on the reaction conditions and the nature of the single-atom Cu catalyst, what candidate reference spectra are needed to perform Linear Combination Fitting (LCF) on the XANES spectrum of this sample?
2. Estimate the phase fractions of the Cu species present in this catalyst after returning to OCV post-reaction in the 0.1 M KNO3 electrolyte.
Ground Truth
Material: Cu1 (single-atom Cu on graphene)
Measurement: Cu K-edge, in situ fluorescence mode, Beamline 8-ID at NSLS-II
Fit method: Linear combination fitting (LCF)
Phase fractions: (±10%)
| Phase | Fraction |
|---|---|
| Cu-N (single atom) | 0.95 |
| metallic Cu (Cu-Cu) | 0.05 |
Fit basis (paper's reference spectra):
- single-atom Cu (Cu-N coordination, CuPc reference)
- metallic Cu (Cu-Cu coordination, Cu foil reference)
Source evidence: Figure 5b and text on pages 14-15
Key reasoning: During NO3RR at -0.8 V, the Cu1 single-atom catalyst aggregates into metallic Cu clusters. Upon returning to open circuit voltage (OCV) post-reaction, these clusters redisperse back to a predominantly single-atom (Cu-N) configuration. This redispersion is highly efficient in the 0.1 M nitrate electrolyte, recovering ~95% of the single-atom sites, likely because nitrate or its reduction intermediates stabilize dissolved Cu2+ species through complexation, acting as carriers during reoxidation.
Reasoning source: Results and Discussion: In Situ XAS Reveals Conformational Changes of Cu1 and CuNP (Pages 14-15)
Scoring Rubric (total: 100 pts)
| Q | Type | Max | Question | Reference Answer | Scoring Criteria |
|---|---|---|---|---|---|
| q1 | identification | 33 | Based on the reaction conditions and the nature of the single-atom Cu catalyst, what candidate reference spectra are needed to perform Linear Combination Fitting (LCF) on the XANES spectrum of this sample? | To perform Linear Combination Fitting (LCF) on the XANES spectrum of this sample, the required candidate reference spectra are single-atom Cu (Cu-N coordination, using a CuPc reference) and metallic Cu (Cu-Cu coordination, using a Cu foil reference). These specific phases are expected because the initial single-atom Cu catalyst on graphene aggregates into metallic Cu clusters during the NO3RR process. Upon returning to open circuit voltage (OCV) post-reaction in the 0.1 M KNO3 + 0.1 M K2SO4 (pH 11.5) electrolyte, the metallic clusters undergo an efficient redispersion process. This redispersion occurs because nitrate or its reduction intermediates stabilize dissolved Cu2+ species through complexation, acting as carriers during reoxidation to restore the predominantly single-atom Cu-N configuration alongside a minor residual metallic Cu phase. | Full credit for identifying a single-atom Cu (Cu-N) reference and a metallic Cu (Cu-Cu / Cu foil) reference. |
| q2 | quantification | 67 | Estimate the phase fractions of the Cu species present in this catalyst after returning to OCV post-reaction in the 0.1 M KNO3 electrolyte. | The estimated phase fractions for this catalyst are 0.95 (95%) single-atom Cu (Cu-N coordination) and 0.05 (5%) metallic Cu (Cu-Cu coordination), with an uncertainty of 10%. These specific values result from the highly efficient redispersion of the catalyst upon returning to open circuit voltage (OCV) post-reaction. Although the single-atom Cu aggregated into metallic clusters during the prior NO3RR step, the presence of the 0.1 M nitrate electrolyte facilitates the recovery of ~95% of the single-atom sites. This high recovery fraction is driven by nitrate or its reduction intermediates complexing with and stabilizing dissolved Cu2+ species, which act as carriers during reoxidation to drive the system back to a nearly complete single-atom state. | Full credit for estimating ~95% single-atom Cu (Cu-N) and ~5% metallic Cu. Partial credit for identifying that the single-atom phase is overwhelmingly dominant (>90%) with a minor metallic component. |
Review
#540
Cu
Cu K
▶
LLM Prompt
Sample Information
Material: Cu
Support: graphene
Reaction Conditions: 0.15 M K2SO4, pH 11.5, -0.8 V vs RHE
Sample-Specific Conditions
- Electrolyte composition: 0 M KNO3
- Single-atom Cu catalyst on graphene during HER (no nitrate)
Measurement
We plan to measure the Cu K XANES spectrum of this sample.
Questions
Based on all the information above:
1. What candidate reference spectra or structural motifs should be used as the basis for linear combination fitting of this single-atom Cu catalyst under these specific in situ conditions?
2. Estimate the phase fractions of the components in this catalyst after applying -0.8 V vs RHE in the nitrate-free electrolyte.
3. Explain the physical reasoning for the observed phase composition under these specific conditions (nitrate-free, -0.8 V), particularly in comparison to how the catalyst behaves in a nitrate-containing electrolyte.
Ground Truth
Material: Cu1 (single-atom Cu on graphene)
Measurement: Cu K-edge in situ XAS in fluorescence mode at Beamline 8-ID, NSLS-II
Fit method: Linear combination fitting (LCF)
Phase fractions: (±15%)
| Phase | Fraction |
|---|---|
| Cu-N (single atom) | 0.6 |
| metallic Cu (Cu-Cu) | 0.4 |
Fit basis (paper's reference spectra):
- single-atom Cu (Cu-N coordination, CuPc reference)
- metallic Cu (Cu-Cu coordination, Cu foil reference)
Source evidence: Figure 5d and Section 'In Situ XAS Reveals Conformational Changes of Cu1 and CuNP', page 15
Key reasoning: Under reductive potentials (-0.8 V), the single-atom Cu1 catalyst undergoes restructuring, forming metallic Cu clusters. However, in the absence of nitrate (0 M KNO3), this restructuring is less extensive compared to operation in nitrate-containing electrolytes. Because nitrate promotes the mobility and aggregation of Cu atoms, its absence results in a smaller magnitude of restructuring, leaving a majority of the catalyst (~60%) in the original single-atom Cu-N configuration while the remainder (~40%) forms metallic Cu-Cu clusters.
Reasoning source: Section 'In Situ XAS Reveals Conformational Changes of Cu1 and CuNP', page 15
Scoring Rubric (total: 100 pts)
| Q | Type | Max | Question | Reference Answer | Scoring Criteria |
|---|---|---|---|---|---|
| q1 | identification | 20 | What candidate reference spectra or structural motifs should be used as the basis for linear combination fitting of this single-atom Cu catalyst under these specific in situ conditions? | The basis for linear combination fitting should include a single-atom Cu reference with Cu-N coordination (such as CuPc) and a metallic Cu reference with Cu-Cu coordination (such as Cu foil). These specific phases are expected because the single-atom Cu catalyst on graphene undergoes structural changes under the applied reductive potential of -0.8 V vs RHE. Specifically, the reductive conditions drive the restructuring of the initial single-atom Cu sites into metallic Cu clusters. However, because the electrolyte is nitrate-free (0 M KNO3), this aggregation is limited, requiring both the original Cu-N motif and the newly formed metallic Cu-Cu motif to accurately model the mixed state of the catalyst. | Full credit for identifying both single-atom Cu (or Cu-N coordination) and metallic Cu (or Cu-Cu clusters) as the necessary basis components. |
| q2 | quantification | 40 | Estimate the phase fractions of the components in this catalyst after applying -0.8 V vs RHE in the nitrate-free electrolyte. | Under these conditions, the catalyst consists of approximately 60% single-atom Cu (Cu-N coordination) and 40% metallic Cu (Cu-Cu coordination), with an uncertainty of 15%. These specific fractions result from the application of a reductive potential (-0.8 V vs RHE) in an electrolyte containing 0 M KNO3. While the reductive potential induces restructuring of the single-atom Cu into metallic clusters, the absence of nitrate significantly limits this process. Because nitrate typically promotes the mobility and aggregation of Cu atoms, its absence ensures a smaller magnitude of restructuring, allowing the majority of the catalyst (60%) to remain in its original single-atom configuration while only 40% aggregates into metallic clusters. | Full credit for estimating approximately 60% single-atom Cu (Cu-N) and 40% metallic Cu. Partial credit for identifying that it is a mixture where the single-atom phase remains the majority component. |
| q3 | reasoning | 40 | Explain the physical reasoning for the observed phase composition under these specific conditions (nitrate-free, -0.8 V), particularly in comparison to how the catalyst behaves in a nitrate-containing electrolyte. | The observed phase composition of 60% single-atom Cu and 40% metallic Cu is driven by the interplay between the applied reductive potential and the electrolyte composition. At -0.8 V vs RHE, the single-atom Cu1 catalyst is thermodynamically driven to undergo restructuring and form metallic Cu clusters. However, the extent of this aggregation is highly dependent on the presence of nitrate, which promotes the mobility and aggregation of Cu atoms. In this nitrate-free environment (0 M KNO3), the mobility of the Cu atoms is restricted compared to operation in nitrate-containing electrolytes. Consequently, the magnitude of restructuring is significantly reduced, leaving the majority of the catalyst in its original Cu-N configuration rather than fully converting to metallic Cu-Cu clusters. | Full credit for explaining that while the reductive potential drives restructuring into metallic clusters, the absence of nitrate limits this aggregation because nitrate species promote Cu atom mobility. Thus, restructuring is less extensive than in nitrate-containing electrolytes, leaving a larger fraction of intact Cu-N sites. |
Review
#541
Cu
Cu K
▶
LLM Prompt
Sample Information
Material: Cu
Support: graphene
Reaction Conditions: 0.15 M K2SO4, pH 11.5, OCV post-reaction
Sample-Specific Conditions
- Electrolyte composition: 0 M KNO3 (post)
- Single-atom Cu catalyst on graphene after HER (no nitrate)
Measurement
We plan to measure the Cu K XANES spectrum of this sample.
Questions
Based on all the information above:
1. What candidate reference spectra or structural motifs should be included in the basis set for linear combination fitting (LCF) of this single-atom Cu catalyst during and after electrocatalytic testing?
2. Based on the provided reaction conditions (nitrate-free electrolyte, post-reaction at OCV), estimate the phase fractions of the Cu species present in the catalyst.
Ground Truth
Material: Cu1 (single-atom Cu on graphene)
Measurement: Cu K-edge, in situ fluorescence mode, Beamline 8-ID (NSLS-II)
Fit method: Linear combination fitting (LCF)
Phase fractions: (±10%)
| Phase | Fraction |
|---|---|
| Cu-N (single atom) | 0.8 |
| metallic Cu (Cu-Cu) | 0.2 |
Fit basis (paper's reference spectra):
- single-atom Cu (Cu-N coordination, CuPc reference)
- metallic Cu (Cu-Cu coordination, Cu foil reference)
Source evidence: Figure 5d and text on Page 15, lines 371-372
Key reasoning: During the applied reductive potential, the single-atom Cu (Cu1) catalyst restructures into metallic Cu clusters. Upon returning to open circuit voltage (OCV) post-reaction, these clusters redisperse back toward a single-atom configuration. However, in the nitrate-free electrolyte, this redispersion is incomplete, with only ~80% of the Cu1 species recovered. The lack of nitrate, which otherwise promotes Cu mobility and stabilizes dissolved Cu2+ species through complexation during reoxidation, results in a residual ~20% metallic Cu fraction.
Reasoning source: Page 15, lines 366-377
Scoring Rubric (total: 100 pts)
| Q | Type | Max | Question | Reference Answer | Scoring Criteria |
|---|---|---|---|---|---|
| q1 | identification | 33 | What candidate reference spectra or structural motifs should be included in the basis set for linear combination fitting (LCF) of this single-atom Cu catalyst during and after electrocatalytic testing? | The basis set for linear combination fitting (LCF) should include single-atom Cu (Cu-N coordination, using a CuPc reference) and metallic Cu (Cu-Cu coordination, using a Cu foil reference). These specific phases are expected because the single-atom Cu catalyst on graphene undergoes dynamic structural changes during electrocatalytic testing. Under reductive potentials, the single-atom Cu restructures into metallic Cu clusters. Upon returning to open circuit voltage (OCV) post-reaction in the 0 M KNO3 (nitrate-free) electrolyte, the clusters attempt to redisperse back into single atoms, but the lack of nitrate prevents complete redispersion, necessitating both single-atom and metallic references to capture the mixed state. | Full points for identifying both single-atom Cu (Cu-N coordination) and metallic Cu (Cu-Cu coordination) as the necessary basis components. |
| q2 | quantification | 67 | Based on the provided reaction conditions (nitrate-free electrolyte, post-reaction at OCV), estimate the phase fractions of the Cu species present in the catalyst. | The estimated phase fractions for this catalyst are 0.8 (80%) single-atom Cu (Cu-N coordination) and 0.2 (20%) metallic Cu (Cu-Cu coordination), with an uncertainty of 10%. These specific values result from the catalyst's incomplete structural recovery at open circuit voltage (OCV) following the reaction in a nitrate-free (0 M KNO3) electrolyte. During the applied reductive potential, the single-atom Cu restructures into metallic clusters, which then attempt to redisperse back to single atoms at OCV. Because the electrolyte lacks nitrate—which otherwise promotes Cu mobility and stabilizes dissolved Cu2+ species through complexation during reoxidation—only ~80% of the single-atom species is recovered, leaving a residual ~20% metallic Cu fraction. | Full points for estimating ~80% single-atom Cu (Cu-N) and ~20% metallic Cu. Partial points for recognizing that the single-atom phase is dominant but incomplete recovery leaves a minority metallic phase. |
Review
Selective Photochemical Oxidation of Reduced Dissolved Organic Sulfur to Inorganic Sulfate
APS
Environmental
Brett A. Poulin
DOI: 10.1021/acs.estlett.3c00210
9 scenarios
▶
#542
Dissolved organic matter (DOM)
S K
▶
LLM Prompt
Sample Information
Material: Dissolved organic matter (DOM)
Sample Origin: Florida Everglades wetland (site WCA 2A-O)
Sample-Specific Conditions
- Experimental treatment: Initial
- Initial dissolved organic matter (DOM) sample before oxidation experiments
Measurement
We plan to measure the S K XANES spectrum of this sample.
Questions
Based on all the information above:
1. What candidate reference spectra (sulfur phases or structural motifs) are needed to fit the S K-edge XANES spectrum of this initial DOM sample?
2. Estimate the phase fractions of the sulfur species in this initial DOM sample prior to oxidation.
3. Based on the sample conditions (initial state before oxidation experiments), explain the expected distribution of sulfur oxidation states in this DOM sample.
Ground Truth
Material: Dissolved organic matter (DOM)
Measurement: S K XANES
Fit method: LCF
Phase fractions: (±10%)
| Phase | Fraction |
|---|---|
| DOS_Red | 0.82 |
| DOS_Sulfx | 0.008 |
| DOS_SO2 | 0.024 |
| DOS_SO3 | 0.12 |
| DOS_SO4 | 0.029 |
Fit basis (paper's reference spectra):
- DOS_Red
- DOS_Sulfx
- DOS_SO2
- DOS_SO3
- DOS_SO4
Source evidence: Table 1
Key reasoning: Before oxidation experiments, the initial dissolved organic matter (DOM) from the Florida Everglades wetland is predominantly composed of reduced sulfur species (82%). Oxidized species are present but minor, with sulfonate (DOS_SO3) being the most abundant oxidized form (12%), while intermediate oxidation states (sulfoxides, sulfones) and sulfate are present at very low fractions (<3%).
Reasoning source: Table 1 and sample description
Scoring Rubric (total: 100 pts)
| Q | Type | Max | Question | Reference Answer | Scoring Criteria |
|---|---|---|---|---|---|
| q1 | identification | 30 | What candidate reference spectra (sulfur phases or structural motifs) are needed to fit the S K-edge XANES spectrum of this initial DOM sample? | To fit the S K-edge XANES spectrum of this sample, the required reference spectra are DOS_Red (reduced sulfur), DOS_Sulfx (sulfoxides), DOS_SO2 (sulfones), DOS_SO3 (sulfonates), and DOS_SO4 (sulfates). These specific structural motifs are needed because the sample is an initial dissolved organic matter (DOM) extract from a wetland environment prior to any experimental oxidation. In this natural, unoxidized state, the DOM is expected to be predominantly composed of reduced sulfur species. However, a full suite of references spanning intermediate to fully oxidized states is still required to account for the minor naturally occurring oxidized species, such as sulfonates, present in the Everglades wetland DOM. | Full credit for identifying reduced sulfur (DOS_Red), sulfoxide (DOS_Sulfx), sulfone (DOS_SO2), sulfonate (DOS_SO3), and sulfate (DOS_SO4) as the necessary basis components. |
| q2 | quantification | 40 | Estimate the phase fractions of the sulfur species in this initial DOM sample prior to oxidation. | The estimated phase fractions for the sulfur species in this sample are 0.82 (82%) DOS_Red, 0.12 (12%) DOS_SO3, 0.029 (2.9%) DOS_SO4, 0.024 (2.4%) DOS_SO2, and 0.008 (0.8%) DOS_Sulfx, with an uncertainty of 10%. These specific values result from the sample being in its initial state before any experimental oxidation treatments are applied. Because it represents the natural state of the Florida Everglades wetland DOM, the vast majority of the sulfur remains in a reduced form (82%). The remaining fractions reflect minor naturally occurring oxidized species, where sulfonate is the most abundant oxidized form (12%) and intermediate oxidation states (sulfoxides, sulfones) alongside sulfate are present at very low fractions (<3%). | Full credit for estimating DOS_Red at ~82%, DOS_SO3 at ~12%, and minor contributions (<3% each) for DOS_Sulfx, DOS_SO2, and DOS_SO4. |
| q3 | reasoning | 30 | Based on the sample conditions (initial state before oxidation experiments), explain the expected distribution of sulfur oxidation states in this DOM sample. | The expected distribution of sulfur oxidation states is heavily skewed toward reduced sulfur, which makes up 82% of the sample (DOS_Red). This distribution occurs because the dissolved organic matter (DOM) originates from a Florida Everglades wetland and is in its initial state prior to any experimental oxidation. Without the application of oxidative treatments, the natural wetland conditions preserve sulfur predominantly in its reduced forms. Consequently, oxidized species are present only as minor components, with sulfonate (DOS_SO3) being the most abundant at 12%, while intermediate oxidation states like sulfoxides and sulfones, as well as sulfates, remain at very low fractions below 3%. | Full credit for explaining that because the sample is in its initial state before experimental oxidation, it is heavily dominated by reduced sulfur species, with sulfonate being the only notable oxidized species, while intermediate oxidation states remain negligible. |
Review
#543
Dissolved organic matter (DOM)
S K
▶
LLM Prompt
Sample Information
Material: Dissolved organic matter (DOM)
Sample Origin: Florida Everglades wetland (site WCA 2A-O)
Sample-Specific Conditions
- Experimental treatment: Dark, anoxic, 336 h
- DOM stored in the dark under N2 for 14 days
Measurement
We plan to measure the S K XANES spectrum of this sample.
Questions
Based on all the information above:
1. What candidate sulfur functional groups (reference spectra) should be included in a linear combination fitting (LCF) model to accurately capture the speciation of this DOM sample?
2. Estimate the relative phase fractions of the sulfur species in this sample. Which sulfur oxidation state dominates, and what are the approximate fractions of the major oxidized species (sulfonate and sulfate)?
3. Explain why the sulfur speciation in this sample is distributed this way, specifically considering the experimental conditions (dark, anoxic, 14 days).
Ground Truth
Material: Dissolved organic matter (DOM)
Measurement: S K XANES
Fit method: LCF
Phase fractions: (±10%)
| Phase | Fraction |
|---|---|
| DOS_Red | 0.77 |
| DOS_Sulfx | 0.015 |
| DOS_SO2 | 0.028 |
| DOS_SO3 | 0.13 |
| DOS_SO4 | 0.058 |
Fit basis (paper's reference spectra):
- Reduced S (DOS_Red)
- Sulfoxide (DOS_Sulfx)
- Sulfone (DOS_SO2)
- Sulfonate (DOS_SO3)
- Sulfate (DOS_SO4)
Source evidence: Table 1
Key reasoning: This sample serves as a dark, anoxic control for DOM weathering experiments. Because it is stored in the dark under N2, photo-oxidation and aerobic oxidation pathways are inhibited. Consequently, the sulfur speciation remains heavily dominated by reduced sulfur (77%), reflecting the native, unoxidized state of the Everglades wetland DOM. The minor oxidized components (sulfonate and sulfate) represent the baseline composition rather than newly formed oxidation products.
Reasoning source: Inferred from sample description (Dark, Anoxic Control) and Table 1 phase fractions
Scoring Rubric (total: 100 pts)
| Q | Type | Max | Question | Reference Answer | Scoring Criteria |
|---|---|---|---|---|---|
| q1 | identification | 20 | What candidate sulfur functional groups (reference spectra) should be included in a linear combination fitting (LCF) model to accurately capture the speciation of this DOM sample? | The linear combination fitting (LCF) model for this DOM sample should include reference spectra for reduced sulfur, sulfoxide, sulfone, sulfonate, and sulfate. These specific phases are expected because the sample serves as a dark, anoxic control for DOM weathering experiments. Since the sample was stored in the dark under N2 for 14 days, photo-oxidation and aerobic oxidation pathways are completely inhibited. Therefore, the required reference spectra must capture the native, unoxidized state of the Everglades wetland DOM, which consists primarily of reduced sulfur along with baseline levels of pre-existing oxidized sulfur species. | Full points if the answer identifies reduced sulfur, sulfoxide, sulfone, sulfonate, and sulfate as the necessary basis components. |
| q2 | quantification | 40 | Estimate the relative phase fractions of the sulfur species in this sample. Which sulfur oxidation state dominates, and what are the approximate fractions of the major oxidized species (sulfonate and sulfate)? | The sulfur speciation is heavily dominated by reduced sulfur at approximately 77%, with minor contributions from sulfonate (13%), sulfate (5.8%), sulfone (2.8%), and sulfoxide (1.5%), all with an estimated uncertainty of 10%. These specific values result from the experimental treatment of storing the sample in the dark under anoxic (N2) conditions for 336 hours. Because these conditions inhibit both photo-oxidation and aerobic oxidation, no new oxidation products are formed during the 14-day period. Consequently, the high fraction of reduced sulfur reflects the native state of the Everglades wetland DOM, while the minor fractions of sulfonate and sulfate merely represent the baseline composition of the original material. | Full points if the answer correctly predicts that reduced sulfur dominates (~77%), with minor contributions from sulfonate (~13%) and sulfate (~6%), and trace amounts of intermediate oxidation states. |
| q3 | reasoning | 40 | Explain why the sulfur speciation in this sample is distributed this way, specifically considering the experimental conditions (dark, anoxic, 14 days). | The sulfur speciation is distributed with a heavy dominance of reduced sulfur (77%) because this sample acts as a dark, anoxic control for DOM weathering experiments. By storing the Everglades wetland DOM in the dark under N2 for 336 hours (14 days), both photo-oxidation and aerobic oxidation pathways are strictly inhibited. Without light or oxygen to drive weathering mechanisms, the sulfur speciation remains in its native, unoxidized state. As a result, the minor oxidized components present, such as sulfonate (13%) and sulfate (5.8%), represent the baseline composition of the original wetland DOM rather than any newly formed oxidation products. | Full points if the answer explains that the dark and anoxic (N2) conditions prevent photo-oxidation and aerobic oxidation, thereby maintaining the naturally high proportion of reduced sulfur inherent to the original wetland DOM. |
Review
#544
Dissolved organic matter (DOM)
S K
▶
LLM Prompt
Sample Information
Material: Dissolved organic matter (DOM)
Sample Origin: Florida Everglades wetland (site WCA 2A-O)
Sample-Specific Conditions
- Experimental treatment: Dark, O2 purge, 192 h
- DOM purged with zero-grade air in the dark for 192 h
Measurement
We plan to measure the S K XANES spectrum of this sample.
Questions
Based on all the information above:
1. What candidate sulfur structural motifs or reference spectra should be included in the basis set to model the S K-edge XANES spectrum of this Everglades DOM sample?
2. Estimate the relative phase fractions of the sulfur species (reduced S, sulfoxide, sulfone, sulfonate, sulfate) in this DOM sample after 192 hours of dark O2 purging.
3. Explain why reduced sulfur remains the overwhelmingly dominant species (~79%) in this sample despite being continuously purged with oxygen (zero-grade air) for 192 hours.
Ground Truth
Material: Dissolved organic matter (DOM)
Measurement: S K-edge XANES
Fit method: Linear Combination Fitting (LCF)
Phase fractions: (±10%)
| Phase | Fraction |
|---|---|
| DOS_Red | 0.79 |
| DOS_Sulfx | 0.012 |
| DOS_SO2 | 0.027 |
| DOS_SO3 | 0.13 |
| DOS_SO4 | 0.035 |
Fit basis (paper's reference spectra):
- Reduced sulfur (DOS_Red)
- Sulfoxide (DOS_Sulfx)
- Sulfone (DOS_SO2)
- Sulfonate (DOS_SO3)
- Sulfate (DOS_SO4)
Source evidence: Table 1
Key reasoning: The sample was subjected to a dark O2 purge for 192 hours, serving as a non-photochemical oxidation treatment. Despite prolonged exposure to oxygen (20.5% O2), the oxidation of sulfur is limited without light, leaving reduced sulfur (DOS_Red) as the dominant phase at 79%. The oxidized fractions, such as sulfonate (13%) and sulfate (3.5%), primarily reflect the inherent composition of the Everglades DOM or very slow dark oxidation processes, demonstrating that O2 alone is inefficient at rapidly oxidizing DOM sulfur compared to photochemical pathways.
Reasoning source: Discussion of Table 1 and experimental treatments
Scoring Rubric (total: 100 pts)
| Q | Type | Max | Question | Reference Answer | Scoring Criteria |
|---|---|---|---|---|---|
| q1 | identification | 20 | What candidate sulfur structural motifs or reference spectra should be included in the basis set to model the S K-edge XANES spectrum of this Everglades DOM sample? | The basis set for modeling the S K-edge XANES spectrum of this Everglades DOM sample should include reduced sulfur, sulfoxide, sulfone, sulfonate, and sulfate. These specific reference spectra are required because the sample was subjected to a dark O2 purge for 192 hours, which acts as a non-photochemical oxidation treatment. Under these dark conditions, oxygen alone is inefficient at rapidly oxidizing the DOM sulfur, meaning the original reduced sulfur motifs remain highly prevalent. Meanwhile, the oxidized motifs (sulfoxide, sulfone, sulfonate, and sulfate) must be included to account for the inherent composition of the Everglades DOM and any minor products of the very slow dark oxidation process. | Full credit for identifying the five key sulfur oxidation states/motifs: reduced sulfur, sulfoxide, sulfone, sulfonate, and sulfate. |
| q2 | quantification | 40 | Estimate the relative phase fractions of the sulfur species (reduced S, sulfoxide, sulfone, sulfonate, sulfate) in this DOM sample after 192 hours of dark O2 purging. | The estimated relative phase fractions for this DOM sample are 79% reduced sulfur, 1.2% sulfoxide, 2.7% sulfone, 13% sulfonate, and 3.5% sulfate, with an uncertainty of 10%. These specific values result from the sample being purged with zero-grade air in the dark for 192 hours, which severely limits the oxidation of sulfur due to the absence of light. Because non-photochemical oxidation by O2 alone is highly inefficient, the vast majority of the sulfur remains in its original reduced state (79%). The minor oxidized fractions, such as the 13% sulfonate and 3.5% sulfate, primarily reflect the inherent starting composition of the Everglades wetland DOM rather than rapid oxidation during the treatment. | Full credit for estimating fractions close to the ground truth: ~79% reduced S, ~13% sulfonate, ~3.5% sulfate, and minor amounts (<3%) of sulfoxide and sulfone. Deduct points proportionally for large deviations. |
| q3 | reasoning | 40 | Explain why reduced sulfur remains the overwhelmingly dominant species (~79%) in this sample despite being continuously purged with oxygen (zero-grade air) for 192 hours. | Reduced sulfur remains the dominant species at approximately 79% because the 192-hour oxygen purge was conducted entirely in the dark. This experimental treatment serves as a non-photochemical oxidation process, which is highly inefficient at rapidly oxidizing DOM sulfur compared to photochemical pathways. Without light to drive the reaction, prolonged exposure to the O2 in zero-grade air results in very limited sulfur oxidation. Consequently, the sulfur speciation largely retains its initial reduced state, with the minor oxidized fractions present mainly reflecting the inherent composition of the Everglades DOM or extremely slow dark oxidation processes. | Full credit for explaining that without light (dark conditions), oxidation by O2 alone is kinetically slow/inefficient, meaning the sulfur speciation largely retains its initial highly reduced state. |
Review
#545
Dissolved organic matter (DOM)
S K
▶
LLM Prompt
Sample Information
Material: Dissolved organic matter (DOM)
Sample Origin: Florida Everglades wetland (site WCA 2A-O)
Sample-Specific Conditions
- Irradiance time: 1.3 h
- DOM exposed to artificial sunlight for 1.3 h
Measurement
We plan to measure the S K XANES spectrum of this sample.
Questions
Based on all the information above:
1. What candidate reference spectra or sulfur functional groups should be included in the basis set to accurately model the S K-edge XANES spectrum of this photo-oxidized DOM sample?
2. Estimate the relative fractions of the different sulfur functional groups (reduced S, sulfoxide, sulfone, sulfonate, sulfate) in this DOM sample after 1.3 hours of irradiation.
3. Based on the environmental conditions (oxygen-saturated, artificial sunlight for 1.3 h), explain the expected distribution of sulfur oxidation states and why reduced sulfur remains the dominant phase.
Ground Truth
Material: Dissolved organic matter (DOM)
Measurement: S K-edge XANES
Fit method: LCF
Phase fractions: (±10%)
| Phase | Fraction |
|---|---|
| DOS_Red | 0.77 |
| DOS_Sulfx | 0.018 |
| DOS_SO2 | 0.029 |
| DOS_SO3 | 0.14 |
| DOS_SO4 | 0.051 |
Fit basis (paper's reference spectra):
- Reduced sulfur (DOS_Red)
- Sulfoxide (DOS_Sulfx)
- Sulfone (DOS_SO2)
- Sulfonate (DOS_SO3)
- Sulfate (DOS_SO4)
Source evidence: Table 1
Key reasoning: Exposure of the DOM to artificial sunlight under oxygen-saturated conditions initiates the photo-oxidation of dissolved organic sulfur. After a short irradiation time of 1.3 hours, the highly reduced sulfur (DOS_Red) begins to oxidize into intermediate and highly oxidized species such as sulfoxide, sulfone, sulfonate, and sulfate. However, due to the brief exposure time, the photo-oxidation is still in its early stages, leaving the vast majority (77%) of the sulfur in its original reduced state.
Reasoning source: Discussion of Table 1 and photo-oxidation results
Scoring Rubric (total: 100 pts)
| Q | Type | Max | Question | Reference Answer | Scoring Criteria |
|---|---|---|---|---|---|
| q1 | identification | 20 | What candidate reference spectra or sulfur functional groups should be included in the basis set to accurately model the S K-edge XANES spectrum of this photo-oxidized DOM sample? | To accurately model the S K-edge XANES spectrum of this sample, the basis set should include reduced sulfur (DOS_Red), sulfoxide (DOS_Sulfx), sulfone (DOS_SO2), sulfonate (DOS_SO3), and sulfate (DOS_SO4). These specific functional groups are required because exposing the Florida Everglades dissolved organic matter (DOM) to artificial sunlight under oxygen-saturated conditions initiates the photo-oxidation of dissolved organic sulfur. After 1.3 hours of irradiation, the original highly reduced sulfur begins to transform into these intermediate and highly oxidized species. Therefore, a complete basis set must account for both the initial reduced state and the newly formed oxidized products. | Full credit if the answer identifies reduced sulfur, sulfoxide, sulfone, sulfonate, and sulfate as the necessary components for the fit. |
| q2 | quantification | 40 | Estimate the relative fractions of the different sulfur functional groups (reduced S, sulfoxide, sulfone, sulfonate, sulfate) in this DOM sample after 1.3 hours of irradiation. | The estimated relative fractions for the sulfur functional groups are 0.77 for reduced sulfur (DOS_Red), 0.018 for sulfoxide (DOS_Sulfx), 0.029 for sulfone (DOS_SO2), 0.14 for sulfonate (DOS_SO3), and 0.051 for sulfate (DOS_SO4), with a 10% uncertainty. These specific values result from the brief 1.3-hour exposure of the DOM to artificial sunlight under oxygen-saturated conditions. Because the irradiation time is short, the photo-oxidation process is still in its early stages. Consequently, while some intermediate and highly oxidized species have formed, the vast majority (77%) of the sulfur remains in its original reduced state. | Full credit if the estimated fractions are within ±10% of the ground truth values: DOS_Red (~77%), DOS_Sulfx (~1.8%), DOS_SO2 (~2.9%), DOS_SO3 (~14%), and DOS_SO4 (~5.1%). |
| q3 | reasoning | 40 | Based on the environmental conditions (oxygen-saturated, artificial sunlight for 1.3 h), explain the expected distribution of sulfur oxidation states and why reduced sulfur remains the dominant phase. | When the dissolved organic matter (DOM) from the Florida Everglades is exposed to artificial sunlight under oxygen-saturated conditions, a photo-oxidation mechanism is initiated. This process causes the initial highly reduced sulfur to begin oxidizing into intermediate and highly oxidized species, such as sulfoxide, sulfone, sulfonate, and sulfate. However, because the irradiation time is only 1.3 hours, the photo-oxidation reaction is still in its very early stages. As a direct outcome of this brief exposure, the transformation is incomplete, leaving 77% of the sulfur in its original reduced state (DOS_Red) as the dominant phase. | Full credit if the answer explains that while photo-oxidation produces intermediate and highly oxidized sulfur species (sulfoxide, sulfone, sulfonate, sulfate), the short irradiation time (1.3 h) means the reaction is in its early stages, leaving the majority of sulfur in its original reduced state. |
Review
#546
Dissolved organic matter (DOM)
S K
▶
LLM Prompt
Sample Information
Material: Dissolved organic matter (DOM)
Sample Origin: Florida Everglades wetland (site WCA 2A-O)
Sample-Specific Conditions
- Irradiance time: 5.3 h
- DOM exposed to artificial sunlight for 5.3 h
Measurement
We plan to measure the S K XANES spectrum of this sample.
Questions
Based on all the information above:
1. What candidate reference spectra (sulfur phases) are needed to adequately model the S K-edge XANES spectrum of this DOM sample using Linear Combination Fitting?
2. Estimate the phase fractions of the various sulfur species in this DOM sample after 5.3 hours of artificial sunlight irradiation.
3. Explain the physical reasoning for the expected sulfur speciation in this sample, specifically considering the environmental conditions (oxygen-saturated, artificial sunlight for 5.3 h).
Ground Truth
Material: Dissolved organic matter (DOM)
Measurement: S K-edge XANES
Fit method: LCF
Phase fractions: (±10%)
| Phase | Fraction |
|---|---|
| DOS_Red | 0.73 |
| DOS_Sulfx | 0.022 |
| DOS_SO2 | 0.033 |
| DOS_SO3 | 0.15 |
| DOS_SO4 | 0.062 |
Fit basis (paper's reference spectra):
- DOS_Red
- DOS_Sulfx
- DOS_SO2
- DOS_SO3
- DOS_SO4
Source evidence: table_1
Key reasoning: The DOM sample was exposed to artificial sunlight (500 W m-2) for 5.3 hours under oxygen-saturated conditions at pH 7 and 30 °C. This irradiance drives the photo-oxidation of sulfur in the DOM, converting a portion of the initially reduced sulfur pool into intermediate and highly oxidized sulfur species. Consequently, the speciation reflects a mixture still dominated by reduced sulfur (73%), but with significant fractions of photo-oxidized products including sulfonate (15%), sulfate (6.2%), sulfone/sulfinate (3.3%), and sulfoxide (2.2%).
Reasoning source: Sample description and environmental conditions context
Scoring Rubric (total: 100 pts)
| Q | Type | Max | Question | Reference Answer | Scoring Criteria |
|---|---|---|---|---|---|
| q1 | identification | 20 | What candidate reference spectra (sulfur phases) are needed to adequately model the S K-edge XANES spectrum of this DOM sample using Linear Combination Fitting? | To adequately model the S K-edge XANES spectrum of this DOM sample using Linear Combination Fitting, the required reference spectra are DOS_Red (reduced sulfur), DOS_Sulfx (sulfoxide), DOS_SO2 (sulfone/sulfinate), DOS_SO3 (sulfonate), and DOS_SO4 (sulfate). These specific phases are expected because the sample was exposed to artificial sunlight (500 W m-2) for 5.3 hours under oxygen-saturated conditions at pH 7 and 30 °C. This irradiance drives the photo-oxidation of the initially reduced sulfur pool present in the Everglades wetland DOM. Consequently, the model must account for both the remaining reduced sulfur and the newly generated intermediate and highly oxidized sulfur species. | Full credit if the answer identifies reduced sulfur, sulfoxide, sulfone/sulfinate (SO2), sulfonate (SO3), and sulfate (SO4) as the necessary basis components. |
| q2 | quantification | 40 | Estimate the phase fractions of the various sulfur species in this DOM sample after 5.3 hours of artificial sunlight irradiation. | After 5.3 hours of artificial sunlight irradiation, the estimated phase fractions are 0.73 (73%) DOS_Red, 0.15 (15%) DOS_SO3, 0.062 (6.2%) DOS_SO4, 0.033 (3.3%) DOS_SO2, and 0.022 (2.2%) DOS_Sulfx, with an uncertainty of 10%. These specific values result from the photo-oxidation of sulfur in the DOM driven by the 5.3 hours of artificial sunlight exposure under oxygen-saturated conditions at pH 7 and 30 °C. The irradiance provides enough energy to convert a portion of the sulfur, meaning the mixture remains dominated by the initially reduced sulfur pool (73%), but develops significant oxidized fractions. As a result, intermediate and highly oxidized species like sulfonate (15%) and sulfate (6.2%) emerge as the primary photo-oxidized products, alongside minor amounts of sulfone/sulfinate and sulfoxide. | Full credit if the estimated fractions are within ±10% of the ground truth: DOS_Red (~73%), DOS_SO3 (~15%), DOS_SO4 (~6.2%), DOS_SO2 (~3.3%), and DOS_Sulfx (~2.2%). Partial credit for correctly identifying the relative abundance ranking (Red > SO3 > SO4 > SO2 > Sulfx). |
| q3 | reasoning | 40 | Explain the physical reasoning for the expected sulfur speciation in this sample, specifically considering the environmental conditions (oxygen-saturated, artificial sunlight for 5.3 h). | The expected sulfur speciation in this DOM sample is driven by its exposure to artificial sunlight (500 W m-2) for 5.3 hours under oxygen-saturated conditions at pH 7 and 30 °C. This specific combination of irradiance and oxygen availability triggers the photo-oxidation of the sulfur naturally present in the Everglades wetland DOM. The photochemical mechanism systematically converts a portion of the initially reduced sulfur pool into intermediate and highly oxidized sulfur species. Ultimately, this mechanism results in a speciation outcome that is still predominantly reduced sulfur (73%), but contains a clear, quantifiable signature of photo-oxidized products including sulfonate (15%), sulfate (6.2%), sulfone/sulfinate (3.3%), and sulfoxide (2.2%). | Full credit if the answer explains that the combination of oxygen saturation and artificial sunlight drives photo-oxidation of the DOM, leading to the conversion of reduced sulfur into a distribution of oxidized species (sulfoxides, sulfones, sulfonates, and sulfates) while reduced sulfur remains the dominant phase. |
Review
#547
Dissolved organic matter (DOM)
S K
▶
LLM Prompt
Sample Information
Material: Dissolved organic matter (DOM)
Sample Origin: Florida Everglades wetland (site WCA 2A-O)
Sample-Specific Conditions
- Irradiance time: 24 h
- DOM exposed to artificial sunlight for 24 h
Measurement
We plan to measure the S K XANES spectrum of this sample.
Questions
Based on all the information above:
1. What candidate reference spectra (sulfur functional groups) are needed to properly model the S K-edge XANES spectrum of this DOM sample using Linear Combination Fitting?
2. Estimate the relative phase fractions of the sulfur species in this DOM sample after 24 hours of artificial sunlight exposure.
3. Explain the physical and chemical reasoning for the expected sulfur speciation in this sample, given its exposure to a solar simulator (500 W m-2) for 24 hours in an oxygen-saturated, pH 7 environment.
Ground Truth
Material: Dissolved organic matter (DOM) from Florida Everglades wetland (site WCA 2A-O)
Measurement: S K-edge XANES
Fit method: LCF
Phase fractions: (±10%)
| Phase | Fraction |
|---|---|
| DOS_Red | 0.68 |
| DOS_Sulfx | 0.032 |
| DOS_SO2 | 0.037 |
| DOS_SO3 | 0.18 |
| DOS_SO4 | 0.079 |
Fit basis (paper's reference spectra):
- DOS_Red (Reduced S)
- DOS_Sulfx (Sulfoxide)
- DOS_SO2 (Sulfone)
- DOS_SO3 (Sulfonate)
- DOS_SO4 (Sulfate)
Source evidence: Table 1
Key reasoning: Exposure of the DOM to artificial sunlight for 24 hours under oxygen-saturated conditions induces photochemical oxidation of the sulfur species. While the majority of the sulfur remains in reduced forms (DOS_Red, 68%), the irradiation drives the formation of intermediate and highly oxidized sulfur species, predominantly sulfonate (18%) and sulfate (7.9%), along with minor amounts of sulfoxide and sulfone.
Reasoning source: Results and Discussion / Table 1
Scoring Rubric (total: 100 pts)
| Q | Type | Max | Question | Reference Answer | Scoring Criteria |
|---|---|---|---|---|---|
| q1 | identification | 20 | What candidate reference spectra (sulfur functional groups) are needed to properly model the S K-edge XANES spectrum of this DOM sample using Linear Combination Fitting? | To properly model the S K-edge XANES spectrum of this DOM sample using Linear Combination Fitting, the required reference spectra are DOS_Red (Reduced S), DOS_Sulfx (Sulfoxide), DOS_SO2 (Sulfone), DOS_SO3 (Sulfonate), and DOS_SO4 (Sulfate). These specific sulfur functional groups are expected because exposing the Florida Everglades DOM to artificial sunlight for 24 hours induces photochemical oxidation of the sulfur species. While a large portion of the sulfur remains in its original reduced state, the irradiation drives the formation of intermediate and highly oxidized sulfur species. Therefore, the fitting basis must account for the unreacted reduced sulfur as well as the newly formed oxidized products. | Full credit for identifying the need for a basis set that spans the oxidation states, specifically including reduced S, sulfoxide, sulfone, sulfonate, and sulfate. |
| q2 | quantification | 40 | Estimate the relative phase fractions of the sulfur species in this DOM sample after 24 hours of artificial sunlight exposure. | The estimated relative phase fractions for the sulfur species in this sample are 68% DOS_Red (Reduced S), 18% DOS_SO3 (Sulfonate), 7.9% DOS_SO4 (Sulfate), 3.7% DOS_SO2 (Sulfone), and 3.2% DOS_Sulfx (Sulfoxide), with an uncertainty of 10%. These specific values result from the 24-hour exposure of the DOM to artificial sunlight under oxygen-saturated conditions, which triggers photochemical oxidation. Because the 24-hour irradiation period is insufficient to fully oxidize the sample, the majority of the sulfur (68%) remains in reduced forms. The oxidized fraction is predominantly converted into highly oxidized sulfonate and sulfate, with only minor amounts captured as intermediate sulfoxide and sulfone species. | Score based on proximity to the ground truth: Reduced S (DOS_Red) ~68%, Sulfonate (DOS_SO3) ~18%, Sulfate (DOS_SO4) ~8%, with minor contributions (~3-4% each) from Sulfoxide and Sulfone. Deduct points for missing the dominant reduced fraction or the significant sulfonate/sulfate photo-oxidation products. |
| q3 | reasoning | 40 | Explain the physical and chemical reasoning for the expected sulfur speciation in this sample, given its exposure to a solar simulator (500 W m-2) for 24 hours in an oxygen-saturated, pH 7 environment. | The expected sulfur speciation in this Florida Everglades DOM sample is driven by its 24-hour exposure to artificial sunlight under oxygen-saturated conditions. This specific environment induces the photochemical oxidation of the native sulfur species present in the dissolved organic matter. Mechanistically, the irradiation drives the progressive transformation of the originally reduced sulfur pool into intermediate and highly oxidized sulfur species. This results in a final speciation where the majority of the sulfur remains reduced (68%), while the oxidized portion is dominated by sulfonate (18%) and sulfate (7.9%), alongside minor amounts of sulfoxide and sulfone. | Full credit for explaining that the combination of sunlight and oxygen saturation drives the photo-oxidation of naturally reduced sulfur in the DOM into higher oxidation states (primarily sulfonate and sulfate), while noting that a 24-hour exposure still leaves a majority of the sulfur pool in a reduced state. |
Review
#548
Dissolved organic matter (DOM)
S K
▶
LLM Prompt
Sample Information
Material: Dissolved organic matter (DOM)
Sample Origin: Florida Everglades wetland (site WCA 2A-O)
Sample-Specific Conditions
- Irradiance time: 24 h
- DOM exposed to artificial sunlight for 24 h (replicate)
Measurement
We plan to measure the S K XANES spectrum of this sample.
Questions
Based on all the information above:
1. What candidate reference spectra (representing different sulfur oxidation states) should be included in a Linear Combination Fitting (LCF) model to accurately quantify the sulfur speciation in this irradiated DOM sample?
2. Estimate the relative fractions of the major sulfur pools (reduced sulfur vs. highly oxidized species like sulfonates and sulfates) in this Everglades DOM sample after 24 hours of artificial sunlight exposure.
3. Explain the photochemical reasoning behind the observed distribution of sulfur species in this DOM sample, given the specific environmental conditions (pH 7, oxygen-saturated, 24 h solar simulator exposure).
Ground Truth
Material: Dissolved organic matter (DOM)
Measurement: S K-edge XANES
Fit method: Linear Combination Fitting (LCF)
Phase fractions: (±10%)
| Phase | Fraction |
|---|---|
| DOS_Red | 0.69 |
| DOS_Sulfx | 0.035 |
| DOS_SO2 | 0.034 |
| DOS_SO3 | 0.18 |
| DOS_SO4 | 0.06 |
Fit basis (paper's reference spectra):
- DOS_Red (Reduced sulfur)
- DOS_Sulfx (Sulfoxides)
- DOS_SO2 (Sulfones)
- DOS_SO3 (Sulfonates)
- DOS_SO4 (Sulfates)
Source evidence: Table 1
Key reasoning: Exposure of oxygen-saturated dissolved organic matter to artificial sunlight (500 W m-2) for 24 hours drives the photo-oxidation of sulfur. This process converts a portion of the reduced sulfur pool into oxidized species. Despite 24 hours of irradiation, reduced sulfur (DOS_Red) remains the dominant phase at 69%, while sulfonates (DOS_SO3) form the largest oxidized product pool at 18%, followed by sulfates (6%) and minor intermediate species (sulfoxides and sulfones).
Reasoning source: Discussion of Table 1
Scoring Rubric (total: 100 pts)
| Q | Type | Max | Question | Reference Answer | Scoring Criteria |
|---|---|---|---|---|---|
| q1 | identification | 30 | What candidate reference spectra (representing different sulfur oxidation states) should be included in a Linear Combination Fitting (LCF) model to accurately quantify the sulfur speciation in this irradiated DOM sample? | The Linear Combination Fitting (LCF) model for this sample should include reference spectra for DOS_Red (reduced sulfur), DOS_Sulfx (sulfoxides), DOS_SO2 (sulfones), DOS_SO3 (sulfonates), and DOS_SO4 (sulfates). These specific phases are expected because exposing the Everglades dissolved organic matter to artificial sunlight for 24 hours drives the photo-oxidation of sulfur. This photochemical process converts a portion of the initial reduced sulfur pool into various oxidized species. Consequently, the basis set must account for both the remaining unreacted reduced sulfur and the newly formed intermediate and highly oxidized sulfur products. | Full credit for identifying the need for reduced sulfur, sulfoxides, sulfones, sulfonates, and sulfates. Deduct points for missing major oxidation states (especially reduced S and sulfonates). |
| q2 | quantification | 40 | Estimate the relative fractions of the major sulfur pools (reduced sulfur vs. highly oxidized species like sulfonates and sulfates) in this Everglades DOM sample after 24 hours of artificial sunlight exposure. | After 24 hours of artificial sunlight exposure, the sulfur speciation consists of 69% DOS_Red (reduced sulfur), 18% DOS_SO3 (sulfonates), 6% DOS_SO4 (sulfates), 3.5% DOS_Sulfx (sulfoxides), and 3.4% DOS_SO2 (sulfones), with a 10% uncertainty. These specific values result from the photo-oxidation process driven by the 24-hour irradiation of the oxygen-saturated dissolved organic matter. Despite this prolonged exposure, the conversion is incomplete, leaving reduced sulfur as the dominant phase. The oxidized fraction is primarily driven toward stable end-products like sulfonates and sulfates, leaving only minor amounts of intermediate sulfoxides and sulfones. | Full credit for estimating ~69% reduced sulfur, ~18% sulfonates, ~6% sulfates, and minor amounts (<5% each) of intermediate sulfoxides/sulfones. Estimates within ±10% of the ground truth fractions are acceptable. |
| q3 | reasoning | 30 | Explain the photochemical reasoning behind the observed distribution of sulfur species in this DOM sample, given the specific environmental conditions (pH 7, oxygen-saturated, 24 h solar simulator exposure). | The observed distribution of sulfur species is driven by the photo-oxidation of the Everglades dissolved organic matter during its 24-hour exposure to artificial sunlight. Under these oxygen-saturated conditions, the solar irradiation provides the energy necessary to oxidize a portion of the initial reduced sulfur pool. This mechanism leads to an outcome where reduced sulfur (DOS_Red) remains the dominant phase at 69%, indicating that the 24-hour exposure is insufficient for complete oxidation. The reaction primarily yields highly oxidized end-products, specifically sulfonates (18%) and sulfates (6%), while intermediate oxidation states like sulfoxides (3.5%) and sulfones (3.4%) accumulate only as minor fractions. | Full credit for explaining that oxygen-saturated conditions and solar irradiation drive the photo-oxidation of reduced sulfur into oxidized forms (primarily sulfonates and sulfates), while noting that reduced sulfur still remains the dominant pool after 24 hours. |
Review
#549
Dissolved organic matter (DOM)
S K
▶
LLM Prompt
Sample Information
Material: Dissolved organic matter (DOM)
Sample Origin: Florida Everglades wetland (site WCA 2A-O)
Sample-Specific Conditions
- Irradiance time: 78 h
- DOM exposed to artificial sunlight for 78 h
Measurement
We plan to measure the S K XANES spectrum of this sample.
Questions
Based on all the information above:
1. Given that this is a dissolved organic matter (DOM) sample exposed to artificial sunlight for 78 hours, what specific sulfur functional groups (candidate reference spectra) should be included in the basis set to properly model its S K-edge XANES spectrum?
2. Estimate the quantitative phase fractions of the different sulfur species (reduced, intermediate oxidized, and highly oxidized) in this DOM sample after 78 hours of irradiation.
3. Explain the physical reasoning for the expected sulfur speciation in this sample, specifically addressing how the 78-hour irradiance time under oxygen-saturated conditions influences the balance between reduced and oxidized sulfur species.
Ground Truth
Material: Dissolved organic matter (DOM)
Measurement: S K-edge XANES
Fit method: LCF
Phase fractions: (±10%)
| Phase | Fraction |
|---|---|
| DOS_Red | 0.58 |
| DOS_Sulfx | 0.031 |
| DOS_SO2 | 0.049 |
| DOS_SO3 | 0.21 |
| DOS_SO4 | 0.14 |
Fit basis (paper's reference spectra):
- DOS_Red (Reduced sulfur)
- DOS_Sulfx (Sulfoxide)
- DOS_SO2 (Sulfone)
- DOS_SO3 (Sulfonate)
- DOS_SO4 (Sulfate)
Source evidence: Table 1
Key reasoning: After 78 hours of exposure to artificial sunlight (500 W m-2), the DOM sample undergoes photochemical weathering, resulting in a specific distribution of sulfur oxidation states. While reduced sulfur (DOS_Red) remains the dominant phase at 58%, there is a substantial presence of highly oxidized species, specifically sulfonates (21%) and sulfates (14%). Intermediate oxidation states, such as sulfoxides and sulfones, represent minor components (3.1% and 4.9%, respectively), indicating that the 78-hour irradiance drives significant photo-oxidation of the original reduced sulfur pool into higher oxidation states.
Reasoning source: Table 1 and discussion on irradiance time effects
Scoring Rubric (total: 100 pts)
| Q | Type | Max | Question | Reference Answer | Scoring Criteria |
|---|---|---|---|---|---|
| q1 | identification | 30 | Given that this is a dissolved organic matter (DOM) sample exposed to artificial sunlight for 78 hours, what specific sulfur functional groups (candidate reference spectra) should be included in the basis set to properly model its S K-edge XANES spectrum? | To properly model the S K-edge XANES spectrum of this DOM sample, the basis set should include DOS_Red (Reduced sulfur), DOS_Sulfx (Sulfoxide), DOS_SO2 (Sulfone), DOS_SO3 (Sulfonate), and DOS_SO4 (Sulfate). These specific reference spectra are required because the 78-hour exposure to artificial sunlight induces photochemical weathering of the sample. This prolonged irradiance drives significant photo-oxidation of the original reduced sulfur pool into higher oxidation states. Therefore, the model must account for the remaining dominant reduced sulfur alongside both intermediate and highly oxidized sulfur species generated during the 78-hour exposure. | Full credit if the answer identifies reduced sulfur, sulfoxides, sulfones, sulfonates, and sulfates as the necessary basis components. Partial credit if 3-4 are identified. |
| q2 | quantification | 40 | Estimate the quantitative phase fractions of the different sulfur species (reduced, intermediate oxidized, and highly oxidized) in this DOM sample after 78 hours of irradiation. | The estimated phase fractions for this sample are 58% reduced sulfur (DOS_Red), 3.1% sulfoxide (DOS_Sulfx), 4.9% sulfone (DOS_SO2), 21% sulfonate (DOS_SO3), and 14% sulfate (DOS_SO4), with a 10% uncertainty. These specific values arise because the 78 hours of artificial sunlight exposure drives significant photochemical weathering of the dissolved organic matter. Although reduced sulfur remains the dominant phase, the prolonged irradiance causes substantial photo-oxidation of the original reduced sulfur pool. This mechanism results in the significant accumulation of highly oxidized species (sulfonates and sulfates) while leaving intermediate oxidation states as minor components. | Full credit if the estimated fractions are within ±10% of the ground truth: ~58% reduced sulfur, ~8% intermediate (sulfoxide+sulfone), and ~35% highly oxidized (21% sulfonate, 14% sulfate). |
| q3 | reasoning | 30 | Explain the physical reasoning for the expected sulfur speciation in this sample, specifically addressing how the 78-hour irradiance time under oxygen-saturated conditions influences the balance between reduced and oxidized sulfur species. | The sulfur speciation in this dissolved organic matter sample is primarily controlled by photochemical weathering induced by 78 hours of exposure to artificial sunlight. This prolonged irradiance drives significant photo-oxidation of the original reduced sulfur pool into higher oxidation states. Consequently, while reduced sulfur remains the dominant phase at 58%, the photochemical mechanism produces a substantial presence of highly oxidized species, specifically sulfonates (21%) and sulfates (14%). Intermediate oxidation states such as sulfoxides and sulfones represent only minor components (3.1% and 4.9%, respectively), demonstrating that the 78-hour exposure effectively pushes the oxidation process toward the most highly oxidized sulfur forms. | Full credit if the answer explains that photochemical weathering (photo-oxidation) over 78 hours converts a portion of the reduced sulfur pool into highly oxidized species (sulfonates and sulfates), while leaving reduced sulfur as the still-dominant but depleted phase, with intermediate oxidation states remaining minor. |
Review
#550
Dissolved organic matter (DOM)
S K
▶
LLM Prompt
Sample Information
Material: Dissolved organic matter (DOM)
Sample Origin: Florida Everglades wetland (site WCA 2A-O)
Sample-Specific Conditions
- Irradiance time: 192 h
- DOM exposed to artificial sunlight for 192 h
Measurement
We plan to measure the S K XANES spectrum of this sample.
Questions
Based on all the information above:
1. What sulfur functional groups (reference phases) should be included in a Linear Combination Fitting (LCF) model to accurately capture the speciation of this irradiated DOM sample?
2. Estimate the relative fractions of the sulfur species in this DOM sample after 192 hours of artificial sunlight exposure.
3. Explain the chemical reasoning for the expected sulfur speciation in this sample given the specific environmental conditions (192 h irradiance, oxygen-saturated, pH 7).
Ground Truth
Material: Dissolved organic matter (DOM)
Measurement: S K-edge XANES
Fit method: LCF
Phase fractions: (±10%)
| Phase | Fraction |
|---|---|
| DOS_Red | 0.5 |
| DOS_Sulfx | 0.037 |
| DOS_SO2 | 0.056 |
| DOS_SO3 | 0.28 |
| DOS_SO4 | 0.13 |
Fit basis (paper's reference spectra):
- DOS_Red (Reduced S)
- DOS_Sulfx (Sulfoxide)
- DOS_SO2 (Sulfone)
- DOS_SO3 (Sulfonate)
- DOS_SO4 (Sulfate)
Source evidence: Table 1
Key reasoning: Prolonged exposure (192 h) of DOM to artificial sunlight under oxygen-saturated conditions drives the photochemical oxidation of reduced organic sulfur. This results in a substantial fraction of oxidized sulfur species, particularly sulfonate (DOS_SO3) and sulfate (DOS_SO4), while reduced sulfur (DOS_Red) remains the largest pool but is significantly depleted relative to unexposed samples.
Reasoning source: Text discussing Table 1 and photo-oxidation trends
Scoring Rubric (total: 100 pts)
| Q | Type | Max | Question | Reference Answer | Scoring Criteria |
|---|---|---|---|---|---|
| q1 | identification | 30 | What sulfur functional groups (reference phases) should be included in a Linear Combination Fitting (LCF) model to accurately capture the speciation of this irradiated DOM sample? | The LCF model should include DOS_Red (Reduced S), DOS_Sulfx (Sulfoxide), DOS_SO2 (Sulfone), DOS_SO3 (Sulfonate), and DOS_SO4 (Sulfate). These specific phases are expected because the Everglades DOM sample was exposed to artificial sunlight for a prolonged period of 192 hours under oxygen-saturated conditions. This extended irradiance drives the photochemical oxidation of the naturally occurring reduced organic sulfur in the sample. Therefore, the fitting basis must account for both the remaining depleted pool of reduced sulfur and the newly generated oxidized sulfur species. | Full points for identifying the full range of oxidation states expected in photo-oxidized DOM: reduced S, sulfoxide, sulfone, sulfonate, and sulfate. |
| q2 | quantification | 40 | Estimate the relative fractions of the sulfur species in this DOM sample after 192 hours of artificial sunlight exposure. | The estimated relative fractions are 0.50 for DOS_Red, 0.037 for DOS_Sulfx, 0.056 for DOS_SO2, 0.28 for DOS_SO3, and 0.13 for DOS_SO4, with an estimated uncertainty of 10%. These specific values arise because the 192-hour exposure to artificial sunlight under oxygen-saturated conditions drives extensive photochemical oxidation of the DOM. This prolonged irradiance significantly depletes the initially dominant reduced sulfur pool, leaving it at 50%. Consequently, the oxidation mechanism results in substantial accumulations of highly oxidized end-products, specifically sulfonate (28%) and sulfate (13%). | Full points if the predicted fractions are within ±10% of the ground truth: Reduced S ~50%, Sulfonate ~28%, Sulfate ~13%, with minor contributions (<6% each) from Sulfoxide and Sulfone. |
| q3 | reasoning | 30 | Explain the chemical reasoning for the expected sulfur speciation in this sample given the specific environmental conditions (192 h irradiance, oxygen-saturated, pH 7). | The chemical reasoning for the observed speciation centers on the photochemical oxidation of reduced organic sulfur in the DOM. Under the specific conditions of 192 hours of artificial sunlight irradiance and oxygen saturation, the reduced sulfur species undergo a sustained oxidation process. This mechanism progressively converts the reduced sulfur into higher oxidation states over the 192-hour period. As a result, while reduced sulfur (DOS_Red) remains the largest pool, it becomes significantly depleted relative to unexposed samples. The outcome is a substantial accumulation of highly oxidized sulfur species, particularly sulfonate (DOS_SO3) and sulfate (DOS_SO4), alongside minor intermediate species. | Full points for explaining that prolonged photochemical oxidation under oxygen-saturated conditions converts reduced sulfur species into highly oxidized species (sulfonate and sulfate), while noting that a significant portion of reduced sulfur still persists. |
Review
Rapid Accumulation of Soil Inorganics on Plastics: Implications for Plastic Degradation and Contaminant Fate
BNL-NSLS-II-8-ID
Environmental
Lauren N. Pincus et al.
DOI: 10.1021/acs.estlett.3c00241
3 scenarios
▶
#551
weathered polyethylene
Ca K-edge
▶
LLM Prompt
Sample Information
Material: weathered polyethylene
Sample Origin: Princeton, NJ
Sample-Specific Conditions
- weathering time: 2 years
- Polyethylene sheet weathered terrestrially for 2 years
Measurement
We plan to measure the Ca K-edge XANES spectrum of this sample.
Questions
Based on all the information above:
1. What is the predominant calcium phase expected to accumulate on the surface of this polyethylene sample after 2 years of terrestrial weathering?
2. What reference spectra should be included in the analysis to distinguish the calcium speciation of this 2-year weathered sample from a sample weathered for a longer duration (e.g., 5 years) in the same environment?
3. Explain the environmental reasoning for why the calcium speciation on this 2-year weathered sample differs from that of a 5-year weathered sample.
Ground Truth
Material: weathered polyethylene
Measurement: Ca K-edge bulk XANES
Fit method: Not explicitly detailed (identified via XANES)
Phase fractions: (±15%)
| Phase | Fraction |
|---|---|
| calcite | 1.0 |
Fit basis (paper's reference spectra):
- calcite
- disordered humic-calcium complex
Source evidence: Page 9, Lines 179-180; Page 11, Line 240
Key reasoning: The predominant calcium mineral on the 2-year weathered polyethylene was identified as calcite. This differs from the 5-year weathered sample, which exhibited a disordered humic-calcium complex, potentially due to more acidic conditions developing over time or from burial in leaf-mulch.
Reasoning source: Page 9, Lines 179-181
Scoring Rubric (total: 100 pts)
| Q | Type | Max | Question | Reference Answer | Scoring Criteria |
|---|---|---|---|---|---|
| q1 | identification | 30 | What is the predominant calcium phase expected to accumulate on the surface of this polyethylene sample after 2 years of terrestrial weathering? | The predominant calcium phase expected to accumulate on this sample is calcite, which accounts for 1.0 (100%) of the fitted fraction. This specific phase arises because the polyethylene sheet was weathered terrestrially for 2 years in Princeton, NJ. At this 2-year mark, the environmental conditions favor the accumulation of calcite as the primary calcium mineral. This contrasts with longer weathering durations (e.g., 5 years), where more acidic conditions or burial in leaf-mulch would lead to the formation of a disordered humic-calcium complex instead. | Full credit for identifying calcite as the predominant or sole phase. |
| q2 | identification | 30 | What reference spectra should be included in the analysis to distinguish the calcium speciation of this 2-year weathered sample from a sample weathered for a longer duration (e.g., 5 years) in the same environment? | The analysis should include reference spectra for calcite and a disordered humic-calcium complex. These specific references are necessary because the polyethylene sheet weathered terrestrially for 2 years predominantly accumulates calcite (fraction of 1.0). However, over a longer 5-year weathering period, the speciation shifts to a disordered humic-calcium complex. This shift occurs because more acidic conditions develop over time or from burial in leaf-mulch, making both references essential to capture the time-dependent environmental transformation of calcium on the plastic surface. | Full credit for mentioning calcite and a disordered humic-calcium complex. |
| q3 | reasoning | 40 | Explain the environmental reasoning for why the calcium speciation on this 2-year weathered sample differs from that of a 5-year weathered sample. | The calcium speciation differs due to the progressive development of acidic conditions or burial in leaf-mulch over time. After 2 years of terrestrial weathering in Princeton, NJ, the polyethylene sheet predominantly accumulates calcite (1.0 fraction). However, by the 5-year mark, the local environment changes, potentially becoming more acidic or involving burial in leaf-mulch. These altered environmental conditions drive a shift in the calcium speciation, replacing the initial calcite with a disordered humic-calcium complex. | Full credit for explaining that the 5-year sample experiences more acidic conditions (potentially from leaf mulch), leading to a disordered humic-calcium complex, whereas the 2-year sample retains calcite. |
Review
#552
weathered polyethylene
Ca K-edge
▶
LLM Prompt
Sample Information
Material: weathered polyethylene
Sample Origin: Princeton, NJ
Sample-Specific Conditions
- weathering time: 5 years
- Polyethylene sheet weathered terrestrially for 5 years
Measurement
We plan to measure the Ca K-edge XANES spectrum of this sample.
Questions
Based on all the information above:
1. Based on the environmental conditions (5 years of terrestrial weathering, burial in leaf-mulch), what is the predominant calcium phase expected to form on the polyethylene surface, and what specific environmental factor drives this speciation compared to shorter weathering times?
2. To properly analyze the Ca K-edge XANES spectra of terrestrially weathered plastics across a 2- to 5-year timeline, what specific candidate reference spectra should be included in the analysis basis?
Ground Truth
Material: weathered polyethylene
Measurement: Ca K-edge bulk XANES
Fit method: spectral fingerprinting / qualitative comparison
Phase fractions: (±15%)
| Phase | Fraction |
|---|---|
| disordered humic-calcium complex | 1.0 |
Fit basis (paper's reference spectra):
- calcite
- disordered humic-calcium complex
Source evidence: Page 9, Lines 179-181
Key reasoning: The predominant calcium phase on the 5-year weathered PE is a disordered humic-calcium complex, contrasting with the calcite found on 2- and 3-year samples. This shift is attributed to the 5-year sample becoming buried in a leaf-mulch layer, which creates a more acidic environment (pH ~4-4.5) compared to the soil porewater (pH ~7.0-7.6). This increased acidity likely prevents the stabilization of calcite, leading to a less abundant and more amorphous calcium distribution dominated by humic-calcium complexes.
Reasoning source: Page 8, Lines 159-162; Page 9, Lines 179-181
Scoring Rubric (total: 100 pts)
| Q | Type | Max | Question | Reference Answer | Scoring Criteria |
|---|---|---|---|---|---|
| q1 | reasoning | 57 | Based on the environmental conditions (5 years of terrestrial weathering, burial in leaf-mulch), what is the predominant calcium phase expected to form on the polyethylene surface, and what specific environmental factor drives this speciation compared to shorter weathering times? | The predominant calcium phase expected on the 5-year terrestrially weathered polyethylene is a disordered humic-calcium complex, which accounts for 100% of the calcium speciation. This phase arises because the 5-year sample became buried in a leaf-mulch layer, creating a highly acidic environment with a pH of ~4-4.5. This increased acidity contrasts with the neutral soil porewater (pH ~7.0-7.6) experienced during shorter weathering times of 2 and 3 years. Consequently, the acidic conditions prevent the stabilization of calcite, leading instead to a more amorphous calcium distribution dominated entirely by humic-calcium complexes. | Full credit for identifying a disordered humic-calcium complex as the predominant phase and explaining that the more acidic environment (pH ~4-4.5) of the leaf-mulch layer drives this speciation (preventing calcite formation). |
| q2 | identification | 43 | To properly analyze the Ca K-edge XANES spectra of terrestrially weathered plastics across a 2- to 5-year timeline, what specific candidate reference spectra should be included in the analysis basis? | The analysis basis for the Ca K-edge XANES spectra should include calcite and a disordered humic-calcium complex. These specific reference spectra are necessary because the calcium speciation on the weathered polyethylene shifts dramatically depending on the weathering duration and local environment. While calcite forms on samples weathered for 2 and 3 years in neutral soil porewater (pH ~7.0-7.6), the 5-year sample becomes buried in leaf-mulch. This burial creates an acidic environment (pH ~4-4.5) that prevents calcite stabilization, resulting in a 100% fraction of disordered humic-calcium complex on the 5-year sample. | Full credit for listing calcite (for earlier weathering stages) and a disordered humic-calcium complex (for the 5-year stage). |
Review
#553
weathered polyethylene
Mn K-edge
▶
LLM Prompt
Sample Information
Material: weathered polyethylene
Sample Origin: Princeton, NJ
Sample-Specific Conditions
- element: Mn
- Polyethylene sheet weathered terrestrially
Measurement
We plan to measure the Mn K-edge XANES spectrum of this sample.
Questions
Based on all the information above:
1. What is the dominant oxidation state of manganese expected to accumulate on the surface of polyethylene weathered in a terrestrial soil and leaf-mulch environment?
2. Explain the environmental and chemical mechanisms that allow the dominant manganese species to be stabilized on the surface of the weathered plastic.
Ground Truth
Material: weathered polyethylene
Measurement: Mn K-edge bulk XANES
Fit method: not reported in main text
Phase fractions: (±15%)
| Phase | Fraction |
|---|---|
| Mn(II) phase | 1.0 |
Fit basis (paper's reference spectra):
- not reported in main text
Source evidence: Page 9, lines 184-187
Key reasoning: Bulk Mn K-edge XANES found that Mn was present mainly as Mn(II). This suggests that at times conditions were anoxic on the plastic surface in order to stabilize this reduced phase. Additionally, the Mn(II) could be further stabilized via adsorption or substitution into carbonates or other mineral phases present on the weathered plastic.
Reasoning source: Results and Discussion, Page 9
Scoring Rubric (total: 100 pts)
| Q | Type | Max | Question | Reference Answer | Scoring Criteria |
|---|---|---|---|---|---|
| q1 | identification | 43 | What is the dominant oxidation state of manganese expected to accumulate on the surface of polyethylene weathered in a terrestrial soil and leaf-mulch environment? | The dominant oxidation state of manganese expected to accumulate on the terrestrially weathered polyethylene is Mn(II), comprising 100% of the measured phase. This specific reduced phase arises because the plastic surface experienced anoxic conditions at times during its weathering, which is necessary to stabilize Mn(II). Additionally, this oxidation state is further stabilized on the weathered plastic via adsorption or substitution into carbonates or other mineral phases present on the material's surface. | The answer must correctly identify Mn(II) as the dominant oxidation state. |
| q2 | reasoning | 57 | Explain the environmental and chemical mechanisms that allow the dominant manganese species to be stabilized on the surface of the weathered plastic. | The dominant manganese species, Mn(II), is stabilized on the weathered polyethylene surface primarily through the occurrence of anoxic environmental conditions. During terrestrial weathering, the plastic surface experiences periods lacking oxygen, which is required to maintain and stabilize this reduced phase. Chemically, the Mn(II) is further stabilized by interacting with the surrounding environment on the plastic. Specifically, it undergoes adsorption or substitution into carbonates and other mineral phases that have accumulated on the polyethylene sheet. | The answer must explain that transient anoxic conditions on the plastic surface help stabilize the phase. Full credit requires mentioning both the anoxic conditions and the potential for stabilization via adsorption or substitution into other minerals. |
Review
Integration of an Oxidation Catalyst with Pd/Zeolite-Based Passive NOx Adsorbers: Impacts on Degradation Resistance and Desorption Characteristics
BNL-NSLS-II-8-ID
Catalyst
Yuntao Gu et al.
DOI: 10.1021/acs.iecr.0c05186
1 scenario
▶
#554
Pd/SSZ-13
Pd K
▶
LLM Prompt
Sample Information
Material: Pd/SSZ-13
Support: SSZ-13 zeolite
Reaction Conditions: ambient
Sample-Specific Conditions
- state: fresh
- Freshly synthesized Pd/SSZ-13 passive NOx adsorber
Measurement
We plan to measure the Pd K XANES spectrum of this sample.
Questions
Based on all the information above:
1. Based on the synthesis method and ambient conditions, what is the expected dominant Pd phase in the fresh Pd/SSZ-13 sample, and what physical reasoning supports this?
2. If one were to perform a fitting or qualitative comparison on the XAS data of this sample to confirm its speciation, what reference spectra would be appropriate to include as standards?
Ground Truth
Material: Pd/SSZ-13
Measurement: Pd K edge, ex-situ, beamline 8-ID of the National Synchrotron Light Source II
Fit method: Qualitative comparison of EXAFS features
Phase fractions:
| Phase | Fraction |
|---|---|
| Pd2+ (ion-exchanged) | 1.0 |
Fit basis (paper's reference spectra):
- Pd(NO3)2·2H2O
- bulk PdO
- Pd foil
Source evidence: Page 3, Section 2.2 and Figure 1a
Key reasoning: The first shell scattering feature at around 1.8 Å is similar to that of Pd(NO3)2·2H2O suggesting the interaction between Pd and zeolite framework O atoms and the predominant formation of highly dispersed Pd cations. The lack of a higher shell scattering feature at R > 2.5 Å in the EXAFS spectrum of Pd/SSZ-13, which is present in the EXAFS of bulk PdO, indicates almost 100% ion exchange of Pd into the SSZ-13 zeolite.
Reasoning source: Page 3, Section 2.2 Catalyst Characterization
Scoring Rubric (total: 100 pts)
| Q | Type | Max | Question | Reference Answer | Scoring Criteria |
|---|---|---|---|---|---|
| q1 | reasoning | 57 | Based on the synthesis method and ambient conditions, what is the expected dominant Pd phase in the fresh Pd/SSZ-13 sample, and what physical reasoning supports this? | The expected dominant Pd phase in the freshly synthesized Pd/SSZ-13 sample under ambient conditions is highly dispersed, ion-exchanged Pd2+ cations, accounting for a fraction of 1.0 (100%). This complete ion exchange occurs because the synthesis process of the passive NOx adsorber drives the Pd to interact directly with the SSZ-13 zeolite framework oxygen atoms rather than agglomerating. This is physically evidenced by a first shell scattering feature at around 1.8 Å, which is similar to Pd(NO3)2·2H2O and characteristic of these framework interactions. Additionally, the lack of a higher shell scattering feature at R > 2.5 Å, which would otherwise indicate bulk PdO formation, confirms that the fresh sample consists entirely of isolated Pd cations. | Must identify ~100% ion-exchanged Pd2+ cations. Must mention interaction with zeolite framework O atoms and the absence of PdO particles. |
| q2 | identification | 43 | If one were to perform a fitting or qualitative comparison on the XAS data of this sample to confirm its speciation, what reference spectra would be appropriate to include as standards? | Appropriate reference spectra for qualitative comparison of this sample include Pd(NO3)2·2H2O, bulk PdO, and Pd foil. These standards are necessary to determine whether the freshly synthesized Pd/SSZ-13 passive NOx adsorber formed isolated cations or aggregated into bulk clusters under ambient conditions. Pd(NO3)2·2H2O is used to identify highly dispersed Pd2+ cations, as it shares a similar first shell scattering feature at around 1.8 Å resulting from Pd interacting with the zeolite framework oxygen atoms. Conversely, bulk PdO and Pd foil are included to check for agglomeration; the absence of higher shell scattering features at R > 2.5 Å compared to the bulk PdO reference confirms that almost 100% of the Pd successfully ion-exchanged into the SSZ-13 support. | Must list references representing atomically dispersed Pd2+ (e.g., Pd(NO3)2·2H2O), bulk PdO (for PdO particles), and Pd foil (for Pd0). |
Review
Complexes of Platinum Group Metals with a Conformationally Locked Scorpionate in a Metal–Organic Framework: An Unusually Close Apical Interaction of Palladium(II)
BNL-NSLS-II-8-ID
Catalyst
Michael T. Payne et al.
DOI: 10.1021/acs.inorgchem.1c00941
1 scenario
▶
#555
Pd(II)@Zr-TpmC
Pd K-edge
▶
LLM Prompt
Sample Information
Material: Pd(II)@Zr-TpmC*
Support: Zr-TpmC* MOF
Reaction Conditions: Measured ex-situ as a solid pellet mixed with polyethylene glycol
Sample-Specific Conditions
- Immobilization in rigid MOF lattice: Conformationally locked C3v symmetry
- Palladium(II) complex immobilized on a scorpionate-derived linker within a metal-organic framework
Measurement
We plan to measure the Pd K-edge XANES spectrum of this sample.
Questions
Based on all the information above:
1. What is the specific chemical formula of the dominant palladium complex immobilized within the MOF pores after post-synthetic metallation?
2. What distinguishing feature in the Pd K-edge XANES spectrum was noted for this immobilized complex compared to reference Pd compounds?
Ground Truth
Material: Pd(II)@Zr-TpmC*
Measurement: Pd K-edge, ex-situ fluorescence mode, ISS beamline at NSLS-II
Fit method: Qualitative comparison
Phase fractions:
| Phase | Fraction |
|---|---|
| [Pd(CH3CN)2(TpmC*)]2+ | 1.0 |
Fit basis (paper's reference spectra):
- reference Pd compounds
Source evidence: Page 11-12 (text), Page 24 (Experimental)
Key reasoning: The Pd oxidation state is assigned as +II based on XPS and supported by qualitative comparison of the Pd K-edge XANES with reference compounds. The XANES data reflects a decrease in the Pd binding energy.
Reasoning source: Results and Discussion, Page 11-12
Scoring Rubric (total: 100 pts)
| Q | Type | Max | Question | Reference Answer | Scoring Criteria |
|---|---|---|---|---|---|
| q2 | identification | 50 | What is the specific chemical formula of the dominant palladium complex immobilized within the MOF pores after post-synthetic metallation? | The specific chemical formula of the dominant palladium complex immobilized within the MOF pores is [Pd(CH3CN)2(TpmC*)]2+, which accounts for a fraction of 1.0 (100%) of the Pd species. This specific complex forms because the palladium(II) precursor is immobilized onto the scorpionate-derived linker within the rigid Zr-TpmC* MOF lattice. The immobilization within this rigid framework enforces a conformationally locked C3v symmetry around the metal center. Qualitative comparison of the Pd K-edge XANES with reference compounds, supported by XPS data, confirms that the palladium retains a +II oxidation state in this highly specific coordination environment. | Full points for identifying the complex as [Pd(CH3CN)2(TpmC*)]2+. |
| q3 | spectral | 50 | What distinguishing feature in the Pd K-edge XANES spectrum was noted for this immobilized complex compared to reference Pd compounds? | The distinguishing feature in the Pd K-edge XANES spectrum for this immobilized complex is a decrease in the Pd binding energy compared to reference Pd compounds. This spectral shift arises from the unique electronic environment created when the palladium(II) complex is immobilized on the scorpionate-derived linker within the metal-organic framework. Specifically, the rigid Zr-TpmC* MOF lattice enforces a conformationally locked C3v symmetry on the [Pd(CH3CN)2(TpmC*)]2+ species, altering its electronic structure relative to standard references. Despite this decrease in binding energy, qualitative comparison of the XANES spectrum confirms the overall spectral shape remains consistent with a +II oxidation state. | Full points for stating that the XANES reflects a decrease in the Pd binding energy compared to reference compounds. |
Review
Effect of Redox-Inactive Metal Ion–Nickel(III) Interactions on the Redox Properties and Proton-Coupled Electron Transfer Reactivity
APS
Synthesis
Simarjeet Kaur et al.
DOI: 10.1021/acs.inorgchem.2c01472
4 scenarios
▶
#556
(NMe4)2[NiII(HMPAB)]
Ni K
▶
LLM Prompt
Sample Information
Material: (NMe4)2[NiII(HMPAB)]
Method: solution synthesis
Precursors: H4HMPAB, NMe4OH, NiII(ClO4)2 •6H2O
Temperature C: 25
Sample-Specific Conditions
- oxidation state: Ni(II)
- Mononuclear Ni(II) complex
Preparation
- Synthesized by mixing equimolar amounts of the deprotonated H4HMPAB (prepared in-situ by mixing one equiv. of the ligand with four equiv. of NMe4OH in methanol) and NiII(ClO4)2 •6H2O in methanol at 25 ⁰C.
Measurement
We plan to measure the Ni K XANES spectrum of this sample.
Questions
Based on all the information above:
1. What distinguishing feature in the Ni K-edge XANES spectrum differentiates this Ni(II) complex from its one-electron oxidized Ni(III) counterpart (Complex 2)?
2. Explain the physical reasoning for the observed difference in the XANES rising edge energy between this Ni(II) complex and the corresponding Ni(III) complex.
Ground Truth
Material: (NMe4)2[NiII(HMPAB)]
Measurement: Ni K-edge XANES recorded at 20 K
Fit method: not applicable
Phase fractions:
| Phase | Fraction |
|---|---|
| (NMe4)2[NiII(HMPAB)] | 1.0 |
Source evidence: Page 5, Figure 5A and text
Key reasoning: Complex 1 is a synthesized mononuclear Ni(II) complex. Its XANES spectrum was measured to establish the baseline electronic structure and edge position for the Ni(II) state. The edge position at a normalized absorption of 0.6 was found to be 8344.87 eV, which is ~2 eV lower than the oxidized Ni(III) complex 2, reflecting the lower ionization energy of the Ni(II) center.
Reasoning source: Page 5, RESULTS AND DISCUSSION, solution state through XANES and EXAFS
Scoring Rubric (total: 100 pts)
| Q | Type | Max | Question | Reference Answer | Scoring Criteria |
|---|---|---|---|---|---|
| q2 | spectral | 50 | What distinguishing feature in the Ni K-edge XANES spectrum differentiates this Ni(II) complex from its one-electron oxidized Ni(III) counterpart (Complex 2)? | The distinguishing feature in the Ni K-edge XANES spectrum is the position of the rising edge, which is located at 8344.87 eV (at a normalized absorption of 0.6). This edge position is shifted by approximately 2 eV to lower energy compared to the oxidized Ni(III) complex 2, which has an edge at 8346.39 eV. This spectral feature arises because the sample is synthesized as a pure mononuclear Ni(II) complex from NiII(ClO4)2 •6H2O and deprotonated H4HMPAB at 25 °C. The lower oxidation state of the Ni(II) center in this baseline complex results in a lower ionization energy compared to the Ni(III) state, directly causing the observed shift to lower energy in the XANES rising edge. | Mentions that the rising edge of the Ni(II) complex is shifted to lower energy by approximately 2 eV compared to the Ni(III) complex. |
| q3 | reasoning | 50 | Explain the physical reasoning for the observed difference in the XANES rising edge energy between this Ni(II) complex and the corresponding Ni(III) complex. | The physical reasoning for the observed difference in the XANES rising edge energy is the lower ionization energy of the Ni(II) center compared to the Ni(III) center. The sample is prepared via solution synthesis at 25 °C using NiII(ClO4)2 •6H2O to form a pure mononuclear Ni(II) complex, establishing a baseline electronic structure for the Ni(II) state. Because the Ni(II) ion has a lower oxidation state than the oxidized Ni(III) complex, less energy is required to excite a core electron. Consequently, the rising edge for this Ni(II) complex appears at 8344.87 eV, which is ~2 eV lower than the 8346.39 eV edge position of the Ni(III) counterpart. | Explains that the lower edge energy for the Ni(II) complex reflects the lower ionization energy required to eject a core 1s electron from a less positively charged Ni ion compared to the Ni(III) ion. |
Review
#557
(NMe4)[NiIII(HMPAB)]
Ni K
▶
LLM Prompt
Sample Information
Material: (NMe4)[NiIII(HMPAB)]
Method: solution synthesis
Precursors: (NMe4)2[NiII(HMPAB)], AgOAc
Temperature C: 25
Atmosphere: anaerobic
Sample-Specific Conditions
- oxidation state: Ni(III)
- Mononuclear Ni(III) complex
Preparation
- Synthesized by reacting 1 with 1.2 equiv. AgOAc in acetonitrile and under anaerobic conditions at room temperature.
Measurement
We plan to measure the Ni K XANES spectrum of this sample.
Questions
Based on all the information above:
1. Based on the synthesis conditions (oxidation of a Ni(II) complex with AgOAc), what is the expected oxidation state of Ni in the resulting complex, and how would this be reflected in the Ni K-edge XANES edge position compared to the precursor?
2. What distinguishing spectral features would differentiate the Ni K-edge XANES spectrum of this mononuclear Ni(III) complex from its Lewis acid adducts (e.g., with Ca2+ or Y3+)?
3. Explain the physical reasoning behind the observed ~2 eV positive shift in the XANES edge position of Complex 2 compared to its Ni(II) precursor.
Ground Truth
Material: (NMe4)[NiIII(HMPAB)]
Measurement: Ni K-edge XANES recorded at 20 K
Fit method: not reported
Phase fractions:
| Phase | Fraction |
|---|---|
| (NMe4)[NiIII(HMPAB)] | 1.0 |
Source evidence: Figure 5A and text on page 5
Key reasoning: Complex 2 was synthesized by one-electron oxidation of the Ni(II) complex 1 using AgOAc. The XANES spectrum of 2 shows a positive shift of ~2 eV in the rising edge compared to 1, reflecting the higher ionization energy required for ejecting a core 1s electron from the more positively charged Ni(III) ion.
Reasoning source: RESULTS AND DISCUSSION, Ni(II) and Ni(III) complexes, page 5
Scoring Rubric (total: 100 pts)
| Q | Type | Max | Question | Reference Answer | Scoring Criteria |
|---|---|---|---|---|---|
| q1 | prediction | 30 | Based on the synthesis conditions (oxidation of a Ni(II) complex with AgOAc), what is the expected oxidation state of Ni in the resulting complex, and how would this be reflected in the Ni K-edge XANES edge position compared to the precursor? | The expected oxidation state of Ni in the resulting complex is Ni(III), which constitutes a 1.0 fraction of the sample. This pure phase arises because the synthesis involves a direct one-electron oxidation of the (NMe4)2[NiII(HMPAB)] precursor using 1.2 equivalents of AgOAc at 25 °C under anaerobic conditions. Spectroscopically, this oxidation is reflected by a positive shift of ~2 eV in the rising edge position (from 8344.87 to 8346.39 eV at a normalized absorption of 0.6) compared to the Ni(II) precursor. This shift occurs because the resulting, more positively charged Ni(III) ion requires a higher ionization energy to eject a core 1s electron. | Award full points if the answer correctly identifies the oxidation state as Ni(III) and predicts a shift to higher energy (specifically ~2 eV positive shift) for the edge position compared to the Ni(II) precursor. |
| q2 | spectral | 40 | What distinguishing spectral features would differentiate the Ni K-edge XANES spectrum of this mononuclear Ni(III) complex from its Lewis acid adducts (e.g., with Ca2+ or Y3+)? | The Ni K-edge XANES spectrum of this mononuclear Ni(III) complex is distinguished by having a less intense rising edge (1s to 4p transition) and a higher edge energy compared to its Lewis acid adducts, such as 2-Ca2+ or 2-Y3+. These spectral features arise directly from the sample's preparation as an isolated, mononuclear (NMe4)[NiIII(HMPAB)] complex synthesized via AgOAc oxidation without the addition of Lewis acidic metal cations. Because the complex lacks these Lewis acid interactions, its electronic structure retains a higher ionization energy for the core 1s electron, maintaining the edge position at 8346.39 eV and a distinct 1s to 4p transition intensity. | Award full points if the answer mentions that the parent Ni(III) complex has a less intense rising edge (1s to 4p transition) and a higher edge energy compared to the Lewis acid adducts. |
| q3 | reasoning | 30 | Explain the physical reasoning behind the observed ~2 eV positive shift in the XANES edge position of Complex 2 compared to its Ni(II) precursor. | The ~2 eV positive shift in the XANES edge position (from 8344.87 to 8346.39 eV) is physically driven by the increased effective nuclear charge on the nickel center. Based on the synthesis conditions, reacting the Ni(II) precursor with AgOAc at room temperature under anaerobic conditions results in a one-electron oxidation to form a pure mononuclear Ni(III) complex. Because the resulting Ni(III) ion is more positively charged than the Ni(II) precursor, it exerts a stronger electrostatic pull on its electrons. Consequently, a higher ionization energy is required to eject a core 1s electron during the X-ray absorption process, which manifests as the observed shift to higher energy in the rising edge. | Award full points if the answer explains that the shift reflects the higher ionization energy required to eject a core 1s electron from a more positively charged Ni(III) ion compared to a Ni(II) ion. |
Review
#558
2-Ca2+ adduct
Ni K
▶
LLM Prompt
Sample Information
Material: 2-Ca2+ adduct
Method: solution synthesis
Precursors: (NMe4)[NiIII(HMPAB)], Ca(OTf)2
Temperature C: -40
Sample-Specific Conditions
- Lewis acid: Ca2+
- Ca2+ coordinated Ni(III) complex
Preparation
- Prepared by reacting equivalent amounts of 2 and Ca(OTf)2 in acetonitrile at –40 ºC.
Measurement
We plan to measure the Ni K XANES spectrum of this sample.
Questions
Based on all the information above:
1. Describe the expected changes in the Ni K-edge XANES spectral shape and edge position when Ca2+ coordinates to the parent Ni(III) complex to form the 2-Ca2+ adduct.
2. What electronic transition is responsible for the rising edge feature in the Ni K-edge XANES spectrum of the 2-Ca2+ adduct, and how does its intensity compare to the parent complex?
3. Explain the physical reasoning behind the observed shift to lower energy and the increased intensity of the rising edge in the 2-Ca2+ adduct compared to the parent Ni(III) complex.
Ground Truth
Material: 2-Ca2+ adduct
Measurement: Ni K-edge XANES recorded at 20 K
Fit method: not reported
Phase fractions:
| Phase | Fraction |
|---|---|
| 2-Ca2+ adduct | 1.0 |
Source evidence: Figure 8A, page 7 and 8
Key reasoning: The reaction of the parent Ni(III) complex 2 with Ca(OTf)2 yields the 2-Ca2+ adduct. The XANES spectrum confirms strong metal-ligand covalency and bonding to Ca2+, leading to greater charge neutralization of the Ni atom, a decrease in effective nuclear charge, and a shift of the rising edge to lower energies.
Reasoning source: Page 7, Results and Discussion
Scoring Rubric (total: 100 pts)
| Q | Type | Max | Question | Reference Answer | Scoring Criteria |
|---|---|---|---|---|---|
| q1 | spectral | 35 | Describe the expected changes in the Ni K-edge XANES spectral shape and edge position when Ca2+ coordinates to the parent Ni(III) complex to form the 2-Ca2+ adduct. | The Ni K-edge XANES spectrum of the 2-Ca2+ adduct exhibits a negative shift in the rising edge energy to 8345.38 eV (at a normalized absorption of 0.6) and a more intense rising metal K-edge compared to the parent complex 2. This pure adduct phase forms by reacting equivalent amounts of the parent Ni(III) complex 2 and Ca(OTf)2 in acetonitrile at -40 ºC. The coordination of the Lewis acid Ca2+ to the Ni(III) complex increases the local coordination to the Ca metal center and enhances metal-ligand covalency. This bonding leads to greater charge neutralization of the Ni atom and a decrease in its effective nuclear charge, which directly causes the observed shift of the rising edge to lower energies and the distinct change in spectral shape. | Full points if the answer mentions a negative shift in the rising edge energy (specifically to ~8345.38 eV at normalized absorption of 0.6) and a more intense rising edge compared to the parent complex. |
| q2 | spectral | 30 | What electronic transition is responsible for the rising edge feature in the Ni K-edge XANES spectrum of the 2-Ca2+ adduct, and how does its intensity compare to the parent complex? | The rising edge feature in the Ni K-edge XANES spectrum of the 2-Ca2+ adduct originates from the 1s to 4p electronic transition. The intensity of this transition is higher than that of the parent Ni(III) complex 2. The 2-Ca2+ adduct is synthesized by reacting the parent complex with Ca(OTf)2 at -40 ºC, resulting in a Ca2+ coordinated Ni(III) complex. The increased intensity of this 1s to 4p transition occurs because of the increased local coordination to the Ca metal center upon adduct formation. Furthermore, the strong metal-ligand covalency and bonding to the Ca2+ Lewis acid lead to greater charge neutralization of the Ni atom, modifying the electronic environment and transition probabilities. | Full points if the answer identifies the transition as 1s to 4p and states that its intensity is higher/more intense compared to the parent complex. |
| q3 | reasoning | 35 | Explain the physical reasoning behind the observed shift to lower energy and the increased intensity of the rising edge in the 2-Ca2+ adduct compared to the parent Ni(III) complex. | The shift to a lower rising edge energy (8345.38 eV) and the increased intensity of the 1s to 4p transition are driven by the electronic and structural changes upon adduct formation. When equivalent amounts of the parent Ni(III) complex 2 and Ca(OTf)2 are reacted in acetonitrile at -40 ºC, the Lewis acid Ca2+ coordinates to the complex to form the pure 2-Ca2+ adduct. This bonding to Ca2+ induces strong metal-ligand covalency and increases the local coordination around the metal center, which increases the intensity of the rising edge. Additionally, this interaction leads to greater charge neutralization of the Ni atom, thereby decreasing its effective nuclear charge and causing the rising edge to shift to lower energies compared to the parent complex. | Full points if the answer explains that coordination to Ca2+ leads to strong metal-ligand covalency, greater charge neutralization of the Ni atom, a decrease in effective nuclear charge (causing the energy shift), and an increase in local coordination (causing the intensity increase). |
Review
#559
2-Y3+ adduct
Ni K
▶
LLM Prompt
Sample Information
Material: 2-Y3+ adduct
Method: solution synthesis
Precursors: (NMe4)[NiIII(HMPAB)], Y(OTf)3
Temperature C: -40
Sample-Specific Conditions
- Lewis acid: Y3+
- Y3+ coordinated Ni(III) complex
Preparation
- Prepared by reacting equivalent amounts of 2 and Y(OTf)3 in acetonitrile at –40 ºC.
Measurement
We plan to measure the Ni K XANES spectrum of this sample.
Questions
Based on all the information above:
1. Based on the synthesis conditions, what is the expected oxidation state of Ni in the 2-Y3+ adduct, and how does the coordination of the Y3+ Lewis acid affect the effective nuclear charge of the Ni atom and the position of the rising edge in the XANES spectrum?
2. Describe the expected changes in the rising edge energy and the intensity of the 1s to 4p transition for the 2-Y3+ adduct compared to the parent Ni(III) complex (2).
3. How does the intensity of the 1s to 4p transition in the 2-Y3+ adduct compare to that of the 2-Ca2+ adduct, and what structural or bonding difference does this indicate?
Ground Truth
Material: 2-Y3+ adduct
Measurement: Ni K-edge XANES recorded at 20 K
Fit method: pure phase
Phase fractions:
| Phase | Fraction |
|---|---|
| 2-Y3+ adduct | 1.0 |
Source evidence: Figure 8A, page 7-8
Key reasoning: The addition of Y(OTf)3 to the Ni(III) parent complex 2 results in the formation of the 2-Y3+ adduct. The XANES spectrum shows a shift of the rising edge to lower energies (8345.77 eV at normalized absorption of 0.6) and a more intense 1s to 4p transition compared to the parent complex 2. This is attributed to strong metal-ligand covalency and bonding to the Y(OTf)3 adduct, leading to greater charge neutralization of the Ni atom and a decrease in effective nuclear charge. The more intense 1s to 4p transition in 2-Y3+ compared to 2-Ca2+ is due to the more strongly coordinated bond between the Ni metal centre and Y.
Reasoning source: Page 7, Results and Discussion section
Scoring Rubric (total: 100 pts)
| Q | Type | Max | Question | Reference Answer | Scoring Criteria |
|---|---|---|---|---|---|
| q1 | reasoning | 35 | Based on the synthesis conditions, what is the expected oxidation state of Ni in the 2-Y3+ adduct, and how does the coordination of the Y3+ Lewis acid affect the effective nuclear charge of the Ni atom and the position of the rising edge in the XANES spectrum? | The expected oxidation state of Ni in the 2-Y3+ adduct is Ni(III). This pure phase (fraction 1.0) forms directly from the solution synthesis reacting equivalent amounts of the Ni(III) parent complex 2 and Y(OTf)3 at -40 °C. The coordination of the Y3+ Lewis acid to the complex results in strong metal-ligand covalency and bonding to the Y(OTf)3 adduct. This interaction leads to greater charge neutralization of the Ni atom, which decreases its effective nuclear charge. Consequently, the rising edge in the XANES spectrum shifts to a lower energy of 8345.77 eV (at a normalized absorption of 0.6) compared to the parent complex. | Must state the oxidation state is Ni(III). Must explain that coordination to Y3+ leads to greater charge neutralization, decreasing the effective nuclear charge of Ni, which shifts the rising edge to lower energies. |
| q2 | spectral | 35 | Describe the expected changes in the rising edge energy and the intensity of the 1s to 4p transition for the 2-Y3+ adduct compared to the parent Ni(III) complex (2). | Compared to the parent Ni(III) complex 2, the 2-Y3+ adduct exhibits a shift of the rising edge to lower energies, specifically to 8345.77 eV at a normalized absorption of 0.6. Additionally, the intensity of the rising metal K-edge (1s to 4p transition) is significantly higher. These spectral changes occur because reacting the parent complex with Y(OTf)3 at -40 °C forms a pure 2-Y3+ adduct characterized by strong metal-ligand covalency. This bonding to the Y(OTf)3 adduct causes greater charge neutralization of the Ni atom and a decreased effective nuclear charge, which directly produces the observed lower edge energy and intensified 1s to 4p transition. | Must state that the rising edge shifts to lower energies (specifically 8345.77 eV at 0.6 normalized absorption) and the intensity of the rising edge (1s to 4p transition) is higher compared to the parent complex 2. |
| q3 | reasoning | 30 | How does the intensity of the 1s to 4p transition in the 2-Y3+ adduct compare to that of the 2-Ca2+ adduct, and what structural or bonding difference does this indicate? | The intensity of the 1s to 4p transition in the 2-Y3+ adduct is higher than that observed in the 2-Ca2+ adduct. This pure 2-Y3+ phase is generated by reacting the Ni(III) parent complex with the Y3+ Lewis acid (Y(OTf)3) in acetonitrile at -40 °C. The increased intensity of this transition indicates a structural and electronic difference where there is a more strongly coordinated bond between the Ni metal centre and the Y atom compared to Ca. This stronger coordination and metal-ligand covalency in the Y3+ adduct alters the electronic environment, directly resulting in the more intense 1s to 4p transition in the XANES spectrum. | Must state that the 1s to 4p transition is more intense in 2-Y3+ compared to 2-Ca2+. Must explain this is due to a more strongly coordinated bond between the Ni metal center and Y. |
Review
Giant Thermoelectric Power Factor Anisotropy in PtSb1.4Sn0.6
BNL-NSLS-II-8-ID
Pure Phase
Yu Liu et al.
DOI: 10.1021/acs.inorgchem.2c02218
1 scenario
▶
#560
PtSb1.4Sn0.6
Sn K
▶
LLM Prompt
Sample Information
Material: PtSb1.4Sn0.6
Crystal Structure: orthorhombic marcasite-type, space group Pnnm
Sample Form: single crystal
Measurement Mode: fluorescence
- Single crystal of marcasite-type PtSb1.4Sn0.6
Measurement
We plan to measure the Sn K XANES spectrum of this sample.
Questions
Based on all the information above:
1. Describe the expected Sn K-edge XANES spectral shape and approximate edge position for this sample as reported in the study.
2. Although the end members PtSb2 and PtSn2 crystallize in cubic structures, this sample forms an orthorhombic marcasite-type structure. Based on the study, what physical reasoning explains the stabilization of this phase?
Ground Truth
Compound: PtSb1.4Sn0.6
Oxidation state: not reported
Measurement: Sn K-edge XANES in fluorescence mode at 8-ID beamline of the NSLS II
Edge position: 29200
Spectral shape: The normalized Sn K-edge XANES spectrum shows a sharp edge jump near 29.2 keV (29200 eV), but no detailed spectral features or electronic transitions are discussed in the text.
Distinguishing features: not discussed in this paper
Key reasoning: The sample is a single crystal grown by the self-flux technique, resulting in a pure phase (fraction 1.0). It crystallizes in the FeAs2-type orthorhombic marcasite structure (space group Pnnm). The alloying between cubic PtSb2 and PtSn2 creates significant changes in bond energies and enthalpies of formation, stabilizing this new orthorhombic phase. EXAFS analysis confirms the local environment consists of Pt(Sb/Sn)6 octahedra with a Pt-Sb/Sn bond distance of ~2.64-2.66 Å.
Reasoning source: Page 4 (Structure analysis) and Page 10 (Conclusion)
Scoring Rubric (total: 100 pts)
| Q | Type | Max | Question | Reference Answer | Scoring Criteria |
|---|---|---|---|---|---|
| q2 | spectral | 46 | Describe the expected Sn K-edge XANES spectral shape and approximate edge position for this sample as reported in the study. | The expected Sn K-edge XANES spectrum for the PtSb1.4Sn0.6 single crystal exhibits a sharp edge jump near 29.2 keV (29200 eV). The study does not report detailed spectral features or specific electronic transitions beyond this edge position. This sharp edge jump arises from the pure phase nature of the single crystal grown via the self-flux technique. Specifically, the uniform orthorhombic marcasite-type structure provides a consistent local environment consisting of Pt(Sb/Sn)6 octahedra with Pt-Sb/Sn bond distances of ~2.64-2.66 Å, yielding a distinct absorption edge without mixed-phase broadening. | Must state the edge position is approximately 29200 eV (or 29.2 keV) and note that while a sharp edge jump is present, detailed spectral features are not discussed in the paper. |
| q3 | reasoning | 54 | Although the end members PtSb2 and PtSn2 crystallize in cubic structures, this sample forms an orthorhombic marcasite-type structure. Based on the study, what physical reasoning explains the stabilization of this phase? | The stabilization of the orthorhombic marcasite-type structure (space group Pnnm) in the PtSb1.4Sn0.6 single crystal is driven by the thermodynamics of alloying. Although the end members PtSb2 and PtSn2 are cubic, alloying them to form the PtSb1.4Sn0.6 composition induces significant changes in bond energies and enthalpies of formation. These energetic changes thermodynamically stabilize the new FeAs2-type orthorhombic phase over the cubic structure. As a result, the self-flux grown crystal forms a pure phase characterized by a local environment of Pt(Sb/Sn)6 octahedra with Pt-Sb/Sn bond distances of ~2.64-2.66 Å. | Must explain that alloying PtSb2 and PtSn2 creates significant changes in bond energies and enthalpies of formation, which stabilizes the new orthorhombic phase. |
Review
Mössbauer and Nuclear Resonance Vibrational Spectroscopy Studies of Iron Species Involved in N–N Bond Cleavage
ESRF-BM23
Pure Phase
Aleksandra Wandzilak et al.
DOI: 10.1021/acs.inorgchem.3c02594
2 scenarios
▶
#561
[LMe3FeCl]2
Fe K
▶
LLM Prompt
Sample Information
Material: [LMe3FeCl]2
Crystal Structure: dimer
Oxidation State: Fe(II)
Sample Form: powder
Measurement Mode: transmission
- Solid precursor complex
Measurement
We plan to measure the Fe K XANES spectrum of this sample.
Questions
Based on all the information above:
1. Describe the expected spectral shape and key features of the Fe K-edge XANES spectrum for solid [LMe3FeCl]2.
2. What spectral features distinguish the solid [LMe3FeCl]2 from its THF solution counterpart?
3. What do the differences in the XANES spectra between solid [LMe3FeCl]2 and its THF solution indicate about the oxidation state and local coordination environment?
Ground Truth
Compound: [LMe3FeCl]2
Oxidation state: Fe(II)
Measurement: Fe Kα-detected XAS, ESRF beamline ID-26
Edge position: not reported
Spectral shape: The spectrum features a pre-edge, a rising edge, and a prominent white line at ~7130 eV.
Labeled peaks:
| Label | Energy (eV) | Intensity | Origin | Source |
|---|---|---|---|---|
| white line | ~7130 | strong | not discussed in this paper | paper_data |
Distinguishing features: Compared to the THF solution sample, the solid [LMe3FeCl]2 has a more intense pre-edge and a lower energy rising edge.
Key reasoning: The Fe Kα-detected XAS spectrum of solid [LMe3FeCl]2 exhibits a more intense pre-edge region and a lower energy rising edge compared to its THF solution counterpart. The average pre-edge energy remains similar, indicating no change in the overall Fe(II) oxidation state. The differences in the rising edge and pre-edge intensity reflect the distinct local coordination environment of the solid dimer versus the THF-coordinated monomer.
Reasoning source: Results section, Solution Structure of [LMe3FeCl]2, page 18455
Scoring Rubric (total: 100 pts)
| Q | Type | Max | Question | Reference Answer | Scoring Criteria |
|---|---|---|---|---|---|
| q1 | spectral | 30 | Describe the expected spectral shape and key features of the Fe K-edge XANES spectrum for solid [LMe3FeCl]2. | The expected Fe K-edge XANES spectrum for solid [LMe3FeCl]2 features a pre-edge, a rising edge, and a prominent, strong white line at approximately 7130 eV. Because the sample is a pure solid precursor complex composed entirely of the Fe(II) dimer (100% fraction), its spectral shape directly reflects this specific dimeric structure. The distinct local coordination environment of the solid powder dimer produces these specific features, including a more intense pre-edge and a lower energy rising edge compared to a solvated monomeric form. Furthermore, the pre-edge energy position is characteristic of the sample's stable Fe(II) oxidation state. | Award full points for mentioning the pre-edge, rising edge, and the white line at ~7130 eV. |
| q2 | spectral | 35 | What spectral features distinguish the solid [LMe3FeCl]2 from its THF solution counterpart? | Compared to its THF solution counterpart, the solid [LMe3FeCl]2 spectrum is distinguished by a more intense pre-edge region and a lower energy rising edge. These spectral differences arise because the solid powder sample exists as a pure [LMe3FeCl]2 dimer, whereas in THF solution it forms a THF-coordinated monomer. The distinct local coordination environment of the solid dimer versus the solvated monomer directly alters the electronic transitions, leading to the observed changes in pre-edge intensity and rising edge position. Despite these structural differences, the average pre-edge energy remains similar, reflecting that the Fe(II) oxidation state is maintained in both conditions. | Award full points for identifying that the solid sample has a more intense pre-edge and a lower energy rising edge compared to the THF solution. |
| q3 | reasoning | 35 | What do the differences in the XANES spectra between solid [LMe3FeCl]2 and its THF solution indicate about the oxidation state and local coordination environment? | The differences in the XANES spectra indicate that the local coordination environment changes significantly between the two states, while the oxidation state remains unchanged. Because the solid powder sample consists of a pure [LMe3FeCl]2 dimer, it exhibits a more intense pre-edge and a lower energy rising edge compared to the THF-coordinated monomer found in solution. This shift in edge features directly reflects the distinct local coordination environment of the solid dimer structure. However, the average pre-edge energy remains similar between the two samples, which confirms that the Fe(II) oxidation state of the solid precursor complex is preserved even when dissolved in THF. | Award full points for explaining that the similar average pre-edge energy indicates no change in the Fe(II) oxidation state, while the differences in pre-edge intensity and rising edge position reflect changes in the local coordination environment (dimer vs. monomer with THF). |
Review
#562
LMe3Fe(Cl)(THF)
Fe K
▶
LLM Prompt
Sample Information
Material: LMe3Fe(Cl)(THF)
Crystal Structure: monomer
Oxidation State: Fe(II)
Sample Form: solution
Measurement Mode: fluorescence
- Precursor complex dissolved in THF, forming a monomeric THF adduct
Measurement
We plan to measure the Fe K XANES spectrum of this sample.
Questions
Based on all the information above:
1. Describe the expected Fe K-edge XANES spectral features for the [LMe3FeCl]2 precursor dissolved in THF, specifically focusing on the pre-edge, rising edge, and white line.
2. What distinguishes the XANES spectrum of this THF solution sample from the solid [LMe3FeCl]2 dimer?
3. Based on the XANES spectral changes (specifically the rising edge shift and pre-edge intensity), what structural transformation occurs when the solid precursor is dissolved in THF?
Ground Truth
Compound: LMe3Fe(Cl)(THF)
Oxidation state: Fe(II)
Measurement: Fe Kα-detected XAS, ESRF beamline ID-26
Edge position: not reported
Spectral shape: Features a less intense pre-edge, a higher energy rising edge, and a white line at ~7130 eV compared to the solid.
Labeled peaks:
| Label | Energy (eV) | Intensity | Origin | Source |
|---|---|---|---|---|
| white line | ~7130 | strong | not discussed in this paper | paper_data |
Distinguishing features: Higher energy rising edge and less intense pre-edge compared to the solid dimer [LMe3FeCl]2.
Key reasoning: The solution sample in THF shows a less intense pre-edge region but similar average pre-edge energy compared to the solid, indicating a change in local coordination but no change in oxidation state. The rising edge shifts to higher energy, consistent with replacing a chloride with a lighter scatterer (oxygen from THF). EXAFS confirms the loss of an Fe-Fe vector (dimer dissociation) and the presence of three N/O scatterers and one Cl.
Reasoning source: Page 8, 'Solution Structure of [LMe3FeCl]2' section
Scoring Rubric (total: 100 pts)
| Q | Type | Max | Question | Reference Answer | Scoring Criteria |
|---|---|---|---|---|---|
| q1 | spectral | 30 | Describe the expected Fe K-edge XANES spectral features for the [LMe3FeCl]2 precursor dissolved in THF, specifically focusing on the pre-edge, rising edge, and white line. | The expected Fe K-edge XANES spectrum for the LMe3Fe(Cl)(THF) solution features a less intense pre-edge region, a rising edge shifted to higher energy, and a strong white line at approximately 7130 eV. These specific spectral features arise because dissolving the precursor in THF forms a monomeric THF adduct. The pre-edge intensity decreases due to the change in local coordination geometry upon monomerization, while the average pre-edge energy remains similar, reflecting the unchanged Fe(II) oxidation state. Furthermore, the rising edge shifts to higher energy because a heavier chloride ligand is replaced by a lighter oxygen scatterer from the coordinating THF solvent. | Full points for mentioning a less intense pre-edge, a higher energy rising edge, and a white line at ~7130 eV. |
| q2 | spectral | 30 | What distinguishes the XANES spectrum of this THF solution sample from the solid [LMe3FeCl]2 dimer? | The XANES spectrum of the THF solution sample is distinguished from the solid [LMe3FeCl]2 dimer by a less intense pre-edge region and a rising edge that is shifted to higher energy. These distinguishing features occur because dissolving the solid precursor in THF causes the dimer to dissociate into a monomeric LMe3Fe(Cl)(THF) adduct. The shift to a higher energy rising edge is directly caused by replacing a heavier chloride ligand with a lighter oxygen scatterer from the THF solvent. Meanwhile, the less intense pre-edge reflects the altered local coordination environment of the newly formed monomer, even though the Fe(II) oxidation state remains unchanged. | Full points for identifying the higher energy rising edge and the less intense pre-edge compared to the solid. |
| q3 | reasoning | 40 | Based on the XANES spectral changes (specifically the rising edge shift and pre-edge intensity), what structural transformation occurs when the solid precursor is dissolved in THF? | When the solid precursor is dissolved in THF, it undergoes a structural transformation from a dimer into a monomeric LMe3Fe(Cl)(THF) adduct. This transformation is evidenced by the rising edge shifting to higher energy, which occurs because a heavier chloride ligand is replaced by a lighter oxygen scatterer from the coordinating THF solvent. Additionally, the pre-edge region becomes less intense due to the change in local coordination geometry associated with this dimer dissociation. Despite these structural changes, the average pre-edge energy remains similar, confirming that the Fe(II) oxidation state is preserved during the dissolution process. | Full points for explaining that the less intense pre-edge indicates a change in local coordination (without oxidation state change) and the higher energy rising edge indicates replacement of a chloride by a lighter scatterer (oxygen from THF), corresponding to dimer dissociation into a monomeric THF adduct. |
Review
Following CO and H Insertion into Ru–C Bonds with X-ray Photoelectron and Absorption Spectroscopies
BNL-NSLS-II-8-ID
Catalyst
Irene Barba-Nieto et al.
DOI: 10.1021/acs.inorgchem.5c03822
1 scenario
▶
#563
cis-[Ru(bpy)2(CO)(CH3)]+
Ru K, L3
▶
LLM Prompt
Sample Information
Material: cis-[Ru(bpy)2(CO)(CH3)]+
Reaction Conditions: ex-situ
Sample-Specific Conditions
- ligand: CH3
- Ruthenium methyl complex
Measurement
We plan to measure the Ru K, L3 XANES spectrum of this sample.
Questions
Based on all the information above:
1. Based on the sample conditions, what is the expected formal oxidation state of the Ru center in this complex, and how would the Ru K-edge and L3-edge XANES spectra confirm this?
2. Describe the expected spectral shape of the cis-[Ru(bpy)2(CO)(CH3)]+ complex at the Ru L3-edge.
Ground Truth
Material: cis-[Ru(bpy)2(CO)(CH3)]+
Measurement: Ru K-edge and L3-edge, ex-situ
Fit method: not reported
Phase fractions:
| Phase | Fraction |
|---|---|
| cis-[Ru(bpy)2(CO)(CH3)]+ | 1.0 |
Source evidence: Figure 2a, 2b, 2c, page 6-7
Key reasoning: The Ru K-edge line shape is very different from metallic Ru and Ru(IV)O2, indicating a Ru(II) oxidation state. This assignment is further confirmed by the spectral features observed at the Ru L3-edge, which match those expected for a Ru(II) center.
Reasoning source: Page 6, paragraph 2
Scoring Rubric (total: 100 pts)
| Q | Type | Max | Question | Reference Answer | Scoring Criteria |
|---|---|---|---|---|---|
| q1 | reasoning | 54 | Based on the sample conditions, what is the expected formal oxidation state of the Ru center in this complex, and how would the Ru K-edge and L3-edge XANES spectra confirm this? | Based on the sample conditions for the ruthenium methyl complex, the expected formal oxidation state of the Ru center is Ru(II). This oxidation state is expected because the presence of the CH3 ligand in the cis-[Ru(bpy)2(CO)(CH3)]+ complex maintains the stable Ru(II) center characteristic of this family of complexes. The Ru K-edge XANES spectrum confirms this by exhibiting a distinct line shape (with an edge position at ~22120 eV) that is very different from metallic Ru and Ru(IV)O2. Additionally, the Ru L3-edge spectrum confirms this assignment by displaying features that match those expected for a Ru(II) center, demonstrating that the oxidation state remains Ru(II) regardless of the specific ligand. | Award full points if the answer correctly identifies the oxidation state as Ru(II) and explains that the Ru K-edge line shape is distinct from metallic Ru and Ru(IV)O2, and that the L3-edge features match those expected for a Ru(II) center. |
| q2 | spectral | 46 | Describe the expected spectral shape of the cis-[Ru(bpy)2(CO)(CH3)]+ complex at the Ru L3-edge. | At the Ru L3-edge, the cis-[Ru(bpy)2(CO)(CH3)]+ complex is expected to exhibit a strong white line peak located at approximately 2844 eV. This specific spectral shape arises because the sample is a ruthenium methyl complex where the Ru center maintains a stable Ru(II) oxidation state under the ex-situ measurement conditions. Because the CH3 ligand does not alter the underlying Ru(II) electronic structure, the resulting L3-edge spectrum is very similar to other related Ru(II) complexes like cis-[Ru(bpy)2(CO)(COCH3)]+ and cis-[Ru(bpy)2(CO)(H)]+. Therefore, the strong white line intensity directly reflects the electronic properties of the Ru(II) center in this specific ligand environment. | Award full points if the answer mentions a strong white line peak around 2844 eV. |
Review
Itinerant Magnetism in Hydride-Synthesized CaCo 12 B 6
BNL-NSLS-II-8-ID
Pure Phase
Thomas A. Seymour-Cozzini et al.
DOI: 10.1021/acs.inorgchem.5c04959
3 scenarios
▶
#564
CaCo12B6
Co K-edge
▶
LLM Prompt
Sample Information
Material: CaCo12B6
Crystal Structure: SrNi12B6 structure type (R-3m)
Oxidation State: 0
Sample Form: powder pellet diluted with BN
Measurement Mode: transmission
- New ternary alkaline-earth-transition metal boride synthesized via hydride route
Measurement
We plan to measure the Co K-edge XANES spectrum of this sample.
Questions
Based on all the information above:
1. Based on the synthesis of the new ternary boride CaCo12B6, what is the expected oxidation state of Co in this compound, and what approximate Co K-edge position (in eV) would confirm this electronic state?
2. To properly benchmark the lack of ionic character and metallic state of Co in CaCo12B6 using XANES, what specific reference materials should be measured alongside the sample?
Ground Truth
Compound: CaCo12B6
Oxidation state: 0 (metallic, no ionic character)
Measurement: Co K-edge transmission at beamline 8-ID, NSLS
Edge position: 7708.8
Spectral shape: The XANES spectrum indicates that cobalt has no ionic character, with an absorption edge similar to cobalt metal and Co2B.
Distinguishing features: Absorption edge is identical to Co2B (7708.8 eV) and very close to Co metal (7709 eV). EXAFS shows peak broadening compared to binary borides due to multiple Co sites and the Ca@Co6B6 cage void.
Key reasoning: The XANES edge energy of CaCo12B6 is 7708.8 eV, which is identical to Co2B and very similar to Co metal (7709 eV), indicating that Co has no ionic character and is in a metallic state. EXAFS radial probability functions show similar Co-Co and Co-B nearest neighbor environments to binary borides at distances shorter than 2.7 Å. However, peak broadening is observed in CaCo12B6 due to greater variability in Co-Co and Co-B distances caused by the multiple crystallographic Co sites and the large void of the Ca@Co6B6 cage.
Reasoning source: Electronic Structure and DFT Calculations section, page 1960
Scoring Rubric (total: 100 pts)
| Q | Type | Max | Question | Reference Answer | Scoring Criteria |
|---|---|---|---|---|---|
| q1 | spectral | 50 | Based on the synthesis of the new ternary boride CaCo12B6, what is the expected oxidation state of Co in this compound, and what approximate Co K-edge position (in eV) would confirm this electronic state? | The expected oxidation state of Co in the newly synthesized CaCo12B6 is 0, indicating a metallic state with no ionic character. This electronic state is confirmed by a Co K-edge position of 7708.8 eV. Because this ternary alkaline-earth-transition metal boride forms a complex SrNi12B6-type structure, the cobalt atoms remain metallic, yielding an absorption edge identical to Co2B and very close to Co metal (7709 eV). Furthermore, the specific structural conditions of the sample—namely the multiple crystallographic Co sites and the large void of the Ca@Co6B6 cage—cause greater variability in Co-Co and Co-B distances, resulting in characteristic peak broadening in the EXAFS region. | Full points for identifying an oxidation state of 0 (or metallic/no ionic character) and an edge position around 7708.8 - 7709 eV. |
| q3 | identification | 50 | To properly benchmark the lack of ionic character and metallic state of Co in CaCo12B6 using XANES, what specific reference materials should be measured alongside the sample? | To properly benchmark the lack of ionic character in CaCo12B6, the specific reference materials that should be measured are Co foil, Co2B, CoB, CoO, and Co3O4. Because the sample is a newly synthesized ternary boride with an expected Co oxidation state of 0, these references are required to comparatively analyze the edge positions and prove the metallic state. The metallic and binary boride references (Co foil, Co2B, CoB) establish the baseline for the 0 oxidation state, showing that the sample's edge energy (7708.8 eV) perfectly matches Co2B and is very close to Co metal (7709 eV). Meanwhile, the oxide references (CoO, Co3O4) act as ionic benchmarks to definitively rule out any oxidation in the powder pellet. This comparative basis ensures that the observed spectral features, including EXAFS peak broadening, are correctly attributed to the sample's multiple crystallographic Co sites and the Ca@Co6B6 cage void rather than oxidized impurities. | Full points for listing metallic Co (Co foil) and binary cobalt borides (Co2B, CoB) to establish the metallic baseline, as well as cobalt oxides (CoO, Co3O4) to rule out ionic character. |
Review
#565
Co2B
Co K-edge
▶
LLM Prompt
Sample Information
Material: Co2B
Oxidation State: 0
Sample Form: powder pellet diluted with BN
Measurement Mode: transmission
- Binary cobalt boride reference compound
Measurement
We plan to measure the Co K-edge XANES spectrum of this sample.
Questions
Based on all the information above:
1. What is the expected Co K-edge absorption edge energy for this Co2B reference sample, and what does this indicate about its electronic state compared to Co metal?
2. Based on the XANES analysis, does the cobalt in Co2B exhibit significant ionic character? Explain your reasoning based on its spectral similarity to other materials.
Ground Truth
Compound: Co2B
Oxidation state: 0
Measurement: Co K-edge transmission at beamline 8-ID, NSLS
Edge position: 7708.8
Spectral shape: Metallic state spectrum with an absorption edge identical to CaCo12B6 and similar to Co metal.
Distinguishing features: Sharper EXAFS peaks compared to CaCo12B6 due to having only one Co crystallographic site, resulting in less variability in Co-Co and Co-B distances.
Key reasoning: Co2B was used as a binary reference compound to compare with CaCo12B6. The XANES edge energy of Co2B is 7708.8 eV, which is identical to CaCo12B6 and similar to Co metal (7709 eV), indicating a metallic state with no ionic character. EXAFS analysis shows Co2B has sharper peaks than CaCo12B6 because it only has one Co crystallographic site, leading to less variability in Co-Co and Co-B distances.
Reasoning source: Page 8, Electronic Structure and DFT Calculations
Scoring Rubric (total: 100 pts)
| Q | Type | Max | Question | Reference Answer | Scoring Criteria |
|---|---|---|---|---|---|
| q1 | spectral | 50 | What is the expected Co K-edge absorption edge energy for this Co2B reference sample, and what does this indicate about its electronic state compared to Co metal? | The expected Co K-edge absorption edge energy for the Co2B reference sample is 7708.8 eV. Because this sample is a binary cobalt boride reference compound prepared with a formal oxidation state of 0, its edge energy is nearly identical to that of pure Co metal (7709 eV). This spectral similarity indicates that the cobalt in Co2B exists in a purely metallic state with no ionic character. Furthermore, the specific Co2B composition features only one Co crystallographic site, which dictates this metallic electronic structure and produces sharper EXAFS peaks due to minimal variability in Co-Co and Co-B distances. | Full credit for stating the edge position is 7708.8 eV and explaining that it indicates a metallic state with no ionic character, similar to Co metal (7709 eV). |
| q3 | reasoning | 50 | Based on the XANES analysis, does the cobalt in Co2B exhibit significant ionic character? Explain your reasoning based on its spectral similarity to other materials. | No, the cobalt in the Co2B sample does not exhibit any significant ionic character. This is expected because the sample is a binary cobalt boride reference compound with a formal oxidation state of 0. Its measured XANES edge energy is 7708.8 eV, which is identical to CaCo12B6 and highly similar to pure Co metal (7709 eV), confirming a purely metallic electronic state. The specific composition and structure of Co2B, which contains only one Co crystallographic site, dictates this metallic nature and results in less variability in Co-Co and Co-B distances, leading to sharper EXAFS peaks compared to more complex borides. | Full credit for stating that Co in Co2B has no ionic character (oxidation state 0) and justifying this by noting its absorption edge is similar to that of pure cobalt metal. |
Review
#566
Co
Co K-edge
▶
LLM Prompt
Sample Information
Material: Co
Oxidation State: 0
Sample Form: foil
Measurement Mode: transmission
- Cobalt foil standard
Measurement
We plan to measure the Co K-edge XANES spectrum of this sample.
Questions
Based on all the information above:
1. What is the expected Co K-edge absorption edge energy for this cobalt foil standard, and what oxidation state does this represent?
2. How does the absorption edge energy of this cobalt metal standard compare to the edge energies of metallic borides like Co2B and CaCo12B6, and what does this imply about the electronic state of Co in those borides?
3. In the context of evaluating the XANES spectra of novel cobalt compounds, what is the primary purpose of measuring this cobalt foil sample?
Ground Truth
Compound: Co
Oxidation state: 0
Measurement: Co K-edge XANES, transmission mode, beamline 8-ID at the National Synchrotron Light Source (NSLS)
Edge position: 7709
Spectral shape: The spectrum exhibits an absorption edge at 7709 eV, characteristic of metallic cobalt.
Distinguishing features: The edge energy of 7709 eV is characteristic of zero-valent cobalt metal. It is nearly identical to the absorption edges of Co2B and CaCo12B6 (7708.8 eV), which demonstrates that the cobalt atoms in these borides lack ionic character and exist in a metallic state.
Key reasoning: Cobalt foil was used as a standard during the X-ray absorption spectroscopy measurements. Its absorption edge is explicitly identified at 7709 eV, which serves as a reference for the metallic state (Co^0) to evaluate the ionic character of synthesized cobalt borides.
Reasoning source: Page 3, X-ray Absorption Spectroscopy; Page 8, Electronic Structure and DFT Calculations
Scoring Rubric (total: 100 pts)
| Q | Type | Max | Question | Reference Answer | Scoring Criteria |
|---|---|---|---|---|---|
| q1 | spectral | 30 | What is the expected Co K-edge absorption edge energy for this cobalt foil standard, and what oxidation state does this represent? | The expected Co K-edge absorption edge energy for this sample is 7709 eV, which represents an oxidation state of 0. Because the sample is a pure cobalt foil standard consisting entirely of zero-valent cobalt metal (fraction = 1.0), it exhibits the characteristic spectral features of metallic Co. This specific edge energy of 7709 eV arises directly from the metallic, non-ionic electronic structure of the Co^0 atoms in the foil. | Full points if the answer correctly identifies the edge position at 7709 eV and the oxidation state as 0 (metallic). |
| q2 | reasoning | 40 | How does the absorption edge energy of this cobalt metal standard compare to the edge energies of metallic borides like Co2B and CaCo12B6, and what does this imply about the electronic state of Co in those borides? | The absorption edge energy of this cobalt metal standard (7709 eV) is nearly identical to the edge energies of metallic borides like Co2B and CaCo12B6 (7708.8 eV). Because the cobalt foil sample consists of pure Co^0, it serves as a baseline for the zero-valent metallic state. The lack of a significant shift in the edge energy demonstrates that the cobalt atoms in these synthesized borides lack ionic character. Consequently, this implies that the cobalt in Co2B and CaCo12B6 exists in a metallic state similar to the pure foil standard. | Full points if the answer notes that the edge energies are very similar (7709 eV for Co metal vs 7708.8 eV for the borides) and correctly concludes that this implies a lack of ionic character (or a metallic state) for Co in the borides. |
| q3 | reasoning | 30 | In the context of evaluating the XANES spectra of novel cobalt compounds, what is the primary purpose of measuring this cobalt foil sample? | The primary purpose of measuring this cobalt foil sample is to use it as a reference standard for the metallic state (Co^0). Because the sample is a pure, zero-valent cobalt foil measured in transmission mode, it provides a reliable baseline absorption edge at 7709 eV. This established baseline is necessary to evaluate the ionic character of synthesized cobalt compounds, such as cobalt borides. By comparing the edge positions of novel compounds to this pure Co^0 standard, researchers can determine whether the cobalt in the new materials exhibits ionic or metallic characteristics. | Full points if the answer explains that the foil is used as a standard/reference to establish the baseline edge energy for zero-valent, metallic cobalt, allowing for the determination of charge transfer or ionic character in the unknown samples. |
Review
Molecular Niobium Precursors in Various Oxidation States: An XAS Case Study
BNL-NSLS-II-8-ID
Pure Phase
Maciej D. Korzyński et al.
DOI: 10.1021/acs.inorgchem.8b02616
1 scenario
▶
#567
NbCl3(DME)
Nb Not specified
▶
LLM Prompt
Sample Information
Material: NbCl3(DME)
Oxidation State: +3
Sample Form: molecular compound
- commonly used and catalytically competent Nb precursor
Measurement
We plan to measure the Nb Not specified XANES spectrum of this sample.
Questions
Based on all the information above:
1. Identify the dominant chemical phase present in this sample.
2. What is the oxidation state of Niobium in this specific compound?
3. Based on the provided context, what is the functional role and physical form of this material?
Ground Truth
Compound: NbCl3(DME)
Oxidation state: +3
Measurement: Not specified
Edge position: not reported
Spectral shape: not reported
Distinguishing features: not reported
Key reasoning: The sample is a molecular compound identified as NbCl3(DME), which is described as a commonly used and catalytically competent Nb precursor. The oxidation state of Nb in this pure phase is +3.
Reasoning source: Text description
Scoring Rubric (total: 100 pts)
| Q | Type | Max | Question | Reference Answer | Scoring Criteria |
|---|---|---|---|---|---|
| q1 | identification | 30 | Identify the dominant chemical phase present in this sample. | The dominant chemical phase present in this sample is NbCl3(DME), which accounts for a 1.0 (100%) fraction of the material. This pure phase is expected because the sample is explicitly provided as a discrete molecular compound rather than a multiphase mixture. According to the sample conditions, this material is synthesized to serve as a commonly used and catalytically competent Nb precursor. Consequently, the sample exists entirely as the intact NbCl3(DME) complex, maintaining its structural integrity without any secondary phases. | Full points if the answer correctly identifies NbCl3(DME) as the sole or dominant phase. |
| q2 | identification | 30 | What is the oxidation state of Niobium in this specific compound? | The oxidation state of Niobium in this specific compound is +3. This oxidation state arises directly from the chemical identity of the pure NbCl3(DME) molecular compound. Because the sample is utilized as a catalytically competent Nb precursor, it is formulated to maintain this specific electronic configuration. The intact molecular nature of the pure phase ensures that the niobium center remains exclusively in the +3 state. | Full points if the answer correctly states the oxidation state is +3. |
| q3 | reasoning | 40 | Based on the provided context, what is the functional role and physical form of this material? | The physical form of this material is a molecular compound, and its functional role is a commonly used, catalytically competent Nb precursor. These properties arise directly from the sample's identity as pure NbCl3(DME). Because it is synthesized as a discrete molecular complex with a specific +3 oxidation state, it possesses the well-defined structural and electronic properties required for catalytic applications. Therefore, the pure NbCl3(DME) composition dictates both its isolated molecular form and its utility as a chemical precursor. | Full points if the answer notes it is a molecular compound and describes it as a commonly used, catalytically competent Nb precursor. |
Review
X-ray Absorption Spectroscopy Investigations of Copper(II) Coordination in the Human Amyloid β Peptide
APS
Synthesis
Kelly L. Summers et al.
DOI: 10.1021/acs.inorgchem.9b00507
4 scenarios
▶
#568
Cu(II)Aβ(1-42) complex
Cu K
▶
LLM Prompt
Sample Information
Material: Cu(II)Aβ(1-42) complex
Method: solution mixing
Precursors: Aβ(1-42), CuCl2, DTAB, MOPS buffer
Cooling Method: flash frozen in liquid nitrogen
Sample-Specific Conditions
- pH: 6.1
- Cu(II) bound to amyloid beta peptide at pH 6.1
Preparation
- Lyophilized Aβ(1-42) dissolved in 400 mM DTAB + 100 mM MOPS buffer. Aqueous Cu(II) from CuCl2 added to ~1:1 Aβ/Cu2+ ratio. Final concentrations: 0.54 mM Aβ(1-42), 0.50 mM CuCl2. Flash frozen in liquid nitrogen.
Measurement
We plan to measure the Cu K XANES spectrum of this sample.
Questions
Based on all the information above:
1. Based on the sample conditions (pH 6.1), what is the expected dominant coordination environment and geometry of the Cu(II) center, and why?
2. Describe the expected key spectral features in the Cu K-edge HERFD-XAS spectrum for this sample. Specifically, what feature distinguishes it from Cu(II)Aβ(1-42) at physiological or high pH, and what is its electronic origin?
Ground Truth
Material: Cu(II)Aβ(1-42) complex
Measurement: Cu K-edge HERFD-XAS
Fit method: EXAFS curve-fitting
Phase fractions: (±10%)
| Phase | Fraction |
|---|---|
| Cu(II)Aβ(1-42) 4-coordinate (1 His) | 1.0 |
Fit basis (paper's reference spectra):
- FEFF calculated scattering paths for Cu(II) imidazole/histidine
Source evidence: Figure 3A, Table 2, pages 9 and 11
Key reasoning: EXAFS fitting indicates the average coordination at pH 6.1 is best fit with 4 O/N primary backscatterers and a single histidine residue. The HERFD-XAS spectrum shows a pronounced 1s -> 4p LMCT shakedown transition at 8983.6 eV, which is often associated with 4-coordinate square planar type complexes.
Reasoning source: Section 2.4 and 2.5, pages 9 and 11
Scoring Rubric (total: 100 pts)
| Q | Type | Max | Question | Reference Answer | Scoring Criteria |
|---|---|---|---|---|---|
| q1 | reasoning | 43 | Based on the sample conditions (pH 6.1), what is the expected dominant coordination environment and geometry of the Cu(II) center, and why? | Based on the sample conditions at pH 6.1, the Cu(II) center is expected to be 100% in a 4-coordinate square planar geometry with 4 O/N primary backscatterers and a single histidine residue. This specific coordination environment arises because, at this mildly acidic pH of 6.1, the 1:1 mixture of Cu(II) and Aβ(1-42) peptide favors binding to only one histidine ligand. EXAFS curve-fitting confirms this structural arrangement for the flash-frozen solution. Furthermore, this geometry is corroborated by the HERFD-XAS spectrum, which exhibits a pronounced 1s -> 4p LMCT shakedown transition that is highly characteristic of 4-coordinate square planar complexes. | 15 points for identifying a 4-coordinate (square planar) environment with a single histidine ligand (and 3 O/N ligands). 15 points for reasoning that this geometry is supported by the pronounced 1s -> 4p LMCT shakedown transition and EXAFS fitting at this pH. |
| q2 | spectral | 57 | Describe the expected key spectral features in the Cu K-edge HERFD-XAS spectrum for this sample. Specifically, what feature distinguishes it from Cu(II)Aβ(1-42) at physiological or high pH, and what is its electronic origin? | The expected Cu K-edge HERFD-XAS spectrum for this sample features a distinctive peak at 8983.6 eV and notably lacks the pronounced shoulder at ~8989.5 eV that typically appears at higher pH values. The key distinguishing feature of this sample is the highly pronounced 8983.6 eV peak, which originates from a 1s -> 4p ligand-to-metal charge transfer (LMCT) shakedown transition. These spectral features arise directly from the sample conditions, specifically the mildly acidic pH of 6.1, which drives the Cu(II)Aβ(1-42) complex to adopt a 4-coordinate square planar geometry with a single histidine ligand. It is this specific 4-coordinate structural and electronic environment that produces the pronounced LMCT shakedown transition, differentiating it from the coordination states formed at physiological or high pH. | 15 points for mentioning the distinctive peak at 8983.6 eV. 15 points for identifying its origin as a 1s -> 4p ligand to metal charge transfer (LMCT) shakedown transition. 10 points for noting it is more pronounced than at higher pH (or lacks the 8989.5 eV shoulder seen at higher pH). |
Review
#569
Cu(II)Aβ(1-42) complex
Cu K
▶
LLM Prompt
Sample Information
Material: Cu(II)Aβ(1-42) complex
Method: solution mixing
Precursors: Aβ(1-42), CuCl2, DTAB, MOPS buffer
Cooling Method: flash frozen in liquid nitrogen
Sample-Specific Conditions
- pH: 7.4
- Cu(II) bound to amyloid beta peptide at pH 7.4
Preparation
- Lyophilized Aβ(1-42) dissolved in 400 mM DTAB + 100 mM MOPS buffer. Aqueous Cu(II) from CuCl2 added to ~1:1 Aβ/Cu2+ ratio. Final concentrations: 0.54 mM Aβ(1-42), 0.50 mM CuCl2. Flash frozen in liquid nitrogen.
Measurement
We plan to measure the Cu K XANES spectrum of this sample.
Questions
Based on all the information above:
1. Based on the sample conditions (pH 7.4), what is the expected average coordination environment of the Cu(II) center, and how does the XANES data distinguish this state from a simple mixture of low-pH (Component I) and high-pH (Component II) species?
2. Describe the expected spectral shape and key features of the Cu K-edge HERFD-XAS spectrum for this sample, specifically focusing on the features around 8983-8990 eV.
3. What electronic transition gives rise to the feature at ~8983.6 eV, and what does its intensity and shape at pH 7.4 imply about the Cu(II) coordination geometry?
Ground Truth
Material: Cu(II)Aβ(1-42) complex
Measurement: Cu K-edge HERFD-XAS and conventional XAS at SSRL beamlines 6-2 and 7-3
Fit method: EXAFS curve-fitting
Phase fractions: (±10%)
| Phase | Fraction |
|---|---|
| Cu(II)Aβ(1-42) 4-coordinate (2 His) | 1.0 |
Fit basis (paper's reference spectra):
- theoretical scattering paths from FEFF825
Source evidence: Figure 3, Table 2, pages 9-11
Key reasoning: The EXAFS is best fit with 4 O/N primary backscatterers and multiple scattering from 2 histidine residues. The HERFD-XAS shows a small, broad 1s -> 4p LMCT shakedown peak and a pronounced shoulder at ~8989.5 eV, indicating a disordered 4-coordinate Cu(II) center. The spectrum is perceptibly different from both pH 6.1 and 9.0 spectra, suggesting it is not simply a mixture of low-pH and high-pH components but represents a distinct heterogeneous mixture of coordination environments.
Reasoning source: Section 2.4 (Effect of pH on Cu(II) Coordination in Aβ) and Section 2.5 (Geometry optimization and curve-fitting of the EXAFS)
Scoring Rubric (total: 100 pts)
| Q | Type | Max | Question | Reference Answer | Scoring Criteria |
|---|---|---|---|---|---|
| q1 | reasoning | 35 | Based on the sample conditions (pH 7.4), what is the expected average coordination environment of the Cu(II) center, and how does the XANES data distinguish this state from a simple mixture of low-pH (Component I) and high-pH (Component II) species? | At pH 7.4, the Cu(II) center in the Aβ(1-42) complex is expected to be a highly disordered 4-coordinate environment with 4 O/N primary backscatterers, including 2 histidine residues. This specific coordination arises because the physiological pH of 7.4 promotes a distinct heterogeneous mixture of coordination environments rather than a simple transition state between extremes. The XANES data distinguishes this state because the spectrum is perceptibly different from both the pH 6.1 (Component I) and pH 9.0 (Component II) spectra. Therefore, it cannot be modeled as a simple linear combination of the low-pH and high-pH species, confirming it represents a unique structural state driven by the specific pH 7.4 conditions. | Must identify a disordered 4-coordinate Cu(II) environment with 2 histidine ligands. Must explain that the spectrum is perceptibly different from both pH 6.1 and 9.0 spectra, indicating it is not just a linear combination of the two, but a distinct heterogeneous mixture or intermediate state. |
| q2 | spectral | 35 | Describe the expected spectral shape and key features of the Cu K-edge HERFD-XAS spectrum for this sample, specifically focusing on the features around 8983-8990 eV. | The Cu K-edge HERFD-XAS spectrum for this sample exhibits a small, broad shoulder at ~8983.6 eV and a pronounced main edge shoulder at ~8989.5 eV. These specific spectral features arise because the sample was prepared at pH 7.4 with a 1:1 Aβ/Cu2+ ratio, which stabilizes a highly disordered 4-coordinate Cu(II) environment with two histidine ligands. The ~8983.6 eV feature corresponds to a 1s -> 4p ligand-to-metal charge transfer (LMCT) shakedown transition characteristic of this geometry. Additionally, the shape of the first EXAFS oscillation reflects longer-range interactions consistent with histidine multiple scattering, further confirming the unique structural state induced by these specific aqueous buffer conditions. | Must mention the small, broad shoulder at ~8983.6 eV and the pronounced shoulder at ~8989.5 eV. |
| q3 | reasoning | 30 | What electronic transition gives rise to the feature at ~8983.6 eV, and what does its intensity and shape at pH 7.4 imply about the Cu(II) coordination geometry? | The feature at ~8983.6 eV is assigned to a 1s -> 4p ligand-to-metal charge transfer (LMCT) shakedown transition. At the specific sample condition of pH 7.4, this peak appears as a small, broad shoulder. This intensity and shape imply that the Cu(II) center exists in a highly disordered 4-coordinate geometry with 4 O/N primary backscatterers, including 2 histidine residues. This distinct coordination geometry is stabilized by the pH 7.4 environment and the flash-freezing process, which traps a unique heterogeneous mixture of coordination environments rather than a simple combination of low- and high-pH species. | Must identify the feature as a 1s -> 4p ligand-to-metal charge transfer (LMCT) shakedown transition. Must state that its small, broad nature indicates a highly disordered 4-coordinate Cu(II) center. |
Review
#570
Cu(II)Aβ(1-42) complex
Cu K
▶
LLM Prompt
Sample Information
Material: Cu(II)Aβ(1-42) complex
Method: solution mixing
Precursors: Aβ(1-42), CuCl2, DTAB, MOPS buffer
Cooling Method: flash frozen in liquid nitrogen
Sample-Specific Conditions
- pH: 9.0
- Cu(II) bound to amyloid beta peptide at pH 9.0
Preparation
- Lyophilized Aβ(1-42) dissolved in 400 mM DTAB + 100 mM MOPS buffer. Aqueous Cu(II) from CuCl2 added to ~1:1 Aβ/Cu2+ ratio. Final concentrations: 0.54 mM Aβ(1-42), 0.50 mM CuCl2. Flash frozen in liquid nitrogen.
Measurement
We plan to measure the Cu K XANES spectrum of this sample.
Questions
Based on all the information above:
1. Based on the sample conditions (Cu(II)Aβ(1-42) at pH 9.0), what is the expected coordination geometry and how many histidine residues are coordinated to the Cu(II) center?
2. Describe the key spectral feature in the Cu K-edge near-edge spectrum that distinguishes the Cu(II) coordination at pH 9.0 from that at pH 6.1, and explain its electronic origin.
Ground Truth
Material: Cu(II)Aβ(1-42) complex
Measurement: Cu K-edge HERFD-XAS, fluorescence mode, SSRL beamline 6-2
Fit method: EXAFS curve-fitting
Phase fractions: (±10%)
| Phase | Fraction |
|---|---|
| Cu(II)Aβ(1-42) 5-coordinate (2 His) | 1.0 |
Fit basis (paper's reference spectra):
- theoretical scattering paths from FEFF825
Source evidence: Figure 3, Table 2, pages 9-11
Key reasoning: At pH 9.0, the HERFD-XAS spectrum shows a less intense 1s → 4p LMCT shakedown transition at 8983.6 eV compared to pH 6.1. EXAFS fitting indicates an average coordination of 5 with O/N primary backscatterers and multiple scattering from 2 histidine residues. This is consistent with a 5-coordinate square pyramidal geometry.
Reasoning source: Section 2.4 and 2.5, pages 9-11
Scoring Rubric (total: 100 pts)
| Q | Type | Max | Question | Reference Answer | Scoring Criteria |
|---|---|---|---|---|---|
| q1 | reasoning | 43 | Based on the sample conditions (Cu(II)Aβ(1-42) at pH 9.0), what is the expected coordination geometry and how many histidine residues are coordinated to the Cu(II) center? | Based on the sample conditions of the Cu(II)Aβ(1-42) complex prepared at pH 9.0, the expected coordination geometry is a 5-coordinate square pyramidal structure with 2 histidine residues bound to the Cu(II) center. This specific coordination state arises because the alkaline pH of 9.0 alters the peptide's binding environment, driving the formation of a 100% 5-coordinate complex. EXAFS fitting confirms this structural shift by showing an average coordination of 5 with O/N primary backscatterers and multiple scattering signals corresponding to exactly 2 histidine residues. Consequently, the sample exists entirely as a Cu(II)Aβ(1-42) 5-coordinate (2 His) complex. | Full points for identifying a 5-coordinate (square pyramidal) geometry with 2 coordinated histidine residues. |
| q2 | spectral | 57 | Describe the key spectral feature in the Cu K-edge near-edge spectrum that distinguishes the Cu(II) coordination at pH 9.0 from that at pH 6.1, and explain its electronic origin. | The key distinguishing spectral feature in the Cu K-edge near-edge spectrum is a 1s → 4p LMCT shakedown transition at 8983.6 eV, which is significantly less intense at pH 9.0 compared to pH 6.1. The electronic origin of this feature is a ligand-to-metal charge transfer (LMCT) shakedown transition. This spectral difference arises directly from the sample conditions at pH 9.0, which drive the Cu(II)Aβ(1-42) complex to adopt a 5-coordinate square pyramidal geometry with 2 histidine residues, rather than the 4-coordinate square planar geometry seen at lower pH. The increased coordination number and altered geometry at this alkaline pH modify the electronic structure, resulting in the observed reduction in the shakedown transition intensity. | Full points for mentioning the peak at 8983.6 eV, identifying it as a 1s → 4p LMCT shakedown transition, and noting that it is less intense at pH 9.0 than at pH 6.1 (indicating a shift from 4-coordinate square planar to 5-coordinate square pyramidal). |
Review
#571
Cu(II)/Cu(I) Aβ(1-42) mixture
Cu K
▶
LLM Prompt
Sample Information
Material: Cu(II)/Cu(I) Aβ(1-42) mixture
Method: solution mixing and X-ray irradiation
Precursors: Aβ(1-42), CuCl2, MOPS buffer, glycerol
Duration Hours: 0.767
Post Treatment: X-ray irradiation for 46 min
Sample-Specific Conditions
- X-ray exposure time: 46 min
- Cu(II)Aβ(1-42) in MOPS buffer with 10% glycerol after 46 min of X-ray exposure showing photoreduction
Preparation
- 1.0 mM Aβ(1-42) and 0.9 mM CuCl2 in 20 mM MOPS at pH 7.45 with 10% glycerol. Exposed to X-ray beam for 46 min.
Measurement
We plan to measure the Cu K XANES spectrum of this sample.
Questions
Based on all the information above:
1. What candidate reference spectra are needed to model the Cu K-edge XANES spectrum of this sample using linear combination fitting?
2. Based on the sample conditions (46 min X-ray exposure in MOPS buffer with 10% glycerol), estimate the phase fractions of the Cu species present.
Ground Truth
Material: Cu(II)/Cu(I) Aβ(1-42) mixture
Measurement: Cu K-edge XAS in fluorescence mode at SSRL beamline 7-3
Fit method: Linear combination fitting (LCF) of time series spectra
Phase fractions: (±10%)
| Phase | Fraction |
|---|---|
| Cu(I)Aβ(1-42) | 0.2 |
| Cu(II)Aβ(1-42) | 0.8 |
Fit basis (paper's reference spectra):
- initial unreduced Cu(II)Aβ(1-42) spectrum
- final photoreduced Cu(I)Aβ(1-42) spectrum
Source evidence: Page 6, Section 2.1, text: 'we estimate this to result in approximately 20% Cu(I) by the end of the EXAFS in the initial 46 min sweep in MOPS buffer with 10% glycerol.' and Figure 1A.
Key reasoning: X-ray beam exposure induces photoreduction of the higher oxidation state Cu(II) to a lower oxidation state Cu(I). In MOPS buffer with 10% glycerol, this process occurs relatively fast, leading to an estimated 20% conversion to Cu(I) by the end of a single 46-minute sweep. This transformation is evidenced by the loss of the Cu(II) 1s -> 3d pre-edge peak at 8979.4 eV and the appearance of the Cu(I) 1s -> 4p transition at ~8983 eV.
Reasoning source: Page 6, Section 2.1 (Photoreduction of Cu(II)Aβ)
Scoring Rubric (total: 100 pts)
| Q | Type | Max | Question | Reference Answer | Scoring Criteria |
|---|---|---|---|---|---|
| q1 | identification | 50 | What candidate reference spectra are needed to model the Cu K-edge XANES spectrum of this sample using linear combination fitting? | To model the Cu K-edge XANES spectrum of this sample using linear combination fitting, the required reference spectra are the initial unreduced Cu(II)Aβ(1-42) spectrum and the final photoreduced Cu(I)Aβ(1-42) spectrum. These specific references are needed because the sample preparation involves exposing a Cu(II)Aβ(1-42) solution in MOPS buffer with 10% glycerol to an X-ray beam for 46 minutes. The X-ray irradiation induces a relatively fast photoreduction process, converting the higher oxidation state Cu(II) into the lower oxidation state Cu(I). Spectroscopically, this transformation is characterized by the loss of the Cu(II) 1s -> 3d pre-edge peak at 8979.4 eV and the emergence of the Cu(I) 1s -> 4p transition at ~8983 eV, necessitating both end-member spectra to accurately fit the resulting mixture. | Full points for identifying the need for an initial unreduced Cu(II)Aβ(1-42) spectrum and a fully photoreduced Cu(I)Aβ(1-42) spectrum as end members. |
| q2 | quantification | 50 | Based on the sample conditions (46 min X-ray exposure in MOPS buffer with 10% glycerol), estimate the phase fractions of the Cu species present. | Based on the sample conditions, the estimated phase fractions are 20% Cu(I)Aβ(1-42) and 80% Cu(II)Aβ(1-42), with an uncertainty of 10%. These specific fractions result from the 46-minute X-ray beam exposure of the initial Cu(II)Aβ(1-42) solution prepared in 20 mM MOPS buffer at pH 7.45 with 10% glycerol. Under these specific buffer and cryoprotectant conditions, the X-ray irradiation induces a relatively fast photoreduction of the higher oxidation state Cu(II) to the lower oxidation state Cu(I). Consequently, by the end of the single 46-minute sweep, this continuous photoreduction mechanism yields a mixture containing approximately 20% of the newly formed Cu(I) state and 80% of the remaining unreduced Cu(II) state. | Full points for estimating ~20% Cu(I) and ~80% Cu(II). Partial points for identifying a mixture with Cu(II) as the majority species but with significant Cu(I) formation. |
Review
Nickel-rich Nickel Manganese Cobalt (NMC622) Cathode Lithiation Mechanism and Extended Cycling Effects Using Operando X-ray Absorption Spectroscopy
BNL-NSLS-II-8-ID
Electrochemistry
Killian R. Tallman et al.
DOI: 10.1021/acs.jpcc.0c08095
10 scenarios
▶
#572
LiNi0.6Mn0.2Co0.2O2
Ni K-edge
▶
LLM Prompt
Sample Information
Material: LiNi0.6Mn0.2Co0.2O2
Electrode Type: cathode
Electrolyte: 1.0 M LiPF6 with 70/30 (v/v) DMC/EC
Cell Type: in-situ cell
Charge Discharge: OCV
State Of Charge: x = 1.0
Cycle Number: 0
Sample-Specific Conditions
- Cycling state: Pristine
- Pristine uncycled cathode material
Measurement
We plan to measure the Ni K-edge XANES spectrum of this sample.
Questions
Based on all the information above:
1. Based on the pristine state of the LiNi0.6Mn0.2Co0.2O2 (NMC622) cathode, what are the expected oxidation states of Ni present in the material, and what are their approximate fractions?
2. Explain the chemical reasoning for the specific mixture of Ni oxidation states found in the pristine uncycled NMC622 cathode material.
Ground Truth
Material: LiNi0.6Mn0.2Co0.2O2
Measurement: Ni K-edge, transmission mode, NSLS-II beamline 8-ID
Fit method: Calculated from Co/Mn LCF results and stoichiometry/capacity
Phase fractions: (±10%)
| Phase | Fraction |
|---|---|
| Ni2+ | 0.33 |
| Ni3+ | 0.67 |
Fit basis (paper's reference spectra):
- Calculated indirectly; no direct Ni LCF standards listed
Source evidence: Page 12, text: 'pristine material contains Ni2.7+... agrees well with previous reports that exhibit a Ni2+:Ni3+ ratio of 1:2'
Key reasoning: Prior to electrochemical cycling, the pristine NMC622 material exhibits an average Ni valence of +2.7 (or +2.67). This is consistent with the stoichiometric requirements of LiNi0.6Mn0.2Co0.2O2, where Co is 3+ and Mn is 4+, necessitating a mixture of Ni2+ and Ni3+ to balance the charge. Specifically, this results in a 1:2 ratio of Ni2+ to Ni3+.
Reasoning source: Page 12, RESULTS AND DISCUSSION
Scoring Rubric (total: 100 pts)
| Q | Type | Max | Question | Reference Answer | Scoring Criteria |
|---|---|---|---|---|---|
| q1 | quantification | 50 | Based on the pristine state of the LiNi0.6Mn0.2Co0.2O2 (NMC622) cathode, what are the expected oxidation states of Ni present in the material, and what are their approximate fractions? | The expected oxidation states of Ni in the pristine LiNi0.6Mn0.2Co0.2O2 (NMC622) cathode are Ni2+ and Ni3+, with approximate fractions of 0.33 (33%) and 0.67 (67%), respectively. These specific fractions arise because the uncycled material at a state of charge of x = 1.0 requires an average Ni valence of +2.67 to maintain charge neutrality. Given the stoichiometric requirements of the NMC622 composition, where Co is present as Co3+ and Mn as Mn4+, the remaining charge must be balanced by the nickel ions. Consequently, this necessitates a 1:2 ratio of Ni2+ to Ni3+ in the pristine state. | Full points for identifying both Ni2+ and Ni3+ and stating their fractions are approximately 33% (or 1/3) and 67% (or 2/3), respectively (a 1:2 ratio). |
| q2 | reasoning | 50 | Explain the chemical reasoning for the specific mixture of Ni oxidation states found in the pristine uncycled NMC622 cathode material. | In the pristine, uncycled LiNi0.6Mn0.2Co0.2O2 cathode material at a state of charge of x = 1.0, the nickel exists as a mixture of 33% Ni2+ and 67% Ni3+. This specific 1:2 ratio is dictated by the stoichiometric and charge balance requirements of the NMC622 crystal structure. In this composition, the oxidation states of the other transition metals are fixed, with cobalt as Co3+ and manganese as Mn4+. To balance the overall charge of the compound alongside the lithium and oxygen ions, the average valence of the nickel must be +2.7 (or +2.67). Therefore, the material naturally forms a mixture of Ni2+ and Ni3+ to satisfy this electrochemical requirement prior to any cycling. | Full points for explaining that charge balance in the stoichiometric LiNi0.6Mn0.2Co0.2O2 compound, given the presence of Co3+ and Mn4+, requires an average Ni valence of +2.67, which manifests as a 1:2 ratio of Ni2+ to Ni3+. |
Review
#573
LiNi0.6Mn0.2Co0.2O2
Co K-edge
▶
LLM Prompt
Sample Information
Material: LiNi0.6Mn0.2Co0.2O2
Electrode Type: cathode
Electrolyte: 1.0 M LiPF6 with 70/30 (v/v) DMC/EC
Cell Type: in-situ cell
Charge Discharge: OCV
State Of Charge: x = 1.0
Cycle Number: 0
Sample-Specific Conditions
- Cycling state: Pristine
- Pristine uncycled cathode material
Measurement
We plan to measure the Co K-edge XANES spectrum of this sample.
Questions
Based on all the information above:
1. When analyzing the Co K-edge XANES spectra of NMC622 during cycling via Linear Combination Fitting (LCF), what specific reference standards would be appropriate to capture the Co valence states, including the pristine state?
2. Based on the pristine, uncycled state of the LiNi0.6Mn0.2Co0.2O2 cathode, what is the expected oxidation state of Co, and how does this fit into the overall charge balance of the transition metals in the material?
3. What is the specific Co K-edge energy reported for this pristine NMC622 material?
Ground Truth
Material: LiNi0.6Mn0.2Co0.2O2
Measurement: Operando XAS, Co K-edge, transmission mode, NSLS-II beamline 8-ID
Fit method: Linear combination fitting (LCF)
Phase fractions: (±10%)
| Phase | Fraction |
|---|---|
| Co3+ | 1.0 |
Fit basis (paper's reference spectra):
- LiCoO2
- delithiated LiCoO2
Source evidence: Page 11 (edge energy) and Page 12 (valence state)
Key reasoning: XAS measurements collected prior to electrochemical cycling indicate that the pristine material contains Co3.0+. This is consistent with the expected stoichiometry of LiNi0.6Mn0.2Co0.2O2, where Co is in the 3+ state to balance the charge alongside Ni2.7+ and Mn4.0+.
Reasoning source: Page 12, RESULTS AND DISCUSSION - Fresh Cell Operando XANES
Scoring Rubric (total: 100 pts)
| Q | Type | Max | Question | Reference Answer | Scoring Criteria |
|---|---|---|---|---|---|
| q1 | identification | 30 | When analyzing the Co K-edge XANES spectra of NMC622 during cycling via Linear Combination Fitting (LCF), what specific reference standards would be appropriate to capture the Co valence states, including the pristine state? | The appropriate reference standards for Linear Combination Fitting (LCF) of this material are LiCoO2 and delithiated LiCoO2. These specific phases are expected because the sample is a pristine, uncycled LiNi0.6Mn0.2Co0.2O2 cathode resting at open circuit voltage (Cycle 0). Under these initial conditions, the material contains a fraction of 1.0 Co3+ to balance the charge alongside Ni2.7+ and Mn4.0+ in the expected stoichiometry. Consequently, LiCoO2 accurately represents the pristine Co3+ state, while delithiated LiCoO2 is necessary to model any structural or electronic changes that would occur upon future electrochemical cycling. | Full points for identifying LiCoO2 (for Co3+) and a delithiated LiCoO2 standard (for higher Co valence). |
| q2 | reasoning | 40 | Based on the pristine, uncycled state of the LiNi0.6Mn0.2Co0.2O2 cathode, what is the expected oxidation state of Co, and how does this fit into the overall charge balance of the transition metals in the material? | The expected oxidation state of Co in this pristine material is Co3+, representing a fraction of 1.0. This specific valence state arises directly from the sample conditions, as it is an uncycled LiNi0.6Mn0.2Co0.2O2 cathode resting at open circuit voltage (Cycle 0). Prior to any electrochemical cycling, the stoichiometry of the layered oxide requires Co to be in the 3.0+ state to maintain overall charge neutrality. This Co3+ state perfectly balances the charge alongside the other transition metals present in the pristine material, specifically Ni2.7+ and Mn4.0+. | Full points for stating Co is 3.0+ (or 100% Co3+) and explaining that it exists alongside Ni2.7+ and Mn4.0+ in the pristine material. |
| q3 | spectral | 30 | What is the specific Co K-edge energy reported for this pristine NMC622 material? | The specific Co K-edge energy reported for this pristine NMC622 material is 7721.2 eV. This spectral feature is produced because the sample is an uncycled LiNi0.6Mn0.2Co0.2O2 cathode resting at open circuit voltage (Cycle 0). Under these pristine conditions, the material's stoichiometry dictates that Co exists entirely in the Co3+ oxidation state to balance the charge alongside Ni2.7+ and Mn4.0+. Therefore, the edge position at 7721.2 eV serves as the characteristic distinguishing feature corresponding directly to the electronic structure of the Co3+ state in the layered oxide prior to any electrochemical cycling. | Full points for identifying the edge energy as 7721.2 eV. |
Review
#574
LiNi0.6Mn0.2Co0.2O2
Mn K-edge
▶
LLM Prompt
Sample Information
Material: LiNi0.6Mn0.2Co0.2O2
Electrode Type: cathode
Electrolyte: 1.0 M LiPF6 with 70/30 (v/v) DMC/EC
Cell Type: in-situ cell
Charge Discharge: OCV
State Of Charge: x = 1.0
Cycle Number: 0
Sample-Specific Conditions
- Cycling state: Pristine
- Pristine uncycled cathode material
Measurement
We plan to measure the Mn K-edge XANES spectrum of this sample.
Questions
Based on all the information above:
1. What reference spectra (standards) are appropriate to use as a basis for determining the Mn valence in this pristine NMC622 sample via linear combination fitting?
2. What is the expected oxidation state of Mn in the pristine uncycled LiNi0.6Mn0.2Co0.2O2 cathode, and what is its expected electrochemical activity during standard cycling (3.0-4.3 V)?
3. What is the expected Mn K-edge energy for this pristine material, and how would you expect this edge position to behave during subsequent charge/discharge cycling?
Ground Truth
Material: LiNi0.6Mn0.2Co0.2O2 (NMC622)
Measurement: Mn K-edge, transmission mode, NSLS-II beamline 8-ID
Fit method: Linear combination fitting (LCF)
Phase fractions: (±10%)
| Phase | Fraction |
|---|---|
| Mn4+ | 1.0 |
Fit basis (paper's reference spectra):
- Mn3O4
- MnO2
Source evidence: Page 11 (edge energy), Page 12 (valence states), Figure 4
Key reasoning: In pristine NMC622, Mn exists entirely as Mn4+. Mn acts as a structural stabilizer and is electrochemically inactive within the standard operating voltage window (3.0-4.3 V). Therefore, it remains as Mn4+ throughout the entire first cycle and extended cycling, showing no significant edge shift.
Reasoning source: Page 12, Results and Discussion (Fresh Cell Operando XANES)
Scoring Rubric (total: 100 pts)
| Q | Type | Max | Question | Reference Answer | Scoring Criteria |
|---|---|---|---|---|---|
| q1 | identification | 20 | What reference spectra (standards) are appropriate to use as a basis for determining the Mn valence in this pristine NMC622 sample via linear combination fitting? | The appropriate reference spectra to use as a basis for linear combination fitting are Mn3O4 and MnO2. These standards are selected because the sample is a pristine, uncycled LiNi0.6Mn0.2Co0.2O2 (NMC622) cathode at OCV (x=1.0). Under these specific pristine conditions, Mn acts purely as a structural stabilizer and exists entirely in the Mn4+ oxidation state. Using MnO2 (Mn4+) alongside Mn3O4 allows for the accurate confirmation of a 1.0 fraction of Mn4+ while ruling out the presence of lower oxidation states. | Full credit for identifying MnO2 (Mn4+) and Mn3O4 (mixed Mn2+/Mn3+) as the appropriate reference standards for the Mn K-edge. |
| q2 | reasoning | 40 | What is the expected oxidation state of Mn in the pristine uncycled LiNi0.6Mn0.2Co0.2O2 cathode, and what is its expected electrochemical activity during standard cycling (3.0-4.3 V)? | The expected oxidation state of Mn in the pristine uncycled LiNi0.6Mn0.2Co0.2O2 cathode is entirely Mn4+, representing a fraction of 1.0. This occurs because, in this pristine state at OCV (x=1.0), Mn functions strictly as a structural stabilizer for the cathode material. Due to this specific structural role, Mn is electrochemically inactive within the standard operating voltage window of 3.0-4.3 V. Therefore, it does not participate in redox reactions and remains as Mn4+ throughout the entire first cycle and any extended cycling. | Full credit for stating the oxidation state is Mn4+ and explaining that Mn is electrochemically inactive in this voltage window, acting primarily as a structural stabilizer. |
| q3 | spectral | 40 | What is the expected Mn K-edge energy for this pristine material, and how would you expect this edge position to behave during subsequent charge/discharge cycling? | The expected Mn K-edge energy for this pristine material is 6551.8 eV, exhibiting a pre-edge feature and a strong white line. This specific edge position arises because the sample is an uncycled LiNi0.6Mn0.2Co0.2O2 cathode at OCV, where Mn exists entirely in the characteristic Mn4+ oxidation state. Because Mn acts solely as an electrochemically inactive structural stabilizer within the standard 3.0-4.3 V window, the edge position will not shift significantly during subsequent charge/discharge cycling. However, the spectral shape will undergo minor variations during cycling, which indicates local structural changes in the second coordination shell. | Full credit for identifying the edge energy at approximately 6551.8 eV and noting that the edge position will not shift significantly during cycling due to Mn's electrochemical inactivity, though minor shape changes may occur. |
Review
#575
LiNi0.6Mn0.2Co0.2O2
Ni K-edge
▶
LLM Prompt
Sample Information
Material: LiNi0.6Mn0.2Co0.2O2
Electrode Type: cathode
Electrolyte: 1.0 M LiPF6 with 70/30 (v/v) DMC/EC
Cell Type: in-situ cell
Charge Discharge: charged
C Rate: C/5
Voltage V: 4.3
State Of Charge: x = 0.28
Cycle Number: 1
Capacity Mah G: 199
Sample-Specific Conditions
- Cycling state: Fresh cell, charged
- First cycle charge to 4.3 V
Measurement
We plan to measure the Ni K-edge XANES spectrum of this sample.
Questions
Based on all the information above:
1. Estimate the average oxidation state and corresponding phase fractions of Ni in the LiNi0.6Mn0.2Co0.2O2 cathode when charged to 4.3 V (x = 0.28) during the first cycle.
2. Explain the physical reasoning for the specific Ni oxidation state reached at 4.3 V, and why it does not reach a fully 4+ state.
3. Describe the relative redox contributions of Ni, Co, and Mn during this charge process that result in the final Ni valence.
Ground Truth
Material: LiNi0.6Mn0.2Co0.2O2
Measurement: Operando Ni K-edge XANES in transmission mode at NSLS-II beamline 8-ID
Fit method: Calculated from experimentally measured capacity and Co/Mn LCF results
Phase fractions: (±10%)
| Phase | Fraction |
|---|---|
| Ni3+ | 0.3 |
| Ni4+ | 0.7 |
Fit basis (paper's reference spectra):
- LiCoO2
- Mn3O4
- MnO2
- delithiated LiCoO2
Source evidence: Figure 4 and text on Page 12
Key reasoning: During the first charge to 4.3 V, Li is extracted to reach Li0.28NMC. To compensate for the charge, Ni is continuously oxidized, reaching an average valence of Ni3.7+ (corresponding to a 30/70 mix of Ni3+ and Ni4+). Ni does not reach fully Ni4+ due to the upper voltage cutoff of 4.3 V. Co also oxidizes to Co3.5+ at higher voltages, while Mn remains electrochemically inactive at Mn4+.
Reasoning source: Page 12, Fresh Cell Operando XANES section
Scoring Rubric (total: 100 pts)
| Q | Type | Max | Question | Reference Answer | Scoring Criteria |
|---|---|---|---|---|---|
| q1 | quantification | 30 | Estimate the average oxidation state and corresponding phase fractions of Ni in the LiNi0.6Mn0.2Co0.2O2 cathode when charged to 4.3 V (x = 0.28) during the first cycle. | At a charge voltage of 4.3 V, the Ni in the LiNi0.6Mn0.2Co0.2O2 cathode reaches an average oxidation state of Ni3.7+, corresponding to phase fractions of 0.3 (30%) Ni3+ and 0.7 (70%) Ni4+. These specific values result from the extraction of lithium during the first cycle charge to reach a state of charge of x = 0.28 (Li0.28NMC). To compensate for this extraction of positively charged lithium ions, the nickel is continuously oxidized. However, because the upper voltage cutoff is limited to 4.3 V, the oxidation process is halted before nickel can reach a fully Ni4+ state, yielding the observed 30/70 mixture. | Full points for identifying an average Ni valence of ~3.7+ or fractions of 30% Ni3+ and 70% Ni4+. |
| q2 | reasoning | 35 | Explain the physical reasoning for the specific Ni oxidation state reached at 4.3 V, and why it does not reach a fully 4+ state. | During the first cycle charge of the fresh LiNi0.6Mn0.2Co0.2O2 cell, lithium is extracted from the cathode structure until it reaches Li0.28NMC at 4.3 V. To maintain charge neutrality during this delithiation process, the nickel ions undergo continuous oxidation. This charge compensation mechanism drives the average nickel valence to Ni3.7+, consisting of 30% Ni3+ and 70% Ni4+. The nickel fails to reach a fully 4+ oxidation state strictly because the applied upper voltage cutoff of 4.3 V limits further lithium extraction and subsequent transition metal oxidation. | Full points for explaining that Ni is continuously oxidized during delithiation but is limited by the upper voltage cutoff of 4.3 V, preventing complete oxidation to Ni4+. |
| q3 | reasoning | 35 | Describe the relative redox contributions of Ni, Co, and Mn during this charge process that result in the final Ni valence. | When the LiNi0.6Mn0.2Co0.2O2 cathode is charged to 4.3 V to reach Li0.28NMC, the required charge compensation is distributed among the transition metals. Nickel is continuously oxidized throughout the charge, ultimately reaching an average valence of Ni3.7+ (a 0.3/0.7 ratio of Ni3+ to Ni4+). At higher voltages within this 4.3 V window, cobalt also actively contributes to the redox process by oxidizing to Co3.5+. In contrast, manganese remains electrochemically inactive and stays at a constant Mn4+ state. The combination of the 4.3 V upper voltage cutoff and cobalt sharing the redox burden at higher voltages explains why nickel oxidation is capped at Ni3.7+ rather than reaching a fully Ni4+ state. | Full points for stating that Ni is the primary redox center, Co contributes at higher voltages (reaching Co3.5+), and Mn remains electrochemically inactive (Mn4+). |
Review
#576
LiNi0.6Mn0.2Co0.2O2
Co K-edge
▶
LLM Prompt
Sample Information
Material: LiNi0.6Mn0.2Co0.2O2
Electrode Type: cathode
Electrolyte: 1.0 M LiPF6 with 70/30 (v/v) DMC/EC
Cell Type: in-situ cell
Charge Discharge: charged
C Rate: C/5
Voltage V: 4.3
State Of Charge: x = 0.28
Cycle Number: 1
Capacity Mah G: 199
Sample-Specific Conditions
- Cycling state: Fresh cell, charged
- First cycle charge to 4.3 V
Measurement
We plan to measure the Co K-edge XANES spectrum of this sample.
Questions
Based on all the information above:
1. What candidate reference spectra are appropriate for determining the Co oxidation state in this charged NMC622 sample via linear combination fitting?
2. Explain the physical reasoning for the expected Co oxidation state at the end of the 4.3 V charge. How does the electrochemical activity of Co evolve during the charging process?
Ground Truth
Material: LiNi0.6Mn0.2Co0.2O2
Measurement: Operando Co K-edge XANES in transmission mode at NSLS-II beamline 8-ID
Fit method: Linear combination fitting (LCF)
Phase fractions: (±10%)
| Phase | Fraction |
|---|---|
| Co3+ | 0.5 |
| Co4+ | 0.5 |
Fit basis (paper's reference spectra):
- LiCoO2
- delithiated LiCoO2
Source evidence: Figure 4 and text on Page 12
Key reasoning: During the first charge (delithiation), Co is not immediately oxidized, unlike Ni, as it is mostly active at higher voltages. It begins to oxidize at ~3.8 V and then continues to oxidize, eventually reaching an average valence of Co3.5+ at the upper voltage cut off of 4.3 V. This indicates that Co is mainly active under higher voltages and contributes to the capacity in this region.
Reasoning source: Page 12, Results and Discussion (Fresh Cell Operando XANES)
Scoring Rubric (total: 100 pts)
| Q | Type | Max | Question | Reference Answer | Scoring Criteria |
|---|---|---|---|---|---|
| q1 | identification | 29 | What candidate reference spectra are appropriate for determining the Co oxidation state in this charged NMC622 sample via linear combination fitting? | The appropriate candidate reference spectra for linear combination fitting of this sample are LiCoO2 (representing Co3+) and delithiated LiCoO2 (representing Co4+). These specific references are required because the sample is a fresh LiNi0.6Mn0.2Co0.2O2 cathode that has been charged to 4.3 V during its first cycle. During this initial delithiation process, Co is not immediately oxidized but becomes electrochemically active at higher voltages, starting around 3.8 V. By the time the cell reaches the 4.3 V cutoff, the cobalt has partially oxidized to an average valence of Co3.5+, necessitating both Co3+ and Co4+ reference spectra to accurately capture this mixed oxidation state. | Full credit for identifying a Co3+ reference (such as LiCoO2) and a higher valence Co reference (such as delithiated LiCoO2 or a Co4+ standard). |
| q3 | reasoning | 71 | Explain the physical reasoning for the expected Co oxidation state at the end of the 4.3 V charge. How does the electrochemical activity of Co evolve during the charging process? | At the end of the first charge to 4.3 V, the expected Co oxidation state is a mixed Co3.5+, corresponding to a 50% Co3+ and 50% Co4+ fraction. This specific state arises because, during the initial stages of delithiation in the fresh LiNi0.6Mn0.2Co0.2O2 cell, cobalt is not immediately oxidized, unlike nickel. Instead, the electrochemical activity of Co is concentrated at higher voltages, with oxidation only beginning at approximately 3.8 V. As the charge continues to the 4.3 V upper cutoff, Co continues to oxidize and actively contributes to the cell's capacity in this higher voltage region, ultimately resulting in the observed average valence of Co3.5+. | Full credit for explaining that Co is mostly inactive at lower potentials, begins to oxidize at higher voltages (around 3.8 V), and continues oxidizing until the 4.3 V cutoff, reaching an intermediate valence state (Co3.5+) rather than fully oxidizing to Co4+. |
Review
#577
LiNi0.6Mn0.2Co0.2O2
Ni K-edge
▶
LLM Prompt
Sample Information
Material: LiNi0.6Mn0.2Co0.2O2
Electrode Type: cathode
Electrolyte: 1.0 M LiPF6 with 70/30 (v/v) DMC/EC
Cell Type: in-situ cell
Charge Discharge: discharged
C Rate: C/5
Voltage V: 3.0
State Of Charge: x = 0.90
Cycle Number: 1
Capacity Mah G: 170
Sample-Specific Conditions
- Cycling state: Fresh cell, discharged
- First cycle discharge to 3.0 V
Measurement
We plan to measure the Ni K-edge XANES spectrum of this sample.
Questions
Based on all the information above:
1. Why does the Ni valence at the end of the first discharge (3.0 V) not return to its pristine state value?
Ground Truth
Material: LiNi0.6Mn0.2Co0.2O2
Measurement: Operando XAS, Ni K-edge, transmission mode, NSLS-II beamline 8-ID
Fit method: Calculated from Co and Mn LCF results and experimentally measured capacity
Phase fractions: (±10%)
| Phase | Fraction |
|---|---|
| Ni2+ | 0.1 |
| Ni3+ | 0.9 |
Fit basis (paper's reference spectra):
- Calculated indirectly; no direct Ni LCF standards listed
Source evidence: Figure 4 and Page 12
Key reasoning: During the first discharge (lithiation), incoming Li-ions reduce the Ni centers. Ni reduces from its highly oxidized state (Ni3.7+) down to Ni2.9+ at the end of the first discharge (3.0 V). It does not return to its pristine state (Ni2.67+) due to irreversible capacity loss during the first cycle, ending at a lithium content of x=0.90.
Reasoning source: Results and Discussion - Fresh Cell Operando XANES (Page 12) and discussion on irreversible capacity loss (Page 21)
Scoring Rubric (total: 100 pts)
| Q | Type | Max | Question | Reference Answer | Scoring Criteria |
|---|---|---|---|---|---|
| q2 | reasoning | 100 | Why does the Ni valence at the end of the first discharge (3.0 V) not return to its pristine state value? | At the end of the first discharge to 3.0 V at a C/5 rate, the Ni valence in the LiNi0.6Mn0.2Co0.2O2 cathode does not return to its pristine state (Ni2.67+) due to irreversible capacity loss. During this initial lithiation process, incoming Li-ions reduce the Ni centers from their highly oxidized charged state (Ni3.7+) down to an average valence of Ni2.9+. Because of the irreversible capacity loss in the fresh cell, the lithium content only reaches x=0.90 rather than fully relithiating. Consequently, this incomplete lithiation leaves the nickel at a higher oxidation state than the pristine material, specifically resulting in a final composition of 10% Ni2+ and 90% Ni3+. | Explains that irreversible capacity loss (ending at x=0.90 instead of x=1.0) prevents full reduction back to the pristine state (Ni2.67+). |
Review
#578
LiNi0.6Mn0.2Co0.2O2
Ni K-edge
▶
LLM Prompt
Sample Information
Material: LiNi0.6Mn0.2Co0.2O2
Electrode Type: cathode
Electrolyte: 1.0 M LiPF6 with 70/30 (v/v) DMC/EC
Cell Type: in-situ cell
Charge Discharge: charged
C Rate: C/5
Voltage V: 4.3
State Of Charge: x = 0.27
Cycle Number: 5
Capacity Mah G: 163
Sample-Specific Conditions
- Cycling state: Formation cell, charged
- Charge to 4.3 V after 4 formation cycles
Measurement
We plan to measure the Ni K-edge XANES spectrum of this sample.
Questions
Based on all the information above:
1. Based on the provided sample conditions (charged to 4.3 V, x=0.27), what are the expected oxidation states of Ni and their approximate fractions?
2. Explain the physical reasoning for the expected Ni oxidation state at the end of charge (4.3 V) in the formation cell.
3. In the context of the charge process to 4.3 V, how does the expected electrochemical activity of Ni compare to that of Co and Mn in this material?
Ground Truth
Material: LiNi0.6Mn0.2Co0.2O2
Measurement: operando Ni K-edge XANES in transmission mode at NSLS-II beamline 8-ID
Fit method: calculated from capacity and Co/Mn LCF
Phase fractions: (±10%)
| Phase | Fraction |
|---|---|
| Ni3+ | 0.2 |
| Ni4+ | 0.8 |
Fit basis (paper's reference spectra):
- Calculated indirectly; no direct Ni LCF standards listed
Source evidence: Page 22, 'Formation Cell & Cycled Cell Operando XANES' section, Figure 8a
Key reasoning: During the charge of the formation cell to 4.3 V, Ni is the most electrochemically active transition metal, while Co is less active and Mn is inactive. The Ni valence reaches approximately 3.8+ at the end of charge, corresponding to a mixture of Ni3+ and Ni4+ states. This oxidation is driven by the extraction of lithium ions (reaching x = 0.27) to compensate for the charge.
Reasoning source: Page 22, 'Formation Cell & Cycled Cell Operando XANES' section
Scoring Rubric (total: 100 pts)
| Q | Type | Max | Question | Reference Answer | Scoring Criteria |
|---|---|---|---|---|---|
| q1 | quantification | 40 | Based on the provided sample conditions (charged to 4.3 V, x=0.27), what are the expected oxidation states of Ni and their approximate fractions? | The expected oxidation states of Ni are Ni3+ and Ni4+, with approximate fractions of 0.2 (20%) and 0.8 (80%), respectively. These specific fractions arise because charging the LiNi0.6Mn0.2Co0.2O2 cathode to 4.3 V results in the extraction of lithium ions down to a state of charge of x = 0.27. To compensate for this charge extraction, the transition metals must oxidize to maintain neutrality. Since Ni is the most electrochemically active transition metal in this system, its average valence increases to approximately 3.8+ at the end of the charge, which corresponds directly to this 20% Ni3+ and 80% Ni4+ mixture. | Correctly identifies Ni3+ and Ni4+ as the primary states, with fractions of approximately 0.2 and 0.8, respectively (or an average valence of ~3.8+). |
| q2 | reasoning | 40 | Explain the physical reasoning for the expected Ni oxidation state at the end of charge (4.3 V) in the formation cell. | At the end of the charge to 4.3 V in the formation cell, the average Ni oxidation state reaches approximately 3.8+, consisting of a mixture of Ni3+ (0.2 fraction) and Ni4+ (0.8 fraction). This oxidation state is physically driven by the extraction of lithium ions from the LiNi0.6Mn0.2Co0.2O2 cathode, reaching a final lithium content of x = 0.27. As lithium is removed, the transition metals must oxidize to maintain charge neutrality. Because Ni is the most electrochemically active transition metal in this material compared to Co and Mn, it undergoes the primary oxidation process to compensate for the extracted lithium, resulting in the highly oxidized Ni3+/Ni4+ state. | Mentions that Ni undergoes oxidation to compensate for the extraction of lithium ions (down to x=0.27) during the charge process. |
| q3 | reasoning | 20 | In the context of the charge process to 4.3 V, how does the expected electrochemical activity of Ni compare to that of Co and Mn in this material? | During the charge process of the LiNi0.6Mn0.2Co0.2O2 cathode to 4.3 V, Ni is the most electrochemically active transition metal. In comparison, Co is less electrochemically active, and Mn remains completely inactive. This difference in activity dictates the charge compensation mechanism as lithium ions are extracted down to x = 0.27. Because Mn is inactive and Co is only weakly active, the burden of charge compensation falls primarily on Ni, forcing it to undergo significant oxidation to reach an average valence of approximately 3.8+ (comprising 20% Ni3+ and 80% Ni4+) to balance the removal of lithium. | Correctly states that Ni is the most electrochemically active transition metal, while Co is less active and Mn is electrochemically inactive. |
Review
#579
LiNi0.6Mn0.2Co0.2O2
Mn K-edge
▶
LLM Prompt
Sample Information
Material: LiNi0.6Mn0.2Co0.2O2
Electrode Type: cathode
Electrolyte: 1.0 M LiPF6 with 70/30 (v/v) DMC/EC
Cell Type: in-situ cell
Charge Discharge: charged
C Rate: C/5
Voltage V: 4.3
State Of Charge: x = 0.27
Cycle Number: 5
Capacity Mah G: 163
Sample-Specific Conditions
- Cycling state: Formation cell, charged
- Charge to 4.3 V after 4 formation cycles
Measurement
We plan to measure the Mn K-edge XANES spectrum of this sample.
Questions
Based on all the information above:
1. What candidate reference spectra should be used as the basis for linear combination fitting (LCF) to determine the Mn valence in this NMC622 sample?
2. Estimate the phase fractions of the Mn oxidation states for this NMC622 cathode charged to 4.3 V after 4 formation cycles.
3. Explain the physical reasoning behind the observed Mn oxidation state distribution at the end of charge (4.3 V) in the formation cell.
Ground Truth
Material: LiNi0.6Mn0.2Co0.2O2
Measurement: Operando Mn K-edge XANES in transmission mode at NSLS-II beamline 8-ID
Fit method: Linear combination fitting (LCF)
Phase fractions: (±10%)
| Phase | Fraction |
|---|---|
| Mn3+ | 0.1 |
| Mn4+ | 0.9 |
Fit basis (paper's reference spectra):
- Mn3O4
- MnO2
Source evidence: Page 22, text and Figure 8a
Key reasoning: Mn is electrochemically inactive in this voltage window (3.0-4.3 V), remaining predominantly Mn4+ throughout cycling. After formation cycling, the Mn valence appears to slightly reduce to Mn3.9+ (corresponding to a 10% Mn3+ / 90% Mn4+ mixture). However, this minor variation is considered within the ~0.1 valence state error margin of the LCF calculations, confirming that Mn does not actively participate in the redox process.
Reasoning source: Page 22, 'Formation Cell & Cycled Cell Operando XANES' section
Scoring Rubric (total: 100 pts)
| Q | Type | Max | Question | Reference Answer | Scoring Criteria |
|---|---|---|---|---|---|
| q1 | identification | 20 | What candidate reference spectra should be used as the basis for linear combination fitting (LCF) to determine the Mn valence in this NMC622 sample? | The candidate reference spectra for linear combination fitting (LCF) of this NMC622 sample are Mn3O4 (for Mn3+) and MnO2 (for Mn4+). These specific phases are expected because manganese is electrochemically inactive within the applied 3.0-4.3 V voltage window of the formation cell. As a result, the manganese remains predominantly in the Mn4+ state throughout the charging process. The inclusion of the Mn3O4 reference accounts for a slight apparent reduction to Mn3.9+ observed after 4 formation cycles, though this minor 10% variation falls within the ~0.1 valence state error margin of the fitting. | Full credit for identifying Mn3O4 and MnO2 as the reference standards for Mn valence determination. |
| q2 | quantification | 40 | Estimate the phase fractions of the Mn oxidation states for this NMC622 cathode charged to 4.3 V after 4 formation cycles. | The estimated phase fractions for the Mn oxidation states in this NMC622 cathode are 0.9 (90%) Mn4+ and 0.1 (10%) Mn3+. These specific values arise because manganese does not actively participate in the redox process within the 3.0-4.3 V operating window of the formation cell. Therefore, despite being charged to 4.3 V after 4 formation cycles, the Mn remains predominantly in its original Mn4+ state. The 10% Mn3+ fraction reflects a slight apparent reduction to an average valence of Mn3.9+, which is considered to be within the 10% error margin of the LCF calculations rather than true electrochemical activity. | Full credit for estimating approximately 90% Mn4+ and 10% Mn3+ (or an average valence of ~3.9+). Partial credit if the estimate is within the 10% uncertainty margin (e.g., stating 100% Mn4+ due to the error margin). |
| q3 | reasoning | 40 | Explain the physical reasoning behind the observed Mn oxidation state distribution at the end of charge (4.3 V) in the formation cell. | The observed Mn oxidation state distribution of 90% Mn4+ and 10% Mn3+ at the end of the 4.3 V charge is due to the electrochemical inactivity of manganese in this specific system. Within the 3.0-4.3 V voltage window used during the formation cycles, manganese does not actively participate in the redox process. Consequently, the transition metal retains its predominantly Mn4+ character throughout the cycling. The minor presence of 10% Mn3+ (an average valence of Mn3.9+) is not attributed to a physical redox mechanism, but is instead considered to be within the ~0.1 valence state error margin of the LCF calculations. | Full credit for explaining that Mn is electrochemically inactive in the 3.0-4.3 V window, remaining predominantly Mn4+, and that any slight deviation (like a shift to 3.9+) is within the LCF error margin (~0.1 valence state). |
Review
#580
LiNi0.6Mn0.2Co0.2O2
Ni K-edge
▶
LLM Prompt
Sample Information
Material: LiNi0.6Mn0.2Co0.2O2
Electrode Type: cathode
Electrolyte: 1.0 M LiPF6 with 70/30 (v/v) DMC/EC
Cell Type: in-situ cell
Charge Discharge: discharged
C Rate: C/5
Voltage V: 3.0
State Of Charge: x = 0.63
Cycle Number: 101
Capacity Mah G: 117
Sample-Specific Conditions
- Cycling state: Cycled cell, discharged
- Discharge to 3.0 V after 100 cycles post-formation
Measurement
We plan to measure the Ni K-edge XANES spectrum of this sample.
Questions
Based on all the information above:
1. Based on the sample conditions (NMC622 discharged to 3.0 V after 100 cycles), identify the expected Ni oxidation states and estimate their phase fractions.
2. Explain the physical reasoning for why the Ni redox couple is depressed and fails to fully reduce to its pristine state (~Ni2.9+) at the end of discharge in the cycled cell.
3. If one were to perform Linear Combination Fitting (LCF) on the Ni K-edge for this specific discharged cycled sample, what candidate reference spectra (oxidation states) would be required to capture the phase composition?
Ground Truth
Material: LiNi0.6Mn0.2Co0.2O2 (NMC622)
Measurement: Operando Ni K-edge XANES in transmission mode at NSLS-II beamline 8-ID
Fit method: Calculated from Co and Mn LCF results and experimentally measured capacity
Phase fractions: (±10%)
| Phase | Fraction |
|---|---|
| Ni3+ | 0.5 |
| Ni4+ | 0.5 |
Fit basis (paper's reference spectra):
- Ni3+ reference state
- Ni4+ reference state
Source evidence: Page 21, Figure 8b and text: 'the redox couple has been depressed to approximately Ni3.7+/Ni3.5+'
Key reasoning: After 100 cycles, the delivered capacity is significantly diminished and the Ni redox couple is depressed to approximately Ni3.7+/Ni3.5+. This limited redox activity is caused by structural degradation, irreversible phase changes, CEI buildup, and increased impedance. The resulting increased polarization causes the cell to reach its lower voltage limit (3.0 V) before Ni can be fully reduced to its initial state (~Ni2.9+), leaving it at an average valence of Ni3.5+ (approximately 50% Ni3+ and 50% Ni4+) at the end of discharge.
Reasoning source: Results and Discussion: Formation Cell & Cycled Cell Comparison (Pages 24-26)
Scoring Rubric (total: 100 pts)
| Q | Type | Max | Question | Reference Answer | Scoring Criteria |
|---|---|---|---|---|---|
| q1 | quantification | 30 | Based on the sample conditions (NMC622 discharged to 3.0 V after 100 cycles), identify the expected Ni oxidation states and estimate their phase fractions. | The expected Ni oxidation states for this NMC622 sample are Ni3+ and Ni4+, with estimated phase fractions of 0.5 (50%) for Ni3+ and 0.5 (50%) for Ni4+. These specific fractions result from the sample being discharged to 3.0 V at a C/5 rate after 100 cycles, which yields a diminished capacity of 117 mAh/g and an average Ni valence of approximately Ni3.5+. This incomplete reduction occurs because structural degradation, irreversible phase changes, CEI buildup, and increased impedance over the 100 cycles cause increased cell polarization. Consequently, the cell hits the 3.0 V lower voltage limit before the Ni can fully reduce to its initial pristine state (~Ni2.9+), leaving an equal mix of Ni3+ and Ni4+. | Correctly identifies that Ni is in a mixed 3+/4+ state with an average valence of ~3.5+, corresponding to approximately 50% Ni3+ and 50% Ni4+. |
| q2 | reasoning | 40 | Explain the physical reasoning for why the Ni redox couple is depressed and fails to fully reduce to its pristine state (~Ni2.9+) at the end of discharge in the cycled cell. | In the cycled NMC622 cell, the Ni redox couple is depressed to approximately Ni3.7+/Ni3.5+ and fails to fully reduce to its pristine state (~Ni2.9+) at the end of discharge to 3.0 V. This limited redox activity is driven by structural degradation, irreversible phase changes, and cathode electrolyte interphase (CEI) buildup that occur over the 100 cycles. These degradation mechanisms lead to increased impedance and higher polarization within the cell. As a result of this polarization, the cell prematurely reaches its lower voltage cut-off of 3.0 V during discharge, terminating the process at a diminished capacity of 117 mAh/g before the Ni can be fully reduced. This leaves the sample at a state of charge of x=0.63 with an average Ni valence of Ni3.5+, corresponding to a 50/50 mix of Ni3+ and Ni4+. | Must mention that extended cycling causes structural degradation, CEI buildup, and increased impedance/polarization, which causes the cell to hit the 3.0 V lower voltage limit before the Ni centers can be fully reduced. |
| q3 | identification | 30 | If one were to perform Linear Combination Fitting (LCF) on the Ni K-edge for this specific discharged cycled sample, what candidate reference spectra (oxidation states) would be required to capture the phase composition? | To perform Linear Combination Fitting (LCF) on the Ni K-edge for this sample, the required candidate reference spectra are a Ni3+ reference state and a Ni4+ reference state. These specific references are necessary because, after 100 cycles, the NMC622 cathode suffers from structural degradation, CEI buildup, and increased impedance. This degradation causes increased cell polarization, meaning the cell reaches its 3.0 V discharge limit prematurely and delivers a diminished capacity of 117 mAh/g. Because the cell cannot fully discharge to its initial state (~Ni2.9+), the Ni redox couple is depressed, leaving the discharged sample at an average valence of Ni3.5+. Therefore, a combination of Ni3+ and Ni4+ references is required to accurately model this mixed oxidation state. | Correctly identifies that reference spectra for Ni3+ and Ni4+ are required, as the material does not reach the Ni2+ state due to the depressed redox couple. |
Review
#581
LiNi0.6Mn0.2Co0.2O2
Co K-edge
▶
LLM Prompt
Sample Information
Material: LiNi0.6Mn0.2Co0.2O2
Electrode Type: cathode
Electrolyte: 1.0 M LiPF6 with 70/30 (v/v) DMC/EC
Cell Type: in-situ cell
Charge Discharge: discharged
C Rate: C/5
Voltage V: 3.0
State Of Charge: x = 0.63
Cycle Number: 101
Capacity Mah G: 117
Sample-Specific Conditions
- Cycling state: Cycled cell, discharged
- Discharge to 3.0 V after 100 cycles post-formation
Measurement
We plan to measure the Co K-edge XANES spectrum of this sample.
Questions
Based on all the information above:
1. Based on the sample conditions (NMC622 cathode, discharged to 3.0 V after 100 cycles), what are the expected Co oxidation states, and what reference spectra would be appropriate for linear combination fitting of the Co K-edge XANES?
2. Estimate the phase fractions of the Co species in this cycled and discharged NMC622 cathode. Explain your estimation based on the expected electrochemical behavior of the Co redox couple after extended cycling.
3. What physical degradation mechanisms account for the restricted Co redox activity and the inability to fully reduce Co to 3+ at the end of discharge in the 101st cycle?
Ground Truth
Material: LiNi0.6Mn0.2Co0.2O2
Measurement: operando Co K-edge XANES in transmission mode at NSLS-II beamline 8-ID
Fit method: linear combination fitting (LCF)
Phase fractions: (±10%)
| Phase | Fraction |
|---|---|
| Co3+ | 0.7 |
| Co4+ | 0.3 |
Fit basis (paper's reference spectra):
- LiCoO2
- delithiated LiCoO2
Source evidence: Figure 8b and text on page 23
Key reasoning: After 100 cycles, the cycled cell exhibits a depression in electrochemical activity for Co, with the redox couple restricted to approximately Co3.5+/Co3.3+. This lack of activity and inability to reach lower valence on discharge is due to structural degradation, irreversible phase changes, and CEI buildup that increase polarization and internal resistance. Consequently, the operating voltage limits are reached prior to the full onset of Co reduction, leaving a significant fraction of Co in an oxidized state (Co4+) even at the end of discharge (3.0 V).
Reasoning source: Results and Discussion - Formation Cell & Cycled Cell Comparison (pages 23, 26-28)
Scoring Rubric (total: 100 pts)
| Q | Type | Max | Question | Reference Answer | Scoring Criteria |
|---|---|---|---|---|---|
| q1 | identification | 30 | Based on the sample conditions (NMC622 cathode, discharged to 3.0 V after 100 cycles), what are the expected Co oxidation states, and what reference spectra would be appropriate for linear combination fitting of the Co K-edge XANES? | The expected Co oxidation states in this sample are Co3+ and Co4+, and the appropriate reference spectra for linear combination fitting (LCF) are LiCoO2 and delithiated LiCoO2, respectively. These specific phases are expected because, after 100 cycles, the NMC622 cathode experiences structural degradation, irreversible phase changes, and cathode electrolyte interphase (CEI) buildup. This degradation increases internal resistance and polarization, restricting the Co redox couple to approximately Co3.5+/Co3.3+ and preventing full reduction to Co3+ even when the cell is discharged to 3.0 V. | 15 points for identifying Co3+ and Co4+ (or oxidized Co species) as the expected states. 15 points for suggesting LiCoO2 (for Co3+) and a delithiated LiCoO2 or equivalent Co4+ reference as standards. |
| q2 | quantification | 40 | Estimate the phase fractions of the Co species in this cycled and discharged NMC622 cathode. Explain your estimation based on the expected electrochemical behavior of the Co redox couple after extended cycling. | The estimated phase fractions for the Co species in this discharged NMC622 cathode are 70% Co3+ and 30% Co4+, with an uncertainty of 10%. These specific values result from the extended cycling conditions (101 cycles), which cause a severe depression in the electrochemical activity of Co. Due to increased polarization and internal resistance from structural degradation and CEI buildup, the cell reaches its 3.0 V discharge limit before the full onset of Co reduction. Consequently, the redox couple is restricted to approximately Co3.5+/Co3.3+, leaving a significant 30% fraction of Co trapped in the oxidized Co4+ state despite being fully discharged. | 20 points for estimating approximately 70% Co3+ and 30% Co4+ (or an average valence of ~3.3+). 20 points for explaining that extended cycling causes a depression in electrochemical activity (restricting the redox couple to ~Co3.5+/Co3.3+) preventing full reduction to Co3+ at the 3.0 V discharge cutoff. |
| q3 | reasoning | 30 | What physical degradation mechanisms account for the restricted Co redox activity and the inability to fully reduce Co to 3+ at the end of discharge in the 101st cycle? | The restricted Co redox activity and inability to fully reduce Co to 3+ at the end of discharge (3.0 V) are caused by structural degradation, irreversible phase changes, and the buildup of the cathode electrolyte interphase (CEI). After 100 cycles, these degradation mechanisms significantly increase the internal resistance and polarization of the NMC622 cathode. Because of this increased polarization, the cell reaches its lower operating voltage limit of 3.0 V prior to the full onset of Co reduction. As a result, the Co redox couple is restricted to approximately Co3.5+/Co3.3+, leaving a substantial 30% fraction of Co trapped in the oxidized Co4+ state rather than returning entirely to Co3+. | 10 points for mentioning structural degradation or irreversible phase changes. 10 points for mentioning CEI (cathode-electrolyte interphase) buildup. 10 points for connecting these factors to increased polarization/internal resistance, which causes the voltage limit to be reached before full reduction occurs. |
Review
Reduction and Agglomeration of Supported Metal Clusters Induced by High-Flux X-ray Absorption Spectroscopy Measurements
BNL-NSLS-II-8-ID
Catalyst
Malik Albrahim et al.
DOI: 10.1021/acs.jpcc.1c01823
3 scenarios
▶
#582
Rh/Al2O3
Rh K
▶
LLM Prompt
Sample Information
Material: Rh/Al2O3
Support: gamma-Al2O3
Reaction Conditions: 20% H2 (balance He), room temperature, 6 min exposure to 4x10^12 photons/s/mm2 X-ray flux
Sample-Specific Conditions
- X-ray flux density and exposure time: 4x10^12 photons/s/mm2, 6 min
- Calcined Rh/Al2O3 catalyst exposed to high-flux X-ray beam in H2 at room temperature
Measurement
We plan to measure the Rh K XANES spectrum of this sample.
Questions
Based on all the information above:
1. What candidate reference spectra are needed to model the Rh K-edge XANES of this sample using linear combination fitting?
2. Estimate the phase fractions of the Rh species present in this sample after 6 minutes of exposure to the high-flux X-ray beam.
3. Explain the physical mechanism by which the high-flux X-ray beam induces changes in the Rh oxidation state at room temperature under these conditions.
Ground Truth
Material: Rh/Al2O3
Measurement: Rh K-edge in-situ fluorescence XAS at NSLS-II BL 08-ID
Fit method: Linear combination fit
Phase fractions:
| Phase | Fraction |
|---|---|
| Rh metal | 0.29 |
| Rh oxide | 0.71 |
Fit basis (paper's reference spectra):
- Rh foil (Rh metal)
- calcined catalyst (Rh oxide)
Source evidence: Page 16, Section 3.2, Figure 2b
Key reasoning: The high flux density X-ray beam (4x10^12 photons/s/mm2) induces partial reduction of the highly dispersed RhOx supported on Al2O3 even at room temperature under H2. This is evidenced by the decrease in white line intensity and formation of isosbestic points at 23,255 and 23,285 eV. The reduction is likely caused by secondary electrons generated by the X-rays, which activate oxygen bound to RhOx, allowing it to react with H2.
Reasoning source: Page 16, Section 3.2 and Page 24, Section 3.5
Scoring Rubric (total: 101 pts)
| Q | Type | Max | Question | Reference Answer | Scoring Criteria |
|---|---|---|---|---|---|
| q1 | identification | 25 | What candidate reference spectra are needed to model the Rh K-edge XANES of this sample using linear combination fitting? | To model the Rh K-edge XANES spectrum of this sample using linear combination fitting, the required reference spectra are Rh foil (Rh metal) and the calcined catalyst (Rh oxide). These specific reference phases are needed because the initial calcined Rh/Al2O3 catalyst consists of highly dispersed RhOx. When exposed to the high-flux X-ray beam (4x10^12 photons/s/mm2) in a 20% H2 environment at room temperature, the sample undergoes partial reduction. This reduction is driven by X-ray-generated secondary electrons that activate the oxygen bound to RhOx, allowing it to react with H2 and form a mixture of metallic Rh and unreduced Rh oxide. | Full points for identifying Rh metal (or foil) and Rh oxide (or calcined catalyst) as the necessary reference spectra. |
| q2 | quantification | 38 | Estimate the phase fractions of the Rh species present in this sample after 6 minutes of exposure to the high-flux X-ray beam. | After 6 minutes of exposure to the high-flux X-ray beam, the estimated phase fractions are 0.29 (29%) Rh metal and 0.71 (71%) Rh oxide. These specific values result from the partial reduction of the highly dispersed RhOx supported on Al2O3 under the 20% H2 atmosphere at room temperature. Despite the low temperature, the high X-ray flux density (4x10^12 photons/s/mm2) generates secondary electrons that activate the oxygen bound to the Rh oxide. This activation allows the oxygen to react with the H2 gas, leading to a 29% conversion to metallic Rh while 71% remains as the original Rh oxide. | Full points for estimating ~29% Rh metal and ~71% Rh oxide. Partial credit for identifying that partial reduction occurs but with inaccurate percentages. |
| q3 | reasoning | 38 | Explain the physical mechanism by which the high-flux X-ray beam induces changes in the Rh oxidation state at room temperature under these conditions. | Under a 20% H2 atmosphere at room temperature, the high-flux X-ray beam (4x10^12 photons/s/mm2) induces a partial reduction of the highly dispersed RhOx on the Al2O3 support. The physical mechanism is driven by secondary electrons generated by the intense X-ray irradiation. These secondary electrons activate the oxygen atoms bound to the RhOx species. Once activated, the oxygen readily reacts with the surrounding H2 gas even at room temperature, resulting in the partial reduction of the catalyst to metallic Rh. Spectroscopically, this mechanism is evidenced by a decrease in the white line intensity and the formation of isosbestic points at 23,255 and 23,285 eV. | Full points for explaining that secondary electrons generated by the X-ray beam activate oxygen bound to RhOx, which then reacts with the H2 atmosphere to partially reduce the Rh. |
Review
#583
Ni/beta zeolite
Rh K
▶
LLM Prompt
Sample Information
Material: Ni/beta zeolite
Support: zeolite beta (Si/Al = 19)
Reaction Conditions: in-situ reduction, exposed to 1.1x10^11 photons/s/mm2 X-ray flux
Sample-Specific Conditions
- Beam exposure during reduction: Exposed
- Ni/beta zeolite catalyst reduced in-situ while exposed to intermediate-flux X-ray beam
Measurement
We plan to measure the Rh K XANES spectrum of this sample.
Questions
Based on all the information above:
1. Based on the provided conditions (in-situ reduction with exposure to an intermediate-flux X-ray beam), what are the expected primary phases and their approximate fractions in the Ni/beta zeolite catalyst?
2. What reference spectra would be required to perform a linear combination fit (LCF) analysis of the XANES spectrum for this sample to determine the extent of reduction?
3. Explain the physical reasoning for why exposure to the X-ray beam during in-situ reduction leads to the observed phase composition, compared to a sample reduced under the same conditions but without beam exposure.
Ground Truth
Material: Ni/beta zeolite
Measurement: Ni K-edge in-situ XANES at SSRL BL 9-3
Fit method: Linear combination fitting (LCF)
Phase fractions:
| Phase | Fraction |
|---|---|
| metallic_nickel | 0.96 |
| oxidized_nickel | 0.04 |
Fit basis (paper's reference spectra):
- metallic Ni reference (implied)
- oxidized Ni reference (implied)
Source evidence: Page 23, text referencing Figure S8
Key reasoning: Exposure to the intermediate flux density X-ray beam (1.1 x 10^11 photons/s/mm2) during in-situ reduction causes significant beam-induced reduction and agglomeration. This results in a much higher extent of reduction (~96%) and formation of Ni nanoparticles compared to the portion of the sample not exposed to the beam (~57%). The beam-induced reduction is likely driven by secondary electrons generated by the X-rays, which facilitate the reduction process in the H2 atmosphere.
Reasoning source: Page 23, Section 3.5 and Page 24
Scoring Rubric (total: 100 pts)
| Q | Type | Max | Question | Reference Answer | Scoring Criteria |
|---|---|---|---|---|---|
| q1 | quantification | 40 | Based on the provided conditions (in-situ reduction with exposure to an intermediate-flux X-ray beam), what are the expected primary phases and their approximate fractions in the Ni/beta zeolite catalyst? | The expected primary phases in the Ni/beta zeolite catalyst are metallic nickel and oxidized nickel, with approximate fractions of 0.96 (96%) and 0.04 (4%), respectively. These specific values result from the sample's exposure to the intermediate-flux X-ray beam (1.1 x 10^11 photons/s/mm2) during the in-situ reduction process. The X-rays generate secondary electrons that actively facilitate the reduction process in the H2 atmosphere, driving significant beam-induced reduction and agglomeration. Consequently, this beam exposure leads to a much higher extent of reduction (~96%) and the formation of metallic Ni nanoparticles compared to the ~57% reduction seen in unexposed samples. | Full score for identifying metallic Ni as the dominant phase (~96%) and a minor oxidized Ni component (~4%). Deduct points for significantly different fractions (e.g., predicting ~57% reduction, which corresponds to the unexposed sample). |
| q2 | identification | 20 | What reference spectra would be required to perform a linear combination fit (LCF) analysis of the XANES spectrum for this sample to determine the extent of reduction? | To perform a linear combination fit (LCF) analysis on this sample, reference spectra for metallic Ni and oxidized Ni are required. These specific references are necessary because the Ni/beta zeolite catalyst undergoes an in-situ reduction process that yields a mixture of these two chemical states. The presence of these phases is directly dictated by the sample's exposure to the intermediate-flux X-ray beam (1.1 x 10^11 photons/s/mm2) during reduction. The X-ray beam generates secondary electrons that drive a beam-induced reduction mechanism in the H2 atmosphere, converting the oxidized nickel into a predominantly metallic phase (~96%) while leaving a small oxidized fraction (~4%). | Full score for mentioning a metallic Ni reference (e.g., Ni foil or Ni nanoparticles) and an oxidized Ni reference (e.g., NiO or the initial calcined Ni/beta zeolite). |
| q3 | reasoning | 40 | Explain the physical reasoning for why exposure to the X-ray beam during in-situ reduction leads to the observed phase composition, compared to a sample reduced under the same conditions but without beam exposure. | Exposure to the intermediate-flux X-ray beam (1.1 x 10^11 photons/s/mm2) during in-situ reduction generates secondary electrons within the Ni/beta zeolite sample. These secondary electrons actively facilitate the reduction process in the H2 atmosphere, driving a mechanism of significant beam-induced reduction and agglomeration. As a result of this mechanism, the exposed sample achieves a much higher extent of reduction, forming ~96% metallic Ni nanoparticles and leaving only ~4% oxidized Ni. In contrast, a portion of the sample reduced under the exact same conditions but without beam exposure lacks these secondary electrons, resulting in a significantly lower extent of reduction of approximately 57%. | Full score for explaining that the X-ray beam induces additional reduction (beam damage/effect), likely through the generation of secondary electrons that activate species and facilitate reduction by H2, leading to a much higher extent of reduction (~96%) than thermal reduction alone (~57%). |
Review
#584
Ni/beta zeolite
Rh K
▶
LLM Prompt
Sample Information
Material: Ni/beta zeolite
Support: zeolite beta (Si/Al = 19)
Reaction Conditions: in-situ reduction, not exposed to beam
Sample-Specific Conditions
- Beam exposure during reduction: Not exposed
- Ni/beta zeolite catalyst reduced in-situ without exposure to X-ray beam
Measurement
We plan to measure the Rh K XANES spectrum of this sample.
Questions
Based on all the information above:
1. Based on the described reaction conditions (in-situ reduction without X-ray beam exposure), what are the expected chemical phases of nickel present in the catalyst, and what are their approximate phase fractions?
2. Explain the physical reasoning for why this sample, which was not exposed to the X-ray beam during reduction, exhibits a significantly different phase composition compared to a sample reduced under the exact same thermal and gas conditions but exposed to the beam.
3. What candidate reference spectra should be included in the basis set to perform a Linear Combination Fitting (LCF) analysis of this sample's XANES spectrum?
Ground Truth
Material: Ni/beta zeolite
Measurement: Ni K-edge in-situ XANES at SSRL BL 9-3
Fit method: Linear combination fitting (LCF)
Phase fractions:
| Phase | Fraction |
|---|---|
| metallic_nickel | 0.57 |
| unreduced_nickel | 0.43 |
Fit basis (paper's reference spectra):
- metallic Ni (Ni nanoparticles)
- unreduced Ni species (implied Ni2+)
Source evidence: Page 23, text referencing Figure S8
Key reasoning: In-situ reduction of the Ni/beta zeolite catalyst without exposure to the X-ray beam results in partial reduction (~57%). This avoids the beam-induced reduction and agglomeration caused by the intermediate flux density X-rays, which otherwise artificially increases the extent of reduction to ~96% through secondary electron generation.
Reasoning source: Page 23, Section 3.5
Scoring Rubric (total: 100 pts)
| Q | Type | Max | Question | Reference Answer | Scoring Criteria |
|---|---|---|---|---|---|
| q1 | quantification | 40 | Based on the described reaction conditions (in-situ reduction without X-ray beam exposure), what are the expected chemical phases of nickel present in the catalyst, and what are their approximate phase fractions? | The expected chemical phases of nickel in the catalyst are metallic Ni (Ni nanoparticles) and unreduced Ni species (implied Ni2+). The approximate phase fractions are 57% metallic nickel and 43% unreduced nickel. These specific fractions arise because the sample was reduced in-situ without exposure to the X-ray beam, which leads to only a partial thermal reduction. By avoiding beam exposure during the reduction process, the sample escapes beam-induced reduction and agglomeration caused by secondary electron generation, which would otherwise artificially inflate the metallic fraction to approximately 96%. | Full credit for identifying metallic nickel (~57%) and unreduced nickel/nickel oxide (~43%). Partial credit if the phases are identified correctly but the fractions are inaccurate. |
| q2 | reasoning | 40 | Explain the physical reasoning for why this sample, which was not exposed to the X-ray beam during reduction, exhibits a significantly different phase composition compared to a sample reduced under the exact same thermal and gas conditions but exposed to the beam. | The sample not exposed to the X-ray beam during in-situ reduction exhibits a partial reduction consisting of 57% metallic Ni and 43% unreduced Ni. In contrast, exposure to intermediate flux density X-rays during reduction artificially increases the extent of reduction to approximately 96%. This significant difference occurs because the X-ray beam generates secondary electrons within the Ni/beta zeolite sample. These secondary electrons drive a beam-induced reduction and agglomeration mechanism that alters the true thermal phase composition. Therefore, keeping the sample unexposed to the beam preserves its intrinsic, partially reduced state. | Full credit for explaining that avoiding the beam prevents beam-induced reduction (often driven by secondary electrons), which artificially inflates the extent of reduction (e.g., from ~57% to ~96%). |
| q3 | identification | 20 | What candidate reference spectra should be included in the basis set to perform a Linear Combination Fitting (LCF) analysis of this sample's XANES spectrum? | The candidate reference spectra for the Linear Combination Fitting (LCF) analysis should include metallic Ni (representing Ni nanoparticles) and unreduced Ni species (implied Ni2+). These specific reference phases are required because the in-situ reduction conditions applied to the Ni/beta zeolite catalyst result in a partially reduced state. Since the sample was not exposed to the X-ray beam during reduction, it avoids beam-induced secondary electron generation that would otherwise artificially reduce the catalyst to ~96% metal. Consequently, the sample retains a true thermal mixture of 57% metallic nickel and 43% unreduced nickel, necessitating both metallic and unreduced references to accurately fit the XANES spectrum. | Full credit for identifying the need for a metallic Ni reference (e.g., Ni foil or Ni nanoparticles) and an unreduced Ni reference (e.g., NiO or Ni2+ in zeolite). |
Review
Oxygen K-Edge X-ray Absorption Spectra of ThO2and CeO2: Experiment, Interpretation, and Structural Effects
BNL-NSLS-II-8-ID
Pure Phase
Lucia Amidani et al.
DOI: 10.1021/acs.jpcc.2c07771
2 scenarios
▶
#585
Thorium dioxide (ThO2)
O K
▶
LLM Prompt
Sample Information
Material: Thorium dioxide (ThO2)
Crystal Structure: fluorite
Oxidation State: Th4+
Sample Form: powder
Measurement Mode: transmission (STXM)
- Bulk thorium dioxide synthesized via oxalic conversion route and calcined at 600 °C
Measurement
We plan to measure the O K XANES spectrum of this sample.
Questions
Based on all the information above:
1. Describe the expected spectral shape of the O K-edge XANES for bulk ThO2 and assign the physical origin (orbital hybridization) of its three main peaks.
2. How does the relative energy ordering of the 5f and 6d states in ThO2 uniquely affect its O K-edge spectrum compared to other actinide dioxides?
Ground Truth
Compound: ThO2
Oxidation state: Th4+
Measurement: O K-edge transmission (STXM)
Edge position: not reported
Spectral shape: Characterized by three prominent features, with an additional weak feature riding on the low-energy side of the second prominent peak. The first peak is extremely sharp and intense; the middle peak is weaker and more structured; and the third is intense and broad.
Labeled peaks:
| Label | Energy (eV) | Intensity | Origin | Source |
|---|---|---|---|---|
| first peak | not reported | extremely sharp and intense | O p hybridized with Th 6d eg (bonding character) | text/figure_1 |
| middle peak | not reported | weaker and more structured with a low-energy small feature | O p hybridized with Th 5f (predominant antibonding interaction) | text/figure_1 |
| third peak | not reported | intense and broad | O p hybridized with Th 6d t2g (antibonding character) | text/figure_1 |
Distinguishing features: The 5f band is found at higher energy than the 6d band, making ThO2 the only actinide dioxide with 5f orbitals higher than 6d, which places the 5f peak in the middle rather than at the absorption edge. The spectrum is highly sensitive to structural modifications: a 1% lattice expansion causes the first and middle peaks to get closer in energy (first peak decreases in intensity, middle peak sharpens), while size reduction to a 2.1 nm nanoparticle causes the loss of the first sharp peak due to broken symmetry at the surface.
Key reasoning: The O K-edge spectrum reflects the hybridization of O p orbitals with Th 6d and 5f orbitals. The Th 5f band is broader than the Ce 4f band due to larger radial extent, allowing participation in chemical bonds. Uniquely for ThO2 among actinide dioxides, the 5f states are slightly higher in energy than the 6d states, placing the 5f contribution (middle peak) between the 6d eg (first peak) and 6d t2g (third peak) states.
Reasoning source: RESULTS AND DISCUSSION section
Scoring Rubric (total: 100 pts)
| Q | Type | Max | Question | Reference Answer | Scoring Criteria |
|---|---|---|---|---|---|
| q1 | spectral | 57 | Describe the expected spectral shape of the O K-edge XANES for bulk ThO2 and assign the physical origin (orbital hybridization) of its three main peaks. | The O K-edge XANES spectrum for the bulk ThO2 powder calcined at 600 °C is characterized by three prominent features, with an additional weak feature on the low-energy side of the second peak. The first peak is extremely sharp and intense, originating from O p orbitals hybridized with Th 6d eg states of bonding character. The middle peak is weaker and more structured, arising from O p hybridization with Th 5f states, while the third intense and broad peak corresponds to O p hybridized with Th 6d t2g states. These specific spectral features arise because the highly crystalline bulk fluorite structure of the Th4+ sample dictates the specific crystal field splitting and hybridization of the O p orbitals with the broader Th 5f and 6d orbitals. | Full points require identifying the three prominent peaks (sharp first peak, weaker/structured middle peak, broad third peak) and correctly assigning their origins to O p hybridization with Th 6d eg, Th 5f, and Th 6d t2g orbitals, respectively. |
| q2 | reasoning | 43 | How does the relative energy ordering of the 5f and 6d states in ThO2 uniquely affect its O K-edge spectrum compared to other actinide dioxides? | In bulk ThO2, the Th 5f states are uniquely located at a slightly higher energy than the Th 6d states, which distinguishes it from all other actinide dioxides. Because of this specific electronic configuration in the Th4+ fluorite lattice, the 5f peak does not appear at the absorption edge. Instead, the O p-Th 5f hybridized contribution forms the middle peak of the O K-edge spectrum, positioned directly between the 6d eg (first peak) and 6d t2g (third peak) states. This distinct spectral ordering arises directly from the intrinsic electronic properties of the bulk ThO2 powder synthesized at 600 °C, where the larger radial extent of the Th 5f orbitals allows them to participate in chemical bonds while sitting higher in energy than the 6d band. | Full points require explaining that ThO2 is unique among actinide dioxides because its 5f states are higher in energy than its 6d states, which places the 5f spectral contribution (the middle peak) between the 6d eg and 6d t2g peaks, rather than at the absorption edge. |
Review
#586
Cerium dioxide (CeO2)
O K
▶
LLM Prompt
Sample Information
Material: Cerium dioxide (CeO2)
Crystal Structure: fluorite
Oxidation State: Ce4+
Sample Form: sintered pellet
Measurement Mode: TEY and NIXS
- Bulk cerium dioxide reference
Measurement
We plan to measure the O K XANES spectrum of this sample.
Questions
Based on all the information above:
1. Describe the expected spectral shape and the relative intensities of the main peaks in the O K-edge XANES spectrum of bulk CeO2.
2. Explain the electronic origins of the three main peaks in the CeO2 O K-edge spectrum in terms of orbital hybridization.
Ground Truth
Compound: CeO2
Oxidation state: Ce4+
Measurement: O K-edge, TEY (ALS beamline 7.0.1) and NIXS (ESRF ID20)
Edge position: not reported
Spectral shape: Characterized by two sharp peaks and a broader third one.
Labeled peaks:
| Label | Energy (eV) | Intensity | Origin | Source |
|---|---|---|---|---|
| first peak | not reported | sharp | O p hybridized with Ce 4f (antibonding interaction) | paper_data |
| second peak | not reported | sharp | O p hybridized with Ce 5d eg | paper_data |
| third peak | not reported | broader | O p hybridized with Ce 5d t2g (antibonding interaction) | paper_data |
Distinguishing features: The 4f band appears below the 5d band, resulting in the first peak being the f-state contribution, unlike ThO2 where the f-state is the middle peak.
Key reasoning: The O K-edge spectrum of CeO2 reflects the hybridization of O p orbitals with Ce 5d and 4f orbitals. Because the Ce 4f orbitals are lower in energy than the 5d orbitals, the 4f contribution forms the first sharp peak. This is followed by the 5d eg and 5d t2g peaks, which correspond to the second sharp peak and the third broader peak, respectively.
Reasoning source: RESULTS AND DISCUSSION section
Scoring Rubric (total: 100 pts)
| Q | Type | Max | Question | Reference Answer | Scoring Criteria |
|---|---|---|---|---|---|
| q1 | spectral | 43 | Describe the expected spectral shape and the relative intensities of the main peaks in the O K-edge XANES spectrum of bulk CeO2. | The O K-edge XANES spectrum of the bulk CeO2 sintered pellet is characterized by two sharp initial peaks followed by a broader third peak. This specific spectral shape arises directly from the electronic structure of the Ce4+ fluorite material, where the spectrum reflects the hybridization of O p orbitals with Ce 5d and 4f orbitals. Because the Ce 4f orbitals are lower in energy than the 5d orbitals in this sample, the 4f contribution forms the first sharp peak, distinguishing it from materials like ThO2 where the f-state is the middle peak. The second sharp peak and the third broader peak then result from O p hybridization with the higher-energy Ce 5d eg and 5d t2g orbitals, respectively. | Full credit for identifying that the spectrum is characterized by two sharp peaks followed by a broader third peak. |
| q2 | reasoning | 57 | Explain the electronic origins of the three main peaks in the CeO2 O K-edge spectrum in terms of orbital hybridization. | The three main peaks in the O K-edge spectrum of the CeO2 sample originate from the hybridization of oxygen p orbitals with unoccupied cerium 4f and 5d orbitals. Given the Ce4+ oxidation state in this fluorite structure, the cerium 4f orbitals are lower in energy than the 5d orbitals, which dictates the energetic ordering of the spectral features. Consequently, the first sharp peak is formed by the antibonding interaction between O p and the lower-energy Ce 4f orbitals. The subsequent second sharp peak and third broader peak arise from O p hybridization with the higher-energy Ce 5d eg and Ce 5d t2g (antibonding) orbitals, respectively. | Full credit for correctly assigning the first peak to O p hybridized with Ce 4f, the second peak to O p hybridized with Ce 5d eg, and the third broader peak to O p hybridized with Ce 5d t2g. |
Review
Electron Radiation-Induced Nickel Nanoparticle Formation in KCl-ZnCl 2 Eutectic Molten Salt Using X-ray Absorption Spectroscopy
BNL-NSLS-II-8-ID
Synthesis
Nirmalendu Patra et al.
DOI: 10.1021/acs.jpcc.4c00622
7 scenarios
▶
#587
0.1 wt% NiCl2 in KCl-ZnCl2 eutectic salt
Ni K-edge
▶
LLM Prompt
Sample Information
Material: 0.1 wt% NiCl2 in KCl-ZnCl2 eutectic salt
Method: melt-quenching
Precursors: NiCl2, KCl, ZnCl2
Temperature C: 25
Atmosphere: Ar
Cooling Method: cooled to room temperature
Sample-Specific Conditions
- Electron dose: Unheated, 0 MGy
- As-synthesized powder mixture before heating or irradiation
Preparation
- 0.1 wt% of NiCl2 was mixed with distilled KCl-ZnCl2 eutectic salt with a 45.3 : 54.7 (mol%) ratio in the solid state, then melted at 400 °C for 2 hours to form a homogeneous mixture. The melted puck was cooled down and crushed to fine powder in Ar atmosphere before loading in capillaries.
Measurement
We plan to measure the Ni K-edge XANES spectrum of this sample.
Questions
Based on all the information above:
1. What is the expected shape of the white line region for this as-synthesized, unheated powder sample, and what coordination geometry does this indicate?
2. How does the XANES spectrum of this unheated powder distinguish itself from the sample after it is melted (0 MGy melt) without irradiation?
3. What is the dominant oxidation state of Ni in this pristine powder sample, and what reference spectrum would be most appropriate to represent the ionic state of Ni in the melted system for Linear Combination Fitting (LCF)?
Ground Truth
Material: 0.1 wt% NiCl2 in KCl-ZnCl2 eutectic salt (powder)
Measurement: Ni K-edge XAS in fluorescence mode at the 8ID-Inner Shell Spectroscopy (ISS) beamline
Fit method: None
Phase fractions: (±10%)
| Phase | Fraction |
|---|---|
| Ni2+ (octahedral coordination) | 1.0 |
Fit basis (paper's reference spectra):
- Ni foil (metallic Ni)
- 1 wt% NiCl2 in molten KCl-ZnCl2 eutectic salt (ionic Ni2+)
Source evidence: Figure 1a, Figure 1b, Page 10 lines 18-20
Key reasoning: The as-synthesized powder exhibits a double peak feature in the white line region that is similar to the pure NiCl2 standard. This indicates that the metal ion is coordinated by chloride anions in an octahedral (Oh) symmetry, representing unreduced Ni2+ prior to any heating or irradiation.
Reasoning source: RESULTS: X-ray Absorption Near Edge Structure (XANES), Page 10
Scoring Rubric (total: 101 pts)
| Q | Type | Max | Question | Reference Answer | Scoring Criteria |
|---|---|---|---|---|---|
| q1 | spectral | 38 | What is the expected shape of the white line region for this as-synthesized, unheated powder sample, and what coordination geometry does this indicate? | The expected shape of the white line region is a double peak feature, similar to a pure NiCl2 standard. This indicates an octahedral (Oh) coordination geometry. Because the sample is an unheated (25 °C) and unirradiated (0 MGy) powder mixture of NiCl2 in a KCl-ZnCl2 eutectic salt, the Ni ions remain unreduced and fully coordinated by chloride anions in their original solid-state structure. This pristine condition preserves the octahedral symmetry of the Ni2+ ions, which directly produces the observed double peak feature in the XANES spectrum. | The answer must mention the double peak feature in the white line region and state that it indicates octahedral (Oh) coordination by chloride anions. |
| q2 | spectral | 38 | How does the XANES spectrum of this unheated powder distinguish itself from the sample after it is melted (0 MGy melt) without irradiation? | The unheated powder spectrum is distinguished by a distinct double peak feature in the white line region. In contrast, when the sample is melted, this double peak disappears and transforms into a bimodal shape with a main peak at 8350 eV and a shoulder at 8347 eV. This spectral difference arises because the unheated sample (measured at 25 °C, 0 MGy) retains the original solid-state octahedral coordination of Ni2+ by chloride anions from the NiCl2 precursor. Upon melting, the structural environment of the Ni ions changes within the KCl-ZnCl2 eutectic salt, altering the coordination symmetry and consequently changing the white line from a double peak to the bimodal shape. | The answer must state that the powder has a double peak feature in the white line region, which disappears upon melting and transforms into a bimodal shape with a main peak at 8350 eV and a shoulder at 8347 eV. |
| q3 | identification | 25 | What is the dominant oxidation state of Ni in this pristine powder sample, and what reference spectrum would be most appropriate to represent the ionic state of Ni in the melted system for Linear Combination Fitting (LCF)? | The dominant oxidation state of Ni in this pristine powder sample is Ni2+ with a fraction of 1.0. For Linear Combination Fitting (LCF), the most appropriate reference spectrum to represent the ionic state of Ni in the melted system is 1 wt% NiCl2 in molten KCl-ZnCl2 eutectic salt. Because the sample is measured as an unheated (25 °C) and unirradiated (0 MGy) powder in an inert Ar atmosphere, no reduction of the NiCl2 precursor has occurred, leaving the Ni entirely in its unreduced Ni2+ state with octahedral chloride coordination. The molten reference is chosen for LCF because it accurately reflects the specific chemical environment and ionic Ni2+ state that forms once this specific eutectic salt mixture is heated to a molten state. | The answer must identify Ni2+ as the oxidation state and mention '1 wt% NiCl2 in molten KCl-ZnCl2 eutectic salt' as the reference for the ionic state in the melt. |
Review
#588
0.1 wt% NiCl2 in KCl-ZnCl2 eutectic salt
Ni K-edge
▶
LLM Prompt
Sample Information
Material: 0.1 wt% NiCl2 in KCl-ZnCl2 eutectic salt
Method: thermal treatment
Precursors: NiCl2, KCl, ZnCl2
Temperature C: 400
Duration Hours: 2.5
Atmosphere: Ar (sealed under vacuum)
Cooling Method: cooled to room temperature for measurement
Sample-Specific Conditions
- Electron dose: 0 MGy
- Sample heated to 400 °C without electron irradiation
Preparation
- 0.1 wt% of NiCl2 was mixed with distilled KCl-ZnCl2 eutectic salt with a 45.3 : 54.7 (mol%) ratio in the solid state, then melted at 400 °C for 2 hours to form a homogeneous mixture. The melted puck was cooled down and crushed to fine powder in Ar atmosphere before loading in capillaries. Heated at 400 °C for 150 minutes without electron irradiation.
Measurement
We plan to measure the Ni K-edge XANES spectrum of this sample.
Questions
Based on all the information above:
1. What reference spectra are appropriate for modeling the Ni K-edge XANES spectrum of this sample using Linear Combination Fitting (LCF)?
2. Based on the thermal treatment at 400 °C (0 MGy electron dose), estimate the phase fractions of the resulting nickel species in the melt.
Ground Truth
Material: 0.1 wt% NiCl2 in KCl-ZnCl2 eutectic salt
Measurement: Ni K-edge XANES in fluorescence mode at the 8ID-Inner Shell Spectroscopy (ISS) beamline
Fit method: Linear Combination Fitting (LCF)
Phase fractions: (±10%)
| Phase | Fraction |
|---|---|
| metallic_nickel | 0.51 |
| Ni2+ (in KCl-ZnCl2) | 0.49 |
Fit basis (paper's reference spectra):
- Ni foil (representing metallic Ni0)
- 1 wt% NiCl2 in molten KCl-ZnCl2 eutectic salt (representing ionic Ni2+)
Source evidence: Figure 4, Figure 1b, and text on page 28 (line 14)
Key reasoning: Heating the sample to 400 °C without electron irradiation induces a significant thermal reduction of Ni2+ to metallic Ni0, resulting in a 51% metallic Ni fraction. This thermally induced reduction is hypothesized to be driven by exogenous species (organic or inorganic) reducing Zn in the matrix to Zn0 micro-aggregates, which subsequently reduce the nickel ions via a spontaneous reaction (Ni2+ + Zn(s) -> Ni(s) + Zn2+). For LCF analysis, 1 wt% NiCl2 in KCl-ZnCl2 is required as the Ni2+ reference rather than pure NiCl2 powder, because dissolved Ni2+ in the melt does not adopt the octahedral (Oh) coordination found in bulk NiCl2.
Reasoning source: DISCUSSION section, pages 28-29; RESULTS section, page 13
Scoring Rubric (total: 100 pts)
| Q | Type | Max | Question | Reference Answer | Scoring Criteria |
|---|---|---|---|---|---|
| q1 | identification | 40 | What reference spectra are appropriate for modeling the Ni K-edge XANES spectrum of this sample using Linear Combination Fitting (LCF)? | The appropriate reference spectra for Linear Combination Fitting (LCF) are Ni foil to represent metallic Ni0 and 1 wt% NiCl2 in molten KCl-ZnCl2 eutectic salt to represent ionic Ni2+. Heating the 0.1 wt% NiCl2 in KCl-ZnCl2 eutectic salt to 400 °C induces a thermal reduction process, resulting in a mixture of metallic Ni0 and unreacted Ni2+. The 1 wt% NiCl2 in KCl-ZnCl2 reference is specifically required instead of pure NiCl2 powder because the dissolved Ni2+ ions in the eutectic melt do not adopt the octahedral coordination found in bulk NiCl2. The Ni foil reference is necessary to account for the metallic Ni0 formed when exogenous species reduce Zn in the matrix to Zn0, which subsequently reduces the nickel ions. | Full points for identifying metallic Ni (or Ni foil) and a dissolved Ni2+ standard in a similar molten salt matrix (e.g., 1 wt% NiCl2 in KCl-ZnCl2). Partial points if pure NiCl2 is suggested instead of the dissolved salt standard. |
| q2 | quantification | 60 | Based on the thermal treatment at 400 °C (0 MGy electron dose), estimate the phase fractions of the resulting nickel species in the melt. | The estimated phase fractions for this sample are 51% metallic Ni0 and 49% ionic Ni2+, with an uncertainty of 10%. Even without electron irradiation (0 MGy dose), heating the sample to 400 °C for 2.5 hours induces a significant thermal reduction of the initial NiCl2 precursor. This specific 51% conversion to metallic nickel is hypothesized to be driven by exogenous organic or inorganic species in the matrix. These species reduce Zn to Zn0 micro-aggregates, which then spontaneously reduce the Ni2+ ions via the reaction Ni2+ + Zn(s) -> Ni(s) + Zn2+, leaving 49% of the nickel as unreacted Ni2+ dissolved in the eutectic salt. | Full points for estimating approximately 51% metallic Ni (Ni0) and 49% ionic Ni2+. Deduct points proportionally for estimates outside a +/- 10% range. |
Review
#589
0.1 wt% NiCl2 in KCl-ZnCl2 eutectic salt
Ni K-edge
▶
LLM Prompt
Sample Information
Material: 0.1 wt% NiCl2 in KCl-ZnCl2 eutectic salt
Method: electron irradiation
Precursors: NiCl2, KCl, ZnCl2
Temperature C: 400
Atmosphere: Ar (sealed under vacuum)
Cooling Method: cooled to room temperature for measurement
Sample-Specific Conditions
- Electron dose: 3 MGy
- Sample heated to 400 °C and irradiated with 3 MGy electron dose
Preparation
- Loaded in capillaries, evacuated and sealed. Heated to 400 °C and irradiated with a 2-MeV Van de Graaff electron accelerator to 3 MGy absorbed dose.
Measurement
We plan to measure the Ni K-edge XANES spectrum of this sample.
Questions
Based on all the information above:
1. Identify the expected Ni phases and estimate their approximate fractions for the 0.1 wt% NiCl2 in KCl-ZnCl2 sample heated to 400 °C and irradiated with a 3 MGy electron dose.
Ground Truth
Material: 0.1 wt% NiCl2 in KCl-ZnCl2 eutectic salt
Measurement: Ni K-edge, fluorescence mode, 8ID-Inner Shell Spectroscopy (ISS) beamline at NSLS-II
Fit method: Linear Combination Fitting (LCF)
Phase fractions: (±10%)
| Phase | Fraction |
|---|---|
| metallic_nickel | 0.44 |
| Ni2+ (in KCl-ZnCl2) | 0.56 |
Fit basis (paper's reference spectra):
- Ni foil (representing metallic Ni0)
- 1 wt% NiCl2 in molten KCl-ZnCl2 eutectic salt (representing dissolved ionic Ni2+)
Source evidence: Figure 4, page 16
Key reasoning: Heating the sample to 400 °C induces a significant thermal reduction of Ni2+ to Ni0 (approx 51% in the 0 MGy melt), likely driven by exogenous species reducing Zn, which subsequently reduces Ni. In the low-dose electron irradiation region (0-6 MGy), the phase composition remains a mixture of Ni2+ and metallic Ni0, with the metallic fraction averaging around 48% (specifically ~44% at 3 MGy). The radiation dose is not yet high enough to cause the dominant accumulation of metallic species seen at higher doses (>9 MGy). For LCF, 1 wt% NiCl2 in KCl-ZnCl2 is used as the Ni2+ reference instead of pure NiCl2 powder because dissolved Ni2+ in the melt does not adopt the octahedral coordination of bulk NiCl2.
Reasoning source: Page 13 (reference choice), Page 16 (Figure 4 text), and Page 29 (thermal reduction discussion)
Scoring Rubric (total: 100 pts)
| Q | Type | Max | Question | Reference Answer | Scoring Criteria |
|---|---|---|---|---|---|
| q1 | quantification | 100 | Identify the expected Ni phases and estimate their approximate fractions for the 0.1 wt% NiCl2 in KCl-ZnCl2 sample heated to 400 °C and irradiated with a 3 MGy electron dose. | The expected Ni phases for this sample are metallic Ni0 (approximately 44%) and dissolved ionic Ni2+ (approximately 56%). Heating the sample to 400 °C induces a significant thermal reduction of Ni2+ to Ni0, which is likely driven by exogenous species reducing Zn that subsequently reduces Ni. The 3 MGy electron dose falls within a low-dose irradiation regime (0-6 MGy) where the radiation is not yet high enough to cause the dominant accumulation of metallic species seen at higher doses (>9 MGy), resulting in this mixed phase composition. Additionally, the Ni2+ fraction is represented by a reference of 1 wt% NiCl2 in molten KCl-ZnCl2 rather than pure NiCl2 powder, because dissolved Ni2+ in the eutectic melt does not adopt the octahedral coordination of the bulk powder. | Full credit for identifying metallic Ni and Ni2+ with fractions around 44-48% and 52-56% respectively. Partial credit for identifying the phases without accurate fractions. |
Review
#590
0.1 wt% NiCl2 in KCl-ZnCl2 eutectic salt
Ni K-edge
▶
LLM Prompt
Sample Information
Material: 0.1 wt% NiCl2 in KCl-ZnCl2 eutectic salt
Method: electron irradiation
Precursors: NiCl2, KCl, ZnCl2
Temperature C: 400
Atmosphere: Ar (sealed under vacuum)
Cooling Method: cooled to room temperature for measurement
Sample-Specific Conditions
- Electron dose: 6 MGy
- Sample heated to 400 °C and irradiated with 6 MGy electron dose
Preparation
- Loaded in capillaries, evacuated and sealed. Heated to 400 °C and irradiated with a 2-MeV Van de Graaff electron accelerator to 6 MGy absorbed dose.
Measurement
We plan to measure the Ni K-edge XANES spectrum of this sample.
Questions
Based on all the information above:
1. What candidate reference spectra are needed to perform a Linear Combination Fitting (LCF) analysis of the Ni K-edge XANES spectrum for this irradiated molten salt sample?
2. Based on the sample conditions (400 °C, 6 MGy electron dose), estimate the phase fractions of the nickel species present in the sample.
3. Explain the physical and radiolytic mechanisms that lead to the specific phase composition at the 6 MGy dose, and why this dose represents a distinct regime compared to higher doses (e.g., >9 MGy).
Ground Truth
Material: 0.1 wt% NiCl2 in KCl-ZnCl2 eutectic salt
Measurement: Ni K-edge, fluorescence mode, 8ID-Inner Shell Spectroscopy (ISS) beamline at NSLS-II
Fit method: Linear Combination Fitting (LCF)
Phase fractions: (±10%)
| Phase | Fraction |
|---|---|
| metallic_nickel | 0.48 |
| Ni2+ (in KCl-ZnCl2) | 0.52 |
Fit basis (paper's reference spectra):
- Ni foil (representing metallic Ni0)
- 1 wt% NiCl2 in molten KCl-ZnCl2 eutectic salt (representing ionic Ni2+)
Source evidence: Figure 4 and text on page 16
Key reasoning: The sample undergoes both thermal and radiolytic reduction. Heating to 400 °C causes an initial thermal reduction (yielding ~51% Ni0 in the 0 MGy melt). Electron irradiation up to 6 MGy falls into a 'low dose' region (Region-I) where the mixture maintains an average of 48% metallic Ni0 and 52% ionic Ni2+. The radiolytic reduction is driven by solvated electrons and highly reducing transient species like Zn+ generated by the electron beam, which reduce Ni2+ to Ni0. The 6 MGy dose represents the threshold just before a sudden step-increase in reduction (to >50% Ni0) observed at 9 MGy due to the accumulation of enough electron radiation dose.
Reasoning source: Results (Figure 4, page 16) and Discussion (pages 28-31)
Scoring Rubric (total: 100 pts)
| Q | Type | Max | Question | Reference Answer | Scoring Criteria |
|---|---|---|---|---|---|
| q1 | identification | 20 | What candidate reference spectra are needed to perform a Linear Combination Fitting (LCF) analysis of the Ni K-edge XANES spectrum for this irradiated molten salt sample? | The required reference spectra for LCF analysis are Ni foil (representing metallic Ni0) and 1 wt% NiCl2 in molten KCl-ZnCl2 eutectic salt (representing ionic Ni2+). These specific references are needed because the sample, consisting of 0.1 wt% NiCl2 in a KCl-ZnCl2 eutectic salt heated to 400 °C and irradiated with a 6 MGy electron dose, undergoes both thermal and radiolytic reduction. The heating process initiates thermal reduction, while the electron beam generates solvated electrons and highly reducing transient species like Zn+ that further reduce the initial Ni2+ ions into metallic Ni0. Therefore, the final spectrum is a mixture of the unreduced ionic Ni2+ precursor and the newly formed metallic Ni0 product. | Full points for identifying both a metallic nickel reference (e.g., Ni foil) and an appropriate ionic Ni2+ reference dissolved in the same or similar molten salt matrix (e.g., 1 wt% NiCl2 in KCl-ZnCl2). |
| q2 | quantification | 30 | Based on the sample conditions (400 °C, 6 MGy electron dose), estimate the phase fractions of the nickel species present in the sample. | The estimated phase fractions for this sample are 48% metallic nickel (Ni0) and 52% ionic Ni2+, with an uncertainty of 10%. These specific values result from the combined effects of heating the sample to 400 °C and applying a 6 MGy electron dose. The 400 °C temperature causes an initial thermal reduction that yields approximately 51% Ni0 even without irradiation. The 6 MGy electron irradiation falls into a "low dose" region (Region-I) that maintains this balance at an average of 48% Ni0 and 52% Ni2+, acting as a threshold just before enough radiation accumulates to trigger a sudden step-increase in reduction observed at 9 MGy. | Full points for estimating approximately 48% metallic Ni (Ni0) and 52% ionic Ni2+. Partial credit for recognizing a roughly 50/50 mixture of metallic and ionic species. |
| q3 | reasoning | 50 | Explain the physical and radiolytic mechanisms that lead to the specific phase composition at the 6 MGy dose, and why this dose represents a distinct regime compared to higher doses (e.g., >9 MGy). | The phase composition at the 6 MGy dose is driven by a combination of thermal and radiolytic reduction mechanisms. Initially, heating the 0.1 wt% NiCl2 in KCl-ZnCl2 eutectic salt to 400 °C causes thermal reduction, producing a baseline of metallic Ni0. During irradiation, the 2-MeV electron beam generates solvated electrons and highly reducing transient species, such as Zn+, which act to radiolytically reduce the remaining Ni2+ to Ni0. The 6 MGy dose represents a distinct "low dose" regime (Region-I) where the mixture stabilizes at an average of 48% Ni0 and 52% Ni2+. This specific dose acts as a threshold, because accumulating further radiation dose (e.g., 9 MGy) triggers a sudden step-increase in the radiolytic reduction process, pushing the metallic Ni0 fraction above 50%. | Full points for explaining that reduction is driven by both thermal effects and radiolytic products (solvated electrons, Zn+ transients) reducing Ni2+ to Ni0, and noting that 6 MGy is in a 'low dose' plateau (~48% Ni0) before a critical accumulation of dose triggers a sudden increase in metallic dominance at higher doses. |
Review
#591
0.1 wt% NiCl2 in KCl-ZnCl2 eutectic salt
Ni K-edge
▶
LLM Prompt
Sample Information
Material: 0.1 wt% NiCl2 in KCl-ZnCl2 eutectic salt
Method: electron irradiation
Precursors: NiCl2, KCl, ZnCl2
Temperature C: 400
Atmosphere: Ar (sealed under vacuum)
Cooling Method: cooled to room temperature for measurement
Sample-Specific Conditions
- Electron dose: 9 MGy
- Sample heated to 400 °C and irradiated with 9 MGy electron dose
Preparation
- Loaded in capillaries, evacuated and sealed. Heated to 400 °C and irradiated with a 2-MeV Van de Graaff electron accelerator to 9 MGy absorbed dose.
Measurement
We plan to measure the Ni K-edge XANES spectrum of this sample.
Questions
Based on all the information above:
1. What candidate reference spectra are needed to perform a Linear Combination Fitting (LCF) analysis on the XANES spectrum of this irradiated molten salt sample?
2. Estimate the phase fractions of the nickel species present in the sample after being heated to 400 °C and irradiated with a 9 MGy electron dose.
Ground Truth
Material: 0.1 wt% NiCl2 in KCl-ZnCl2 eutectic salt
Measurement: Ni K-edge XANES in fluorescence mode at the 8ID-Inner Shell Spectroscopy (ISS) beamline at NSLS-II
Fit method: Linear Combination Fitting (LCF)
Phase fractions: (±10%)
| Phase | Fraction |
|---|---|
| metallic_nickel | 0.76 |
| Ni2+ (in KCl-ZnCl2) | 0.24 |
Fit basis (paper's reference spectra):
- Ni foil (representing metallic Ni0)
- 1 wt% NiCl2 in molten KCl-ZnCl2 eutectic salt (representing ionic Ni2+)
Source evidence: Figure 4, page 16
Key reasoning: The radiolytic reduction of Ni2+ is caused by the scavenging of solvated electrons generated by high-energy electron irradiation of the solute-salt mixture. A sudden step in reduction occurs from 6 MGy to 9 MGy due to the accumulation of enough electron radiation dose, which leads to the dominance of metallic species (more than 50%) compared to ionic nickel. At 9 MGy, the metallic Ni0 phase fraction reaches approximately 76%, indicating significant nanoparticle formation and growth.
Reasoning source: Page 16 (Results) and Page 30 (Discussion)
Scoring Rubric (total: 100 pts)
| Q | Type | Max | Question | Reference Answer | Scoring Criteria |
|---|---|---|---|---|---|
| q1 | identification | 33 | What candidate reference spectra are needed to perform a Linear Combination Fitting (LCF) analysis on the XANES spectrum of this irradiated molten salt sample? | To perform a Linear Combination Fitting (LCF) analysis on this sample, the required reference spectra are Ni foil (representing metallic Ni0) and 1 wt% NiCl2 in molten KCl-ZnCl2 eutectic salt (representing ionic Ni2+). These specific phases are expected because the sample begins as ionic NiCl2 dissolved in the eutectic salt at 400 °C. Upon exposure to the 2-MeV electron accelerator, high-energy electron irradiation generates solvated electrons in the solute-salt mixture. The scavenging of these solvated electrons causes the radiolytic reduction of the initial Ni2+ ions into metallic Ni0 nanoparticles, requiring both an ionic and a metallic reference to capture the resulting mixed oxidation states. | Full points for identifying both metallic Ni (e.g., Ni foil) and an appropriate ionic Ni2+ reference representing the dissolved state (e.g., 1 wt% NiCl2 in KCl-ZnCl2 melt). |
| q2 | quantification | 67 | Estimate the phase fractions of the nickel species present in the sample after being heated to 400 °C and irradiated with a 9 MGy electron dose. | After heating to 400 °C and irradiating with a 9 MGy electron dose, the sample consists of approximately 76% metallic Ni0 and 24% ionic Ni2+ (in KCl-ZnCl2), with a 10% uncertainty. These specific values result from the radiolytic reduction of Ni2+ caused by the scavenging of solvated electrons generated during the high-energy electron irradiation of the salt mixture. As the electron radiation dose accumulates, a sudden step in reduction occurs between 6 MGy and 9 MGy. At the final 9 MGy dose, enough solvated electrons have been scavenged to make the metallic species dominant, driving the metallic Ni0 fraction to 76% and indicating significant nanoparticle formation and growth. | Full points for estimating approximately 76% metallic Ni0 and 24% ionic Ni2+. Partial credit for correctly identifying that metallic Ni0 is the dominant phase (>50%). |
Review
#592
0.1 wt% NiCl2 in KCl-ZnCl2 eutectic salt
Ni K-edge
▶
LLM Prompt
Sample Information
Material: 0.1 wt% NiCl2 in KCl-ZnCl2 eutectic salt
Method: electron irradiation
Precursors: NiCl2, KCl, ZnCl2
Temperature C: 400
Atmosphere: Ar (sealed under vacuum)
Cooling Method: cooled to room temperature for measurement
Sample-Specific Conditions
- Electron dose: 12 MGy
- Sample heated to 400 °C and irradiated with 12 MGy electron dose
Preparation
- Loaded in capillaries, evacuated and sealed. Heated to 400 °C and irradiated with a 2-MeV Van de Graaff electron accelerator to 12 MGy absorbed dose.
Measurement
We plan to measure the Ni K-edge XANES spectrum of this sample.
Questions
Based on all the information above:
1. What candidate reference spectra are needed to perform Linear Combination Fitting (LCF) for this irradiated molten salt sample?
2. Based on the provided conditions (12 MGy electron dose at 400 °C), estimate the phase fractions of the nickel species present in the sample.
Ground Truth
Material: 0.1 wt% NiCl2 in KCl-ZnCl2 eutectic salt
Measurement: Ni K-edge XANES in fluorescence mode at the 8ID-Inner Shell Spectroscopy (ISS) beamline at NSLS-II
Fit method: Linear Combination Fitting (LCF)
Phase fractions: (±5%)
| Phase | Fraction |
|---|---|
| metallic_nickel | 0.69 |
| Ni2+ (in KCl-ZnCl2) | 0.31 |
Fit basis (paper's reference spectra):
- Ni foil (representing metallic Ni0)
- 1 wt% NiCl2 in molten KCl-ZnCl2 eutectic salt (representing ionic Ni2+)
Source evidence: Figure 4, page 16
Key reasoning: Electron irradiation of the molten salt generates highly reducing transient species (like solvated electrons or Zn+) that reduce Ni2+ to Ni+. These intermediates undergo subsequent electron transfer and addition reactions to form Ni clusters. At high doses like 12 MGy, the system is in a high-dose region where metallic Ni0 is the dominant species, as nanoparticle growth outcompetes oxidation/corrosion reactions, leading to a steady-state concentration of metallic nanoparticles.
Reasoning source: DISCUSSION section, pages 30-32
Scoring Rubric (total: 100 pts)
| Q | Type | Max | Question | Reference Answer | Scoring Criteria |
|---|---|---|---|---|---|
| q1 | identification | 33 | What candidate reference spectra are needed to perform Linear Combination Fitting (LCF) for this irradiated molten salt sample? | To perform Linear Combination Fitting (LCF) on this sample, the required reference spectra are Ni foil (representing metallic Ni0) and 1 wt% NiCl2 in molten KCl-ZnCl2 eutectic salt (representing ionic Ni2+). These specific references are needed because the sample initially consists of NiCl2 dissolved in the KCl-ZnCl2 eutectic salt at 400 °C, providing the unreacted ionic Ni2+ component. Upon electron irradiation, highly reducing transient species such as solvated electrons or Zn+ are generated in the molten salt, which reduce the Ni2+ ions to Ni+. These intermediates subsequently undergo electron transfer and addition reactions to form metallic Ni clusters, necessitating the metallic Ni0 reference to capture the resulting reduced phase. | Full points if the answer identifies both a metallic nickel reference (e.g., Ni foil) and an ionic Ni2+ reference dissolved in the specific molten salt matrix (e.g., 1 wt% NiCl2 in KCl-ZnCl2). |
| q2 | quantification | 67 | Based on the provided conditions (12 MGy electron dose at 400 °C), estimate the phase fractions of the nickel species present in the sample. | Based on the 12 MGy electron dose at 400 °C, the estimated phase fractions are 0.69 (69%) metallic Ni0 and 0.31 (31%) ionic Ni2+, with an uncertainty of 5%. These specific values result from the high-dose electron irradiation of the molten salt, which generates highly reducing transient species like solvated electrons or Zn+ that reduce the initial Ni2+ to Ni+. At this high dose of 12 MGy, the system enters a regime where metallic Ni0 becomes the dominant species. This high metallic fraction occurs because the rate of metallic nanoparticle growth outcompetes oxidation and corrosion reactions, ultimately leading to a steady-state concentration heavily favoring the metallic nickel phase. | Full points if the estimated fractions are within ±5% of 69% metallic Ni0 and 31% ionic Ni2+. Partial points if the answer correctly identifies that metallic Ni0 is the dominant phase (>50%) but the exact fractions are off. |
Review
#593
0.1 wt% NiCl2 in KCl-ZnCl2 eutectic salt
Ni K-edge
▶
LLM Prompt
Sample Information
Material: 0.1 wt% NiCl2 in KCl-ZnCl2 eutectic salt
Method: electron irradiation
Precursors: NiCl2, KCl, ZnCl2
Temperature C: 400
Atmosphere: Ar (sealed under vacuum)
Cooling Method: cooled to room temperature for measurement
Sample-Specific Conditions
- Electron dose: 15 MGy
- Sample heated to 400 °C and irradiated with 15 MGy electron dose
Preparation
- Loaded in capillaries, evacuated and sealed. Heated to 400 °C and irradiated with a 2-MeV Van de Graaff electron accelerator to 15 MGy absorbed dose.
Measurement
We plan to measure the Ni K-edge XANES spectrum of this sample.
Questions
Based on all the information above:
1. What candidate reference spectra should be used as basis functions for Linear Combination Fitting (LCF) to determine the speciation of Ni in this irradiated molten salt sample?
2. Estimate the phase fractions of the nickel species present in the sample after being heated to 400 °C and irradiated with a 15 MGy electron dose.
3. Explain the physical and chemical reasoning for why this specific electron dose (15 MGy) results in the observed mixture of nickel phases rather than a single pure phase.
Ground Truth
Material: 0.1 wt% NiCl2 in KCl-ZnCl2 eutectic salt
Measurement: Ni K-edge XANES in fluorescence mode at 8ID-Inner Shell Spectroscopy (ISS) beamline
Fit method: Linear Combination Fitting (LCF)
Phase fractions: (±10%)
| Phase | Fraction |
|---|---|
| Ni0 | 0.78 |
| Ni2+ | 0.22 |
Fit basis (paper's reference spectra):
- Ni foil (representing metallic Ni0)
- 1 wt% NiCl2 in molten KCl-ZnCl2 eutectic salt (representing ionic Ni2+)
Source evidence: Figure 3b (LCF of 15 MGy) and Figure 4 (Phase fractions vs Dose)
Key reasoning: High-energy electron irradiation of the solute-salt mixture generates solvated electrons that reduce Ni2+ to Ni0. At the high dose of 15 MGy, the accumulated electron radiation leads to the dominance of the metallic Ni0 species (forming 1-2 nm nanoparticles). The conversion is not 100% due to a steady-state competition between nanoparticle growth and oxidation/corrosion reactions in the melt, leaving a fraction of unreduced Ni2+.
Reasoning source: Results (page 16) and Discussion (pages 30-32)
Scoring Rubric (total: 100 pts)
| Q | Type | Max | Question | Reference Answer | Scoring Criteria |
|---|---|---|---|---|---|
| q1 | identification | 25 | What candidate reference spectra should be used as basis functions for Linear Combination Fitting (LCF) to determine the speciation of Ni in this irradiated molten salt sample? | The candidate reference spectra for Linear Combination Fitting (LCF) should include Ni foil to represent metallic Ni0 and 1 wt% NiCl2 in molten KCl-ZnCl2 eutectic salt to represent ionic Ni2+. These specific references are required because the sample initially consists of Ni2+ ions from the 0.1 wt% NiCl2 dissolved in the KCl-ZnCl2 eutectic salt at 400 °C. Upon irradiation with a 15 MGy electron dose, high-energy electrons generate solvated electrons in the melt that reduce the initial Ni2+ species into metallic Ni0 nanoparticles. Because this reduction process competes with oxidation/corrosion reactions in the melt, the conversion is incomplete, meaning both the reduced Ni0 phase and the unreduced Ni2+ precursor phase must be used to fit the final spectrum. | Full points for identifying a metallic Ni reference (e.g., Ni foil) and an ionic Ni2+ reference dissolved in a similar molten salt matrix (e.g., NiCl2 in KCl-ZnCl2). |
| q2 | quantification | 35 | Estimate the phase fractions of the nickel species present in the sample after being heated to 400 °C and irradiated with a 15 MGy electron dose. | The estimated phase fractions for the sample are 0.78 (78%) metallic Ni0 and 0.22 (22%) ionic Ni2+, with an uncertainty of 10%. These specific values arise because the high 15 MGy electron dose applied to the sample at 400 °C generates solvated electrons that heavily reduce the Ni2+ precursor into metallic Ni0 nanoparticles. The conversion reaches 78% rather than full completion due to a steady-state competition between the radiation-induced nanoparticle growth and ongoing oxidation/corrosion reactions in the KCl-ZnCl2 melt. Consequently, this dynamic equilibrium leaves a 22% fraction of unreduced Ni2+ in the final mixture. | Full points for estimating approximately 75-80% metallic Ni (Ni0) and 20-25% ionic Ni (Ni2+). Partial points for correctly identifying that Ni0 is the dominant phase (>50%) but with less accurate percentages. |
| q3 | reasoning | 40 | Explain the physical and chemical reasoning for why this specific electron dose (15 MGy) results in the observed mixture of nickel phases rather than a single pure phase. | The observed mixture of phases at a 15 MGy dose is the result of a steady-state competition between reduction and oxidation reactions in the melt. When the 0.1 wt% NiCl2 in KCl-ZnCl2 eutectic salt is heated to 400 °C and subjected to high-energy electron irradiation, solvated electrons are generated that reduce Ni2+ to metallic Ni0. At the high accumulated dose of 15 MGy, this reduction leads to the dominance of 1-2 nm Ni0 nanoparticles. However, the system does not reach a single pure Ni0 phase because the nanoparticle growth continuously competes with oxidation and corrosion reactions within the molten salt environment. This steady-state dynamic prevents 100% conversion, leaving a residual fraction of unreduced Ni2+ alongside the dominant Ni0 phase. | Full points for explaining that electron irradiation generates solvated electrons that reduce Ni2+ to Ni0, and that a mixture remains at high doses due to a steady-state competition between radiolytic nanoparticle growth and oxidation/corrosion reactions in the molten salt. |
Review
Influence of Domain Size and Support Composition on the Reducibility of SiO2 and TiO2 Supported Tungsten Oxide Clusters
BNL-NSLS-II-8-ID
Catalyst
Konstantin Mamedov et al.
DOI: 10.1021/acs.jpcc.4c03652
2 scenarios
▶
#594
WOx/SiO2
W L3
▶
LLM Prompt
Sample Information
Material: WOx/SiO2
Support: SiO2
Reaction Conditions: 5% H2/N2
Sample-Specific Conditions
- Reduction temperature: 600 K
- Tungsten oxide supported on silica
Measurement
We plan to measure the W L3 XANES spectrum of this sample.
Questions
Based on all the information above:
1. What is the dominant tungsten oxidation state for the 6 wt% WOx/SiO2 catalyst after reduction in 5% H2/N2 at 600 K, and why?
2. Under these specific reduction conditions (600 K, 5% H2/N2), would you expect to see contributions from W5+ or W4+ in the XANES analysis?
3. What reference spectra or basis functions would be necessary to model the W L3-edge XANES spectrum of this sample?
Ground Truth
Material: WOx/SiO2
Measurement: W L3-edge, ex-situ
Fit method: not reported
Phase fractions: (±10%)
| Phase | Fraction |
|---|---|
| W6+ | 1.0 |
Fit basis (paper's reference spectra):
- W6+ reference
Source evidence: Text data for 6W-SiO2 (W 4f) reduced at 600 K
Key reasoning: At a mild reduction temperature of 600 K in 5% H2/N2, the 6 wt% tungsten oxide supported on silica (1-3 nm particle size) remains fully oxidized. The conditions are insufficient to reduce W6+ to lower oxidation states.
Reasoning source: Text
Scoring Rubric (total: 100 pts)
| Q | Type | Max | Question | Reference Answer | Scoring Criteria |
|---|---|---|---|---|---|
| q1 | reasoning | 40 | What is the dominant tungsten oxidation state for the 6 wt% WOx/SiO2 catalyst after reduction in 5% H2/N2 at 600 K, and why? | The dominant tungsten oxidation state for the 6 wt% WOx/SiO2 catalyst is W6+, which accounts for 1.0 (100%) of the tungsten species. This occurs because the reduction temperature of 600 K in a 5% H2/N2 atmosphere is relatively mild. Under these specific conditions, the thermal energy and reducing environment are insufficient to reduce the 1-3 nm tungsten oxide particles supported on silica to lower oxidation states. Consequently, the material remains fully oxidized as W6+. | Full credit for identifying W6+ as the sole/dominant phase (fraction 1.0) and explaining that 600 K is too mild a reduction temperature to reduce the tungsten oxide species on silica. |
| q2 | prediction | 30 | Under these specific reduction conditions (600 K, 5% H2/N2), would you expect to see contributions from W5+ or W4+ in the XANES analysis? | No, you should not expect to see any contributions from W5+ or W4+ in the XANES analysis, as the expected fraction for W6+ is 1.0 (100%). The sample consists of 6 wt% tungsten oxide with a 1-3 nm particle size supported on silica. The applied reduction conditions of 600 K in 5% H2/N2 are too mild to drive the reduction of W6+ to lower oxidation states. Because the environment lacks sufficient reducing power at this temperature, the tungsten remains fully oxidized, precluding the formation of W5+ or W4+ species. | Full credit for stating that lower oxidation states like W5+ or W4+ are not expected, as the tungsten remains 100% W6+ under these mild reduction conditions. |
| q3 | identification | 30 | What reference spectra or basis functions would be necessary to model the W L3-edge XANES spectrum of this sample? | Only a W6+ reference spectrum is necessary to model the W L3-edge XANES spectrum of this sample. This single basis function is sufficient because the 6 wt% tungsten oxide (1-3 nm particles) on silica remains fully oxidized under the specified sample conditions. Specifically, the mild reduction temperature of 600 K in a 5% H2/N2 gas mixture does not provide enough energy to reduce W6+ to lower oxidation states. Therefore, the resulting spectrum will exclusively reflect the fully oxidized W6+ state, requiring no other reference spectra for fitting. | Full credit for identifying that a W6+ reference spectrum is the primary/only requirement, since the sample is fully oxidized. |
Review
#595
Pd-WOx/SiO2
W L3
▶
LLM Prompt
Sample Information
Material: Pd-WOx/SiO2
Support: SiO2
Reaction Conditions: 5% H2/N2
Sample-Specific Conditions
- Reduction temperature: 600 K
- Pd-promoted tungsten oxide supported on silica
Measurement
We plan to measure the W L3 XANES spectrum of this sample.
Questions
Based on all the information above:
1. What candidate oxidation states or reference phases should be included in the basis set to model the W L3 XANES spectrum of the Pd-WOx/SiO2 catalyst after reduction at 600 K?
2. Estimate the quantitative phase fractions of the tungsten species present in this catalyst after reduction in 5% H2/N2 at 600 K.
3. Based on the sample composition and treatment conditions, explain the expected oxidation state distribution of tungsten in this catalyst.
Ground Truth
Material: Pd-WOx/SiO2
Measurement: W L3 edge, ex-situ
Fit method: not reported
Phase fractions: (±10%)
| Phase | Fraction |
|---|---|
| W6+ | 0.55 |
| W5+ | 0.45 |
Fit basis (paper's reference spectra):
- W6+
- W5+
Source evidence: Text (Sample ID: 1Pd-6W-SiO2 (W 4f), phase fractions)
Key reasoning: The Pd-promoted tungsten oxide supported on silica undergoes partial reduction when treated in 5% H2/N2 at 600 K. This specific reduction temperature and environment results in a mixed oxidation state consisting of 55% W6+ and 45% W5+.
Reasoning source: Sample description and treatment conditions text
Scoring Rubric (total: 100 pts)
| Q | Type | Max | Question | Reference Answer | Scoring Criteria |
|---|---|---|---|---|---|
| q1 | identification | 30 | What candidate oxidation states or reference phases should be included in the basis set to model the W L3 XANES spectrum of the Pd-WOx/SiO2 catalyst after reduction at 600 K? | To model the W L3 XANES spectrum of this sample, the basis set should include W6+ and W5+ reference phases. These specific oxidation states are expected because the Pd-promoted tungsten oxide supported on silica undergoes partial reduction when treated in a 5% H2/N2 environment. The reduction temperature of 600 K provides the necessary thermal energy to partially reduce the tungsten oxide species, resulting in a mixture of W6+ and W5+ states rather than a fully reduced material. | Full points for identifying both W6+ and W5+ as the necessary components for the basis set. |
| q2 | quantification | 40 | Estimate the quantitative phase fractions of the tungsten species present in this catalyst after reduction in 5% H2/N2 at 600 K. | The quantitative phase fractions for this catalyst are estimated to be 55% W6+ and 45% W5+, with an uncertainty of 10%. These specific values result from the partial reduction of the Pd-promoted tungsten oxide on silica under the applied treatment conditions. Treating the sample in a 5% H2/N2 reducing atmosphere at exactly 600 K drives the reduction process to this specific mixed oxidation state, leaving slightly more than half of the tungsten in its fully oxidized W6+ state while converting the rest to W5+. | Full points for estimating approximately 55% W6+ and 45% W5+. |
| q3 | reasoning | 30 | Based on the sample composition and treatment conditions, explain the expected oxidation state distribution of tungsten in this catalyst. | The expected oxidation state distribution of tungsten in this catalyst is a mixture of 55% W6+ and 45% W5+. This distribution arises because the Pd-promoted tungsten oxide supported on silica is subjected to a reducing environment of 5% H2/N2. At a reduction temperature of 600 K, the material undergoes a partial reduction process. The combination of the Pd promoter and these specific thermal and atmospheric conditions facilitates the reduction of nearly half the tungsten sites to W5+, while the remaining 55% is retained as W6+. | Full points for explaining that the 600 K reduction in H2/N2 of the Pd-promoted catalyst leads to partial reduction, yielding a specific mixture of W6+ and W5+. |
Review
Lithiation of Magnetite (Fe 3 O 4 ): Analysis Using Isothermal Microcalorimetry and Operando X-ray Absorption Spectroscopy
BNL-NSLS-II-8-ID
Electrochemistry
Matthew M. Huie et al.
DOI: 10.1021/acs.jpcc.8b01681
14 scenarios
▶
#596
Fe3O4
Fe K-edge
▶
LLM Prompt
Sample Information
Material: Fe3O4
Electrode Type: working electrode
Electrolyte: 1 M LiPF6 in EC/DMC (30/70)
Cell Type: pouch cell
Charge Discharge: discharging
C Rate: 64 mA/g
State Of Charge: 0 e-
Cycle Number: 1
Sample-Specific Conditions
- Electron Equiv.: 0
- Undischarged Fe3O4 electrode
Measurement
We plan to measure the Fe K-edge XANES spectrum of this sample.
Questions
Based on all the information above:
1. What candidate reference spectra are required to perform Linear Combination Fitting (LCF) on the XANES data for this Fe3O4 conversion electrode throughout its first discharge?
2. Given that the sample is at 0 electron equivalents (undischarged), what is the dominant phase present in the electrode, and why?
3. How does the XANES spectral shape and edge position of this initial undischarged state distinguish it from the states that emerge later during deep discharge (e.g., after 4.2 electrons)?
Ground Truth
Material: Fe3O4
Measurement: Operando XAS at the Fe K-edge (7112 eV) in transmission mode at beamline 8-ID at NSLS-II
Fit method: Linear combination fitting (LCF)
Phase fractions: (±10%)
| Phase | Fraction |
|---|---|
| Fe3O4 | 1.0 |
| Li1.9Fe3O4 | 0.0 |
| metallic_iron | 0.0 |
Fit basis (paper's reference spectra):
- undischarged cell (Fe3O4)
- cell lithiated to 1.9 Li per mole of Fe3O4 (Li1.9Fe3O4)
- Fe metal foil
Source evidence: Figure 7A, page 28
Key reasoning: At 0 electron equivalents, the cell is in its pristine, undischarged state. No electrochemical reduction or lithiation has occurred yet, so the material consists entirely of the parent inverse-spinel Fe3O4 phase.
Reasoning source: Page 24 and Page 26
Scoring Rubric (total: 100 pts)
| Q | Type | Max | Question | Reference Answer | Scoring Criteria |
|---|---|---|---|---|---|
| q1 | identification | 30 | What candidate reference spectra are required to perform Linear Combination Fitting (LCF) on the XANES data for this Fe3O4 conversion electrode throughout its first discharge? | To perform Linear Combination Fitting (LCF) on this Fe3O4 electrode throughout its first discharge, the required reference spectra are the undischarged cell (Fe3O4), a cell lithiated to 1.9 Li per mole of Fe3O4 (Li1.9Fe3O4), and Fe metal foil. These specific reference phases are necessary because they represent the structural evolution of the electrode during the electrochemical conversion process. At the current sample condition of 0 electron equivalents (undischarged), the material consists entirely of the parent inverse-spinel Fe3O4 phase (fraction = 1.0). The other references (Li1.9Fe3O4 and Fe metal) are required to capture the subsequent lithiation and reduction steps that will occur as the cell is discharged. | Full points for identifying the undischarged electrode (Fe3O4), a partially lithiated intermediate (Li1.9Fe3O4), and Fe metal foil as the necessary reference spectra. |
| q2 | reasoning | 30 | Given that the sample is at 0 electron equivalents (undischarged), what is the dominant phase present in the electrode, and why? | The dominant phase present in the electrode is the parent inverse-spinel Fe3O4, which accounts for a phase fraction of 1.0. This occurs because the sample is at exactly 0 electron equivalents, meaning it is in its pristine, undischarged state. Under these specific conditions, no electrochemical reduction or lithiation has occurred yet. Therefore, the material consists entirely of the initial Fe3O4 phase, with no formation of intermediate Li1.9Fe3O4 or metallic iron phases. | Full points for stating the phase is 100% Fe3O4 and explaining that at 0 electron equivalents, no electrochemical reduction or lithiation has occurred, leaving the pristine parent material intact. |
| q3 | spectral | 40 | How does the XANES spectral shape and edge position of this initial undischarged state distinguish it from the states that emerge later during deep discharge (e.g., after 4.2 electrons)? | The XANES spectrum of this initial undischarged state is characterized by a higher Fe K-edge energy position (7112 eV) and a distinct white line compared to subsequent lithiated states. These spectral features arise because the sample is at 0 electron equivalents, meaning the iron remains in its pristine inverse-spinel Fe3O4 crystal structure with an average oxidation state near +2.67. As the cell undergoes discharge and lithiation, the electrochemical reduction of iron causes the edge position to shift to lower energies. Additionally, the structural changes associated with the transition to reduced phases like Li1.9Fe3O4 and metallic iron result in a decrease in the intensity of the white line. | Full points for noting that the initial state has a higher edge energy and a distinct white line intensity, and that deep discharge/lithiation causes the edge position to shift to lower energies and the white line intensity to decrease. |
Review
#597
Fe3O4
Fe K-edge
▶
LLM Prompt
Sample Information
Material: Fe3O4
Electrode Type: working electrode
Electrolyte: 1 M LiPF6 in EC/DMC (30/70)
Cell Type: pouch cell
Charge Discharge: discharging
C Rate: 64 mA/g
State Of Charge: 0.3 e-
Cycle Number: 1
Sample-Specific Conditions
- Electron Equiv.: 0.3
- Fe3O4 electrode during initial lithiation
Measurement
We plan to measure the Fe K-edge XANES spectrum of this sample.
Questions
Based on all the information above:
1. What candidate reference spectra are appropriate for modeling the XANES spectrum of this sample using Linear Combination Fitting (LCF) across the full lithiation process?
2. Estimate the phase fractions of the electrode at this early state of discharge (0.3 e-).
3. Explain the electrochemical and structural reasoning for this specific phase composition at 0.3 e- of discharge, detailing why certain phases are present or absent.
Ground Truth
Material: Fe3O4
Measurement: Operando XAS at the Fe K-edge (7112 eV) in transmission mode at beamline 8-ID at NSLS-II
Fit method: Linear combination fitting (LCF)
Phase fractions: (±10%)
| Phase | Fraction |
|---|---|
| Fe3O4 | 0.85 |
| Li1.9Fe3O4 | 0.15 |
| metallic_iron | 0.0 |
Fit basis (paper's reference spectra):
- undischarged cell (Fe3O4)
- cell lithiated to 1.9 Li per mole of Fe3O4 (Li1.9Fe3O4)
- Fe metal foil
Source evidence: Figure 7A and Section 3.8, pages 26-28
Key reasoning: During the initial stages of lithiation (0 to 1.9 electrons), the parent Fe3O4 phase changes to a partially lithiated Li1.9Fe3O4 phase at a constant linear rate. This corresponds to the insertion of Li+ into interstitial octahedral (16c) sites. At a very early state of charge (0.3 electron equivalents), the conversion has just begun, resulting in a mixture dominated by the parent Fe3O4 phase with a small fraction of Li1.9Fe3O4. No metallic iron is formed at this stage, as significant reduction to Fe0 is only observed after 2.7 electrons of lithiation.
Reasoning source: Section 3.8 (Operando X-ray Absorption Spectroscopy), page 27
Scoring Rubric (total: 100 pts)
| Q | Type | Max | Question | Reference Answer | Scoring Criteria |
|---|---|---|---|---|---|
| q1 | identification | 20 | What candidate reference spectra are appropriate for modeling the XANES spectrum of this sample using Linear Combination Fitting (LCF) across the full lithiation process? | The appropriate candidate reference spectra for modeling the Fe K-edge XANES spectrum using Linear Combination Fitting (LCF) are the undischarged cell (Fe3O4), a cell lithiated to 1.9 Li per mole of Fe3O4 (Li1.9Fe3O4), and Fe metal foil. These specific spectral references are required because they represent the distinct structural and electronic states the Fe3O4 working electrode adopts during the discharging process. Specifically, the parent Fe3O4 spectrum captures the initial state, while the Li1.9Fe3O4 spectrum captures the structural changes caused by Li+ insertion into interstitial octahedral (16c) sites between 0 and 1.9 electrons. Finally, the Fe metal foil spectrum is necessary to model the eventual electronic reduction to metallic iron (Fe0) that occurs at deeper states of discharge beyond 2.7 electrons. | Full credit for identifying the undischarged parent phase (Fe3O4), an intermediate partially lithiated phase (Li1.9Fe3O4), and the final reduced phase (Fe metal). |
| q2 | quantification | 40 | Estimate the phase fractions of the electrode at this early state of discharge (0.3 e-). | At this early state of discharge (0.3 electron equivalents), the estimated phase fractions are 85% Fe3O4, 15% Li1.9Fe3O4, and 0% metallic iron, with an uncertainty of 10%. These specific values result from the cell being at the very beginning of its initial lithiation cycle. Because the parent Fe3O4 phase converts to Li1.9Fe3O4 at a constant linear rate between 0 and 1.9 electrons, a discharge of only 0.3 electrons means the conversion has just begun. Consequently, the composition is heavily dominated by the unreacted parent Fe3O4 phase with only a small fraction of the lithiated Li1.9Fe3O4 phase, and no metallic iron has formed yet since significant reduction to Fe0 requires at least 2.7 electrons. | Full credit for estimating ~85% Fe3O4 and ~15% Li1.9Fe3O4, with 0% metallic iron. Partial credit if the trend is correct (majority parent phase, minority intermediate phase, no metal) but values deviate by more than 10%. |
| q3 | reasoning | 40 | Explain the electrochemical and structural reasoning for this specific phase composition at 0.3 e- of discharge, detailing why certain phases are present or absent. | The phase composition at 0.3 electron equivalents of discharge is driven by the initial mechanism of lithium insertion into the Fe3O4 electrode. During the early stages of lithiation (0 to 1.9 electrons), Li+ ions from the electrolyte are inserted into the interstitial octahedral (16c) sites of the parent Fe3O4 structure. This structural change converts the material into a partially lithiated Li1.9Fe3O4 phase at a constant linear rate. Because the sample is only at a 0.3 e- state of charge, this conversion process has just started, leaving a dominant 85% fraction of the original Fe3O4 and only 15% of the new Li1.9Fe3O4 phase. Metallic iron is completely absent (0%) at this stage because the deep reduction of iron to Fe0 does not occur until the cell reaches a much lower state of charge, specifically after 2.7 electrons of lithiation. | Full credit for explaining that the initial lithiation proceeds via a linear conversion from Fe3O4 to Li1.9Fe3O4 (Li+ insertion into 16c sites), meaning at 0.3 e- the reaction has just started, leaving mostly unreacted Fe3O4. Must also explicitly state that Fe metal does not form until much later in the discharge process (>2.7 e-). |
Review
#598
Fe3O4
Fe K-edge
▶
LLM Prompt
Sample Information
Material: Fe3O4
Electrode Type: working electrode
Electrolyte: 1 M LiPF6 in EC/DMC (30/70)
Cell Type: pouch cell
Charge Discharge: discharging
C Rate: 64 mA/g
State Of Charge: 0.7 e-
Cycle Number: 1
Sample-Specific Conditions
- Electron Equiv.: 0.7
- Fe3O4 electrode during initial lithiation
Measurement
We plan to measure the Fe K-edge XANES spectrum of this sample.
Questions
Based on all the information above:
1. What reference spectra are required to accurately model the XANES data of this Fe3O4 electrode during its first lithiation using linear combination fitting?
2. Estimate the phase fractions of the components present in the electrode at a state of charge of 0.7 electron equivalents.
3. Explain the electrochemical and structural reasoning for the expected phase composition at 0.7 electron equivalents of discharge.
Ground Truth
Material: Fe3O4
Measurement: Operando XAS at the Fe K-edge (7112 eV) in transmission mode at beamline 8-ID at NSLS-II
Fit method: Linear combination fitting (LCF)
Phase fractions: (±10%)
| Phase | Fraction |
|---|---|
| Fe3O4 | 0.65 |
| Li1.9Fe3O4 | 0.35 |
| metallic_iron | 0.0 |
Fit basis (paper's reference spectra):
- undischarged cell (Fe3O4)
- cell lithiated to 1.9 Li per mole of Fe3O4 (Li1.9Fe3O4)
- Fe metal foil
Source evidence: Figure 7A, page 28
Key reasoning: During the initial stages of lithiation (0 to 1.9 electrons), the parent Fe3O4 phase converts to a partially lithiated intermediate, Li1.9Fe3O4, at a constant linear rate. This corresponds to the intercalation of Li+ ions into the crystal structure prior to the conversion reaction. At 0.7 electron equivalents, the electrode is in this initial intercalation regime, meaning it is a mixture of the unreacted Fe3O4 and the Li1.9Fe3O4 intermediate, with no metallic iron formed yet.
Reasoning source: Section 3.8 (Operando X-ray Absorption Spectroscopy), pages 24-27
Scoring Rubric (total: 100 pts)
| Q | Type | Max | Question | Reference Answer | Scoring Criteria |
|---|---|---|---|---|---|
| q1 | identification | 20 | What reference spectra are required to accurately model the XANES data of this Fe3O4 electrode during its first lithiation using linear combination fitting? | The required reference spectra for linear combination fitting are the undischarged cell (Fe3O4), a cell lithiated to 1.9 Li per mole of Fe3O4 (Li1.9Fe3O4), and Fe metal foil. Under the sample conditions of initial lithiation (discharging at 64 mA/g to 0.7 electron equivalents), the parent Fe3O4 phase undergoes an intercalation reaction with Li+ ions from the electrolyte. This process converts the material into a partially lithiated intermediate, Li1.9Fe3O4, prior to any conversion reaction. Therefore, these specific references are needed to capture the mixture of unreacted starting material, the intercalation intermediate, and to confirm the absence of metallic iron at this early stage of discharge. | Full points for identifying the unreacted Fe3O4, a partially lithiated intermediate (Li1.9Fe3O4), and metallic Fe as the necessary basis set. |
| q2 | quantification | 40 | Estimate the phase fractions of the components present in the electrode at a state of charge of 0.7 electron equivalents. | At a state of charge of 0.7 electron equivalents, the estimated phase fractions are 0.65 Fe3O4, 0.35 Li1.9Fe3O4, and 0.0 metallic iron, with an uncertainty of 10%. These specific values result from the cell being in the initial stages of its first discharge cycle. Between 0 and 1.9 electron equivalents, Li+ ions intercalate into the Fe3O4 crystal structure at a constant linear rate to form the Li1.9Fe3O4 intermediate. Because the sample has only reached 0.7 electron equivalents, it remains strictly in this initial intercalation regime, yielding a proportional mixture of the unreacted parent phase and the intermediate phase without triggering the conversion reaction that would produce metallic iron. | Full points for estimating approximately 65% Fe3O4 and 35% Li1.9Fe3O4, with 0% metallic iron. Partial credit for identifying that it is a mixture of only the parent phase and the lithiated intermediate. |
| q3 | reasoning | 40 | Explain the electrochemical and structural reasoning for the expected phase composition at 0.7 electron equivalents of discharge. | At 0.7 electron equivalents of discharge, the expected phase composition is a mixture of unreacted Fe3O4 (65%) and a partially lithiated intermediate, Li1.9Fe3O4 (35%), with no metallic iron present. This composition arises because, during the initial stages of lithiation (0 to 1.9 electrons) in the 1 M LiPF6 electrolyte, Li+ ions intercalate directly into the parent Fe3O4 crystal structure. This intercalation proceeds at a constant linear rate prior to the onset of the conversion reaction. Since the applied state of charge (0.7 e-) falls well within this 0 to 1.9 electron window, the electrode remains entirely in the intercalation regime, preventing the formation of metallic iron. | Full points for explaining that 0.7 e- falls within the initial intercalation regime (0-1.9 e-) where Li+ inserts into the structure, causing a linear conversion from Fe3O4 to Li1.9Fe3O4 without any conversion to metallic Fe. |
Review
#599
Fe3O4
Fe K-edge
▶
LLM Prompt
Sample Information
Material: Fe3O4
Electrode Type: working electrode
Electrolyte: 1 M LiPF6 in EC/DMC (30/70)
Cell Type: pouch cell
Charge Discharge: discharging
C Rate: 64 mA/g
State Of Charge: 1.1 e-
Cycle Number: 1
Sample-Specific Conditions
- Electron Equiv.: 1.1
- Fe3O4 electrode during initial lithiation
Measurement
We plan to measure the Fe K-edge XANES spectrum of this sample.
Questions
Based on all the information above:
1. Identify the appropriate reference spectra (basis functions) required to perform Linear Combination Fitting (LCF) on the operando Fe K-edge XANES data for this sample during its first lithiation.
2. Estimate the phase fractions of the electrode at a state of charge of 1.1 electron equivalents during the initial lithiation.
3. Explain the electrochemical reaction mechanism that leads to this specific phase composition at 1.1 electron equivalents of discharge. Why is metallic iron not observed at this stage?
Ground Truth
Material: Fe3O4
Measurement: Operando XAS at the Fe K-edge (7112 eV) in transmission mode at beamline 8-ID at NSLS-II
Fit method: Linear combination fitting (LCF)
Phase fractions: (±10%)
| Phase | Fraction |
|---|---|
| Fe3O4 | 0.4 |
| Li1.9Fe3O4 | 0.6 |
| metallic_iron | 0.0 |
Fit basis (paper's reference spectra):
- undischarged cell (Fe3O4)
- cell lithiated to 1.9 Li per mole of Fe3O4 (Li1.9Fe3O4)
- Fe metal foil
Source evidence: Figure 7A, page 28
Key reasoning: During the initial stages of lithiation (up to 1.9 electrons), the parent Fe3O4 phase converts to an intermediate Li1.9Fe3O4 phase at a constant linear rate. This corresponds to the insertion of Li+ into interstitial sites. At 1.1 electron equivalents of discharge, the electrode is a mixture of the unreacted Fe3O4 and the newly formed Li1.9Fe3O4, with no metallic iron formed yet since the conversion reaction to Fe0 occurs at higher electron equivalents.
Reasoning source: Page 27, Section 3.8 (Operando X-ray Absorption Spectroscopy)
Scoring Rubric (total: 100 pts)
| Q | Type | Max | Question | Reference Answer | Scoring Criteria |
|---|---|---|---|---|---|
| q1 | identification | 25 | Identify the appropriate reference spectra (basis functions) required to perform Linear Combination Fitting (LCF) on the operando Fe K-edge XANES data for this sample during its first lithiation. | The appropriate reference spectra for Linear Combination Fitting (LCF) are the undischarged cell (Fe3O4), a cell lithiated to 1.9 Li per mole of Fe3O4 (Li1.9Fe3O4), and Fe metal foil. These specific basis functions are required because the sample is an Fe3O4 working electrode undergoing its initial lithiation in a pouch cell. During this early stage of discharge (up to 1.9 electrons), Li+ inserts into interstitial sites, converting the parent Fe3O4 into the intermediate Li1.9Fe3O4 phase. The Fe metal foil reference is necessary to confirm the absence of metallic iron, which only forms via a conversion reaction at higher electron equivalents than the current 1.1 e- state. | The answer must identify three key reference states: the initial unreacted phase (Fe3O4), an intermediate lithiated phase (Li1.9Fe3O4), and the fully reduced end-member (Fe metal foil). |
| q2 | quantification | 35 | Estimate the phase fractions of the electrode at a state of charge of 1.1 electron equivalents during the initial lithiation. | At a state of charge of 1.1 electron equivalents, the electrode consists of 40% Fe3O4, 60% Li1.9Fe3O4, and 0% metallic iron, with a 10% uncertainty. These specific fractions result from the constant linear rate at which the parent Fe3O4 phase converts to the intermediate Li1.9Fe3O4 phase during the initial stages of discharge. Because the cell has only been discharged to 1.1 electron equivalents at 64 mA/g, the insertion of Li+ into interstitial sites is incomplete, leaving a mixture of unreacted Fe3O4 and newly formed Li1.9Fe3O4. The metallic iron fraction remains at zero because the conversion reaction to Fe0 requires higher electron equivalents than the 1.1 e- achieved at this stage. | The answer must state that the sample is approximately 40% Fe3O4 and 60% Li1.9Fe3O4, and explicitly note that metallic iron is 0%. |
| q3 | reasoning | 40 | Explain the electrochemical reaction mechanism that leads to this specific phase composition at 1.1 electron equivalents of discharge. Why is metallic iron not observed at this stage? | During the first cycle discharge of the Fe3O4 working electrode in the 1 M LiPF6 electrolyte, the electrochemical mechanism involves the insertion of Li+ ions into interstitial sites. This insertion causes the parent Fe3O4 phase to convert into an intermediate Li1.9Fe3O4 phase at a constant linear rate up to 1.9 electrons. Because the cell has only reached a state of charge of 1.1 electron equivalents at a rate of 64 mA/g, the reaction is incomplete, yielding a mixture of 40% unreacted Fe3O4 and 60% Li1.9Fe3O4. Metallic iron is not observed at this stage because the conversion reaction that reduces the material to Fe0 only occurs at higher electron equivalents. | The answer must explain that the initial 1.9 electrons correspond to a linear conversion of the parent Fe3O4 to an intermediate Li1.9Fe3O4 phase via Li+ insertion. It must also state that the conversion to metallic iron (Fe0) does not begin until further lithiation (beyond 1.9 e-), which is why no Fe metal is present at 1.1 e-. |
Review
#600
Fe3O4
Fe K-edge
▶
LLM Prompt
Sample Information
Material: Fe3O4
Electrode Type: working electrode
Electrolyte: 1 M LiPF6 in EC/DMC (30/70)
Cell Type: pouch cell
Charge Discharge: discharging
C Rate: 64 mA/g
State Of Charge: 1.5 e-
Cycle Number: 1
Sample-Specific Conditions
- Electron Equiv.: 1.5
- Fe3O4 electrode during initial lithiation
Measurement
We plan to measure the Fe K-edge XANES spectrum of this sample.
Questions
Based on all the information above:
1. What reference spectra are appropriate for modeling the Fe K-edge XANES of this Fe3O4 electrode during its first discharge cycle using linear combination fitting?
2. Based on the state of charge (1.5 e- transferred), estimate the phase fractions of the components present in the electrode.
3. Explain the electrochemical and structural reasoning for the phase composition at 1.5 e- of discharge, specifically addressing why metallic iron is absent.
Ground Truth
Material: Fe3O4
Measurement: Operando XAS at the Fe K-edge (7112 eV) in transmission mode at beamline 8-ID at NSLS-II
Fit method: Linear combination fitting (LCF)
Phase fractions: (±10%)
| Phase | Fraction |
|---|---|
| Fe3O4 | 0.15 |
| Li1.9Fe3O4 | 0.85 |
| metallic_iron | 0.0 |
Fit basis (paper's reference spectra):
- undischarged cell (Fe3O4)
- cell lithiated to 1.9 Li per mole of Fe3O4 (Li1.9Fe3O4)
- Fe metal foil
Source evidence: Figure 7A, page 28
Key reasoning: During the initial lithiation up to 1.9 electrons, the parent Fe3O4 phase converts linearly to an intermediate Li1.9Fe3O4 phase. This corresponds to Li+ insertion into interstitial sites and Fe migration to octahedral sites, forming a FeO-like structure. At 1.5 electron equivalents, this initial intercalation/migration step is mostly complete, resulting in a dominant Li1.9Fe3O4 phase and a small remaining fraction of unreacted Fe3O4. No metallic iron is formed yet, as the conversion reaction to Fe0 and Li2O does not begin until after 1.9 electrons.
Reasoning source: Section 3.8, pages 27-29
Scoring Rubric (total: 100 pts)
| Q | Type | Max | Question | Reference Answer | Scoring Criteria |
|---|---|---|---|---|---|
| q1 | identification | 25 | What reference spectra are appropriate for modeling the Fe K-edge XANES of this Fe3O4 electrode during its first discharge cycle using linear combination fitting? | The appropriate reference spectra for linear combination fitting are the undischarged cell (Fe3O4), a cell lithiated to 1.9 Li per mole of Fe3O4 (Li1.9Fe3O4), and Fe metal foil. These references are required because, during the initial lithiation of the Fe3O4 electrode, the parent Fe3O4 phase undergoes Li+ insertion and Fe migration to form the intermediate Li1.9Fe3O4 phase. At the current state of charge (1.5 e- transferred), the structural evolution involves a linear conversion between these two specific oxide phases. The Fe metal foil reference is also necessary to confirm the absence of metallic iron, as the deep conversion reaction to Fe0 does not begin until after 1.9 electrons are transferred. | Full credit for identifying the initial state (Fe3O4), the final state (Fe metal), and the specific intermediate lithiated phase (Li1.9Fe3O4) prior to conversion. |
| q2 | quantification | 35 | Based on the state of charge (1.5 e- transferred), estimate the phase fractions of the components present in the electrode. | At a state of charge of 1.5 electron equivalents, the estimated phase fractions are 0.85 for Li1.9Fe3O4, 0.15 for Fe3O4, and 0.0 for metallic iron, with an uncertainty of 10%. These specific values result from the linear conversion of the parent Fe3O4 phase to the intermediate Li1.9Fe3O4 phase during the initial lithiation up to 1.9 electrons. Because 1.5 electrons have been transferred during this first discharge cycle, the initial intercalation and Fe migration step is mostly complete, yielding a dominant Li1.9Fe3O4 fraction and a small remaining amount of unreacted Fe3O4. The metallic iron fraction remains at zero because the conversion reaction that produces Fe0 and Li2O does not initiate until the discharge surpasses 1.9 electrons. | Full credit for estimating ~85% intermediate lithiated phase (Li1.9Fe3O4), ~15% unreacted Fe3O4, and 0% metallic iron. Deduct points if metallic iron is predicted to be present at this stage. |
| q3 | reasoning | 40 | Explain the electrochemical and structural reasoning for the phase composition at 1.5 e- of discharge, specifically addressing why metallic iron is absent. | During the initial discharge of the Fe3O4 electrode, lithium ions insert into interstitial sites while iron atoms migrate to octahedral sites, forming an FeO-like structure. This structural evolution manifests as a linear conversion from the parent Fe3O4 phase to an intermediate Li1.9Fe3O4 phase up to 1.9 electron equivalents. At the specific state of charge of 1.5 electrons, this intercalation and migration process is largely complete, resulting in a composition dominated by Li1.9Fe3O4 (85%) with a minor fraction of unreacted Fe3O4 (15%). Metallic iron is completely absent at this stage because the subsequent conversion reaction that reduces the material to Fe0 and Li2O only begins after 1.9 electrons have been transferred. | Full credit for explaining that the initial 1.9 electrons correspond to a linear conversion of Fe3O4 to an intermediate Li1.9Fe3O4 phase (involving Li+ insertion and Fe migration to octahedral sites forming a FeO-like structure), and that the actual conversion reaction producing Fe0 does not initiate until after this 1.9 e- threshold is reached. |
Review
#601
Fe3O4
Fe K-edge
▶
LLM Prompt
Sample Information
Material: Fe3O4
Electrode Type: working electrode
Electrolyte: 1 M LiPF6 in EC/DMC (30/70)
Cell Type: pouch cell
Charge Discharge: discharging
C Rate: 64 mA/g
State Of Charge: 1.9 e-
Cycle Number: 1
Sample-Specific Conditions
- Electron Equiv.: 1.9
- Fe3O4 electrode at end of initial intercalation
Measurement
We plan to measure the Fe K-edge XANES spectrum of this sample.
Questions
Based on all the information above:
1. Based on the state of charge (1.9 e-), what is the dominant iron-containing phase present in the electrode, and why does it form at this specific stage of lithiation?
2. If performing Linear Combination Fitting (LCF) on the XANES spectrum of this sample to model the full discharge process, what reference spectra would be appropriate to include in the fit basis?
3. How does the Fe K-edge XANES spectrum of this sample (at 1.9 e-) compare to the pristine Fe3O4 spectrum, and what does this indicate about the average Fe oxidation state?
4. Upon further lithiation beyond 1.9 e- (up to 2.7 e-), the average Fe oxidation state remains constant despite continued electrochemical discharge. What does this suggest about the electrochemical reactions occurring in the cell?
Ground Truth
Material: Fe3O4
Measurement: Operando XAS at the Fe K-edge (7112 eV) in transmission mode at beamline 8-ID at NSLS-II
Fit method: Linear combination fitting (LCF)
Phase fractions: (±10%)
| Phase | Fraction |
|---|---|
| Li1.9Fe3O4 | 1.0 |
| Fe3O4 | 0.0 |
| metallic_iron | 0.0 |
Fit basis (paper's reference spectra):
- undischarged cell (Fe3O4)
- cell lithiated to 1.9 Li per mole of Fe3O4 (Li1.9Fe3O4)
- Fe metal foil
Source evidence: Figure 7A and 7B, Page 27
Key reasoning: During the initial 1.9 electrons of lithiation, the parent Fe3O4 phase undergoes a phase change to Li1.9Fe3O4 at a constant linear rate. At 1.9 electron equivalents, the conversion to this intermediate phase is complete, and the average Fe oxidation state has reduced linearly to ~+2. Minimal conversion to Fe metal occurs until after 2.7 electrons, making Li1.9Fe3O4 the sole phase at this specific state of charge. The unchanging position of the Fe K-edge between 1.9 and 2.7 electrons suggests the onset of electrolyte reduction (SEI formation) rather than further Fe reduction.
Reasoning source: Section 3.8, Page 27
Scoring Rubric (total: 100 pts)
| Q | Type | Max | Question | Reference Answer | Scoring Criteria |
|---|---|---|---|---|---|
| q1 | identification | 30 | Based on the state of charge (1.9 e-), what is the dominant iron-containing phase present in the electrode, and why does it form at this specific stage of lithiation? | The dominant iron-containing phase present in the electrode at this state of charge is Li1.9Fe3O4, which accounts for 100% of the sample. This phase forms because, during the initial 1.9 electrons of lithiation, the parent Fe3O4 undergoes a phase change at a constant linear rate. At exactly 1.9 electron equivalents of discharge, the conversion to this intermediate Li1.9Fe3O4 phase is complete. Minimal conversion to Fe metal occurs until after 2.7 electrons, making Li1.9Fe3O4 the sole phase expected under these specific electrochemical conditions. | Must identify Li1.9Fe3O4 (or a fully intercalated FeO-like intermediate) as the dominant phase (~100%). Must explain that the initial 1.9 electrons correspond to the complete linear conversion of parent Fe3O4 to this intermediate before any significant conversion to Fe metal begins. |
| q2 | reasoning | 20 | If performing Linear Combination Fitting (LCF) on the XANES spectrum of this sample to model the full discharge process, what reference spectra would be appropriate to include in the fit basis? | To model the full discharge process using Linear Combination Fitting (LCF), the appropriate reference spectra to include are the undischarged cell (pristine Fe3O4), the intermediate phase lithiated to 1.9 Li per mole of Fe3O4 (Li1.9Fe3O4), and Fe metal foil. These references are necessary because they represent the distinct structural stages the electrode undergoes during lithiation. Specifically, the pristine Fe3O4 converts completely to the intermediate Li1.9Fe3O4 phase during the initial 1.9 electrons of discharge. Subsequently, the Fe metal reference is required to model the final conversion reaction that only begins to occur after 2.7 electrons of discharge. | Must list the pristine/undischarged material (Fe3O4), the intermediate phase (Li1.9Fe3O4), and the final reduction product (Fe metal). |
| q3 | spectral | 25 | How does the Fe K-edge XANES spectrum of this sample (at 1.9 e-) compare to the pristine Fe3O4 spectrum, and what does this indicate about the average Fe oxidation state? | The Fe K-edge XANES spectrum of this sample at 1.9 electrons of discharge is shifted to a lower energy compared to the pristine Fe3O4 spectrum. This shift occurs because the electrochemical reduction of the cell linearly reduces the average Fe oxidation state to approximately +2 at this specific state of charge. The spectral shift directly reflects the complete phase change from the parent inverse-spinel Fe3O4 to an intermediate FeO-like Li1.9Fe3O4 structure, where all Fe atoms now occupy octahedral coordination sites. | Must state that the edge position shifts to lower energy compared to pristine Fe3O4, indicating a reduction of the Fe centers. Must note that the average Fe oxidation state at this point is approximately +2. |
| q4 | prediction | 25 | Upon further lithiation beyond 1.9 e- (up to 2.7 e-), the average Fe oxidation state remains constant despite continued electrochemical discharge. What does this suggest about the electrochemical reactions occurring in the cell? | The constant average Fe oxidation state of ~+2 between 1.9 and 2.7 electrons of discharge suggests that the applied electrochemical current is no longer reducing the iron species. Instead, this unchanging Fe K-edge position indicates the onset of electrolyte reduction and the formation of a solid electrolyte interphase (SEI). Because minimal conversion to Fe metal occurs until after 2.7 electrons, the electrons supplied to the cell during this intermediate discharge plateau are consumed by the electrolyte rather than driving further structural changes in the Li1.9Fe3O4 electrode. | Must explain that the constant oxidation state (unchanging edge position) suggests the onset of secondary/parasitic reactions, specifically electrolyte reduction and SEI formation, rather than further reduction of the Fe centers. |
Review
#602
Fe3O4
Fe K-edge
▶
LLM Prompt
Sample Information
Material: Fe3O4
Electrode Type: working electrode
Electrolyte: 1 M LiPF6 in EC/DMC (30/70)
Cell Type: pouch cell
Charge Discharge: discharging
C Rate: 64 mA/g
State Of Charge: 2.7 e-
Cycle Number: 1
Sample-Specific Conditions
- Electron Equiv.: 2.7
- Fe3O4 electrode during plateau region
Measurement
We plan to measure the Fe K-edge XANES spectrum of this sample.
Questions
Based on all the information above:
1. Based on the expected electrochemical conversion mechanism of Fe3O4, what reference spectra (basis functions) are required to accurately model the XANES spectrum of this sample using Linear Combination Fitting (LCF)?
2. Estimate the phase fractions of the iron-containing species in the electrode after discharging to 2.7 electron equivalents.
3. Explain the physical and electrochemical reasons why the phase composition (dominated by Li1.9Fe3O4) and the average iron oxidation state remain relatively constant between 1.9 and 2.7 electron equivalents of discharge, despite the continuous passage of current.
Ground Truth
Material: Fe3O4
Measurement: Operando XAS at the Fe K-edge (7112 eV) in transmission mode at beamline 8-ID at NSLS-II
Fit method: Linear combination fitting (LCF)
Phase fractions: (±10%)
| Phase | Fraction |
|---|---|
| Fe3O4 | 0.0 |
| Li1.9Fe3O4 | 0.98 |
| metallic_iron | 0.02 |
Fit basis (paper's reference spectra):
- undischarged cell (Fe3O4)
- cell lithiated to 1.9 Li per mole of Fe3O4 (Li1.9Fe3O4)
- Fe metal foil
Source evidence: Figure 7A and text on page 27
Key reasoning: During the initial 1.9 electrons of lithiation, the parent Fe3O4 phase converts to Li1.9Fe3O4 at a constant linear rate. Between 1.9 and 2.7 electrons, the Li1.9Fe3O4 phase remains the primary phase (>98%) and the average Fe oxidation state remains constant at approximately +2. This indicates minimal conversion to Fe metal in this region, suggesting that the electrochemical capacity delivered here is primarily due to the onset of electrolyte reduction (SEI formation) rather than Faradaic reduction of the iron centers.
Reasoning source: Section 3.8 Operando X-ray Absorption Spectroscopy (XAS), Page 27
Scoring Rubric (total: 100 pts)
| Q | Type | Max | Question | Reference Answer | Scoring Criteria |
|---|---|---|---|---|---|
| q1 | identification | 20 | Based on the expected electrochemical conversion mechanism of Fe3O4, what reference spectra (basis functions) are required to accurately model the XANES spectrum of this sample using Linear Combination Fitting (LCF)? | The required reference spectra for LCF are the undischarged cell (Fe3O4), a cell lithiated to 1.9 Li per mole of Fe3O4 (Li1.9Fe3O4), and Fe metal foil. Given the sample is an Fe3O4 working electrode discharged to 2.7 electron equivalents in a LiPF6 electrolyte, the initial parent phase (Fe3O4) converts to an intermediate lithiated phase (Li1.9Fe3O4) during the first 1.9 electrons of lithiation. Between 1.9 and 2.7 electron equivalents, the electrochemical capacity is primarily consumed by electrolyte reduction (SEI formation) rather than further Faradaic reduction of iron. Therefore, these three specific basis spectra are necessary to capture the initial material, the dominant intermediate phase formed before the plateau, and any trace metallic iron formed from minimal further reduction. | Full credit for identifying the initial phase (Fe3O4), the intermediate lithiated phase (Li1.9Fe3O4 or similar Fe(II) oxide intermediate), and the final reduction product (Fe metal). |
| q2 | quantification | 30 | Estimate the phase fractions of the iron-containing species in the electrode after discharging to 2.7 electron equivalents. | At a discharge state of 2.7 electron equivalents, the phase fractions are 0.0 for the initial Fe3O4, 0.98 for Li1.9Fe3O4, and 0.02 for metallic iron, with an uncertainty of 10%. These specific fractions arise because the parent Fe3O4 phase fully converts to Li1.9Fe3O4 during the initial 1.9 electrons of lithiation at a constant linear rate. As the cell continues discharging from 1.9 to 2.7 electron equivalents, the average Fe oxidation state remains constant at approximately +2, resulting in Li1.9Fe3O4 remaining the primary phase. The minimal 2% fraction of metallic iron occurs because the applied current in this region primarily drives the onset of electrolyte reduction (SEI formation) rather than the Faradaic reduction of the iron centers to Fe metal. | Full credit for stating that the intermediate Li1.9Fe3O4 phase is dominant (>95%) with minimal to no unreacted Fe3O4 and only trace amounts (≤2%) of metallic iron. |
| q3 | reasoning | 50 | Explain the physical and electrochemical reasons why the phase composition (dominated by Li1.9Fe3O4) and the average iron oxidation state remain relatively constant between 1.9 and 2.7 electron equivalents of discharge, despite the continuous passage of current. | The phase composition remains dominated by Li1.9Fe3O4 (>98%) and the average iron oxidation state stays constant at approximately +2 because the continuous passage of current is no longer driving the Faradaic reduction of the iron centers. In this Fe3O4 pouch cell discharged at 64 mA/g, the initial 1.9 electrons of lithiation fully convert the parent material to Li1.9Fe3O4. Between 1.9 and 2.7 electron equivalents during the plateau region, the electrochemical capacity delivered is instead primarily consumed by the onset of electrolyte reduction. This side reaction forms the solid electrolyte interphase (SEI) from the 1 M LiPF6 in EC/DMC electrolyte, explaining why the current does not produce significant amounts of Fe metal and the iron oxidation state remains unchanged. | Full credit for explaining that the constant oxidation state and phase composition indicate a pause in the Faradaic reduction of iron, and correctly attributing the passed charge in this region to parasitic side reactions, specifically electrolyte reduction and the formation of the solid electrolyte interphase (SEI). |
Review
#603
Fe3O4
Fe K-edge
▶
LLM Prompt
Sample Information
Material: Fe3O4
Electrode Type: working electrode
Electrolyte: 1 M LiPF6 in EC/DMC (30/70)
Cell Type: pouch cell
Charge Discharge: discharging
C Rate: 64 mA/g
State Of Charge: 3.1 e-
Cycle Number: 1
Sample-Specific Conditions
- Electron Equiv.: 3.1
- Fe3O4 electrode during conversion reaction
Measurement
We plan to measure the Fe K-edge XANES spectrum of this sample.
Questions
Based on all the information above:
1. What reference spectra (basis functions) are required to accurately model the Fe K-edge XANES spectrum of this Fe3O4 electrode during the conversion reaction using Linear Combination Fitting (LCF)?
2. Based on the state of charge (3.1 electron equivalents transferred), estimate the phase fractions of the components present in the electrode.
3. Explain the physical reasoning for the expected phase composition at 3.1 electron equivalents of discharge. Specifically, discuss the progression of the reaction mechanism from intercalation to conversion.
Ground Truth
Material: Fe3O4
Measurement: Operando XAS at the Fe K-edge (7112 eV) in transmission mode at beamline 8-ID at NSLS-II
Fit method: Linear combination fitting (LCF)
Phase fractions: (±10%)
| Phase | Fraction |
|---|---|
| Fe3O4 | 0.0 |
| Li1.9Fe3O4 | 0.9 |
| metallic_iron | 0.1 |
Fit basis (paper's reference spectra):
- undischarged cell (Fe3O4)
- cell lithiated to 1.9 Li per mole of Fe3O4 (Li1.9Fe3O4)
- Fe metal foil
Source evidence: Figure 7A, page 28
Key reasoning: During the initial stages of discharge, the parent Fe3O4 phase changes to an intermediate Li1.9Fe3O4 phase at a constant linear rate over the first 1.9 electrons. Upon further lithiation through 2.7 electrons, Li1.9Fe3O4 remains the primary phase (>98%), indicating minimal conversion to Fe metal. Between 2.7 and 8.3 electrons, the conversion reaction proceeds, marked by the emergence of the Fe metal phase and a concurrent decrease in Li1.9Fe3O4 phase intensity. Therefore, at 3.1 electrons, the sample is predominantly the intermediate Li1.9Fe3O4 phase with a small fraction of newly formed metallic iron.
Reasoning source: Section 3.8, page 27
Scoring Rubric (total: 100 pts)
| Q | Type | Max | Question | Reference Answer | Scoring Criteria |
|---|---|---|---|---|---|
| q1 | identification | 20 | What reference spectra (basis functions) are required to accurately model the Fe K-edge XANES spectrum of this Fe3O4 electrode during the conversion reaction using Linear Combination Fitting (LCF)? | The required reference spectra for Linear Combination Fitting (LCF) are the undischarged cell (Fe3O4), a cell lithiated to 1.9 Li per mole of Fe3O4 (Li1.9Fe3O4), and Fe metal foil. These specific phases are expected because the Fe3O4 working electrode is undergoing its first discharge cycle at a state of charge of 3.1 electron equivalents. During the initial discharge up to 1.9 electrons, the parent Fe3O4 phase fully transitions into the intermediate Li1.9Fe3O4 phase. Because the cell has discharged past 2.7 electrons to reach 3.1 electrons, the conversion reaction has just begun, necessitating the Fe metal foil reference to account for the newly emerging metallic iron phase alongside the dominant Li1.9Fe3O4 intermediate. | Full credit for identifying the three necessary reference states: the initial unreacted phase (Fe3O4), the intermediate lithiated phase (Li1.9Fe3O4 or similar FeO-like intermediate), and the final conversion product (Fe metal). |
| q2 | quantification | 40 | Based on the state of charge (3.1 electron equivalents transferred), estimate the phase fractions of the components present in the electrode. | At a state of charge of 3.1 electron equivalents, the estimated phase fractions are 0.0 for the initial Fe3O4 phase, 0.9 for the intermediate Li1.9Fe3O4 phase, and 0.1 for metallic iron, with an uncertainty of 10%. These specific values result from the progression of the lithiation mechanism during the first discharge cycle of the Fe3O4 electrode. By 1.9 electrons, the parent Fe3O4 is completely consumed to form Li1.9Fe3O4, which remains stable (>98%) up to 2.7 electrons. Because the current state of charge is 3.1 electrons, the cell has just entered the conversion reaction stage (which occurs between 2.7 and 8.3 electrons), resulting in a small 10% fraction of newly formed Fe metal and a corresponding decrease in the dominant Li1.9Fe3O4 phase to 90%. | Full credit for estimating ~0% initial Fe3O4, a dominant majority of the intermediate Li1.9Fe3O4 phase (~90%), and a minor fraction of metallic iron (~10%). Deduct points if Fe3O4 is estimated to be present in significant amounts or if the metallic iron fraction is overestimated. |
| q3 | reasoning | 40 | Explain the physical reasoning for the expected phase composition at 3.1 electron equivalents of discharge. Specifically, discuss the progression of the reaction mechanism from intercalation to conversion. | The expected phase composition of 90% Li1.9Fe3O4 and 10% metallic iron at 3.1 electron equivalents is dictated by the sequential lithiation mechanism of the Fe3O4 electrode during its first discharge. Initially, the parent Fe3O4 phase undergoes a structural change at a constant linear rate, converting entirely to an intermediate Li1.9Fe3O4 phase over the first 1.9 electrons. Upon further lithiation through 2.7 electrons, this intermediate phase remains highly stable (>98%), indicating minimal conversion to Fe metal. The actual conversion reaction only proceeds between 2.7 and 8.3 electrons, marked by the emergence of the Fe metal phase and a concurrent decrease in Li1.9Fe3O4 intensity. Therefore, at exactly 3.1 electrons, the intermediate phase is still predominantly present, while the conversion to metallic iron has only just begun. | Full credit for explaining that the initial ~2 electrons correspond to the formation of an intermediate lithiated phase (Li1.9Fe3O4) with minimal Fe reduction, and that the conversion to metallic Fe only begins after ~2.7 electrons. The answer must connect this mechanism to the fact that at 3.1 e-, the intermediate phase is still dominant but metallic Fe has just begun to form. |
Review
#604
Fe3O4
Fe K-edge
▶
LLM Prompt
Sample Information
Material: Fe3O4
Electrode Type: working electrode
Electrolyte: 1 M LiPF6 in EC/DMC (30/70)
Cell Type: pouch cell
Charge Discharge: discharging
C Rate: 64 mA/g
State Of Charge: 4.2 e-
Cycle Number: 1
Sample-Specific Conditions
- Electron Equiv.: 4.2
- Fe3O4 electrode during conversion reaction
Measurement
We plan to measure the Fe K-edge XANES spectrum of this sample.
Questions
Based on all the information above:
1. What candidate reference spectra are needed to perform Linear Combination Fitting (LCF) of the XANES data for this Fe3O4 electrode during its conversion reaction?
2. Based on the state of charge (4.2 electron equivalents transferred), estimate the phase fractions of the components in the electrode.
3. Explain the physical reasoning for the phase composition at 4.2 electron equivalents of discharge. Why is the original Fe3O4 phase absent, and what electrochemical reaction is actively occurring?
Ground Truth
Material: Fe3O4
Measurement: Operando XAS at the Fe K-edge (7112 eV) in transmission mode at beamline 8-ID at NSLS-II
Fit method: Linear combination fitting (LCF)
Phase fractions: (±10%)
| Phase | Fraction |
|---|---|
| Fe3O4 | 0.0 |
| Li1.9Fe3O4 | 0.75 |
| metallic_iron | 0.25 |
Fit basis (paper's reference spectra):
- undischarged cell (Fe3O4)
- cell lithiated to 1.9 Li per mole of Fe3O4 (Li1.9Fe3O4)
- Fe metal foil
Source evidence: Figure 7A, page 28
Key reasoning: During the initial 1.9 electrons of lithiation, the parent Fe3O4 phase converts to an intermediate Li1.9Fe3O4 phase at a constant linear rate. Between 2.7 and 8.3 electrons, the Li1.9Fe3O4 phase undergoes a conversion reaction to form Fe0 metal and Li2O. At 4.2 electron equivalents, the electrode is in the middle of this conversion process, resulting in a mixture of the intermediate Li1.9Fe3O4 phase and the emerging Fe metal phase, with the original Fe3O4 completely consumed.
Reasoning source: Section 3.8 (Operando X-ray Absorption Spectroscopy), pages 26-27
Scoring Rubric (total: 100 pts)
| Q | Type | Max | Question | Reference Answer | Scoring Criteria |
|---|---|---|---|---|---|
| q1 | identification | 20 | What candidate reference spectra are needed to perform Linear Combination Fitting (LCF) of the XANES data for this Fe3O4 electrode during its conversion reaction? | To perform Linear Combination Fitting (LCF) on this sample, the required reference spectra are the undischarged cell (Fe3O4), a cell lithiated to 1.9 Li per mole of Fe3O4 (Li1.9Fe3O4), and Fe metal foil. These specific references are necessary because of the sequential electrochemical reactions occurring during the first discharge cycle of the Fe3O4 electrode. During the initial 1.9 electrons of lithiation, the parent Fe3O4 phase converts to the intermediate Li1.9Fe3O4 phase. As the discharge progresses to the current state of 4.2 electron equivalents, this intermediate undergoes a conversion reaction to form Fe0 metal and Li2O, making these three iron-containing phases the exact basis set needed to capture the electrode's structural evolution. | Full credit requires identifying the initial phase (Fe3O4), the intermediate lithiated phase (Li1.9Fe3O4), and the final reduction product (Fe metal). |
| q2 | quantification | 40 | Based on the state of charge (4.2 electron equivalents transferred), estimate the phase fractions of the components in the electrode. | At a state of charge of 4.2 electron equivalents, the estimated phase fractions are 0% Fe3O4, 75% Li1.9Fe3O4, and 25% metallic iron, with an uncertainty of 10%. These specific values result directly from the lithiation mechanism of the Fe3O4 working electrode during its first discharge. The initial 1.9 electrons of lithiation completely consume the original Fe3O4 to form the Li1.9Fe3O4 intermediate, explaining the 0% Fe3O4 fraction. Because the cell is currently at 4.2 electron equivalents, it is actively in the middle of the subsequent conversion reaction (which occurs between 2.7 and 8.3 electrons), resulting in the partial reduction of the Li1.9Fe3O4 intermediate into the emerging 25% Fe metal phase. | Full credit requires stating that the original Fe3O4 is completely consumed (0%), and estimating the remaining composition as approximately 75% Li1.9Fe3O4 and 25% metallic Fe. |
| q3 | reasoning | 40 | Explain the physical reasoning for the phase composition at 4.2 electron equivalents of discharge. Why is the original Fe3O4 phase absent, and what electrochemical reaction is actively occurring? | The phase composition at 4.2 electron equivalents of discharge consists of a mixture of the intermediate Li1.9Fe3O4 phase and emerging Fe metal. The original Fe3O4 phase is completely absent because it is fully consumed during the initial 1.9 electrons of lithiation, where it converts to the Li1.9Fe3O4 intermediate at a constant linear rate. At the current state of charge of 4.2 electrons, the electrode is actively undergoing a conversion reaction that takes place between 2.7 and 8.3 electrons. During this specific stage of the discharge cycle, the Li1.9Fe3O4 intermediate is being progressively reduced to form Fe0 metal and Li2O, resulting in the observed intermediate-metal mixture. | Full credit requires explaining that Fe3O4 fully converts to an intermediate Li1.9Fe3O4 phase during the first ~1.9 electrons of discharge. Furthermore, it must be explained that beyond 2.7 electrons, this intermediate phase undergoes a conversion reaction to form Fe metal and Li2O, placing the 4.2 e- state squarely in the middle of this conversion process. |
Review
#605
Fe3O4
Fe K-edge
▶
LLM Prompt
Sample Information
Material: Fe3O4
Electrode Type: working electrode
Electrolyte: 1 M LiPF6 in EC/DMC (30/70)
Cell Type: pouch cell
Charge Discharge: discharging
C Rate: 64 mA/g
State Of Charge: 4.8 e-
Cycle Number: 1
Sample-Specific Conditions
- Electron Equiv.: 4.8
- Fe3O4 electrode during conversion reaction
Measurement
We plan to measure the Fe K-edge XANES spectrum of this sample.
Questions
Based on all the information above:
1. What reference spectra (basis functions) are required to accurately model the Fe K-edge XANES spectrum of this Fe3O4 electrode discharged to 4.8 electron equivalents using Linear Combination Fitting (LCF)?
2. Estimate the phase fractions of the Fe-containing species present in the electrode at this specific state of charge (4.8 e-).
3. Explain the electrochemical reasoning for the phase composition at 4.8 electron equivalents of discharge, detailing the progression of the conversion reaction.
Ground Truth
Material: Fe3O4
Measurement: Operando XAS at the Fe K-edge (7112 eV) in transmission mode at beamline 8-ID at NSLS-II
Fit method: Linear combination fitting (LCF)
Phase fractions: (±10%)
| Phase | Fraction |
|---|---|
| Fe3O4 | 0.0 |
| Li1.9Fe3O4 | 0.65 |
| metallic_iron | 0.35 |
Fit basis (paper's reference spectra):
- undischarged cell (Fe3O4)
- cell lithiated to 1.9 Li per mole of Fe3O4 (Li1.9Fe3O4)
- Fe metal foil
Source evidence: Figure 7A, page 28
Key reasoning: Upon further lithiation from 2.7-5.4 electrons, the Fe oxidation state decreases as the intermediate Li1.9Fe3O4 phase is converted to Fe0 and Li2O. At 4.8 electron equivalents, the conversion reaction is actively proceeding, resulting in a mixture dominated by the remaining Li1.9Fe3O4 and the newly formed metallic Fe phase, with the initial Fe3O4 having been completely consumed.
Reasoning source: Section 3.8 Operando X-ray Absorption Spectroscopy (XAS), page 27
Scoring Rubric (total: 100 pts)
| Q | Type | Max | Question | Reference Answer | Scoring Criteria |
|---|---|---|---|---|---|
| q1 | identification | 25 | What reference spectra (basis functions) are required to accurately model the Fe K-edge XANES spectrum of this Fe3O4 electrode discharged to 4.8 electron equivalents using Linear Combination Fitting (LCF)? | To accurately model the Fe K-edge XANES spectrum using LCF, the required reference spectra are the undischarged cell (Fe3O4), a cell lithiated to 1.9 Li per mole of Fe3O4 (Li1.9Fe3O4), and an Fe metal foil. These specific phases are expected because the Fe3O4 working electrode is undergoing a conversion reaction during its first discharge cycle. At the specific state of charge of 4.8 electron equivalents, the initial Fe3O4 has been completely consumed to form the intermediate Li1.9Fe3O4 phase. As lithiation progresses between 2.7 and 5.4 electrons, this intermediate phase actively converts into metallic Fe0 and Li2O, requiring the Li1.9Fe3O4 and Fe metal references to capture the resulting mixture. | Full points for identifying the initial unreacted phase (Fe3O4), the intermediate lithiated phase (Li1.9Fe3O4 or similar FeO-like intermediate), and the final conversion product (metallic Fe). |
| q2 | quantification | 40 | Estimate the phase fractions of the Fe-containing species present in the electrode at this specific state of charge (4.8 e-). | At a state of charge of 4.8 electron equivalents, the estimated phase fractions are 0.0 for Fe3O4, 0.65 for Li1.9Fe3O4, and 0.35 for metallic iron, with a fitting uncertainty of 10%. These specific values arise because the Fe3O4 electrode is undergoing a conversion reaction during the discharge process. By the time the cell reaches 4.8 electron equivalents, the initial Fe3O4 has been completely consumed, resulting in a 0.0 fraction. The remaining fractions reflect the active conversion of the intermediate Li1.9Fe3O4 phase into Fe0 and Li2O, resulting in a mixture dominated by the remaining intermediate (65%) and the newly formed metallic iron (35%). | Full points for estimating ~0% initial Fe3O4, ~65% intermediate Li1.9Fe3O4, and ~35% metallic Fe. Partial credit for correctly identifying that the initial phase is gone and the system is a mixture of the intermediate and metallic iron. |
| q3 | reasoning | 35 | Explain the electrochemical reasoning for the phase composition at 4.8 electron equivalents of discharge, detailing the progression of the conversion reaction. | The phase composition at 4.8 electron equivalents of discharge is driven by the progression of the conversion reaction in the Fe3O4 working electrode. Initially, the starting Fe3O4 material is completely consumed to form an intermediate Li1.9Fe3O4 phase. Upon further lithiation from 2.7 to 5.4 electrons, the Fe oxidation state decreases as this intermediate phase is converted into metallic Fe0 and Li2O. Consequently, at exactly 4.8 electron equivalents, the reaction is actively proceeding, resulting in a mixture that is dominated by the remaining Li1.9Fe3O4 (65%) and newly formed metallic Fe (35%), with no initial Fe3O4 remaining. | Full points for explaining that the initial intercalation/structural rearrangement to Li1.9Fe3O4 is complete, and the system is in the middle of the conversion reaction (2.7-5.4 e- region) where the intermediate Li1.9Fe3O4 is being actively reduced to Fe0 and Li2O. |
Review
#606
Fe3O4
Fe K-edge
▶
LLM Prompt
Sample Information
Material: Fe3O4
Electrode Type: working electrode
Electrolyte: 1 M LiPF6 in EC/DMC (30/70)
Cell Type: pouch cell
Charge Discharge: discharging
C Rate: 64 mA/g
State Of Charge: 6.0 e-
Cycle Number: 1
Sample-Specific Conditions
- Electron Equiv.: 6.0
- Fe3O4 electrode during conversion reaction
Measurement
We plan to measure the Fe K-edge XANES spectrum of this sample.
Questions
Based on all the information above:
1. What candidate reference spectra are needed to perform Linear Combination Fitting (LCF) of the XANES data for this Fe3O4 electrode during its conversion reaction?
2. Estimate the phase fractions of the Fe-containing species in the electrode at a state of charge of 6.0 electron equivalents.
3. Explain the physical reasoning for the expected phase composition at 6.0 electron equivalents during the first lithiation of Fe3O4.
Ground Truth
Material: Fe3O4
Measurement: Operando XAS at the Fe K-edge (7112 eV) in transmission mode at beamline 8-ID at NSLS-II
Fit method: Linear combination fitting (LCF)
Phase fractions: (±10%)
| Phase | Fraction |
|---|---|
| Fe3O4 | 0.0 |
| Li1.9Fe3O4 | 0.6 |
| metallic_iron | 0.4 |
Fit basis (paper's reference spectra):
- undischarged cell (Fe3O4)
- cell lithiated to 1.9 Li per mole of Fe3O4 (Li1.9Fe3O4)
- Fe metal foil
Source evidence: Figure 7A, page 28
Key reasoning: During the final region of discharge (5.4-8.3 electrons), the iron oxidation state continues to decrease as additional Fe metal is generated. The intermediate Li1.9Fe3O4 phase is converted to Fe0 and Li2O. At 6.0 electron equivalents, the conversion reaction is actively proceeding, resulting in a mixture of the remaining intermediate Li1.9Fe3O4 phase and the growing metallic Fe0 phase, with the initial Fe3O4 phase having been completely consumed.
Reasoning source: Section 3.8, pages 27-28
Scoring Rubric (total: 100 pts)
| Q | Type | Max | Question | Reference Answer | Scoring Criteria |
|---|---|---|---|---|---|
| q1 | identification | 20 | What candidate reference spectra are needed to perform Linear Combination Fitting (LCF) of the XANES data for this Fe3O4 electrode during its conversion reaction? | To perform Linear Combination Fitting (LCF) of the XANES data, the required reference spectra are the undischarged cell (Fe3O4), a cell lithiated to 1.9 Li per mole of Fe3O4 (Li1.9Fe3O4), and Fe metal foil. These specific references are needed because the sample is a Fe3O4 working electrode undergoing a conversion reaction during its first discharge. At a state of charge of 6.0 electron equivalents, the cell is in the final region of discharge (5.4-8.3 electrons) where the iron oxidation state continues to decrease. Consequently, the initial Fe3O4 phase has been completely consumed, and the intermediate Li1.9Fe3O4 phase is actively converting into metallic Fe0 and Li2O, necessitating these three basis spectra to capture the full structural evolution. | Full credit for identifying the initial phase (Fe3O4), the intermediate lithiated phase (Li1.9Fe3O4), and the final reduction product (Fe metal). |
| q2 | quantification | 40 | Estimate the phase fractions of the Fe-containing species in the electrode at a state of charge of 6.0 electron equivalents. | At a state of charge of 6.0 electron equivalents, the estimated phase fractions are 0.0 for Fe3O4, 0.6 for Li1.9Fe3O4, and 0.4 for metallic iron, with an uncertainty of 10%. These specific values result from the electrode being in the final region of its first discharge (between 5.4 and 8.3 electrons). Under these conditions, the conversion reaction is actively proceeding, meaning the initial Fe3O4 phase has already been completely consumed, resulting in a 0.0 fraction. The remaining composition is a mixture of the intermediate Li1.9Fe3O4 phase (0.6) that is actively being converted into the growing metallic Fe0 phase (0.4) as the iron oxidation state continues to decrease. | Full credit for estimating ~0% Fe3O4, ~60% Li1.9Fe3O4, and ~40% metallic iron. Partial credit if the trends are correct (Fe3O4 is gone, Li1.9Fe3O4 is the majority but decreasing, Fe metal is significant and growing) but values are off by more than 15%. |
| q3 | reasoning | 40 | Explain the physical reasoning for the expected phase composition at 6.0 electron equivalents during the first lithiation of Fe3O4. | During the first discharge of the Fe3O4 electrode at 64 mA/g, the cell undergoes a conversion reaction driven by lithiation. By the time the state of charge reaches 6.0 electron equivalents, the cell has entered the final region of discharge, which spans from 5.4 to 8.3 electrons. In this regime, the initial Fe3O4 material has been completely consumed, leaving no residual unreacted starting phase. The ongoing mechanism involves the intermediate Li1.9Fe3O4 phase converting into Fe0 and Li2O, which causes the overall iron oxidation state to continuously decrease. As a result, the final outcome at exactly 6.0 electrons is a mixed phase composition consisting of the remaining Li1.9Fe3O4 intermediate alongside a growing fraction of newly generated metallic Fe0. | Full credit for explaining that at this depth of discharge (>5.4 electrons), the initial Fe3O4 has been completely consumed, and the intermediate Li1.9Fe3O4 phase is undergoing a conversion reaction to form Fe0 metal and Li2O, resulting in a mixture of the intermediate and metallic iron. |
Review
#607
Fe3O4
Fe K-edge
▶
LLM Prompt
Sample Information
Material: Fe3O4
Electrode Type: working electrode
Electrolyte: 1 M LiPF6 in EC/DMC (30/70)
Cell Type: pouch cell
Charge Discharge: discharging
C Rate: 64 mA/g
State Of Charge: 6.6 e-
Cycle Number: 1
Sample-Specific Conditions
- Electron Equiv.: 6.6
- Fe3O4 electrode during conversion reaction
Measurement
We plan to measure the Fe K-edge XANES spectrum of this sample.
Questions
Based on all the information above:
1. What candidate reference spectra should be used as the basis for Linear Combination Fitting (LCF) of the XANES data for this Fe3O4 electrode during its conversion reaction?
2. Estimate the relative phase fractions of the components in the electrode at a deep state of discharge corresponding to 6.6 electron equivalents transferred.
3. Explain the electrochemical reasoning for why metallic iron is the dominant phase at 6.6 electron equivalents of discharge, and why an intermediate phase is still present.
Ground Truth
Material: Fe3O4
Measurement: Operando XAS at the Fe K-edge (7112 eV) in transmission mode at beamline 8-ID at NSLS-II
Fit method: Linear combination fitting (LCF)
Phase fractions: (±10%)
| Phase | Fraction |
|---|---|
| Fe3O4 | 0.0 |
| Li1.9Fe3O4 | 0.3 |
| metallic_iron | 0.7 |
Fit basis (paper's reference spectra):
- undischarged cell (Fe3O4)
- cell lithiated to 1.9 Li per mole of Fe3O4 (Li1.9Fe3O4)
- Fe metal foil
Source evidence: Figure 7A, page 28
Key reasoning: In the final region of the discharge (5.4-8.3 electrons), the iron oxidation state continues to decrease as additional Fe metal is generated. The conversion reaction proceeds as the intermediate Li1.9Fe3O4 phase is converted to Fe0 and Li2O. Consequently, Fe0 metal becomes the principal phase in the discharged electrode, while the intermediate phase fraction steadily decreases and the initial Fe3O4 is completely consumed.
Reasoning source: Section 3.8 (Operando X-ray Absorption Spectroscopy), pages 27-28
Scoring Rubric (total: 100 pts)
| Q | Type | Max | Question | Reference Answer | Scoring Criteria |
|---|---|---|---|---|---|
| q1 | identification | 25 | What candidate reference spectra should be used as the basis for Linear Combination Fitting (LCF) of the XANES data for this Fe3O4 electrode during its conversion reaction? | The candidate reference spectra for Linear Combination Fitting (LCF) should include the undischarged cell (Fe3O4), a cell lithiated to 1.9 Li per mole of Fe3O4 (Li1.9Fe3O4), and Fe metal foil. These specific phases are expected because the Fe3O4 working electrode is undergoing a conversion reaction during its first discharge cycle. At a deep discharge state of 6.6 electron equivalents, the initial Fe3O4 is completely consumed and converted into an intermediate Li1.9Fe3O4 phase. This intermediate phase is subsequently converted into Fe0 metal and Li2O, making these three references necessary to capture the full structural evolution of the electrode. | Full points for identifying the three necessary reference states: the initial unreacted phase (Fe3O4), an intermediate lithiated phase (Li1.9Fe3O4 or FeO-like), and the final conversion product (Fe metal). |
| q2 | quantification | 35 | Estimate the relative phase fractions of the components in the electrode at a deep state of discharge corresponding to 6.6 electron equivalents transferred. | At a deep discharge state of 6.6 electron equivalents, the estimated phase fractions are 0% Fe3O4, 30% Li1.9Fe3O4, and 70% metallic iron, with an uncertainty of 10%. These specific values result from the electrode being in the final region of the discharge process, which spans from 5.4 to 8.3 electrons. Under these conditions, the initial Fe3O4 has been completely consumed, resulting in a 0% fraction. The conversion reaction proceeds by converting the intermediate Li1.9Fe3O4 phase into Fe0 and Li2O, which explains why the intermediate phase fraction has decreased to 30% while metallic iron has accumulated to become the principal phase at 70%. | Full points for estimating approximately 70% metallic iron, 30% intermediate lithiated phase (Li1.9Fe3O4), and 0% unreacted Fe3O4. Deduct points proportionally for estimates deviating by more than 10% from these values. |
| q3 | reasoning | 40 | Explain the electrochemical reasoning for why metallic iron is the dominant phase at 6.6 electron equivalents of discharge, and why an intermediate phase is still present. | At 6.6 electron equivalents of discharge, the Fe3O4 electrode is in the final region of its conversion reaction, which occurs between 5.4 and 8.3 electrons. During this deep discharge stage, the iron oxidation state continuously decreases as the intermediate Li1.9Fe3O4 phase is electrochemically converted into Fe0 and Li2O. Because the initial Fe3O4 is already completely consumed, metallic iron accumulates and becomes the dominant phase at 70%. However, the conversion reaction is not yet complete at 6.6 electrons, which is why a residual 30% fraction of the intermediate Li1.9Fe3O4 phase is still present and steadily decreasing. | Full points for explaining that at this late stage of discharge (>5.4 e-), the conversion reaction is actively converting the intermediate Li1.9Fe3O4 phase into Fe0 metal and Li2O. This makes Fe0 the principal phase, while a fraction of the intermediate remains unconverted and the initial Fe3O4 has already been fully consumed. |
Review
#608
Fe3O4
Fe K-edge
▶
LLM Prompt
Sample Information
Material: Fe3O4
Electrode Type: working electrode
Electrolyte: 1 M LiPF6 in EC/DMC (30/70)
Cell Type: pouch cell
Charge Discharge: discharging
C Rate: 64 mA/g
State Of Charge: 7.2 e-
Cycle Number: 1
Sample-Specific Conditions
- Electron Equiv.: 7.2
- Fe3O4 electrode during conversion reaction
Measurement
We plan to measure the Fe K-edge XANES spectrum of this sample.
Questions
Based on all the information above:
1. What reference spectra are appropriate for modeling the Fe K-edge XANES of this Fe3O4 electrode during its conversion reaction via linear combination fitting?
2. Given the deep state of charge (7.2 e- transferred out of a theoretical 8.0 e-), estimate the phase fractions of the components present in the electrode.
3. Explain the physical reasoning for the expected phase composition at this specific depth of discharge (7.2 e-), detailing the status of the initial material, intermediates, and products.
Ground Truth
Material: Fe3O4
Measurement: Operando XAS at the Fe K-edge (7112 eV) in transmission mode at beamline 8-ID at NSLS-II
Fit method: Linear combination fitting (LCF)
Phase fractions: (±10%)
| Phase | Fraction |
|---|---|
| Fe3O4 | 0.0 |
| Li1.9Fe3O4 | 0.35 |
| metallic_iron | 0.65 |
Fit basis (paper's reference spectra):
- undischarged cell (Fe3O4)
- cell lithiated to 1.9 Li per mole of Fe3O4 (Li1.9Fe3O4)
- Fe metal foil
Source evidence: Figure 7A, page 28
Key reasoning: At 7.2 electron equivalents of discharge, the conversion reaction is in its final stages (Region IV). The parent Fe3O4 phase was completely consumed earlier in the discharge. The intermediate phase Li1.9Fe3O4 is being actively converted into metallic Fe0 and Li2O, resulting in a mixture dominated by the product Fe metal with a smaller remaining fraction of the intermediate.
Reasoning source: Section 3.8, page 27
Scoring Rubric (total: 100 pts)
| Q | Type | Max | Question | Reference Answer | Scoring Criteria |
|---|---|---|---|---|---|
| q1 | identification | 25 | What reference spectra are appropriate for modeling the Fe K-edge XANES of this Fe3O4 electrode during its conversion reaction via linear combination fitting? | The appropriate reference spectra for modeling the Fe K-edge XANES via linear combination fitting are the undischarged cell (Fe3O4), a cell lithiated to 1.9 Li per mole of Fe3O4 (Li1.9Fe3O4), and Fe metal foil. These references are necessary because the sample is an Fe3O4 working electrode undergoing a conversion reaction during its first discharge cycle. At the deep discharge state of 7.2 electron equivalents, the reaction is in its final stages (Region IV). Therefore, the fitting basis must capture the initial parent material (Fe3O4), the intermediate phase formed during lithiation (Li1.9Fe3O4), and the final metallic product (Fe0) generated as the intermediate is actively converted. | Full points for identifying the initial state (Fe3O4/undischarged), the intermediate state (Li1.9Fe3O4), and the final product state (Fe metal foil). |
| q2 | quantification | 40 | Given the deep state of charge (7.2 e- transferred out of a theoretical 8.0 e-), estimate the phase fractions of the components present in the electrode. | The estimated phase fractions for the electrode are 0.0 for the initial Fe3O4, 0.35 for the intermediate Li1.9Fe3O4, and 0.65 for metallic iron, with an uncertainty of 10%. These specific values arise because the cell has been discharged to 7.2 electron equivalents, placing the conversion reaction in its final stages (Region IV). At this deep state of discharge, the parent Fe3O4 phase was completely consumed earlier in the process, yielding a fraction of zero. The remaining composition is dominated by the 65% metallic Fe product, which forms as the remaining 35% of the intermediate Li1.9Fe3O4 is actively converted into Fe0 and Li2O. | Full points for estimating ~0% Fe3O4, ~35% Li1.9Fe3O4, and ~65% metallic iron. Partial credit if the trends are correct (Fe metal > Li1.9Fe3O4 > Fe3O4) but values deviate by more than 10%. |
| q3 | reasoning | 35 | Explain the physical reasoning for the expected phase composition at this specific depth of discharge (7.2 e-), detailing the status of the initial material, intermediates, and products. | The expected phase composition of 0% Fe3O4, 35% Li1.9Fe3O4, and 65% metallic Fe is dictated by the electrode reaching 7.2 electron equivalents during its first discharge cycle. At this specific depth of discharge, the Fe3O4 conversion reaction is in its final stages, known as Region IV. The initial parent material, Fe3O4, was completely consumed earlier in the discharge process, explaining why none remains. The intermediate phase, Li1.9Fe3O4, is actively being converted into the final products of metallic Fe0 and Li2O. This mechanism logically results in a mixture that is dominated by the final Fe metal product, with only a smaller remaining fraction of the intermediate phase. | Full points for explaining that the initial Fe3O4 is completely consumed, and the intermediate Li1.9Fe3O4 is undergoing conversion into the final products (Fe metal and Li2O), making Fe metal the dominant phase. |
Review
#609
Fe3O4
Fe K-edge
▶
LLM Prompt
Sample Information
Material: Fe3O4
Electrode Type: working electrode
Electrolyte: 1 M LiPF6 in EC/DMC (30/70)
Cell Type: pouch cell
Charge Discharge: discharging
C Rate: 64 mA/g
State Of Charge: 7.7 e-
Cycle Number: 1
Sample-Specific Conditions
- Electron Equiv.: 7.7
- Fe3O4 electrode near end of discharge
Measurement
We plan to measure the Fe K-edge XANES spectrum of this sample.
Questions
Based on all the information above:
1. What candidate reference spectra are required to construct an appropriate basis for Linear Combination Fitting (LCF) of the Fe K-edge XANES spectrum for this Fe3O4 electrode during its first discharge?
2. Estimate the phase fractions of the Fe-containing species in the electrode at a deep discharge state of 7.7 electron equivalents.
3. Explain the electrochemical conversion mechanism that leads to the expected phase composition at 7.7 electron equivalents.
Ground Truth
Material: Fe3O4
Measurement: Operando XAS at the Fe K-edge (7112 eV) in transmission mode at beamline 8-ID at NSLS-II
Fit method: Linear combination fitting (LCF)
Phase fractions: (±10%)
| Phase | Fraction |
|---|---|
| Fe3O4 | 0.0 |
| Li1.9Fe3O4 | 0.15 |
| metallic_iron | 0.85 |
Fit basis (paper's reference spectra):
- undischarged cell (Fe3O4)
- cell lithiated to 1.9 Li per mole of Fe3O4 (Li1.9Fe3O4)
- Fe metal foil
Source evidence: Figure 7A, page 28
Key reasoning: At 7.7 electron equivalents, the electrode is in the final region of discharge (5.4-8.3 electrons). In this regime, the intermediate Li1.9Fe3O4 phase is undergoing deep conversion to Fe0 metal and Li2O. Consequently, the iron oxidation state continues to decrease, and Fe0 becomes the predominant phase, with only a small residual fraction of the intermediate Li1.9Fe3O4 remaining and no unreacted Fe3O4.
Reasoning source: Section 3.8, page 27
Scoring Rubric (total: 100 pts)
| Q | Type | Max | Question | Reference Answer | Scoring Criteria |
|---|---|---|---|---|---|
| q1 | identification | 20 | What candidate reference spectra are required to construct an appropriate basis for Linear Combination Fitting (LCF) of the Fe K-edge XANES spectrum for this Fe3O4 electrode during its first discharge? | To construct an appropriate basis for Linear Combination Fitting (LCF) of the Fe K-edge XANES spectrum, the required reference spectra are the undischarged cell (Fe3O4), a cell lithiated to 1.9 Li per mole of Fe3O4 (Li1.9Fe3O4), and Fe metal foil. These specific references are necessary because of the sample's deep discharge state of 7.7 electron equivalents during its first cycle. At this specific condition, the electrode is in the final region of discharge (5.4-8.3 electrons), where the intermediate Li1.9Fe3O4 phase undergoes deep conversion to Fe0 metal and Li2O. Therefore, the fitting basis must account for the initial starting material, the lithiated intermediate, and the final metallic iron product dictated by this conversion mechanism. | Full credit for identifying the initial phase (Fe3O4), an intermediate lithiated phase (Li1.9Fe3O4), and the final reduction product (Fe metal). |
| q2 | quantification | 40 | Estimate the phase fractions of the Fe-containing species in the electrode at a deep discharge state of 7.7 electron equivalents. | At a deep discharge state of 7.7 electron equivalents, the estimated phase fractions are 85% metallic iron (Fe0), 15% intermediate Li1.9Fe3O4, and 0% unreacted Fe3O4, with an uncertainty of 10%. These specific values result directly from the electrode reaching the final region of discharge (5.4-8.3 electrons) during its first cycle at 64 mA/g. Under these conditions, the intermediate Li1.9Fe3O4 phase undergoes deep electrochemical conversion to Fe0 metal and Li2O, causing the iron oxidation state to decrease significantly. Consequently, metallic iron becomes the predominant phase, leaving only a small residual fraction of the intermediate Li1.9Fe3O4 and completely consuming the initial Fe3O4 material. | Full credit for estimating ~85% metallic iron (Fe0) and ~15% intermediate lithiated phase (Li1.9Fe3O4), with ~0% unreacted Fe3O4. Deduct points for estimates outside a +/- 10% absolute margin. |
| q3 | reasoning | 40 | Explain the electrochemical conversion mechanism that leads to the expected phase composition at 7.7 electron equivalents. | During the first discharge of the Fe3O4 electrode at 64 mA/g, the cell reaches a deep state of charge of 7.7 electron equivalents. This specific condition places the electrode in the final region of discharge, which spans from 5.4 to 8.3 electrons. In this regime, the electrochemical mechanism involves the deep conversion of the intermediate Li1.9Fe3O4 phase into Fe0 metal and Li2O. As a result of this conversion mechanism, the iron oxidation state continues to decrease until metallic iron becomes the predominant phase. The final outcome of this process is a composition dominated by 85% Fe0, with only a small 15% residual fraction of the Li1.9Fe3O4 intermediate remaining and no unreacted Fe3O4. | Full credit for explaining that at this late stage of discharge, the intermediate lithiated phase (Li1.9Fe3O4) is being deeply converted into Fe0 metal and Li2O, making metallic iron the predominant phase while the initial Fe3O4 has been completely consumed. |
Review
Effects of Molecular and Electronic Structures in CoOx/CeO2 Catalysts on NO Reduction by CO
BNL-NSLS-II-8-ID
Catalyst
Shuhao Zhang et al.
DOI: 10.1021/acs.jpcc.8b12442
7 scenarios
▶
#610
CoOx/CeO2
Co K-edge
▶
LLM Prompt
Sample Information
Material: CoOx/CeO2
Support: CeO2
Reaction Conditions: He, RT
Sample-Specific Conditions
- Atmosphere and Temperature: He at RT
- In-situ XAS of 7.1 Co/nm2 catalyst under He at room temperature
Measurement
We plan to measure the Co K-edge XANES spectrum of this sample.
Questions
Based on all the information above:
1. Based on the sample conditions (He at RT), what is the dominant Co phase present in the 7.1 Co/nm2 CoOx/CeO2 catalyst, and what physical reasoning explains this state?
2. What reference spectra should be used as the basis for linear combination fitting to model the structural evolution of this catalyst from its initial state to its state under reaction conditions?
Ground Truth
Material: CoOx/CeO2
Measurement: Co K-edge in-situ XAS in fluorescence mode at SSRL BL 2-2 or NSLS-II ISS
Fit method: Linear combination analysis
Phase fractions: (±10%)
| Phase | Fraction |
|---|---|
| Co3O4 | 1.0 |
| CoO | 0.0 |
Fit basis (paper's reference spectra):
- Co3O4
- CoO
Source evidence: Figure 5a and 5b, page 20-21
Key reasoning: Under helium at room temperature, the as-prepared 7.1 Co/nm2 catalyst maintains its initial oxidized state. The XANES spectrum is almost identical to that of bulk Co3O4, indicating that the Co species are predominantly in the Co3O4-like phase (Co3+) before exposure to reducing conditions or high temperatures.
Reasoning source: Section 3.4, page 19-20
Scoring Rubric (total: 100 pts)
| Q | Type | Max | Question | Reference Answer | Scoring Criteria |
|---|---|---|---|---|---|
| q1 | reasoning | 57 | Based on the sample conditions (He at RT), what is the dominant Co phase present in the 7.1 Co/nm2 CoOx/CeO2 catalyst, and what physical reasoning explains this state? | The dominant Co phase present in the 7.1 Co/nm2 CoOx/CeO2 catalyst is Co3O4, which accounts for a 1.0 (100%) fraction of the composition. This state arises because, under the inert helium atmosphere at room temperature, the as-prepared catalyst maintains its initial oxidized state. Since the sample has not yet been exposed to reducing conditions or elevated temperatures, the cobalt species remain predominantly in the Co3O4-like phase (Co3+). Consequently, the measured Co K-edge XANES spectrum is almost identical to that of bulk Co3O4. | Full credit for identifying Co3O4 as the dominant phase (~100%) and explaining that under inert conditions at room temperature, the as-prepared catalyst retains its initial oxidized state. |
| q2 | identification | 43 | What reference spectra should be used as the basis for linear combination fitting to model the structural evolution of this catalyst from its initial state to its state under reaction conditions? | The reference spectra that should be used as the basis for linear combination fitting are Co3O4 and CoO. Under the initial sample conditions of helium at room temperature, the as-prepared 7.1 Co/nm2 catalyst maintains its fully oxidized state, meaning the initial spectrum is almost identical to bulk Co3O4 (1.0 fraction). The CoO reference is included in the basis to model any subsequent structural evolution or reduction of the Co3+ species from this initial state. Together, these references capture the transition from the predominantly Co3O4-like phase present before the catalyst is exposed to reducing conditions or high temperatures. | Full credit for identifying Co3O4 and CoO as the necessary reference spectra. |
Review
#611
CoOx/CeO2
Co K-edge
▶
LLM Prompt
Sample Information
Material: CoOx/CeO2
Support: CeO2
Reaction Conditions: He, 400°C
Sample-Specific Conditions
- Atmosphere and Temperature: He at 400°C
- In-situ XAS of 7.1 Co/nm2 catalyst under He at 400°C
Measurement
We plan to measure the Co K-edge XANES spectrum of this sample.
Questions
Based on all the information above:
1. What candidate reference spectra should be included in a linear combination fitting (LCF) model to analyze the Co K-edge XANES spectrum of this sample?
2. Estimate the phase fractions of the Co species present in the 7.1 Co/nm2 CoOx/CeO2 catalyst under He at 400°C.
3. Based on the physical and chemical properties of the system, explain why this specific phase composition is expected for the catalyst under He at 400°C.
Ground Truth
Material: CoOx/CeO2
Measurement: Co K-edge in-situ XAS (fluorescence mode)
Fit method: Linear combination fitting (LCF)
Phase fractions: (±10%)
| Phase | Fraction |
|---|---|
| Co3O4 | 0.95 |
| CoO | 0.05 |
Fit basis (paper's reference spectra):
- Co3O4
- CoO
Source evidence: Figure 5b, page 21
Key reasoning: For the high-loading 7.1 Co/nm2 sample, the initial state after calcination is predominantly Co3O4. When heated to 400°C in an inert Helium atmosphere, the catalyst does not undergo significant reduction. The XANES spectrum remains almost identical to that of bulk Co3O4, indicating that the spinel structure is stable under these non-reducing conditions.
Reasoning source: Section 3.4, page 20
Scoring Rubric (total: 100 pts)
| Q | Type | Max | Question | Reference Answer | Scoring Criteria |
|---|---|---|---|---|---|
| q1 | identification | 20 | What candidate reference spectra should be included in a linear combination fitting (LCF) model to analyze the Co K-edge XANES spectrum of this sample? | The linear combination fitting (LCF) model for the Co K-edge XANES spectrum should include Co3O4 and CoO as candidate reference spectra. These specific phases are expected because the high-loading 7.1 Co/nm2 sample is initially predominantly Co3O4 after calcination. When heated to 400°C in an inert Helium atmosphere, the catalyst does not undergo significant reduction. Therefore, the stable spinel Co3O4 structure dominates the composition, with only a minor contribution from CoO expected under these non-reducing conditions. | Full points for identifying Co3O4 and CoO as the necessary reference spectra. |
| q2 | quantification | 40 | Estimate the phase fractions of the Co species present in the 7.1 Co/nm2 CoOx/CeO2 catalyst under He at 400°C. | The estimated phase fractions for the 7.1 Co/nm2 catalyst under He at 400°C are 95% Co3O4 and 5% CoO, with an uncertainty of 10%. These specific values result from the fact that the initial state of this high-loading catalyst is predominantly Co3O4. Because the 400°C treatment is performed in an inert Helium atmosphere rather than a reducing environment, the catalyst resists significant reduction. Consequently, the spinel Co3O4 structure remains highly stable, yielding a spectrum almost identical to bulk Co3O4 and leaving only a trace 5% fraction of CoO. | Full points if the estimated fractions are within ±10% of Co3O4 (0.95) and CoO (0.05). Partial points for identifying Co3O4 as the overwhelmingly dominant phase (>80%). |
| q3 | reasoning | 40 | Based on the physical and chemical properties of the system, explain why this specific phase composition is expected for the catalyst under He at 400°C. | The expected phase composition of 95% Co3O4 and 5% CoO is driven by the catalyst's high loading and the inert reaction conditions. For the 7.1 Co/nm2 CoOx/CeO2 sample, the initial state following calcination is predominantly the Co3O4 spinel phase. When the system is heated to 400°C in an inert Helium atmosphere, there is no chemical driving force for significant reduction. As a result, the spinel structure remains highly stable under these non-reducing conditions, producing a XANES spectrum that is almost identical to bulk Co3O4 with only a minimal presence of CoO. | Full points for explaining that the high-loading sample forms Co3O4 after calcination, and that heating in an inert (He) atmosphere to 400°C does not provide the reducing conditions necessary to alter this stable spinel structure. |
Review
#612
CoOx/CeO2
Co K-edge
▶
LLM Prompt
Sample Information
Material: CoOx/CeO2
Support: CeO2
Reaction Conditions: NO+CO (1:1), 400°C
Sample-Specific Conditions
- Atmosphere and Temperature: NO+CO at 400°C
- In-situ XAS of 7.1 Co/nm2 catalyst under NO+CO at 400°C
Measurement
We plan to measure the Co K-edge XANES spectrum of this sample.
Questions
Based on all the information above:
1. What reference spectra are required to model the Co K-edge XANES spectrum of this catalyst under NO+CO at 400°C using linear combination fitting?
2. Based on the reaction conditions (NO+CO at 400°C), estimate the phase fractions of the Co species present in the catalyst.
3. Explain why the catalyst exhibits this specific phase composition under NO+CO at 400°C, and how the composition is expected to change at lower temperatures.
Ground Truth
Material: CoOx/CeO2
Measurement: Co K-edge in-situ fluorescence mode at SSRL BL 2-2 or NSLS-II ISS
Fit method: Linear combination fitting (LCF)
Phase fractions: (±10%)
| Phase | Fraction |
|---|---|
| Co3O4 | 0.9 |
| CoO | 0.1 |
Fit basis (paper's reference spectra):
- Co3O4
- CoO
Source evidence: Figure 5b and Section 3.4, page 19-20
Key reasoning: Under NO+CO at 400°C, the catalyst remains highly oxidized, with the XANES spectrum almost identical to that of Co3O4. The linear combination fitting confirms that the sample is predominantly Co3O4 (~90%) with a minor fraction of CoO (~10%). Significant reduction to CoO only occurs when the temperature drops below 300°C.
Reasoning source: Section 3.4, page 19-20
Scoring Rubric (total: 100 pts)
| Q | Type | Max | Question | Reference Answer | Scoring Criteria |
|---|---|---|---|---|---|
| q1 | identification | 30 | What reference spectra are required to model the Co K-edge XANES spectrum of this catalyst under NO+CO at 400°C using linear combination fitting? | To model the Co K-edge XANES spectrum of the CoOx/CeO2 catalyst under NO+CO at 400°C, reference spectra for Co3O4 and CoO are required. These specific phases are expected because the catalyst remains highly oxidized under these specific reaction conditions. At 400°C in the NO+CO (1:1) atmosphere, the environment prevents significant reduction of the cobalt species, resulting in a spectrum almost identical to Co3O4. Significant reduction to CoO would only occur if the temperature were to drop below 300°C, explaining why only a minor CoO reference component is needed for the linear combination fitting. | Full points for identifying Co3O4 and CoO as the necessary reference spectra. |
| q2 | quantification | 40 | Based on the reaction conditions (NO+CO at 400°C), estimate the phase fractions of the Co species present in the catalyst. | Based on the reaction conditions, the estimated phase fractions for the CoOx/CeO2 catalyst are approximately 90% Co3O4 and 10% CoO, with an uncertainty of 10%. These specific values arise because the catalyst remains highly oxidized under the NO+CO (1:1) atmosphere at 400°C. The elevated temperature of 400°C prevents the significant reduction of the cobalt species that is observed at lower temperatures. Since significant reduction to CoO only happens when the temperature drops below 300°C, the sample retains a predominantly Co3O4 composition under the specified 400°C conditions. | Full points for estimating ~90% Co3O4 and ~10% CoO. Partial credit for identifying Co3O4 as the dominant phase (>80%). |
| q3 | reasoning | 30 | Explain why the catalyst exhibits this specific phase composition under NO+CO at 400°C, and how the composition is expected to change at lower temperatures. | Under the NO+CO (1:1) atmosphere at 400°C, the CoOx/CeO2 catalyst exhibits a predominantly Co3O4 phase composition (~90%) with a minor CoO fraction (~10%) because the system remains highly oxidized. The specific reaction conditions at 400°C do not induce significant reduction of the cobalt species, causing the XANES spectrum to be almost identical to that of pure Co3O4. The logical outcome of these conditions is a stable, highly oxidized catalyst where the Co3O4 phase dominates. However, this composition is expected to change at lower temperatures; specifically, significant reduction to CoO will occur when the temperature drops below 300°C. | Full points for explaining that the catalyst remains highly oxidized (Co3O4-like) at 400°C under NO+CO, and that significant reduction to CoO only occurs at lower temperatures (<300°C). |
Review
#613
CoOx/CeO2
Co K-edge
▶
LLM Prompt
Sample Information
Material: CoOx/CeO2
Support: CeO2
Reaction Conditions: NO+CO (1:1), 300°C
Sample-Specific Conditions
- Atmosphere and Temperature: NO+CO at 300°C
- In-situ XAS of 7.1 Co/nm2 catalyst under NO+CO at 300°C
Measurement
We plan to measure the Co K-edge XANES spectrum of this sample.
Questions
Based on all the information above:
1. What reference spectra are required to perform a linear combination fitting (LCF) analysis of the Co K-edge XANES spectrum for this catalyst under the specified conditions?
2. Estimate the phase fractions of the Co species present in the 7.1 Co/nm2 CoOx/CeO2 catalyst under NO+CO at 300°C.
3. Explain the physical reasoning for the observed phase composition at 300°C under NO+CO, and how it compares to the expected composition at lower temperatures (e.g., < 300°C).
Ground Truth
Material: CoOx/CeO2
Measurement: Co K-edge in-situ XAS, fluorescence mode, SSRL BL 2-2 / NSLS-II ISS
Fit method: Linear combination fitting (LCF)
Phase fractions: (±10%)
| Phase | Fraction |
|---|---|
| Co3O4 | 0.85 |
| CoO | 0.15 |
Fit basis (paper's reference spectra):
- Co3O4
- CoO
Source evidence: Figure 5b, page 21
Key reasoning: In-situ XANES spectra under reacting gases (NO+CO) at 400°C and 300°C were very similar to that of Co3O4. Linear combination fitting reveals that the fraction of Co3O4 dramatically decreases and CoO increases only when the temperature drops below 300°C. At 300°C, the catalyst is still predominantly Co3O4 (~85%) with a minor fraction of CoO (~15%) beginning to form as the surface Co3O4 is gradually reduced by CO.
Reasoning source: Section 3.4, page 20 and Figure 5b, page 21
Scoring Rubric (total: 100 pts)
| Q | Type | Max | Question | Reference Answer | Scoring Criteria |
|---|---|---|---|---|---|
| q1 | identification | 20 | What reference spectra are required to perform a linear combination fitting (LCF) analysis of the Co K-edge XANES spectrum for this catalyst under the specified conditions? | To perform a linear combination fitting (LCF) analysis of the Co K-edge XANES spectrum for this sample, reference spectra for Co3O4 and CoO are required. These specific phases are expected because the 7.1 Co/nm2 CoOx/CeO2 catalyst is exposed to a reacting gas mixture of NO+CO (1:1) at 300°C. Under these conditions, the catalyst remains predominantly in the Co3O4 phase, similar to its state at higher temperatures like 400°C. However, the presence of CO in the gas mixture acts as a reducing agent, necessitating the CoO reference to account for the minor fraction of surface Co3O4 that is gradually reduced at 300°C. | Full credit for identifying bulk Co3O4 and bulk CoO as the necessary reference spectra. |
| q2 | quantification | 40 | Estimate the phase fractions of the Co species present in the 7.1 Co/nm2 CoOx/CeO2 catalyst under NO+CO at 300°C. | Under NO+CO (1:1) at 300°C, the phase fractions of the Co species in the 7.1 Co/nm2 CoOx/CeO2 catalyst are estimated to be approximately 85% Co3O4 and 15% CoO, with an uncertainty of 10%. These specific values result from the temperature-dependent reduction behavior of the catalyst in this reacting gas mixture. At 300°C, the temperature is not yet low enough to cause a dramatic phase shift, leaving the material predominantly as Co3O4. The 15% CoO fraction arises specifically because the CO in the gas mixture is just beginning to gradually reduce the surface of the Co3O4 phase at this temperature. | Full credit for estimating ~85% Co3O4 and ~15% CoO. Partial credit for identifying Co3O4 as the dominant phase with a minor CoO component. |
| q3 | reasoning | 40 | Explain the physical reasoning for the observed phase composition at 300°C under NO+CO, and how it compares to the expected composition at lower temperatures (e.g., < 300°C). | The observed phase composition of ~85% Co3O4 and ~15% CoO at 300°C is driven by the interaction between the 7.1 Co/nm2 CoOx/CeO2 catalyst and the NO+CO (1:1) reacting gas mixture. At 300°C and above (e.g., 400°C), the catalyst is relatively stable and the in-situ XANES spectra remain very similar to pure Co3O4. The minor 15% CoO fraction emerges because the CO in the gas mixture acts as a reducing agent, gradually reducing the surface Co3O4 to CoO. When the temperature drops below 300°C, this reduction mechanism becomes much more pronounced, leading to a dramatic decrease in the Co3O4 fraction and a corresponding significant increase in CoO. | Full credit for explaining that at 300°C, the catalyst remains predominantly Co3O4, and that significant reduction to CoO by CO only occurs when the temperature drops below 300°C. |
Review
#614
CoOx/CeO2
Co K-edge
▶
LLM Prompt
Sample Information
Material: CoOx/CeO2
Support: CeO2
Reaction Conditions: NO+CO (1:1), 200°C
Sample-Specific Conditions
- Atmosphere and Temperature: NO+CO at 200°C
- In-situ XAS of 7.1 Co/nm2 catalyst under NO+CO at 200°C
Measurement
We plan to measure the Co K-edge XANES spectrum of this sample.
Questions
Based on all the information above:
1. What reference spectra are required to model the Co K-edge XANES spectrum of this catalyst under the specified reaction conditions using linear combination fitting?
2. Based on the reaction conditions (NO+CO at 200°C) for the 7.1 Co/nm2 CoOx/CeO2 catalyst, estimate the phase fractions of the Co species present.
3. Explain the structural and electronic evolution of the Co species as the temperature is decreased from 400°C to 200°C under NO+CO, and discuss how this phase transformation relates to the catalyst's activity.
Ground Truth
Material: CoOx/CeO2
Measurement: Co K-edge in-situ XAS in fluorescence mode at SSRL BL 2-2 or NSLS-II ISS
Fit method: Linear combination analysis (LCF)
Phase fractions: (±10%)
| Phase | Fraction |
|---|---|
| Co3O4 | 0.45 |
| CoO | 0.55 |
Fit basis (paper's reference spectra):
- Co3O4
- CoO
Source evidence: Figure 5b, page 21
Key reasoning: Under reacting gases (NO+CO) at 400°C and 300°C, the catalyst remains primarily as Co3O4. However, when the temperature is decreased to 200°C and below, the catalyst undergoes a phase transformation, and the fraction of Co3O4 dramatically decreases while CoO increases. This reduction of Co to the 2+ state at lower temperatures correlates with a decrease in NO and CO conversion, suggesting Co3+ is the active site.
Reasoning source: Section 3.4, page 20
Scoring Rubric (total: 100 pts)
| Q | Type | Max | Question | Reference Answer | Scoring Criteria |
|---|---|---|---|---|---|
| q1 | identification | 20 | What reference spectra are required to model the Co K-edge XANES spectrum of this catalyst under the specified reaction conditions using linear combination fitting? | To model the Co K-edge XANES spectrum of the 7.1 Co/nm2 CoOx/CeO2 catalyst under NO+CO at 200°C using linear combination fitting, reference spectra for Co3O4 and CoO are required. These specific phases are expected because the catalyst undergoes a temperature-dependent phase transformation in the presence of the reacting gases. While the catalyst remains primarily as Co3O4 at higher temperatures (300-400°C), decreasing the temperature to 200°C causes a dramatic reduction of the cobalt species. Consequently, the Co3O4 fraction decreases while the CoO (Co2+ state) fraction increases, necessitating both references to accurately capture the mixed oxidation state present at this specific condition. | Full points for identifying bulk Co3O4 and bulk CoO as the necessary reference spectra. |
| q2 | quantification | 40 | Based on the reaction conditions (NO+CO at 200°C) for the 7.1 Co/nm2 CoOx/CeO2 catalyst, estimate the phase fractions of the Co species present. | Under the specified reaction conditions of NO+CO at 200°C, the estimated phase fractions for the Co species are 45% Co3O4 and 55% CoO, with an uncertainty of 10%. These specific values result from a temperature-driven reduction mechanism occurring in the reacting gas mixture. At higher temperatures (300°C and 400°C), the catalyst is predominantly Co3O4, but as the temperature is lowered to 200°C, the catalyst undergoes a significant phase transformation. This causes the Co3O4 fraction to dramatically decrease while the CoO fraction increases to become the majority phase (55%). This resulting mixture of Co3+ and Co2+ states directly correlates with a decrease in the catalytic conversion of NO and CO. | Full points for estimating approximately 45% Co3O4 and 55% CoO (allow ±10% margin). Partial points for identifying that it is a mixture with CoO becoming the majority phase. |
| q3 | reasoning | 40 | Explain the structural and electronic evolution of the Co species as the temperature is decreased from 400°C to 200°C under NO+CO, and discuss how this phase transformation relates to the catalyst's activity. | When exposed to reacting gases (NO+CO) at elevated temperatures of 400°C and 300°C, the 7.1 Co/nm2 CoOx/CeO2 catalyst structurally and electronically remains primarily as Co3O4. As the temperature is decreased to 200°C, the catalyst undergoes a significant phase transformation where the fraction of Co3O4 dramatically decreases and CoO increases, yielding a final composition of 45% Co3O4 and 55% CoO. This structural evolution represents an electronic reduction of the cobalt species to the Co2+ state. This phase transformation directly impacts the catalyst's activity, as the reduction to Co2+ at lower temperatures correlates with a marked decrease in NO and CO conversion. Consequently, this relationship suggests that the Co3+ species present at higher temperatures is the actual active site for the reaction. | Full points for explaining that the catalyst reduces from a Co3O4-dominated state at 300-400°C to a CoO-dominated state at 200°C, and linking this reduction to the 2+ state with a decrease in catalytic activity (NO and CO conversion). |
Review
#615
CoOx/CeO2
Co K-edge
▶
LLM Prompt
Sample Information
Material: CoOx/CeO2
Support: CeO2
Reaction Conditions: NO+CO (1:1), 100°C
Sample-Specific Conditions
- Atmosphere and Temperature: NO+CO at 100°C
- In-situ XAS of 7.1 Co/nm2 catalyst under NO+CO at 100°C
Measurement
We plan to measure the Co K-edge XANES spectrum of this sample.
Questions
Based on all the information above:
1. Based on the reaction conditions and catalyst composition, what candidate reference spectra should be included in a linear combination fitting analysis of the Co K-edge XANES spectrum?
2. Estimate the relative phase fractions of the Co species in the 7.1 Co/nm2 CoOx/CeO2 catalyst under NO+CO at 100°C.
3. Explain the physical reasoning for why the catalyst exhibits this specific mixture of phases at 100°C under NO+CO, and how this phase composition relates to the catalytic activity.
Ground Truth
Material: CoOx/CeO2
Measurement: Co K-edge in-situ XANES, fluorescence mode
Fit method: Linear combination fitting (LCF)
Phase fractions: (±10%)
| Phase | Fraction |
|---|---|
| Co3O4 | 0.42 |
| CoO | 0.58 |
Fit basis (paper's reference spectra):
- Co3O4
- CoO
Source evidence: Figure 5b, page 21
Key reasoning: During the NO reduction by CO reaction, the fraction of Co3O4 in the sample dramatically decreases and CoO increases when the temperature drops below 300 °C. The surface Co3O4 is gradually reduced to CoO by CO. At 100 °C under NO+CO, the catalyst has undergone significant reduction, resulting in a mixture of Co3O4 and CoO phases. This reduction to the 2+ state is believed to be a reason for the lowered NO and CO conversions at lower temperatures.
Reasoning source: Section 3.4, page 20 and Section 4, page 32
Scoring Rubric (total: 100 pts)
| Q | Type | Max | Question | Reference Answer | Scoring Criteria |
|---|---|---|---|---|---|
| q1 | identification | 20 | Based on the reaction conditions and catalyst composition, what candidate reference spectra should be included in a linear combination fitting analysis of the Co K-edge XANES spectrum? | The linear combination fitting analysis of the Co K-edge XANES spectrum should include Co3O4 and CoO as candidate reference spectra. These specific phases are expected because the CoOx/CeO2 catalyst is exposed to a reducing NO+CO (1:1) atmosphere at 100°C. Under these conditions, the surface Co3O4 is gradually reduced to CoO by the CO present in the gas mixture. Consequently, the catalyst undergoes significant reduction, resulting in a coexistence of both the initial Co3O4 phase and the newly formed CoO phase. | Full points for identifying Co3O4 and CoO as the necessary reference spectra. |
| q2 | quantification | 40 | Estimate the relative phase fractions of the Co species in the 7.1 Co/nm2 CoOx/CeO2 catalyst under NO+CO at 100°C. | Under NO+CO at 100°C, the relative phase fractions for the 7.1 Co/nm2 CoOx/CeO2 catalyst are estimated to be 0.42 (42%) Co3O4 and 0.58 (58%) CoO, with an uncertainty of 10%. These specific values result from the reaction conditions where the catalyst is exposed to a NO+CO mixture at a relatively low temperature of 100°C. During the NO reduction by CO, the surface Co3O4 is gradually reduced to CoO by the CO. Because the temperature has dropped below 300°C down to 100°C, the fraction of Co3O4 dramatically decreases while CoO increases, leading to this specific partially reduced mixture. | Full points for estimating CoO at ~58% and Co3O4 at ~42% (allow ±10% margin of error). |
| q3 | reasoning | 40 | Explain the physical reasoning for why the catalyst exhibits this specific mixture of phases at 100°C under NO+CO, and how this phase composition relates to the catalytic activity. | At 100°C under a NO+CO atmosphere, the CoOx/CeO2 catalyst exhibits a mixed phase composition of Co3O4 and CoO. This occurs because, during the NO reduction by CO, the CO acts as a reducing agent that gradually reduces the surface Co3O4 to CoO. As the reaction temperature drops below 300°C down to 100°C, this reduction mechanism becomes highly pronounced, causing the Co3O4 fraction to dramatically decrease while the CoO fraction increases. Ultimately, this significant reduction of cobalt to the 2+ state (CoO) is believed to be the reason for the lowered NO and CO conversions, thereby decreasing the catalytic activity at lower temperatures. | Full points for explaining that surface Co3O4 is reduced to CoO by CO as the temperature drops below 300°C, and linking this reduction to the 2+ state to a decrease in NO and CO conversions. |
Review
#616
CoOx/CeO2
Co K-edge
▶
LLM Prompt
Sample Information
Material: CoOx/CeO2
Support: CeO2
Reaction Conditions: NO+CO (1:1), RT
Sample-Specific Conditions
- Atmosphere and Temperature: NO+CO at RT
- In-situ XAS of 7.1 Co/nm2 catalyst under NO+CO at room temperature
Measurement
We plan to measure the Co K-edge XANES spectrum of this sample.
Questions
Based on all the information above:
1. What reference spectra are required to model the Co K-edge XANES spectrum of the 7.1 Co/nm2 CoOx/CeO2 catalyst under NO+CO at room temperature using linear combination fitting?
2. Estimate the relative phase fractions of the Co species present in this catalyst under NO+CO at room temperature (after cooling from 400°C).
3. Explain the chemical evolution that leads to this specific phase composition at room temperature under NO+CO, compared to the state at higher temperatures (e.g., 400°C).
Ground Truth
Material: CoOx/CeO2
Measurement: Co K-edge in-situ XANES, fluorescence mode
Fit method: Linear combination analysis
Phase fractions: (±10%)
| Phase | Fraction |
|---|---|
| Co3O4 | 0.43 |
| CoO | 0.57 |
Fit basis (paper's reference spectra):
- Co3O4
- CoO
Source evidence: Figure 5b, page 21
Key reasoning: Under reacting gases (NO+CO) at 400°C and 300°C, the catalyst structure is almost identical to Co3O4. When the temperature decreases to 200°C and below, the spectra change and become more similar to CoO, with isosbestic points indicating a direct phase transformation. Linear combination fitting reveals that the fraction of Co3O4 dramatically decreases and CoO increases when the temperature drops below 300°C, as the surface Co3O4 is gradually reduced to CoO by CO.
Reasoning source: Section 3.4, page 20 and Section 4, page 32
Scoring Rubric (total: 100 pts)
| Q | Type | Max | Question | Reference Answer | Scoring Criteria |
|---|---|---|---|---|---|
| q1 | identification | 20 | What reference spectra are required to model the Co K-edge XANES spectrum of the 7.1 Co/nm2 CoOx/CeO2 catalyst under NO+CO at room temperature using linear combination fitting? | To model the Co K-edge XANES spectrum of the 7.1 Co/nm2 CoOx/CeO2 catalyst under NO+CO at room temperature, reference spectra for Co3O4 and CoO are required. These specific phases are expected because the catalyst undergoes a temperature-dependent phase transformation in the NO+CO reaction mixture. While the catalyst exists primarily as Co3O4 at higher temperatures (300-400°C), cooling to room temperature causes the surface Co3O4 to be gradually reduced to CoO by the CO gas. This direct phase transformation, evidenced by isosbestic points in the spectra, necessitates both Co3O4 and CoO references to accurately capture the mixed-phase state present at room temperature. | Full points for identifying bulk Co3O4 and bulk CoO as the necessary reference spectra. |
| q2 | quantification | 40 | Estimate the relative phase fractions of the Co species present in this catalyst under NO+CO at room temperature (after cooling from 400°C). | Under NO+CO at room temperature, the relative phase fractions of the Co species are estimated to be 0.43 (43%) Co3O4 and 0.57 (57%) CoO, with an uncertainty of 10%. These specific values result from the temperature-dependent reduction of the catalyst in the NO+CO atmosphere. At higher temperatures like 400°C, the catalyst is almost entirely Co3O4, but as the temperature drops below 300°C down to room temperature, the CO in the gas mixture gradually reduces the surface Co3O4. This ongoing reduction process leads to a final room-temperature state where the majority of the phase has converted to CoO (57%), leaving a significant but minority fraction of unreduced Co3O4 (43%). | Full points for estimating ~43% Co3O4 and ~57% CoO. Partial credit if the values are within 10-15% of the ground truth. |
| q3 | reasoning | 40 | Explain the chemical evolution that leads to this specific phase composition at room temperature under NO+CO, compared to the state at higher temperatures (e.g., 400°C). | At higher temperatures of 400°C and 300°C under the NO+CO reacting gases, the CoOx/CeO2 catalyst structure is almost identical to Co3O4. However, as the temperature decreases to 200°C and eventually to room temperature, a direct phase transformation occurs, which is indicated by isosbestic points in the XANES spectra. This chemical evolution is driven by the CO in the gas mixture, which gradually reduces the surface Co3O4 to CoO as the temperature drops below 300°C. Consequently, linear combination fitting reveals that the fraction of Co3O4 dramatically decreases while CoO increases, resulting in the mixed 43% Co3O4 and 57% CoO phase composition observed at room temperature. | Full points for explaining that at high temperatures (300-400°C) the catalyst is predominantly Co3O4, but as the temperature drops below 300°C under the NO+CO mixture, the surface Co3O4 is gradually reduced to CoO by CO, resulting in a mixed phase at room temperature. |
Review
Stabilization of Super Electrophilic Pd +2 Cations in Small-Pore SSZ-13 Zeolite
APS
Catalyst
Konstantin Khivantsev et al.
DOI: 10.1021/acs.jpcc.9b06760
1 scenario
▶
#617
Pd/SSZ-13
Pd K
▶
LLM Prompt
Sample Information
Material: Pd/SSZ-13
Support: SSZ-13
Reaction Conditions: room temperature
Sample-Specific Conditions
- treatment: calcined in air
- Atomically dispersed Pd in SSZ-13 zeolite
Measurement
We plan to measure the Pd K XANES spectrum of this sample.
Questions
Based on all the information above:
1. Based on the sample conditions (1 wt% Pd/SSZ-13, calcined in air at 350 °C), what is the dominant oxidation state of Pd, and what physical reasoning justifies this conclusion?
2. To confirm the oxidation state of this sample using XANES, what specific reference spectra should be compared against the sample spectrum?
3. Describe the expected distinguishing features of the Pd K-edge XANES spectrum for this calcined sample compared to a Pd(IV) reference like K2[PdCl6].
Ground Truth
Material: Pd/SSZ-13
Measurement: Pd K-edge XANES, fluorescence mode, beamline 9-1
Fit method: Qualitative comparison
Phase fractions: (±10%)
| Phase | Fraction |
|---|---|
| Pd(II) species | 1.0 |
Fit basis (paper's reference spectra):
- PdO
- [Pd(NH3)4](NO3)2
- K2[PdCl6]
- Pd foil
Source evidence: Page 3 (Results and Discussion) and Figure S1
Key reasoning: Comparison of the XANES region of the Pd/SSZ-13 spectrum with those of PdO, [Pd(NH3)4](NO3)2, and standard [Pd(IV)Cl6]2- clearly shows the absence of Pd(IV) species within the margin of EXAFS sensitivity. Therefore, all Pd remains in the +2 oxidation state as atomically dispersed species after calcination.
Reasoning source: Page 3, Results and Discussion
Scoring Rubric (total: 101 pts)
| Q | Type | Max | Question | Reference Answer | Scoring Criteria |
|---|---|---|---|---|---|
| q1 | reasoning | 38 | Based on the sample conditions (1 wt% Pd/SSZ-13, calcined in air at 350 °C), what is the dominant oxidation state of Pd, and what physical reasoning justifies this conclusion? | The dominant oxidation state of Pd in this sample is +2, accounting for 100% of the species. This occurs because the sample consists of Pd supported on SSZ-13 zeolite that has been calcined in air, a treatment that stabilizes the metal entirely as atomically dispersed Pd(II). Qualitative comparison of the XANES region confirms the complete absence of Pd(IV) species within the margin of EXAFS sensitivity. Therefore, the calcination conditions ensure all Pd remains in the +2 oxidation state rather than oxidizing further. | Full points for identifying Pd(II) as the sole/dominant state and explaining that comparison with standards shows a complete absence of Pd(IV) features within the margin of sensitivity. |
| q2 | identification | 25 | To confirm the oxidation state of this sample using XANES, what specific reference spectra should be compared against the sample spectrum? | To confirm the oxidation state, the sample spectrum should be compared against PdO, [Pd(NH3)4](NO3)2, K2[PdCl6], and Pd foil reference spectra. These specific references are required because the sample was calcined in air, making it necessary to distinguish between metallic, +2, and +4 oxidation states. Comparing the sample against the standard [Pd(IV)Cl6]2- reference is critical to prove the absence of Pd(IV) species after the air treatment. Meanwhile, the PdO and [Pd(NH3)4](NO3)2 standards are used to confirm that the calcined material consists entirely of atomically dispersed Pd(II). | Full points for listing the reference standards used in the paper: PdO, [Pd(NH3)4](NO3)2, K2[PdCl6], and/or Pd foil. |
| q3 | spectral | 38 | Describe the expected distinguishing features of the Pd K-edge XANES spectrum for this calcined sample compared to a Pd(IV) reference like K2[PdCl6]. | The expected Pd K-edge XANES spectrum will feature an absorption edge rising near 24,350 eV and a white line peak around 24,365 eV. Compared to a Pd(IV) reference like K2[PdCl6], the sample spectrum will clearly lack the higher-energy edge shift and specific white line features characteristic of Pd(IV). These features arise because calcining the Pd/SSZ-13 sample in air stabilizes 100% of the metal as atomically dispersed Pd(II) rather than oxidizing it to Pd(IV). Furthermore, the spectrum's overall shape differs from bulk PdO, structurally confirming the atomically dispersed nature of the Pd(II) species generated by these specific sample conditions. | Full points for noting that the sample spectrum lacks the higher-energy edge shift characteristic of Pd(IV) and closely matches the edge position of Pd(II) standards. |
Review
Full Energy Range Resonant Inelastic X-ray Scattering of O 2 and CO 2 : Direct Comparison with Oxygen Redox State in Batteries
BNL-NSLS-II-8-ID
Pure Phase
Zengqing Zhuo et al.
DOI: 10.1021/acs.jpclett.0c00423
4 scenarios
▶
#618
O2
O K-edge
▶
LLM Prompt
Sample Information
Material: O2
Oxidation State: 0
Sample Form: gas
Measurement Mode: mRIXS
- O2 molecule reference
Measurement
We plan to measure the O K-edge XANES spectrum of this sample.
Questions
Based on all the information above:
1. Based on the sample conditions, what is the expected phase and oxidation state of this reference material?
2. What distinguishes the O K-edge mRIXS spectrum of this O2 gas reference from the spectra of oxidized oxygen states typically found in battery electrodes?
3. Why is it necessary to measure the O K-edge mRIXS spectrum of pure O2 gas in the context of battery electrode research?
Ground Truth
Compound: O2
Oxidation state: 0
Measurement: O K-edge mRIXS
Edge position: not reported
Spectral shape: not reported
Distinguishing features: Has distinct widths and positions along the excitation energy compared to oxidized oxygen states in battery electrodes.
Key reasoning: O2 gas is used as a molecule reference to compare against oxidized oxygen states in battery electrodes. It exhibits distinct widths and positions along the excitation energy.
Reasoning source: Text description
Scoring Rubric (total: 100 pts)
| Q | Type | Max | Question | Reference Answer | Scoring Criteria |
|---|---|---|---|---|---|
| q1 | identification | 30 | Based on the sample conditions, what is the expected phase and oxidation state of this reference material? | Based on the sample conditions, the expected phase is pure O2 gas with an oxidation state of 0, comprising 100% (fraction of 1.0) of the sample. This specific phase and oxidation state are expected because the material is explicitly prepared as a pure O2 molecule reference. Utilizing this zero-oxidation-state gas is necessary to establish a baseline that exhibits distinct spectral characteristics, which can then be compared against the oxidized oxygen states typically found in battery electrodes. | Award full points for identifying the phase as pure O2 gas with an oxidation state of 0. |
| q2 | spectral | 40 | What distinguishes the O K-edge mRIXS spectrum of this O2 gas reference from the spectra of oxidized oxygen states typically found in battery electrodes? | The O K-edge mRIXS spectrum of the O2 gas reference is distinguished by its distinct widths and positions along the excitation energy. These specific spectral features arise directly from the sample's condition as a pure, zero-oxidation-state diatomic gas. Because the O2 molecule reference has this unique electronic and physical state, it produces a distinct spectral signature that serves as a clear baseline for comparison against the oxidized oxygen states present in battery electrodes. | Award full points for mentioning that O2 has distinct widths and positions along the excitation energy compared to oxidized oxygen states in battery electrodes. |
| q3 | reasoning | 30 | Why is it necessary to measure the O K-edge mRIXS spectrum of pure O2 gas in the context of battery electrode research? | Measuring pure O2 gas is necessary to establish a definitive molecule reference with an oxidation state of 0. Given its gaseous form and zero oxidation state, the O2 sample yields a spectrum with distinct widths and positions along the excitation energy. This specific spectral signature is required to provide a clear contrast to the oxidized oxygen states typically found in battery electrodes. By using this pure gas as a baseline, researchers can accurately identify and compare the varying oxygen states within battery materials. | Award full points for explaining that it serves as a molecule reference to compare against and distinguish from oxidized oxygen states in battery electrodes. |
Review
#619
CO2
O K-edge
▶
LLM Prompt
Sample Information
Material: CO2
Oxidation State: 2-
Sample Form: gas
Measurement Mode: mRIXS
- CO2 molecule reference with strong covalency
Measurement
We plan to measure the O K-edge XANES spectrum of this sample.
Questions
Based on all the information above:
1. Based on the provided sample conditions, what is the expected oxidation state and electronic structure interpretation of oxygen in this CO2 gas reference?
2. In O K-edge mRIXS, what specific spectral feature distinguishes this strongly covalent CO2 reference from intrinsically oxidized oxygen?
Ground Truth
Compound: CO2
Oxidation state: 2-
Measurement: O K-edge mRIXS
Edge position: not reported
Spectral shape: not reported
Distinguishing features: Does not exhibit the critical mRIXS feature around 523.7 eV emission energy, distinguishing it from intrinsically oxidized oxygen.
Key reasoning: CO2 is used as a reference molecule representing an O2- state with strong covalency. It is specifically noted that it does not exhibit the critical mRIXS feature around 523.7 eV emission energy, which distinguishes it from intrinsically oxidized oxygen.
Reasoning source: Text
Scoring Rubric (total: 100 pts)
| Q | Type | Max | Question | Reference Answer | Scoring Criteria |
|---|---|---|---|---|---|
| q1 | reasoning | 43 | Based on the provided sample conditions, what is the expected oxidation state and electronic structure interpretation of oxygen in this CO2 gas reference? | The expected oxidation state of oxygen in this CO2 gas reference is 2-. This state arises because the pure CO2 gas sample (present at a 1.0 fraction) is specifically utilized as a molecular reference to represent an O2- state characterized by strong covalency. The strong covalency in this specific molecular environment is crucial for electronic structure interpretation. It demonstrates that highly covalent O2- states behave differently from intrinsically oxidized oxygen, providing a baseline for comparison in advanced spectroscopic measurements. | Full points if the answer identifies the oxidation state as 2- and mentions it represents a state with strong covalency. |
| q2 | spectral | 57 | In O K-edge mRIXS, what specific spectral feature distinguishes this strongly covalent CO2 reference from intrinsically oxidized oxygen? | In O K-edge mRIXS, the distinguishing spectral feature of this CO2 reference is the complete absence of a critical emission feature around 523.7 eV. This spectral behavior occurs because the pure CO2 gas sample (1.0 fraction) represents an O2- state with strong covalency, rather than an intrinsically oxidized oxygen state. The specific electronic structure of this strongly covalent molecular reference does not support the transitions required to produce the 523.7 eV emission energy peak. Consequently, the lack of this feature serves as a key spectroscopic marker to differentiate strongly covalent O2- systems from those containing intrinsically oxidized oxygen. | Full points if the answer explicitly states that CO2 does NOT exhibit the critical mRIXS feature around 523.7 eV emission energy. |
Review
#620
Li2O2
O K-edge
▶
LLM Prompt
Sample Information
Material: Li2O2
Oxidation State: 1-
Measurement Mode: mRIXS
- Lithium peroxide reference
Measurement
We plan to measure the O K-edge XANES spectrum of this sample.
Questions
Based on all the information above:
1. What specific spectral feature (energy and intensity) is expected for this lithium peroxide reference in mRIXS, and what is its physical origin?
2. What distinguishes the spectral features of this Li2O2 reference from oxidized oxygen states typically found in battery electrodes?
3. What specific oxidation state and electronic state does this reference material represent?
Ground Truth
Compound: Li2O2
Oxidation state: 1-
Measurement: O K-edge mRIXS
Edge position: not reported
Spectral shape: not reported
Labeled peaks:
| Label | Energy (eV) | Intensity | Origin | Source |
|---|---|---|---|---|
| oxidized oxygen feature | 523.7 (emission) | strong | intrinsically oxidized oxygen | paper_data |
Distinguishing features: Has distinct widths and positions along the excitation energy compared to oxidized oxygen states in battery electrodes.
Key reasoning: The sample is a lithium peroxide reference representing an intrinsically oxidized oxygen (O-) state. It exhibits a strong oxidized oxygen feature at 523.7 eV (emission). This feature has distinct widths and positions along the excitation energy compared to oxidized oxygen states found in battery electrodes.
Reasoning source: text
Scoring Rubric (total: 100 pts)
| Q | Type | Max | Question | Reference Answer | Scoring Criteria |
|---|---|---|---|---|---|
| q1 | spectral | 35 | What specific spectral feature (energy and intensity) is expected for this lithium peroxide reference in mRIXS, and what is its physical origin? | In the O K-edge mRIXS measurement of this lithium peroxide reference, a strong oxidized oxygen feature is expected at an emission energy of 523.7 eV. The physical origin of this feature is the intrinsically oxidized oxygen state present in the material. Because the sample is pure Li2O2 with an oxygen oxidation state of 1-, it naturally exhibits this distinct emission peak. This specific spectral signature arises directly from the O- electronic configuration inherent to the peroxide anion in the reference material. | Award full points if the response identifies the strong oxidized oxygen feature at 523.7 eV (emission) originating from intrinsically oxidized oxygen. |
| q2 | reasoning | 35 | What distinguishes the spectral features of this Li2O2 reference from oxidized oxygen states typically found in battery electrodes? | The spectral features of this Li2O2 reference are distinguished by having distinct widths and positions along the excitation energy axis when compared to oxidized oxygen states typically found in battery electrodes. This distinction arises because the sample is a pure lithium peroxide reference representing an intrinsically oxidized oxygen (O-) state, rather than a complex cycled battery electrode material. Consequently, the specific O- electronic environment in pure Li2O2 produces a unique strong emission feature at 523.7 eV that differs in shape and excitation energy dependence from the oxidized oxygen species formed during battery operation. | Award full points if the response notes that the Li2O2 reference has distinct widths and positions along the excitation energy compared to oxidized oxygen states in battery electrodes. |
| q3 | identification | 30 | What specific oxidation state and electronic state does this reference material represent? | This reference material represents an oxygen oxidation state of 1- and an intrinsically oxidized oxygen (O-) electronic state. Because the sample is a pure lithium peroxide (Li2O2) reference, it consists entirely (1.0 fraction) of the peroxide phase. Under these specific sample conditions, the oxygen atoms naturally exist in the O- state rather than the typical O2- state found in standard oxides. This intrinsic 1- oxidation state is exactly what produces the material's characteristic strong emission feature at 523.7 eV in the mRIXS spectrum. | Award full points if the response identifies the oxidation state as 1- and specifies it represents an O- state (peroxide). |
Review
#621
Na/Li-ion battery electrodes
O K-edge
▶
LLM Prompt
Sample Information
Material: Na/Li-ion battery electrodes
Oxidation State: n- (0 < n < 2)
Sample Form: electrode
Measurement Mode: mRIXS
- Oxidized oxygen state in representative Na/Li-ion battery electrodes
Measurement
We plan to measure the O K-edge XANES spectrum of this sample.
Questions
Based on all the information above:
1. Based on mRIXS measurements, what specific spectral feature (energy and type) is expected to strongly indicate the presence of the oxidized oxygen state in these battery electrodes?
2. How does the spectral signature of the oxidized oxygen state in these oxide electrodes distinguish itself from simple molecular configurations like peroxide (Li2O2) or O2 gas?
3. What is the expected oxidation state range for the oxygen in this specific oxidized state within the Na/Li-ion battery electrodes?
Ground Truth
Compound: Oxidized oxygen state in oxide electrodes
Oxidation state: n- (0 < n < 2)
Measurement: O K-edge mRIXS
Edge position: not reported
Spectral shape: not reported
Labeled peaks:
| Label | Energy (eV) | Intensity | Origin | Source |
|---|---|---|---|---|
| oxidized oxygen feature | 523.7 (emission) | strong | intrinsically oxidized oxygen | paper_data |
Distinguishing features: Exhibits distinct widths and positions along the excitation energy compared with Li2O2 and O2.
Key reasoning: The nature of the oxidized oxygen state in oxide electrodes is beyond a simple molecular configuration of either peroxide or O2. It represents an intrinsically oxidized oxygen state.
Reasoning source: text
Scoring Rubric (total: 100 pts)
| Q | Type | Max | Question | Reference Answer | Scoring Criteria |
|---|---|---|---|---|---|
| q1 | spectral | 30 | Based on mRIXS measurements, what specific spectral feature (energy and type) is expected to strongly indicate the presence of the oxidized oxygen state in these battery electrodes? | Based on O K-edge mRIXS measurements, a strong emission feature at 523.7 eV strongly indicates the presence of the oxidized oxygen state. This specific spectral feature arises because the oxygen in these Na/Li-ion battery electrodes exists in an intrinsically oxidized state with an oxidation state of n- (0 < n < 2). Rather than forming simple molecular configurations like peroxide or O2 gas, the oxygen is intrinsically oxidized within the solid oxide electrode structure. Consequently, the unique electronic environment of this non-molecular oxidized state produces the distinct 523.7 eV emission peak. | Full credit for identifying the strong emission feature at 523.7 eV originating from intrinsically oxidized oxygen. |
| q2 | reasoning | 40 | How does the spectral signature of the oxidized oxygen state in these oxide electrodes distinguish itself from simple molecular configurations like peroxide (Li2O2) or O2 gas? | The spectral signature of the oxidized oxygen state distinguishes itself by exhibiting distinct widths and positions along the excitation energy compared to simple molecular configurations like Li2O2 and O2. This difference arises because the oxygen in these Na/Li-ion battery electrodes represents an intrinsically oxidized oxygen state rather than a simple molecular configuration. With an oxidation state of n- (0 < n < 2), the oxygen is integrated into the solid oxide electrode structure. Therefore, the unique electronic properties of this intrinsically oxidized state produce a distinct mRIXS spectral shape that cannot be matched by discrete peroxide or O2 molecules. | Full credit for stating that the state goes beyond a simple molecular configuration of peroxide or O2, and exhibits distinct widths and positions along the excitation energy compared to Li2O2 and O2. |
| q3 | identification | 30 | What is the expected oxidation state range for the oxygen in this specific oxidized state within the Na/Li-ion battery electrodes? | The expected oxidation state for the oxygen in this specific oxidized state is n-, where 0 < n < 2. This fractional oxidation state is expected because the oxygen in these Na/Li-ion battery electrodes exists as an intrinsically oxidized oxygen state rather than a standard fully reduced oxide. The nature of this state goes beyond simple molecular configurations like peroxide (which would be exactly 1-) or O2 gas (which would be 0). Because the oxygen is intrinsically oxidized within the solid oxide electrode framework, its unique electronic environment dictates this intermediate n- oxidation state. | Full credit for identifying the oxidation state as n- where 0 < n < 2. |
Review
Radiation-Assisted Formation of Metal Nanoparticles in Molten Salts
BNL-NSLS-II-8-ID
Synthesis
Elaine T. Dias et al.
DOI: 10.1021/acs.jpclett.0c03231
3 scenarios
▶
#622
Ni nanoparticles in molten ZnCl2
Ni K-edge
▶
LLM Prompt
Sample Information
Material: Ni nanoparticles in molten ZnCl2
Method: melt fusion and in-situ radiolytic reduction
Precursors: 0.05 wt% NiCl2, 99.95 wt% ZnCl2
Temperature C: 320
Duration Hours: 0.333
Atmosphere: vacuum (10^-3 Torr in sealed capillary)
Post Treatment: in-situ X-ray irradiation (20 min exposure)
Sample-Specific Conditions
- Initial NiCl2 concentration: 0.05 wt%
- 0.05 wt% NiCl2 in molten ZnCl2 exposed to X-ray irradiation for 20 minutes at 320 °C
Preparation
- Molten salt solutions prepared by adding NiCl2 into purified ZnCl2 in quartz test tubes sealed under inert atmosphere, maintained at 800 °C for 15 minutes to fuse, cooled, crushed, loaded into capillaries, evacuated to 10^-3 Torr and flame sealed. Irradiated by synchrotron X-rays during measurement.
Measurement
We plan to measure the Ni K-edge XANES spectrum of this sample.
Questions
Based on all the information above:
1. Based on the extremely low initial concentration (0.05 wt% NiCl2) and the 20-minute X-ray irradiation at 320 °C, what is the expected dominant phase and oxidation state of nickel in this sample?
2. Explain the physical and chemical mechanism by which the 0.05 wt% NiCl2 sample is fully converted to its dominant phase during the in-situ XANES measurement.
3. Describe the expected XANES spectral shape of this sample. How does it compare to the spectrum of bulk Ni foil, and what structural characteristic causes this difference?
4. If one were to perform Linear Combination Analysis (LCA) to evaluate the phase purity of this sample or similar irradiated molten salt samples, what reference spectra (basis functions) would be appropriate to use?
Ground Truth
Material: Ni nanoparticles in molten ZnCl2
Measurement: Ni K-edge XANES in fluorescence geometry at NSLS-II ISS (8-ID) beamline
Fit method: Linear Combination Analysis (LCA)
Phase fractions: (±5%)
| Phase | Fraction |
|---|---|
| metallic_nickel | 1.0 |
| Ni2+ | 0.0 |
Fit basis (paper's reference spectra):
- 0.05 wt% NiCl2 in ZnCl2 at 320 °C (representing metallic Ni0)
- 1.0 wt% NiCl2 in ZnCl2 at 320 °C (representing Ni2+)
Source evidence: Table 2 (SI) and Figure 1c
Key reasoning: X-ray irradiation of the molten ZnCl2 solvent produces solvated electrons and reducing species (Zn+). Because the initial concentration of Ni2+ is very low (0.05 wt%), the radiolytically produced reducing species are sufficient to quantitatively reduce all Ni2+ ions to metallic Ni0. The high radiation dose rate favors rapid nucleation over growth, resulting in the complete conversion of the precursor into a high concentration of small (~1 nm) nanoparticles.
Reasoning source: Discussion section, pages 4-6
Scoring Rubric (total: 100 pts)
| Q | Type | Max | Question | Reference Answer | Scoring Criteria |
|---|---|---|---|---|---|
| q1 | prediction | 20 | Based on the extremely low initial concentration (0.05 wt% NiCl2) and the 20-minute X-ray irradiation at 320 °C, what is the expected dominant phase and oxidation state of nickel in this sample? | The expected dominant phase is metallic Ni0 nanoparticles (approximately 1 nm in diameter, ~55 atoms) with an oxidation state of 0, comprising 1.0 (100%) of the sample fraction. This complete conversion occurs because the in-situ X-ray irradiation of the molten ZnCl2 solvent at 320 °C generates solvated electrons and reducing species like Zn+. Given the extremely low initial Ni2+ concentration of 0.05 wt%, these radiolytically produced species are highly abundant relative to the precursor, allowing them to quantitatively reduce all Ni2+ ions to metallic Ni0. Furthermore, the high radiation dose rate promotes rapid nucleation over growth, resulting in the formation of very small nanoparticles rather than bulk metal. | Full credit for identifying metallic nickel (Ni0) nanoparticles as the 100% dominant phase. Partial credit for identifying metallic nickel without specifying nanoparticles. |
| q2 | reasoning | 30 | Explain the physical and chemical mechanism by which the 0.05 wt% NiCl2 sample is fully converted to its dominant phase during the in-situ XANES measurement. | During the in-situ XANES measurement at 320 °C, the synchrotron X-ray irradiation interacts with the molten ZnCl2 solvent to produce solvated electrons and reducing species such as Zn+. Because the initial concentration of the NiCl2 precursor is extremely low (0.05 wt%), the amount of radiolytically generated reducing species is more than sufficient to quantitatively reduce all available Ni2+ ions to metallic Ni0. The continuous high radiation dose rate drives rapid nucleation of the reduced nickel atoms rather than allowing slow particle growth. Consequently, this mechanism leads to the complete conversion of the precursor into a high concentration of small, ~1 nm diameter Ni0 nanoparticles (~55 atoms). | Full credit for explaining that X-ray radiolysis of the ZnCl2 solvent produces reducing species (Zn+ / solvated electrons) which quantitatively reduce the low concentration of Ni2+ to Ni0, with the high dose rate favoring rapid nucleation into nanoparticles. |
| q3 | spectral | 30 | Describe the expected XANES spectral shape of this sample. How does it compare to the spectrum of bulk Ni foil, and what structural characteristic causes this difference? | The XANES spectrum of this sample exhibits a metallic character that is qualitatively similar to bulk Ni foil, but with distinct differences such as an altered intensity and position of the mid-edge feature and smeared oscillations in the EXAFS region. These spectral deviations from bulk face-centered cubic Ni arise directly from finite size effects. Specifically, because the 0.05 wt% NiCl2 precursor is rapidly reduced by X-ray irradiation into very small (~1 nm, ~55-atom) nanoparticles, the lack of extended long-range order alters the electronic and structural environment. As a result, the spectrum closely matches the simulated XANES of a 55-atom cuboctahedral Ni nanoparticle rather than bulk metal. | Full credit for noting the spectrum has metallic character but differs from bulk Ni foil (altered mid-edge intensity/position, smeared EXAFS oscillations) specifically due to the finite size effects of the ~1 nm (55-atom) nanoparticles. |
| q4 | identification | 20 | If one were to perform Linear Combination Analysis (LCA) to evaluate the phase purity of this sample or similar irradiated molten salt samples, what reference spectra (basis functions) would be appropriate to use? | For Linear Combination Analysis (LCA), the appropriate reference spectra would be 0.05 wt% NiCl2 in ZnCl2 at 320 °C to represent the fully reduced metallic Ni0 phase, and 1.0 wt% NiCl2 in ZnCl2 at 320 °C to represent the unreduced Ni2+ phase. These specific references are necessary because the sample conditions dictate the chemical states present: the 0.05 wt% sample undergoes complete radiolytic reduction to Ni0 nanoparticles due to the high ratio of X-ray-generated reducing species (Zn+, solvated electrons) to the low initial Ni2+ concentration. Conversely, a higher concentration sample (1.0 wt%) would not be fully reduced under the same irradiation conditions, making it a suitable reference for the initial Ni2+ state in the molten ZnCl2 environment. Using these in-situ references accounts for the specific temperature (320 °C) and solvent effects of the molten salt matrix. | Full credit for identifying a Ni2+ reference (e.g., high-concentration 1.0 wt% NiCl2 in ZnCl2) and a Ni0 reference (e.g., bulk Ni foil or simulated Ni nanoparticles). |
Review
#623
Ni nanoparticles and Ni2+ ions in molten ZnCl2
Ni K-edge
▶
LLM Prompt
Sample Information
Material: Ni nanoparticles and Ni2+ ions in molten ZnCl2
Method: melt fusion and in-situ radiolytic reduction
Precursors: 0.1 wt% NiCl2, 99.9 wt% ZnCl2
Temperature C: 320
Duration Hours: 0.333
Atmosphere: vacuum (10^-3 Torr in sealed capillary)
Post Treatment: in-situ X-ray irradiation (20 min exposure)
Sample-Specific Conditions
- Initial NiCl2 concentration: 0.1 wt%
- 0.1 wt% NiCl2 in molten ZnCl2 exposed to X-ray irradiation for 20 minutes at 320 °C
Preparation
- Molten salt solutions prepared by adding NiCl2 into purified ZnCl2 in quartz test tubes sealed under inert atmosphere, maintained at 800 °C for 15 minutes to fuse, cooled, crushed, loaded into capillaries, evacuated to 10^-3 Torr and flame sealed. Irradiated by synchrotron X-rays during measurement.
Measurement
We plan to measure the Ni K-edge XANES spectrum of this sample.
Questions
Based on all the information above:
1. Based on the sample conditions (0.1 wt% NiCl2 in molten ZnCl2, 20 min X-ray irradiation at 320 °C), what are the expected nickel phases and their approximate fractions?
2. What reference spectra would be most appropriate to use as basis functions for a Linear Combination Analysis (LCA) of this sample's XANES spectrum to capture the in-situ states?
3. Explain the physical mechanism by which these phases form and why this specific ratio of phases is observed for the 0.1 wt% concentration under these irradiation conditions.
Ground Truth
Material: Ni nanoparticles and Ni2+ ions in molten ZnCl2
Measurement: Ni K-edge XANES in fluorescence geometry at NSLS-II ISS (8-ID) beamline
Fit method: Linear combination analysis (LCA)
Phase fractions: (±10%)
| Phase | Fraction |
|---|---|
| metallic_nickel | 0.55 |
| Ni2+ (in molten ZnCl2) | 0.45 |
Fit basis (paper's reference spectra):
- 0.05 wt% NiCl2 in ZnCl2 at 320 °C (representing the fully reduced Ni0 nanoparticle state)
- 1.0 wt% NiCl2 in ZnCl2 at 320 °C (representing the unreduced Ni2+ state)
Source evidence: Page 3, Figure 2 and text; SI Table 2
Key reasoning: The 0.1 wt% NiCl2 sample represents an intermediate state where the X-ray radiation dose is sufficient to partially reduce the Ni2+ ions. Solvated electrons generated by X-ray irradiation of the molten ZnCl2 solvent reduce Ni2+ to Ni0. Because the initial concentration of Ni2+ is higher than in the 0.05 wt% sample but lower than the 1.0 wt% sample, the fixed radiation dose (20 min exposure) reduces approximately half of the nickel ions, resulting in a mixture of 55% Ni0 and 45% Ni2+.
Reasoning source: Results and Discussion sections, Pages 3-4
Scoring Rubric (total: 100 pts)
| Q | Type | Max | Question | Reference Answer | Scoring Criteria |
|---|---|---|---|---|---|
| q1 | quantification | 30 | Based on the sample conditions (0.1 wt% NiCl2 in molten ZnCl2, 20 min X-ray irradiation at 320 °C), what are the expected nickel phases and their approximate fractions? | The expected nickel phases for this sample are metallic nickel (Ni0 nanoparticles) at approximately 55% and unreduced Ni2+ ions at approximately 45%, with an uncertainty of 10%. These specific fractions arise because the 20-minute in-situ X-ray irradiation of the molten ZnCl2 solvent at 320 °C generates solvated electrons that reduce Ni2+ to Ni0. Given the intermediate initial precursor concentration of 0.1 wt% NiCl2, this fixed radiation dose is only sufficient to partially reduce the nickel ions. As a result, the available solvated electrons convert about half of the initial Ni2+ into metallic Ni0, leaving the remaining 45% in the unreduced Ni2+ state. | Full points for identifying both metallic nickel (Ni0) and Ni2+ ions in the melt, with fractions around 55% and 45% respectively. Partial points for identifying the correct phases but incorrect fractions. |
| q2 | identification | 30 | What reference spectra would be most appropriate to use as basis functions for a Linear Combination Analysis (LCA) of this sample's XANES spectrum to capture the in-situ states? | The most appropriate reference spectra for the Linear Combination Analysis (LCA) are a 0.05 wt% NiCl2 in ZnCl2 sample at 320 °C (representing the fully reduced Ni0 nanoparticle state) and a 1.0 wt% NiCl2 in ZnCl2 sample at 320 °C (representing the unreduced Ni2+ state). These specific in-situ references are necessary because the 0.1 wt% NiCl2 sample undergoes partial radiolytic reduction in the molten salt at 320 °C. During the 20-minute X-ray exposure, solvated electrons generated in the ZnCl2 solvent reduce a portion of the Ni2+ to Ni0. Using these exact high-temperature, in-situ standards allows the LCA to accurately capture the intermediate mixture of 55% Ni0 and 45% Ni2+ produced under these specific irradiation conditions. | Full points for suggesting the use of the fully reduced state (e.g., 0.05 wt% NiCl2 in ZnCl2 at 320 °C) and the unreduced state (e.g., 1.0 wt% NiCl2 in ZnCl2 at 320 °C) as end-member references. Partial points for suggesting generic Ni foil and NiCl2 without accounting for the molten salt environment. |
| q3 | reasoning | 40 | Explain the physical mechanism by which these phases form and why this specific ratio of phases is observed for the 0.1 wt% concentration under these irradiation conditions. | The physical mechanism driving the phase formation is in-situ radiolytic reduction, where X-ray irradiation of the molten ZnCl2 solvent at 320 °C generates solvated electrons. These solvated electrons act as reducing agents, converting the precursor Ni2+ ions into metallic Ni0 nanoparticles. The specific observed ratio of 55% Ni0 and 45% Ni2+ occurs because the 0.1 wt% NiCl2 concentration represents an intermediate state relative to the fixed 20-minute radiation dose. Because this initial concentration is higher than what the dose can fully reduce (e.g., 0.05 wt%) but lower than a fully unreduced state (e.g., 1.0 wt%), the fixed exposure reduces approximately half of the nickel ions before the solvated electrons are depleted. | Full points for explaining that X-ray irradiation generates solvated electrons in the ZnCl2 melt which radiolytically reduce Ni2+ to Ni0, and that the 0.1 wt% concentration represents an intermediate case where the fixed radiation dose is only sufficient to reduce roughly half of the initial Ni2+ ions. |
Review
#624
Ni2+ ions in molten ZnCl2
Ni K-edge
▶
LLM Prompt
Sample Information
Material: Ni2+ ions in molten ZnCl2
Method: melt fusion and in-situ radiolytic reduction
Precursors: 1.0 wt% NiCl2, 99.0 wt% ZnCl2
Temperature C: 320
Duration Hours: 0.15
Atmosphere: vacuum (10^-3 Torr in sealed capillary)
Post Treatment: in-situ X-ray irradiation (9 min exposure)
Sample-Specific Conditions
- Initial NiCl2 concentration: 1.0 wt%
- 1.0 wt% NiCl2 in molten ZnCl2 exposed to X-ray irradiation for 9 minutes at 320 °C
Preparation
- Molten salt solutions prepared by adding NiCl2 into purified ZnCl2 in quartz test tubes sealed under inert atmosphere, maintained at 800 °C for 15 minutes to fuse, cooled, crushed, loaded into capillaries, evacuated to 10^-3 Torr and flame sealed. Irradiated by synchrotron X-rays during measurement.
Measurement
We plan to measure the Ni K-edge XANES spectrum of this sample.
Questions
Based on all the information above:
1. Based on the high initial concentration (1.0 wt%) and the 9-minute X-ray exposure at 320 °C, what is the expected dominant phase of nickel in this sample, and why is metallic nickel not observed despite the radiolytic environment?
2. Describe the expected shape of the white line region for this 1.0 wt% NiCl2 sample in molten ZnCl2 at 320 °C compared to room temperature pure NiCl2. What specific structural coordination does this spectral shape indicate?
Ground Truth
Material: Ni2+ ions in molten ZnCl2
Measurement: Ni K-edge XANES in fluorescence geometry at NSLS-II ISS (8-ID) beamline
Fit method: Linear Combination Analysis (LCA)
Phase fractions: (±5%)
| Phase | Fraction |
|---|---|
| Ni2+ (disordered tetrahedral) | 1.0 |
| metallic Ni | 0.0 |
Fit basis (paper's reference spectra):
- 0.05 wt% NiCl2 in ZnCl2 at 320 °C (metallic Ni0 reference)
- 1.0 wt% NiCl2 in ZnCl2 at 320 °C (Ni2+ reference)
Source evidence: Page 4 (Discussion section), Figure 1a/1b, and SI Table 2
Key reasoning: The 1.0 wt% NiCl2 sample has a high initial concentration of Ni2+. The radiation dose from the 9-minute X-ray exposure (0.12 - 77 MGy) is insufficient to reduce a measurable fraction of Ni2+ to Ni0. The calculated expected conversion is only 2.2%, which is below the precision limit of the linear combination analysis, resulting in an observed Ni0 fraction of 0.
Reasoning source: Page 4, Discussion section and SI Table 2
Scoring Rubric (total: 100 pts)
| Q | Type | Max | Question | Reference Answer | Scoring Criteria |
|---|---|---|---|---|---|
| q1 | reasoning | 50 | Based on the high initial concentration (1.0 wt%) and the 9-minute X-ray exposure at 320 °C, what is the expected dominant phase of nickel in this sample, and why is metallic nickel not observed despite the radiolytic environment? | The expected dominant phase of nickel in this sample is Ni2+ in a disordered tetrahedral coordination, which accounts for a fraction of 1.0, while metallic Ni0 is completely absent (fraction of 0.0). This phase composition arises directly from the sample conditions, specifically the high initial concentration of NiCl2 (1.0 wt%) in the molten ZnCl2 at 320 °C. Although the sample is subjected to a radiolytic environment via a 9-minute in-situ X-ray exposure, the resulting radiation dose (0.12 - 77 MGy) is insufficient to reduce a measurable fraction of the abundant Ni2+ ions. The calculated expected conversion to metallic nickel under these specific conditions is only 2.2%, which falls below the precision limit of the linear combination analysis, explaining why no metallic nickel is observed. | Full points if the answer identifies Ni2+ as the sole/dominant phase (fraction ~1.0) and explains that the radiation dose is too low relative to the high initial Ni2+ concentration to produce a measurable amount of Ni0 (conversion is below the LCA precision limit). |
| q2 | spectral | 50 | Describe the expected shape of the white line region for this 1.0 wt% NiCl2 sample in molten ZnCl2 at 320 °C compared to room temperature pure NiCl2. What specific structural coordination does this spectral shape indicate? | The expected shape of the white line region (at ca. 8349 eV) exhibits a reduced intensity and a distinct shape change compared to the double-peak structure characteristic of room temperature pure NiCl2. Additionally, the spectrum lacks the metallic mid-edge features typically seen in highly reduced samples. These spectral features arise because heating the 1.0 wt% NiCl2 in molten ZnCl2 to 320 °C induces a structural transformation in the material. At this elevated temperature, the Ni2+ ions adopt a disordered tetrahedral coordination, which directly produces the observed changes in the white line shape. The absence of metallic features further reflects the sample conditions, as the 9-minute X-ray exposure is insufficient to reduce the high initial concentration of Ni2+ to Ni0. | Full points if the answer mentions a reduced intensity and shape change of the white line (at ca. 8349 eV) compared to the double-peak structure of RT NiCl2, and correctly attributes this to a disordered tetrahedral coordination. |
Review
Active States During the Reduction of CO 2 by a MoS 2 Electrocatalyst
APS
Catalyst
Khagesh Kumar et al.
DOI: 10.1021/acs.jpclett.2c03942
8 scenarios
▶
#625
MoS2
S K
▶
LLM Prompt
Sample Information
Material: MoS2
Reaction Conditions: no electrolyte
Sample-Specific Conditions
- Applied Potential (VRHE): N/A
- MoS2 without electrolyte on the working electrode
Measurement
We plan to measure the S K XANES spectrum of this sample.
Questions
Based on all the information above:
1. What specific spectral features or basis components are required to model the pre-edge region of the S K-edge XANES spectrum for the dry MoS2 working electrode?
2. Estimate the relative fractions of the pre-edge spectral features for the pristine MoS2 electrode without electrolyte.
3. What is the physical reasoning for measuring the dry MoS2 electrode without electrolyte, and what baseline information does it provide for the operando study?
Ground Truth
Material: MoS2
Measurement: S K-edge operando
Fit method: Peak fitting
Phase fractions: (±10%)
| Phase | Fraction |
|---|---|
| Pre-edge peak 2471.4 eV | 0.427 |
| Pre-edge peak 2473.4 eV | 0.573 |
Fit basis (paper's reference spectra):
- Pre-edge peak 2471.4 eV
- Pre-edge peak 2473.4 eV
Source evidence: Table 1
Key reasoning: The dry MoS2 working electrode without electrolyte serves as a baseline for the pristine catalyst. In this state, the S K-edge spectrum exhibits two distinct pre-edge peaks at 2471.4 eV and 2473.4 eV, which are quantified to establish the initial electronic structure before electrochemical operation.
Reasoning source: Sample description and Table 1
Scoring Rubric (total: 100 pts)
| Q | Type | Max | Question | Reference Answer | Scoring Criteria |
|---|---|---|---|---|---|
| q1 | identification | 30 | What specific spectral features or basis components are required to model the pre-edge region of the S K-edge XANES spectrum for the dry MoS2 working electrode? | The pre-edge region of the S K-edge XANES spectrum is modeled using two distinct pre-edge peaks located at 2471.4 eV and 2473.4 eV. These specific features arise because the sample is a dry MoS2 working electrode measured without any electrolyte or applied potential. Under these pristine conditions, the catalyst exhibits its initial, unperturbed electronic structure. Identifying these two distinct peaks establishes the baseline state of the material before any electrochemical operation begins. | Must identify the two specific pre-edge peaks at 2471.4 eV and 2473.4 eV. |
| q2 | quantification | 40 | Estimate the relative fractions of the pre-edge spectral features for the pristine MoS2 electrode without electrolyte. | The relative fractions for the pre-edge spectral features are 0.427 for the peak at 2471.4 eV and 0.573 for the peak at 2473.4 eV, with an uncertainty of 10%. These specific values result from measuring the pristine MoS2 working electrode in a dry state without any electrolyte or applied potential. Because the catalyst has not yet been subjected to electrochemical operation, these fractions represent the initial electronic structure of the material. Quantifying these baseline fractions is necessary to establish a reference point for subsequent operando measurements. | Must state approximately 42.7% for the 2471.4 eV peak and 57.3% for the 2473.4 eV peak. |
| q3 | reasoning | 30 | What is the physical reasoning for measuring the dry MoS2 electrode without electrolyte, and what baseline information does it provide for the operando study? | Measuring the dry MoS2 working electrode without electrolyte serves to establish a baseline for the pristine catalyst before any electrochemical operation. Because there is no electrolyte and no applied potential, the sample remains in its initial, unperturbed state. This allows researchers to quantify the initial electronic structure, which is characterized by two distinct S K-edge pre-edge peaks at 2471.4 eV and 2473.4 eV. Establishing this baseline is critical for comparing how the electronic structure changes once the catalyst is subjected to operando conditions. | Must explain that it establishes the baseline spectral features (the initial distribution of the two pre-edge peaks) of the pristine catalyst before any electrochemical operation or electrolyte interaction. |
Review
#626
MoS2
S K
▶
LLM Prompt
Sample Information
Material: MoS2
Reaction Conditions: 1 M choline chloride and 1 M KOH hybrid electrolyte saturated with CO2, OCV
Sample-Specific Conditions
- Applied Potential (VRHE): OCV
- MoS2 with electrolyte at open circuit voltage
Measurement
We plan to measure the S K XANES spectrum of this sample.
Questions
Based on all the information above:
1. What specific spectral components or basis functions are required to model the pre-edge region of the S K-edge XANES spectrum for this MoS2 sample at open circuit voltage?
2. Estimate the relative fractions of the pre-edge peaks at 2471.4 eV and 2473.4 eV for the MoS2 catalyst under these OCV conditions.
3. What do these specific pre-edge peak fractions represent in the context of the operando measurement before an applied potential is introduced?
Ground Truth
Material: MoS2
Measurement: S K-edge operando
Fit method: Peak fitting / component analysis
Phase fractions: (±10%)
| Phase | Fraction |
|---|---|
| Pre-edge peak 2471.4 eV | 0.424 |
| Pre-edge peak 2473.4 eV | 0.576 |
Fit basis (paper's reference spectra):
- Pre-edge peak 2471.4 eV
- Pre-edge peak 2473.4 eV
Source evidence: Table 1
Key reasoning: At open circuit voltage (OCV) in the CO2-saturated hybrid electrolyte, the MoS2 catalyst exhibits two distinct pre-edge peaks at 2471.4 eV and 2473.4 eV. These peaks represent the baseline sulfur electronic states prior to the application of a cathodic potential. The higher energy peak at 2473.4 eV is the majority component in this resting state.
Reasoning source: Table 1 and associated text discussing OCV conditions
Scoring Rubric (total: 100 pts)
| Q | Type | Max | Question | Reference Answer | Scoring Criteria |
|---|---|---|---|---|---|
| q1 | identification | 30 | What specific spectral components or basis functions are required to model the pre-edge region of the S K-edge XANES spectrum for this MoS2 sample at open circuit voltage? | To model the pre-edge region of the S K-edge XANES spectrum for this sample, two specific basis functions are required: a pre-edge peak at 2471.4 eV and a pre-edge peak at 2473.4 eV. These specific components are expected because the MoS2 catalyst is resting at open circuit voltage (OCV) in a CO2-saturated 1 M choline chloride and 1 M KOH hybrid electrolyte. Under these unpolarized conditions, prior to the application of any cathodic potential, these two distinct peaks emerge as representations of the baseline sulfur electronic states in this specific chemical environment. | Full credit for identifying the two pre-edge peaks at 2471.4 eV and 2473.4 eV. |
| q2 | quantification | 40 | Estimate the relative fractions of the pre-edge peaks at 2471.4 eV and 2473.4 eV for the MoS2 catalyst under these OCV conditions. | The estimated relative fractions for the pre-edge peaks are 0.424 for the 2471.4 eV component and 0.576 for the 2473.4 eV component, with an uncertainty of 10%. These specific values result directly from the sample being held at open circuit voltage (OCV) within the CO2-saturated hybrid electrolyte. Because no external potential is being applied to drive a reaction, these fractions reflect the natural resting state of the MoS2 catalyst, where the higher energy electronic state (2473.4 eV) naturally exists as the majority component. | Full credit for stating ~42.4% for the 2471.4 eV peak and ~57.6% for the 2473.4 eV peak. Partial credit if the values are within 10% of the ground truth. |
| q3 | reasoning | 30 | What do these specific pre-edge peak fractions represent in the context of the operando measurement before an applied potential is introduced? | These specific pre-edge peak fractions represent the baseline sulfur electronic states of the MoS2 catalyst prior to any electrochemical polarization. Because the sample is maintained at open circuit voltage (OCV) in the CO2-saturated 1 M choline chloride and 1 M KOH hybrid electrolyte, there is no cathodic potential applied to alter the material's structure. Consequently, the observed distribution—dominated by the higher energy peak at 2473.4 eV—captures the intrinsic resting state of the sulfur atoms in this specific electrolyte environment before any reaction is induced. | Full credit for explaining that these fractions establish the baseline electronic state of the sulfur species at OCV, with the 2473.4 eV peak being the majority component prior to applying a potential. |
Review
#627
MoS2
S K
▶
LLM Prompt
Sample Information
Material: MoS2
Reaction Conditions: 1 M choline chloride and 1 M KOH hybrid electrolyte saturated with CO2, -0.80 VRHE
Sample-Specific Conditions
- Applied Potential (VRHE): -0.80
- MoS2 under CO2 reduction conditions, second scan at -0.80 V
Measurement
We plan to measure the S K XANES spectrum of this sample.
Questions
Based on all the information above:
1. What candidate basis components or distinct features are needed to model the S K-edge XANES spectrum of MoS2 under these specific operando CO2 reduction conditions?
2. Estimate the relative fractions of the identified pre-edge components for the MoS2 catalyst during the second scan at -0.80 VRHE.
3. Based on the provided sample information, what specific reaction conditions and measurement state correspond to this observed distribution of sulfur pre-edge peaks?
Ground Truth
Material: MoS2
Measurement: S K-edge operando
Fit method: peak fitting (implied by peak fractions)
Phase fractions: (±10%)
| Phase | Fraction |
|---|---|
| Pre-edge peak 2471.4 eV | 0.433 |
| Pre-edge peak 2473.4 eV | 0.567 |
Fit basis (paper's reference spectra):
- Pre-edge peak 2471.4 eV
- Pre-edge peak 2473.4 eV
Source evidence: Table 1
Key reasoning: Under operando CO2 reduction conditions at -0.80 VRHE (second scan) in a 1 M choline chloride and 1 M KOH hybrid electrolyte, the MoS2 catalyst's S K-edge spectrum is characterized by two distinct pre-edge peaks at 2471.4 eV and 2473.4 eV. The relative fractions of these peaks represent the distribution of sulfur species present at this specific applied potential.
Reasoning source: Sample description and Table 1
Scoring Rubric (total: 100 pts)
| Q | Type | Max | Question | Reference Answer | Scoring Criteria |
|---|---|---|---|---|---|
| q1 | identification | 30 | What candidate basis components or distinct features are needed to model the S K-edge XANES spectrum of MoS2 under these specific operando CO2 reduction conditions? | To model the S K-edge XANES spectrum of this sample, two distinct pre-edge peak components are required: one at 2471.4 eV and another at 2473.4 eV. These specific features arise because the MoS2 catalyst is being measured under operando CO2 reduction conditions at an applied potential of -0.80 VRHE in a CO2-saturated 1 M choline chloride and 1 M KOH hybrid electrolyte. Under these specific electrochemical conditions during the second scan, the applied potential and the hybrid electrolyte interact with the catalyst to dictate the distribution of sulfur species. Consequently, the spectrum exhibits these two distinct pre-edge peaks, which represent the specific electronic states of sulfur present at this exact applied potential. | Full credit for identifying the two specific pre-edge peaks at 2471.4 eV and 2473.4 eV as the necessary components. |
| q2 | quantification | 40 | Estimate the relative fractions of the identified pre-edge components for the MoS2 catalyst during the second scan at -0.80 VRHE. | The relative fractions for the pre-edge components are 0.433 for the peak at 2471.4 eV and 0.567 for the peak at 2473.4 eV, with an estimated uncertainty of 10%. These specific values result from the MoS2 catalyst being subjected to a second scan at -0.80 VRHE during operando CO2 reduction in a 1 M choline chloride and 1 M KOH hybrid electrolyte. The applied cathodic potential of -0.80 VRHE directly drives the distribution of sulfur species present on the catalyst surface. Therefore, these fractions quantitatively represent the specific balance of sulfur states stabilized by the hybrid electrolyte and the applied potential at this exact measurement state. | Full credit for providing fractions of approximately 43.3% for the 2471.4 eV peak and 56.7% for the 2473.4 eV peak. |
| q3 | reasoning | 30 | Based on the provided sample information, what specific reaction conditions and measurement state correspond to this observed distribution of sulfur pre-edge peaks? | The observed distribution of sulfur pre-edge peaks corresponds to the MoS2 catalyst measured during a second scan at an applied potential of -0.80 VRHE. The reaction takes place under operando CO2 reduction conditions in a hybrid electrolyte composed of 1 M choline chloride and 1 M KOH saturated with CO2. These specific conditions are responsible for the observed spectral features because the applied cathodic potential (-0.80 VRHE) and the unique chemical environment of the hybrid electrolyte drive the formation and stabilization of specific sulfur species. As a result, the relative fractions of the 2471.4 eV and 2473.4 eV pre-edge peaks directly reflect the distribution of these sulfur states present at this specific electrochemical state. | Full credit for mentioning the operando measurement during CO2 reduction in a 1 M choline chloride/1 M KOH hybrid electrolyte, specifically at an applied potential of -0.80 VRHE (second scan). |
Review
#628
MoS2
S K
▶
LLM Prompt
Sample Information
Material: MoS2
Reaction Conditions: 1 M choline chloride and 1 M KOH hybrid electrolyte saturated with CO2, -1.09 VRHE
Sample-Specific Conditions
- Applied Potential (VRHE): -1.09
- MoS2 under CO2 reduction conditions, first scan at -1.09 V
Measurement
We plan to measure the S K XANES spectrum of this sample.
Questions
Based on all the information above:
1. Identify the key spectral components (pre-edge peaks) and estimate their relative fractions for the MoS2 catalyst during the first operando scan at -1.09 VRHE under CO2 reduction conditions.
2. Explain the reasoning for the observed spectral component composition of the MoS2 catalyst at -1.09 VRHE.
Ground Truth
Material: MoS2
Measurement: S K-edge operando XANES
Fit method: Peak fitting / component analysis
Phase fractions: (±10%)
| Phase | Fraction |
|---|---|
| Pre-edge peak 2471.4 eV | 0.435 |
| Pre-edge peak 2473.4 eV | 0.565 |
Fit basis (paper's reference spectra):
- Pre-edge peak 2471.4 eV
- Pre-edge peak 2473.4 eV
Source evidence: Table 1
Key reasoning: Under CO2 reduction conditions at an applied potential of -1.09 VRHE (first scan), the operando S K-edge XANES spectrum of the MoS2 catalyst exhibits two distinct pre-edge features. These features are located at 2471.4 eV and 2473.4 eV, representing different sulfur species or electronic states induced by the applied potential. The relative intensities of these peaks yield fractions of 43.5% and 56.5%, respectively, indicating a mixed state of sulfur sites under these specific reaction conditions.
Reasoning source: Table 1 and sample description
Scoring Rubric (total: 100 pts)
| Q | Type | Max | Question | Reference Answer | Scoring Criteria |
|---|---|---|---|---|---|
| q1 | quantification | 57 | Identify the key spectral components (pre-edge peaks) and estimate their relative fractions for the MoS2 catalyst during the first operando scan at -1.09 VRHE under CO2 reduction conditions. | For the MoS2 catalyst measured during the first operando scan at -1.09 VRHE under CO2 reduction conditions, the S K-edge XANES spectrum is characterized by two distinct pre-edge peaks located at 2471.4 eV and 2473.4 eV. The relative fractions of these spectral components are 43.5% for the 2471.4 eV peak and 56.5% for the 2473.4 eV peak, with an uncertainty of 10%. These specific fractions arise because the applied potential of -1.09 VRHE in the CO2-saturated hybrid electrolyte (1 M choline chloride and 1 M KOH) induces a mixed state of sulfur sites. Consequently, the catalyst develops different sulfur species or electronic states in response to the electrochemical driving force, which are directly reflected in the relative intensities of these two pre-edge features. | Award full points if the response correctly identifies the two pre-edge peaks at 2471.4 eV and 2473.4 eV and accurately provides their respective fractions (0.435 and 0.565, or 43.5% and 56.5%). Deduct points for missing peaks or incorrect fractions. |
| q3 | reasoning | 43 | Explain the reasoning for the observed spectral component composition of the MoS2 catalyst at -1.09 VRHE. | The observed spectral composition of the MoS2 catalyst consists of two pre-edge features at 2471.4 eV (43.5%) and 2473.4 eV (56.5%). This specific composition results from subjecting the catalyst to CO2 reduction conditions at an applied potential of -1.09 VRHE in a 1 M choline chloride and 1 M KOH hybrid electrolyte. The applied potential during this first operando scan alters the electronic environment of the catalyst, inducing the formation of different sulfur species or electronic states. As a result, a mixed state of sulfur sites is generated under these specific reaction conditions, which manifests as the two distinct pre-edge peaks with these exact relative intensities in the S K-edge XANES spectrum. | Award full points if the response explains that the applied potential (-1.09 VRHE) under CO2 reduction conditions induces multiple sulfur species or electronic states, evidenced by the coexistence of two distinct pre-edge features with a ~43.5% / 56.5% distribution. |
Review
#629
MoS2
S K
▶
LLM Prompt
Sample Information
Material: MoS2
Reaction Conditions: 1 M choline chloride and 1 M KOH hybrid electrolyte saturated with CO2, -1.09 VRHE
Sample-Specific Conditions
- Applied Potential (VRHE): -1.09
- MoS2 under CO2 reduction conditions, second scan at -1.09 V
Measurement
We plan to measure the S K XANES spectrum of this sample.
Questions
Based on all the information above:
1. Based on the provided operando conditions (-1.09 VRHE, 2nd scan), what are the specific spectral features (phases) expected in the S K-edge XANES spectrum of the MoS2 catalyst, and what are their estimated relative fractions?
2. What basis functions or reference features are required to accurately model the S K-edge XANES spectrum of this sample under these specific electrochemical conditions?
3. Explain what the presence and ratio of these specific pre-edge peaks indicate about the state of the MoS2 catalyst during the second scan at -1.09 VRHE.
Ground Truth
Material: MoS2
Measurement: S K-edge operando
Fit method: Peak fitting / Linear Combination Fitting
Phase fractions: (±10%)
| Phase | Fraction |
|---|---|
| Pre-edge peak 2471.4 eV | 0.42 |
| Pre-edge peak 2473.4 eV | 0.58 |
Fit basis (paper's reference spectra):
- Pre-edge peak 2471.4 eV
- Pre-edge peak 2473.4 eV
Source evidence: table_1
Key reasoning: Under operando CO2 reduction conditions at an applied potential of -1.09 VRHE (second scan), the MoS2 catalyst exhibits two distinct sulfur states. These states are characterized by specific pre-edge peaks in the S K-edge XANES spectrum. The relative intensity of these features indicates a mixed state, with the species corresponding to the 2473.4 eV peak being slightly more dominant (58%) than the species corresponding to the 2471.4 eV peak (42%).
Reasoning source: Table 1 and associated text discussing operando CO2 reduction of MoS2
Scoring Rubric (total: 100 pts)
| Q | Type | Max | Question | Reference Answer | Scoring Criteria |
|---|---|---|---|---|---|
| q1 | quantification | 40 | Based on the provided operando conditions (-1.09 VRHE, 2nd scan), what are the specific spectral features (phases) expected in the S K-edge XANES spectrum of the MoS2 catalyst, and what are their estimated relative fractions? | The expected spectral features in the S K-edge XANES spectrum are two distinct pre-edge peaks located at 2471.4 eV and 2473.4 eV. Their estimated relative fractions are 0.42 (42%) for the 2471.4 eV peak and 0.58 (58%) for the 2473.4 eV peak, with an uncertainty of 10%. These specific fractions arise because, under the operando CO2 reduction conditions at an applied potential of -1.09 VRHE (second scan) in the hybrid electrolyte, the MoS2 catalyst transitions into a mixed state containing two distinct sulfur species. The applied cathodic potential drives this electronic evolution, resulting in the species associated with the 2473.4 eV peak becoming slightly more dominant than the species at 2471.4 eV. | Award 20 points for identifying the two pre-edge peaks at 2471.4 eV and 2473.4 eV. Award 20 points for correctly providing their respective fractions (0.42 for 2471.4 eV and 0.58 for 2473.4 eV). |
| q2 | identification | 30 | What basis functions or reference features are required to accurately model the S K-edge XANES spectrum of this sample under these specific electrochemical conditions? | To accurately model the S K-edge XANES spectrum of this sample, the required basis features for peak fitting or linear combination fitting are the pre-edge peak at 2471.4 eV and the pre-edge peak at 2473.4 eV. These specific reference features are necessary because the MoS2 catalyst undergoes electronic changes during the second scan of operando CO2 reduction at -1.09 VRHE in the choline chloride and KOH hybrid electrolyte. The applied potential of -1.09 VRHE induces the formation of two distinct sulfur states within the material. Consequently, modeling the spectrum requires these two specific pre-edge peaks to capture the dual-state nature of the catalyst under these exact electrochemical conditions. | Award full points for stating that the fitting basis must include the pre-edge peaks located at 2471.4 eV and 2473.4 eV. |
| q3 | reasoning | 30 | Explain what the presence and ratio of these specific pre-edge peaks indicate about the state of the MoS2 catalyst during the second scan at -1.09 VRHE. | The presence of the two pre-edge peaks at 2471.4 eV and 2473.4 eV indicates that the MoS2 catalyst exists in a mixed state comprising two distinct sulfur states. The specific ratio of 42% for the 2471.4 eV peak and 58% for the 2473.4 eV peak shows that the species corresponding to the higher energy peak is slightly more dominant. This mixed state arises directly from the operando CO2 reduction conditions in the 1 M choline chloride and 1 M KOH hybrid electrolyte. Specifically, the applied cathodic potential of -1.09 VRHE during the second scan drives the catalyst into this dual-state configuration, reflecting the dynamic response of the sulfur atoms to the electrochemical environment. | Award full points for explaining that the catalyst exists in a mixed state under these operando CO2 reduction conditions, characterized by two distinct sulfur species/states, with the state corresponding to the 2473.4 eV peak being slightly more dominant. |
Review
#630
MoS2
S K
▶
LLM Prompt
Sample Information
Material: MoS2
Reaction Conditions: 1 M choline chloride and 1 M KOH hybrid electrolyte saturated with CO2, -1.09 VRHE
Sample-Specific Conditions
- Applied Potential (VRHE): -1.09
- MoS2 under CO2 reduction conditions, third scan at -1.09 V
Measurement
We plan to measure the S K XANES spectrum of this sample.
Questions
Based on all the information above:
1. What specific spectral features or basis components should be used to model the S K-edge XANES spectrum of this MoS2 sample under these operando conditions?
2. Estimate the relative fractions of the sulfur species corresponding to the pre-edge peaks at 2471.4 eV and 2473.4 eV during the third scan at -1.09 VRHE.
3. Based on the distribution of these pre-edge peak fractions, what can be inferred about the state of the MoS2 catalyst during the third scan at -1.09 VRHE?
Ground Truth
Material: MoS2
Measurement: S K-edge operando
Fit method: Peak fitting / LCF
Phase fractions: (±10%)
| Phase | Fraction |
|---|---|
| Pre-edge peak 2471.4 eV | 0.449 |
| Pre-edge peak 2473.4 eV | 0.551 |
Fit basis (paper's reference spectra):
- Pre-edge peak 2471.4 eV
- Pre-edge peak 2473.4 eV
Source evidence: Table 1
Key reasoning: Under operando CO2 reduction conditions at -1.09 VRHE (third scan), the MoS2 catalyst exhibits two distinct sulfur species or states characterized by pre-edge peaks at 2471.4 eV and 2473.4 eV. The relative fractions of these peaks are 44.9% and 55.1%, respectively, indicating a mixed state of sulfur species during the electrochemical reaction at this potential.
Reasoning source: Table 1 and sample description
Scoring Rubric (total: 100 pts)
| Q | Type | Max | Question | Reference Answer | Scoring Criteria |
|---|---|---|---|---|---|
| q1 | identification | 30 | What specific spectral features or basis components should be used to model the S K-edge XANES spectrum of this MoS2 sample under these operando conditions? | The S K-edge XANES spectrum of this sample should be modeled using two specific basis components: a pre-edge peak at 2471.4 eV and a pre-edge peak at 2473.4 eV. These specific spectral features arise because the MoS2 catalyst is subjected to operando CO2 reduction conditions at an applied potential of -1.09 VRHE in a CO2-saturated 1 M choline chloride and 1 M KOH hybrid electrolyte. Under these specific electrochemical conditions during the third scan, the material develops two distinct sulfur species or electronic states. Consequently, these two pre-edge peaks must be used to accurately capture the mixed state of sulfur present during the reaction. | Full points if the answer identifies the two pre-edge peaks at 2471.4 eV and 2473.4 eV as the necessary components. |
| q2 | quantification | 40 | Estimate the relative fractions of the sulfur species corresponding to the pre-edge peaks at 2471.4 eV and 2473.4 eV during the third scan at -1.09 VRHE. | The relative fractions for the sulfur species are 44.9% for the pre-edge peak at 2471.4 eV and 55.1% for the pre-edge peak at 2473.4 eV, with an estimated uncertainty of 10%. These specific values result from the MoS2 catalyst operating under CO2 reduction conditions at -1.09 VRHE in the hybrid choline chloride/KOH electrolyte. During the third scan at this applied potential, the electrochemical environment induces a mixed state of sulfur species. The 44.9% and 55.1% distribution directly reflects the balance of these two distinct sulfur states driven by the specific applied potential of -1.09 VRHE. | Full points if the answer provides fractions of approximately 45% (or 0.449) for the 2471.4 eV peak and 55% (or 0.551) for the 2473.4 eV peak. |
| q3 | reasoning | 30 | Based on the distribution of these pre-edge peak fractions, what can be inferred about the state of the MoS2 catalyst during the third scan at -1.09 VRHE? | Based on the peak fractions, it can be inferred that the MoS2 catalyst exists in a mixed state comprising two distinct sulfur species during the third scan at -1.09 VRHE. This mixed state, characterized by a 44.9% fraction of the 2471.4 eV peak and a 55.1% fraction of the 2473.4 eV peak, is a direct consequence of the operando CO2 reduction conditions. Specifically, the applied potential of -1.09 VRHE in the CO2-saturated 1 M choline chloride and 1 M KOH hybrid electrolyte drives the sulfur atoms into these two distinct electronic states. The distribution indicates that the electrochemical reaction at this specific potential stabilizes this dual-state sulfur configuration. | Full points if the answer explains that the catalyst exists in a mixed state of sulfur species, as evidenced by the roughly 45/55 split between the two distinct pre-edge features under these operando conditions. |
Review
#631
MoS2
S K
▶
LLM Prompt
Sample Information
Material: MoS2
Reaction Conditions: 1 M choline chloride and 1 M KOH hybrid electrolyte saturated with CO2, -1.09 VRHE
Sample-Specific Conditions
- Applied Potential (VRHE): -1.09
- MoS2 under CO2 reduction conditions, fourth scan at -1.09 V
Measurement
We plan to measure the S K XANES spectrum of this sample.
Questions
Based on all the information above:
1. What specific spectral features or basis components should be used to analyze the S K-edge XANES spectrum of the MoS2 catalyst under these operando CO2 reduction conditions?
2. Estimate the relative fractions of the pre-edge peaks (2471.4 eV and 2473.4 eV) for the MoS2 catalyst during the fourth scan at -1.09 VRHE.
3. Describe the expected state of the sulfur species in terms of the pre-edge peak distribution for this sample under the specified applied potential.
Ground Truth
Material: MoS2
Measurement: S K-edge operando
Fit method: peak fraction analysis
Phase fractions: (±10%)
| Phase | Fraction |
|---|---|
| Pre-edge peak 2471.4 eV | 0.389 |
| Pre-edge peak 2473.4 eV | 0.611 |
Fit basis (paper's reference spectra):
- Pre-edge peak 2471.4 eV
- Pre-edge peak 2473.4 eV
Source evidence: Table 1
Key reasoning: Under operando CO2 reduction conditions at -1.09 VRHE (fourth scan), the MoS2 catalyst exhibits two distinct pre-edge peaks at 2471.4 eV and 2473.4 eV. The relative distribution is 38.9% for the 2471.4 eV peak and 61.1% for the 2473.4 eV peak, reflecting the state of the sulfur species under this specific applied potential.
Reasoning source: Sample description and Table 1
Scoring Rubric (total: 100 pts)
| Q | Type | Max | Question | Reference Answer | Scoring Criteria |
|---|---|---|---|---|---|
| q1 | identification | 30 | What specific spectral features or basis components should be used to analyze the S K-edge XANES spectrum of the MoS2 catalyst under these operando CO2 reduction conditions? | To analyze the S K-edge XANES spectrum of the MoS2 catalyst, a peak fraction analysis utilizing two distinct pre-edge peaks at 2471.4 eV and 2473.4 eV should be used. These specific spectral features arise because the sample is subjected to operando CO2 reduction conditions in a CO2-saturated 1 M choline chloride and 1 M KOH hybrid electrolyte. Specifically, during the fourth scan at an applied potential of -1.09 VRHE, the sulfur species in the MoS2 catalyst are driven into a state that produces these two distinct pre-edge features. The emergence of these peaks directly reflects the electronic state of the sulfur species under this specific applied potential. | Full credit if the answer identifies the two pre-edge peaks at 2471.4 eV and 2473.4 eV as the primary components for analysis. |
| q2 | quantification | 40 | Estimate the relative fractions of the pre-edge peaks (2471.4 eV and 2473.4 eV) for the MoS2 catalyst during the fourth scan at -1.09 VRHE. | During the fourth scan at -1.09 VRHE, the relative fractions of the pre-edge peaks are 38.9% for the 2471.4 eV peak and 61.1% for the 2473.4 eV peak, with an uncertainty of 10%. These specific values result directly from the operando CO2 reduction conditions in the CO2-saturated 1 M choline chloride and 1 M KOH hybrid electrolyte. The applied potential of -1.09 VRHE modifies the MoS2 catalyst, shifting the electronic environment of the sulfur atoms. Consequently, this relative distribution reflects the exact state of the sulfur species stabilized under this specific applied potential during the fourth scan. | Full credit if the estimated fractions are approximately 38.9% for the 2471.4 eV peak and 61.1% for the 2473.4 eV peak. |
| q3 | reasoning | 30 | Describe the expected state of the sulfur species in terms of the pre-edge peak distribution for this sample under the specified applied potential. | Under the specified applied potential of -1.09 VRHE during the fourth scan, the sulfur species in the MoS2 catalyst exhibit a state characterized by a pre-edge peak distribution of 38.9% at 2471.4 eV and 61.1% at 2473.4 eV. This specific distribution occurs because the sample is undergoing operando CO2 reduction within a CO2-saturated 1 M choline chloride and 1 M KOH hybrid electrolyte. The applied cathodic potential of -1.09 VRHE directly influences the electronic structure of the MoS2 catalyst. Therefore, the resulting ratio of these two distinct pre-edge peaks reflects the altered state of the sulfur species driven by this specific electrochemical environment. | Full credit if the response explains that the spectrum is characterized by a distribution between the 2471.4 eV and 2473.4 eV pre-edge peaks, with the 2473.4 eV feature being the dominant component (approx 61%) under these conditions. |
Review
#632
MoS2
S K
▶
LLM Prompt
Sample Information
Material: MoS2
Reaction Conditions: 1 M choline chloride and 1 M KOH hybrid electrolyte saturated with CO2, -1.29 VRHE
Sample-Specific Conditions
- Applied Potential (VRHE): -1.29
- MoS2 under CO2 reduction conditions at high cathodic bias
Measurement
We plan to measure the S K XANES spectrum of this sample.
Questions
Based on all the information above:
1. For operando S K-edge XANES of MoS2 at -1.29 VRHE in CO2-saturated electrolyte, what are the key pre-edge features used to model the spectrum, and what are their estimated relative fractions?
2. Which pre-edge feature dominates the S K-edge spectrum of MoS2 at a high cathodic bias of -1.29 VRHE, and what is its approximate percentage?
3. Explain the expected spectral composition of the S K-edge pre-edge region for MoS2 under these specific high cathodic bias conditions (-1.29 VRHE).
Ground Truth
Material: MoS2
Measurement: S K-edge operando
Fit method: Peak fitting / LCF
Phase fractions: (±10%)
| Phase | Fraction |
|---|---|
| Pre-edge peak 2471.4 eV | 0.349 |
| Pre-edge peak 2473.4 eV | 0.651 |
Fit basis (paper's reference spectra):
- Pre-edge peak 2471.4 eV
- Pre-edge peak 2473.4 eV
Source evidence: Table 1
Key reasoning: Under CO2 reduction conditions at a high cathodic bias of -1.29 VRHE, the S K-edge XANES spectrum of MoS2 is characterized by two distinct pre-edge peaks at 2471.4 eV and 2473.4 eV. The relative fractions of these peaks reflect the electronic state of sulfur under applied potential, with the 2473.4 eV peak remaining the dominant feature (65.1%) compared to the 2471.4 eV peak (34.9%) at this specific voltage.
Reasoning source: Table 1 and associated text discussing operando S K-edge XANES
Scoring Rubric (total: 100 pts)
| Q | Type | Max | Question | Reference Answer | Scoring Criteria |
|---|---|---|---|---|---|
| q1 | quantification | 40 | For operando S K-edge XANES of MoS2 at -1.29 VRHE in CO2-saturated electrolyte, what are the key pre-edge features used to model the spectrum, and what are their estimated relative fractions? | The key pre-edge features used to model the S K-edge spectrum are two distinct peaks located at 2471.4 eV and 2473.4 eV. Their estimated relative fractions are 34.9% for the 2471.4 eV peak and 65.1% for the 2473.4 eV peak, with an uncertainty of 10%. These specific features and fractions arise because the MoS2 is subjected to CO2 reduction conditions in a 1 M choline chloride and 1 M KOH hybrid electrolyte at a high cathodic bias of -1.29 VRHE. Under this applied potential, the relative fractions of these peaks reflect the altered electronic state of sulfur, where the high cathodic bias specifically drives the electronic structure such that the 2473.4 eV peak remains the dominant feature. | Full points if the response identifies the two pre-edge peaks at 2471.4 eV and 2473.4 eV and correctly estimates their fractions at ~35% and ~65% respectively. |
| q2 | prediction | 30 | Which pre-edge feature dominates the S K-edge spectrum of MoS2 at a high cathodic bias of -1.29 VRHE, and what is its approximate percentage? | The pre-edge feature at 2473.4 eV dominates the S K-edge spectrum of MoS2, accounting for approximately 65.1% of the pre-edge signal with a 10% uncertainty. The secondary peak at 2471.4 eV makes up the remaining 34.9%. This spectral dominance occurs because the sample is operating under CO2 reduction conditions in a hybrid electrolyte (1 M choline chloride and 1 M KOH) at a high cathodic bias of -1.29 VRHE. This specific applied voltage modifies the electronic state of the sulfur atoms in the MoS2 lattice, favoring the electronic state associated with the 2473.4 eV transition and making it the primary feature. | Full points if the response correctly identifies the 2473.4 eV peak as the dominant feature and states its fraction is approximately 65%. |
| q3 | reasoning | 30 | Explain the expected spectral composition of the S K-edge pre-edge region for MoS2 under these specific high cathodic bias conditions (-1.29 VRHE). | The expected spectral composition of the S K-edge pre-edge region consists of two distinct peaks at 2471.4 eV (34.9%) and 2473.4 eV (65.1%). This composition is directly driven by the application of a high cathodic bias (-1.29 VRHE) during CO2 reduction in a 1 M choline chloride and 1 M KOH hybrid electrolyte. The applied potential alters the electronic state of sulfur in the MoS2 material, which is directly reflected in the relative intensities of these two pre-edge peaks. At this specific voltage of -1.29 VRHE, the electronic configuration stabilizes such that the 2473.4 eV peak remains the dominant spectral feature compared to the 2471.4 eV peak. | Full points if the response explains that the pre-edge region is composed of two distinct peaks (2471.4 eV and 2473.4 eV) whose relative intensities reflect the electronic state of sulfur under the applied cathodic bias. |
Review
Spectroscopic Characterization of Mn1+ Low Oxidation State in Prussian Blue-Based Battery Anodes
BNL-NSLS-II-8-ID
Electrochemistry
Olga Maximova et al.
DOI: 10.1021/acs.jpclett.3c03516
1 scenario
▶
#633
Na1.8Mn[Mn(CN)6]0.95·1.5H2O
Mn K
▶
LLM Prompt
Sample Information
Material: Na1.8Mn[Mn(CN)6]0.95·1.5H2O
Electrode Type: anode
Cell Type: three-electrode pouch cell
Charge Discharge: charged
C Rate: C/10
Voltage V: 1.6
State Of Charge: 100%
Capacity Mah G: 72
Sample-Specific Conditions
- State of Charge: 100%
- Fully charged sodium manganese hexacyanomanganate anode
Measurement
We plan to measure the Mn K XANES spectrum of this sample.
Questions
Based on all the information above:
1. What reference spectra or basis functions would be appropriate to model the Mn spectroscopic data of this fully charged (100% SOC) sodium manganese hexacyanomanganate anode?
2. Based on the theoretical capacity and expected stoichiometry at 100% SOC (1.6 V), estimate the relative fractions of the distinct Mn species present in the electrode.
3. Explain the physical reasoning for the expected phase composition at 100% SOC. Which specific Mn sites undergo redox, and what are their resulting spin and oxidation states?
Ground Truth
Material: Na1.8Mn[Mn(CN)6]0.95·1.5H2O
Measurement: Mn K-edge XAS, Kβ non-resonant XES, and RIXS at beamline 8-ID (ISS)
Fit method: Superposition / Linear Combination Fitting
Phase fractions:
| Phase | Fraction |
|---|---|
| MnO | 0.48 |
| Mn(bpy)(CO)3Br | 0.52 |
Fit basis (paper's reference spectra):
- MnO
- Mn(bpy)(CO)3Br
Source evidence: Page 12, Figure 5F and text
Key reasoning: Upon charging the anode to 100% SOC (1.6 V), the C-coordinated Mn2+ is reduced to a formal Mn1+ oxidation state, while the N-coordinated Mn2+ remains in the high-spin Mn2+ state. This results in a mixed oxidation state system. The measured spectra can be represented as a superposition of Mn(bpy)(CO)3Br (representing low-spin Mn1+) and MnO (representing high-spin Mn2+) in a ratio of approximately 0.52 to 0.48. This matches the expected stoichiometry of the fully charged state: Na2.75MnII,HS[MnI,LS(CN)6]0.95.
Reasoning source: Page 12, text discussing Figure 5F and expected stoichiometry
Scoring Rubric (total: 100 pts)
| Q | Type | Max | Question | Reference Answer | Scoring Criteria |
|---|---|---|---|---|---|
| q1 | identification | 30 | What reference spectra or basis functions would be appropriate to model the Mn spectroscopic data of this fully charged (100% SOC) sodium manganese hexacyanomanganate anode? | To model the Mn K XANES spectrum of this fully charged (100% SOC) anode, the appropriate reference spectra are MnO and Mn(bpy)(CO)3Br. These references are required because charging the Na1.8Mn[Mn(CN)6]0.95·1.5H2O anode to 1.6 V reduces the C-coordinated Mn2+ to a formal low-spin Mn1+ state, while the N-coordinated Mn2+ remains in a high-spin Mn2+ state. Consequently, Mn(bpy)(CO)3Br serves as the ideal basis for the low-spin Mn1+ species, and MnO serves as the basis for the high-spin Mn2+ species. Using linear combination fitting with these two references accurately captures the mixed oxidation state system generated by the charging conditions. | Full points for identifying the need for a high-spin Mn2+ reference (such as MnO) and a low-spin Mn1+ reference (such as Mn(bpy)(CO)3Br). |
| q2 | quantification | 30 | Based on the theoretical capacity and expected stoichiometry at 100% SOC (1.6 V), estimate the relative fractions of the distinct Mn species present in the electrode. | At 100% SOC (1.6 V), the relative fractions of the distinct Mn species are approximately 0.52 for Mn(bpy)(CO)3Br (representing Mn1+) and 0.48 for MnO (representing Mn2+). These specific values arise because charging the Na1.8Mn[Mn(CN)6]0.95·1.5H2O anode to full capacity selectively reduces the C-coordinated Mn sites while leaving the N-coordinated Mn sites unchanged. This site-specific redox mechanism leads to an expected stoichiometry of Na2.75MnII,HS[MnI,LS(CN)6]0.95 for the fully charged state. The 0.52 to 0.48 ratio directly reflects this stoichiometry, balancing the newly formed low-spin Mn1+ fraction against the remaining high-spin Mn2+ fraction. | Full points for estimating approximately 48-50% high-spin Mn2+ (MnO-like) and 50-52% low-spin Mn1+ (Mn(bpy)(CO)3Br-like). |
| q3 | reasoning | 40 | Explain the physical reasoning for the expected phase composition at 100% SOC. Which specific Mn sites undergo redox, and what are their resulting spin and oxidation states? | Upon charging the sodium manganese hexacyanomanganate anode to 100% SOC at 1.6 V, the material undergoes a site-dependent redox process that results in a mixed oxidation state system. Specifically, the C-coordinated Mn2+ sites are reduced to a formal low-spin Mn1+ oxidation state. In contrast, the N-coordinated Mn2+ sites do not undergo redox and remain in a high-spin Mn2+ state. This selective reduction mechanism yields the final expected stoichiometry of Na2.75MnII,HS[MnI,LS(CN)6]0.95. Consequently, the physical phase composition is a superposition of these two distinct electronic states, represented by a ~0.52 fraction of low-spin Mn1+ and a ~0.48 fraction of high-spin Mn2+. | Full points for explaining that the C-coordinated Mn2+ reduces to low-spin Mn1+, while the N-coordinated Mn remains as high-spin Mn2+, resulting in a roughly 1:1 ratio of these two states in the fully charged material. |
Review
Formation of Copper Catalysts for CO2 Reduction with High Ethylene/Methane Product Ratio Investigated with In Situ X-ray Absorption Spectroscopy
BNL-NSLS-II-8-ID
Electrochemistry
André Eilert et al.
DOI: 10.1021/acs.jpclett.6b00367
4 scenarios
▶
#634
Cu
Cu K
▶
LLM Prompt
Sample Information
Material: Cu
Electrode Type: working electrode
Electrolyte: 0.1 M KHCO3, 4 mM KCl
Cell Type: in-situ cell
Charge Discharge: OCV
Voltage V: 0.7
Cycle Number: 1
Sample-Specific Conditions
- cycle number: 1
- Polycrystalline copper subjected to 1st potentiodynamic oxidation cycle in 0.1 M bicarbonate and 4 mM KCl, measured at OCP
Measurement
We plan to measure the Cu K XANES spectrum of this sample.
Questions
Based on all the information above:
1. Based on the sample conditions (1st potentiodynamic oxidation cycle up to 0.7 V in 0.1 M KHCO3 and 4 mM KCl), what candidate reference spectra should be included in a linear combination analysis of the Cu K-edge XANES spectrum, and which species can be excluded?
2. Estimate the phase fractions of the components present in this sample after the 1st oxidation cycle.
Ground Truth
Material: Cu
Measurement: in situ Cu K-edge XAS, fluorescence mode, SSRL beamline 7-3
Fit method: Linear combination analysis (LCA)
Phase fractions: (±10%)
| Phase | Fraction |
|---|---|
| Cu2O | 0.85 |
| Cu | 0.15 |
Fit basis (paper's reference spectra):
- Cu
- Cu2O
Source evidence: Page 2, paragraph 2 and Figure 1
Key reasoning: The sample was subjected to a potentiodynamic oxidation cycle up to 0.7 V vs RHE in the presence of KCl. The resulting spectrum is well described by a linear combination of Cu and Cu2O, with Cu2O being the dominant component (85%). There is no indication of CuCl or Cu(II) species like CuO; attempting to include CuCl in the fit resulted in physically meaningless negative concentrations.
Reasoning source: Page 2, paragraph 2
Scoring Rubric (total: 100 pts)
| Q | Type | Max | Question | Reference Answer | Scoring Criteria |
|---|---|---|---|---|---|
| q1 | identification | 50 | Based on the sample conditions (1st potentiodynamic oxidation cycle up to 0.7 V in 0.1 M KHCO3 and 4 mM KCl), what candidate reference spectra should be included in a linear combination analysis of the Cu K-edge XANES spectrum, and which species can be excluded? | The linear combination analysis of the Cu K-edge XANES spectrum should include metallic Cu and Cu2O as reference spectra. Species such as CuCl and Cu(II) oxides like CuO can be excluded from the fit. These specific phases are expected because the polycrystalline copper sample was subjected to a potentiodynamic oxidation cycle up to 0.7 V in the presence of KCl, which primarily drives the oxidation of the copper surface to Cu(I) oxide (Cu2O). Despite the presence of chloride ions in the electrolyte, there is no indication of CuCl formation, as attempting to include CuCl in the fit yields physically meaningless negative concentrations. | Full points for identifying Cu and Cu2O as the necessary reference spectra. Must explicitly mention that CuCl and Cu(II) species (like CuO) can be excluded. |
| q2 | quantification | 50 | Estimate the phase fractions of the components present in this sample after the 1st oxidation cycle. | The phase fractions for this sample are estimated to be 85% Cu2O and 15% metallic Cu, with an uncertainty of 10%. These specific values result from the sample being subjected to a potentiodynamic oxidation cycle up to 0.7 V in 0.1 M KHCO3 and 4 mM KCl. This applied anodic potential is sufficient to heavily oxidize the polycrystalline copper working electrode, making Cu2O the dominant component (85%). The remaining 15% metallic Cu represents the unoxidized underlying bulk material of the electrode measured during the in-situ OCP conditions. | Full points for estimating approximately 85% Cu2O and 15% metallic Cu. Partial credit for identifying Cu2O as the dominant phase (>70%) with residual Cu. |
Review
#635
Cu
Cu K
▶
LLM Prompt
Sample Information
Material: Cu
Electrode Type: working electrode
Electrolyte: 0.1 M KHCO3, 4 mM KCl
Cell Type: in-situ cell
Charge Discharge: OCV
Voltage V: 0.663
Cycle Number: 2
Sample-Specific Conditions
- cycle number: 2
- Polycrystalline copper subjected to 2nd potentiodynamic oxidation cycle in 0.1 M bicarbonate and 4 mM KCl, measured at OCP
Measurement
We plan to measure the Cu K XANES spectrum of this sample.
Questions
Based on all the information above:
1. Based on the provided conditions (2nd potentiodynamic oxidation cycle in 0.1 M KHCO3 and 4 mM KCl, measured at OCP), what are the expected candidate phases that should be included as reference spectra for linear combination fitting?
2. Given the presence of 4 mM KCl in the electrolyte, one might expect the formation of CuCl. What does the XANES analysis reveal about the presence of CuCl or Cu(II) species in this oxidized sample?
Ground Truth
Material: Cu
Measurement: in situ Cu K-edge XAS, fluorescence mode, SSRL beamline 7-3
Fit method: Linear combination analysis (LCA)
Phase fractions: (±10%)
| Phase | Fraction |
|---|---|
| Cu2O | 0.71 |
| Cu | 0.29 |
Fit basis (paper's reference spectra):
- Cu
- Cu2O
Source evidence: Page 2, left column, paragraph 3
Key reasoning: During the potentiodynamic oxidation-reduction cycles, the copper electrode is oxidized to Cu2O. The second oxidation cycle reversed at a 37 mV lower voltage (0.663 V vs RHE) compared to the first and third cycles (0.7 V vs RHE). This lower reversal potential resulted in a lower extent of oxidation, yielding 71% Cu2O compared to 85% and 99% for the first and third cycles, respectively. No CuCl or Cu(II) species were formed.
Reasoning source: Page 2, left column, paragraph 3
Scoring Rubric (total: 100 pts)
| Q | Type | Max | Question | Reference Answer | Scoring Criteria |
|---|---|---|---|---|---|
| q1 | identification | 50 | Based on the provided conditions (2nd potentiodynamic oxidation cycle in 0.1 M KHCO3 and 4 mM KCl, measured at OCP), what are the expected candidate phases that should be included as reference spectra for linear combination fitting? | The expected candidate phases for linear combination fitting are metallic Cu and Cu2O. During the potentiodynamic oxidation-reduction cycles in the 0.1 M KHCO3 and 4 mM KCl electrolyte, the polycrystalline copper electrode is oxidized to Cu2O. Because this second oxidation cycle was reversed at a lower voltage of 0.663 V compared to other cycles, it resulted in a lower extent of oxidation. This leaves a mixture of unreacted metallic Cu (29%) and the newly formed Cu2O (71%), while no CuCl or Cu(II) species are formed under these specific conditions. | Full points for identifying Cu and Cu2O as the necessary reference spectra. Deduct points if CuCl or Cu(II) species are suggested as present in the final fit. |
| q3 | reasoning | 50 | Given the presence of 4 mM KCl in the electrolyte, one might expect the formation of CuCl. What does the XANES analysis reveal about the presence of CuCl or Cu(II) species in this oxidized sample? | The XANES analysis reveals that no CuCl or Cu(II) species are formed in this oxidized sample. During the potentiodynamic cycling in the 0.1 M KHCO3 and 4 mM KCl electrolyte, the copper electrode is exclusively oxidized to Cu2O. The specific conditions of this second cycle, which reversed at a lower voltage of 0.663 V, resulted in a limited extent of oxidation that yielded only 71% Cu2O and 29% unreacted Cu. Consequently, the applied potential and electrochemical conditions drive the formation of the Cu(I) oxide phase rather than incorporating chloride ions or oxidizing further to Cu(II). | Full points for stating that XANES shows no evidence of CuCl or Cu(II) species, and that the oxidized phase is exclusively Cu2O. |
Review
#636
Cu
Cu K
▶
LLM Prompt
Sample Information
Material: Cu
Electrode Type: working electrode
Electrolyte: 0.1 M KHCO3, 4 mM KCl
Cell Type: in-situ cell
Charge Discharge: OCV
Voltage V: 0.7
Cycle Number: 3
Sample-Specific Conditions
- cycle number: 3
- Polycrystalline copper subjected to 3rd potentiodynamic oxidation cycle in 0.1 M bicarbonate and 4 mM KCl, measured at OCP
Measurement
We plan to measure the Cu K XANES spectrum of this sample.
Questions
Based on all the information above:
1. What reference spectra are required to fit the Cu K-edge XANES spectrum of this sample using linear combination analysis, and what other copper species were explicitly ruled out as stable intermediates?
2. Based on the sample conditions (3rd potentiodynamic oxidation cycle at 0.7 V vs RHE), estimate the phase fractions of the components present in the sample.
Ground Truth
Material: Cu
Measurement: in situ Cu K-edge XAS at SSRL beamline 7-3
Fit method: Linear combination analysis (LCA)
Phase fractions: (±10%)
| Phase | Fraction |
|---|---|
| Cu2O | 0.99 |
| Cu | 0.01 |
Fit basis (paper's reference spectra):
- Cu
- Cu2O
Source evidence: Page 2, left column, text
Key reasoning: A linear combination analysis gives a fraction of 99% Cu2O for the third oxidation cycle, which is higher than the second cycle (71%) because the second cycle reversed at a 37 mV lower voltage compared to the first and third cycles. Despite the presence of KCl in the electrolyte, no indication of CuCl or CuO was found in the spectra. The exclusive formation of Cu(I)-oxide suggests that Cl- changes the oxidation mechanism via transient Cu-Cl complexes, allowing for Cu oxide growth via dissolution followed by precipitation rather than forming solid CuCl.
Reasoning source: Page 2, left column and Page 3, right column
Scoring Rubric (total: 100 pts)
| Q | Type | Max | Question | Reference Answer | Scoring Criteria |
|---|---|---|---|---|---|
| q1 | identification | 50 | What reference spectra are required to fit the Cu K-edge XANES spectrum of this sample using linear combination analysis, and what other copper species were explicitly ruled out as stable intermediates? | To fit the Cu K-edge XANES spectrum of this sample, reference spectra for metallic Cu and Cu2O are required. Despite the presence of 4 mM KCl in the 0.1 M KHCO3 electrolyte, CuCl and CuO were explicitly ruled out as stable intermediates. The exclusive formation of Cu(I)-oxide (Cu2O) under these specific potentiodynamic oxidation conditions occurs because the chloride ions alter the oxidation mechanism. Instead of forming solid CuCl, the Cl- ions facilitate the formation of transient Cu-Cl complexes, which then allow for extensive Cu oxide growth through a dissolution-precipitation pathway. | Full points if the answer identifies Cu and Cu2O as the required reference spectra and mentions that CuCl and CuO were ruled out. |
| q2 | quantification | 50 | Based on the sample conditions (3rd potentiodynamic oxidation cycle at 0.7 V vs RHE), estimate the phase fractions of the components present in the sample. | Based on the sample conditions, the estimated phase fractions are 99% Cu2O and 1% metallic Cu, with an uncertainty of approximately 10%. This near-complete conversion to Cu2O during the 3rd potentiodynamic oxidation cycle at 0.7 V is significantly higher than the second cycle (71%) because the second cycle reversed at a 37 mV lower voltage. The exceptionally high yield of Cu2O is driven by the presence of 4 mM KCl in the bicarbonate electrolyte, which fundamentally changes the oxidation mechanism. The chloride ions promote the formation of transient Cu-Cl complexes that enable Cu oxide growth via dissolution followed by precipitation, rather than forming solid CuCl. | Full points if the answer estimates approximately 99% Cu2O and 1% metallic Cu. |
Review
#637
Cu
Cu K
▶
LLM Prompt
Sample Information
Material: Cu
Electrode Type: working electrode
Electrolyte: 0.1 M KHCO3, 4 mM KCl
Cell Type: in-situ cell
Charge Discharge: OCV
Sample-Specific Conditions
- state: reduced
- CuCubes after reduction cycle, measured at OCP
Measurement
We plan to measure the Cu K XANES spectrum of this sample.
Questions
Based on all the information above:
1. Based on the sample conditions (CuCubes after reduction cycle, measured at OCP), what is the expected dominant phase, and what reference spectra should be included in a linear combination analysis to verify the absence of other species?
2. Describe the expected spectral shape and distinguishing features of the Cu K-edge XANES for this reduced sample, particularly in comparison to potential oxidized precursors like Cu2O or CuCl.
Ground Truth
Material: Cu
Measurement: Cu K-edge in situ XAS in fluorescence mode at SSRL beamline 7-3
Fit method: Linear Combination Analysis (LCA)
Phase fractions: (±10%)
| Phase | Fraction |
|---|---|
| Cu | 1.0 |
Fit basis (paper's reference spectra):
- Cu
- Cu2O
- CuO
- CuCl
Source evidence: Page 1 text, Figure 1, Page 2 text
Key reasoning: The spectrum of the reduced sample is identical to the copper metal reference. No changes were detected between the initially reduced sample and the sample after several oxidation-reduction cycles. Furthermore, strain analysis showed no significant lattice strain, and no residual oxide could be found in the reduced CuCubes.
Reasoning source: Page 1-2, text discussing Figure 1 and Figure S1/S2
Scoring Rubric (total: 100 pts)
| Q | Type | Max | Question | Reference Answer | Scoring Criteria |
|---|---|---|---|---|---|
| q1 | identification | 50 | Based on the sample conditions (CuCubes after reduction cycle, measured at OCP), what is the expected dominant phase, and what reference spectra should be included in a linear combination analysis to verify the absence of other species? | The expected dominant phase for this sample is metallic Cu, comprising 1.0 (100%) of the composition. To verify the absence of other species, the linear combination analysis should include reference spectra for Cu, Cu2O, CuO, and CuCl. This phase composition arises because the CuCubes have undergone a complete reduction cycle and are measured at open circuit potential (OCP), driving the copper to an oxidation state of 0. The specific reference basis is chosen to ensure no residual oxides (Cu2O, CuO) remain from the initial state and no chloride species (CuCl) formed from the 4 mM KCl in the electrolyte. Ultimately, the absence of these oxidized species confirms that the reduction cycle fully converts the sample to pure metallic copper with no residual oxide or significant lattice strain. | 15 points for identifying metallic copper as the pure/dominant phase. 15 points for listing appropriate reference spectra (Cu, Cu2O, CuO, CuCl) needed to rule out oxides and chlorides. |
| q3 | spectral | 50 | Describe the expected spectral shape and distinguishing features of the Cu K-edge XANES for this reduced sample, particularly in comparison to potential oxidized precursors like Cu2O or CuCl. | The expected Cu K-edge XANES spectrum for this sample is identical to a metallic copper reference, featuring an edge position at ~8979 eV and a main peak at ~8993 eV. It exhibits the characteristic edge and post-edge oscillations typical of fcc copper metal. These spectral features arise directly from the sample conditions, as the CuCubes have undergone a complete reduction cycle and are measured at OCP, resulting in a pure Cu(0) state with no residual oxides or lattice strain. Because the sample is fully reduced, its spectrum is distinguished by the complete lack of pre-edge or rising edge features associated with oxidized species. Specifically, it lacks the sharp peak at ~8981 eV characteristic of Cu2O and the features between 8985 and 8990 eV that would indicate the presence of CuCl or CuO. | 15 points for describing the spectrum as identical to metallic copper. 15 points for noting the absence of distinguishing features of oxidized species, such as the ~8981 eV peak of Cu2O or features between 8985-8990 eV for CuCl/CuO. |
Review
Understanding the Electronic Structure Evolution of Epitaxial LaNi1–xFexO3 Thin Films for Water Oxidation
APS
Thin Film
Le Wang et al.
DOI: 10.1021/acs.nanolett.1c02901
10 scenarios
▶
#638
LaNiO3
Ni L-edge
▶
LLM Prompt
Sample Information
Material: LaNiO3
Deposition Method: MBE
Substrate: LSAT
Film Thickness Nm: 11.5
Composition Variable: Fe fraction (x)
Composition Value: 0
Sample-Specific Conditions
- Fe fraction (x): 0
- Epitaxial LaNi1-xFexO3 thin film with x=0 (30 unit cells)
Measurement
We plan to measure the Ni L-edge XANES spectrum of this sample.
Questions
Based on all the information above:
1. What candidate reference spectra are needed to quantify the Ni oxidation state in this LaNiO3 sample and potential reduced phases?
2. Why does the pure LaNiO3 film exhibit a pure Ni3+ oxidation state, and how would this change upon Fe substitution?
3. Describe the expected spectral shape of the Ni L2-edge for this pure LaNiO3 sample, specifically regarding features α (~870 eV) and β (~871.5 eV).
Ground Truth
Material: LaNiO3
Measurement: Ni L-edge XAS in total electron yield (TEY) mode at Advanced Light Source
Fit method: Peak area ratio analysis
Phase fractions: (±10%)
| Phase | Fraction |
|---|---|
| Ni3+ (LaNiO3) | 1.0 |
Fit basis (paper's reference spectra):
- NiO (Ni2+ reference)
Source evidence: Figure 2b and 2f, page 4
Key reasoning: For pure LaNiO3 (x=0), the Ni L2-edge spectrum lacks the prominent lower-energy feature (α) associated with Ni2+. The average Ni formal charge calculated from the peak area ratio confirms a valence of 3+.
Reasoning source: Page 4, RESULTS AND DISCUSSION
Scoring Rubric (total: 101 pts)
| Q | Type | Max | Question | Reference Answer | Scoring Criteria |
|---|---|---|---|---|---|
| q1 | identification | 25 | What candidate reference spectra are needed to quantify the Ni oxidation state in this LaNiO3 sample and potential reduced phases? | To quantify the Ni oxidation state and potential reduced phases, a NiO reference spectrum is needed to represent the Ni2+ state. Because the sample is an epitaxial LaNi1-xFexO3 thin film with an Fe fraction of x=0, it is expected to consist of pure LaNiO3 with a formal Ni valence of 3+. The NiO reference allows for peak area ratio analysis to detect any reduced Ni2+ phases. Given the pure x=0 composition, this analysis confirms a pure Ni3+ fraction of 1.0, as the spectrum lacks the prominent lower-energy features associated with Ni2+. | Must mention a Ni2+ reference (such as NiO) to quantify any reduction from the expected Ni3+ state. |
| q2 | reasoning | 38 | Why does the pure LaNiO3 film exhibit a pure Ni3+ oxidation state, and how would this change upon Fe substitution? | The pure LaNiO3 film exhibits a pure Ni3+ oxidation state (fraction of 1.0) because it is an unsubstituted (x=0) epitaxial thin film where the stoichiometry dictates a 3+ valence for nickel. Under these specific sample conditions, the average Ni formal charge calculated from the peak area ratio confirms this pure 3+ valence. If Fe substitution were introduced, the material would begin to exhibit mixed Ni2+/Ni3+ features. This is supported by the observation that the pure x=0 sample completely lacks the prominent lower-energy feature (α) associated with Ni2+, distinguishing it from Fe-substituted samples. | Must explain that pure LNO stabilizes Ni3+, and that Fe substitution induces electron transfer from Fe to Ni, reducing Ni3+ to Ni2+. |
| q3 | spectral | 38 | Describe the expected spectral shape of the Ni L2-edge for this pure LaNiO3 sample, specifically regarding features α (~870 eV) and β (~871.5 eV). | The Ni L2-edge spectrum for this sample consists of a single strong main peak (β) at approximately 871.5 eV, with negligible or absent intensity at the lower energy position (α) around 870 eV. This specific spectral shape arises directly from the sample's composition as a pure LaNiO3 epitaxial thin film with an Fe fraction of x=0. Because there is no Fe substitution, the nickel maintains a pure Ni3+ oxidation state, which is responsible for the strong β peak. Consequently, the spectrum lacks the prominent lower-energy α feature, which originates from Ni2+ absorption and distinguishes this pure sample from Fe-substituted variants. | Must mention the dominance of the higher-energy peak (β at ~871.5 eV) and the absence or weakness of the lower-energy peak (α at ~870 eV) characteristic of Ni2+. |
Review
#639
LaNi0.875Fe0.125O3
Ni L-edge
▶
LLM Prompt
Sample Information
Material: LaNi0.875Fe0.125O3
Deposition Method: MBE
Substrate: LSAT
Film Thickness Nm: 11.5
Composition Variable: Fe fraction (x)
Composition Value: 0.125
Sample-Specific Conditions
- Fe fraction (x): 0.125
- Epitaxial LaNi1-xFexO3 thin film with x=0.125 (30 unit cells)
Measurement
We plan to measure the Ni L-edge XANES spectrum of this sample.
Questions
Based on all the information above:
1. What reference spectra or basis states are required to model the Ni L-edge XANES spectrum and quantify the Ni oxidation states for this Fe-substituted LaNiO3 thin film?
2. Explain the physical mechanism that causes the Ni oxidation state to deviate from the nominal 3+ state found in pure LaNiO3 upon 12.5% Fe substitution.
Ground Truth
Material: LaNi0.875Fe0.125O3
Measurement: Ni L-edge XAS, total electron yield (TEY) mode, Advanced Light Source
Fit method: Peak area ratio analysis (using features α and β)
Phase fractions: (±10%)
| Phase | Fraction |
|---|---|
| Ni3+ (LaNiO3) | 0.92 |
| Ni2+ (NiO) | 0.08 |
Fit basis (paper's reference spectra):
- NiO (Ni2+ reference)
- LaNiO3 (Ni3+ reference)
Source evidence: Figure 2b and Figure 2f, page 4
Key reasoning: Fe substitution for Ni in LaNiO3 induces electron transfer from Fe to Ni sites. This charge transfer reduces a portion of the Ni from Ni3+ to Ni2+. At x=0.125, this electron transfer results in a slight decrease in the average Ni valence to approximately 2.92, corresponding to a mix of predominantly Ni3+ with a small fraction of Ni2+.
Reasoning source: RESULTS AND DISCUSSION, pages 4-5
Scoring Rubric (total: 100 pts)
| Q | Type | Max | Question | Reference Answer | Scoring Criteria |
|---|---|---|---|---|---|
| q1 | identification | 33 | What reference spectra or basis states are required to model the Ni L-edge XANES spectrum and quantify the Ni oxidation states for this Fe-substituted LaNiO3 thin film? | To model the Ni L-edge XANES spectrum of the LaNi0.875Fe0.125O3 thin film, the required reference spectra are NiO (as a Ni2+ reference) and pure LaNiO3 (as a Ni3+ reference). These specific basis states are necessary because substituting 12.5% Fe for Ni in the LaNiO3 lattice induces an electron transfer from the Fe sites to the Ni sites. This charge transfer mechanism reduces a portion of the Ni ions from their nominal Ni3+ state to Ni2+. Consequently, the sample conditions dictate a mixed oxidation state of predominantly Ni3+ (92%) with a small fraction of Ni2+ (8%), requiring both references to accurately quantify the average Ni valence of 2.92 via peak area ratio analysis. | Full points for identifying the need for a Ni2+ reference (such as NiO) and a Ni3+ reference (such as pure LaNiO3). |
| q3 | reasoning | 67 | Explain the physical mechanism that causes the Ni oxidation state to deviate from the nominal 3+ state found in pure LaNiO3 upon 12.5% Fe substitution. | In the epitaxial LaNi0.875Fe0.125O3 thin film, the deviation of the Ni oxidation state from the nominal 3+ state is driven by an inter-site electron transfer mechanism. Specifically, substituting 12.5% Fe for Ni in the LaNiO3 lattice induces a charge transfer from the substituted Fe sites to the neighboring Ni sites. This electron transfer reduces a portion of the Ni ions from Ni3+ to Ni2+. Because of this specific composition (x=0.125), the charge transfer results in a slight decrease in the average Ni valence to approximately 2.92, yielding a final quantified state composed of 92% Ni3+ and 8% Ni2+. | Full points for explaining that Fe substitution induces electron transfer from Fe to Ni sites, which reduces a fraction of the Ni cations from Ni3+ to Ni2+. |
Review
#640
LaNi0.75Fe0.25O3
Ni L-edge
▶
LLM Prompt
Sample Information
Material: LaNi0.75Fe0.25O3
Deposition Method: MBE
Substrate: LSAT
Film Thickness Nm: 11.5
Composition Variable: Fe fraction (x)
Composition Value: 0.25
Sample-Specific Conditions
- Fe fraction (x): 0.25
- Epitaxial LaNi1-xFexO3 thin film with x=0.25 (30 unit cells)
Measurement
We plan to measure the Ni L-edge XANES spectrum of this sample.
Questions
Based on all the information above:
1. Based on the sample composition (LaNi0.75Fe0.25O3 epitaxial thin film), what are the expected Ni oxidation states present, and what are their approximate fractions?
2. What reference spectra and analytical approach should be used to quantify the Ni oxidation states from the Ni L-edge XAS data for this sample?
3. Explain the physical mechanism that leads to the specific mixture of Ni oxidation states in this Fe-substituted LaNiO3 thin film.
Ground Truth
Material: LaNi0.75Fe0.25O3
Measurement: Ni L2-edge XAS in total electron yield (TEY) mode at Advanced Light Source
Fit method: Peak area ratio integration (features α and β)
Phase fractions: (±10%)
| Phase | Fraction |
|---|---|
| Ni3+ (LaNiO3) | 0.78 |
| Ni2+ (NiO) | 0.22 |
Fit basis (paper's reference spectra):
- NiO (Ni2+ reference)
- LaNiO3 (Ni3+ reference)
Source evidence: Figure 2b, Figure 2f, and text on page 4
Key reasoning: Fe substitution for Ni in LaNiO3 induces spontaneous electron transfer from Fe to Ni sites. This charge transfer process reduces a portion of the Ni from its original Ni3+ state to Ni2+. As the Fe fraction (x) increases, the magnitude of charge transfer increases, resulting in a continuous decrease in the average Ni valence and a specific mixture of Ni2+ and Ni3+ states.
Reasoning source: Pages 4-5, RESULTS AND DISCUSSION
Scoring Rubric (total: 100 pts)
| Q | Type | Max | Question | Reference Answer | Scoring Criteria |
|---|---|---|---|---|---|
| q1 | quantification | 40 | Based on the sample composition (LaNi0.75Fe0.25O3 epitaxial thin film), what are the expected Ni oxidation states present, and what are their approximate fractions? | For the LaNi0.75Fe0.25O3 epitaxial thin film, the expected Ni oxidation states are Ni3+ and Ni2+. The approximate fractions are 0.78 (78%) for Ni3+ and 0.22 (22%) for Ni2+, with an uncertainty of 10%. These specific fractions arise because the Fe substitution (x=0.25) in the LaNiO3 lattice induces spontaneous electron transfer from Fe to Ni sites. This charge transfer process reduces a portion of the Ni from its original Ni3+ state to Ni2+, with the magnitude of the transfer directly determined by the 25% Fe composition. | Award 20 points for correctly identifying the presence of both Ni3+ and Ni2+ states. Award 20 points for estimating the fractions at approximately 78% Ni3+ and 22% Ni2+ (accept ranges of 70-85% for Ni3+ and 15-30% for Ni2+). |
| q2 | identification | 30 | What reference spectra and analytical approach should be used to quantify the Ni oxidation states from the Ni L-edge XAS data for this sample? | The analytical approach should utilize peak area ratio integration of features α and β from the Ni L2-edge XAS data collected in total electron yield (TEY) mode. The required reference spectra for the fit basis are LaNiO3 for the Ni3+ reference and NiO for the Ni2+ reference. These specific references are necessary because the LaNi0.75Fe0.25O3 sample conditions dictate a mixed-valence state. Specifically, the x=0.25 Fe substitution in the thin film causes spontaneous electron transfer from Fe to Ni sites, reducing a portion of the original Ni3+ to Ni2+ and requiring both reference spectra to quantify the resulting mixture. | Award 15 points for identifying NiO as the Ni2+ reference and LaNiO3 as the Ni3+ reference. Award 15 points for mentioning the use of peak area ratios (specifically integrating features at the L2-edge) to estimate the formal charge. |
| q3 | reasoning | 30 | Explain the physical mechanism that leads to the specific mixture of Ni oxidation states in this Fe-substituted LaNiO3 thin film. | The physical mechanism leading to the specific mixture of Ni oxidation states is spontaneous electron transfer from Fe to Ni sites. In this epitaxial LaNi1-xFexO3 thin film, the sample condition of substituting Fe for Ni at a fraction of x=0.25 directly drives this charge transfer process. Consequently, this mechanism reduces a portion of the Ni from its original Ni3+ state to a Ni2+ state. Because the magnitude of charge transfer increases with the Fe fraction, the x=0.25 composition results in a continuous decrease in the average Ni valence, yielding the specific final mixture of 78% Ni3+ and 22% Ni2+. | Award 15 points for explaining that electron transfer occurs from Fe to Ni sites. Award 15 points for stating that this charge transfer reduces Ni3+ to Ni2+, with the extent of reduction scaling with the Fe substitution level. |
Review
#641
LaNi0.625Fe0.375O3
Ni L-edge
▶
LLM Prompt
Sample Information
Material: LaNi0.625Fe0.375O3
Deposition Method: MBE
Substrate: LSAT
Film Thickness Nm: 11.5
Composition Variable: Fe fraction (x)
Composition Value: 0.375
Sample-Specific Conditions
- Fe fraction (x): 0.375
- Epitaxial LaNi1-xFexO3 thin film with x=0.375 (30 unit cells)
Measurement
We plan to measure the Ni L-edge XANES spectrum of this sample.
Questions
Based on all the information above:
1. What candidate reference spectra or spectral features are needed to quantify the Ni oxidation states in this LaNi0.625Fe0.375O3 thin film using Ni L-edge XAS?
2. Explain the physical reasoning for the observed mixture of Ni oxidation states in this Fe-substituted LaNiO3 film.
Ground Truth
Material: LaNi0.625Fe0.375O3
Measurement: Ni L-edge XAS in total electron yield (TEY) mode
Fit method: Peak area ratio analysis of L2-edge features (α and β)
Phase fractions: (±10%)
| Phase | Fraction |
|---|---|
| Ni3+ | 0.68 |
| Ni2+ | 0.32 |
Fit basis (paper's reference spectra):
- NiO (Ni2+ reference)
Source evidence: Figure 2b, Figure 2f, and text on page 4
Key reasoning: Fe substitution for Ni in LaNiO3 induces electron transfer from Fe to Ni sites. This charge transfer process results in a continuous decrease in Ni valence with increasing Fe content (x). For x=0.375, this electron transfer reduces a portion of the Ni3+ to Ni2+, resulting in a mixed valence state with an average Ni valence of ~2.68.
Reasoning source: Page 4 and Page 5 (Results and Discussion)
Scoring Rubric (total: 100 pts)
| Q | Type | Max | Question | Reference Answer | Scoring Criteria |
|---|---|---|---|---|---|
| q1 | identification | 43 | What candidate reference spectra or spectral features are needed to quantify the Ni oxidation states in this LaNi0.625Fe0.375O3 thin film using Ni L-edge XAS? | To quantify the Ni oxidation states in this sample, peak area ratio analysis of the L2-edge features (α and β) is required, utilizing NiO as a Ni2+ reference spectrum. These specific features and references are necessary because the substitution of Fe (x=0.375) for Ni in the LaNiO3 lattice induces electron transfer from Fe to Ni sites. This charge transfer mechanism reduces a portion of the native Ni3+ ions to Ni2+, resulting in a mixed valence state. Consequently, analyzing these L2-edge features against the Ni2+ standard allows for the accurate determination of the resulting 68% Ni3+ and 32% Ni2+ fractions. | Full credit for identifying NiO as a necessary Ni2+ reference and mentioning the analysis of specific L2-edge peak features (or peak area ratios) to determine the formal charge. |
| q3 | reasoning | 57 | Explain the physical reasoning for the observed mixture of Ni oxidation states in this Fe-substituted LaNiO3 film. | The observed mixture of 68% Ni3+ and 32% Ni2+ in this 11.5 nm LaNi0.625Fe0.375O3 film is driven by an electron transfer mechanism between the transition metal sites. When Fe is substituted for Ni in the LaNiO3 lattice at a fraction of x=0.375, it induces a charge transfer from the Fe atoms to the Ni atoms. This process continuously decreases the Ni valence as Fe content increases. For this specific x=0.375 composition, the transferred electrons reduce a portion of the native Ni3+ to Ni2+, resulting in the observed mixed valence state with an average Ni valence of ~2.68. | Full credit for explaining that Fe substitution induces electron transfer from Fe to Ni sites, which reduces a portion of the Ni from Ni3+ to Ni2+. |
Review
#642
LaNi0.5Fe0.5O3
Ni L-edge
▶
LLM Prompt
Sample Information
Material: LaNi0.5Fe0.5O3
Deposition Method: MBE
Substrate: LSAT
Film Thickness Nm: 11.5
Composition Variable: Fe fraction (x)
Composition Value: 0.5
Sample-Specific Conditions
- Fe fraction (x): 0.5
- Epitaxial LaNi1-xFexO3 thin film with x=0.5 (30 unit cells)
Measurement
We plan to measure the Ni L-edge XANES spectrum of this sample.
Questions
Based on all the information above:
1. Based on the sample conditions (LaNi0.5Fe0.5O3 epitaxial thin film), what are the expected Ni oxidation states and their approximate fractions?
2. What reference spectra would be appropriate to use as a basis for quantifying the Ni oxidation states in this sample's Ni L-edge XANES spectrum?
3. Explain the physical mechanism that leads to the observed mixture of Ni oxidation states in this Fe-substituted LaNiO3 film.
Ground Truth
Material: LaNi0.5Fe0.5O3
Measurement: Ni L-edge XAS in total electron yield (TEY) mode at Advanced Light Source
Fit method: Peak area ratio analysis of Ni L2-edge features (alpha and beta peaks)
Phase fractions: (±10%)
| Phase | Fraction |
|---|---|
| Ni3+ | 0.62 |
| Ni2+ | 0.38 |
Fit basis (paper's reference spectra):
- NiO (Ni2+ reference)
- LaNiO3 (Ni3+ reference)
Source evidence: Figure 2b and 2f, pages 4-5
Key reasoning: Fe substitution for Ni in LaNiO3 induces electron transfer from Fe to Ni sites. This charge transfer process results in a continuous decrease in Ni valence with increasing Fe content (x). For x=0.5, the average Ni valence is reduced to approximately 2.62, corresponding to a mixture of Ni2+ and Ni3+ states.
Reasoning source: RESULTS AND DISCUSSION, pages 4-5
Scoring Rubric (total: 100 pts)
| Q | Type | Max | Question | Reference Answer | Scoring Criteria |
|---|---|---|---|---|---|
| q1 | quantification | 40 | Based on the sample conditions (LaNi0.5Fe0.5O3 epitaxial thin film), what are the expected Ni oxidation states and their approximate fractions? | For the LaNi0.5Fe0.5O3 epitaxial thin film, the expected Ni oxidation states are Ni3+ and Ni2+, with approximate fractions of 0.62 and 0.38, respectively (with a 10% uncertainty). These specific fractions arise because the sample contains an Fe fraction of x=0.5. Substituting Fe for Ni in the LaNiO3 lattice induces an electron transfer from the Fe sites to the Ni sites. This charge transfer mechanism continuously decreases the Ni valence as Fe content increases, resulting in an average Ni valence of approximately 2.62 for this specific composition. | Full points for identifying a mixture of Ni3+ and Ni2+ with fractions around 0.62 and 0.38 respectively (or an average valence of ~2.62). Partial points for identifying the correct oxidation states without accurate fractions. |
| q2 | identification | 30 | What reference spectra would be appropriate to use as a basis for quantifying the Ni oxidation states in this sample's Ni L-edge XANES spectrum? | The appropriate reference spectra to use as a fit basis are LaNiO3 to represent the Ni3+ state and NiO to represent the Ni2+ state. These specific references are required because the LaNi0.5Fe0.5O3 sample conditions dictate a mixed-valence state. Specifically, substituting 50% Fe (x=0.5) into the LaNiO3 film causes an electron transfer from Fe to Ni sites, reducing the average Ni valence to approximately 2.62. Therefore, pure Ni3+ and Ni2+ standard spectra are necessary to quantify this resulting mixture via peak area ratio analysis of the Ni L2-edge alpha and beta peaks. | Full points for mentioning a Ni2+ reference (such as NiO) and a Ni3+ reference (such as pure LaNiO3). |
| q3 | reasoning | 30 | Explain the physical mechanism that leads to the observed mixture of Ni oxidation states in this Fe-substituted LaNiO3 film. | The observed mixture of Ni oxidation states is driven by a charge transfer mechanism between the transition metal sites in the lattice. In the LaNi0.5Fe0.5O3 epitaxial thin film, substituting Fe for Ni induces an electron transfer from the Fe atoms to the Ni atoms. As the Fe fraction (x) increases to 0.5, this continuous charge transfer decreases the overall Ni valence. Consequently, the average Ni valence is reduced to approximately 2.62, which manifests as the observed mixture of 62% Ni3+ and 38% Ni2+ states in the 11.5 nm film. | Full points for explaining that Fe substitution induces electron transfer from Fe to Ni sites, reducing some of the Ni3+ to Ni2+. |
Review
#643
LaNi0.875Fe0.125O3
Fe L-edge
▶
LLM Prompt
Sample Information
Material: LaNi0.875Fe0.125O3
Deposition Method: MBE
Substrate: LSAT
Film Thickness Nm: 11.5
Composition Variable: Fe fraction (x)
Composition Value: 0.125
Sample-Specific Conditions
- Fe fraction (x): 0.125
- Epitaxial LaNi1-xFexO3 thin film with x=0.125 (30 unit cells)
Measurement
We plan to measure the Fe L-edge XANES spectrum of this sample.
Questions
Based on all the information above:
1. What candidate reference spectra are needed to model the Fe L-edge XANES spectrum of the LaNi0.875Fe0.125O3 thin film using linear combination fitting?
Ground Truth
Material: LaNi0.875Fe0.125O3
Measurement: Fe L-edge XAS in TEY mode
Fit method: Linear combination fitting
Phase fractions: (±10%)
| Phase | Fraction |
|---|---|
| Fe4+ | 0.82 |
| Fe3+ | 0.18 |
Fit basis (paper's reference spectra):
- Fe3+ (LaFeO3)
- Fe4+ ((SrNiO3)1/(LaFeO3)1 superlattice)
Source evidence: Figure 2d, Figure 2f, and text on page 5
Key reasoning: Fe substitution for Ni in LaNiO3 induces electron transfer from Fe to Ni sites, oxidizing Fe from Fe3+ to Fe4+. The average Fe valence reaches its maximum value at x=0.125 because the electrons transferred from Ni are concentrated on a small number of Fe sites. At higher Fe concentrations (x > 0.125), the electrons transferred from Ni are distributed over an increasing number of Fe cations per unit volume, causing the average Fe valence to drop.
Reasoning source: Page 5, RESULTS AND DISCUSSION
Scoring Rubric (total: 100 pts)
| Q | Type | Max | Question | Reference Answer | Scoring Criteria |
|---|---|---|---|---|---|
| q1 | identification | 100 | What candidate reference spectra are needed to model the Fe L-edge XANES spectrum of the LaNi0.875Fe0.125O3 thin film using linear combination fitting? | To model the Fe L-edge XANES spectrum of the LaNi0.875Fe0.125O3 thin film, reference spectra for Fe3+ (using LaFeO3) and Fe4+ (using a (SrNiO3)1/(LaFeO3)1 superlattice) are required. These specific valence states are expected because substituting Fe for Ni in the LaNiO3 lattice induces electron transfer from the Fe to the Ni sites, oxidizing the iron from Fe3+ to Fe4+. At this specific composition of x=0.125, the average Fe valence reaches its maximum value. This occurs because the electrons transferred from Ni are concentrated on a small number of Fe sites, resulting in a highly oxidized state that necessitates both Fe3+ and Fe4+ references to accurately capture the mixed-valence nature of the film. | Full points for identifying Fe3+ and Fe4+ reference spectra (specifically mentioning LaFeO3 for Fe3+ and a suitable Fe4+ reference like a superlattice or SrFeO3). |
Review
#644
LaNi0.75Fe0.25O3
Fe L-edge
▶
LLM Prompt
Sample Information
Material: LaNi0.75Fe0.25O3
Deposition Method: MBE
Substrate: LSAT
Film Thickness Nm: 11.5
Composition Variable: Fe fraction (x)
Composition Value: 0.25
Sample-Specific Conditions
- Fe fraction (x): 0.25
- Epitaxial LaNi1-xFexO3 thin film with x=0.25 (30 unit cells)
Measurement
We plan to measure the Fe L-edge XANES spectrum of this sample.
Questions
Based on all the information above:
1. What candidate reference spectra are needed to model the Fe L-edge XANES spectrum of the LaNi0.75Fe0.25O3 thin film using linear combination fitting?
2. Based on the sample composition (x=0.25), estimate the relative fractions of the Fe oxidation states present in the film.
3. Explain the physical mechanism that drives the formation of these specific Fe oxidation states in the LaNi1-xFexO3 system as the Fe fraction x increases to 0.25.
Ground Truth
Material: LaNi0.75Fe0.25O3
Measurement: Fe L-edge XAS in total electron yield (TEY) mode
Fit method: Linear combination fitting (LCF)
Phase fractions: (±10%)
| Phase | Fraction |
|---|---|
| Fe4+ (SNO1/LFO1 SL) | 0.55 |
| Fe3+ (LaFeO3) | 0.45 |
Fit basis (paper's reference spectra):
- Fe3+ (LaFeO3)
- Fe4+ ((SrNiO3)1/(LaFeO3)1 superlattice)
Source evidence: Figure 2d, Figure 2f, and page 5
Key reasoning: Fe substitution for Ni in LaNiO3 induces electron transfer from Fe to Ni sites. This charge transfer process oxidizes Fe from Fe3+ to Fe4+ while reducing Ni from Ni3+ to Ni2+. The average Fe valence reaches its maximum value at x=0.125 and then drops at higher x as the electrons transferred from the Ni are distributed over an increasing number of Fe cations per unit volume. At x=0.25, this results in a mixed valence state with a slightly higher fraction of Fe4+ than Fe3+.
Reasoning source: Page 5, RESULTS AND DISCUSSION
Scoring Rubric (total: 100 pts)
| Q | Type | Max | Question | Reference Answer | Scoring Criteria |
|---|---|---|---|---|---|
| q1 | identification | 30 | What candidate reference spectra are needed to model the Fe L-edge XANES spectrum of the LaNi0.75Fe0.25O3 thin film using linear combination fitting? | To model the Fe L-edge XANES spectrum of the LaNi0.75Fe0.25O3 thin film using linear combination fitting, reference spectra for Fe3+ (LaFeO3) and Fe4+ ((SrNiO3)1/(LaFeO3)1 superlattice) are required. These specific reference phases are necessary because substituting Fe for Ni in the LaNiO3 system induces an electron transfer from the Fe to the Ni sites. This charge transfer oxidizes the Fe from Fe3+ to Fe4+ while reducing Ni from Ni3+ to Ni2+. At the specific composition of x=0.25, the electrons transferred from the Ni are distributed over a larger number of Fe cations, resulting in a mixed valence state that requires both Fe3+ and Fe4+ references to accurately fit the spectrum. | Full points for identifying the need for both Fe3+ (e.g., LaFeO3) and Fe4+ (e.g., (SrNiO3)1/(LaFeO3)1 superlattice or similar) reference spectra. |
| q2 | quantification | 30 | Based on the sample composition (x=0.25), estimate the relative fractions of the Fe oxidation states present in the film. | For the LaNi0.75Fe0.25O3 thin film with an Fe fraction of x=0.25, the relative fractions of the Fe oxidation states are 0.55 for Fe4+ and 0.45 for Fe3+, with an uncertainty of 10%. These specific values result from the electron transfer from Fe to Ni sites that occurs upon Fe substitution, which oxidizes Fe3+ to Fe4+. The average Fe valence reaches its maximum at x=0.125, but as the Fe fraction increases to x=0.25, the electrons transferred from the Ni are distributed over an increasing number of Fe cations per unit volume. This distribution effect lowers the average valence, yielding a mixed state where the Fe4+ fraction is only slightly higher than the Fe3+ fraction. | Full points for estimating approximately 55% Fe4+ and 45% Fe3+ (accept values within ±10% of the ground truth). |
| q3 | reasoning | 40 | Explain the physical mechanism that drives the formation of these specific Fe oxidation states in the LaNi1-xFexO3 system as the Fe fraction x increases to 0.25. | In the epitaxial LaNi1-xFexO3 thin film, the formation of mixed Fe oxidation states is driven by an electron transfer mechanism between the transition metal sites. When Fe is substituted for Ni, electrons are transferred from the Fe to the Ni sites, which oxidizes Fe from Fe3+ to Fe4+ and reduces Ni from Ni3+ to Ni2+. The average Fe valence peaks at x=0.125, but as the Fe fraction increases to x=0.25, the electrons transferred from the Ni must be distributed over an increasing number of Fe cations per unit volume. This distribution effect lowers the average Fe valence from its maximum, resulting in the observed mixed state comprising 55% Fe4+ and 45% Fe3+ at the x=0.25 composition. | Full points for explaining the electron transfer from Fe to Ni sites (oxidizing Fe to Fe4+ and reducing Ni to Ni2+) and noting that the average Fe valence decreases from its maximum at x=0.125 because the transferred electrons are distributed over an increasing number of Fe cations. |
Review
#645
LaNi0.625Fe0.375O3
Fe L-edge
▶
LLM Prompt
Sample Information
Material: LaNi0.625Fe0.375O3
Deposition Method: MBE
Substrate: LSAT
Film Thickness Nm: 11.5
Composition Variable: Fe fraction (x)
Composition Value: 0.375
Sample-Specific Conditions
- Fe fraction (x): 0.375
- Epitaxial LaNi1-xFexO3 thin film with x=0.375 (30 unit cells)
Measurement
We plan to measure the Fe L-edge XANES spectrum of this sample.
Questions
Based on all the information above:
1. What candidate reference spectra are needed to perform a linear combination fitting of the Fe L-edge XANES spectrum for this LaNi0.625Fe0.375O3 thin film?
2. Estimate the phase fractions of the Fe oxidation states in this sample. Provide the specific percentages.
3. Explain the physical reasoning behind the expected Fe oxidation states in this LaNi0.625Fe0.375O3 thin film. Why does Fe adopt this specific mixed valence state at this composition?
Ground Truth
Material: LaNi0.625Fe0.375O3
Measurement: Fe L-edge XAS in total electron yield (TEY) mode
Fit method: Linear combination fitting
Phase fractions: (±10%)
| Phase | Fraction |
|---|---|
| Fe4+ ((SrNiO3)1/(LaFeO3)1 superlattice) | 0.38 |
| Fe3+ (LaFeO3) | 0.62 |
Fit basis (paper's reference spectra):
- Fe3+ (LaFeO3)
- Fe4+ ((SrNiO3)1/(LaFeO3)1 superlattice)
Source evidence: Figure 2d, Figure 2f, and page 5
Key reasoning: Fe substitution for Ni in LaNiO3 induces electron transfer from Fe to Ni sites, reducing Ni from Ni3+ to Ni2+ and oxidizing Fe from Fe3+ to Fe4+. The average Fe valence reaches a maximum at x=0.125 and then drops at higher x as the electrons transferred from Ni are distributed over an increasing number of Fe cations per unit volume. At x=0.375, the average Fe valence is approximately 3.38, corresponding to a mixture of 38% Fe4+ and 62% Fe3+.
Reasoning source: Page 5 (RESULTS AND DISCUSSION) and Page 9 (CONCLUSIONS)
Scoring Rubric (total: 100 pts)
| Q | Type | Max | Question | Reference Answer | Scoring Criteria |
|---|---|---|---|---|---|
| q1 | identification | 20 | What candidate reference spectra are needed to perform a linear combination fitting of the Fe L-edge XANES spectrum for this LaNi0.625Fe0.375O3 thin film? | To perform linear combination fitting of the Fe L-edge XANES spectrum for this LaNi0.625Fe0.375O3 thin film, the required reference spectra are Fe3+ (using LaFeO3) and Fe4+ (using a (SrNiO3)1/(LaFeO3)1 superlattice). These specific references are necessary because substituting Fe for Ni in the LaNiO3 lattice at a fraction of x=0.375 induces an electron transfer from the Fe sites to the Ni sites. This electron transfer oxidizes a portion of the Fe from Fe3+ to Fe4+ while reducing Ni from Ni3+ to Ni2+. Because the transferred electrons are distributed over a relatively high number of Fe cations at this specific composition (x=0.375), the sample exhibits a mixed valence state requiring both Fe3+ and Fe4+ references to accurately model the spectrum. | Full credit for identifying the need for Fe3+ and Fe4+ reference spectra (e.g., LaFeO3 for Fe3+ and a suitable Fe4+ reference like a superlattice or SrFeO3). |
| q2 | quantification | 40 | Estimate the phase fractions of the Fe oxidation states in this sample. Provide the specific percentages. | The estimated phase fractions for the Fe oxidation states in this sample are 38% Fe4+ and 62% Fe3+, with an uncertainty of 10%. These specific fractions result from the composition of the epitaxial LaNi0.625Fe0.375O3 thin film, where the Fe fraction is x=0.375. At this composition, the electron transfer from Fe to Ni sites is distributed over an increasing number of Fe cations per unit volume compared to lower doping levels. Consequently, the average Fe valence drops from its maximum at x=0.125 to approximately 3.38 at x=0.375. This average valence of 3.38 directly corresponds to the observed mixture of 38% Fe4+ and 62% Fe3+. | Full credit for estimating approximately 38% Fe4+ and 62% Fe3+. Partial credit for identifying a mixed Fe3+/Fe4+ state with Fe3+ being the majority species. |
| q3 | reasoning | 40 | Explain the physical reasoning behind the expected Fe oxidation states in this LaNi0.625Fe0.375O3 thin film. Why does Fe adopt this specific mixed valence state at this composition? | In the LaNi0.625Fe0.375O3 thin film, substituting Fe for Ni at a fraction of x=0.375 drives an electron transfer mechanism from the Fe sites to the Ni sites. This transfer reduces the Ni cations from Ni3+ to Ni2+ and simultaneously oxidizes the Fe cations from Fe3+ to Fe4+. While the average Fe valence reaches a maximum at a lower doping level of x=0.125, increasing the Fe fraction to x=0.375 causes the electrons transferred from Ni to be distributed over a larger number of Fe cations per unit volume. As a result of this distribution at x=0.375, the average Fe valence decreases to approximately 3.38. This specific average valence manifests as the observed mixed oxidation state comprising 38% Fe4+ and 62% Fe3+. | Full credit for explaining that Fe substitution for Ni induces electron transfer from Fe to Ni sites, reducing Ni (Ni3+ to Ni2+) and oxidizing Fe (Fe3+ to Fe4+), and noting that the average Fe valence decreases at higher x because the transferred electrons are distributed over an increasing number of Fe cations. |
Review
#646
LaNi0.5Fe0.5O3
Fe L-edge
▶
LLM Prompt
Sample Information
Material: LaNi0.5Fe0.5O3
Deposition Method: MBE
Substrate: LSAT
Film Thickness Nm: 11.5
Composition Variable: Fe fraction (x)
Composition Value: 0.5
Sample-Specific Conditions
- Fe fraction (x): 0.5
- Epitaxial LaNi1-xFexO3 thin film with x=0.5 (30 unit cells)
Measurement
We plan to measure the Fe L-edge XANES spectrum of this sample.
Questions
Based on all the information above:
1. What reference spectra or basis functions are appropriate for linear combination fitting of the Fe L-edge XANES to determine the Fe oxidation state in this LaNi0.5Fe0.5O3 sample?
Ground Truth
Material: LaNi0.5Fe0.5O3
Measurement: Fe L-edge XAS in total electron yield (TEY) mode
Fit method: Linear combination fitting
Phase fractions: (±10%)
| Phase | Fraction |
|---|---|
| Fe4+ | 0.28 |
| Fe3+ | 0.72 |
Fit basis (paper's reference spectra):
- Fe3+ (LaFeO3)
- Fe4+ ((SrNiO3)1/(LaFeO3)1 superlattice)
Source evidence: Figure 2d and 2f, page 5
Key reasoning: Fe substitution for Ni in LaNiO3 induces electron transfer from Fe to Ni sites, reducing Ni from Ni3+ to Ni2+ and oxidizing Fe from Fe3+ to Fe4+. The average Fe valence reaches its maximum value at x=0.125 and then drops at higher x (such as x=0.5) because the electrons transferred from the Ni are distributed over an increasing number of Fe cations per unit volume. This results in an average Fe valence of ~3.28 at x=0.5, corresponding to a mix of Fe3+ and Fe4+.
Reasoning source: RESULTS AND DISCUSSION, page 5
Scoring Rubric (total: 100 pts)
| Q | Type | Max | Question | Reference Answer | Scoring Criteria |
|---|---|---|---|---|---|
| q1 | identification | 100 | What reference spectra or basis functions are appropriate for linear combination fitting of the Fe L-edge XANES to determine the Fe oxidation state in this LaNi0.5Fe0.5O3 sample? | For linear combination fitting of the Fe L-edge XANES in this LaNi0.5Fe0.5O3 sample, the appropriate reference spectra are Fe3+ (using LaFeO3) and Fe4+ (using a (SrNiO3)1/(LaFeO3)1 superlattice). These specific basis functions are required because substituting Fe for Ni in the epitaxial LaNiO3 film induces an electron transfer from Fe to Ni sites, which oxidizes Fe3+ to Fe4+ and reduces Ni3+ to Ni2+. At the specific composition of x=0.5, the electrons transferred from the Ni sites are distributed over an increased number of Fe cations per unit volume compared to lower doping levels. This distribution lowers the average Fe valence to approximately +3.28, meaning the sample exists as a mixture of Fe3+ and Fe4+ states that must be modeled by these two references. | Full credit for identifying Fe3+ (e.g., LaFeO3) and Fe4+ (e.g., (SrNiO3)1/(LaFeO3)1 superlattice or similar Fe4+ standard) reference spectra. |
Review
#647
LaFeO3
Fe L-edge
▶
LLM Prompt
Sample Information
Material: LaFeO3
Deposition Method: MBE
Substrate: LSAT
Film Thickness Nm: 11.5
Composition Variable: Fe fraction (x)
Composition Value: 1
Sample-Specific Conditions
- Fe fraction (x): 1
- Epitaxial LaNi1-xFexO3 thin film with x=1 (30 unit cells)
Measurement
We plan to measure the Fe L-edge XANES spectrum of this sample.
Questions
Based on all the information above:
1. Based on the sample conditions (pure LaFeO3, x=1), what is the expected oxidation state of Fe?
2. Describe the expected spectral shape of the Fe L3-edge for this pure LaFeO3 sample.
3. If you were to perform linear combination fitting (LCF) to quantify the Fe oxidation state across the LaNi1-xFexO3 solid solution series, what specific reference spectra would be appropriate to use as basis functions?
Ground Truth
Material: LaFeO3
Measurement: Fe L-edge XAS, TEY mode
Fit method: Linear combination fitting (LCF)
Phase fractions: (±10%)
| Phase | Fraction |
|---|---|
| Fe3+ (LaFeO3) | 1.0 |
Fit basis (paper's reference spectra):
- Fe3+ (LaFeO3)
- Fe4+ ((SrNiO3)1/(LaFeO3)1 superlattice)
Source evidence: Figure 2d, Figure 2f, page 5
Key reasoning: For pure LFO (x=1), the Fe L3 feature exhibits a well-separated double peak structure characteristic of Fe3+. Linear combination fitting using Fe3+ and Fe4+ reference spectra confirms the Fe valence is 3+ for x=1.
Reasoning source: RESULTS AND DISCUSSION, page 5
Scoring Rubric (total: 101 pts)
| Q | Type | Max | Question | Reference Answer | Scoring Criteria |
|---|---|---|---|---|---|
| q1 | identification | 29 | Based on the sample conditions (pure LaFeO3, x=1), what is the expected oxidation state of Fe? | Based on the sample conditions, the expected oxidation state of Fe is 3+, with a phase fraction of 1.0. This is expected because the sample is an epitaxial LaNi1-xFexO3 thin film where the Fe fraction (x) is exactly 1, resulting in pure LaFeO3. In this pure x=1 composition, the stoichiometry inherently stabilizes the Fe3+ state. Linear combination fitting confirms this, showing that the Fe valence is entirely 3+ for the pure LaFeO3 film, whereas lower x values would lead to an increased Fe valence. | Full credit for identifying the oxidation state as 3+. |
| q2 | spectral | 36 | Describe the expected spectral shape of the Fe L3-edge for this pure LaFeO3 sample. | The expected spectral shape of the Fe L3-edge for this sample exhibits a well-separated double peak structure. This specific feature arises directly from the structural and electronic properties of the pure LaFeO3 (x=1) composition, which stabilizes Fe entirely in the 3+ oxidation state. The well-separated double peak is highly characteristic of this pure Fe3+ state. If the sample had a lower Fe fraction (x < 1), the Fe valence would increase, which would cause this distinct double peak structure to become broader and less resolved. | Full credit for mentioning the well-separated double peak structure at the Fe L3 edge. |
| q3 | reasoning | 36 | If you were to perform linear combination fitting (LCF) to quantify the Fe oxidation state across the LaNi1-xFexO3 solid solution series, what specific reference spectra would be appropriate to use as basis functions? | The appropriate reference spectra to use as basis functions for linear combination fitting (LCF) are Fe3+ from LaFeO3 and Fe4+ from a (SrNiO3)1/(LaFeO3)1 superlattice. These specific references are necessary because the LaNi1-xFexO3 solid solution series exhibits a changing Fe valence depending on the Fe fraction (x). For the pure x=1 sample, the composition dictates that the Fe valence is entirely 3+, making the Fe3+ (LaFeO3) spectrum the exact end-member reference. As the Fe fraction (x) decreases, the Fe valence increases, requiring the Fe4+ reference to accurately quantify the shifting oxidation states across the series. | Full credit for identifying Fe3+ (e.g., LaFeO3) and Fe4+ (e.g., (SrNiO3)1/(LaFeO3)1 superlattice) as the necessary reference spectra. |
Review
Influence of Ether Solvent and Anion Coordination on Electrochemical Behavior in Calcium Battery Electrolytes
APS
Synthesis
Nathan T. Hahn et al.
DOI: 10.1021/acsaem.0c01070
1 scenario
▶
#648
CaBHFIP2/G1 liquid electrolyte
Ca K-edge
▶
LLM Prompt
Sample Information
Material: CaBHFIP2/G1 liquid electrolyte
Method: chemical synthesis
Precursors: Ca(BH4)2, hexafluoroisopropanol, dimethoxy ethane (DME)
Temperature C: 25
Duration Hours: 168
Atmosphere: Argon
Post Treatment: solvent removal by vacuum, crystallization
Sample-Specific Conditions
- Anion: BHFIP-
- Calcium tetrakis(hexafluoroisopropoxy)borate in 1,2-dimethoxyethane
Preparation
- Synthesized by reacting Ca(BH4)2 with hexafluoroisopropanol in dimethoxy ethane (DME). The pure solid product Ca[B(hfip)4]2·4DME was isolated after removal of the solvent by vacuum. Single crystals were isolated from unstirred concentrated DME solutions stored in an argon-filled glovebox at ambient temperature for a week. The electrolyte was prepared by dissolving the salt in the chosen solvent (DME/G1).
Measurement
We plan to measure the Ca K-edge XANES spectrum of this sample.
Questions
Based on all the information above:
1. Based on the sample conditions (CaBHFIP2 in G1), what is the dominant Ca2+ coordination environment expected in this electrolyte, and what physical reasoning explains this state?
2. What distinguishing structural feature in the first coordination shell characterizes this fully solvated electrolyte compared to a system with strong anion coordination (such as CaTFSI2 in G1)?
3. To accurately model the local coordination environment of the dominant Ca species in this electrolyte using X-ray absorption fine structure data, what type of structural model or reference state is required?
Ground Truth
Material: 0.5 M CaBHFIP2 in G1 liquid electrolyte
Measurement: Ca K-edge EXAFS in transmission mode at beamline 9-BM of the Advanced Photon Source
Fit method: EXAFS fitting in r-space using Artemis (FEFF 6.0)
Phase fractions: (±10%)
| Phase | Fraction |
|---|---|
| fully solvated Ca2+ | 1.0 |
Fit basis (paper's reference spectra):
- fully solvated Ca2+ structural model (solvent coordination only)
Source evidence: Page 14 (text), Page 15 (Figure 4 and Table 2), Page 19 (text)
Key reasoning: The BHFIP anion exhibits much weaker coordination strength toward Ca2+ compared to TFSI. In the weakly coordinating solvent G1, this allows for facile dissociation of the CaBHFIP2 salt. Consequently, the majority species in the CaBHFIP2/G1 electrolyte is fully solvated Ca2+, lacking extensive anion coordination.
Reasoning source: Results and Discussion, Pages 13-14 and 19
Scoring Rubric (total: 100 pts)
| Q | Type | Max | Question | Reference Answer | Scoring Criteria |
|---|---|---|---|---|---|
| q1 | reasoning | 40 | Based on the sample conditions (CaBHFIP2 in G1), what is the dominant Ca2+ coordination environment expected in this electrolyte, and what physical reasoning explains this state? | The dominant coordination environment expected in this electrolyte is fully solvated Ca2+, representing a 1.0 fraction of the species. This state arises because the synthesized CaBHFIP2 salt contains the BHFIP- anion, which exhibits much weaker coordination strength toward Ca2+ compared to anions like TFSI-. When dissolved in the weakly coordinating solvent 1,2-dimethoxyethane (G1), this weak anion-cation interaction allows for facile and complete dissociation of the salt. Consequently, the Ca2+ ions become entirely coordinated by the G1 solvent molecules, lacking any extensive anion coordination. | Full points for identifying fully solvated Ca2+ as the dominant species and explaining that the BHFIP anion has weak coordination strength, allowing facile dissociation in G1. |
| q2 | spectral | 30 | What distinguishing structural feature in the first coordination shell characterizes this fully solvated electrolyte compared to a system with strong anion coordination (such as CaTFSI2 in G1)? | The distinguishing structural feature of this fully solvated electrolyte is a shift to a longer first-shell Ca-O bond distance of 2.47 ± 0.01 Å, compared to the shorter 2.42 Å distance seen in strongly coordinated systems like CaTFSI2 in G1. The EXAFS data also shows distinct changes in longer-range radial features between 2.5 and 3.5 Å. These spectral features occur because the weak coordination strength of the BHFIP- anion allows for facile dissociation of the CaBHFIP2 salt in the G1 solvent. Consequently, the first coordination shell is entirely populated by solvent molecules without any coordinated anion atoms, which directly produces the observed longer Ca-O scattering path and altered radial distribution. | Full points for mentioning a longer Ca-O bond distance (approx 2.47 Å) and/or the absence of coordinated anion atoms in the first shell. |
| q3 | identification | 30 | To accurately model the local coordination environment of the dominant Ca species in this electrolyte using X-ray absorption fine structure data, what type of structural model or reference state is required? | To accurately model the local coordination environment of this electrolyte, a fully solvated Ca2+ structural model that accounts only for solvent coordination is required. This specific reference state is necessary because the sample is composed of CaBHFIP2 dissolved in 1,2-dimethoxyethane (G1). Due to the extremely weak coordination strength of the BHFIP- anion toward Ca2+, the salt undergoes facile and complete dissociation in the G1 solvent. As a result, the system yields a 1.0 fraction of fully solvated Ca2+ ions with no anion atoms in the first coordination shell, dictating the use of a pure solvent-coordination model. | Full points for stating a fully solvated Ca2+ structural model (or a model containing only solvent coordination). |
Review
Spectroscopic Characterization of Highly Active Fe–N–C Oxygen Reduction Catalysts and Discovery of Strong Interaction with Nafion Ionomer
BNL-NSLS-II-8-ID
Catalyst
Roman Ezhov et al.
DOI: 10.1021/acsaem.3c02522
2 scenarios
▶
#649
Fe-N-C
Fe K-edge
▶
LLM Prompt
Sample Information
Material: Fe-N-C
Support: carbon
Sample-Specific Conditions
- batch: 1 and 3
- As-prepared highly active Fe-N-C oxygen reduction catalyst
Measurement
We plan to measure the Fe K-edge XANES spectrum of this sample.
Questions
Based on all the information above:
1. Based on the sample conditions (as-prepared highly active Fe-N-C oxygen reduction catalyst, batches 1 and 3), what are the expected dominant and minority Fe phases, and what are their estimated fractions?
2. What reference spectra would be appropriate to use as a basis for Linear Combination Fitting (LCF) of the XANES spectrum for this sample to capture its heterogeneity?
3. Explain the physical reasoning for the expected phase composition of this as-prepared Fe-N-C catalyst, specifically regarding the oxidation states and coordination environments of the Fe species.
Ground Truth
Material: Fe-N-C
Measurement: Fe K-edge XANES in fluorescence mode at APS beamline 20-BM
Fit method: XANES and EXAFS analysis
Phase fractions: (±10%)
| Phase | Fraction |
|---|---|
| Fe-N4 centers | 0.95 |
| Fe metal and/or Fe carbide | 0.05 |
Fit basis (paper's reference spectra):
- Fe-N4 centers
- Fe metal and/or Fe carbide
Source evidence: Abstract and Results/Discussion (Pages 6, 9)
Key reasoning: XANES analysis shows the majority of Fe centers are in the Fe3+ oxidation state, with pre-edge features characteristic of Fe embedded in a distorted phthalocyanine-like Fe-N-C matrix. EXAFS confirms that batch 1 and 3 consist predominantly of mononuclear Fe centers with pyrrolic coordination. A small fraction (<5%) of Fe metal or Fe-carbide nanoparticles (Fe0) is present as a byproduct of the synthesis.
Reasoning source: Results and Discussion, Section 1 (Pages 6-9)
Scoring Rubric (total: 100 pts)
| Q | Type | Max | Question | Reference Answer | Scoring Criteria |
|---|---|---|---|---|---|
| q1 | quantification | 40 | Based on the sample conditions (as-prepared highly active Fe-N-C oxygen reduction catalyst, batches 1 and 3), what are the expected dominant and minority Fe phases, and what are their estimated fractions? | The expected dominant phase is Fe-N4 centers, accounting for approximately 95% of the iron species, while the minority phase consists of Fe metal and/or Fe carbide at about 5% (with a 10% uncertainty). These specific fractions result from the preparation conditions of the highly active Fe-N-C oxygen reduction catalyst (batches 1 and 3), which predominantly form mononuclear Fe3+ centers with pyrrolic coordination. Consequently, the iron is mostly embedded in a distorted phthalocyanine-like Fe-N-C matrix on the carbon support. The small 5% fraction of Fe0 species (Fe metal or Fe-carbide nanoparticles) arises as a minor byproduct of this specific synthesis process. | Full points for identifying Fe-N4 centers (or single-site Fe-N-C) as the dominant phase (>=95%) and metallic iron or Fe-carbide as the minority phase (<=5%). |
| q2 | identification | 30 | What reference spectra would be appropriate to use as a basis for Linear Combination Fitting (LCF) of the XANES spectrum for this sample to capture its heterogeneity? | Appropriate reference spectra for fitting this sample's XANES spectrum would include Fe-N4 centers and Fe metal and/or Fe carbide. These specific references are required because the synthesis of the highly active Fe-N-C oxygen reduction catalyst (batches 1 and 3) predominantly yields mononuclear Fe3+ centers embedded in a distorted phthalocyanine-like matrix with pyrrolic coordination. Furthermore, a reference for Fe0 is necessary because a small fraction (<5%) of Fe metal or Fe-carbide nanoparticles is generated as a byproduct during the preparation of the carbon-supported material. Together, these references perfectly capture the structural heterogeneity resulting from the catalyst's synthesis conditions. | Full points for mentioning a reference for single-site Fe-N4 centers (e.g., a highly pure Fe-N-C batch or Fe phthalocyanine) and a reference for metallic iron (Fe foil) or Fe-carbide. |
| q3 | reasoning | 30 | Explain the physical reasoning for the expected phase composition of this as-prepared Fe-N-C catalyst, specifically regarding the oxidation states and coordination environments of the Fe species. | The expected phase composition of this as-prepared Fe-N-C catalyst (batches 1 and 3) is 95% Fe-N4 centers and 5% Fe metal and/or Fe carbide. This composition occurs because the synthesis conditions on the carbon support predominantly generate mononuclear Fe centers in the Fe3+ oxidation state with pyrrolic coordination. This specific coordination environment embeds the Fe into a distorted phthalocyanine-like Fe-N-C matrix, which produces characteristic pre-edge features in the XANES spectrum. The remaining 5% of the composition consists of Fe0 species (Fe metal or Fe-carbide nanoparticles), which arise as a minor structural byproduct of the catalyst's preparation process. | Full points for explaining that the material predominantly consists of mononuclear Fe3+ centers in a pyrrolic/N4 coordination environment (the active sites), but trace amounts of Fe0 (metallic Fe or Fe-carbide nanoparticles) remain as synthesis byproducts. |
Review
#650
Fe-N-C
Fe K-edge
▶
LLM Prompt
Sample Information
Material: Fe-N-C
Support: carbon
Sample-Specific Conditions
- batch: 2
- As-prepared highly active Fe-N-C oxygen reduction catalyst with slightly higher nanoparticle content
Measurement
We plan to measure the Fe K-edge XANES spectrum of this sample.
Questions
Based on all the information above:
1. What candidate reference spectra are needed to model the Fe K-edge XANES spectrum of this specific batch of Fe-N-C catalyst using linear combination fitting?
Ground Truth
Material: Fe-N-C
Measurement: Fe K-edge XANES, ex-situ, fluorescence mode, APS beamline 20-BM
Fit method: Linear combination fitting (LCF)
Phase fractions: (±10%)
| Phase | Fraction |
|---|---|
| batch 1 | 0.965 |
| Fe metal | 0.045 |
Fit basis (paper's reference spectra):
- Fe metal
- batch 1
Source evidence: Page 6, Results and Discussion, Section 1
Key reasoning: Batch 2 exhibits a slight increase in XANES pre-edge intensity at ~7114 eV compared to other batches. This increase is well captured by a linear combination of spectra for Fe metal (4.5%) and batch 1 (96.5%). This signifies a higher content of Fe0 nanoparticles, such as Fe metal and/or Fe-carbide, which is also supported by more prominent EXAFS peaks at ~2.0 Å and ~4.3 Å corresponding to Fe-Fe interactions.
Reasoning source: Pages 6 and 9, Results and Discussion, Section 1
Scoring Rubric (total: 100 pts)
| Q | Type | Max | Question | Reference Answer | Scoring Criteria |
|---|---|---|---|---|---|
| q1 | identification | 100 | What candidate reference spectra are needed to model the Fe K-edge XANES spectrum of this specific batch of Fe-N-C catalyst using linear combination fitting? | To model the Fe K-edge XANES spectrum of this specific batch 2 Fe-N-C catalyst, the required candidate reference spectra are Fe metal and batch 1. Based on the sample conditions, this specific batch was synthesized with a slightly higher nanoparticle content compared to other batches. This structural difference manifests spectroscopically as a slight increase in the XANES pre-edge intensity at ~7114 eV. Consequently, the batch 1 spectrum serves as the baseline Fe-N-C reference, while the Fe metal spectrum is necessary to accurately capture the higher content of Fe0 nanoparticles, such as Fe metal and/or Fe-carbide. | Full points for identifying a reference for single-site Fe-N4 centers (or a pristine batch of the catalyst) and a reference for metallic iron (Fe0) or iron carbide. |
Review
Anatomy of Local Structural Disorder of Ni(II) Species in MgCl 2 –KCl Molten Salts
BNL-NSLS-II-8-ID
Synthesis
Nirmalendu Patra et al.
DOI: 10.1021/acsaem.5c02944
4 scenarios
▶
#651
Ni(II) in MgCl2-KCl molten salt
Ni K
▶
LLM Prompt
Sample Information
Material: Ni(II) in MgCl2-KCl molten salt
Method: melt mixing
Precursors: MgCl2, KCl, NiCl2 (1.0 wt %)
Temperature C: 550
Atmosphere: Ar
Sample-Specific Conditions
- Temperature and Composition: 550 °C, 32:68 MgCl2:KCl
- Eutectic mixture of MgCl2 and KCl (32:68 molar ratio) with 1 wt% NiCl2 measured at 550 °C.
Preparation
- MgCl2 (anhydrous 99.9%) was purified via sparging with dry air at 800 °C, fractional distillation at 900 °C, and sparging with Cl2 gas at 800 °C. KCl was dried under vacuum at 800 °C. Purified MgCl2 and KCl were fused together under vacuum in a fused silica test tube at 32:68 molar ratio by heating to 800 °C. 1.0 wt % NiCl2 was added and manually mixed under vacuum at 550 °C. Samples were sealed in quartz capillaries under Ar atmosphere.
Measurement
We plan to measure the Ni K XANES spectrum of this sample.
Questions
Based on all the information above:
1. Based on the sample conditions (32:68 MgCl2:KCl at 550 °C), what are the expected dominant Ni(II) coordination states and their approximate phase fractions?
2. Explain the physical reasoning for the observed distribution of Ni(II) coordination states at 550 °C in the 32:68 MgCl2:KCl mixture, specifically addressing the roles of temperature and Mg2+ concentration.
3. What candidate reference spectra or basis functions are required to perform linear combination fitting for this molten salt system, given that some coordination states lack solid-state analogs?
Ground Truth
Material: Ni(II) in MgCl2-KCl molten salt
Measurement: Ni K-edge fluorescence mode at ISS beamline (NSLS-II)
Fit method: Linear combination fitting (LCF) of EXAFS and MCR-ALS of XANES
Phase fractions: (±5%)
| Phase | Fraction |
|---|---|
| Ni(II) CN 4 | 0.679 |
| Ni(II) CN 5 | 0.321 |
Fit basis (paper's reference spectra):
- Computed EXAFS spectra from AIMD trajectories for distinct coordination states (CN 3, 4, 5, 6*)
- MCR-ALS extracted pure component spectra
Source evidence: Table 1, page 7
Key reasoning: In the molten eutectic 32:68 MgCl2-KCl mixture at 550 °C, Ni(II) exists as a mixture of coordination states. The 4-coordinate (CN 4) state is the most stable and dominant. A significant population of 5-coordinate (CN 5) species is also present. Compared to higher temperatures (e.g., 700 °C), the lower thermal energy at 550 °C allows for a higher population of the higher-coordinated CN 5 state. Compared to the equimolar (50:50) mixture, the lower Mg2+ concentration in the eutectic mixture results in less polarization of Cl- ions, making them stronger ligands for Ni(II) and favoring lower coordination numbers overall.
Reasoning source: Section 3.3 (Ab Initio Molecular Dynamics Simulations), page 7 and Section 3.4, page 10
Scoring Rubric (total: 100 pts)
| Q | Type | Max | Question | Reference Answer | Scoring Criteria |
|---|---|---|---|---|---|
| q1 | quantification | 40 | Based on the sample conditions (32:68 MgCl2:KCl at 550 °C), what are the expected dominant Ni(II) coordination states and their approximate phase fractions? | The expected dominant Ni(II) coordination states are 4-coordinate (CN 4) at approximately 67.9% and 5-coordinate (CN 5) at approximately 32.1%. In the 32:68 MgCl2:KCl eutectic mixture at 550 °C, the relatively low Mg2+ concentration reduces the polarization of Cl- ions, making them stronger ligands for Ni(II) and generally favoring lower coordination numbers like CN 4. However, the relatively low thermal energy at 550 °C (compared to higher temperatures like 700 °C) permits a significant population of the higher-coordinated CN 5 state to persist. Thus, the system stabilizes as a mixture where CN 4 is the most stable and dominant, but CN 5 remains a substantial minority phase. | Full points if the answer identifies CN 4 and CN 5 as the dominant states with fractions around 68% and 32% respectively. Partial credit if only the states are identified without accurate fractions. |
| q2 | reasoning | 30 | Explain the physical reasoning for the observed distribution of Ni(II) coordination states at 550 °C in the 32:68 MgCl2:KCl mixture, specifically addressing the roles of temperature and Mg2+ concentration. | The observed distribution of Ni(II) coordination states is driven by the competing effects of thermal energy and melt composition. At 550 °C, the lower thermal energy compared to higher temperatures (e.g., 700 °C) allows for a higher population of the higher-coordinated CN 5 state to exist alongside the dominant CN 4 state. Concurrently, the 32:68 MgCl2:KCl eutectic mixture has a lower Mg2+ concentration than an equimolar (50:50) mixture. This lower Mg2+ concentration results in less polarization of the Cl- ions, which makes them stronger ligands for Ni(II) and ultimately favors the formation of lower coordination numbers overall. | Full points if the answer explains that lower temperature (compared to 700 °C) allows for higher coordination (CN 5) to persist, and that the lower Mg2+ concentration (compared to 50:50) reduces Cl- polarization, favoring lower coordination numbers overall compared to the equimolar melt. |
| q3 | identification | 30 | What candidate reference spectra or basis functions are required to perform linear combination fitting for this molten salt system, given that some coordination states lack solid-state analogs? | To perform linear combination fitting for this molten salt system, the required basis functions include computed EXAFS spectra derived from Ab Initio Molecular Dynamics (AIMD) trajectories for distinct coordination states (CN 3, 4, 5, and 6*), as well as pure component spectra extracted via MCR-ALS of the XANES data. These specific computational and mathematically extracted bases are necessary because the Ni(II) species exist as a dynamic mixture of coordination states (predominantly CN 4 and CN 5) in the 32:68 MgCl2:KCl melt at 550 °C. The specific melt composition dictates that lower Mg2+ concentration reduces Cl- polarization, favoring lower coordination numbers, while the 550 °C temperature allows higher-coordinated states like CN 5 to persist. Because these specific dynamic liquid-state geometries lack direct solid-state analogs, theoretical AIMD models and MCR-ALS extraction are required to accurately represent the structural and electronic properties of the melt. | Full points if the answer specifies the use of computed spectra from ab initio molecular dynamics (AIMD) trajectories for distinct coordination states (CN 3, 4, 5, 6*) or MCR-ALS extracted components. |
Review
#652
Ni(II) in MgCl2-KCl molten salt
Ni K
▶
LLM Prompt
Sample Information
Material: Ni(II) in MgCl2-KCl molten salt
Method: melt mixing
Precursors: MgCl2, KCl, NiCl2 (1.0 wt %)
Temperature C: 700
Atmosphere: Ar
Sample-Specific Conditions
- Temperature and Composition: 700 °C, 32:68 MgCl2:KCl
- Eutectic mixture of MgCl2 and KCl (32:68 molar ratio) with 1 wt% NiCl2 measured at 700 °C.
Preparation
- MgCl2 (anhydrous 99.9%) was purified via sparging with dry air at 800 °C, fractional distillation at 900 °C, and sparging with Cl2 gas at 800 °C. KCl was dried under vacuum at 800 °C. Purified MgCl2 and KCl were fused together under vacuum in a fused silica test tube at 32:68 molar ratio by heating to 800 °C. 1.0 wt % NiCl2 was added and manually mixed under vacuum at 550 °C. Samples were sealed in quartz capillaries under Ar atmosphere.
Measurement
We plan to measure the Ni K XANES spectrum of this sample.
Questions
Based on all the information above:
1. What candidate reference spectra or basis functions are required to model the EXAFS data for this molten salt sample?
2. Estimate the relative fractions of the different Ni(II) coordination states present in this eutectic MgCl2-KCl mixture at 700 °C.
3. How does the high temperature (700 °C) influence the preferred coordination number of Ni(II) in this molten salt compared to lower temperatures?
4. How does the eutectic composition (32:68 MgCl2:KCl) affect the Ni(II) speciation compared to an equimolar composition?
Ground Truth
Material: Ni(II) in MgCl2-KCl molten salt
Measurement: Ni K-edge fluorescence mode at ISS beamline (NSLS-II)
Fit method: Linear combination fitting (LCF) of EXAFS and Multivariate Curve Resolution-Alternating Least-Squares (MCR-ALS) of XANES
Phase fractions: (±5%)
| Phase | Fraction |
|---|---|
| Ni(II) CN 4 | 0.908 |
| Ni(II) CN 5 | 0.092 |
Fit basis (paper's reference spectra):
- AIMD-computed EXAFS spectra for Ni(II) coordination states: CN 3, CN 4, CN 5, and CN 6*
Source evidence: Table 1, page 7
Key reasoning: At 700 °C, increased thermal energy leads to higher atomic vibrations and disorder, weakening Ni-Cl bonds and causing ligand dissociation, which favors lower coordination numbers compared to lower temperatures. Furthermore, in the eutectic composition (32:68), the lower Mg2+ concentration compared to an equimolar mixture results in less polarization of Cl- ions by Mg2+. This makes Cl- stronger ligands for Ni(II), stabilizing the 4-coordinate tetrahedral state (CN 4) as the dominant species and reducing the population of higher coordination states like CN 5.
Reasoning source: Section 3.1 (page 5) and Section 3.3 (page 7)
Scoring Rubric (total: 100 pts)
| Q | Type | Max | Question | Reference Answer | Scoring Criteria |
|---|---|---|---|---|---|
| q1 | identification | 20 | What candidate reference spectra or basis functions are required to model the EXAFS data for this molten salt sample? | To model the EXAFS data for this molten salt sample, the required basis functions are AIMD-computed EXAFS spectra for Ni(II) coordination states with coordination numbers (CN) 3, 4, 5, and 6*. These specific reference states are necessary because the sample is measured at a high temperature of 700 °C, where increased thermal energy weakens Ni-Cl bonds and causes ligand dissociation, favoring lower coordination numbers. Furthermore, the eutectic 32:68 MgCl2:KCl composition features a lower Mg2+ concentration that reduces the polarization of Cl- ions. This makes Cl- a stronger ligand for Ni(II), stabilizing the 4-coordinate state as the dominant species while necessitating the inclusion of adjacent coordination states to capture the full speciation. | Must mention the need for computed spectra or models representing different Ni(II) coordination states, specifically coordination numbers (CN) 3, 4, 5, and 6*. |
| q2 | quantification | 30 | Estimate the relative fractions of the different Ni(II) coordination states present in this eutectic MgCl2-KCl mixture at 700 °C. | The relative fractions of Ni(II) coordination states in this sample are estimated to be 0.908 for CN 4 and 0.092 for CN 5, with an uncertainty of 5%. These specific values result from the high measurement temperature of 700 °C, which increases thermal energy and atomic vibrations, thereby weakening Ni-Cl bonds and favoring lower coordination numbers through ligand dissociation. Additionally, the eutectic 32:68 MgCl2:KCl composition contains a lower Mg2+ concentration compared to an equimolar mixture, resulting in less polarization of Cl- ions by Mg2+. This allows Cl- to act as a stronger ligand for Ni(II), overwhelmingly stabilizing the 4-coordinate tetrahedral state (CN 4) as the dominant species and minimizing the population of the CN 5 state. | Must identify the 4-coordinate state (CN 4) as the dominant species (~91%) and the 5-coordinate state (CN 5) as a minor species (~9%). |
| q3 | reasoning | 25 | How does the high temperature (700 °C) influence the preferred coordination number of Ni(II) in this molten salt compared to lower temperatures? | The high temperature of 700 °C shifts the preferred coordination number of Ni(II) toward lower values compared to lower temperatures, resulting in a mixture of 90.8% CN 4 and 9.2% CN 5. At this elevated temperature, the increased thermal energy leads to higher atomic vibrations and structural disorder within the molten salt. This thermal agitation weakens the Ni-Cl bonds and causes ligand dissociation, which inherently favors lower coordination numbers. When combined with the eutectic 32:68 MgCl2:KCl composition, which provides stronger Cl- ligands due to reduced Mg2+ polarization, the thermal dissociation strongly stabilizes the 4-coordinate tetrahedral state as the dominant species. | Must explain that higher thermal energy increases atomic vibrations and disorder, which weakens Ni-Cl bonds and causes ligand dissociation, thereby favoring lower coordination numbers. |
| q4 | reasoning | 25 | How does the eutectic composition (32:68 MgCl2:KCl) affect the Ni(II) speciation compared to an equimolar composition? | The eutectic composition of 32:68 MgCl2:KCl stabilizes the 4-coordinate tetrahedral state (CN 4) as the overwhelmingly dominant Ni(II) species (90.8%), leaving only 9.2% as CN 5. This occurs because the eutectic mixture has a lower Mg2+ concentration compared to an equimolar composition, which results in less polarization of the Cl- ions by Mg2+. Consequently, the less-polarized Cl- ions act as stronger ligands for the Ni(II) ions. Combined with the high measurement temperature of 700 °C that weakens bonds and promotes ligand dissociation, this strong ligand effect firmly stabilizes the CN 4 state and reduces the formation of higher coordination states like CN 5. | Must explain that the lower Mg2+ concentration in the eutectic mixture leads to less polarization of Cl- ions, making them stronger ligands for Ni(II) and stabilizing the CN 4 state over higher coordination states. |
Review
#653
Ni(II) in MgCl2-KCl molten salt
Ni K
▶
LLM Prompt
Sample Information
Material: Ni(II) in MgCl2-KCl molten salt
Method: melt mixing
Precursors: MgCl2, KCl, NiCl2 (1.0 wt %)
Temperature C: 550
Atmosphere: Ar
Sample-Specific Conditions
- Temperature and Composition: 550 °C, 50:50 MgCl2:KCl
- Equimolar mixture of MgCl2 and KCl (50:50 molar ratio) with 1 wt% NiCl2 measured at 550 °C.
Preparation
- MgCl2 (anhydrous 99.9%) was purified via sparging with dry air at 800 °C, fractional distillation at 900 °C, and sparging with Cl2 gas at 800 °C. KCl was dried under vacuum at 800 °C. Purified MgCl2 and KCl were fused together under vacuum in a fused silica test tube at 50:50 molar ratio by heating to 800 °C. 1.0 wt % NiCl2 was added and manually mixed under vacuum at 550 °C. Samples were sealed in quartz capillaries under Ar atmosphere.
Measurement
We plan to measure the Ni K XANES spectrum of this sample.
Questions
Based on all the information above:
1. Based on the sample conditions (50:50 MgCl2-KCl at 550 °C), what are the expected dominant coordination states of Ni(II) and their approximate phase fractions?
2. What reference spectra or basis functions are required to perform linear combination fitting for this molten salt system where pure experimental standards for intermediate coordination states are unavailable?
Ground Truth
Material: Ni(II) in MgCl2-KCl molten salt
Measurement: Ni K-edge fluorescence XAS at ISS beamline, NSLS-II
Fit method: Linear combination fitting (LCF)
Phase fractions: (±10%)
| Phase | Fraction |
|---|---|
| Ni(II) CN 4 | 0.502 |
| Ni(II) CN 5 | 0.498 |
Fit basis (paper's reference spectra):
- AIMD-computed EXAFS spectrum for Ni(II) CN 3
- AIMD-computed EXAFS spectrum for Ni(II) CN 4
- AIMD-computed EXAFS spectrum for Ni(II) CN 5
- AIMD-computed EXAFS spectrum for Ni(II) CN 6*
Source evidence: Table 1, page 7
Key reasoning: At 550 °C, the 50:50 MgCl2-KCl mixture is molten, causing the solid-state octahedral (CN 6*) coordination to break down into lower coordination states due to thermal disorder. The equimolar composition has a higher Mg2+ concentration than the eutectic mixture, which strongly polarizes the Cl- ions. This polarization makes Cl- weaker ligands for Ni(II), reducing the repulsion between them and allowing a higher coordination number (CN 5) to coexist in roughly equal proportions with the tetrahedral state (CN 4).
Reasoning source: Section 3.3, page 7 and Conclusion, page 11
Scoring Rubric (total: 100 pts)
| Q | Type | Max | Question | Reference Answer | Scoring Criteria |
|---|---|---|---|---|---|
| q1 | quantification | 67 | Based on the sample conditions (50:50 MgCl2-KCl at 550 °C), what are the expected dominant coordination states of Ni(II) and their approximate phase fractions? | The expected dominant coordination states of Ni(II) in this system are CN 4 and CN 5, with approximate phase fractions of 0.502 (50.2%) and 0.498 (49.8%), respectively, subject to a 10% uncertainty. These specific fractions arise because heating the sample to 550 °C melts the 50:50 MgCl2-KCl mixture, causing the initial solid-state octahedral (CN 6*) coordination to break down into lower coordination states due to thermal disorder. Additionally, the equimolar composition has a higher Mg2+ concentration than a eutectic mixture, which strongly polarizes the Cl- ions. This polarization makes the Cl- ions weaker ligands for Ni(II), reducing the repulsion between them and allowing the higher coordination number (CN 5) to coexist in roughly equal proportions with the tetrahedral state (CN 4). | Full credit for identifying CN 4 and CN 5 as the dominant states with fractions around 50% each (e.g., 0.502 and 0.498). Partial credit for identifying the correct states but incorrect fractions, or if other minor states are heavily weighted. |
| q2 | identification | 33 | What reference spectra or basis functions are required to perform linear combination fitting for this molten salt system where pure experimental standards for intermediate coordination states are unavailable? | To perform linear combination fitting (LCF) for this system, the required basis functions are AIMD-computed EXAFS spectra for Ni(II) with coordination numbers (CN) 3, 4, 5, and 6*. These computed theoretical standards are necessary because the sample is a 50:50 MgCl2-KCl molten salt at 550 °C, where thermal disorder breaks down the solid-state octahedral structure into a dynamic mixture of lower coordination states. Specifically, the high Mg2+ concentration in this equimolar mixture strongly polarizes the Cl- ions and reduces ligand repulsion, causing intermediate states like CN 5 and CN 4 to coexist. Since pure experimental standards for these specific intermediate molten coordination states cannot be physically isolated, the AIMD-computed spectra for CN 3, 4, 5, and 6* must be used to accurately model the structural distribution. | Full credit for stating that computed spectra (e.g., from AIMD or similar first-principles molecular dynamics) for specific coordination numbers (CN 3, CN 4, CN 5, CN 6*) are needed as basis functions. |
Review
#654
Ni(II) in MgCl2-KCl molten salt
Ni K
▶
LLM Prompt
Sample Information
Material: Ni(II) in MgCl2-KCl molten salt
Method: melt mixing
Precursors: MgCl2, KCl, NiCl2 (1.0 wt %)
Temperature C: 700
Atmosphere: Ar
Sample-Specific Conditions
- Temperature and Composition: 700 °C, 50:50 MgCl2:KCl
- Equimolar mixture of MgCl2 and KCl (50:50 molar ratio) with 1 wt% NiCl2 measured at 700 °C.
Preparation
- MgCl2 (anhydrous 99.9%) was purified via sparging with dry air at 800 °C, fractional distillation at 900 °C, and sparging with Cl2 gas at 800 °C. KCl was dried under vacuum at 800 °C. Purified MgCl2 and KCl were fused together under vacuum in a fused silica test tube at 50:50 molar ratio by heating to 800 °C. 1.0 wt % NiCl2 was added and manually mixed under vacuum at 550 °C. Samples were sealed in quartz capillaries under Ar atmosphere.
Measurement
We plan to measure the Ni K XANES spectrum of this sample.
Questions
Based on all the information above:
1. What candidate coordination states (reference spectra) should be considered when modeling the local structure of Ni(II) in this molten salt system using linear combination fitting?
2. Given the high temperature (700 °C) and equimolar composition (50:50 MgCl2:KCl), estimate the relative fractions of the dominant Ni(II) coordination states.
Ground Truth
Material: Ni(II) in MgCl2-KCl molten salt
Measurement: Ni K-edge fluorescence mode at ISS beamline (NSLS-II)
Fit method: LCF of EXAFS
Phase fractions: (±8%)
| Phase | Fraction |
|---|---|
| Ni(II) CN 4 | 0.862 |
| Ni(II) CN 5 | 0.138 |
Fit basis (paper's reference spectra):
- AIMD-computed EXAFS spectra for distinct coordination states (CN 3, CN 4, CN 5, CN 6*)
Source evidence: Table 1, page 7
Key reasoning: At a high temperature of 700 °C, increased thermal energy leads to higher atomic vibrations and disorder, weakening Ni-Cl bonds and favoring lower coordination numbers, making the 4-coordinate state dominant. However, the equimolar 50:50 composition has a higher Mg2+ concentration than the eutectic mixture. The stronger polarizing power of the divalent Mg2+ directs more electron density of the Cl- ions toward Mg2+, making them weaker ligands for Ni2+ and reducing repulsion between them, which enables a minor but significant population of the 5-coordinate state.
Reasoning source: Section 3.3, page 7
Scoring Rubric (total: 100 pts)
| Q | Type | Max | Question | Reference Answer | Scoring Criteria |
|---|---|---|---|---|---|
| q1 | identification | 33 | What candidate coordination states (reference spectra) should be considered when modeling the local structure of Ni(II) in this molten salt system using linear combination fitting? | When modeling the local structure of Ni(II) in this molten salt system, the candidate reference spectra to consider are AIMD-computed EXAFS spectra for distinct coordination states, specifically coordination numbers (CN) 3, 4, 5, and 6*. These specific phases must be considered because the high measurement temperature of 700 °C increases thermal energy and atomic disorder, weakening Ni-Cl bonds and favoring lower coordination numbers like CN 4. Concurrently, the 50:50 MgCl2:KCl equimolar composition introduces a high concentration of strongly polarizing Mg2+ ions. These Mg2+ ions direct electron density away from the Cl- ligands, reducing ligand-ligand repulsion around the Ni2+ center and enabling the formation of higher coordination states like CN 5, necessitating a broad basis set to capture all structural variations. | Full points for identifying that multiple coordination states (e.g., CN 3, 4, 5, 6) need to be considered as basis functions. |
| q2 | quantification | 67 | Given the high temperature (700 °C) and equimolar composition (50:50 MgCl2:KCl), estimate the relative fractions of the dominant Ni(II) coordination states. | The estimated relative fractions for the Ni(II) coordination states are 86.2% for 4-coordinate Ni(II) and 13.8% for 5-coordinate Ni(II), with an uncertainty of 8%. The dominance of the 4-coordinate state (0.862 fraction) is a direct result of the high 700 °C temperature, which provides increased thermal energy that drives atomic vibrations, weakens Ni-Cl bonds, and favors lower coordination numbers. However, the 50:50 MgCl2:KCl equimolar composition contains a higher concentration of Mg2+ than a eutectic mixture. The stronger polarizing power of these divalent Mg2+ ions pulls electron density from the Cl- ions, making them weaker ligands for Ni2+ and reducing their mutual repulsion, which allows for the minor but significant 13.8% population of the 5-coordinate state. | Full points for estimating that the 4-coordinate state (CN 4) is highly dominant (~85-90%), with the 5-coordinate state (CN 5) making up the remainder (~10-15%). |
Review
Origin of Electronic Modification of Platinum in a Pt3V Alloy and Its Consequences for Propane Dehydrogenation Catalysis
APS
Catalyst
Stephen C. Purdy et al.
DOI: 10.1021/acsaem.9b01373
3 scenarios
▶
#655
Pt
Pt L3
▶
LLM Prompt
Sample Information
Material: Pt
Support: SiO2
Reaction Conditions: measured at room temperature in He
Sample-Specific Conditions
- Pt/V ratio: 3 wt% Pt, 0 wt% V
- Monometallic Pt nanoparticles on silica
Measurement
We plan to measure the Pt L3 XANES spectrum of this sample.
Questions
Based on all the information above:
1. What is the expected Pt L3 edge energy for this reduced monometallic Pt nanoparticle sample, and how does its white line shape compare to that of a Pt3V alloy?
2. Given the reduction treatment at 550°C in H2, what is the expected oxidation state of the Pt nanoparticles, and what specific XANES spectral evidence supports this?
Ground Truth
Material: Pt
Measurement: Pt L3 edge in-situ XAS in transmission mode at MRCAT bending magnet line (10BM)
Fit method: not reported for XANES (edge energy determined by first zero crossing of the second derivative)
Phase fractions: (±10%)
| Phase | Fraction |
|---|---|
| metallic_platinum | 1.0 |
Fit basis (paper's reference spectra):
- Pt foil
Source evidence: Table 1, Figure 3a, page 17
Key reasoning: The 3Pt sample consists of monometallic Pt nanoparticles. After reduction at 550°C in H2, the Pt L3 edge energy is identical to the Pt foil reference (11.5640 keV), indicating a fully reduced metallic state (Pt0). The white line intensity is lower and broader compared to the Pt3V alloy samples, which is characteristic of pure Pt nanoparticles.
Reasoning source: Electronic Characterization section, page 17
Scoring Rubric (total: 100 pts)
| Q | Type | Max | Question | Scoring Criteria |
|---|---|---|---|---|
| q1 | spectral | 57 | What is the expected Pt L3 edge energy for this reduced monometallic Pt nanoparticle sample, and how does its white line shape compare to that of a Pt3V alloy? | Full points if the answer states the edge energy is 11564.0 eV (or identical to Pt foil) and notes that the white line is broader and lower in intensity compared to the Pt3V alloy. |
| q2 | reasoning | 43 | Given the reduction treatment at 550°C in H2, what is the expected oxidation state of the Pt nanoparticles, and what specific XANES spectral evidence supports this? | Full points if the answer identifies the oxidation state as 0 (metallic) and cites the edge energy matching the Pt foil reference (11.5640 keV) as evidence. |
Review
#656
Pt-V
Pt L3
▶
LLM Prompt
Sample Information
Material: Pt-V
Support: SiO2
Reaction Conditions: measured at room temperature in He
Sample-Specific Conditions
- Pt/V ratio: 5 wt% Pt, 5 wt% V
- Pt-V bimetallic nanoparticles on silica
Measurement
We plan to measure the Pt L3 XANES spectrum of this sample.
Questions
Based on all the information above:
1. Based on the sample conditions (5 wt% Pt, 5 wt% V on SiO2, reduced at 550°C), what are the expected Pt-containing phases and their approximate fractions?
2. Explain the physical reasoning for the expected phase composition and structural arrangement of the Pt-V nanoparticles in this sample.
3. What structural models or reference phases would be necessary to quantify the Pt speciation in this sample using X-ray absorption spectroscopy?
Ground Truth
Material: Pt-V
Measurement: in-situ Pt L3 edge XANES and EXAFS in transmission mode at MRCAT 10BM
Fit method: EXAFS coordination number analysis
Phase fractions: (±15%)
| Phase | Fraction |
|---|---|
| Pt3V | 0.7 |
| metallic_platinum | 0.3 |
Fit basis (paper's reference spectra):
- Pt3V alloy
- metallic Pt core
Source evidence: Page 28, text
Key reasoning: The 5Pt-5V sample has a Pt-V:Pt-Pt neighbor ratio lower than bulk Pt3V, indicating it is Pt rich with respect to Pt3V. Surface oxidation difference XAS and XRD demonstrate a core-shell structure with a Pt core and a Pt3V shell. Because the ratio of Pt-V to Pt-Pt in the Pt3V alloy is fixed at 0.5, the total Pt-Pt coordination can be separated into alloy and core contributions, yielding a 70% alloy phase fraction and a 30% Pt core phase fraction.
Reasoning source: Discussion section, Structural Model, Page 28
Scoring Rubric (total: 100 pts)
| Q | Type | Max | Question | Reference Answer | Scoring Criteria |
|---|---|---|---|---|---|
| q1 | quantification | 40 | Based on the sample conditions (5 wt% Pt, 5 wt% V on SiO2, reduced at 550°C), what are the expected Pt-containing phases and their approximate fractions? | The expected Pt-containing phases for this sample are a Pt3V alloy at approximately 70% and a metallic Pt core at approximately 30%. These specific fractions arise because the 5 wt% Pt and 5 wt% V bimetallic nanoparticles on silica are Pt-rich with respect to a pure Pt3V phase. This composition results in a Pt-V to Pt-Pt neighbor ratio that is lower than that of bulk Pt3V, driving the formation of a core-shell structure. Because the ratio of Pt-V to Pt-Pt in the Pt3V alloy shell is fixed at 0.5, the total Pt-Pt coordination can be mathematically separated to yield the 70% alloy and 30% metallic core phase fractions. | 20 points for identifying Pt3V and metallic Pt. 20 points for estimating fractions of approximately 70% Pt3V and 30% metallic Pt. |
| q2 | reasoning | 40 | Explain the physical reasoning for the expected phase composition and structural arrangement of the Pt-V nanoparticles in this sample. | The 5 wt% Pt and 5 wt% V bimetallic nanoparticles on silica form a core-shell structure consisting of a metallic Pt core and a Pt3V alloy shell. This structural arrangement occurs because the 5Pt-5V composition is Pt-rich relative to a pure Pt3V phase, which manifests as a lower Pt-V to Pt-Pt neighbor ratio than bulk Pt3V. Surface oxidation difference XAS and XRD confirm this segregation into a core and shell. Because the Pt-V to Pt-Pt ratio in the Pt3V alloy shell is fixed at 0.5, the excess Pt-Pt coordination must be attributed to a distinct metallic Pt core, explaining the resulting 70% Pt3V and 30% metallic Pt phase distribution. | 20 points for identifying a core-shell structure (Pt core, Pt3V shell). 20 points for explaining that the overall composition is Pt-rich relative to Pt3V, leading to a phase mixture where the excess Pt forms the core. |
| q3 | identification | 20 | What structural models or reference phases would be necessary to quantify the Pt speciation in this sample using X-ray absorption spectroscopy? | To quantify the Pt speciation in this sample, structural models for a Pt3V alloy and a metallic Pt core are necessary. These specific reference phases are required because the 5 wt% Pt and 5 wt% V bimetallic nanoparticles on silica form a segregated core-shell structure rather than a single uniform alloy. The sample's overall Pt-rich nature relative to Pt3V yields a lower Pt-V to Pt-Pt neighbor ratio than bulk Pt3V, necessitating both a metallic Pt phase for the core and a Pt3V phase for the shell to accurately model the EXAFS coordination numbers. By using these two bases, the fixed 0.5 ratio of Pt-V to Pt-Pt in the alloy allows the separation of the total coordination into the observed 70% Pt3V alloy and 30% metallic Pt core contributions. | 10 points for mentioning a Pt3V alloy reference/model. 10 points for mentioning a metallic Pt reference/model. |
Review
#657
Pt-V
Pt L3
▶
LLM Prompt
Sample Information
Material: Pt-V
Support: SiO2
Reaction Conditions: measured at room temperature in He
Sample-Specific Conditions
- Pt/V ratio: 2 wt% Pt, 5 wt% V
- Pt-V bimetallic nanoparticles on silica
Measurement
We plan to measure the Pt L3 XANES spectrum of this sample.
Questions
Based on all the information above:
1. Based on the sample conditions (2 wt% Pt, 5 wt% V on SiO2, reduced at 550°C), what specific Pt-V alloy phase is expected to dominate, and what structural metric confirms this pure phase assignment?
2. Describe the expected changes in the Pt L3-edge XANES white line shape and edge position for this sample compared to a monometallic Pt reference.
Ground Truth
Material: Pt-V
Measurement: Pt L3 edge in-situ XANES in transmission mode at MRCAT 10BM
Fit method: Phase identified via EXAFS coordination number ratio; XANES LCF not reported
Phase fractions: (±10%)
| Phase | Fraction |
|---|---|
| Pt3V | 1.0 |
Fit basis (paper's reference spectra):
- Pt3V
Source evidence: Page 14, Page 17, Table 1, Figure 3a
Key reasoning: The 2Pt-5V sample has a Pt-Pt coordination number of 6.2 and a Pt-V coordination number of 2.9, giving a Pt-V/Pt-Pt coordination number ratio of 0.47. This closely matches the theoretical ratio of 0.5 for the Pt3V phase, suggesting that 2Pt-5V is a pure phase Pt3V alloy. The lower Pt loading relative to V allows for complete alloying without the formation of a Pt core, which occurs in higher Pt loading samples.
Reasoning source: Page 14 (Structural Characterization) and Page 17 (Electronic Characterization)
Scoring Rubric (total: 100 pts)
| Q | Type | Max | Question | Reference Answer | Scoring Criteria |
|---|---|---|---|---|---|
| q1 | identification | 50 | Based on the sample conditions (2 wt% Pt, 5 wt% V on SiO2, reduced at 550°C), what specific Pt-V alloy phase is expected to dominate, and what structural metric confirms this pure phase assignment? | The sample is expected to consist entirely of a pure phase Pt3V alloy. This pure phase forms because the specific sample conditions—specifically the lower Pt loading (2 wt%) relative to V (5 wt%)—allow for complete alloying without the formation of a segregated Pt core, which typically occurs at higher Pt loadings. This assignment is confirmed by the EXAFS structural metrics, which show a Pt-Pt coordination number of 6.2 and a Pt-V coordination number of 2.9. The resulting Pt-V/Pt-Pt coordination number ratio of 0.47 closely matches the theoretical ratio of 0.5 expected for the Pt3V phase. | Full points for identifying Pt3V as the pure phase and mentioning the Pt-V to Pt-Pt coordination number ratio (~0.5) as the confirming metric. |
| q2 | spectral | 50 | Describe the expected changes in the Pt L3-edge XANES white line shape and edge position for this sample compared to a monometallic Pt reference. | For this sample, the Pt L3-edge XANES spectrum will exhibit an edge energy shifted 0.4 eV higher (to 11564.4 eV) compared to a Pt foil reference (11564.0 eV). Furthermore, the white line shape becomes narrower and higher in intensity compared to a monometallic Pt nanoparticle of equivalent size. These spectral features arise because the specific 2 wt% Pt and 5 wt% V composition leads to complete alloying into a Pt3V phase without a Pt core. The resulting Pt-V bonding causes d-band broadening, which increases the energy of the Pt 5d unfilled states and produces the observed positive edge shift and increased white line intensity, rather than electron transfer to the d-band. | Full points for stating the white line becomes narrower and higher in intensity, and the edge position shifts to a higher energy (specifically +0.4 eV or 11564.4 eV). |
Review
Ex Situ and Operando XRD and XAS Analysis of MoS 2 : A Lithiation Study of Bulk and Nanosheet Materials
BNL-NSLS-II-8-ID
Electrochemistry
Calvin D. Quilty et al.
DOI: 10.1021/acsaem.9b01538
4 scenarios
▶
#658
Bulk MoS2
Mo K
▶
LLM Prompt
Sample Information
Material: Bulk MoS2
Electrode Type: cathode
Electrolyte: 1 M LiPF6 in 3:7 ethylene carbonate: dimethyl carbonate
Cell Type: coin cell
Charge Discharge: OCV
C Rate: 160 mA/g
Sample-Specific Conditions
- cycle_number: 0
- Pristine bulk MoS2 electrode before cycling
Measurement
We plan to measure the Mo K XANES spectrum of this sample.
Questions
Based on all the information above:
1. What is the expected dominant crystallographic phase for the pristine bulk MoS2 electrode, and what is its local coordination geometry?
2. Describe the expected Mo K-edge position and the key spectral features (energies) of the pristine bulk MoS2 XANES spectrum.
Ground Truth
Material: Bulk MoS2
Measurement: Mo K-edge, transmission mode, Sector 10-BM of the Advanced Photon Source
Fit method: Not applicable (pure phase, qualitative XANES comparison used)
Phase fractions: (±5%)
| Phase | Fraction |
|---|---|
| 2H-MoS2 | 1.0 |
Fit basis (paper's reference spectra):
- Mo metal powder
- MoO3 standards
Source evidence: Figure 9a (XANES), Figure 3 and Table 3 (XRD phase identification)
Key reasoning: The pristine bulk MoS2 crystallizes in the thermodynamically stable 2H phase, characterized by MoS6 units with trigonal prismatic coordination. XRD Rietveld refinement confirms all peaks index to 2H-MoS2 with no crystalline impurities. The XANES edge energy is ~20,007 eV, consistent with the Mo(IV) oxidation state.
Reasoning source: RESULTS AND DISCUSSION, pages 6-7 (XRD) and page 13 (XANES)
Scoring Rubric (total: 100 pts)
| Q | Type | Max | Question | Reference Answer | Scoring Criteria |
|---|---|---|---|---|---|
| q1 | identification | 45 | What is the expected dominant crystallographic phase for the pristine bulk MoS2 electrode, and what is its local coordination geometry? | The expected dominant crystallographic phase for the pristine bulk MoS2 electrode is 2H-MoS2, which accounts for a 1.0 phase fraction. In this phase, the local coordination geometry consists of MoS6 units with trigonal prismatic coordination. This specific phase is expected because the sample is at open circuit voltage (cycle 0) before any electrochemical cycling or lithiation has occurred. Under these pristine, uncycled conditions, the bulk MoS2 remains in its thermodynamically stable 2H phase with a Mo(IV) oxidation state, and XRD confirms the absence of any crystalline impurities. | Full points for identifying the 2H-MoS2 phase and stating the trigonal prismatic coordination of the MoS6 units. |
| q2 | spectral | 55 | Describe the expected Mo K-edge position and the key spectral features (energies) of the pristine bulk MoS2 XANES spectrum. | The expected Mo K-edge position for the pristine bulk MoS2 spectrum is approximately 20,007 eV, defined by the maximum of the first derivative. The spectrum is characterized by a pronounced, high-intensity white-line feature at 20,032 eV and a low-intensity lower energy feature at 20,017 eV. These specific spectral features arise because the sample is an uncycled (cycle 0, OCV) pristine electrode, meaning it remains in the thermodynamically stable 2H-MoS2 phase. The ~20,007 eV edge energy reflects the unperturbed Mo(IV) oxidation state, while the strong 20,032 eV peak and lack of pronounced 20,017 eV intensity confirm that no electrochemical discharge or lithiation has yet occurred to alter the structure. | Full points for stating the edge energy is ~20,007 eV and identifying the pronounced white-line feature at 20,032 eV. |
Review
#659
Bulk MoS2
Mo K
▶
LLM Prompt
Sample Information
Material: Bulk MoS2
Electrode Type: cathode
Electrolyte: 1 M LiPF6 in 3:7 ethylene carbonate: dimethyl carbonate
Cell Type: coin cell
Charge Discharge: discharged
C Rate: 160 mA/g
Voltage V: 0.8
Cycle Number: 1
Sample-Specific Conditions
- cycle_number: 1
- Bulk MoS2 electrode discharged to 0.8 V in cycle 1
Measurement
We plan to measure the Mo K XANES spectrum of this sample.
Questions
Based on all the information above:
1. What candidate reference structures or theoretical models are needed to fit the local structure of bulk MoS2 discharged to 0.8 V in cycle 1?
2. How do the Mo-Mo coordination numbers in the EXAFS fitting reflect the phase composition of the bulk MoS2 discharged to 0.8 V?
Ground Truth
Material: Bulk MoS2
Measurement: Mo K-edge (20,000 eV) XAS in transmission mode at Sector 10-BM of the Advanced Photon Source
Fit method: EXAFS shell fitting (no XANES LCF reported)
Phase fractions: (±10%)
| Phase | Fraction |
|---|---|
| 2H-MoS2 | 0.833 |
| distorted 1T-MoS2 | 0.167 |
Fit basis (paper's reference spectra):
- 2H-MoS2 theoretical model (FEFF6)
- distorted 1T-MoS2 theoretical model (FEFF6)
Source evidence: Page 14 text (EXAFS fitting n=5 and n=1) and Page 11 Table 3 (XRD 87% 2H, 13% 1T)
Key reasoning: Electrochemical lithiation of bulk 2H-MoS2 induces a partial phase conversion to 1T-MoS2 as lithium intercalates. The EXAFS fitting for the cycle 1 discharge to 0.8 V uses a degeneracy of n=5 for 2H Mo-Mo and n=1 for distorted 1T Mo-Mo, which is consistent with the ~13% 1T phase fraction determined by XRD.
Reasoning source: Page 14, EXAFS fitting discussion; Page 10-11, in situ XRD discussion
Scoring Rubric (total: 100 pts)
| Q | Type | Max | Question | Reference Answer | Scoring Criteria |
|---|---|---|---|---|---|
| q1 | identification | 50 | What candidate reference structures or theoretical models are needed to fit the local structure of bulk MoS2 discharged to 0.8 V in cycle 1? | To fit the local structure of this sample, theoretical models (FEFF6) for both 2H-MoS2 and distorted 1T-MoS2 are required. These specific models are needed because during the first cycle discharge to 0.8 V, the electrochemical lithiation of the bulk 2H-MoS2 cathode induces a partial phase conversion. As lithium intercalates into the material, a portion of the initial 2H phase structurally transforms into the distorted 1T-MoS2 phase. Consequently, both the pristine 2H-MoS2 and the newly formed distorted 1T-MoS2 models must be included to accurately represent the mixed-phase state of the lithiated electrode. | Must identify 2H-MoS2 and distorted 1T-MoS2 (or 1T'-MoS2) as the necessary components. |
| q4 | reasoning | 50 | How do the Mo-Mo coordination numbers in the EXAFS fitting reflect the phase composition of the bulk MoS2 discharged to 0.8 V? | The EXAFS fitting reflects the phase composition by utilizing specific Mo-Mo coordination numbers (degeneracies) of n=5 for the 2H phase and n=1 for the distorted 1T phase. When the bulk MoS2 cathode is discharged to 0.8 V in the first cycle, electrochemical lithium intercalation drives a partial structural transition from the initial 2H phase to the 1T phase. This specific discharge condition results in a mixed-phase composition of 83.3% 2H-MoS2 and 16.7% distorted 1T-MoS2. The chosen degeneracies of n=5 and n=1 directly capture this partial conversion, which is also consistent with the ~13% 1T phase fraction independently determined by XRD for this lithiated state. | Must mention that the Mo-Mo path is fit with a degeneracy of n=5 for the 2H phase and n=1 for the distorted 1T phase, corresponding to a ~5/6 (83.3%) to 1/6 (16.7%) ratio. |
Review
#660
Bulk MoS2
Mo K
▶
LLM Prompt
Sample Information
Material: Bulk MoS2
Electrode Type: cathode
Electrolyte: 1 M LiPF6 in 3:7 ethylene carbonate: dimethyl carbonate
Cell Type: coin cell
Charge Discharge: discharged
C Rate: 160 mA/g
Voltage V: 0.8
Cycle Number: 20
Sample-Specific Conditions
- cycle_number: 20
- Bulk MoS2 electrode discharged to 0.8 V in cycle 20
Measurement
We plan to measure the Mo K XANES spectrum of this sample.
Questions
Based on all the information above:
1. What structural phases must be included as theoretical models to accurately fit the local coordination environment of the bulk MoS2 electrode discharged to 0.8 V after 20 cycles?
2. Estimate the phase fractions of the structural polymorphs present in the bulk MoS2 electrode after 20 discharge cycles to 0.8 V.
3. Explain the physical reasoning for the estimated phase fractions after 20 cycles. How does the EXAFS data (specifically the Mo-Mo interactions) support this quantification compared to the pristine state?
Ground Truth
Material: Bulk MoS2
Measurement: Mo K-edge, transmission mode, Sector 10-BM of the Advanced Photon Source
Fit method: EXAFS fitting using theoretical models
Phase fractions: (±15%)
| Phase | Fraction |
|---|---|
| 2H-MoS2 | 0.5 |
| distorted 1T-MoS2 | 0.5 |
Fit basis (paper's reference spectra):
- 2H-MoS2 theoretical model
- distorted 1T-MoS2 theoretical model
Source evidence: Page 15, paragraph 2; Figure 9b
Key reasoning: Upon discharge to 20 cycles, the Mo-Mo peak in the EXAFS Fourier transform splits more severely relative to cycle 1, indicating an increased presence of the distorted 1T phase. The 20 cycle discharge scan was fit with 2H and distorted 1T Mo-Mo paths, where the coordination number n=3 for both phases. Since the pristine pure phase has a coordination number of n=6, an n=3 for both the 2H and 1T phases indicates a 50/50 mixture of the two phases. Furthermore, the XANES spectra show a permanent decrease in intensity at 20,032 eV and an increase at 20,017 eV upon discharge, which remains after 20 cycles.
Reasoning source: Page 13 (XANES discussion) and Page 15 (EXAFS discussion)
Scoring Rubric (total: 101 pts)
| Q | Type | Max | Question | Reference Answer | Scoring Criteria |
|---|---|---|---|---|---|
| q1 | identification | 25 | What structural phases must be included as theoretical models to accurately fit the local coordination environment of the bulk MoS2 electrode discharged to 0.8 V after 20 cycles? | To accurately fit the local coordination environment of the bulk MoS2 electrode discharged to 0.8 V after 20 cycles, theoretical models for both the 2H-MoS2 and distorted 1T-MoS2 phases must be included. These phases are expected under these specific sample conditions because repeated electrochemical cycling to 0.8 V induces a structural transition in the bulk material. This is evidenced by the EXAFS Fourier transform, which shows a severe splitting of the Mo-Mo peak relative to the first cycle, indicating an increased presence of the distorted 1T phase. Additionally, the XANES spectra display a permanent decrease in intensity at 20,032 eV and an increase at 20,017 eV upon discharge, confirming the coexistence of these two phases after 20 cycles. | Full credit for identifying both the 2H-MoS2 and the distorted 1T-MoS2 phases as the necessary components for the fit. |
| q2 | quantification | 38 | Estimate the phase fractions of the structural polymorphs present in the bulk MoS2 electrode after 20 discharge cycles to 0.8 V. | The estimated phase fractions for the bulk MoS2 electrode after 20 discharge cycles to 0.8 V are 50% 2H-MoS2 and 50% distorted 1T-MoS2, with an uncertainty of 15%. These specific values result from the structural changes driven by extended electrochemical cycling of the bulk MoS2 to 0.8 V. When fitting the EXAFS data for this cycled sample, both the 2H and distorted 1T Mo-Mo paths yield a coordination number of n=3. Because the pristine pure phase has a coordination number of n=6, obtaining n=3 for both structural paths mathematically dictates a 50/50 mixture of the two polymorphs. | Full credit for estimating a 50/50 mixture (or 0.5 each) of the 2H and distorted 1T phases. |
| q3 | reasoning | 38 | Explain the physical reasoning for the estimated phase fractions after 20 cycles. How does the EXAFS data (specifically the Mo-Mo interactions) support this quantification compared to the pristine state? | The 50/50 phase mixture of 2H and distorted 1T-MoS2 is physically driven by the repeated electrochemical lithiation of the bulk MoS2 electrode discharged to 0.8 V over 20 cycles. Compared to the pristine state, the EXAFS Fourier transform of the 20-cycle discharged sample exhibits a more severe splitting of the Mo-Mo peak, which signifies an increased accumulation of the distorted 1T phase. During EXAFS fitting, the Mo-Mo paths for both the 2H and distorted 1T phases yield a coordination number of n=3. Since the pristine pure phase possesses a full coordination number of n=6, the reduction to n=3 for each individual path directly supports and quantifies the 50/50 mixture of the two structural polymorphs. | Full credit for explaining that the Mo-Mo peak in the EXAFS Fourier transform splits, and fitting yields a coordination number of n=3 for both the 2H and distorted 1T paths. Mentioning that the pristine state has n=6, meaning n=3 for both indicates a 50% conversion, is required for full points. |
Review
#661
Nanosheet MoS2
Mo K
▶
LLM Prompt
Sample Information
Material: Nanosheet MoS2
Electrode Type: cathode
Electrolyte: 1 M LiPF6 in 3:7 ethylene carbonate: dimethyl carbonate
Cell Type: coin cell
Charge Discharge: OCV
C Rate: 160 mA/g
Sample-Specific Conditions
- cycle_number: 0
- Pristine nanosheet MoS2 electrode before cycling
Measurement
We plan to measure the Mo K XANES spectrum of this sample.
Questions
Based on all the information above:
1. Based on the sample conditions (pristine nanosheet MoS2), what is the expected dominant crystallographic phase, and what is the expected oxidation state of Mo?
2. Describe the expected Mo K-edge XANES spectral shape for this pristine nanosheet material, including the specific edge position and the energies of key pronounced features.
Ground Truth
Material: Nanosheet MoS2
Measurement: Mo K-edge, transmission mode, Sector 10-BM of the Advanced Photon Source
Fit method: qualitative comparison
Phase fractions: (±5%)
| Phase | Fraction |
|---|---|
| 1T'-MoS2 | 1.0 |
Fit basis (paper's reference spectra):
- MoO3 standard
- Mo metal standard
- Bulk 2H-MoS2
Source evidence: Figure 10, Figure 11a, Page 15
Key reasoning: The pristine nanosheet MoS2 is identified as the metastable 1T' phase with distorted MoS6 octahedra, evidenced by EXAFS and Rietveld refinement. The XANES edge energy (maximum of the first derivative) is ~20,007 eV, which is the same as the bulk 2H-MoS2, suggesting a similar Mo oxidation state before lithiation.
Reasoning source: Page 15 (XANES discussion), Page 18 (Conclusions)
Scoring Rubric (total: 100 pts)
| Q | Type | Max | Question | Reference Answer | Scoring Criteria |
|---|---|---|---|---|---|
| q1 | identification | 46 | Based on the sample conditions (pristine nanosheet MoS2), what is the expected dominant crystallographic phase, and what is the expected oxidation state of Mo? | Based on the pristine, uncycled conditions (cycle 0 at OCV), the expected dominant crystallographic phase is 100% metastable 1T'-MoS2. The expected oxidation state of molybdenum is Mo(IV). This specific phase arises because the prepared nanosheet MoS2 material inherently forms the 1T' structure characterized by distorted MoS6 octahedra prior to any electrochemical cycling. Furthermore, because the electrode has not yet undergone lithiation or discharge, the molybdenum retains its initial Mo(IV) oxidation state, which is supported by the material exhibiting an edge energy identical to that of bulk 2H-MoS2. | Full points for identifying the 1T'-MoS2 phase and stating the oxidation state is similar to bulk MoS2 (Mo(IV)) due to the identical edge energy. |
| q2 | spectral | 54 | Describe the expected Mo K-edge XANES spectral shape for this pristine nanosheet material, including the specific edge position and the energies of key pronounced features. | The expected Mo K-edge XANES spectrum for this material exhibits an edge position at ~20,007 eV, along with pronounced features at 20,017 eV and 20,032 eV. Compared to bulk 2H-MoS2, these two higher-energy features show a noticeable reduction in intensity. These spectral characteristics arise directly from the pristine, uncycled state of the nanosheet electrode at OCV. The edge energy remains at ~20,007 eV because no lithiation has occurred, leaving the Mo(IV) oxidation state intact. Meanwhile, the reduced intensity of the features at 20,017 eV and 20,032 eV reflects the unique structural properties of the uncycled nanosheets, which exist in the metastable 1T' phase with distorted MoS6 octahedra rather than the standard bulk 2H structure. | Full points for stating the edge position is ~20,007 eV and identifying the pronounced features at 20,017 eV and 20,032 eV. |
Review
Optimized Microwave-Based Synthesis of Thermally Stable Inverse Catalytic Core–shell Motifs for CO 2 Hydrogenation
BNL-NSLS-II-8-ID
Catalyst
Kenna L. Salvatore et al.
DOI: 10.1021/acsami.0c06430
3 scenarios
▶
#662
Cu@TiO2
Cu K-edge
▶
LLM Prompt
Sample Information
Material: Cu@TiO2
Support: TiO2 shell
Sample-Specific Conditions
- Treatment: Pristine
- As-prepared Cu@TiO2 core-shell nanowires
Measurement
We plan to measure the Cu K-edge XANES spectrum of this sample.
Questions
Based on all the information above:
1. Based on the sample conditions (pristine, as-prepared Cu@TiO2 core-shell nanowires), what is the expected dominant oxidation state of Cu, and what reference spectrum would be necessary to rule out a typical bulk oxide environment?
2. Describe the expected spectral features and specific peak energies in the Cu K-edge XANES spectrum for this pristine sample.
3. How does the XANES spectrum of this pristine sample distinguish its Cu environment from that of a typical CuO standard?
Ground Truth
Material: Cu@TiO2
Measurement: Cu K-edge XANES, fluorescence-yield mode, 8-ID ISS beamline at NSLS-II
Fit method: qualitative comparison
Phase fractions: (±10%)
| Phase | Fraction |
|---|---|
| Cu2+ species (non-CuO) | 1.0 |
Fit basis (paper's reference spectra):
- CuO standard
Source evidence: Section 4.1, Pages 19-20; Figure 6B
Key reasoning: The measured Cu signal for the pristine sample consists primarily of Cu2+, due to the presence of its characteristic feature located at ~8978 eV. However, as compared with the CuO standard, the weak 8986 eV feature in the pristine sample indicates that the Cu2+ is not situated within a typical CuO environment.
Reasoning source: Section 4.1, Pages 19-20
Scoring Rubric (total: 100 pts)
| Q | Type | Max | Question | Reference Answer | Scoring Criteria |
|---|---|---|---|---|---|
| q1 | identification | 30 | Based on the sample conditions (pristine, as-prepared Cu@TiO2 core-shell nanowires), what is the expected dominant oxidation state of Cu, and what reference spectrum would be necessary to rule out a typical bulk oxide environment? | The expected dominant oxidation state of Cu in the pristine, as-prepared Cu@TiO2 core-shell nanowires is Cu2+, comprising a fraction of 1.0. To rule out a typical bulk oxide environment, a CuO standard reference spectrum is necessary for qualitative comparison. This fully oxidized Cu2+ state is expected because the pristine, as-prepared conditions of the Cu@TiO2 nanowires leave the copper naturally oxidized prior to any further catalytic or thermal treatment. However, comparing the sample to the CuO standard reveals it is a non-CuO Cu2+ species, as the specific core-shell architecture with the TiO2 shell creates a unique coordination environment distinct from bulk copper(II) oxide. | Award full points for identifying Cu2+ as the dominant oxidation state and mentioning CuO as a necessary reference standard to distinguish the environment. |
| q2 | spectral | 35 | Describe the expected spectral features and specific peak energies in the Cu K-edge XANES spectrum for this pristine sample. | The Cu K-edge XANES spectrum for this pristine sample is expected to exhibit a characteristic feature located at ~8978 eV, along with a weak feature at 8986 eV. These specific spectral features arise directly from the pristine, as-prepared state of the Cu@TiO2 core-shell nanowires. The ~8978 eV peak originates from the presence of the fully oxidized Cu2+ species that naturally forms in the as-prepared material. Meanwhile, the weak intensity of the 8986 eV feature reflects the structural reality that the Cu2+ is not situated within a typical CuO environment, likely due to the unique coordination influence of the TiO2 shell. | Award full points for mentioning the characteristic feature at ~8978 eV and the weak feature at 8986 eV. |
| q3 | reasoning | 35 | How does the XANES spectrum of this pristine sample distinguish its Cu environment from that of a typical CuO standard? | The XANES spectrum distinguishes the pristine sample's Cu environment from a typical CuO standard through the relative intensity of a specific peak at 8986 eV. While the sample shows a characteristic feature at ~8978 eV confirming it consists primarily of Cu2+, the notably weak 8986 eV feature indicates that this Cu2+ is not situated within a typical CuO environment. This spectral distinction arises because the pristine, as-prepared Cu@TiO2 core-shell nanowires possess a unique architecture where the copper is influenced by the TiO2 shell. Consequently, these as-prepared conditions yield a 100% fraction of a non-CuO Cu2+ species rather than a standard bulk oxide phase. | Award full points for explaining that the 8986 eV feature is weak compared to a CuO standard, indicating the Cu2+ is not in a typical CuO environment. |
Review
#663
Cu@TiO2
Cu K-edge
▶
LLM Prompt
Sample Information
Material: Cu@TiO2
Support: TiO2 shell
Sample-Specific Conditions
- Treatment: N2 annealed
- Cu@TiO2 core-shell nanowires annealed in N2
Measurement
We plan to measure the Cu K-edge XANES spectrum of this sample.
Questions
Based on all the information above:
1. Based on the sample conditions (Cu@TiO2 core-shell nanowires annealed in N2 at 450°C), what is the expected dominant Cu phase, and what reference spectrum would be most appropriate for comparison?
2. Explain the physical reasoning for why this specific Cu phase is observed after the N2 annealing treatment at 450°C.
3. What spectral features distinguish the Cu K-edge XANES of this N2-annealed sample from the pristine (unannealed) sample and an O2-treated sample?
Ground Truth
Material: Cu@TiO2
Measurement: Cu K-edge XANES, fluorescence-yield mode, 8-ID ISS beamline at NSLS-II
Fit method: Qualitative comparison
Phase fractions: (±10%)
| Phase | Fraction |
|---|---|
| metallic_copper | 1.0 |
Fit basis (paper's reference spectra):
- Cu foil standard
Source evidence: Page 17, Figure 6B
Key reasoning: The N2 annealing step at 450°C converts the initial Cu speciation within the sample to typical metallic elemental copper, while the amorphous TiO2 shell crystallizes into anatase.
Reasoning source: Page 17, Section 4.1
Scoring Rubric (total: 100 pts)
| Q | Type | Max | Question | Reference Answer | Scoring Criteria |
|---|---|---|---|---|---|
| q1 | identification | 30 | Based on the sample conditions (Cu@TiO2 core-shell nanowires annealed in N2 at 450°C), what is the expected dominant Cu phase, and what reference spectrum would be most appropriate for comparison? | The expected dominant Cu phase for the Cu@TiO2 core-shell nanowires is metallic copper (oxidation state 0), which accounts for a fraction of 1.0. The most appropriate reference spectrum for qualitative comparison is a Cu foil standard. This specific phase is expected because the N2 annealing step at 450°C converts the initial Cu speciation within the sample entirely into typical metallic elemental copper. During this inert thermal treatment, the amorphous TiO2 shell crystallizes into anatase without oxidizing the copper core. | Full credit for identifying metallic copper as the dominant phase and suggesting a Cu foil (or metallic Cu) reference spectrum. |
| q2 | reasoning | 40 | Explain the physical reasoning for why this specific Cu phase is observed after the N2 annealing treatment at 450°C. | After the N2 annealing treatment at 450°C, the Cu@TiO2 core-shell nanowires exhibit a purely metallic copper phase (fraction of 1.0). This occurs because the thermal treatment at 450°C in an inert nitrogen atmosphere converts the initial Cu speciation within the sample directly into typical metallic elemental copper. Concurrently, this specific annealing condition causes the amorphous TiO2 shell to crystallize into anatase. The inert N2 environment ensures the copper core is reduced or maintained as metallic copper rather than forming oxidized species. | Full credit for explaining that the N2 annealing step at 450°C converts the initial Cu speciation to typical metallic elemental copper, alongside the crystallization of the TiO2 shell. |
| q3 | spectral | 30 | What spectral features distinguish the Cu K-edge XANES of this N2-annealed sample from the pristine (unannealed) sample and an O2-treated sample? | The Cu K-edge XANES spectrum of the N2-annealed sample exhibits the characteristic shape of typical metallic elemental copper. It is distinguished from the pristine sample by the complete absence of the ~8978 eV Cu2+ feature, and it lacks the CuO features that appear after O2 treatment. These specific spectral features arise because the N2 annealing step at 450°C fully converts the initial Cu speciation into metallic copper (oxidation state 0). The inert atmosphere prevents the formation of the oxidized copper species that are responsible for the features seen in the pristine and O2-treated conditions. | Full credit for noting that the N2-annealed sample lacks the ~8978 eV Cu2+ feature present in the pristine sample and lacks the CuO features that appear after O2 treatment. |
Review
#664
Cu@TiO2
Cu K-edge
▶
LLM Prompt
Sample Information
Material: Cu@TiO2
Support: TiO2 shell
Sample-Specific Conditions
- Treatment: N2 + O2 treated
- Cu@TiO2 core-shell nanowires annealed in N2 then oxidized
Measurement
We plan to measure the Cu K-edge XANES spectrum of this sample.
Questions
Based on all the information above:
1. What is the dominant copper phase expected for the Cu@TiO2 core-shell nanowires after annealing in N2 at 450°C followed by oxidation in O2 at 350°C, and what is the physical reasoning for this phase composition?
2. Based on the treatment conditions, describe the expected distinguishing spectral features in the Cu K-edge XANES spectrum for this oxidized sample. What specific energy feature indicates the presence of this phase according to the paper?
3. If performing Linear Combination Fitting (LCF) or qualitative spectral matching on this oxidized sample, what primary reference spectrum would be necessary to model the data?
Ground Truth
Material: Cu@TiO2 core-shell nanowires
Measurement: Cu K-edge XANES, fluorescence-yield mode, 8-ID ISS beamline at NSLS-II
Fit method: Qualitative comparison to standard spectra
Phase fractions: (±10%)
| Phase | Fraction |
|---|---|
| CuO | 1.0 |
Fit basis (paper's reference spectra):
- CuO standard
Source evidence: Page 20, Figure 6B (blue curve)
Key reasoning: The sample was first annealed in N2 at 450°C, which converts the amorphous TiO2 shell to crystalline anatase and the Cu to metallic copper. Subsequent treatment with 10 vol% O2/N2 at 350°C for 1 hour oxidizes the copper core, resulting in the formation of CuO, as evidenced by the appearance of characteristic CuO features in the XANES spectrum.
Reasoning source: Section 4.1, Page 20
Scoring Rubric (total: 100 pts)
| Q | Type | Max | Question | Reference Answer | Scoring Criteria |
|---|---|---|---|---|---|
| q1 | reasoning | 35 | What is the dominant copper phase expected for the Cu@TiO2 core-shell nanowires after annealing in N2 at 450°C followed by oxidation in O2 at 350°C, and what is the physical reasoning for this phase composition? | The dominant copper phase expected for this sample is 100% CuO, corresponding to a Cu2+ oxidation state. This phase composition arises because the initial annealing in N2 at 450°C converts the amorphous TiO2 shell to crystalline anatase and reduces the copper to a metallic state. The subsequent oxidation treatment using 10 vol% O2/N2 at 350°C for 1 hour fully oxidizes the metallic copper core. Consequently, the entire copper content is converted into CuO, resulting in a 1.0 fraction of this phase. | Full points if the answer identifies CuO (or Cu2+ oxide) as the dominant phase and explains that the O2 treatment at 350°C oxidizes the copper core. |
| q2 | spectral | 40 | Based on the treatment conditions, describe the expected distinguishing spectral features in the Cu K-edge XANES spectrum for this oxidized sample. What specific energy feature indicates the presence of this phase according to the paper? | The expected Cu K-edge XANES spectrum for this oxidized sample will exhibit a characteristic CuO spectral shape. Specifically, the presence of this phase is indicated by a distinct peak at 8986 eV, which corresponds to a typical CuO environment. These spectral features arise because the sequential treatment of annealing in N2 at 450°C followed by oxidation in O2 at 350°C fully oxidizes the copper core into Cu2+ (CuO). This strong 8986 eV feature clearly distinguishes the oxidized sample from both the pristine sample (which has a weak 8986 eV feature and a peak at ~8978 eV) and the fully reduced metallic copper sample. | Full points if the answer mentions the appearance of a characteristic CuO feature, specifically noting the feature at 8986 eV that distinguishes it from the pristine sample. |
| q3 | identification | 25 | If performing Linear Combination Fitting (LCF) or qualitative spectral matching on this oxidized sample, what primary reference spectrum would be necessary to model the data? | To model the XANES data for this oxidized sample, a CuO standard reference spectrum is the primary basis necessary. This specific reference is required because the sample conditions—specifically the initial N2 annealing at 450°C followed by oxidation in 10 vol% O2/N2 at 350°C for 1 hour—completely oxidize the metallic copper core into CuO. As a result, the sample consists of a 1.0 fraction of CuO (Cu2+). Using the CuO standard allows for accurate qualitative comparison and matching of the distinct 8986 eV feature generated by this fully oxidized environment. | Full points if the answer identifies a CuO standard as the necessary reference spectrum. |
Review
Ru-Bipyridine Entrapped in the Supercages of EMC-1 Faujasite as Catalyst for the Trifluoromethylation of Arenes
ESRF-BM23
Catalyst
Vincent Lemmens et al.
DOI: 10.1021/acsami.1c19655
2 scenarios
▶
#665
Ru(bipy)3 2+ @ EMC-1
Ru K-edge
▶
LLM Prompt
Sample Information
Material: Ru(bipy)3 2+ @ EMC-1
Support: EMC-1 zeolite (SAR = 3.6)
Sample-Specific Conditions
- State: Fresh
- Ru(bipy)3 2+ entrapped in EMC-1 faujasite supercages
Measurement
We plan to measure the Ru K-edge XANES spectrum of this sample.
Questions
Based on all the information above:
1. Based on the 'ship-in-a-bottle' synthesis strategy using a Ru(NH3)6Cl3 precursor and bipyridine, what is the expected dominant Ru phase and its oxidation state in the fresh EMC-1-Ru catalyst? Provide the physical reasoning for this phase composition.
2. To verify the oxidation state and local coordination environment of the Ru species in this sample using XANES, what specific reference spectra should be measured for comparison?
3. Describe the expected overall shape of the Ru K-edge XANES spectrum for this sample. What distinguishing spectral features would confirm the success of the synthesis compared to the initial precursor?
Ground Truth
Material: Ru(bipy)3 2+ @ EMC-1
Measurement: Ru K-edge XANES, ex-situ, beamline BM23 at the European Synchrotron Radiation Facility (ESRF)
Fit method: qualitative comparison
Phase fractions: (±10%)
| Phase | Fraction |
|---|---|
| Ru(bipy)3 2+ | 1.0 |
Fit basis (paper's reference spectra):
- Ru(bipy)3Cl2
- RuCl3
- Ru-foil
Source evidence: Figure 2c and text page 6
Key reasoning: The XANES pattern of the encapsulated Ru is very similar to Ru(bipy)3Cl2, which is a first indication that the trivalent ruthenium atom from the Ru(NH3)6Cl3 precursor is reduced to Ru(II) after the ship-in-a-bottle procedure. EXAFS further confirms that the Ru-center is surrounded by six nitrogen atoms from the bipy ligands, with no Ru-Cl interactions, confirming the formation of the Ru(bipy)3 2+ complex.
Reasoning source: Results and discussion, page 6
Scoring Rubric (total: 100 pts)
| Q | Type | Max | Question | Reference Answer | Scoring Criteria |
|---|---|---|---|---|---|
| q1 | reasoning | 35 | Based on the 'ship-in-a-bottle' synthesis strategy using a Ru(NH3)6Cl3 precursor and bipyridine, what is the expected dominant Ru phase and its oxidation state in the fresh EMC-1-Ru catalyst? Provide the physical reasoning for this phase composition. | The expected dominant phase is 100% Ru(bipy)3 2+ with an oxidation state of Ru(II). This phase composition arises because during the 'ship-in-a-bottle' procedure, the trivalent ruthenium atom from the initial Ru(NH3)6Cl3 precursor is reduced to Ru(II). Consequently, the Ru-center becomes coordinated by six nitrogen atoms from the bipyridine ligands within the EMC-1 faujasite supercages. The complete absence of Ru-Cl interactions confirms the successful formation and entrapment of the pure Ru(bipy)3 2+ complex in the fresh state. | Full points if the answer identifies Ru(bipy)3 2+ as the dominant phase (fraction ~1.0), states the Ru(II) oxidation state, and explains that the trivalent Ru precursor is reduced during the synthesis to form the coordinated complex. |
| q2 | identification | 30 | To verify the oxidation state and local coordination environment of the Ru species in this sample using XANES, what specific reference spectra should be measured for comparison? | To verify the oxidation state and local coordination environment, the specific reference spectra that should be measured are Ru(bipy)3Cl2, RuCl3, and Ru-foil. These references are chosen based on the sample's synthesis conditions, which involve entrapping a Ru complex in EMC-1 zeolite supercages starting from a trivalent precursor. The Ru(bipy)3Cl2 reference is needed to confirm the successful formation of the Ru(II) bipyridine complex. The RuCl3 and Ru-foil references are necessary to prove the absence of unreacted trivalent ruthenium precursor or fully reduced metallic ruthenium, respectively. | Full points if the answer suggests Ru(bipy)3Cl2 (or a similar Ru(II) polypyridyl complex) to confirm the final state, and RuCl3 (or a similar Ru(III) salt) to rule out unreacted precursor, alongside a metallic Ru reference (Ru-foil). |
| q3 | spectral | 35 | Describe the expected overall shape of the Ru K-edge XANES spectrum for this sample. What distinguishing spectral features would confirm the success of the synthesis compared to the initial precursor? | The overall shape of the Ru K-edge XANES spectrum for this sample is expected to closely match the molecular complex Ru(bipy)3Cl2. This spectral shape occurs because the fresh sample consists of Ru(bipy)3 2+ successfully entrapped within the EMC-1 faujasite supercages. The distinguishing feature confirming the synthesis success is that the spectrum is distinctly different from the trivalent RuCl3 precursor and Ru-foil. This distinct spectral match confirms that the initial trivalent ruthenium precursor was successfully reduced to the +2 oxidation state and coordinated by bipyridine ligands without retaining any Ru-Cl interactions. | Full points if the answer states the spectrum should closely resemble the molecular complex Ru(bipy)3Cl2 and notes that it must be distinct from the spectrum of a trivalent ruthenium species (like RuCl3), confirming the reduction to Ru(II). |
Review
#666
Ru(bipy)3 2+ @ EMC-1
Ru K-edge
▶
LLM Prompt
Sample Information
Material: Ru(bipy)3 2+ @ EMC-1
Support: EMC-1 zeolite (SAR = 3.6)
Reaction Conditions: veratrole (0.1 mmol), CF3SO2Cl (5 equiv.), Mg(OAc)2 (2 equiv.), H2O (60 µl), EMC-1-Ru (1 mol% Ru) and 1 mL MeCN, blue light (455-470 nm, 40 W), 24 h at room temperature (3 consecutive runs)
Sample-Specific Conditions
- State: Spent (3 runs)
- Catalyst after 3 recycling runs in the photocatalytic trifluoromethylation reaction
Measurement
We plan to measure the Ru K-edge XANES spectrum of this sample.
Questions
Based on all the information above:
1. What candidate reference spectra would be appropriate to use as a basis for analyzing the Ru speciation in this spent zeolite catalyst?
2. Based on the provided reaction conditions (3 consecutive recycling runs), estimate the phase fractions of the intact active Ru complex and any deactivated Ru species.
3. Explain the physical reasoning behind the estimated phase fractions for this spent catalyst. What specific structural evidence from X-ray absorption spectroscopy supports this conclusion?
Ground Truth
Material: Ru(bipy)3 2+ @ EMC-1
Measurement: Ru K-edge XANES/EXAFS, ex-situ, beamline BM23 at ESRF
Fit method: EXAFS analysis (evaluation of Ru-N signal decrease)
Phase fractions: (±5%)
| Phase | Fraction |
|---|---|
| Ru(bipy)3 2+ | 0.95 |
| Deactivated Ru | 0.05 |
Fit basis (paper's reference spectra):
- Ru(bipy)3Cl2
- RuCl3
- Ru-foil
Source evidence: Page 11, text under 'Catalyst heterogeneity/stability'
Key reasoning: After 3 recycling runs, the catalyst retains 95% of its activity towards the mono-trifluoromethylated product. EXAFS data of the single-site catalyst after the reaction illustrates only a slight decrease in the Ru-N signal. Consequently, the structural integrity of the entrapped complex is largely maintained, with less than 5% of the active Ru(II) becoming deactivated.
Reasoning source: Page 11, Catalyst heterogeneity/stability section
Scoring Rubric (total: 100 pts)
| Q | Type | Max | Question | Reference Answer | Scoring Criteria |
|---|---|---|---|---|---|
| q1 | identification | 20 | What candidate reference spectra would be appropriate to use as a basis for analyzing the Ru speciation in this spent zeolite catalyst? | Appropriate candidate reference spectra for analyzing this spent catalyst are Ru(bipy)3Cl2, RuCl3, and Ru-foil. These references are necessary because the sample consists of a Ru(bipy)3 2+ complex entrapped in an EMC-1 zeolite that has undergone three consecutive photocatalytic trifluoromethylation runs at room temperature. Ru(bipy)3Cl2 represents the intact, active Ru(II) single-site complex initially loaded into the support. Meanwhile, RuCl3 and Ru-foil are required to account for any deactivated or degraded Ru species that could potentially form after prolonged exposure to the reaction mixture (veratrole, CF3SO2Cl, Mg(OAc)2) and blue light irradiation. | Full points if the answer identifies the molecular complex reference (Ru(bipy)3Cl2 or similar Ru(II) polypyridyl complex) and standard Ru references (RuCl3, Ru-foil) as used in the paper. |
| q2 | quantification | 30 | Based on the provided reaction conditions (3 consecutive recycling runs), estimate the phase fractions of the intact active Ru complex and any deactivated Ru species. | The estimated phase fractions for the spent catalyst are 0.95 (95%) intact Ru(bipy)3 2+ and 0.05 (5%) deactivated Ru species, with an uncertainty of 5%. These specific values result from the catalyst's high stability during the three consecutive 24-hour photocatalytic trifluoromethylation runs at room temperature under blue light irradiation. Because the entrapped Ru(bipy)3 2+ complex is protected within the EMC-1 zeolite framework, it retains 95% of its catalytic activity towards the mono-trifluoromethylated product. Consequently, the structural integrity of the single-site catalyst is largely maintained, leading to less than 5% of the active Ru(II) becoming deactivated despite repeated exposure to the reaction conditions. | Full points for estimating ~95% intact Ru(bipy)3 2+ and ~5% (or less than 5%) deactivated Ru species. |
| q3 | reasoning | 50 | Explain the physical reasoning behind the estimated phase fractions for this spent catalyst. What specific structural evidence from X-ray absorption spectroscopy supports this conclusion? | The physical reasoning behind the 95% intact and 5% deactivated phase fractions lies in the robust entrapment of the Ru(bipy)3 2+ complex within the EMC-1 zeolite support. Despite undergoing three consecutive 24-hour recycling runs of photocatalytic trifluoromethylation under blue light, the zeolite framework protects the active Ru(II) sites, allowing the catalyst to retain 95% of its activity. The specific structural evidence supporting this conclusion comes from EXAFS analysis, which illustrates only a slight decrease in the Ru-N coordination signal after the reactions. This confirms that the structural integrity of the entrapped complex is largely maintained, with minimal degradation of the Ru-bipyridine bonds under the specified reaction conditions. | Full points if the answer explains that the catalyst retains 95% of its activity and that EXAFS data shows only a slight decrease in the Ru-N coordination signal, indicating that less than 5% of the active Ru(II) sites undergo deactivation or degradation. |
Review
Ball Milling-Enabled Fe2.4+ to Fe3+ Redox Reaction in Prussian Blue Materials for Long-Life Aqueous Sodium-Ion Batteries
APS
Electrochemistry
Marcos Lucero et al.
DOI: 10.1021/acsami.3c07304
6 scenarios
▶
#667
m-Na1.88Fe[Fe(CN)6]·0.7H2O
Fe K-edge
▶
LLM Prompt
Sample Information
Material: m-Na1.88Fe[Fe(CN)6]·0.7H2O
Electrode Type: cathode
Electrolyte: 17 m NaClO4 water-in-salt
Cell Type: Aqueous Na-ion battery
Charge Discharge: OCV
State Of Charge: pristine
Sample-Specific Conditions
- state of charge: OCV
- As-received monoclinic PBA at open circuit voltage
Measurement
We plan to measure the Fe K-edge XANES spectrum of this sample.
Questions
Based on all the information above:
1. What is the expected oxidation state of Fe in the pristine monoclinic PBA at open circuit voltage, and what is the corresponding Fe K-edge position?
2. Describe the expected pre-edge feature for this pristine PBA sample and explain what it indicates about the local structure around Fe.
3. How does the pre-edge feature of this pristine monoclinic PBA distinguish it from the ball-milled cubic PBA?
Ground Truth
Material: m-Na1.88Fe[Fe(CN)6]·0.7H2O
Measurement: Fe K-edge XANES, ex-situ, SSRL beamline 11-2 and APS beamline 9-BM
Fit method: Integral method
Phase fractions: (±10%)
| Phase | Fraction |
|---|---|
| Fe2+ (in PBA) | 1.0 |
Fit basis (paper's reference spectra):
- Pristine PBA standard
- Fully charged PBA standard
Source evidence: Figure 4A, 4E, Page 3
Key reasoning: In the fully-filled framework of pristine PBA, the theoretical oxidation state of Fe is 2+. The Fe K-edge position is at 7124.4 eV. The spectrum exhibits a noticeable pre-edge feature, indicating a less symmetric local structure around Fe compared to the fully charged state.
Reasoning source: Page 3, 'Fe2.4+ to Fe3+ redox reaction' section
Scoring Rubric (total: 100 pts)
| Q | Type | Max | Question | Reference Answer | Scoring Criteria |
|---|---|---|---|---|---|
| q1 | spectral | 30 | What is the expected oxidation state of Fe in the pristine monoclinic PBA at open circuit voltage, and what is the corresponding Fe K-edge position? | The expected oxidation state of Fe is 2+, with a corresponding Fe K-edge position at 7124.4 eV. This occurs because the sample is an as-received, pristine m-Na1.88Fe[Fe(CN)6]·0.7H2O cathode at open circuit voltage (OCV). Under these pristine conditions, the material possesses a fully-filled framework where the theoretical oxidation state of Fe is entirely 2+. Consequently, the XANES spectrum reflects this pure Fe2+ state with its characteristic 7124.4 eV edge energy. | Full points for identifying the oxidation state as 2+ and the edge position at 7124.4 eV. |
| q2 | spectral | 40 | Describe the expected pre-edge feature for this pristine PBA sample and explain what it indicates about the local structure around Fe. | The Fe K-edge XANES spectrum for this sample will exhibit a noticeable and distinct pre-edge feature. This feature indicates that the local structure around the Fe atoms is less symmetric. Because the sample is in its pristine, as-received monoclinic state at open circuit voltage (m-Na1.88Fe[Fe(CN)6]·0.7H2O), the fully-filled framework inherently possesses this lower symmetry. If the sample were to be fully charged, the local structure would become more symmetric, causing this pre-edge feature to disappear. | Full points for stating that a noticeable pre-edge feature is present, which indicates a less symmetric local structure around Fe (compared to the fully charged state). |
| q3 | reasoning | 30 | How does the pre-edge feature of this pristine monoclinic PBA distinguish it from the ball-milled cubic PBA? | The pristine monoclinic PBA exhibits a distinct, noticeable pre-edge feature, whereas this feature is almost absent in the ball-milled cubic PBA. This distinction arises directly from the specific structural conditions of the as-received m-Na1.88Fe[Fe(CN)6]·0.7H2O sample at open circuit voltage. In this pristine monoclinic state, the fully-filled framework creates a less symmetric local structure around the Fe atoms, which gives rise to the prominent pre-edge absorption. In contrast, the ball-milled PBA lacks this specific less-symmetric local environment, resulting in the near absence of the pre-edge peak. | Full points for explaining that the pristine PBA has a distinct pre-edge feature, whereas in the ball-milled PBA, the pre-edge feature is almost absent. |
Review
#668
m-Na1.88Fe[Fe(CN)6]·0.7H2O
Fe K-edge
▶
LLM Prompt
Sample Information
Material: m-Na1.88Fe[Fe(CN)6]·0.7H2O
Electrode Type: cathode
Electrolyte: 17 m NaClO4 water-in-salt
Cell Type: Aqueous Na-ion battery
Charge Discharge: charging
Voltage V: 0.27
State Of Charge: half charge
Cycle Number: 1
Sample-Specific Conditions
- state of charge: half charge
- As-received monoclinic PBA charged to 0.27 V
Measurement
We plan to measure the Fe K-edge XANES spectrum of this sample.
Questions
Based on all the information above:
1. Based on the electrochemical extraction of Na-ions, estimate the phase fractions of Fe2+ and Fe3+ in the pristine monoclinic PBA at half charge (0.27 V) and explain the physical mechanism driving this ratio.
2. What reference spectra or standards are required to determine the intermediate oxidation state of this half-charged PBA sample using linear interpolation?
Ground Truth
Material: m-Na1.88Fe[Fe(CN)6]·0.7H2O
Measurement: Fe K-edge XANES (SSRL beamline 11-2 and APS beamline 9-BM)
Fit method: Integral method for edge shifts and linear interpolation
Phase fractions: (±10%)
| Phase | Fraction |
|---|---|
| Fe2+ (in PBA) | 0.75 |
| Fe3+ (in PBA) | 0.25 |
Fit basis (paper's reference spectra):
- Pristine PBA (Fe2+ standard)
- Fully charged pristine PBA cycled to 4.0 V vs Na+/Na in organic electrolyte (Fe2.5+ standard)
Source evidence: Figure 4A, Figure 4E, and Page 3 (Fe2.4+ to Fe3+ redox reaction section)
Key reasoning: During charging, Na-ions are extracted from the monoclinic PBA framework, causing the Fe to oxidize. The pristine PBA operates between an average Fe oxidation state of 2+ (edge at 7124.4 eV) and 2.5+ (edge at 7126 eV). At the half-charge state of 0.27 V, the Fe K-edge shifts to an intermediate energy, corresponding to an average oxidation state of ~2.25+, which equates to a 75% Fe2+ and 25% Fe3+ mixture. Furthermore, upon charging, the intensity of the pre-edge feature decreases, indicating that the local structure around Fe becomes more symmetric after Na-ion extraction.
Reasoning source: Page 3, 'Fe2.4+ to Fe3+ redox reaction' section
Scoring Rubric (total: 100 pts)
| Q | Type | Max | Question | Reference Answer | Scoring Criteria |
|---|---|---|---|---|---|
| q1 | quantification | 57 | Based on the electrochemical extraction of Na-ions, estimate the phase fractions of Fe2+ and Fe3+ in the pristine monoclinic PBA at half charge (0.27 V) and explain the physical mechanism driving this ratio. | At the half-charge state of 0.27 V during the first charging cycle, the sample consists of 75% Fe2+ and 25% Fe3+ (with a 10% uncertainty). This specific ratio arises because charging the aqueous Na-ion battery drives the extraction of Na-ions from the monoclinic m-Na1.88Fe[Fe(CN)6]·0.7H2O cathode framework, forcing the iron to oxidize to maintain charge neutrality. The pristine PBA operates between an average Fe oxidation state of 2+ and 2.5+. Reaching the half-charge state of 0.27 V shifts the Fe K-edge to an intermediate energy corresponding to an average oxidation state of ~2.25+. This average oxidation state of 2.25+ mathematically equates to the observed 75% Fe2+ and 25% Fe3+ mixture. | Full points require stating the 75% Fe2+ / 25% Fe3+ fractions (or an average oxidation state of ~2.25+) and explaining that Na-ion extraction causes proportional oxidation of the Fe framework between the 2+ and 2.5+ bounds. |
| q2 | identification | 43 | What reference spectra or standards are required to determine the intermediate oxidation state of this half-charged PBA sample using linear interpolation? | To determine the intermediate oxidation state using linear interpolation, the required reference spectra are the pristine PBA (serving as the Fe2+ standard) and a fully charged pristine PBA cycled to 4.0 V vs Na+/Na in an organic electrolyte (serving as the Fe2.5+ standard). These specific standards are necessary because the m-Na1.88Fe[Fe(CN)6]·0.7H2O cathode operates between an average Fe oxidation state of 2+ (edge at 7124.4 eV) and 2.5+ (edge at 7126 eV) during the Na-ion extraction process. As the battery is charged to 0.27 V (half charge), Na-ions are extracted from the monoclinic framework, causing the Fe to oxidize to an intermediate state of ~2.25+. Using these two boundary standards allows for the accurate interpolation of this intermediate state, which corresponds to a mixture of 75% Fe2+ and 25% Fe3+. Furthermore, comparing the sample to these standards reveals a decrease in pre-edge intensity, confirming that the local structure around Fe becomes more symmetric after Na-ion extraction. | Full points require identifying the pristine PBA (Fe2+) and the fully charged pristine PBA (cycled to 4.0 V vs Na+/Na, Fe2.5+) as the necessary end-member standards. |
Review
#669
m-Na1.88Fe[Fe(CN)6]·0.7H2O
Fe K-edge
▶
LLM Prompt
Sample Information
Material: m-Na1.88Fe[Fe(CN)6]·0.7H2O
Electrode Type: cathode
Electrolyte: 17 m NaClO4 water-in-salt
Cell Type: Aqueous Na-ion battery
Charge Discharge: charged
Voltage V: 1.0
State Of Charge: full charge
Cycle Number: 1
Sample-Specific Conditions
- state of charge: full charge
- As-received monoclinic PBA charged to 1.0 V
Measurement
We plan to measure the Fe K-edge XANES spectrum of this sample.
Questions
Based on all the information above:
1. Based on the sample conditions (pristine monoclinic PBA charged to 1.0 V), what are the expected Fe oxidation states and their approximate fractions in the material?
2. What reference spectra or standards would be necessary to determine the Fe oxidation state of this sample using XANES edge position analysis?
3. Explain the physical reasoning for the expected Fe oxidation state and phase composition when the pristine PBA is fully charged.
Ground Truth
Material: m-Na1.88Fe[Fe(CN)6]·0.7H2O
Measurement: Fe K-edge ex-situ XANES at SSRL beamline 11-2 and APS beamline 9-BM
Fit method: Linear fit of edge position (integral method)
Phase fractions: (±10%)
| Phase | Fraction |
|---|---|
| Fe2+ (in PBA) | 0.5 |
| Fe3+ (in PBA) | 0.5 |
Fit basis (paper's reference spectra):
- pristine PBA standard (Fe2+)
- fully charged PBA standard
Source evidence: Figure 4A, 4E, and text on page 3
Key reasoning: During charge, Na-ions are removed from the structure and Fe in the framework becomes oxidized. For pristine PBA, the Fe K-edge shifts to higher energies when charged to the fully-charged state (7126 eV), corresponding to an average oxidation state of 2.5+ (a 1:1 mixture of Fe2+ and Fe3+ in the half-filled framework). Additionally, the pre-edge feature intensity decreases and disappears at the fully charged state, indicating the local structure around Fe becomes more symmetric after Na-ion extraction.
Reasoning source: Results and Discussion, Fe2.4+ to Fe3+ redox reaction section, page 3
Scoring Rubric (total: 101 pts)
| Q | Type | Max | Question | Reference Answer | Scoring Criteria |
|---|---|---|---|---|---|
| q1 | quantification | 38 | Based on the sample conditions (pristine monoclinic PBA charged to 1.0 V), what are the expected Fe oxidation states and their approximate fractions in the material? | The expected Fe oxidation states in the material are Fe2+ and Fe3+, each present at an approximate fraction of 0.5 (50%). These specific fractions arise because the sample is a monoclinic PBA cathode that has been fully charged to 1.0 V in an aqueous Na-ion battery. During this charging process, Na-ions are extracted from the structure, causing the Fe in the framework to become oxidized. This Na-ion removal results in a half-filled framework with an average Fe oxidation state of 2.5+, which is observed as the Fe K-edge shifts to a higher energy of 7126 eV. | Full points for identifying a 50/50 mixture of Fe2+ and Fe3+ (or an average oxidation state of 2.5+). Partial points for identifying that Fe is partially oxidized but with incorrect fractions. |
| q2 | identification | 25 | What reference spectra or standards would be necessary to determine the Fe oxidation state of this sample using XANES edge position analysis? | To determine the Fe oxidation state of this sample using a linear fit of the edge position, the necessary reference spectra are a pristine PBA standard (representing Fe2+) and a fully charged PBA standard. These specific standards are required because the sample is an as-received monoclinic PBA cathode that has been subjected to a full charge to 1.0 V. During this charge cycle, Na-ions are removed from the structure, which oxidizes the framework Fe and shifts the Fe K-edge to higher energies (7126 eV). Utilizing these two end-member standards allows for the accurate quantification of the resulting 1:1 mixture of Fe2+ and Fe3+ that forms upon complete Na-ion extraction. | Full points for mentioning pristine PBA (Fe2+) and a fully charged PBA standard (or known Fe2+ and Fe3+ standards) to establish a linear fit for oxidation state. |
| q3 | reasoning | 38 | Explain the physical reasoning for the expected Fe oxidation state and phase composition when the pristine PBA is fully charged. | When the pristine monoclinic PBA cathode is fully charged to 1.0 V in the 17 m NaClO4 aqueous electrolyte, Na-ions are extracted from the material's structure. This removal of Na-ions forces the Fe in the framework to become oxidized, resulting in an average Fe oxidation state of 2.5+, which corresponds to a 1:1 phase mixture of Fe2+ and Fe3+ (0.5 fraction each) in the half-filled framework. Spectroscopically, this oxidation is observed as the Fe K-edge shifting to a higher energy of 7126 eV. Additionally, the extraction of Na-ions causes the local structure around the Fe atoms to become more symmetric, which is evidenced by the pre-edge feature intensity decreasing and ultimately disappearing at this fully charged state. | Full points for explaining that Na-ion extraction leads to oxidation of Fe in the framework, reaching a half-filled state (e.g., NaFe[Fe(CN)6]) with an average oxidation state of 2.5+. |
Review
#670
c-Na1.17Fe[Fe(CN)6]·0.35H2O
Fe K-edge
▶
LLM Prompt
Sample Information
Material: c-Na1.17Fe[Fe(CN)6]·0.35H2O
Electrode Type: cathode
Electrolyte: 17 m NaClO4 water-in-salt
Cell Type: Aqueous Na-ion battery
Charge Discharge: OCV
State Of Charge: pristine
Sample-Specific Conditions
- state of charge: OCV
- Ball-milled cubic PBA at open circuit voltage
Measurement
We plan to measure the Fe K-edge XANES spectrum of this sample.
Questions
Based on all the information above:
1. Based on the sample conditions, what are the expected Fe oxidation states present in the ball-milled PBA at open circuit voltage (pristine state), and what are their estimated fractions?
2. What reference spectra or standards would be required to determine the Fe oxidation state of this sample using the integral method (edge shift analysis)?
3. Explain the physical reasoning for why the ball-milled PBA at OCV exhibits an average Fe oxidation state of 2.4+ rather than the 2+ state expected for a fully-filled Prussian white framework.
Ground Truth
Material: c-Na1.17Fe[Fe(CN)6]·0.35H2O
Measurement: Fe K-edge XANES at SSRL 11-2 and APS 9-BM
Fit method: Integral method (edge shift linear interpolation/extrapolation)
Phase fractions: (±10%)
| Phase | Fraction |
|---|---|
| Fe2+ (in PBA) | 0.6 |
| Fe3+ (in PBA) | 0.4 |
Fit basis (paper's reference spectra):
- Pristine monoclinic PBA (Fe2+ standard)
- Fully charged pristine monoclinic PBA (Fe2.5+ standard)
Source evidence: Page 3, Section 'Fe2.4+ to Fe3+ redox reaction', Figure 4E
Key reasoning: The ball milling process decreases the sodium content in the PBA framework, causing a phase transition from monoclinic to cubic. This Na-ion deficiency leads to an initial partial oxidation of Fe in the framework. The Fe K-edge position at OCV for the ball-milled PBA is 7125.6 eV, corresponding to an average oxidation state of 2.4+, which indicates a mixture of 60% Fe2+ and 40% Fe3+.
Reasoning source: Page 3, Section 'Fe2.4+ to Fe3+ redox reaction'
Scoring Rubric (total: 100 pts)
| Q | Type | Max | Question | Reference Answer | Scoring Criteria |
|---|---|---|---|---|---|
| q1 | quantification | 30 | Based on the sample conditions, what are the expected Fe oxidation states present in the ball-milled PBA at open circuit voltage (pristine state), and what are their estimated fractions? | The expected Fe oxidation states in the pristine ball-milled PBA sample are Fe2+ and Fe3+, with estimated fractions of 60% Fe2+ and 40% Fe3+ (with a 10% uncertainty). These specific fractions arise because the ball-milling process decreases the sodium content in the PBA framework, inducing a phase transition from a monoclinic to a cubic structure (c-Na1.17Fe[Fe(CN)6]·0.35H2O). This Na-ion deficiency leads to an initial partial oxidation of the Fe centers at open circuit voltage (OCV), resulting in an Fe K-edge position of 7125.6 eV that corresponds to an average oxidation state of 2.4+. | Full points for identifying a mixture of Fe2+ and Fe3+ with fractions of approximately 0.6 and 0.4, respectively (or stating an average oxidation state of 2.4+). |
| q2 | identification | 30 | What reference spectra or standards would be required to determine the Fe oxidation state of this sample using the integral method (edge shift analysis)? | To determine the Fe oxidation state using the integral method (edge shift linear interpolation/extrapolation), the required reference spectra are a pristine monoclinic PBA (serving as the Fe2+ standard) and a fully charged pristine monoclinic PBA (serving as the Fe2.5+ standard). These specific standards are necessary because the ball-milled cubic PBA sample at open circuit voltage (OCV) exhibits an average Fe oxidation state of 2.4+. This 2.4+ state occurs because ball milling decreases the Na content, causing a monoclinic-to-cubic phase transition and an initial partial oxidation of Fe, which can then be quantified as a 60% Fe2+ and 40% Fe3+ mixture using these reference bounds. | Full points for mentioning pristine PBA (Fe2+) and fully charged pristine PBA (Fe2.5+) standards to establish a linear fit for interpolation and extrapolation. |
| q3 | reasoning | 40 | Explain the physical reasoning for why the ball-milled PBA at OCV exhibits an average Fe oxidation state of 2.4+ rather than the 2+ state expected for a fully-filled Prussian white framework. | The ball-milled PBA at open circuit voltage (OCV) exhibits an average Fe oxidation state of 2.4+ due to a loss of sodium during the material preparation process. Specifically, ball milling decreases the sodium content in the PBA framework, which drives a structural phase transition from a monoclinic to a cubic phase (c-Na1.17Fe[Fe(CN)6]·0.35H2O). This resulting Na-ion deficiency forces an initial partial oxidation of the Fe atoms in the framework to maintain charge neutrality, shifting the Fe K-edge position to 7125.6 eV and creating a mixture of 60% Fe2+ and 40% Fe3+. | Full points for explaining that the ball milling process decreases the sodium content (Na-ion deficiency) and induces a phase transition to a cubic structure, which inherently results in the partial oxidation of Fe in the pristine state. |
Review
#671
c-Na1.17Fe[Fe(CN)6]·0.35H2O
Fe K-edge
▶
LLM Prompt
Sample Information
Material: c-Na1.17Fe[Fe(CN)6]·0.35H2O
Electrode Type: cathode
Electrolyte: 17 m NaClO4 water-in-salt
Cell Type: Aqueous Na-ion battery
Charge Discharge: charging
Voltage V: 0.27
State Of Charge: half charge
Cycle Number: 1
Sample-Specific Conditions
- state of charge: half charge
- Ball-milled cubic PBA charged to 0.27 V
Measurement
We plan to measure the Fe K-edge XANES spectrum of this sample.
Questions
Based on all the information above:
1. Based on the sample conditions (ball-milled PBA charged to 0.27 V), what are the expected Fe oxidation states present in the material, and what are their estimated fractions?
2. What reference spectra or standards would be necessary to determine the average oxidation state of Fe in this sample using the edge shift method?
3. Explain the physical reasoning for the expected phase composition and average oxidation state of the ball-milled PBA at half charge (0.27 V).
Ground Truth
Material: c-Na1.17Fe[Fe(CN)6]·0.35H2O
Measurement: Fe K-edge XANES, ex-situ, SSRL beamline 11-2 and APS beamline 9-BM
Fit method: Integral method for edge shift and linear interpolation of oxidation state
Phase fractions: (±10%)
| Phase | Fraction |
|---|---|
| Fe2+ (in PBA) | 0.3 |
| Fe3+ (in PBA) | 0.7 |
Fit basis (paper's reference spectra):
- pristine PBA standard (Fe2+)
- fully charged PBA standard (Fe2.5+)
Source evidence: Figure 4E and Page 3
Key reasoning: During charging, Na-ions are extracted from the PBA framework, causing the Fe to become oxidized. The ball-milled PBA starts at an initial oxidation state of 2.4+ at OCV due to Na-ion deficiency. At half charge (0.27 V), the Fe K-edge shifts to higher energy, corresponding to an average oxidation state of approximately 2.7+ (extrapolated from the linear fit of standards), which translates to a mixture of 30% Fe2+ and 70% Fe3+.
Reasoning source: Page 3, 'Fe2.4+ to Fe3+ redox reaction' section
Scoring Rubric (total: 100 pts)
| Q | Type | Max | Question | Reference Answer | Scoring Criteria |
|---|---|---|---|---|---|
| q1 | quantification | 35 | Based on the sample conditions (ball-milled PBA charged to 0.27 V), what are the expected Fe oxidation states present in the material, and what are their estimated fractions? | The expected Fe oxidation states in the material are Fe2+ and Fe3+, with estimated fractions of 30% Fe2+ and 70% Fe3+, subject to a 10% uncertainty. These specific fractions arise because during the charging process of the aqueous Na-ion battery, Na-ions are extracted from the c-Na1.17Fe[Fe(CN)6]·0.35H2O cathode framework, causing the iron to oxidize. The ball-milled PBA starts at an initial oxidation state of 2.4+ at open circuit voltage due to an inherent Na-ion deficiency. By the time the cell reaches half charge at 0.27 V, the average oxidation state increases to approximately 2.7+, which mathematically translates to this 30% Fe2+ and 70% Fe3+ mixture. | Full points for identifying Fe2+ and Fe3+ with fractions of approximately 0.3 and 0.7, respectively. Partial points for identifying the correct oxidation states without the exact fractions. |
| q2 | identification | 30 | What reference spectra or standards would be necessary to determine the average oxidation state of Fe in this sample using the edge shift method? | To determine the average oxidation state of Fe using the edge shift method, a pristine PBA standard (Fe2+) and a fully charged PBA standard (Fe2.5+) are necessary as the fit basis. These specific standards are required because they provide the baseline and upper reference points for the integral method and linear interpolation of the oxidation state during the battery cycle. As the c-Na1.17Fe[Fe(CN)6]·0.35H2O cathode is charged to 0.27 V (half charge), Na-ions are extracted from the framework, causing the Fe K-edge to shift to higher energies due to oxidation. By comparing the sample's edge shift to these pristine and fully charged standards, the average oxidation state of approximately 2.7+ can be accurately extrapolated. | Full points for mentioning pristine PBA (Fe2+) and fully charged PBA standards to establish a linear calibration for the edge shift. |
| q3 | reasoning | 35 | Explain the physical reasoning for the expected phase composition and average oxidation state of the ball-milled PBA at half charge (0.27 V). | The expected phase composition of 30% Fe2+ and 70% Fe3+ at half charge (0.27 V) is driven by the electrochemical extraction of Na-ions from the c-Na1.17Fe[Fe(CN)6]·0.35H2O framework. Initially, the ball-milled PBA cathode starts at an open circuit voltage with an average oxidation state of 2.4+ due to an inherent Na-ion deficiency in the material. As the aqueous Na-ion battery is charged to 0.27 V, further Na-ion extraction forces the Fe atoms to oxidize to maintain charge neutrality. This oxidation manifests as a shift of the Fe K-edge to higher energy in the XANES spectrum, yielding an average oxidation state of approximately 2.7+ that corresponds directly to the observed 30/70 ratio of Fe2+ to Fe3+. | Full points for explaining that Na-ion extraction during charging oxidizes the Fe framework, starting from an initial state of ~2.4+ for the ball-milled sample and reaching ~2.7+ at half charge. |
Review
#672
c-Na1.17Fe[Fe(CN)6]·0.35H2O
Fe K-edge
▶
LLM Prompt
Sample Information
Material: c-Na1.17Fe[Fe(CN)6]·0.35H2O
Electrode Type: cathode
Electrolyte: 17 m NaClO4 water-in-salt
Cell Type: Aqueous Na-ion battery
Charge Discharge: charged
Voltage V: 1.0
State Of Charge: full charge
Cycle Number: 1
Sample-Specific Conditions
- state of charge: full charge
- Ball-milled cubic PBA charged to 1.0 V
Measurement
We plan to measure the Fe K-edge XANES spectrum of this sample.
Questions
Based on all the information above:
1. Based on the sample conditions (ball-milled PBA charged to 1.0 V), what is the expected oxidation state of Fe, and what structural changes occur upon full Na-ion extraction?
2. Describe the expected spectral features of the Fe K-edge XANES for this fully charged sample, specifically focusing on the edge position and the pre-edge feature.
3. What reference spectra or standards would be appropriate to determine the Fe oxidation state of this sample using the integral method?
Ground Truth
Material: c-Na1.17Fe[Fe(CN)6]·0.35H2O
Measurement: Fe K-edge XANES
Fit method: integral method
Phase fractions: (±10%)
| Phase | Fraction |
|---|---|
| Fe3+ (in PBA) | 1.0 |
Fit basis (paper's reference spectra):
- pristine PBA (assigned to 2+)
- fully charged pristine PBA cycled to 4.0 V vs Na+/Na in organic electrolyte (assigned to 2.5+)
Source evidence: Page 3, Figure 4C and 4E
Key reasoning: During charge to 1.0 V vs Ag/AgCl, Na-ions are extracted from the BM PBA framework, leading to the oxidation of Fe. The Fe K-edge shifts to a higher energy of 7127.8 eV, corresponding to an oxidation state of 3+. The pre-edge feature is almost absent, indicating a highly symmetric local structure around Fe.
Reasoning source: Page 3, 'Fe2.4+ to Fe3+ redox reaction' section
Scoring Rubric (total: 100 pts)
| Q | Type | Max | Question | Reference Answer | Scoring Criteria |
|---|---|---|---|---|---|
| q1 | reasoning | 35 | Based on the sample conditions (ball-milled PBA charged to 1.0 V), what is the expected oxidation state of Fe, and what structural changes occur upon full Na-ion extraction? | The expected oxidation state of Fe in this fully charged sample is 3+, representing a 1.0 fraction of Fe3+ in the material. This occurs because charging the ball-milled cubic PBA cathode to 1.0 V in the aqueous Na-ion battery drives the full extraction of Na-ions from the framework. The removal of these sodium ions forces the oxidation of Fe to compensate for the charge, resulting in the Fe3+ state. Structurally, the local environment around the Fe atoms becomes highly symmetric upon this complete Na-ion extraction. | Award full points if the answer correctly identifies the Fe oxidation state as 3+ and mentions that Na-ion extraction leads to an empty framework (Fe[Fe(CN)6]) with a highly symmetric local structure around Fe. |
| q2 | spectral | 35 | Describe the expected spectral features of the Fe K-edge XANES for this fully charged sample, specifically focusing on the edge position and the pre-edge feature. | The Fe K-edge XANES spectrum will exhibit an edge position shifted to a higher energy of 7127.8 eV and an almost completely absent pre-edge feature. These spectral features arise directly from the sample conditions, where charging the ball-milled PBA to 1.0 V causes full Na-ion extraction and oxidizes the iron to Fe3+, driving the main edge shift to higher energy compared to the pristine state (7125.5 eV). Furthermore, the absence of the pre-edge feature reflects the highly symmetric local structure around the Fe atoms that forms upon this complete desodiation. | Award full points if the answer states the edge position shifts to approximately 7127.8 eV and notes that the pre-edge feature is almost absent due to the symmetric local structure. |
| q3 | identification | 30 | What reference spectra or standards would be appropriate to determine the Fe oxidation state of this sample using the integral method? | The appropriate reference spectra for the integral method are pristine PBA (assigned to Fe2+) and fully charged pristine PBA cycled to 4.0 V vs Na+/Na in an organic electrolyte (assigned to Fe2.5+). These references are utilized because charging the ball-milled PBA cathode to 1.0 V in the aqueous cell extracts Na-ions from the framework, progressively oxidizing the iron. By using these specific lower-oxidation state PBA standards as a baseline, the integral method can accurately track this charge-driven mechanism, confirming that the full Na-ion extraction results in a complete conversion to a 1.0 fraction of Fe3+. | Award full points if the answer mentions pristine PBA (Fe2+) and fully charged PBA standards (e.g., cycled to 4.0 V vs Na+/Na in organic electrolyte, Fe2.5+) as references for extrapolation. |
Review
Role of Atomicity and Interface on InOx-TiO2 Composites: Thermo-Photo Valorization of CO2
BNL-NSLS-II-8-ID
Catalyst
Rocío Sayago-Carro et al.
DOI: 10.1021/acsami.4c04803
1 scenario
▶
#673
InOx-TiO2
In K
▶
LLM Prompt
Sample Information
Material: InOx-TiO2
Support: TiO2 (anatase)
Sample-Specific Conditions
- Indium loading: 0.5 mol%
- InOx-TiO2 composite catalyst with 0.5 mol% In
Measurement
We plan to measure the In K XANES spectrum of this sample.
Questions
Based on all the information above:
1. Based on the very low indium loading (0.5 mol%) on the TiO2 support, what is the expected dominant indium species and its oxidation state?
2. Describe the expected position of the In K-edge and how the white line intensity of this 0.5 mol% In sample compares to a bulk In2O3 reference spectrum.
3. What physical or structural factors explain the difference in the XANES continuum resonances (white line) between this highly dispersed 0.5InTi sample and bulk In2O3?
Ground Truth
Material: InOx-TiO2
Measurement: In K-edge (27940 eV), fluorescence mode, 8-ID beamline at NSLS-II
Fit method: Not applicable (qualitative comparison and EXAFS fitting used instead of XANES LCF)
Phase fractions:
| Phase | Fraction |
|---|---|
| isolated In ions or In-In pairs (In3+) | 1.0 |
Fit basis (paper's reference spectra):
- In2O3
- In foil
Source evidence: Page 9, Section 3; Figure 4B; Page 11, Section 3
Key reasoning: The XANES signal displays an invariant energy of the absorption edge at ca. 27938.0 eV, confirming the In3+ oxidation state. The intensity of the continuum resonances (white line) is lower than the bulk In2O3 reference, indicating lower electronic density in low-lying states near the continuum. This spectral feature, along with EXAFS data showing short In-In distances and In-Ti shells, proves a strong In-Ti interaction and the presence of an 'equimolecular' mixture of isolated In ions or In-In pairs in oxidized environments on the anatase surface.
Reasoning source: Section 3. RESULTS AND DISCUSSION, Pages 9 and 11
Scoring Rubric (total: 100 pts)
| Q | Type | Max | Question | Reference Answer | Scoring Criteria |
|---|---|---|---|---|---|
| q1 | identification | 30 | Based on the very low indium loading (0.5 mol%) on the TiO2 support, what is the expected dominant indium species and its oxidation state? | The expected dominant indium species is an 'equimolecular' mixture of isolated In ions or In-In pairs in an oxidized environment on the TiO2 surface, representing a fraction of 1.0. The oxidation state of these species is In3+. These specific phases arise because the very low indium loading (0.5 mol%) on the anatase support prevents the formation of bulk In2O3. Instead, this low concentration promotes a strong In-Ti interaction, leading to highly dispersed isolated ions or small In-In pairs rather than large oxide clusters. | Full credit for identifying the In3+ oxidation state and describing the species as highly dispersed, isolated In ions, or In-In pairs in an oxidized environment on the TiO2 surface. |
| q2 | spectral | 35 | Describe the expected position of the In K-edge and how the white line intensity of this 0.5 mol% In sample compares to a bulk In2O3 reference spectrum. | The expected position of the In K-edge is at approximately 27938.0 eV, which confirms the In3+ oxidation state of the sample. The intensity of the continuum resonances (white line) is expected to be lower than that of a bulk In2O3 reference spectrum. These spectral features arise directly from the low 0.5 mol% indium loading on the TiO2 support, which forces the indium into highly dispersed isolated ions or In-In pairs. This specific structural configuration and the resulting strong In-Ti interaction cause a lower electronic density in the low-lying states near the continuum compared to bulk In2O3. | Full credit for stating the edge position is at approximately 27938.0 eV and noting that the white line (continuum resonances) intensity is lower than that of bulk In2O3. |
| q3 | reasoning | 35 | What physical or structural factors explain the difference in the XANES continuum resonances (white line) between this highly dispersed 0.5InTi sample and bulk In2O3? | The difference in the XANES continuum resonances (white line) is driven by a strong In-Ti interaction and a strong size effect. Because the sample contains a very low indium loading of 0.5 mol% on the TiO2 (anatase) support, the indium cannot form bulk In2O3 and instead exists as highly dispersed isolated In ions or In-In pairs. This specific structural configuration on the anatase surface leads to a lower electronic density in the low-lying states near the continuum (conduction band). As a result of this reduced electronic density, the white line intensity is lower than that observed in bulk In2O3. | Full credit for explaining that the lower intensity indicates lower electronic density in the low-lying states near the continuum (conduction band), which is caused by a strong In-Ti interaction and/or a strong size effect due to the subnanometric dispersion of the indium species. |
Review
Optimizing Materials to Boost the Valorization of CO2: Tuning Cobalt–Cobalt Interactions on In2O3-Based Photothermal Catalysts
BNL-NSLS-II-8-ID
Catalyst
Rocío Sayago-Carro et al.
DOI: 10.1021/acsami.4c14280
3 scenarios
▶
#674
In0.98Co0.02O3
Co K
▶
LLM Prompt
Sample Information
Material: In0.98Co0.02O3
Support: In2O3
Sample-Specific Conditions
- Co loading: 2 mol%
- 2 mol% Co-doped In2O3 catalyst, as-prepared
Measurement
We plan to measure the Co K XANES spectrum of this sample.
Questions
Based on all the information above:
1. Based on the sample conditions (2 mol% Co-doped In2O3, as-prepared), what is the expected dominant Co phase, and what physical reasoning justifies this assignment?
2. Describe the expected Co K-edge XANES spectral features for this sample, including the edge position and any notable pre-edge features along with their electronic origins.
3. How would the post-edge continuum resonances of this sample's XANES spectrum compare to a bulk CoO reference, and what structural information does this provide?
Ground Truth
Material: In2Co
Measurement: Co K-edge XANES, fluorescence mode, 8-ID beamline at NSLS-II
Fit method: qualitative comparison and EXAFS fitting
Phase fractions: (±10%)
| Phase | Fraction |
|---|---|
| Isolated Co(II) in In2O3 lattice | 1.0 |
Fit basis (paper's reference spectra):
- CoO
- Co3O4
Source evidence: Figure 4A, page 14
Key reasoning: The XANES spectra show an edge position at ca. 7718 eV, indicating a Co(II) oxidation state. A 1s → p/d pre-edge feature at 7709.4 eV suggests a non-centrosymmetric local environment due to p-d mixing. The continuum resonances after the edge differ strongly from a CoO reference, indicating that the typical Co(II) octahedral symmetry is significantly distorted, consistent with isolated Co species substituting into the 24d sites of the In2O3 lattice at this low loading.
Reasoning source: Section 3.- Results and discussion, pages 14-15
Scoring Rubric (total: 100 pts)
| Q | Type | Max | Question | Reference Answer | Scoring Criteria |
|---|---|---|---|---|---|
| q1 | reasoning | 35 | Based on the sample conditions (2 mol% Co-doped In2O3, as-prepared), what is the expected dominant Co phase, and what physical reasoning justifies this assignment? | The expected dominant Co phase is 100% isolated Co(II) species substituted into the In2O3 lattice. This phase arises because the low Co loading of 2 mol% in the as-prepared In0.98Co0.02O3 sample allows the cobalt atoms to substitute directly into the 24d sites of the In2O3 support rather than aggregating into bulk cobalt oxide clusters. The assignment is justified by an edge position at ca. 7718 eV indicating a Co(II) oxidation state, along with distinct continuum resonances that confirm a significantly distorted local symmetry characteristic of isolated substitution. | Full points for identifying isolated Co(II) in the In2O3 lattice and explaining that at this low loading, Co substitutes into the In2O3 structure with a distorted octahedral symmetry, as evidenced by the non-centrosymmetric environment. |
| q2 | spectral | 35 | Describe the expected Co K-edge XANES spectral features for this sample, including the edge position and any notable pre-edge features along with their electronic origins. | The expected Co K-edge XANES spectrum for this sample features an edge position at approximately 7718 eV, which is indicative of a Co(II) oxidation state. Additionally, a distinct pre-edge feature is observed at ca. 7709.4 eV. These specific spectral features arise because the low 2 mol% Co loading results in isolated Co(II) species substituting into the In2O3 lattice, creating a significantly distorted, non-centrosymmetric local environment. In this distorted geometry, p-d orbital mixing occurs, which electronically allows the 1s → p/d transition that produces the observed pre-edge peak. | Full points for mentioning an edge position around 7718 eV indicating Co(II), and a pre-edge feature around 7709.4 eV originating from a 1s → p/d transition allowed by p-d mixing in a non-centrosymmetric environment. |
| q3 | spectral | 30 | How would the post-edge continuum resonances of this sample's XANES spectrum compare to a bulk CoO reference, and what structural information does this provide? | The post-edge continuum resonances of this sample's XANES spectrum will differ strongly from those of a bulk CoO reference. This significant deviation occurs because the low 2 mol% Co loading in the as-prepared sample leads to isolated Co species substituting into the 24d sites of the In2O3 lattice, rather than forming a separate bulk oxide phase. Structurally, this indicates that the typical octahedral symmetry found in bulk Co(II) oxide is significantly distorted in this sample. Consequently, the distinct continuum resonances directly reflect this highly distorted, non-centrosymmetric local environment of the isolated Co(II) dopants within the host lattice. | Full points for stating that the continuum resonances immediately after the edge show strong differences compared to CoO, which indicates that the typical Co(II) octahedral symmetry of CoO is significantly distorted in the catalyst. |
Review
#675
In0.95Co0.05O3
Co K
▶
LLM Prompt
Sample Information
Material: In0.95Co0.05O3
Support: In2O3
Sample-Specific Conditions
- Co loading: 5 mol%
- 5 mol% Co-doped In2O3 catalyst, as-prepared
Measurement
We plan to measure the Co K XANES spectrum of this sample.
Questions
Based on all the information above:
1. Based on the sample conditions (5 mol% Co in In2O3), what is the expected oxidation state and local structural environment of the Co species?
2. Describe the expected Co K-edge XANES spectral features for this sample, including the edge position and any specific pre-edge features.
3. What electronic transition gives rise to the pre-edge feature in this sample, and what does its presence indicate about the local symmetry of the Co sites?
4. What distinguishes the local structure of the 5 mol% Co sample (In5Co) from samples with lower Co loadings (e.g., <= 4 mol%), and how does this affect the structural motif?
Ground Truth
Material: In5Co
Measurement: Co K-edge XANES, fluorescence mode, 8-ID beamline at NSLS-II
Fit method: EXAFS fitting
Phase fractions:
| Phase | Fraction |
|---|---|
| Co(II) with Co-Co interactions | 1.0 |
Fit basis (paper's reference spectra):
- CoO
- Co-doped In2O3
Source evidence: Page 14, Figure 4A; Page 16, Table 1
Key reasoning: XANES spectra show an edge position at ca. 7718 eV and a pre-edge feature at 7709.4 eV, indicating Co(II) in a non-centrosymmetric environment. EXAFS fitting for the In5Co sample reveals the emergence of a Co-Co interaction at 3.26 Å, which is absent in samples with lower Co loadings (<= 4 mol%). This indicates that Co occupies the 24d sites of the In2O3 lattice, but at 5 mol% loading, homo-interactions (Co-Co) begin to appear alongside hetero-interactions (Co-In).
Reasoning source: Section 3.- Results and discussion, pages 14-16
Scoring Rubric (total: 100 pts)
| Q | Type | Max | Question | Reference Answer | Scoring Criteria |
|---|---|---|---|---|---|
| q1 | reasoning | 25 | Based on the sample conditions (5 mol% Co in In2O3), what is the expected oxidation state and local structural environment of the Co species? | Based on the 5 mol% Co-doped In2O3 sample conditions, the expected oxidation state is Co(II). The local structural environment consists of Co occupying the distorted 24d sites of the In2O3 host lattice. Because the Co is doped into the In2O3 matrix at this specific 5 mol% loading, it adopts a non-centrosymmetric, significantly distorted octahedral symmetry rather than forming a bare CoO phase. Furthermore, at this 5 mol% concentration, the local structure is characterized by the emergence of homo-interactions (Co-Co) alongside hetero-interactions (Co-In), resulting in a 100% fraction of Co(II) with Co-Co interactions. | Full points for identifying Co(II) located in the 24d sites of the In2O3 lattice, and noting the emergence of Co-Co interactions at this specific loading. |
| q2 | spectral | 25 | Describe the expected Co K-edge XANES spectral features for this sample, including the edge position and any specific pre-edge features. | The expected Co K-edge XANES spectrum for this sample exhibits an edge position at approximately 7718 eV and a distinct pre-edge feature at 7709.4 eV. Additionally, the continuum resonances immediately after the edge differ strongly from a standard CoO reference. These spectral features arise directly from the 5 mol% Co-doped In2O3 sample conditions, which dictate that Co(II) substitutes into the host lattice. Specifically, the pre-edge and unique continuum resonances appear because the Co atoms occupy the highly distorted, non-centrosymmetric 24d sites of the In2O3 structure rather than forming a symmetric bulk oxide. | Full points for stating an edge position around 7718 eV, the presence of a pre-edge feature at ~7709.4 eV, and continuum resonances that differ from bare CoO. |
| q3 | reasoning | 25 | What electronic transition gives rise to the pre-edge feature in this sample, and what does its presence indicate about the local symmetry of the Co sites? | The pre-edge feature at 7709.4 eV is caused by a 1s to p/d electronic transition. Its presence indicates that the Co sites possess a non-centrosymmetric local environment with significantly distorted octahedral symmetry. Because the sample consists of Co doped into an In2O3 support, the Co(II) ions substitute into the specific 24d sites of the host lattice. This crystallographic site lacks inversion symmetry, which allows for p-d orbital mixing. It is this p-d mixing, dictated by the host lattice conditions, that enables the transition and generates the observed pre-edge peak. | Full points for identifying the 1s -> p/d transition and explaining that it is allowed by p-d mixing due to a non-centrosymmetric (distorted) local environment. |
| q4 | reasoning | 25 | What distinguishes the local structure of the 5 mol% Co sample (In5Co) from samples with lower Co loadings (e.g., <= 4 mol%), and how does this affect the structural motif? | The local structure of the 5 mol% Co sample is distinguished by the emergence of a Co-Co interaction at a distance of 3.26 Å, which is absent in samples with lower Co loadings (<= 4 mol%). While Co(II) occupies the 24d sites of the In2O3 lattice in all these materials, the specific 5 mol% loading condition increases the density of dopant atoms. Because of this higher concentration, homo-interactions (Co-Co) begin to appear alongside the standard hetero-interactions (Co-In). Consequently, the structural motif of the 5 mol% sample is uniquely characterized by a 1.0 fraction of Co(II) exhibiting these Co-Co interactions. | Full points for explaining that at 5 mol% loading, Co-Co homo-interactions emerge (detectable by EXAFS at ~3.26 Å), which are absent in samples with 4 mol% or lower Co loading. |
Review
#676
In0.94Co0.06O3
Co K
▶
LLM Prompt
Sample Information
Material: In0.94Co0.06O3
Support: In2O3
Reaction Conditions: CO2 + H2 (1:1), 250 °C, photo-thermal (UV-Vis illumination)
Sample-Specific Conditions
- Reaction condition: Photo-thermal reaction
- 6 mol% Co-doped In2O3 catalyst, post-photo-thermal reaction
Measurement
We plan to measure the Co K XANES spectrum of this sample.
Questions
Based on all the information above:
1. Based on the reaction conditions (photo-thermal at 250 °C), what is the dominant cobalt phase expected in the In6Co-PT sample, and what is its oxidation state?
2. Explain the physical reasoning for the formation of this specific cobalt phase under dual photo-thermal conditions in the 6 mol% Co-doped In2O3 catalyst.
3. What reference structures would be appropriate to use as a basis for modeling the local environment of the cobalt species in this sample?
Ground Truth
Material: In6Co-PT (6 mol% Co-doped In2O3 post-photo-thermal reaction)
Measurement: Co K-edge, fluorescence mode, 8-ID beamline at NSLS-II
Fit method: EXAFS fitting (no XANES LCF reported)
Phase fractions: (±10%)
| Phase | Fraction |
|---|---|
| CoOx clusters | 1.0 |
Fit basis (paper's reference spectra):
- CoO
- Co-doped In2O3
Source evidence: Page 16-17, Figure 7, Table 1
Key reasoning: Under dual photo-thermal conditions at 250 °C, the EXAFS signal for the In6Co catalyst shows a new Co-O contribution and a further shortening of the Co-Co distance compared to thermal conditions. While there is a relative similitude with the CoO reference, the bond distances are characteristic of small oxide-type entities. This indicates the formation of size-limited CoOx clusters (few cobalt atoms) that maintain a Co(II) oxidation state.
Reasoning source: Section 3.- Results and discussion, pages 16-17
Scoring Rubric (total: 100 pts)
| Q | Type | Max | Question | Reference Answer | Scoring Criteria |
|---|---|---|---|---|---|
| q1 | identification | 30 | Based on the reaction conditions (photo-thermal at 250 °C), what is the dominant cobalt phase expected in the In6Co-PT sample, and what is its oxidation state? | The dominant cobalt phase expected in the In6Co-PT sample is size-limited CoOx clusters, which account for 100% of the cobalt species and maintain a Co(II) oxidation state. This specific phase arises because the dual photo-thermal conditions (CO2 + H2 at 250 °C with UV-Vis illumination) induce structural changes in the 6 mol% Co-doped In2O3 catalyst. Specifically, the combination of heat and light causes a new Co-O contribution and a shortened Co-Co distance compared to purely thermal conditions. Consequently, the cobalt segregates into small oxide-type entities consisting of only a few atoms, preventing full reduction and stabilizing the Co(II) state. | Full points for identifying CoOx clusters (or small oxide-type entities) and a Co(II) oxidation state. |
| q2 | reasoning | 40 | Explain the physical reasoning for the formation of this specific cobalt phase under dual photo-thermal conditions in the 6 mol% Co-doped In2O3 catalyst. | The formation of size-limited CoOx clusters is driven by the unique structural rearrangements induced by the dual photo-thermal environment (250 °C, UV-Vis illumination in CO2 + H2). Under these specific conditions, the 6 mol% Co-doped In2O3 catalyst exhibits a new Co-O contribution and a further shortening of the Co-Co bond distance compared to purely thermal treatments. While the resulting structure shares a relative similitude with bulk CoO, the observed bond distances are characteristic of small oxide-type entities. This indicates that the combination of heat and light causes the cobalt to segregate into tiny clusters of just a few atoms, which stabilizes the Co(II) oxidation state rather than allowing further reduction. | Full points for explaining that the initial Co-Co interactions in the 6 mol% sample evolve under photo-thermal conditions, leading to a new Co-O contribution and shortened Co-Co distances characteristic of size-limited CoOx clusters. |
| q3 | reasoning | 30 | What reference structures would be appropriate to use as a basis for modeling the local environment of the cobalt species in this sample? | The appropriate reference structures to use as a basis for modeling the local cobalt environment are CoO and Co-doped In2O3. These references are chosen because the 6 mol% Co-doped In2O3 catalyst undergoes specific structural evolution under the dual photo-thermal conditions (CO2 + H2 at 250 °C with UV-Vis illumination). The Co-doped In2O3 reference represents the initial host matrix of the catalyst. Meanwhile, the CoO reference is necessary because the heat and light induce the formation of size-limited CoOx clusters that maintain a Co(II) oxidation state and exhibit a relative similitude to bulk CoO, albeit with shortened Co-Co distances characteristic of small oxide-type entities. | Full points for mentioning CoO and Co-doped In2O3 (or similar indium oxide and cobalt oxide references). |
Review
Single Metal Atom Catalysts Prepared by Diluted Atomic Layer Deposition
BNL-NSLS-II-8-ID
Catalyst
Kai Shen et al.
DOI: 10.1021/acsami.5c10576
1 scenario
▶
#677
Pt/Al2O3
Pt L3
▶
LLM Prompt
Sample Information
Material: Pt/Al2O3
Support: gamma-Al2O3
Reaction Conditions: 10% H2 at 308 K
Sample-Specific Conditions
- metal loading: 0.06 wt%
- Pt single atom catalyst prepared by Diluted Atomic Layer Deposition
Measurement
We plan to measure the Pt L3 XANES spectrum of this sample.
Questions
Based on all the information above:
1. Based on the synthesis method (Diluted Atomic Layer Deposition) and the extremely low metal loading (0.06 wt%), what is the dominant Pt structural phase expected in this sample, and what physical reasoning explains this?
2. Describe the expected white line intensity of the Pt L3 edge XANES spectrum for this 0.06 wt% Pt/Al2O3 sample. How does it compare to standard reference materials?
3. If you were to qualitatively assess the oxidation state of the Pt species in this sample using XANES, what specific reference spectra would be appropriate to use as a basis for comparison?
Ground Truth
Material: 0.06 wt% Pt/Al2O3
Measurement: in-situ Pt L3 edge XANES at Beamline 8 ID-ISS (NSLS II)
Fit method: qualitative comparison
Phase fractions:
| Phase | Fraction |
|---|---|
| Pt single atoms | 1.0 |
Fit basis (paper's reference spectra):
- Pt foil (Pt0)
- Pt(acac)2 (Pt2+)
Source evidence: Page 14, Figure 5a
Key reasoning: The extremely low metal loading (0.06 wt%) achieved via Diluted Atomic Layer Deposition (DALD) minimizes metal agglomeration, resulting in predominantly isolated Pt atoms. This is confirmed by STEM images and EXAFS data showing a lack of measurable Pt-Pt coordination. The XANES white line intensity reflects an oxidation state between 0 and 2, consistent with single atoms interacting with the support.
Reasoning source: Section 2.2, Page 14
Scoring Rubric (total: 99 pts)
| Q | Type | Max | Question | Reference Answer | Scoring Criteria |
|---|---|---|---|---|---|
| q1 | reasoning | 33 | Based on the synthesis method (Diluted Atomic Layer Deposition) and the extremely low metal loading (0.06 wt%), what is the dominant Pt structural phase expected in this sample, and what physical reasoning explains this? | The dominant structural phase expected in this sample is 100% Pt single atoms supported on gamma-Al2O3. This specific phase arises because the extremely low metal loading of 0.06 wt%, combined with the Diluted Atomic Layer Deposition (DALD) synthesis method, effectively minimizes metal agglomeration. As a result, the platinum remains as isolated atoms interacting with the support rather than forming nanoparticles, a structural outcome confirmed by the complete lack of measurable Pt-Pt coordination in corresponding EXAFS data. | Full credit requires identifying the phase as Pt single atoms (or 100% isolated atoms) and explaining that the extremely low loading minimizes agglomeration during the deposition process. |
| q2 | spectral | 33 | Describe the expected white line intensity of the Pt L3 edge XANES spectrum for this 0.06 wt% Pt/Al2O3 sample. How does it compare to standard reference materials? | The Pt L3 edge XANES spectrum is expected to exhibit a white line intensity that is intermediate between the intensities of a Pt foil (Pt0) and Pt(acac)2 (Pt2+). This spectral feature results directly from the sample conditions, where the 0.06 wt% Pt is synthesized via Diluted Atomic Layer Deposition to form isolated single atoms. Because these single atoms interact with the gamma-Al2O3 support under 10% H2 at 308 K, they maintain an oxidation state between 0 and 2, which physically manifests as this intermediate white line intensity. | Full credit requires stating that the white line intensity is intermediate between metallic Pt (Pt0, e.g., Pt foil) and fully oxidized Pt2+ (e.g., Pt(acac)2), indicating an oxidation state between 0 and 2. |
| q3 | identification | 33 | If you were to qualitatively assess the oxidation state of the Pt species in this sample using XANES, what specific reference spectra would be appropriate to use as a basis for comparison? | To qualitatively assess the oxidation state of the Pt species in this sample, the appropriate reference spectra to use as a fit basis are Pt foil (representing Pt0) and Pt(acac)2 (representing Pt2+). These specific references are required because the sample's synthesis via Diluted Atomic Layer Deposition at a 0.06 wt% loading produces isolated Pt single atoms that interact with the gamma-Al2O3 support. Under the 10% H2 at 308 K reaction conditions, this support interaction stabilizes the single atoms in an oxidation state between 0 and 2, making the Pt0 and Pt2+ references necessary to bound and evaluate the sample's intermediate white line intensity. | Full credit requires listing Pt foil (or Pt0) and Pt(acac)2 (or a Pt2+ reference) as the basis spectra. |
Review
Reaction Mechanism of Electrodeposited ε-MnO 2 : A Proton-Centered Pathway in Aqueous Zn-Ion Systems
BNL-NSLS-II-8-ID
Electrochemistry
Varun R. Kankanallu et al.
DOI: 10.1021/acsami.5c22636
2 scenarios
▶
#678
ε-MnO2
Zn K
▶
LLM Prompt
Sample Information
Material: ε-MnO2
Electrode Type: cathode
Electrolyte: 1 M ZnSO4
Cell Type: coin cell
Charge Discharge: discharged
C Rate: 0.2 C
Voltage V: 1.0
Cycle Number: 1
Sample-Specific Conditions
- voltage: 1.0 V
- Ex-situ Zn K-edge XAS of the electrodeposited ε-MnO2 cathode after the first discharge to 1.0 V.
Measurement
We plan to measure the Zn K XANES spectrum of this sample.
Questions
Based on all the information above:
1. What is the dominant Zn-containing phase that precipitates on the ε-MnO2 cathode during the first discharge to 1.0 V, and what electrochemical mechanism drives its formation?
2. Describe the key distinguishing feature in the extended X-ray absorption fine structure (EXAFS) R-space data that confirms the presence of this discharged phase, and contrast it with the partially charged (1.6 V) state.
3. If performing EXAFS modeling or qualitative spectral comparisons for this sample, what reference structures or standard spectra should be included in the analysis basis according to the study?
Ground Truth
Material: ε-MnO2
Measurement: Ex-situ Zn K-edge XAS at ISS beamline (8-ID)
Fit method: Qualitative comparison and EXAFS FEFF6 modeling
Fit basis (paper's reference spectra):
- Zn4SO4(OH)6·5H2O (ZHS)
- ZnMn3O7·3H2O
- ZnO standard
Source evidence: Figure 4(e, f), Page 21
Key reasoning: During discharge, proton insertion and MnO2 dissolution consume protons at the cathode, leading to local interfacial alkalization. This pH rise is buffered by the precipitation of zinc hydroxyl sulfate (ZHS). The EXAFS radial density function of the discharged state shows a distinct peak between 2.5–3 Å corresponding to Zn–Zn coordination, confirming the formation of the ZHS phase.
Reasoning source: Section 2.1 (Page 14) and Section 2.2 (Page 21)
Scoring Rubric (total: 100 pts)
| Q | Type | Max | Question | Reference Answer | Scoring Criteria |
|---|---|---|---|---|---|
| q1 | reasoning | 35 | What is the dominant Zn-containing phase that precipitates on the ε-MnO2 cathode during the first discharge to 1.0 V, and what electrochemical mechanism drives its formation? | The dominant Zn-containing phase that precipitates on the cathode is zinc hydroxyl sulfate (ZHS), specifically Zn4SO4(OH)6·5H2O. This phase forms because discharging the ε-MnO2 cathode to 1.0 V in a 1 M ZnSO4 electrolyte drives proton insertion and MnO2 dissolution. These electrochemical reactions consume protons at the cathode surface, causing a local interfacial alkalization. The resulting rise in pH is buffered by the precipitation of the ZHS phase onto the electrode. | The answer must identify zinc hydroxyl sulfate (ZHS) / Zn4SO4(OH)6·5H2O as the dominant phase and explain that proton consumption during discharge causes local interfacial alkalization (pH rise), which drives the precipitation of ZHS. |
| q2 | spectral | 35 | Describe the key distinguishing feature in the extended X-ray absorption fine structure (EXAFS) R-space data that confirms the presence of this discharged phase, and contrast it with the partially charged (1.6 V) state. | The key distinguishing feature in the EXAFS R-space data is a prominent peak located between 2.5–3 Å, which corresponds to Zn–Zn coordination. This peak is distinctly present in the 1.0 V discharged state but is completely absent in the 1.6 V charged state. This spectral feature arises because discharging the cell to 1.0 V consumes protons and causes local interfacial alkalization, driving the precipitation of zinc hydroxyl sulfate (ZHS). The Zn-Zn scattering within the structure of this precipitated ZHS phase produces the distinct 2.5–3 Å peak, structurally confirming its formation on the cathode surface. | The answer must mention the appearance of a distinct peak between 2.5–3 Å in R-space corresponding to Zn-Zn coordination, and note that this peak is absent in the 1.6 V charged state. |
| q3 | identification | 30 | If performing EXAFS modeling or qualitative spectral comparisons for this sample, what reference structures or standard spectra should be included in the analysis basis according to the study? | According to the study, the analysis basis for EXAFS modeling and qualitative comparisons should include Zn4SO4(OH)6·5H2O (ZHS), ZnMn3O7·3H2O, and a ZnO standard. These specific references are necessary because discharging the ε-MnO2 cathode to 1.0 V in a 1 M ZnSO4 electrolyte consumes protons via proton insertion and MnO2 dissolution. This causes a local interfacial pH rise that is buffered by the precipitation of ZHS, making it a critical structural reference for modeling the discharged state. Furthermore, the ZnO standard is required to evaluate relative energy shifts, as the XANES spectrum of the 1.0 V discharged state differs significantly from charged samples, which shift to higher energies relative to ZnO. | The answer must list Zn4SO4(OH)6·5H2O (ZHS) and ZnO (as a standard). Mentioning ZnMn3O7·3H2O is also acceptable as it is part of the study's overall basis. |
Review
#679
ε-MnO2
Zn K
▶
LLM Prompt
Sample Information
Material: ε-MnO2
Electrode Type: cathode
Electrolyte: 1 M ZnSO4
Cell Type: coin cell
Charge Discharge: charged
C Rate: 0.2 C
Voltage V: 1.75
Cycle Number: 1
Sample-Specific Conditions
- voltage: 1.75 V
- Ex-situ Zn K-edge XAS of the electrodeposited ε-MnO2 cathode after the first full charge to 1.75 V.
Measurement
We plan to measure the Zn K XANES spectrum of this sample.
Questions
Based on all the information above:
1. Based on the sample conditions (1st full charge to 1.75 V), what is the dominant Zn-containing phase that forms on the cathode, and what physical/chemical process drives its formation?
2. Describe the expected distinguishing spectral features of this sample at 1.75 V compared to the discharged state, specifically focusing on the local coordination environment of Zn.
3. If one were to perform structural modeling or linear combination fitting on the Zn K-edge data for this 1.75 V charged sample, what reference spectra or calculated structures would be essential to include in the basis set to capture the observed Zn speciation?
Ground Truth
Material: ε-MnO2
Measurement: Ex-situ Zn K-edge XAS at the inner shell spectroscopy (ISS) beamline (8-ID)
Fit method: Qualitative XANES edge position comparison and EXAFS/Wavelet Transform (WT) analysis
Fit basis (paper's reference spectra):
- ZnO standard
- FEFF-calculated structure of ZnMn3O7·3H2O (ZMC)
- FEFF-calculated structure of Zn4SO4(OH)6·5H2O (ZHS)
Source evidence: Figure 4(e, f) and Section 2.2, Pages 21-22
Key reasoning: During the charge to 1.75 V, the flaky ZHS phase formed during discharge disappears, and dissolved Mn2+ redeposits. The EXAFS R-space shows the disappearance of the Zn-Zn coordination peak (2.5-3 Å) from ZHS and the emergence of a distinct peak around 3 Å. This new peak corresponds to Zn-Mn coordination, matching the FEFF-calculated structure of a layered ZnMn3O7·3H2O (ZMC) phase that nucleates on the surface.
Reasoning source: Section 2.2, Pages 21-22
Scoring Rubric (total: 100 pts)
| Q | Type | Max | Question | Reference Answer | Scoring Criteria |
|---|---|---|---|---|---|
| q1 | reasoning | 30 | Based on the sample conditions (1st full charge to 1.75 V), what is the dominant Zn-containing phase that forms on the cathode, and what physical/chemical process drives its formation? | The dominant Zn-containing phase that forms on the cathode is a layered ZnMn3O7·3H2O (ZMC) phase. This occurs because during the first full charge to 1.75 V in the 1 M ZnSO4 electrolyte, the flaky zinc hydroxyl sulfate (ZHS) phase that formed during the prior discharge process disappears. Concurrently, dissolved Mn2+ ions in the electrolyte redeposit onto the cathode. This redeposition process drives the nucleation of the ZMC phase on the surface, incorporating Zn into the new layered structure. | Full points if the answer identifies ZnMn3O7·3H2O (ZMC) as the dominant phase and explains that it forms via the redeposition of dissolved Mn2+ and the disappearance/dissolution of the ZHS phase during the charge process. |
| q2 | spectral | 40 | Describe the expected distinguishing spectral features of this sample at 1.75 V compared to the discharged state, specifically focusing on the local coordination environment of Zn. | In the XANES energy space, the absorption edge is shifted to the right compared to a ZnO standard, indicating a more oxidized Zn state. In the EXAFS R-space, the spectrum features a Zn-O coordination peak at 1-2 Å and a distinct new peak around 3 Å. These features arise because charging the cell to 1.75 V causes the zinc hydroxyl sulfate (ZHS) phase to disappear, resulting in the complete loss of the Zn-Zn coordination peak (2.5-3 Å) characteristic of the discharged state. The new peak at ~3 Å emerges due to the redeposition of Mn2+ into a ZnMn3O7·3H2O (ZMC) phase, directly reflecting the new Zn-Mn local coordination environment. | Full points if the answer mentions the emergence of a distinct Zn-Mn coordination peak around 3 Å and the disappearance of the Zn-Zn coordination peak (2.5-3 Å) associated with ZHS. Mentioning the XANES edge shift to a more oxidized state relative to ZnO is a bonus. |
| q3 | identification | 30 | If one were to perform structural modeling or linear combination fitting on the Zn K-edge data for this 1.75 V charged sample, what reference spectra or calculated structures would be essential to include in the basis set to capture the observed Zn speciation? | The essential basis set for modeling this data must include a ZnO standard, the FEFF-calculated structure of ZnMn3O7·3H2O (ZMC), and the FEFF-calculated structure of Zn4SO4(OH)6·5H2O (ZHS). These specific references are required because the sample undergoes a distinct phase transformation during the charge to 1.75 V. The ZHS structure is necessary to verify the disappearance of the discharged phase, while the ZMC structure is needed to model the new Zn-Mn coordination environment created by the redeposition of dissolved Mn2+. The ZnO standard is included to provide a baseline for the edge position shift, confirming the more oxidized state of Zn in the charged cathode. | Full points if the answer identifies the need for a FEFF-calculated structure of ZnMn3O7·3H2O (ZMC), a ZnO standard (for edge position comparison), and a ZHS reference (to confirm its disappearance). |
Review
Multimodal Characterization of Materials and Decontamination Processes for Chemical Warfare Protection
BNL-NSLS-II-8-ID
Catalyst
Amani
M. Ebrahim et al.
DOI: 10.1021/acsami.9b19494
2 scenarios
▶
#680
(Et2NH2)8[(α-PW11O39Zr(μ-OH)(H2O))2]·7H2O
Zr K
▶
LLM Prompt
Sample Information
Material: (Et2NH2)8[(α-PW11O39Zr(μ-OH)(H2O))2]·7H2O
Reaction Conditions: Ambient, before exposure
Sample-Specific Conditions
- Exposure time to DMCP: 0 days
- Pristine zirconium-substituted polyoxometalate before exposure to simulant
Measurement
We plan to measure the Zr K XANES spectrum of this sample.
Questions
Based on all the information above:
1. What theoretical reference spectra (basis functions) are required to model the Zr K-edge XANES of this catalytic system during a simulant exposure time-course, and which of these specifically matches the pristine sample?
2. Describe the key spectral features (approximate peak positions and overall shape) expected in the Zr K-edge XANES spectrum of the pristine Zr-POM dimer.
Ground Truth
Material: (Et2NH2)8[(α-PW11O39Zr(μ-OH)(H2O))2]·7H2O
Measurement: Zr K-edge XANES
Fit method: FEFF calculations
Phase fractions:
| Phase | Fraction |
|---|---|
| Zr-POM dimer | 1.0 |
Fit basis (paper's reference spectra):
- Calculated Zr-POM dimer structure
- Calculated Zr-POM monomer structure
Source evidence: Figure 5 and text on pages 13-14, 25
Key reasoning: Before exposure to the simulant DMCP, the pristine Zr-POM exists entirely as a dimer (D). The experimental XANES spectrum of the pristine sample matches the FEFF-calculated XANES spectrum of the dimeric structure. Monomerization to the active single-site Zr catalyst requires interaction with the simulant or a significant enthalpy input (38.5 kJ/mol in the absence of warfare gases), so the pristine state remains dimeric under ambient, unexposed conditions.
Reasoning source: Section 4 (page 13-14) and Section 9 (page 25)
Scoring Rubric (total: 100 pts)
| Q | Type | Max | Question | Reference Answer | Scoring Criteria |
|---|---|---|---|---|---|
| q2 | identification | 46 | What theoretical reference spectra (basis functions) are required to model the Zr K-edge XANES of this catalytic system during a simulant exposure time-course, and which of these specifically matches the pristine sample? | To model the Zr K-edge XANES of this catalytic system, the required theoretical reference spectra are the FEFF-calculated Zr-POM dimer structure and the FEFF-calculated Zr-POM monomer structure. For the pristine sample, the spectrum specifically matches the calculated Zr-POM dimer structure with a fraction of 1.0. This occurs because, under the specified ambient conditions with 0 days of exposure to the DMCP simulant, the pristine zirconium-substituted polyoxometalate exists entirely in its dimeric form. Monomerization to the active single-site Zr catalyst requires either interaction with the simulant or a significant enthalpy input of 38.5 kJ/mol, meaning the unexposed, ambient sample lacks the driving force to convert and remains 100% dimeric. | Full points for identifying that calculated spectra for both the Zr-POM dimer and Zr-POM monomer are needed as basis functions, and correctly stating that the pristine sample matches the calculated dimer structure. |
| q3 | spectral | 54 | Describe the key spectral features (approximate peak positions and overall shape) expected in the Zr K-edge XANES spectrum of the pristine Zr-POM dimer. | The Zr K-edge XANES spectrum of the pristine Zr-POM dimer exhibits an edge position near 18000 eV, a sharp, high-intensity white line (normalized intensity ~1.5-2.0) near 18020 eV, and a broader, moderate-intensity post-edge resonance near 18040 eV. The overall spectral shape closely matches the FEFF-calculated spectrum for the dimeric Zr-POM structure, which is distinguished from the monomer by differences in the post-edge region between 18020 and 18040 eV. These specific features arise because the sample is measured at ambient conditions with 0 days of exposure to the DMCP simulant. Without exposure to the simulant or a significant enthalpy input (38.5 kJ/mol) to drive monomerization, the pristine material remains entirely in the dimeric state, meaning the observed electronic and structural properties strictly reflect the intact Zr-POM dimer. | Full points for mentioning the edge position (~18000 eV), the sharp white line peak near 18020 eV, and the broader post-edge resonance near 18040 eV. |
Review
#681
(Et2NH2)8[(α-PW11O39Zr(μ-OH)(H2O))2]·7H2O
Zr K
▶
LLM Prompt
Sample Information
Material: (Et2NH2)8[(α-PW11O39Zr(μ-OH)(H2O))2]·7H2O
Reaction Conditions: Exposed to DMCP vapor for 4 days
Sample-Specific Conditions
- Exposure time to DMCP: 4 days
- Zirconium-substituted polyoxometalate after 4 days of exposure to DMCP vapor
Measurement
We plan to measure the Zr K XANES spectrum of this sample.
Questions
Based on all the information above:
1. What is the dominant structural phase of the Zr-POM catalyst after 4 days of exposure to DMCP vapor, and what is the physical reasoning for this structural change?
2. To model and interpret the XANES spectrum of this sample, what specific basis functions or reference spectra should be utilized according to the study?
3. How can the XANES spectrum of the DMCP-exposed sample be distinguished from the pristine Zr-POM catalyst?
Ground Truth
Material: (Et2NH2)8[(α-PW11O39Zr(μ-OH)(H2O))2]·7H2O
Measurement: Zr K-edge XANES
Fit method: Comparison to FEFF calculations
Phase fractions:
| Phase | Fraction |
|---|---|
| Zr-POM monomer | 1.0 |
Fit basis (paper's reference spectra):
- FEFF-calculated Zr-POM dimer structure
- FEFF-calculated Zr-POM monomer structure
Source evidence: Figure 5 and Page 13-14
Key reasoning: Exposure of the Zr-POM to DMCP vapor facilitates the dissociation of the pristine Zr-POM dimers into monomers. The simulant-catalyst interaction significantly reduces the energy required for monomeric Zr-POM formation. The experimental Zr K-edge XANES spectrum after 4 days of DMCP exposure matches the calculated spectrum for the monomeric structure, indicating complete or near-complete conversion to the monomer.
Reasoning source: Section 4 (Pages 13-14) and Section 9 (Page 25)
Scoring Rubric (total: 100 pts)
| Q | Type | Max | Question | Reference Answer | Scoring Criteria |
|---|---|---|---|---|---|
| q1 | reasoning | 40 | What is the dominant structural phase of the Zr-POM catalyst after 4 days of exposure to DMCP vapor, and what is the physical reasoning for this structural change? | After 4 days of exposure to DMCP vapor, the dominant structural phase of the Zr-POM catalyst is the Zr-POM monomer, comprising a fraction of 1.0. This complete structural change occurs because the interaction between the DMCP simulant and the catalyst significantly reduces the energy required for monomeric Zr-POM formation. Consequently, the DMCP vapor facilitates the dissociation of the pristine Zr-POM dimers into monomers. The experimental Zr K-edge XANES spectrum confirms this mechanism by matching the calculated spectrum for the monomeric structure. | Must identify the Zr-POM monomer as the dominant phase and explain that interaction with DMCP facilitates the dissociation of the pristine dimer into monomers by reducing the energy required for this transformation. |
| q2 | identification | 30 | To model and interpret the XANES spectrum of this sample, what specific basis functions or reference spectra should be utilized according to the study? | To model the Zr K-edge XANES spectrum of this sample, the specific basis functions utilized are the FEFF-calculated Zr-POM dimer structure and the FEFF-calculated Zr-POM monomer structure. These specific references are required because the pristine material initially consists of Zr-POM dimers, which undergo a structural transformation upon exposure to DMCP vapor for 4 days. The interaction with the DMCP simulant lowers the energy barrier for dissociation, driving the complete conversion from dimers to monomers. By comparing the experimental data to these two calculated structures, the analysis confirms that the DMCP exposure results in a 1.0 fraction of the Zr-POM monomer. | Must mention the use of FEFF-calculated theoretical spectra for both the Zr-POM dimer and Zr-POM monomer structures. |
| q3 | spectral | 30 | How can the XANES spectrum of the DMCP-exposed sample be distinguished from the pristine Zr-POM catalyst? | The XANES spectrum of the sample exposed to DMCP for 4 days is distinguished from the pristine Zr-POM catalyst by its distinct spectral shape, which matches the FEFF-calculated monomer structure rather than the dimer structure. This spectral difference arises because the 4-day exposure to DMCP vapor facilitates the complete dissociation of the pristine Zr-POM dimers into monomers. The simulant-catalyst interaction significantly reduces the energy required to form the monomeric state. As a result, this structural transformation from dimer to monomer alters the local environment around the Zr4+ ions, producing the unique spectral signature of the fully converted monomeric sample. | Must state that the spectrum of the exposed sample matches the calculated spectrum for the monomeric structure, which has a distinct spectral shape compared to the pristine dimer. |
Review
Supported Single Fe Atoms Prepared via Atomic Layer Deposition for Catalytic Reactions
APS
Catalyst
Xiaofeng Wang et al.
DOI: 10.1021/acsanm.0c00146
1 scenario
▶
#682
Fe/SiO2
Fe K-edge
▶
LLM Prompt
Sample Information
Material: Fe/SiO2
Support: SiO2
Sample-Specific Conditions
- Support material: SiO2
- Fe single atoms deposited on SiO2 nanoparticles via ALD, exposed to air
Measurement
We plan to measure the Fe K-edge XANES spectrum of this sample.
Questions
Based on all the information above:
1. What candidate reference spectra should be included in a linear combination fitting (LCF) analysis to determine the oxidation state of the air-exposed Fe/SiO2 single-atom catalyst?
2. Based on the sample conditions (Fe single atoms deposited via ALD and exposed to air), estimate the phase fractions of the different Fe oxidation states present in the Fe/SiO2 sample.
Ground Truth
Material: Fe/SiO2
Measurement: Fe K-edge XANES, Advanced Photon Source (9-BM)
Fit method: Linear combination fitting (implied by fitting to a mixture of oxidation states)
Phase fractions: (±10%)
| Phase | Fraction |
|---|---|
| Fe3+ (Fe2O3-like) | 0.85 |
| Fe2+ (FeO-like) | 0.15 |
Fit basis (paper's reference spectra):
- Fe2O3
- FeO
- Fe foil
Source evidence: Page 9, text ('After fitting and calculating, both samples were oxidized to the extent of a mixture of ~85% Fe3+ and ~15% Fe2+ (Table S2).') and Figure 2a
Key reasoning: The Fe K-edge XANES of the Fe/SiO2 sample exhibited a near-edge structure similar to Fe2O3, but very different from Fe foil and FeO. This indicates that the highly dispersed Fe single atoms were oxidized upon exposure to air. Fitting the data revealed a mixture of predominantly Fe3+ (~85%) with a minor Fe2+ (~15%) component.
Reasoning source: Page 9, Section 3 (Results and discussion)
Scoring Rubric (total: 100 pts)
| Q | Type | Max | Question | Reference Answer | Scoring Criteria |
|---|---|---|---|---|---|
| q1 | identification | 33 | What candidate reference spectra should be included in a linear combination fitting (LCF) analysis to determine the oxidation state of the air-exposed Fe/SiO2 single-atom catalyst? | The candidate reference spectra for the linear combination fitting (LCF) analysis should include Fe2O3, FeO, and Fe foil. These specific references are required because the highly dispersed Fe single atoms deposited on the SiO2 support via ALD undergo significant oxidation upon exposure to air. As a result of this air exposure, the sample's near-edge structure becomes very similar to Fe2O3, indicating a predominantly oxidized state. Including the metallic (Fe foil) and lower oxidation state (FeO) references alongside Fe2O3 ensures that the full extent of this air-induced oxidation can be accurately modeled to confirm the absence of metallic iron and quantify the oxidized species. | Full credit for identifying Fe2O3 (Fe3+), FeO (Fe2+), and Fe foil (Fe0) as the necessary reference standards. |
| q2 | quantification | 67 | Based on the sample conditions (Fe single atoms deposited via ALD and exposed to air), estimate the phase fractions of the different Fe oxidation states present in the Fe/SiO2 sample. | The estimated phase fractions for the Fe/SiO2 sample are approximately 85% Fe3+ (Fe2O3-like) and 15% Fe2+ (FeO-like), with an uncertainty of 10%. These specific values arise because the highly dispersed Fe single atoms deposited on the SiO2 nanoparticles are highly reactive and become heavily oxidized upon exposure to air. This air exposure drives the iron predominantly to the highly oxidized Fe3+ state, yielding a near-edge structure very similar to Fe2O3. However, the oxidation results in a mixed state rather than a single pure phase, leaving a minor 15% component of partially oxidized Fe2+ species. | Full credit for estimating ~85% Fe3+ (or Fe2O3-like) and ~15% Fe2+ (or FeO-like). Partial credit for identifying that it is predominantly Fe3+ with a minor Fe2+ component. |
Review
Deciphering Dynamic Structural and Mechanistic Complexity in Cu/CeO2/ZSM-5 Catalysts for the Reverse Water-Gas Shift Reaction
APS
Catalyst
Dimitriy Vovchok et al.
DOI: 10.1021/acscatal.0c01584
3 scenarios
▶
#683
Cu/CeO2/ZSM-5
Cu K-edge
▶
LLM Prompt
Sample Information
Material: Cu/CeO2/ZSM-5
Support: ZSM-5
Reaction Conditions: H2:CO2 = 5:1 (10 mL/min H2, 2 mL/min CO2), 25 °C
Sample-Specific Conditions
- Temperature: 25 °C
- Fresh catalyst under RWGS gas mixture at room temperature
Measurement
We plan to measure the Cu K-edge XANES spectrum of this sample.
Questions
Based on all the information above:
1. Identify the dominant copper phase and its oxidation state for this catalyst at 25 °C under the specified RWGS gas mixture. What reference spectra would be appropriate to include in a basis set to model the phase evolution of this catalyst during an in-situ heating experiment?
2. Describe the expected spectral shape and the key distinguishing feature (including its specific energy position) in the Cu K-edge XANES spectrum of this sample at 25 °C.
Ground Truth
Material: Cu/CeO2/ZSM-5
Measurement: in-situ Cu K-edge XANES at APS beamline 9-BM
Fit method: Qualitative comparison to reference spectra
Phase fractions: (±10%)
| Phase | Fraction |
|---|---|
| CuO | 1.0 |
Fit basis (paper's reference spectra):
- Cu0
- Cu1+
- Cu2+
Source evidence: Figure 4b and text on page 18
Key reasoning: At 25 °C under the RWGS reactant flow, the catalyst is in its initial fresh state before reaction light-off. The Cu K-edge XANES spectrum closely matches the Cu2+ reference spectrum. The text explicitly notes that the bulk copper content exists in a state resembling Cu2+ in CuO at this temperature, before undergoing a dramatic reduction to metallic copper at higher temperatures (between 100 °C and 200 °C).
Reasoning source: Page 18, In-situ Characterization of Catalysts Under Reaction Conditions
Scoring Rubric (total: 100 pts)
| Q | Type | Max | Question | Reference Answer | Scoring Criteria |
|---|---|---|---|---|---|
| q1 | identification | 50 | Identify the dominant copper phase and its oxidation state for this catalyst at 25 °C under the specified RWGS gas mixture. What reference spectra would be appropriate to include in a basis set to model the phase evolution of this catalyst during an in-situ heating experiment? | The dominant copper phase for this catalyst at 25 °C is CuO, corresponding to an oxidation state of Cu2+. To model the phase evolution of this catalyst during an in-situ heating experiment, the appropriate reference spectra to include in the basis set are Cu0, Cu1+, and Cu2+. This specific phase composition arises because, at 25 °C under the RWGS reactant flow (H2:CO2 = 5:1), the catalyst remains in its initial fresh state prior to reaction light-off. Consequently, the bulk copper content exists entirely as Cu2+ in CuO, as the temperature is too low to drive the dramatic reduction to metallic copper that typically occurs between 100 °C and 200 °C. | Full points for identifying CuO / Cu2+ as the dominant phase and listing Cu0, Cu1+, and Cu2+ (or CuO) as the necessary reference spectra for modeling the phase evolution. |
| q3 | spectral | 50 | Describe the expected spectral shape and the key distinguishing feature (including its specific energy position) in the Cu K-edge XANES spectrum of this sample at 25 °C. | The expected Cu K-edge XANES spectrum for this sample exhibits a strong white line peak at 8999 eV, closely matching the spectral shape of a Cu2+ reference standard. The key distinguishing feature is this prominent peak at 8999 eV coupled with the complete absence of metallic copper features. These spectral characteristics arise because the sample is held at 25 °C under the RWGS gas mixture, which keeps the fresh catalyst in its initial, unreacted state before light-off. Since the bulk copper has not yet undergone reduction to metallic copper at this low temperature, its structural and electronic properties remain entirely those of Cu2+ in CuO, thereby producing the observed strong white line. | Full points for describing a spectral shape matching a Cu2+ standard, specifically noting the prominent main peak/white line at 8999 eV that distinguishes it from reduced copper states. |
Review
#684
Cu/CeO2/ZSM-5
Cu K-edge
▶
LLM Prompt
Sample Information
Material: Cu/CeO2/ZSM-5
Support: ZSM-5
Reaction Conditions: H2:CO2 = 5:1 (10 mL/min H2, 2 mL/min CO2), 200 °C
Sample-Specific Conditions
- Temperature: 200 °C
- Catalyst under RWGS gas mixture heated to 200 °C
Measurement
We plan to measure the Cu K-edge XANES spectrum of this sample.
Questions
Based on all the information above:
1. What candidate reference spectra are needed to evaluate the Cu K-edge XANES of this catalyst under RWGS conditions, and which phase dominates the bulk copper speciation at 200 °C?
2. Based on the physical and chemical processes occurring during the RWGS reaction heating ramp, explain why the bulk copper phase transitions to its observed state by 200 °C.
3. Describe the expected spectral shape of the Cu K-edge XANES for this sample at 200 °C and explain how it distinguishes the dominant phase from oxidized copper species.
Ground Truth
Material: Cu/CeO2/ZSM-5
Measurement: in-situ Cu K-edge XANES in fluorescence mode at APS beamline 9-BM
Fit method: Qualitative visual comparison to reference spectra
Phase fractions: (±10%)
| Phase | Fraction |
|---|---|
| metallic_copper | 1.0 |
Fit basis (paper's reference spectra):
- Cu0
- Cu1+
- Cu2+
Source evidence: Figure 4b and text on page 18
Key reasoning: Under the reducing RWGS reaction conditions (H2:CO2 = 5:1), the bulk copper content undergoes a dramatic reduction from a state resembling Cu2+ in CuO to metallic copper between 100 °C and 200 °C. By 200 °C, the in-situ XANES spectrum perfectly matches the Cu0 reference spectrum, indicating that the bulk copper is fully reduced to metallic copper. This metallic state, alongside unreduced bulk CeO2, describes the active state of the catalyst.
Reasoning source: In-situ Characterization of Catalysts Under Reaction Conditions, page 18
Scoring Rubric (total: 100 pts)
| Q | Type | Max | Question | Reference Answer | Scoring Criteria |
|---|---|---|---|---|---|
| q1 | identification | 30 | What candidate reference spectra are needed to evaluate the Cu K-edge XANES of this catalyst under RWGS conditions, and which phase dominates the bulk copper speciation at 200 °C? | To evaluate the Cu K-edge XANES of this catalyst, reference spectra for Cu0, Cu1+, and Cu2+ are required as the fitting basis. At 200 °C, the bulk copper speciation is entirely dominated by metallic copper (Cu0), which accounts for a fraction of 1.0. This complete dominance of the Cu0 phase occurs because the sample is exposed to a highly reducing RWGS gas mixture (H2:CO2 = 5:1) during heating. Under these specific reducing conditions, the initial Cu2+ species undergo a dramatic and complete reduction to metallic copper between 100 °C and 200 °C, forming the active state of the catalyst alongside unreduced CeO2. | Full credit for identifying Cu0, Cu1+, and Cu2+ as the necessary reference spectra and correctly stating that metallic copper (Cu0) completely dominates the bulk phase at 200 °C. |
| q2 | reasoning | 40 | Based on the physical and chemical processes occurring during the RWGS reaction heating ramp, explain why the bulk copper phase transitions to its observed state by 200 °C. | The bulk copper phase transitions to a fully metallic state (Cu0 fraction of 1.0) by 200 °C due to the highly reducing nature of the RWGS reaction conditions. Specifically, the Cu/CeO2/ZSM-5 catalyst is exposed to a hydrogen-rich gas mixture with an H2:CO2 ratio of 5:1. As the temperature ramps from 100 °C to 200 °C in this environment, the initial oxidized copper content (resembling Cu2+ in CuO) undergoes a dramatic chemical reduction. Consequently, by 200 °C, the bulk copper is completely reduced to metallic copper, which, together with unreduced bulk CeO2, constitutes the active state of the catalyst. | Full credit for explaining that the highly reducing H2-rich RWGS environment drives a dramatic reduction of the initial Cu2+ (CuO) state to metallic copper between 100 °C and 200 °C, resulting in a fully reduced bulk metallic copper active state. |
| q3 | spectral | 30 | Describe the expected spectral shape of the Cu K-edge XANES for this sample at 200 °C and explain how it distinguishes the dominant phase from oxidized copper species. | At 200 °C, the Cu K-edge XANES spectrum perfectly matches the Cu0 reference, exhibiting a characteristic metallic edge step and distinct post-edge oscillations. The spectrum is distinguished from oxidized copper species by the complete absence of the intense white line characteristic of Cu1+ and the pre-edge/edge features typical of Cu2+. These specific metallic spectral features arise because the highly reducing RWGS gas mixture (H2:CO2 = 5:1) at 200 °C drives a complete reduction of the initial Cu2+ content to metallic copper (Cu0). Therefore, the observed post-edge oscillations and lack of oxidized features directly reflect the fully reduced, metallic electronic and structural state of the active catalyst. | Full credit for describing a spectrum that matches a Cu0 reference (metallic edge step and post-edge oscillations) and explicitly noting the absence of Cu1+ white line features and Cu2+ pre-edge/edge features. |
Review
#685
Cu/CeO2/ZSM-5
Ce L3-edge
▶
LLM Prompt
Sample Information
Material: Cu/CeO2/ZSM-5
Support: ZSM-5
Reaction Conditions: H2:CO2 = 5:1 (10 mL/min H2, 2 mL/min CO2), 400 °C
Sample-Specific Conditions
- Temperature: 400 °C
- Catalyst under RWGS gas mixture heated to 400 °C, measured at Ce L3-edge
Measurement
We plan to measure the Ce L3-edge XANES spectrum of this sample.
Questions
Based on all the information above:
1. Based on the reaction conditions (RWGS at 400 °C), what is the expected dominant oxidation state and phase of Cerium in the bulk of the Cu/CeO2/ZSM-5 catalyst? Explain the physical reasoning for this bulk state.
2. Describe the expected spectral shape of the Ce L3-edge XANES for this sample at 400 °C. What distinguishing features indicate the oxidation state of the bulk cerium?
Ground Truth
Material: 3Cu48CeZ (3 wt% Cu, 48 wt% CeO2 on ZSM-5)
Measurement: in-situ Ce L3-edge XANES in fluorescence mode at APS beamline 9-BM
Fit method: Qualitative spectral comparison
Phase fractions: (±10%)
| Phase | Fraction |
|---|---|
| CeO2 | 1.0 |
Fit basis (paper's reference spectra):
- Ce3+
- Ce4+
Source evidence: Figure 4a and text on pages 17-18
Key reasoning: In-situ Ce L3-edge XANES measurements up to 400 °C indicate that the bulk cerium content is oxidatively stable and exists as Ce4+ in CeO2 throughout the course of the reaction. While the surface undergoes partial reduction to Ce3+ (as observed by AP-XPS), the bulk probed by XANES remains fully oxidized.
Reasoning source: Pages 17-18, Section: In-situ Characterization of Catalysts Under Reaction Conditions
Scoring Rubric (total: 100 pts)
| Q | Type | Max | Question | Reference Answer | Scoring Criteria |
|---|---|---|---|---|---|
| q1 | identification | 50 | Based on the reaction conditions (RWGS at 400 °C), what is the expected dominant oxidation state and phase of Cerium in the bulk of the Cu/CeO2/ZSM-5 catalyst? Explain the physical reasoning for this bulk state. | The expected dominant phase of cerium in the bulk of the Cu/CeO2/ZSM-5 catalyst is CeO2, with an oxidation state of Ce4+ comprising a fraction of 1.0. This state is expected because the bulk cerium content is highly oxidatively stable under the applied RWGS reaction conditions of H2:CO2 = 5:1 at 400 °C. While the surface of the catalyst undergoes partial reduction to Ce3+ in this reducing environment, the bulk structure probed by XANES remains fully oxidized. Consequently, the bulk cerium resists reduction and persists entirely as Ce4+ throughout the course of the reaction. | Full points for identifying Ce4+ / CeO2 as the dominant bulk phase (fraction ~1.0) and explaining that the bulk ceria is oxidatively stable under these conditions, even if the surface reduces. |
| q2 | spectral | 50 | Describe the expected spectral shape of the Ce L3-edge XANES for this sample at 400 °C. What distinguishing features indicate the oxidation state of the bulk cerium? | The expected Ce L3-edge XANES spectrum for this sample at 400 °C will exhibit the characteristic spectral shape and profile of Ce4+. The distinguishing feature of this spectrum is the maintenance of this Ce4+ profile without the appearance of any significant Ce3+ features, remaining unchanged from room temperature up to 400 °C. These spectral features occur because the bulk cerium in the Cu/CeO2/ZSM-5 catalyst is oxidatively stable under the reducing RWGS gas mixture (H2:CO2 = 5:1). Even though the surface partially reduces, the bulk probed by the XANES measurement remains fully oxidized as CeO2, producing a pure Ce4+ spectral signature. | Full points for describing the characteristic Ce4+ spectral profile and noting the absence of Ce3+ features, indicating a fully oxidized bulk. |
Review
Pretreatment Effects on the Surface Chemistry of Small Oxygenates on Molybdenum Trioxide
BNL-NSLS-II-8-ID
Catalyst
Sean Najmi et al.
DOI: 10.1021/acscatal.0c01992
3 scenarios
▶
#686
MoO3
Mo L3-edge
▶
LLM Prompt
Sample Information
Material: MoO3
Sample-Specific Conditions
- Pretreatment gas: O2
- MoO3 sample re-oxidized in O2 after inert and reducing treatments
Measurement
We plan to measure the Mo L3-edge XANES spectrum of this sample.
Questions
Based on all the information above:
1. Based on the O2 pretreatment conditions, what is the expected dominant phase and oxidation state of the sample, and what specific XANES parameters (edge position and splitting energy) confirm this state?
Ground Truth
Material: MoO3
Measurement: Mo L3-edge in-situ XANES, fluorescence mode, beamline 4-3 at SSRL
Fit method: Peak position and splitting energy analysis (no LCF performed)
Phase fractions:
| Phase | Fraction |
|---|---|
| MoO3 | 1.0 |
Fit basis (paper's reference spectra):
- MoO3 standard
- MoO2 standard
Source evidence: Table 1, Figure 1A, and Section 3.1 text
Key reasoning: Following the oxidative treatment in O2, the Mo L3 edge energy was determined to be 2525.6 eV with a d-orbital splitting difference of 3.6 eV. These values are indicative of fully oxidized MoO3. The spectrum exhibits a distinct doublet peak shape in the white line, confirming the presence of octahedrally coordinated Mo(VI) centers without significant reduction.
Reasoning source: Section 3.1 Catalyst Pretreatments and Characterization
Scoring Rubric (total: 100 pts)
| Q | Type | Max | Question | Reference Answer | Scoring Criteria |
|---|---|---|---|---|---|
| q1 | identification | 100 | Based on the O2 pretreatment conditions, what is the expected dominant phase and oxidation state of the sample, and what specific XANES parameters (edge position and splitting energy) confirm this state? | Based on the O2 pretreatment and re-oxidation conditions, the expected dominant phase is fully oxidized MoO3 (fraction 1.0) with an oxidation state of Mo(VI). Because the sample is exposed to a strongly oxidative O2 environment, any previously reduced molybdenum is fully re-oxidized to its highest oxidation state, resulting in octahedrally coordinated Mo(VI) centers without significant reduction. This fully oxidized state is confirmed by specific XANES parameters, namely a high Mo L3-edge position of 2525.6 eV and a d-orbital splitting difference of 3.6 eV. These spectral features arise from the transition of 2p3/2 core electrons to empty 4d orbitals, which exhibit a distinct white line doublet peak shape due to crystal field splitting into eg and t2g states in the fully oxidized MoO3 lattice. | Full credit for identifying MoO3 / Mo(VI) and citing the edge position of 2525.6 eV and a splitting energy of 3.6 eV. |
Review
#687
MoO3
Mo L3-edge
▶
LLM Prompt
Sample Information
Material: MoO3
Sample-Specific Conditions
- Pretreatment gas: He
- MoO3 sample heated in inert He flow
Measurement
We plan to measure the Mo L3-edge XANES spectrum of this sample.
Questions
Based on all the information above:
1. Based on the pretreatment conditions (heating in inert He flow at 450 °C), what is the expected dominant oxidation state of the MoOx sample, and what physical reasoning explains this state?
2. Describe the expected spectral shape of the Mo L3-edge white line for this sample and explain the electronic transitions responsible for this shape.
Ground Truth
Material: MoO3
Measurement: Mo L3-edge in-situ fluorescence mode at SSRL beamline 4-3
Fit method: Not applicable (edge position and splitting energy analysis used instead of LCF)
Phase fractions:
| Phase | Fraction |
|---|---|
| MoOx (~Mo5+) | 1.0 |
Fit basis (paper's reference spectra):
- MoO3 standard
- MoO2 standard
Source evidence: Table 1, Figure 1, Section 3.1
Key reasoning: Heating in He at 450 °C causes a downward shift in the Mo L3 edge position by 1.4 eV and a decrease in the d-orbital splitting energy by 0.2 eV compared to the fully oxidized sample. Comparing this edge shift to MoO3 and MoO2 standards indicates a slight reduction to an intermediate oxidation state around Mo(V).
Reasoning source: Section 3.1 Catalyst Pretreatments and Characterization, page 8
Scoring Rubric (total: 100 pts)
| Q | Type | Max | Question | Reference Answer | Scoring Criteria |
|---|---|---|---|---|---|
| q1 | prediction | 46 | Based on the pretreatment conditions (heating in inert He flow at 450 °C), what is the expected dominant oxidation state of the MoOx sample, and what physical reasoning explains this state? | The expected dominant oxidation state of the MoOx sample is an intermediate state of approximately Mo(V), which accounts for a fraction of 1.0 of the sample. This specific state arises because heating the initial MoO3 material in an inert He flow at 450 °C induces a slight reduction of the fully oxidized Mo(VI) species. The physical evidence for this mechanism is a downward shift in the Mo L3 edge position by 1.4 eV and a 0.2 eV decrease in the d-orbital splitting energy compared to the fully oxidized sample. Comparing these shifts to MoO3 and MoO2 standards confirms that the inert thermal pretreatment partially reduces the sample to Mo(V) rather than a highly reduced Mo(IV) state. | 15 points for identifying an intermediate oxidation state around Mo(V) or slightly reduced MoOx. 15 points for reasoning that inert treatment at high temperatures causes partial reduction (oxygen vacancy formation) as evidenced by shifts in the edge position. |
| q2 | spectral | 54 | Describe the expected spectral shape of the Mo L3-edge white line for this sample and explain the electronic transitions responsible for this shape. | The Mo L3-edge white line for this sample is expected to exhibit a doublet peak shape with an edge position at 2524.2 eV. This doublet shape is driven by the crystal field splitting of the vacant 4d orbitals into eg and t2g states, resulting in a splitting energy of 3.4 eV. These specific spectral features arise because heating the MoO3 sample in an inert He flow at 450 °C causes a slight reduction to an intermediate ~Mo(V) oxidation state. As a result of this condition-induced reduction, the edge position shifts downward by 1.4 eV and the splitting energy is reduced by 0.2 eV compared to fully oxidized MoO3, distinguishing it from both Mo(VI) and Mo(IV) states. | 15 points for mentioning the doublet peak shape in the white line. 20 points for attributing it to the transition of 2p3/2 core electrons to empty 4d orbitals that are split into eg and t2g states by the crystal field. |
Review
#688
MoO3
Mo L3-edge
▶
LLM Prompt
Sample Information
Material: MoO3
Sample-Specific Conditions
- Pretreatment gas: H2
- MoO3 sample reduced in H2 flow
Measurement
We plan to measure the Mo L3-edge XANES spectrum of this sample.
Questions
Based on all the information above:
1. Based on the pretreatment conditions (high temperature H2 flow), what is the expected oxidation state of the resulting molybdenum oxide phase?
2. Describe the expected Mo L3-edge XANES spectral features for this sample, including the edge position and the shape of the white line.
Ground Truth
Material: MoO3
Measurement: Mo L3-edge XANES in fluorescence mode at SSRL beamline 4-3
Fit method: Peak position and splitting energy analysis
Phase fractions:
| Phase | Fraction |
|---|---|
| MoOx (~Mo4+ or lower) | 1.0 |
Fit basis (paper's reference spectra):
- MoO3 standard
- MoO2 standard
Source evidence: Table 1, Figure 1, Section 3.1
Key reasoning: High temperature H2 treatment shifts the Mo L3 edge position down by 2.5 eV compared to fully oxidized MoO3 (from 2525.6 eV to 2523.1 eV). Comparing this to a shift of approximately 2.2 eV between MoO3 and MoO2 standards indicates the sample is highly reduced to a Mo(IV) or lower state. The d-orbital splitting energy also decreases to 3.2 eV, which correlates with the reduction in oxidation state.
Reasoning source: Section 3.1 Catalyst Pretreatments and Characterization
Scoring Rubric (total: 100 pts)
| Q | Type | Max | Question | Reference Answer | Scoring Criteria |
|---|---|---|---|---|---|
| q1 | prediction | 43 | Based on the pretreatment conditions (high temperature H2 flow), what is the expected oxidation state of the resulting molybdenum oxide phase? | The expected oxidation state of the resulting molybdenum oxide phase is ~Mo(IV) or lower, forming a highly reduced MoOx compound. This occurs because the high-temperature H2 flow acts as a strong reducing agent on the initial MoO3 material. The reduction mechanism is evidenced by the Mo L3-edge position shifting down by 2.5 eV (from 2525.6 eV to 2523.1 eV) compared to fully oxidized MoO3. Since the shift between MoO3 and MoO2 standards is approximately 2.2 eV, the observed 2.5 eV shift confirms the sample is highly reduced to a Mo(IV) or lower state, which is further supported by a decrease in the d-orbital splitting energy to 3.2 eV. | Full credit for predicting a highly reduced state, specifically Mo(IV) or lower (e.g., MoO2-like). |
| q2 | spectral | 57 | Describe the expected Mo L3-edge XANES spectral features for this sample, including the edge position and the shape of the white line. | The expected Mo L3-edge XANES spectrum will feature an edge position shifted downward to 2523.1 eV and a white line exhibiting a doublet peak shape. These spectral features arise because the high-temperature H2 flow reduces the initial MoO3 sample to a highly reduced MoOx phase (~Mo(IV) or lower). The downward edge shift of 2.5 eV (from 2525.6 eV in fully oxidized MoO3) directly reflects this lower oxidation state. Furthermore, the doublet shape of the white line is caused by the crystal field splitting of the vacant 4d orbitals into eg and t2g states, with the H2 reduction causing the d-orbital splitting energy to decrease to 3.2 eV compared to 3.6 eV in fully oxidized MoO3. | Full credit for stating an edge position around 2523.1 eV (or shifted down by ~2.5 eV from MoO3) and mentioning the doublet peak shape in the white line due to crystal field splitting (with a splitting energy of ~3.2 eV). |
Review
Nickel Speciation and Methane Dry Reforming Performance of Ni/Ce x Zr 1– x O 2 Prepared by Different Synthesis Methods
BNL-NSLS-II-8-ID
Catalyst
Yimeng Lyu et al.
DOI: 10.1021/acscatal.0c02426
10 scenarios
▶
#689
Ni/Ce0.83Zr0.17O2
Ni K
▶
LLM Prompt
Sample Information
Material: Ni/Ce0.83Zr0.17O2
Support: Ce0.83Zr0.17O2
Sample-Specific Conditions
- Synthesis method: DI
- 2 wt% Ni on Ce0.83Zr0.17O2 prepared by dry impregnation
Measurement
We plan to measure the Ni K XANES spectrum of this sample.
Questions
Based on all the information above:
1. What candidate reference spectra are needed to model the Ni speciation in this unreduced sample using linear combination fitting?
2. Estimate the phase fractions of the different Ni species in this unreduced catalyst.
Ground Truth
Material: 2 wt% Ni/Ce0.83Zr0.17O2 prepared by dry impregnation (2DI)
Measurement: Ni K-edge XANES, ex-situ, fluorescence mode, 8-ID beamline at Brookhaven National Lab
Fit method: Linear combination fitting (LCF)
Phase fractions: (±10%)
| Phase | Fraction |
|---|---|
| NiO | 0.529 |
| 1st shell NiO | 0.471 |
| Ni3+ | 0.0 |
Fit basis (paper's reference spectra):
- NiO
- NiO 1st shell (simulated spectrum for small clusters)
- NiLaO3 (Ni3+ reference)
Source evidence: Table 2 and Section 3.1.4
Key reasoning: In the unreduced 2DI sample prepared by dry impregnation, Ni is entirely in the 2+ oxidation state. The speciation is split between bulk NiO and '1st shell NiO', which represents very small, under-coordinated NiO clusters on the catalyst surface. The surface deposition method (DI) does not incorporate Ni into the ceria-zirconia lattice, hence the absence of Ni3+ species that are typically formed in bulk synthesis methods. Compared to strong electrostatic adsorption (SEA), DI provides slightly weaker metal-support interactions, leading to a slightly higher fraction of bulk NiO and less 1st shell NiO.
Reasoning source: Section 3.1.4 and Section 4.1
Scoring Rubric (total: 100 pts)
| Q | Type | Max | Question | Reference Answer | Scoring Criteria |
|---|---|---|---|---|---|
| q1 | identification | 33 | What candidate reference spectra are needed to model the Ni speciation in this unreduced sample using linear combination fitting? | To model the Ni speciation in this unreduced sample using linear combination fitting, the required candidate reference spectra are bulk NiO, a simulated "1st shell NiO" spectrum representing small clusters, and NiLaO3 as a Ni3+ reference. These specific phases are chosen because the sample is prepared via dry impregnation (DI), a surface deposition method that leaves Ni entirely in the 2+ oxidation state. Because DI does not incorporate Ni into the ceria-zirconia lattice, Ni3+ species (which typically form in bulk synthesis) are absent, which the NiLaO3 reference helps confirm. Instead, the DI method results in surface speciation split between bulk NiO and very small, under-coordinated NiO clusters represented by the 1st shell NiO spectrum. | Full points for identifying bulk NiO, a reference for highly dispersed/small cluster NiO (like 1st shell NiO), and a reference to check for higher oxidation states like Ni3+ (e.g., NiLaO3). |
| q2 | quantification | 67 | Estimate the phase fractions of the different Ni species in this unreduced catalyst. | The estimated phase fractions for this unreduced catalyst are 52.9% bulk NiO, 47.1% 1st shell NiO, and 0.0% Ni3+, with an uncertainty of 10%. These specific values result directly from the dry impregnation (DI) synthesis method used to deposit 2 wt% Ni onto the Ce0.83Zr0.17O2 support. Because DI is a surface deposition technique rather than a bulk synthesis method, Ni is not incorporated into the support lattice, resulting in a complete absence of Ni3+. Furthermore, the DI method provides slightly weaker metal-support interactions compared to techniques like strong electrostatic adsorption. This weaker interaction drives the speciation toward a slightly higher fraction of bulk NiO and a lower fraction of the small, under-coordinated surface clusters represented by the 1st shell NiO. | Full points for estimating ~53% bulk NiO and ~47% highly dispersed/1st shell NiO, with 0% Ni3+. Deduct points for significant deviations (>15%) or for predicting the presence of Ni3+ or metallic Ni. |
Review
#690
Ni/Ce0.83Zr0.17O2
Ni K
▶
LLM Prompt
Sample Information
Material: Ni/Ce0.83Zr0.17O2
Support: Ce0.83Zr0.17O2
Sample-Specific Conditions
- Synthesis method: SEA
- 2 wt% Ni on Ce0.83Zr0.17O2 prepared by strong electrostatic adsorption
Measurement
We plan to measure the Ni K XANES spectrum of this sample.
Questions
Based on all the information above:
1. What reference spectra or basis functions are necessary to accurately model the Ni K-edge XANES spectrum of the unreduced 2 wt% Ni/Ce0.83Zr0.17O2 catalyst prepared by strong electrostatic adsorption (SEA) using linear combination fitting?
2. Estimate the relative phase fractions of the Ni species present in this unreduced SEA-prepared catalyst.
3. Explain the physical reasoning for the observed distribution of Ni species in this sample. Why does the strong electrostatic adsorption (SEA) method produce this specific speciation compared to bulk synthesis methods?
Ground Truth
Material: Ni/Ce0.83Zr0.17O2
Measurement: Ni K-edge, ex-situ, fluorescence mode, 8-ID beamline at Brookhaven National Lab
Fit method: Linear combination fitting (LCF)
Phase fractions: (±10%)
| Phase | Fraction |
|---|---|
| NiO | 0.46 |
| 1st shell NiO | 0.54 |
| Ni3+ (NiLaO3) | 0.0 |
Fit basis (paper's reference spectra):
- NiO
- NiO 1st shell (simulated)
- NiLaO3 (for Ni3+)
Source evidence: Table 2 and Section 3.1.4
Key reasoning: The strong electrostatic adsorption (SEA) method utilizes Coulomb forces to deposit dissolved charged precursor metal complexes onto the support, which results in a better dispersion of the metal and stronger metal-support interactions. As a surface deposition technique, it produces small, well-dispersed NiO clusters (represented by the 1st shell NiO standard) and some bulk NiO. Because the Ni is deposited on the surface rather than incorporated into the support lattice (as occurs in bulk synthesis methods like co-precipitation), no Ni3+ species are formed.
Reasoning source: Section 3.1.4 and Section 4.1
Scoring Rubric (total: 100 pts)
| Q | Type | Max | Question | Reference Answer | Scoring Criteria |
|---|---|---|---|---|---|
| q1 | identification | 30 | What reference spectra or basis functions are necessary to accurately model the Ni K-edge XANES spectrum of the unreduced 2 wt% Ni/Ce0.83Zr0.17O2 catalyst prepared by strong electrostatic adsorption (SEA) using linear combination fitting? | To accurately model the Ni K-edge XANES spectrum of this sample using linear combination fitting, the necessary basis functions are bulk NiO, a simulated 1st shell NiO standard, and NiLaO3 (to account for potential Ni3+). These specific references are required because the strong electrostatic adsorption (SEA) synthesis method deposits charged precursor complexes onto the support surface via Coulomb forces. This surface deposition technique leads to a mixture of small, well-dispersed NiO clusters (captured by the 1st shell NiO standard) and some bulk NiO. Furthermore, the NiLaO3 reference is included to confirm the absence of Ni3+, which does not form because the SEA method deposits Ni on the surface rather than incorporating it into the support lattice. | Award full points for identifying bulk NiO and a highly dispersed or under-coordinated NiO phase (such as a simulated 1st shell NiO). Mentioning that a Ni3+ reference (like NiLaO3) could be included but would yield a zero fraction is also acceptable. |
| q2 | quantification | 30 | Estimate the relative phase fractions of the Ni species present in this unreduced SEA-prepared catalyst. | The relative phase fractions for the 2 wt% Ni/Ce0.83Zr0.17O2 catalyst prepared by SEA are 0.54 (54%) for 1st shell NiO, 0.46 (46%) for bulk NiO, and 0.0 (0%) for Ni3+ (NiLaO3), with an uncertainty of 10%. These specific values result from the strong electrostatic adsorption synthesis method, which utilizes Coulomb forces to deposit metal complexes onto the support surface. This mechanism promotes high metal dispersion and strong metal-support interactions, yielding a majority fraction of small, well-dispersed NiO clusters (54%) alongside a significant portion of bulk NiO (46%). The 0% fraction of Ni3+ occurs because SEA is strictly a surface deposition technique, preventing the Ni atoms from incorporating into the Ce0.83Zr0.17O2 support lattice. | Award full points for estimating approximately 45-50% bulk NiO and 50-55% highly dispersed/1st shell NiO, and explicitly stating that Ni3+ species are absent (0%). |
| q3 | reasoning | 40 | Explain the physical reasoning for the observed distribution of Ni species in this sample. Why does the strong electrostatic adsorption (SEA) method produce this specific speciation compared to bulk synthesis methods? | The observed distribution of 54% 1st shell NiO, 46% bulk NiO, and 0% Ni3+ is directly driven by the strong electrostatic adsorption (SEA) synthesis method. SEA utilizes Coulomb forces to deposit dissolved charged precursor metal complexes onto the Ce0.83Zr0.17O2 support surface. This surface-specific deposition results in better metal dispersion and stronger metal-support interactions, producing a large fraction of small, well-dispersed NiO clusters alongside some bulk NiO. Compared to bulk synthesis methods like co-precipitation, SEA does not incorporate Ni into the support lattice. Consequently, no Ni3+ species are formed, restricting the speciation entirely to surface-bound Ni2+ oxide species. | Award full points for explaining that SEA is a surface deposition technique that uses Coulomb forces to achieve high dispersion and strong metal-support interactions, resulting in a large fraction of small, well-dispersed NiO clusters (1st shell NiO). Crucially, the answer must note that because it is a surface method, Ni is not incorporated into the support lattice, which prevents the formation of Ni3+ species that are typically seen in bulk synthesis methods. |
Review
#691
Ni/Ce0.83Zr0.17O2
Ni K
▶
LLM Prompt
Sample Information
Material: Ni/Ce0.83Zr0.17O2
Support: Ce0.83Zr0.17O2
Sample-Specific Conditions
- Synthesis method: CP
- 2 wt% Ni on Ce0.83Zr0.17O2 prepared by co-precipitation
Measurement
We plan to measure the Ni K XANES spectrum of this sample.
Questions
Based on all the information above:
1. What reference spectra or basis functions are appropriate for linear combination fitting of the unreduced 2 wt% Ni/Ce0.83Zr0.17O2 catalyst prepared by co-precipitation to capture the different Ni species present?
Ground Truth
Material: Ni/Ce0.83Zr0.17O2
Measurement: Ni K-edge, ex-situ fluorescence mode, 8-ID beamline at Brookhaven National Lab
Fit method: Linear combination fitting (LCF)
Phase fractions: (±15%)
| Phase | Fraction |
|---|---|
| NiO | 0.308 |
| Ni3+ (NiLaO3) | 0.354 |
| 1st shell NiO | 0.338 |
Fit basis (paper's reference spectra):
- NiO
- NiO 1st shell
- NiLaO3
Source evidence: Table 2, Page 12; Section 3.1.4, Page 10-11
Key reasoning: The bulk synthesis method (co-precipitation) incorporates Ni atoms into the CZ lattice to form a mixed metal oxide and induces stronger metal-support interactions. This incorporation alters the local electronic structure of the Ni species, forming Ni3+ species and almost atomically dispersed NiO clusters (represented by 1st shell NiO). Consequently, only a minor fraction (~30%) of the nickel remains as bulk NiO.
Reasoning source: Section 3.1.4, Page 11; Section 4.1, Page 20
Scoring Rubric (total: 100 pts)
| Q | Type | Max | Question | Reference Answer | Scoring Criteria |
|---|---|---|---|---|---|
| q1 | identification | 100 | What reference spectra or basis functions are appropriate for linear combination fitting of the unreduced 2 wt% Ni/Ce0.83Zr0.17O2 catalyst prepared by co-precipitation to capture the different Ni species present? | The appropriate reference spectra for linear combination fitting of this sample are bulk NiO, NiO 1st shell, and NiLaO3 (which represents Ni3+ species). These specific basis functions are required because the co-precipitation synthesis method incorporates the 2 wt% Ni atoms directly into the Ce0.83Zr0.17O2 lattice, forming a mixed metal oxide with strong metal-support interactions. This bulk synthesis approach alters the local electronic structure of the nickel, leading to the formation of Ni3+ species and almost atomically dispersed NiO clusters that are best captured by the NiO 1st shell reference. Consequently, only a minor fraction of the nickel remains as bulk NiO, necessitating this specific three-component fit to accurately describe the diverse Ni species generated by the synthesis conditions. | Full points for identifying bulk NiO, a reference for highly dispersed/under-coordinated NiO (e.g., NiO 1st shell), and a reference for Ni3+ (e.g., NiLaO3). |
Review
#692
Ni/Ce0.83Zr0.17O2
Ni K
▶
LLM Prompt
Sample Information
Material: Ni/Ce0.83Zr0.17O2
Support: Ce0.83Zr0.17O2
Sample-Specific Conditions
- Ni loading: 4 wt%
- 4 wt% Ni on Ce0.83Zr0.17O2 prepared by co-precipitation
Measurement
We plan to measure the Ni K XANES spectrum of this sample.
Questions
Based on all the information above:
1. Based on the sample conditions (4 wt% Ni on Ce0.83Zr0.17O2 prepared by co-precipitation, unreduced), what reference spectra or basis functions are necessary to accurately model the Ni K-edge XANES spectrum using linear combination fitting?
2. Estimate the phase fractions of the different Ni species in this unreduced 4 wt% Ni co-precipitated catalyst.
Ground Truth
Material: Ni/Ce0.83Zr0.17O2
Measurement: Ni K-edge, ex-situ, fluorescence mode, 8-ID beamline at Brookhaven National Lab
Fit method: Linear combination fitting (LCF)
Phase fractions: (±10%)
| Phase | Fraction |
|---|---|
| NiO | 0.464 |
| Ni3+ (NiLaO3) | 0.163 |
| 1st shell NiO | 0.373 |
Fit basis (paper's reference spectra):
- NiO
- Ni foil
- NiLaO3
- 1st shell NiO (simulated)
Source evidence: Table 2 and Figure 2
Key reasoning: Bulk synthesis methods like co-precipitation incorporate Ni atoms into the ceria-zirconia (CZ) lattice to form a mixed metal oxide and induce strong metal-support interactions. This results in a significant fraction of Ni existing as almost atomically dispersed NiO clusters (1st shell NiO) or incorporated Ni3+ species. As the Ni loading increases to 4 wt%, the solubility limit of Ni in the CZ lattice is approached, leading to an increase in the fraction of segregated bulk NiO and a decrease in the relative abundance of Ni3+ compared to lower loadings.
Reasoning source: Section 3.1.4 (X-ray Adsorption Spectroscopy) and Section 4.2 (The effect of the Ni content of CP and CS catalysts on Ni speciation and redox properties)
Scoring Rubric (total: 100 pts)
| Q | Type | Max | Question | Reference Answer | Scoring Criteria |
|---|---|---|---|---|---|
| q1 | identification | 46 | Based on the sample conditions (4 wt% Ni on Ce0.83Zr0.17O2 prepared by co-precipitation, unreduced), what reference spectra or basis functions are necessary to accurately model the Ni K-edge XANES spectrum using linear combination fitting? | To accurately model the Ni K-edge XANES spectrum using linear combination fitting, the necessary reference spectra are bulk NiO, Ni foil, NiLaO3 (representing Ni3+), and a simulated 1st shell NiO spectrum. These specific phases are expected because the co-precipitation synthesis method incorporates Ni atoms into the ceria-zirconia (CZ) lattice, inducing strong metal-support interactions that form atomically dispersed NiO clusters (1st shell NiO) and incorporated Ni3+ species. Additionally, at a loading of 4 wt% Ni, the solubility limit of Ni in the CZ lattice is approached. This causes the formation of segregated bulk NiO alongside the highly dispersed and incorporated species, necessitating this exact set of basis functions to capture all structural states. | Full points for identifying bulk NiO, a Ni3+ reference (such as NiLaO3), and a reference for highly dispersed/under-coordinated NiO (such as 1st shell NiO). Deduct points for missing the dispersed NiO or Ni3+ components. |
| q2 | quantification | 54 | Estimate the phase fractions of the different Ni species in this unreduced 4 wt% Ni co-precipitated catalyst. | The estimated phase fractions for this catalyst are 46.4% bulk NiO, 37.3% 1st shell NiO, and 16.3% Ni3+ (represented by NiLaO3), with an uncertainty of 10%. These specific values arise because the bulk co-precipitation synthesis incorporates Ni into the ceria-zirconia lattice, forming a mixed metal oxide with a large portion of atomically dispersed NiO clusters and Ni3+ species due to strong metal-support interactions. However, because the sample contains 4 wt% Ni, it approaches the solubility limit of Ni within the support lattice. This relatively high loading leads to the dominant fraction of segregated bulk NiO (46.4%) and a decreased relative abundance of incorporated Ni3+ compared to samples with lower Ni loadings. | Full points if the estimated fractions are within ±10-15% of the ground truth: ~46% bulk NiO, ~37% 1st shell (dispersed) NiO, and ~16% Ni3+. Partial credit for correctly identifying that bulk NiO is the largest component, followed by dispersed NiO, with a smaller but non-zero amount of Ni3+. |
Review
#693
Ni/Ce0.83Zr0.17O2
Ni K
▶
LLM Prompt
Sample Information
Material: Ni/Ce0.83Zr0.17O2
Support: Ce0.83Zr0.17O2
Sample-Specific Conditions
- Ni loading: 6 wt%
- 6 wt% Ni on Ce0.83Zr0.17O2 prepared by co-precipitation
Measurement
We plan to measure the Ni K XANES spectrum of this sample.
Questions
Based on all the information above:
1. What reference spectra or basis functions are appropriate for modeling the Ni K-edge XANES spectrum of this unreduced catalyst via linear combination fitting?
2. Based on the Ni loading (6 wt%) and the co-precipitation synthesis method, estimate the phase fractions of the different Ni species present in the unreduced sample.
Ground Truth
Material: Ni/Ce0.83Zr0.17O2
Measurement: Ni K-edge, ex-situ fluorescence mode, 8-ID beamline at Brookhaven National Lab
Fit method: Linear combination fitting (LCF)
Phase fractions: (±10%)
| Phase | Fraction |
|---|---|
| NiO | 0.672 |
| 1st shell NiO | 0.328 |
| Ni3+ (NiLaO3) | 0.0 |
Fit basis (paper's reference spectra):
- NiO
- NiO 1st shell (simulated XANES spectrum for isolated NiO clusters)
- NiLaO3 (Ni3+ reference)
Source evidence: Table 2 (page 12) and Section 3.1.4 (page 11)
Key reasoning: In co-precipitated (CP) catalysts, increasing the Ni loading increases the fraction of bulk NiO and decreases the relative abundance of Ni3+ species. At 6 wt% Ni (6CP), the solubility limit of Ni in the Ce0.83Zr0.17O2 (CZ) lattice is exceeded, leading to the complete disappearance of Ni3+ species. Consequently, the sample is dominated by a separate bulk NiO phase (~67%), with the remaining ~33% existing as very small, under-coordinated interfacial NiO clusters (represented by the 1st shell NiO standard).
Reasoning source: Section 3.1.4 (Page 11) and Section 4.2 (Page 22)
Scoring Rubric (total: 100 pts)
| Q | Type | Max | Question | Reference Answer | Scoring Criteria |
|---|---|---|---|---|---|
| q1 | identification | 33 | What reference spectra or basis functions are appropriate for modeling the Ni K-edge XANES spectrum of this unreduced catalyst via linear combination fitting? | The appropriate reference spectra for linear combination fitting are bulk NiO, a simulated 'NiO 1st shell' spectrum representing isolated NiO clusters, and NiLaO3 as a Ni3+ reference. These specific references are required because the sample is a co-precipitated Ni/Ce0.83Zr0.17O2 catalyst with a 6 wt% Ni loading. At this loading, the solubility limit of Ni in the support lattice is exceeded, meaning no Ni3+ species are expected to form. Instead, the Ni segregates into a dominant bulk NiO phase alongside very small, under-coordinated interfacial NiO clusters, necessitating both bulk and 1st-shell NiO standards to accurately model the spectrum. | Full credit for identifying bulk NiO, a reference for highly dispersed/isolated NiO clusters (e.g., 1st shell NiO), and a Ni3+ reference (e.g., NiLaO3) to account for potential lattice incorporation. |
| q2 | quantification | 67 | Based on the Ni loading (6 wt%) and the co-precipitation synthesis method, estimate the phase fractions of the different Ni species present in the unreduced sample. | The estimated phase fractions for this sample are 67.2% bulk NiO, 32.8% isolated NiO clusters (1st shell NiO), and 0.0% Ni3+ (NiLaO3), with an uncertainty of 10%. These specific values result from the 6 wt% Ni loading prepared via co-precipitation, which exceeds the solubility limit of Ni within the Ce0.83Zr0.17O2 lattice. Because the solubility limit is surpassed, Ni3+ species completely disappear, resulting in a 0% fraction. Consequently, the excess nickel forms a separate, dominant bulk NiO phase (~67%), while the remaining fraction (~33%) exists as very small, under-coordinated interfacial NiO clusters. | Full credit for estimating ~67% bulk NiO, ~33% highly dispersed/1st shell NiO, and 0% Ni3+. Deduct points proportionally if estimates deviate by more than the 10% uncertainty margin. |
Review
#694
Ni/Ce0.83Zr0.17O2
Ni K
▶
LLM Prompt
Sample Information
Material: Ni/Ce0.83Zr0.17O2
Support: Ce0.83Zr0.17O2
Sample-Specific Conditions
- Ni loading: 10 wt%
- 10 wt% Ni on Ce0.83Zr0.17O2 prepared by co-precipitation
Measurement
We plan to measure the Ni K XANES spectrum of this sample.
Questions
Based on all the information above:
1. Based on the sample conditions (10 wt% Ni on Ce0.83Zr0.17O2 prepared by co-precipitation, unreduced), what reference spectra should be considered for a linear combination fitting (LCF) analysis of its Ni K-edge XANES spectrum?
2. Estimate the phase fractions of the different Ni species in this unreduced 10 wt% Ni co-precipitated catalyst.
Ground Truth
Material: Ni/Ce0.83Zr0.17O2
Measurement: Ni K-edge, ex-situ, fluorescence mode, 8-ID beamline at Brookhaven National Lab
Fit method: Linear combination fitting (LCF)
Phase fractions: (±10%)
| Phase | Fraction |
|---|---|
| NiO | 0.677 |
| 1st shell NiO | 0.323 |
| Ni3+ (NiLaO3) | 0.0 |
Fit basis (paper's reference spectra):
- NiO
- NiO 1st shell (simulated spectrum for highly dispersed/interfacial Ni2+)
- NiLaO3 (Ni3+ reference)
Source evidence: Table 2 and Section 3.1.4
Key reasoning: In co-precipitated (CP) catalysts, the fraction of bulk NiO species increases with nickel loading, reaching ~67% for the 10 wt% Ni sample, indicating the formation of a separate NiO phase due to exceeding the solubility limit of Ni in the support. The relative abundance of Ni3+ species decreases with increasing Ni content, dropping to zero for the 10CP sample as less Ni is dissolved in the lattice. The fraction of 1st shell NiO species (representing very small NiO clusters or Ni2+ incorporated into the support) remains relatively constant at around 30%.
Reasoning source: Section 3.1.4 (Page 11) and Section 4.2 (Page 22)
Scoring Rubric (total: 100 pts)
| Q | Type | Max | Question | Reference Answer | Scoring Criteria |
|---|---|---|---|---|---|
| q1 | identification | 46 | Based on the sample conditions (10 wt% Ni on Ce0.83Zr0.17O2 prepared by co-precipitation, unreduced), what reference spectra should be considered for a linear combination fitting (LCF) analysis of its Ni K-edge XANES spectrum? | For the LCF analysis of the unreduced 10 wt% Ni/Ce0.83Zr0.17O2 co-precipitated catalyst, the reference spectra to consider are bulk NiO, a simulated 'NiO 1st shell' spectrum (representing highly dispersed/interfacial Ni2+), and NiLaO3 (as a Ni3+ reference). These specific phases are expected because the high 10 wt% Ni loading exceeds the solubility limit of Ni in the support, leading to the formation of a separate bulk NiO phase. Additionally, the co-precipitation method allows for some Ni2+ to remain incorporated into the support or form very small clusters, represented by the 1st shell NiO reference. Finally, while Ni3+ (NiLaO3) is considered in the basis set for these types of catalysts, its abundance drops to zero at this high loading because less Ni is dissolved into the support lattice. | Full credit for identifying bulk NiO, a reference for highly dispersed/interfacial Ni2+ (e.g., 1st shell NiO or atomically dispersed Ni), and potentially a Ni3+ reference (even if its final fitted fraction is zero). |
| q2 | quantification | 54 | Estimate the phase fractions of the different Ni species in this unreduced 10 wt% Ni co-precipitated catalyst. | The estimated phase fractions for this 10 wt% Ni co-precipitated catalyst are 67.7% bulk NiO, 32.3% 1st shell NiO, and 0.0% Ni3+ (with an uncertainty of 10%). These specific values result from the high 10 wt% nickel loading, which exceeds the solubility limit of Ni in the Ce0.83Zr0.17O2 support and forces the majority of the nickel (~67%) to precipitate as a separate bulk NiO phase. The fraction of 1st shell NiO remains at approximately 32% because a relatively constant amount of very small NiO clusters or support-incorporated Ni2+ forms during the co-precipitation process. Meanwhile, the Ni3+ fraction drops completely to zero because the high Ni content prevents further dissolution of Ni into the support lattice. | Full credit for estimating ~65-70% bulk NiO, ~30-35% highly dispersed/1st shell NiO, and 0% Ni3+. |
Review
#695
Ni/Ce0.83Zr0.17O2
Ni K
▶
LLM Prompt
Sample Information
Material: Ni/Ce0.83Zr0.17O2
Support: Ce0.83Zr0.17O2
Sample-Specific Conditions
- Synthesis method: CS
- 2 wt% Ni on Ce0.83Zr0.17O2 prepared by combustion synthesis
Measurement
We plan to measure the Ni K XANES spectrum of this sample.
Questions
Based on all the information above:
1. What reference spectra or basis functions are appropriate for modeling the Ni K-edge XANES spectrum of this unreduced combustion-synthesized catalyst via linear combination fitting?
Ground Truth
Material: Ni/Ce0.83Zr0.17O2
Measurement: Ni K-edge ex-situ XAS in fluorescence mode at beamline 8-ID (Brookhaven National Lab)
Fit method: Linear combination fitting (LCF)
Phase fractions: (±10%)
| Phase | Fraction |
|---|---|
| NiO | 0.351 |
| Ni3+ (NiLaO3) | 0.437 |
| 1st shell NiO | 0.212 |
Fit basis (paper's reference spectra):
- NiO
- NiLaO3 (representing Ni3+ species)
- NiO 1st shell (simulated spectrum representing very small NiO clusters or Ni2+ incorporated into the support)
Source evidence: Table 2 and Section 3.1.4 (X-ray Adsorption Spectroscopy), Pages 11-12
Key reasoning: Combustion synthesis (CS) is a bulk synthesis method that incorporates a large fraction of Ni into the ceria-zirconia (CZ) lattice, forming a mixed metal oxide. The fast combustion process inhibits annealing to a thermodynamically stable state, creating more defects and oxygen vacancies compared to other methods. This kinetically trapped structure favors the incorporation of Ni cations as Ni3+ and highly dispersed Ni2+ (represented by 1st shell NiO) rather than segregating into bulk NiO. Consequently, at a low loading of 2 wt%, the 2CS sample contains a high fraction of Ni3+ and 1st shell NiO, with only a minority of the nickel present as bulk NiO.
Reasoning source: Section 4.1 (The effect of synthesis methods on Ni speciation and redox properties), Page 21
Scoring Rubric (total: 100 pts)
| Q | Type | Max | Question | Reference Answer | Scoring Criteria |
|---|---|---|---|---|---|
| q1 | identification | 100 | What reference spectra or basis functions are appropriate for modeling the Ni K-edge XANES spectrum of this unreduced combustion-synthesized catalyst via linear combination fitting? | The appropriate basis functions for linear combination fitting of this sample are bulk NiO, NiLaO3 (representing Ni3+ species), and a simulated NiO 1st shell spectrum (representing very small NiO clusters or Ni2+ incorporated into the support). These specific references are necessary because the combustion synthesis (CS) method used to prepare the 2 wt% Ni/Ce0.83Zr0.17O2 catalyst is a fast process that inhibits annealing to a thermodynamically stable state. This rapid combustion creates a kinetically trapped structure with numerous defects and oxygen vacancies. As a result, rather than segregating entirely into bulk NiO, a large fraction of the nickel incorporates into the ceria-zirconia lattice as Ni3+ and highly dispersed Ni2+, requiring these specialized reference spectra to accurately capture the mixed metal oxide composition. | Full credit for identifying bulk NiO, a Ni3+ reference (such as NiLaO3), and a reference for highly dispersed/isolated Ni2+ (such as a simulated 1st shell NiO spectrum). |
Review
#696
Ni/Ce0.83Zr0.17O2
Ni K
▶
LLM Prompt
Sample Information
Material: Ni/Ce0.83Zr0.17O2
Support: Ce0.83Zr0.17O2
Sample-Specific Conditions
- Ni loading: 4 wt%
- 4 wt% Ni on Ce0.83Zr0.17O2 prepared by combustion synthesis
Measurement
We plan to measure the Ni K XANES spectrum of this sample.
Questions
Based on all the information above:
1. What reference spectra or basis functions are necessary to accurately model the Ni K-edge XANES spectrum of this unreduced 4 wt% Ni/Ce0.83Zr0.17O2 catalyst prepared by combustion synthesis using linear combination fitting?
Ground Truth
Material: Ni/Ce0.83Zr0.17O2
Measurement: Ni K-edge, fluorescence mode, 8-ID beamline at Brookhaven National Lab
Fit method: Linear combination fitting (LCF)
Phase fractions: (±10%)
| Phase | Fraction |
|---|---|
| NiO | 0.591 |
| Ni3+ (NiLaO3) | 0.254 |
| 1st shell NiO | 0.155 |
Fit basis (paper's reference spectra):
- NiO
- Ni foil
- NiLaO3
- NiO 1st shell
Source evidence: Table 2, Figure 2
Key reasoning: Combustion synthesis involves fast combustion that traps mixed metal oxides in kinetically-formed structures, favoring the incorporation of Ni cations into the ceria-zirconia lattice and forming Ni3+ species. However, as the Ni loading increases to 4 wt%, the solubility limit of Ni in the support is approached, leading to a decrease in the relative fraction of incorporated Ni3+ and an increase in the segregated bulk NiO phase compared to lower loading samples. The 1st shell NiO represents very small, under-coordinated NiO clusters or Ni2+ incorporated into the support.
Reasoning source: Section 4.1 and 4.2
Scoring Rubric (total: 100 pts)
| Q | Type | Max | Question | Reference Answer | Scoring Criteria |
|---|---|---|---|---|---|
| q1 | identification | 100 | What reference spectra or basis functions are necessary to accurately model the Ni K-edge XANES spectrum of this unreduced 4 wt% Ni/Ce0.83Zr0.17O2 catalyst prepared by combustion synthesis using linear combination fitting? | To accurately model the Ni K-edge XANES spectrum of this sample using linear combination fitting, the necessary reference spectra are NiO, Ni foil, NiLaO3, and NiO 1st shell. These specific phases are expected because the combustion synthesis preparation involves fast combustion that traps mixed metal oxides in kinetically-formed structures, favoring the incorporation of Ni cations into the ceria-zirconia lattice as Ni3+ species (represented by NiLaO3). However, because the sample has a relatively high Ni loading of 4 wt%, the solubility limit of Ni in the Ce0.83Zr0.17O2 support is approached, resulting in a significant segregated bulk NiO phase. Finally, the NiO 1st shell basis function is required to account for very small, under-coordinated NiO clusters or Ni2+ incorporated into the support. | Full points for identifying bulk NiO, a Ni3+ reference (like NiLaO3), and a highly dispersed or under-coordinated Ni2+ reference (like 1st shell NiO). Partial points for missing one. |
Review
#697
Ni/Ce0.83Zr0.17O2
Ni K
▶
LLM Prompt
Sample Information
Material: Ni/Ce0.83Zr0.17O2
Support: Ce0.83Zr0.17O2
Sample-Specific Conditions
- Ni loading: 6 wt%
- 6 wt% Ni on Ce0.83Zr0.17O2 prepared by combustion synthesis
Measurement
We plan to measure the Ni K XANES spectrum of this sample.
Questions
Based on all the information above:
1. What reference spectra should be included in the basis set for linear combination fitting of the unreduced 6 wt% Ni/Ce0.83Zr0.17O2 catalyst prepared by combustion synthesis?
Ground Truth
Material: Ni/Ce0.83Zr0.17O2
Measurement: Ni K-edge, ex-situ fluorescence mode, 8-ID beamline at Brookhaven National Lab
Fit method: Linear combination fitting (LCF)
Phase fractions: (±10%)
| Phase | Fraction |
|---|---|
| NiO | 0.65 |
| 1st shell NiO | 0.177 |
| Ni3+ (NiLaO3) | 0.173 |
Fit basis (paper's reference spectra):
- NiO
- NiO 1st shell (simulated/highly dispersed NiO)
- NiLaO3 (Ni3+ reference)
- Ni foil
Source evidence: Table 2, page 12
Key reasoning: Increasing the Ni content in combustion synthesis (CS) catalysts results in an increase in the fraction of Ni present as a separate bulk NiO phase and a decrease in the relative Ni3+ concentration. The fast combustion process inhibits annealing to a thermodynamically favored state, creating more defects and allowing more Ni cations to incorporate into the support compared to co-precipitation. At 6 wt% Ni, the CS sample still contains a substantial fraction of Ni3+ species (17.3%) and 1st shell NiO (17.7%), but the majority (65%) forms a separate NiO phase, indicating that possible saturation of incorporated Ni cations in the CZ lattice is reached around this loading.
Reasoning source: Section 4.1 and 4.2, pages 21-22
Scoring Rubric (total: 100 pts)
| Q | Type | Max | Question | Reference Answer | Scoring Criteria |
|---|---|---|---|---|---|
| q1 | identification | 100 | What reference spectra should be included in the basis set for linear combination fitting of the unreduced 6 wt% Ni/Ce0.83Zr0.17O2 catalyst prepared by combustion synthesis? | The basis set for linear combination fitting should include NiO, a simulated 1st shell NiO (representing highly dispersed NiO), NiLaO3 (as a Ni3+ reference), and Ni foil. These specific references are required due to the structural effects of the combustion synthesis preparation method at a 6 wt% Ni loading. The fast combustion process inhibits annealing to a thermodynamically favored state and creates defects, allowing a portion of the Ni to incorporate into the Ce0.83Zr0.17O2 support as Ni3+ species and highly dispersed 1st shell NiO. However, because the 6 wt% loading reaches the saturation point for Ni incorporation into the support lattice, the majority of the nickel is forced to segregate into a separate bulk NiO phase. | Full points for identifying bulk NiO, a highly dispersed/interfacial NiO (e.g., 1st shell NiO), and a Ni3+ reference (e.g., NiLaO3). |
Review
#698
Ni/Ce0.83Zr0.17O2
Ni K
▶
LLM Prompt
Sample Information
Material: Ni/Ce0.83Zr0.17O2
Support: Ce0.83Zr0.17O2
Sample-Specific Conditions
- Ni loading: 10 wt%
- 10 wt% Ni on Ce0.83Zr0.17O2 prepared by combustion synthesis
Measurement
We plan to measure the Ni K XANES spectrum of this sample.
Questions
Based on all the information above:
1. What reference spectra or basis functions should be included in a linear combination fitting (LCF) analysis of the unreduced 10 wt% Ni/Ce0.83Zr0.17O2 catalyst prepared by combustion synthesis to accurately capture the expected Ni species?
Ground Truth
Material: Ni/Ce0.83Zr0.17O2
Measurement: Ni K-edge XANES, ex-situ fluorescence mode, 8-ID beamline at Brookhaven National Lab
Fit method: Linear combination fitting (LCF)
Phase fractions: (±10%)
| Phase | Fraction |
|---|---|
| NiO | 0.731 |
| 1st shell NiO | 0.269 |
| Ni3+ | 0.0 |
Fit basis (paper's reference spectra):
- NiO
- NiO 1st shell (simulated spectrum for small clusters)
- NiLaO3 (Ni3+ reference)
Source evidence: Table 2, Page 12
Key reasoning: Increasing the Ni content to 10 wt% exceeds the limited solubility of Ni in the ceria-zirconia (CZ) support. As a result, Ni segregates from the CZ support to form a separate bulk NiO phase, which becomes the dominant species. Because a lower fraction of Ni is dissolved in the CZ lattice at this high loading, the fraction of incorporated Ni3+ species drops to zero. The remaining nickel exists as very small, under-coordinated NiO clusters (represented by the 1st shell NiO standard).
Reasoning source: Section 4.2, Page 22
Scoring Rubric (total: 100 pts)
| Q | Type | Max | Question | Reference Answer | Scoring Criteria |
|---|---|---|---|---|---|
| q1 | identification | 100 | What reference spectra or basis functions should be included in a linear combination fitting (LCF) analysis of the unreduced 10 wt% Ni/Ce0.83Zr0.17O2 catalyst prepared by combustion synthesis to accurately capture the expected Ni species? | For the linear combination fitting (LCF) analysis of the 10 wt% Ni/Ce0.83Zr0.17O2 catalyst, the basis functions should include bulk NiO, a simulated NiO 1st shell spectrum (representing small clusters), and NiLaO3 (as a Ni3+ reference). These specific references are required because the 10 wt% Ni loading exceeds the limited solubility of nickel in the ceria-zirconia support prepared by combustion synthesis. As a result, the nickel segregates from the support to form a dominant bulk NiO phase, while the remaining nickel forms very small, under-coordinated NiO clusters captured by the 1st shell standard. Additionally, because the high loading prevents further dissolution of Ni into the lattice, the fraction of incorporated Ni3+ species drops to zero, making the NiLaO3 reference necessary to confirm this structural evolution. | Full credit for identifying bulk NiO, a reference for highly dispersed/under-coordinated NiO (e.g., 1st shell NiO), and a Ni3+ reference (e.g., NiLaO3) to confirm its absence. |
Review
Condition-Dependent Pd Speciation and NO Adsorption in Pd/Zeolites
BNL-NSLS-II-8-ID
Catalyst
Keka Mandal et al.
DOI: 10.1021/acscatal.0c03585
1 scenario
▶
#699
Pd/SSZ-13
Pd K
▶
LLM Prompt
Sample Information
Material: Pd/SSZ-13
Support: SSZ-13 zeolite
Reaction Conditions: Ambient exposure at 298 K
Sample-Specific Conditions
- Hydration state: Ambient
- Pd exchanged SSZ-13 zeolite exposed to ambient conditions
Measurement
We plan to measure the Pd K XANES spectrum of this sample.
Questions
Based on all the information above:
1. Based on the ambient exposure conditions, what is the dominant Pd speciation (phase/motif) in the SSZ-13 zeolite, and what physical reasoning explains the formation of this state?
2. What key XAS spectral feature (or lack thereof) distinguishes this ambient-exposed Pd species from bulk PdO nanoparticles and dehydrated framework-bound Pd cations?
3. What is the expected oxidation state of Pd in this sample, and what reference standards should be used to confirm this via XANES edge energy comparison?
Ground Truth
Material: Pd/SSZ-13
Measurement: Pd K-edge (23450 eV) XAS in transmission mode at NSLS II beamline 8-ID
Fit method: Comparison of edge energy to standards
Phase fractions: (±10%)
| Phase | Fraction |
|---|---|
| Z2[PdII(H2O)4] (H2O-solvated PdII) | 1.0 |
Fit basis (paper's reference spectra):
- PdO
- Pd foil
Source evidence: Section 2.2, Page 5; Figure 3b (EXAFS); Figure S5 and S6 (XANES)
Key reasoning: Exposure to ambient conditions introduces water into the zeolite pores. The EXAFS spectrum shows a first shell Pd-O coordination number of ~4 and a bond distance of 2.01 Å, with a complete absence of second shell scattering. This indicates that the Pd cations do not form PdO nanoparticles and are detached from the zeolite framework, existing as fully hydrated, mobile Z2[PdII(H2O)4] complexes. The XANES edge energy matches the PdIIO standard, confirming the 2+ oxidation state.
Reasoning source: Section 2.2, Page 5
Scoring Rubric (total: 100 pts)
| Q | Type | Max | Question | Reference Answer | Scoring Criteria |
|---|---|---|---|---|---|
| q1 | reasoning | 41 | Based on the ambient exposure conditions, what is the dominant Pd speciation (phase/motif) in the SSZ-13 zeolite, and what physical reasoning explains the formation of this state? | The dominant Pd speciation in the SSZ-13 zeolite is a fully hydrated, mobile Z2[PdII(H2O)4] complex, which accounts for 100% of the Pd species. This specific state forms because exposure to ambient conditions at 298 K introduces water molecules into the zeolite pores. The water fully solvates the Pd cations, causing them to detach from the zeolite framework rather than aggregating into PdO nanoparticles. Consequently, the Pd exists entirely as isolated, mononuclear Pd(II) complexes coordinated by approximately four water molecules. | Full points if the answer identifies the fully hydrated/solvated PdII complex (Z2[PdII(H2O)4]) and explains that ambient moisture leads to water coordination, detaching the Pd from the zeolite framework without forming PdO nanoparticles. |
| q2 | spectral | 35 | What key XAS spectral feature (or lack thereof) distinguishes this ambient-exposed Pd species from bulk PdO nanoparticles and dehydrated framework-bound Pd cations? | The key distinguishing XAS feature for this ambient-exposed Pd species is the complete absence of second-shell scattering in the EXAFS region, accompanied by a strong white line in the XANES region typical of oxidized Pd. This lack of second-shell scattering occurs because ambient exposure introduces water into the zeolite pores, which fully solvates the Pd cations. Because the water solvates the cations, they detach from the zeolite framework and exist as isolated, mobile Z2[PdII(H2O)4] complexes rather than forming PdO nanoparticles or remaining bound to the framework. The structural property producing these features is a mononuclear complex with a first-shell Pd-O coordination number of ~4 at a bond distance of 2.01 Å, lacking any longer-range Pd-Pd or Pd-framework coordination. | Full points if the answer explicitly mentions the complete absence of second-shell scattering (no Pd-Pd or Pd-Si/Al scatter) in the EXAFS region, indicating a mononuclear, framework-detached complex. |
| q3 | identification | 24 | What is the expected oxidation state of Pd in this sample, and what reference standards should be used to confirm this via XANES edge energy comparison? | The expected oxidation state of Pd in this sample is 2+. To confirm this via XANES edge energy comparison, PdO (PdIIO) and Pd foil should be used as the reference standards. This 2+ oxidation state arises because the ambient exposure at 298 K introduces water into the zeolite pores, leading to the formation of fully hydrated, framework-detached Z2[PdII(H2O)4] complexes. The XANES edge energy of the sample matches the PdIIO standard, confirming that the solvated Pd cations maintain their oxidized 2+ state under these ambient conditions. | Full points if the answer identifies the 2+ oxidation state and lists PdO (and optionally Pd foil) as the appropriate reference standard(s) for edge energy comparison. |
Review
Metal–Support Interactions and C1 Chemistry: Transforming Pt-CeO 2 into a Highly Active and Stable Catalyst for the Conversion of Carbon Dioxide and Methane
APS
Catalyst
Feng Zhang et al.
DOI: 10.1021/acscatal.0c04694
2 scenarios
▶
#700
Pt
Pt L3
▶
LLM Prompt
Sample Information
Material: Pt
Sample-Specific Conditions
- reference: Pt foil
- Reference material
Measurement
We plan to measure the Pt L3 XANES spectrum of this sample.
Questions
Based on all the information above:
1. What phase dominates this sample and why?
2. What is the expected oxidation state of the platinum in this sample?
3. In a XANES analysis of a Pt catalyst, what role would the spectrum of this specific sample play?
Ground Truth
Material: Pt
Measurement: Pt L3 edge, ex-situ
Fit method: not reported
Phase fractions:
| Phase | Fraction |
|---|---|
| metallic_platinum | 1.0 |
Fit basis (paper's reference spectra):
- Pt foil
Source evidence: Figure 9
Key reasoning: The sample is a Pt foil measured ex-situ. It serves as a reference material, which by definition consists of 100% pure metallic platinum. It is used to provide a standard spectrum for the metallic Pt phase.
Reasoning source: Sample description
Scoring Rubric (total: 100 pts)
| Q | Type | Max | Question | Reference Answer | Scoring Criteria |
|---|---|---|---|---|---|
| q1 | reasoning | 40 | What phase dominates this sample and why? | The sample is dominated entirely by the metallic platinum phase, comprising a fraction of 1.0. This occurs because the sample is a Pt foil measured ex-situ specifically to serve as a reference material. By definition, this reference material consists of 100% pure metallic platinum. Consequently, it provides a standard spectrum for the metallic Pt phase without any other competing phases. | Award 20 points for identifying metallic platinum as the dominant phase (1.0 fraction). Award 20 points for explaining that it is a reference foil, which is inherently pure metallic Pt. |
| q2 | identification | 30 | What is the expected oxidation state of the platinum in this sample? | The expected oxidation state of the platinum in this sample is 0. This state is expected because the sample is a pure Pt foil measured ex-situ to serve as a reference material. By definition, this reference consists of 100% pure metallic platinum, which inherently possesses a 0 oxidation state. This ensures it provides a reliable standard spectrum for the metallic Pt phase. | Award 30 points for correctly identifying the oxidation state as 0. |
| q3 | reasoning | 30 | In a XANES analysis of a Pt catalyst, what role would the spectrum of this specific sample play? | In a XANES analysis, the spectrum of this specific sample would serve as the standard reference spectrum for the metallic Pt phase. This role is dictated by the sample conditions, as it is a pure Pt foil measured ex-situ. Because it consists of 100% pure metallic platinum with an oxidation state of 0, it acts as a fit basis component. This allows researchers to accurately identify and quantify the metallic platinum fraction in other experimental samples. | Award 30 points for stating it serves as a reference material or basis function representing the pure metallic Pt phase. |
Review
#701
PtO2
Pt L3
▶
LLM Prompt
Sample Information
Material: PtO2
Sample-Specific Conditions
- reference: PtO2 powder
- Reference material
Measurement
We plan to measure the Pt L3 XANES spectrum of this sample.
Questions
Based on all the information above:
1. Describe the expected spectral shape of the Pt L3-edge XANES for this PtO2 reference powder, specifically focusing on the white line intensity and edge position.
2. What is the formal oxidation state of Pt in this reference material, and what specific electronic transition is responsible for its prominent white line feature at the L3-edge?
3. How does the Pt L3-edge XANES spectrum of this PtO2 sample distinguish it from a metallic Pt reference?
Ground Truth
Material: PtO2
Measurement: Pt L3-edge, ex-situ
Fit method: Not applicable (reference material)
Phase fractions:
| Phase | Fraction |
|---|---|
| platinum_dioxide | 1.0 |
Fit basis (paper's reference spectra):
- Not applicable
Source evidence: Figure 9
Key reasoning: This sample is a pure PtO2 powder measured as a reference standard. It provides the characteristic spectral signature for fully oxidized Pt4+, which is used as a basis for linear combination fitting or qualitative comparison of oxidized catalyst samples.
Reasoning source: Reference materials discussion / Figure 9
Scoring Rubric (total: 100 pts)
| Q | Type | Max | Question | Reference Answer | Scoring Criteria |
|---|---|---|---|---|---|
| q1 | spectral | 30 | Describe the expected spectral shape of the Pt L3-edge XANES for this PtO2 reference powder, specifically focusing on the white line intensity and edge position. | The expected Pt L3-edge XANES spectrum for this sample exhibits a very intense white line peak immediately after the absorption edge, alongside an edge position shifted to higher energy relative to metallic Pt. Because this sample is a pure PtO2 powder measured as a reference standard, it consists entirely of fully oxidized Pt4+. This 4+ oxidation state results in a high density of unoccupied 5d states, which directly produces the characteristic high-intensity white line and positive edge shift. This distinct spectral shape provides the characteristic signature used as a basis for linear combination fitting or qualitative comparison of oxidized catalyst samples. | Award full points if the model correctly predicts a very intense white line and an edge position shifted to higher energy relative to metallic Pt. |
| q2 | reasoning | 35 | What is the formal oxidation state of Pt in this reference material, and what specific electronic transition is responsible for its prominent white line feature at the L3-edge? | The formal oxidation state of Pt in this reference material is 4+. The prominent white line feature at the L3-edge originates from 2p3/2 to 5d electronic transitions. Because the sample is a pure PtO2 powder reference standard, the platinum atoms are fully oxidized, creating a high density of unoccupied 5d states. This specific electronic configuration allows for strong transition probabilities from the 2p3/2 core level, resulting in the characteristic high-intensity white line used as a basis for comparing oxidized samples. | Award full points if the model identifies the oxidation state as 4+ and attributes the white line to 2p3/2 -> 5d electronic transitions. |
| q3 | identification | 35 | How does the Pt L3-edge XANES spectrum of this PtO2 sample distinguish it from a metallic Pt reference? | The Pt L3-edge XANES spectrum of this PtO2 sample is distinguished from a metallic Pt reference by a significantly higher white line intensity and a positive shift in the absorption edge energy. These distinguishing features arise because the sample is a pure PtO2 powder reference material containing fully oxidized Pt4+, unlike zero-valent metallic Pt. The fully oxidized state creates a high density of unoccupied 5d states, which drives the intense 2p3/2 to 5d electronic transitions. Consequently, this pure reference sample provides the characteristic spectral signature of Pt4+ needed to differentiate it from metallic Pt or lower oxidation states like PtO. | Award full points if the model notes the significantly higher white line intensity (due to more unoccupied 5d states) and the positive energy shift of the absorption edge compared to metallic Pt. |
Review
Conflicting Roles of Coordination Number on Catalytic Performance of Single-Atom Pt Catalysts
BNL-NSLS-II-8-ID
Catalyst
Dahong Huang et al.
DOI: 10.1021/acscatal.1c00627
4 scenarios
▶
#702
Pt1/SiC
Pt L3
▶
LLM Prompt
Sample Information
Material: Pt1/SiC
Support: SiC
Sample-Specific Conditions
- Thermal treatment temperature: 80 °C
- Single-atom Pt catalyst on SiC treated at 80 °C (EXAFS Pt-O CN=3.3)
Measurement
We plan to measure the Pt L3 XANES spectrum of this sample.
Questions
Based on all the information above:
1. What is the expected dominant structural motif for this sample, and what reference spectra would be appropriate to compare it against to determine its oxidation state?
2. Describe the expected Pt L3-edge XANES spectral shape, specifically the white line intensity and edge position, for this sample compared to metallic Pt and fully oxidized PtO2.
3. What distinguishes the XANES spectrum of this sample (treated at 80 °C) from similar single-atom Pt/SiC catalysts treated at higher temperatures (e.g., up to 160 °C), and what physical changes cause this difference?
Ground Truth
Material: Pt1/SiC
Measurement: Pt L3-edge XANES, ex-situ, ISS (8-ID) beamline at NSLS-II
Fit method: not reported (qualitative comparison of white line intensity and edge position)
Phase fractions:
| Phase | Fraction |
|---|---|
| Single-atom Pt-O | 1.0 |
Fit basis (paper's reference spectra):
- Pt foil
- PtO2
- cisplatin
Source evidence: Figure 2b,c,d, Table 1, page 5
Key reasoning: The sample consists of single-atom Pt coordinated to oxygen, with no Pt-Pt bonds observed in EXAFS. The 80 °C thermal treatment results in a relatively low Pt-O coordination number of 3.3. The white line intensity and edge position (11564.6 eV) are positioned between Pt2+ (cisplatin) and Pt4+ (PtO2), indicating an intermediate oxidation state, which is confirmed by XPS to be +2.28.
Reasoning source: RESULTS AND DISCUSSION, page 5
Scoring Rubric (total: 100 pts)
| Q | Type | Max | Question | Reference Answer | Scoring Criteria |
|---|---|---|---|---|---|
| q1 | identification | 30 | What is the expected dominant structural motif for this sample, and what reference spectra would be appropriate to compare it against to determine its oxidation state? | The expected dominant structural motif for this sample is single-atom Pt coordinated entirely to oxygen (fraction 1.0), with no Pt-Pt bonds present. To determine its oxidation state, appropriate reference spectra for comparison include Pt foil (Pt0), cisplatin (Pt2+), and PtO2 (Pt4+). This specific motif and the choice of references arise because the sample is a single-atom Pt catalyst supported on SiC treated at a mild 80 °C, which yields a relatively low Pt-O coordination number of 3.3. Comparing the sample against these references reveals an intermediate oxidation state (+2.28), as its spectral features fall directly between those of the Pt2+ and Pt4+ standards. | Full credit for identifying single-atom Pt coordinated to oxygen (Pt-O) and listing appropriate references like Pt foil (Pt0), cisplatin (Pt2+), and PtO2 (Pt4+). |
| q2 | spectral | 35 | Describe the expected Pt L3-edge XANES spectral shape, specifically the white line intensity and edge position, for this sample compared to metallic Pt and fully oxidized PtO2. | The Pt L3-edge XANES spectrum for this sample will exhibit a white line intensity at ~11566 eV that is higher than metallic Pt foil but lower than fully oxidized PtO2. Furthermore, the edge position (11564.6 eV) is shifted to a higher energy compared to Pt foil and cisplatin, but remains lower than that of PtO2. These intermediate spectral features occur because the 80 °C thermal treatment of the single-atom Pt/SiC catalyst results in a relatively low Pt-O coordination number of 3.3. This specific coordination environment leaves the Pt atoms in an intermediate oxidation state of +2.28, placing its electronic structure and resulting XANES features squarely between the metallic and fully oxidized references. | Full credit for stating the white line intensity is intermediate between Pt foil and PtO2, and the edge position (approx 11564.6 eV) is shifted to higher energy than Pt foil but lower than PtO2. |
| q3 | prediction | 35 | What distinguishes the XANES spectrum of this sample (treated at 80 °C) from similar single-atom Pt/SiC catalysts treated at higher temperatures (e.g., up to 160 °C), and what physical changes cause this difference? | The XANES spectrum of this sample treated at 80 °C is distinguished by having the lowest white line intensity and the lowest edge energy (11564.6 eV) among the entire series of Pt1/SiC samples. These distinct spectral characteristics arise directly from the mild 80 °C thermal treatment condition compared to higher temperatures. Specifically, this low-temperature treatment results in the lowest Pt-O coordination number (3.3) and the lowest corresponding oxidation state (+2.28) in the series. Samples treated at higher temperatures undergo physical changes that increase their Pt-O coordination and oxidation state, which consequently shifts their edge positions to higher energies and increases their white line intensities. | Full credit for noting it has the lowest white line intensity and lowest edge energy among the series, caused by having the lowest oxidation state (+2.28) and lowest Pt-O coordination number (3.3) due to the mildest thermal treatment. |
Review
#703
Pt
Pt L3
▶
LLM Prompt
Sample Information
Material: Pt
Sample-Specific Conditions
- Reference: Pt0
- Reference material for XAS
Measurement
We plan to measure the Pt L3 XANES spectrum of this sample.
Questions
Based on all the information above:
1. What is the expected edge position (in eV) for the Pt foil reference sample, as determined by the maximum of the first derivative of the Pt L3-edge XANES spectrum?
2. Describe the expected relative white line intensity of the Pt foil at the Pt L3-edge compared to oxidized platinum references such as PtO2 and cisplatin.
3. What is the primary purpose of including the Pt foil sample in the XANES analysis of the synthesized catalysts?
Ground Truth
Material: Pt foil
Measurement: Pt L3-edge XANES at beamline 8-ID (Inner Shell Spectroscopy, ISS) of the National Synchrotron Light Source II
Fit method: not reported
Phase fractions:
| Phase | Fraction |
|---|---|
| metallic_platinum | 1.0 |
Source evidence: Figure 2b (normalized XANES), Figure 2c (1st derivative curves), and Acknowledgments
Key reasoning: Pt foil is utilized as a standard reference material for metallic Pt (Pt0). It provides a baseline for comparing the white line intensity and edge position against oxidized references (PtO2, cisplatin) and the synthesized single-atom Pt catalysts to determine their relative oxidation states.
Reasoning source: Results and Discussion (Synthesis and Structural Characterization of Pt1/SiC SACs) and Figure 2
Scoring Rubric (total: 100 pts)
| Q | Type | Max | Question | Reference Answer | Scoring Criteria |
|---|---|---|---|---|---|
| q1 | spectral | 30 | What is the expected edge position (in eV) for the Pt foil reference sample, as determined by the maximum of the first derivative of the Pt L3-edge XANES spectrum? | The expected edge position for the Pt foil reference sample is 11564.0 eV. This specific value arises because the sample is a pure metallic platinum (Pt0) reference material consisting entirely of metallic platinum (fraction 1.0). Due to its zero oxidation state, it exhibits the lowest edge energy compared to oxidized references like PtO2 or cisplatin, thereby providing a reliable baseline for determining the relative oxidation states of synthesized single-atom Pt catalysts. | Full credit for stating 11564.0 eV. |
| q2 | spectral | 40 | Describe the expected relative white line intensity of the Pt foil at the Pt L3-edge compared to oxidized platinum references such as PtO2 and cisplatin. | The Pt foil is expected to exhibit a very low white line intensity at the Pt L3-edge, which is the lowest when compared to oxidized references such as PtO2 and cisplatin. This spectral characteristic occurs because the sample is a standard reference material composed of 100% metallic platinum (Pt0). In this zero oxidation state, the electronic structure produces a minimal white line feature, which serves as a necessary baseline for comparing against oxidized samples and synthesized single-atom Pt catalysts to determine their relative oxidation states. | Full credit for stating that the Pt foil exhibits the lowest white line intensity compared to the oxidized references. |
| q3 | reasoning | 30 | What is the primary purpose of including the Pt foil sample in the XANES analysis of the synthesized catalysts? | The primary purpose of including the Pt foil is to serve as a standard reference material for metallic platinum (Pt0). Because the sample is composed entirely of metallic platinum with an oxidation state of 0, it establishes a fundamental baseline for both the edge position (11564.0 eV) and the white line intensity. By comparing the XANES spectra of synthesized single-atom Pt catalysts against this Pt0 baseline and other oxidized references (such as PtO2 and cisplatin), their relative oxidation states can be accurately determined. | Full credit for explaining that it serves as a metallic (Pt0) reference standard to establish a baseline for edge position and white line intensity, enabling the determination of the oxidation states of the other samples. |
Review
#704
PtO2
Pt L3
▶
LLM Prompt
Sample Information
Material: PtO2
Sample-Specific Conditions
- Reference: Pt4+
- Reference material for XAS
Measurement
We plan to measure the Pt L3 XANES spectrum of this sample.
Questions
Based on all the information above:
1. What distinguishes the Pt L3-edge XANES spectrum of PtO2 from the metallic Pt foil and Pt cisplatin references?
2. What oxidation state does the PtO2 reference material represent, and what is its specific edge position as determined by the 1st derivative maximum?
3. How is the PtO2 XANES spectrum utilized in the analysis of the synthesized single-atom Pt catalysts in this study?
Ground Truth
Material: PtO2
Measurement: Pt L3-edge XANES, Inner Shell Spectroscopy (ISS) beamline 8-ID of the National Synchrotron Light Source II
Fit method: Not applicable (used as a reference standard)
Phase fractions:
| Phase | Fraction |
|---|---|
| platinum_dioxide | 1.0 |
Fit basis (paper's reference spectra):
- PtO2
Source evidence: Figure 2b (XANES spectra), Figure 2c (1st derivative), Page 5 text
Key reasoning: PtO2 is utilized as a standard reference material to represent the Pt4+ oxidation state. Its spectrum is compared against synthesized Pt1/SiC catalysts to demonstrate that the oxidation state of the single-atom Pt species is positioned between Pt2+ and Pt4+.
Reasoning source: Page 5, Results and Discussion
Scoring Rubric (total: 100 pts)
| Q | Type | Max | Question | Reference Answer | Scoring Criteria |
|---|---|---|---|---|---|
| q1 | spectral | 40 | What distinguishes the Pt L3-edge XANES spectrum of PtO2 from the metallic Pt foil and Pt cisplatin references? | The Pt L3-edge XANES spectrum of PtO2 is distinguished by having the highest white line intensity (approximately 2.3-2.4 normalized intensity at ~11568 eV) and the highest edge energy position. Specifically, its edge position is at 11566.0 eV, which is higher than that of Pt foil (11564.0 eV) and Pt cisplatin (11564.2 eV). These distinct spectral features arise because the sample is a pure PtO2 reference material representing a high Pt4+ oxidation state. The highly oxidized Pt4+ state directly produces this intense white line and shifted edge energy, allowing it to serve as an effective standard to evaluate the oxidation state of synthesized catalysts. | Full points for identifying that PtO2 has the highest white line intensity and the highest edge energy position compared to the other references. |
| q2 | identification | 30 | What oxidation state does the PtO2 reference material represent, and what is its specific edge position as determined by the 1st derivative maximum? | The PtO2 reference material represents the Pt4+ oxidation state and has a specific edge position of 11566.0 eV, as determined by the 1st derivative maximum. The sample consists entirely of a 1.0 fraction of platinum dioxide. This specific oxidation state and corresponding edge position are expected because the sample is measured specifically to serve as a pure Pt4+ standard for XAS analysis. By providing a reliable, fully oxidized benchmark, the PtO2 reference allows researchers to demonstrate that the oxidation state of synthesized single-atom Pt species is positioned between Pt2+ and Pt4+. | Full points for stating the oxidation state is Pt4+ and the edge position is 11566.0 eV. |
| q3 | reasoning | 30 | How is the PtO2 XANES spectrum utilized in the analysis of the synthesized single-atom Pt catalysts in this study? | The PtO2 XANES spectrum is utilized as a standard reference material to represent the Pt4+ oxidation state. It is compared directly against the spectra of synthesized Pt1/SiC catalysts to evaluate their electronic properties. Because the PtO2 sample is a pure reference standard with a known Pt4+ oxidation state, it provides a critical upper-bound benchmark for the analysis. By comparing the edge positions and white line intensities against this standard, researchers can successfully demonstrate that the oxidation state of the single-atom Pt species in the synthesized catalysts is positioned between Pt2+ and Pt4+. | Full points for explaining that it serves as a Pt4+ standard to demonstrate that the oxidation state of the synthesized single-atom Pt catalysts falls between Pt2+ and Pt4+. |
Review
#705
Pt(NH3)2Cl2
Pt L3
▶
LLM Prompt
Sample Information
Material: Pt(NH3)2Cl2
Sample-Specific Conditions
- Reference: Pt2+
- Reference material for XAS
Measurement
We plan to measure the Pt L3 XANES spectrum of this sample.
Questions
Based on all the information above:
1. What is the expected oxidation state of Pt in cisplatin, and how does its Pt L3-edge XANES white line intensity compare to that of Pt foil and PtO2?
2. What is the approximate edge position (in eV) of Pt cisplatin as determined from the 1st derivative of its XANES spectrum, and how does it compare to Pt foil?
3. Why is it necessary to measure the XANES spectrum of Pt cisplatin when studying the single-atom Pt catalysts in this context?
Ground Truth
Material: Pt(NH3)2Cl2
Measurement: Pt L3-edge XANES, National Synchrotron Light Source II (NSLS-II) beamline 8-ID (ISS)
Fit method: reference standard
Phase fractions:
| Phase | Fraction |
|---|---|
| Pt(NH3)2Cl2 | 1.0 |
Source evidence: Figure 2b, 2c; Page 5 text
Key reasoning: Pt cisplatin is used as a pure Pt2+ reference standard to establish a calibration for determining the oxidation state of the synthesized single-atom Pt catalysts.
Reasoning source: Page 5, Results and Discussion
Scoring Rubric (total: 100 pts)
| Q | Type | Max | Question | Reference Answer | Scoring Criteria |
|---|---|---|---|---|---|
| q1 | spectral | 35 | What is the expected oxidation state of Pt in cisplatin, and how does its Pt L3-edge XANES white line intensity compare to that of Pt foil and PtO2? | The expected oxidation state of Pt in cisplatin (Pt(NH3)2Cl2) is 2+. In its Pt L3-edge XANES spectrum, the white line intensity is intermediate between that of Pt foil (Pt0) and PtO2 (Pt4+). This occurs because the cisplatin sample is utilized as a pure Pt2+ reference standard to establish a calibration for determining the oxidation state of synthesized single-atom Pt catalysts. The intermediate white line intensity directly reflects this 2+ electronic state, which naturally falls between the fully reduced metallic state and the highly oxidized 4+ state. | Full points for identifying the oxidation state as 2+ and stating the white line intensity is intermediate between Pt foil and PtO2. |
| q2 | spectral | 35 | What is the approximate edge position (in eV) of Pt cisplatin as determined from the 1st derivative of its XANES spectrum, and how does it compare to Pt foil? | The edge position of Pt cisplatin, as determined from the 1st derivative of its XANES spectrum, is 11564.2 eV. This is slightly higher in energy compared to the edge position of Pt foil, which is located at 11564.0 eV. This shift to a higher energy arises because the Pt(NH3)2Cl2 sample is a pure Pt2+ compound, and its higher oxidation state requires more energy to excite the core electrons compared to metallic Pt0. Measuring this specific edge position is necessary because the sample acts as a reference standard to calibrate and determine the oxidation states of single-atom Pt catalysts. | Full points for stating the edge position is 11564.7 eV and that it is shifted to a higher energy compared to Pt foil (11564.0 eV). |
| q3 | reasoning | 30 | Why is it necessary to measure the XANES spectrum of Pt cisplatin when studying the single-atom Pt catalysts in this context? | Measuring the XANES spectrum of Pt cisplatin is necessary because it serves as a pure Pt2+ reference standard. By analyzing this Pt(NH3)2Cl2 sample, researchers can establish a reliable calibration based on its distinct edge position (11564.2 eV) and intermediate white line intensity. This calibration is required to accurately determine the unknown oxidation state of the synthesized single-atom Pt catalysts. Because the sample is composed entirely of pure Pt2+ (a fraction of 1.0), it provides a necessary intermediate reference point between Pt0 (foil) and Pt4+ (PtO2) to complete the electronic analysis. | Full points for explaining that it serves as a Pt2+ reference standard to help determine the oxidation state of the Pt single atoms in the catalysts. |
Review
Compressive Strain Reduces the Hydrogen Evolution and Oxidation Reaction Activity of Platinum in Alkaline Solution
BNL-NSLS-II-8-ID
Catalyst
Li Jiao et al.
DOI: 10.1021/acscatal.1c01723
1 scenario
▶
#706
PtCu3
Cu K-edge
▶
LLM Prompt
Sample Information
Material: PtCu3
Support: C
Reaction Conditions: H2-saturated 0.1 M KOH, 0.1-0.9 V vs RHE
Sample-Specific Conditions
- Applied potential: 0.1-0.9 V
- Dealloyed carbon-supported Pt-Cu nanoclusters with a core-shell Cu@Pt structure
Measurement
We plan to measure the Cu K-edge XANES spectrum of this sample.
Questions
Based on all the information above:
1. What is the dominant oxidation state of Cu in the D-PtCu3/C catalyst under in situ HER/HOR conditions (0.1-0.9 V), and what structural feature of the catalyst causes it to remain in this state?
2. Describe the expected spectral shape of the in situ Cu K-edge XANES for this sample across the 0.1-0.9 V potential range. What standard reference spectrum does it most closely resemble?
3. If the Cu in the sample were to undergo oxidation (e.g., forming Cu(OH)2), what specific XANES spectral feature would emerge, and is this feature observed in the D-PtCu3/C sample under these conditions?
Ground Truth
Material: D-PtCu3/C
Measurement: in situ Cu K-edge XANES, fluorescence mode, NSLS II (7-BM and 8-ID)
Fit method: Qualitative comparison
Phase fractions: (±10%)
| Phase | Fraction |
|---|---|
| metallic_copper | 1.0 |
Fit basis (paper's reference spectra):
- Cu foil
- Cu(OH)2
Source evidence: Figure 3A and text on pages 11-12
Key reasoning: The in situ XANES spectra of D-PtCu3/C shift negatively towards lower energy compared with the ex situ spectrum, overlapping that of the Cu foil. The spectra remain unchanged within the potential range of 0.1-0.9 V. This confirms that the Cu in the D-PtCu3/C is mainly in the reduced metallic phase, buried in the core, and electrochemically inactive during HER/HOR.
Reasoning source: Pages 11-12, Results section
Scoring Rubric (total: 100 pts)
| Q | Type | Max | Question | Reference Answer | Scoring Criteria |
|---|---|---|---|---|---|
| q1 | reasoning | 35 | What is the dominant oxidation state of Cu in the D-PtCu3/C catalyst under in situ HER/HOR conditions (0.1-0.9 V), and what structural feature of the catalyst causes it to remain in this state? | The dominant oxidation state of Cu in the D-PtCu3/C catalyst is Cu0 (metallic copper), representing a fraction of 1.0. This state is maintained because the dealloyed carbon-supported Pt-Cu nanoclusters feature a core-shell Cu@Pt structure. Under the applied potential range of 0.1-0.9 V in H2-saturated 0.1 M KOH, the Cu atoms are buried within the alloyed core beneath the Pt shell. This structural shielding protects the Cu from the electrolyte, rendering it electrochemically inactive during HER/HOR and locking it in a reduced metallic phase. | Full credit requires identifying the oxidation state as Cu0 (reduced metallic phase) and explaining that the Cu remains in this state because it is buried in the core of the Cu@Pt structure, making it electrochemically inactive. |
| q2 | spectral | 30 | Describe the expected spectral shape of the in situ Cu K-edge XANES for this sample across the 0.1-0.9 V potential range. What standard reference spectrum does it most closely resemble? | The in situ Cu K-edge XANES spectrum is expected to perfectly overlap with the standard Cu foil reference spectrum and remain completely unchanged as the applied potential increases from 0.1 V to 0.9 V. These spectral features occur because the sample consists of dealloyed Pt-Cu nanoclusters with a core-shell Cu@Pt structure. Due to this architecture, the Cu is buried in the core and shielded from the H2-saturated 0.1 M KOH electrolyte. Consequently, the Cu remains electrochemically inactive and entirely in a reduced metallic state (Cu0) across all tested potentials, producing a stable spectrum identical to metallic copper. | Full credit requires stating that the spectrum overlaps with a Cu foil standard and remains unchanged across the entire 0.1-0.9 V potential range. |
| q3 | identification | 35 | If the Cu in the sample were to undergo oxidation (e.g., forming Cu(OH)2), what specific XANES spectral feature would emerge, and is this feature observed in the D-PtCu3/C sample under these conditions? | If the Cu were to undergo oxidation to form a phase like Cu(OH)2, a distinct peak around 8998 eV would emerge, indicating charge transfer from Cu to O. However, this feature is completely absent in the in situ XANES spectra of the D-PtCu3/C sample. This absence is directly attributed to the core-shell Cu@Pt structure of the dealloyed nanoclusters. Because the Cu is buried within the core and protected by the Pt shell from the H2-saturated 0.1 M KOH electrolyte, it remains electrochemically inactive between 0.1-0.9 V and stays in a fully reduced metallic state (Cu0) without oxidizing. | Full credit requires mentioning the emergence of a peak around 8998 eV (indicative of charge transfer from Cu to O) and confirming that this peak is absent in the in situ D-PtCu3/C spectra. |
Review
Sustainable Oxide Electrocatalyst for Hydrogen- and Oxygen-Evolution Reactions
APS
Synthesis
Ram Krishna Hona et al.
DOI: 10.1021/acscatal.1c03196
9 scenarios
▶
#707
CaSrFe1-xCo1-xMn2xO6-δ (x=0.20)
Fe K-edge
▶
LLM Prompt
Sample Information
Material: CaSrFe1-xCo1-xMn2xO6-δ (x=0.20)
Method: solid-state
Precursors: CaCO3, SrCO3, Fe2O3, Mn2O3, Co3O4
Temperature C: 1200
Duration Hours: 24
Heating Rate C Per Min: 1.67
Atmosphere: air
Cooling Method: slow cooling (100 °C/h)
Sample-Specific Conditions
- Mn concentration (x): 0.20
- Perovskite oxide with x=0.20, analyzed at the Fe K-edge
Preparation
- Solid-state synthesis. Precursors CaCO3, SrCO3, Fe2O3, Mn2O3, and Co3O4 were mixed in stoichiometric proportions, ground, pressed into a pellet, and calcined in air at 1000 °C for 24 h. Samples were reground and sintered at 1200 °C for 24 h in air, followed by slow cooling. Heating and cooling rates were 100 °C/h.
Measurement
We plan to measure the Fe K-edge XANES spectrum of this sample.
Questions
Based on all the information above:
1. What candidate reference spectra are needed to establish a calibration curve for determining the oxidation state of Fe in this perovskite sample using pre-edge centroid analysis?
2. Based on the synthesis conditions and the resulting oxygen-deficient perovskite structure, estimate the fractions of the different Fe oxidation states present in the CaSrFe0.8Co0.8Mn0.4O6-δ (x=0.20) sample.
3. Explain how the Fe oxidation state fractions are determined from the XANES spectra and why a mixed valence state is observed for this specific composition.
Ground Truth
Material: CaSrFe0.8Co0.8Mn0.4O6-δ (x=0.20)
Measurement: Fe K-edge in transmission mode at beamline 9-BM of the Advanced Photon Source
Fit method: Pre-edge centroid position calibration
Phase fractions: (±5%)
| Phase | Fraction |
|---|---|
| Fe4+ state | 0.724 |
| Fe3+ state | 0.276 |
Fit basis (paper's reference spectra):
- FeO
- Fe2O3
- SrFeO3
Source evidence: Figure 2(a) and 2(d); Section 3.2, page 8
Key reasoning: The Fe K-edge XANES analysis reveals that iron in the x=0.20 compound exists in a mixed valence state. By analyzing the Fe K-pre-edge centroid position and comparing it to reference compounds (FeO, Fe2O3, SrFeO3), the average oxidation state is determined to be +3.724. This indicates a combination of trivalent and tetravalent iron, corresponding to 72.4% Fe4+ and 27.6% Fe3+.
Reasoning source: Section 3.2, page 8 and Figure 2(d)
Scoring Rubric (total: 100 pts)
| Q | Type | Max | Question | Reference Answer | Scoring Criteria |
|---|---|---|---|---|---|
| q1 | identification | 20 | What candidate reference spectra are needed to establish a calibration curve for determining the oxidation state of Fe in this perovskite sample using pre-edge centroid analysis? | To establish a calibration curve for determining the oxidation state of Fe using pre-edge centroid analysis, the required candidate reference spectra are FeO, Fe2O3, and SrFeO3. These specific references are necessary because the solid-state synthesis of CaSrFe0.8Co0.8Mn0.4O6-δ (x=0.20) in air at 1200 °C produces an oxygen-deficient perovskite where iron exists in a mixed valence state. By utilizing standards that represent Fe2+ (FeO), Fe3+ (Fe2O3), and Fe4+ (SrFeO3), the calibration curve brackets the possible oxidation states, allowing the sample's pre-edge centroid position to accurately yield the average Fe oxidation state of +3.724. | Full points for identifying Fe2O3 (Fe3+) and SrFeO3 (Fe4+) as the primary references, with FeO (Fe2+) as an acceptable additional calibration point. |
| q2 | quantification | 40 | Based on the synthesis conditions and the resulting oxygen-deficient perovskite structure, estimate the fractions of the different Fe oxidation states present in the CaSrFe0.8Co0.8Mn0.4O6-δ (x=0.20) sample. | The estimated fractions of the different Fe oxidation states in the CaSrFe0.8Co0.8Mn0.4O6-δ (x=0.20) sample are 72.4% Fe4+ and 27.6% Fe3+, with an uncertainty of 5%. These specific values arise because the solid-state synthesis of the x=0.20 composition, which involves sintering in air at 1200 °C followed by slow cooling, produces an oxygen-deficient perovskite structure (O6-δ). To maintain charge balance within this specific lattice under these atmospheric and thermal conditions, iron adopts a mixed valence state with an average oxidation state of +3.724, directly corresponding to this exact ratio of tetravalent and trivalent iron. | Full points for estimating approximately 72% Fe4+ and 28% Fe3+ (or an average oxidation state of ~+3.72). Deduct points for estimates outside a 5% error margin. |
| q3 | reasoning | 40 | Explain how the Fe oxidation state fractions are determined from the XANES spectra and why a mixed valence state is observed for this specific composition. | The Fe oxidation state fractions are determined by analyzing the Fe K-pre-edge centroid position from the XANES spectra and comparing it against a calibration curve built from reference compounds (FeO, Fe2O3, and SrFeO3). This pre-edge centroid calibration reveals an average iron oxidation state of +3.724, which mathematically translates to 72.4% Fe4+ and 27.6% Fe3+. This mixed valence state is observed because the CaSrFe0.8Co0.8Mn0.4O6-δ (x=0.20) material is synthesized via a high-temperature (1200 °C) solid-state method in an air atmosphere, resulting in an oxygen-deficient perovskite (O6-δ). The specific Mn concentration (x=0.20) and the thermal synthesis conditions force the iron to adopt a combination of trivalent and tetravalent states to maintain overall charge neutrality in the resulting crystal lattice. | Full points for mentioning the use of the Fe K-pre-edge centroid position calibrated against standard references to determine the average oxidation state, and linking the mixed +3/+4 state to the stoichiometry of the synthesized material. |
Review
#708
CaSrFe1-xCo1-xMn2xO6-δ (x=0.25)
Fe K-edge
▶
LLM Prompt
Sample Information
Material: CaSrFe1-xCo1-xMn2xO6-δ (x=0.25)
Method: solid-state
Precursors: CaCO3, SrCO3, Fe2O3, Mn2O3, Co3O4
Temperature C: 1200
Duration Hours: 24
Heating Rate C Per Min: 1.67
Atmosphere: air
Cooling Method: slow cooling (100 °C/h)
Sample-Specific Conditions
- Mn concentration (x): 0.25
- Perovskite oxide with x=0.25, analyzed at the Fe K-edge
Preparation
- Solid-state synthesis. Precursors CaCO3, SrCO3, Fe2O3, Mn2O3, and Co3O4 were mixed in stoichiometric proportions, ground, pressed into a pellet, and calcined in air at 1000 °C for 24 h. Samples were reground and sintered at 1200 °C for 24 h in air, followed by slow cooling. Heating and cooling rates were 100 °C/h.
Measurement
We plan to measure the Fe K-edge XANES spectrum of this sample.
Questions
Based on all the information above:
1. What candidate reference spectra are needed to determine the Fe oxidation state and phase composition of this sample using XANES?
Ground Truth
Material: CaSrFe0.75Co0.75Mn0.5O6-δ
Measurement: Fe K-edge XANES, transmission mode, beamline 9-BM at Advanced Photon Source
Fit method: Linear correlation of pre-edge centroid energy with formal oxidation state
Phase fractions: (±10%)
| Phase | Fraction |
|---|---|
| Fe4+ state | 0.83 |
| Fe3+ state | 0.17 |
Fit basis (paper's reference spectra):
- FeO
- Fe2O3
- SrFeO3
Source evidence: Figure 2d and Section 3.2, pages 7-8
Key reasoning: The Fe oxidation state is determined by analyzing the Fe K-pre-edge centroid energy and comparing it to reference compounds (FeO, Fe2O3, SrFeO3). The sample contains a combination of trivalent and tetravalent iron, with an average oxidation state of +3.83. This high oxidation state is a result of the specific stoichiometry (x=0.25) and the presence of oxygen vacancies (δ ≈ 0.56) in the cubic perovskite structure, which requires charge compensation among the transition metals (Fe, Co, Mn).
Reasoning source: Section 3.2, page 8
Scoring Rubric (total: 100 pts)
| Q | Type | Max | Question | Reference Answer | Scoring Criteria |
|---|---|---|---|---|---|
| q1 | identification | 100 | What candidate reference spectra are needed to determine the Fe oxidation state and phase composition of this sample using XANES? | The candidate reference spectra needed to determine the Fe oxidation state for this sample are FeO, Fe2O3, and SrFeO3. These references are used to establish a linear correlation between the Fe K-pre-edge centroid energy and the formal oxidation state. Based on the sample's specific stoichiometry (x=0.25) and solid-state synthesis in air at 1200 °C, the resulting cubic perovskite structure contains oxygen vacancies (δ ≈ 0.56). This defect structure requires charge compensation among the transition metals (Fe, Co, Mn), which drives the iron to a highly oxidized, mixed state. Consequently, references containing Fe3+ (Fe2O3) and Fe4+ (SrFeO3) are specifically required to accurately quantify the resulting combination of trivalent and tetravalent iron (average oxidation state of +3.83) present in the sample. | Full points for identifying Fe2O3 (Fe3+) and SrFeO3 (Fe4+) as the primary references, and FeO (Fe2+) as an additional anchor for the calibration curve. |
Review
#709
CaSrFe1-xCo1-xMn2xO6-δ (x=0.30)
Fe K-edge
▶
LLM Prompt
Sample Information
Material: CaSrFe1-xCo1-xMn2xO6-δ (x=0.30)
Method: solid-state
Precursors: CaCO3, SrCO3, Fe2O3, Mn2O3, Co3O4
Temperature C: 1200
Duration Hours: 24
Heating Rate C Per Min: 1.67
Atmosphere: air
Cooling Method: slow cooling (100 °C/h)
Sample-Specific Conditions
- Mn concentration (x): 0.30
- Perovskite oxide with x=0.30, analyzed at the Fe K-edge
Preparation
- Solid-state synthesis. Precursors CaCO3, SrCO3, Fe2O3, Mn2O3, and Co3O4 were mixed in stoichiometric proportions, ground, pressed into a pellet, and calcined in air at 1000 °C for 24 h. Samples were reground and sintered at 1200 °C for 24 h in air, followed by slow cooling. Heating and cooling rates were 100 °C/h.
Measurement
We plan to measure the Fe K-edge XANES spectrum of this sample.
Questions
Based on all the information above:
1. What reference compounds are appropriate for establishing a calibration curve to determine the Fe oxidation state in this perovskite oxide?
Ground Truth
Material: CaSrFe0.7Co0.7Mn0.6O6-δ (x=0.30)
Measurement: Fe K-edge XANES, transmission mode, beamline 9-BM at Advanced Photon Source
Fit method: Linear correlation of pre-edge centroid energy
Phase fractions: (±10%)
| Phase | Fraction |
|---|---|
| Fe4+ | 0.952 |
| Fe3+ | 0.048 |
Fit basis (paper's reference spectra):
- FeO
- Fe2O3
- SrFeO3
Source evidence: Figure 2d and Section 3.2 (Page 8)
Key reasoning: The iron in this compound contains a combination of trivalent and tetravalent states. There is a systematic increase in the iron oxidation state as the Mn concentration (x) increases in the series. For x=0.30, the pre-edge centroid position shifts to higher energy, corresponding to an average oxidation state of +3.952, indicating a predominantly Fe4+ state with a minor Fe3+ component.
Reasoning source: Section 3.2, Page 8
Scoring Rubric (total: 100 pts)
| Q | Type | Max | Question | Reference Answer | Scoring Criteria |
|---|---|---|---|---|---|
| q1 | identification | 100 | What reference compounds are appropriate for establishing a calibration curve to determine the Fe oxidation state in this perovskite oxide? | The appropriate reference compounds for establishing a calibration curve using the pre-edge centroid energy are FeO, Fe2O3, and SrFeO3. These specific references are necessary because the iron in the CaSrFe0.7Co0.7Mn0.6O6-δ (x=0.30) perovskite, synthesized via solid-state methods in air at 1200 °C, exhibits a mixed oxidation state. As the Mn concentration increases to x=0.30, there is a systematic increase in the iron oxidation state, shifting the pre-edge centroid to higher energies. This results in an average oxidation state of +3.952, consisting of predominantly Fe4+ (95.2%) and a minor Fe3+ (4.8%) component. Therefore, Fe2O3 and SrFeO3 are required to model the Fe3+ and Fe4+ states present in the sample, while FeO provides the lower-valence baseline for the linear correlation. | Full credit for identifying FeO, Fe2O3, and SrFeO3 as the necessary reference standards for Fe2+, Fe3+, and Fe4+ respectively. |
Review
#710
CaSrFe1-xCo1-xMn2xO6-δ (x=0.20)
Co K-edge
▶
LLM Prompt
Sample Information
Material: CaSrFe1-xCo1-xMn2xO6-δ (x=0.20)
Method: solid-state
Precursors: CaCO3, SrCO3, Fe2O3, Mn2O3, Co3O4
Temperature C: 1200
Duration Hours: 24
Heating Rate C Per Min: 1.67
Atmosphere: air
Cooling Method: slow cooling (100 °C/h)
Sample-Specific Conditions
- Mn concentration (x): 0.20
- Perovskite oxide with x=0.20, analyzed at the Co K-edge
Preparation
- Solid-state synthesis. Precursors CaCO3, SrCO3, Fe2O3, Mn2O3, and Co3O4 were mixed in stoichiometric proportions, ground, pressed into a pellet, and calcined in air at 1000 °C for 24 h. Samples were reground and sintered at 1200 °C for 24 h in air, followed by slow cooling. Heating and cooling rates were 100 °C/h.
Measurement
We plan to measure the Co K-edge XANES spectrum of this sample.
Questions
Based on all the information above:
1. What candidate reference spectra are needed to determine the Co oxidation states in this sample?
2. Estimate the fractions of the different Co oxidation states present in this sample.
3. Explain the physical reasoning for why this specific composition and synthesis method results in the observed mixed Co oxidation state.
Ground Truth
Material: CaSrFe0.8Co0.8Mn0.4O6-δ
Measurement: Co K-edge XANES in transmission mode at beamline 9-BM, Advanced Photon Source
Fit method: Linear regression of edge position (E0) vs. oxidation state
Phase fractions: (±10%)
| Phase | Fraction |
|---|---|
| Co3+ | 0.7 |
| Co2+ | 0.3 |
Fit basis (paper's reference spectra):
- CoO
- LaCoO3
Source evidence: Figure 2e and Section 3.2, page 7-8
Key reasoning: The Co K-edge position (E0) for CaSrFe0.8Co0.8Mn0.4O6-δ (x=0.20) was determined and compared to a linear calibration curve of E0 versus oxidation state constructed from reference compounds (CoO for Co2+ and LaCoO3 for Co3+). The measured E0 corresponds to an average Co oxidation state of +2.70. This indicates a mixed valence state consisting of approximately 70% Co3+ and 30% Co2+, which is driven by the significant degree of oxygen-deficiency in the perovskite lattice requiring charge compensation.
Reasoning source: Section 3.1 (Crystal Structure) and Section 3.2 (X-ray Absorption Near-Edge Structure), Pages 6-8
Scoring Rubric (total: 100 pts)
| Q | Type | Max | Question | Reference Answer | Scoring Criteria |
|---|---|---|---|---|---|
| q1 | identification | 30 | What candidate reference spectra are needed to determine the Co oxidation states in this sample? | The candidate reference spectra needed to determine the Co oxidation states are CoO and LaCoO3. These references are used to construct a linear calibration curve of the edge position (E0) versus oxidation state, where CoO provides the Co2+ reference and LaCoO3 provides the Co3+ reference. These specific oxidation states are expected because the solid-state synthesis of the CaSrFe0.8Co0.8Mn0.4O6-δ perovskite at 1200 °C in air produces a significantly oxygen-deficient lattice. This oxygen deficiency requires charge compensation within the transition metal sites, leading to the mixed Co2+/Co3+ valence state. | Full points for identifying CoO (or another Co2+ standard) and LaCoO3 (or another Co3+ standard). |
| q2 | quantification | 40 | Estimate the fractions of the different Co oxidation states present in this sample. | The sample contains approximately 70% Co3+ and 30% Co2+, with an estimated uncertainty of 10%. These fractions correspond to an average Co oxidation state of +2.70, which is determined by comparing the measured Co K-edge position to a linear calibration curve. These specific values result from the solid-state synthesis of the CaSrFe0.8Co0.8Mn0.4O6-δ (x=0.20) composition at 1200 °C in air, which induces a significant degree of oxygen deficiency in the perovskite lattice. To maintain charge neutrality in response to this oxygen loss, exactly 30% of the cobalt ions must reduce to Co2+ to compensate. | Full points for estimating ~70% Co3+ and ~30% Co2+ (or stating an average oxidation state of ~+2.7). |
| q3 | reasoning | 30 | Explain the physical reasoning for why this specific composition and synthesis method results in the observed mixed Co oxidation state. | The observed mixed Co oxidation state is fundamentally driven by the significant degree of oxygen deficiency (δ) in the CaSrFe0.8Co0.8Mn0.4O6-δ (x=0.20) perovskite lattice. During the solid-state synthesis, sintering the mixed oxide precursors at 1200 °C in air leads to the formation of oxygen vacancies within the structure. To maintain overall electrical neutrality in the oxygen-deficient lattice, charge compensation must occur at the transition metal sites. This mechanism forces a portion of the cobalt to reduce, resulting in the observed average oxidation state of +2.70, composed of 70% Co3+ and 30% Co2+. | Full points for explaining that the oxygen-deficient nature of the perovskite lattice forces the transition metals into mixed valence states to maintain charge neutrality, resulting in a combination of Co2+ and Co3+. |
Review
#711
CaSrFe1-xCo1-xMn2xO6-δ (x=0.25)
Co K-edge
▶
LLM Prompt
Sample Information
Material: CaSrFe1-xCo1-xMn2xO6-δ (x=0.25)
Method: solid-state
Precursors: CaCO3, SrCO3, Fe2O3, Mn2O3, Co3O4
Temperature C: 1200
Duration Hours: 24
Heating Rate C Per Min: 1.67
Atmosphere: air
Cooling Method: slow cooling (100 °C/h)
Sample-Specific Conditions
- Mn concentration (x): 0.25
- Perovskite oxide with x=0.25, analyzed at the Co K-edge
Preparation
- Solid-state synthesis. Precursors CaCO3, SrCO3, Fe2O3, Mn2O3, and Co3O4 were mixed in stoichiometric proportions, ground, pressed into a pellet, and calcined in air at 1000 °C for 24 h. Samples were reground and sintered at 1200 °C for 24 h in air, followed by slow cooling. Heating and cooling rates were 100 °C/h.
Measurement
We plan to measure the Co K-edge XANES spectrum of this sample.
Questions
Based on all the information above:
1. What candidate reference spectra are needed to establish a calibration curve for determining the Co oxidation states in this sample?
Ground Truth
Material: CaSrFe0.75Co0.75Mn0.5O6-δ (x=0.25)
Measurement: Co K-edge in transmission mode at APS beamline 9-BM
Fit method: Linear regression of edge position (E0) vs oxidation state
Phase fractions: (±5%)
| Phase | Fraction |
|---|---|
| Co3+ | 0.736 |
| Co2+ | 0.264 |
Fit basis (paper's reference spectra):
- CoO
- LaCoO3
Source evidence: Figure 2b, Figure 2e, and Section 3.2 (page 8)
Key reasoning: The material exhibits a significant degree of oxygen-deficiency (δ ≈ 0.56). The presence of these oxygen vacancies directly impacts the valence states of the transition metals to maintain charge neutrality. Consequently, the cobalt oxidation state is a combination of divalent and trivalent states, yielding an average oxidation state of +2.736.
Reasoning source: Section 3.1 (page 6) and Section 3.2 (page 8)
Scoring Rubric (total: 100 pts)
| Q | Type | Max | Question | Reference Answer | Scoring Criteria |
|---|---|---|---|---|---|
| q1 | identification | 100 | What candidate reference spectra are needed to establish a calibration curve for determining the Co oxidation states in this sample? | To establish a calibration curve for determining the Co oxidation states in this sample, the required candidate reference spectra are CoO and LaCoO3. The solid-state synthesis of the CaSrFe0.75Co0.75Mn0.5O6-δ (x=0.25) perovskite at 1200 °C in air results in a material with a significant degree of oxygen deficiency (δ ≈ 0.56). To maintain charge neutrality in the presence of these oxygen vacancies, the cobalt ions must adopt a mixed valence state consisting of divalent (Co2+) and trivalent (Co3+) species. Consequently, CoO and LaCoO3 are needed as standards representing the +2 and +3 oxidation states, respectively, to perform a linear regression of the edge position (E0) versus oxidation state. | Full credit for identifying CoO (for Co2+) and LaCoO3 (for Co3+) as the necessary reference standards. |
Review
#712
CaSrFe1-xCo1-xMn2xO6-δ (x=0.30)
Co K-edge
▶
LLM Prompt
Sample Information
Material: CaSrFe1-xCo1-xMn2xO6-δ (x=0.30)
Method: solid-state
Precursors: CaCO3, SrCO3, Fe2O3, Mn2O3, Co3O4
Temperature C: 1200
Duration Hours: 24
Heating Rate C Per Min: 1.67
Atmosphere: air
Cooling Method: slow cooling (100 °C/h)
Sample-Specific Conditions
- Mn concentration (x): 0.30
- Perovskite oxide with x=0.30, analyzed at the Co K-edge
Preparation
- Solid-state synthesis. Precursors CaCO3, SrCO3, Fe2O3, Mn2O3, and Co3O4 were mixed in stoichiometric proportions, ground, pressed into a pellet, and calcined in air at 1000 °C for 24 h. Samples were reground and sintered at 1200 °C for 24 h in air, followed by slow cooling. Heating and cooling rates were 100 °C/h.
Measurement
We plan to measure the Co K-edge XANES spectrum of this sample.
Questions
Based on all the information above:
1. What candidate reference spectra are needed to determine the oxidation state fractions of Co in this oxygen-deficient perovskite sample?
2. Estimate the fractions of the different Co oxidation states present in this CaSrFe0.7Co0.7Mn0.6O6-δ (x=0.30) sample.
3. Based on the structural properties of the synthesized material, explain the physical reasoning for why cobalt adopts this specific mixture of oxidation states.
Ground Truth
Material: CaSrFe0.7Co0.7Mn0.6O6-δ (x=0.30)
Measurement: Co K-edge, transmission mode, beamline 9-BM at Advanced Photon Source
Fit method: Linear interpolation of edge energy (E0)
Phase fractions: (±14%)
| Phase | Fraction |
|---|---|
| Co3+ state | 0.76 |
| Co2+ state | 0.24 |
Fit basis (paper's reference spectra):
- CoO
- LaCoO3
Source evidence: Figure 2e and Section 3.2 (page 7-8)
Key reasoning: The synthesized material forms an oxygen-deficient perovskite structure. The presence of these oxygen vacancies directly impacts the valence states of the transition metals. Consequently, cobalt exists in a mixed oxidation state, combining divalent and trivalent states, to balance the charge in the oxygen-deficient lattice.
Reasoning source: Section 3.1 (page 6) and Section 3.2 (page 8)
Scoring Rubric (total: 100 pts)
| Q | Type | Max | Question | Reference Answer | Scoring Criteria |
|---|---|---|---|---|---|
| q1 | identification | 20 | What candidate reference spectra are needed to determine the oxidation state fractions of Co in this oxygen-deficient perovskite sample? | The required reference spectra to determine the oxidation state fractions of Co are CoO and LaCoO3. The solid-state synthesis of CaSrFe0.7Co0.7Mn0.6O6-δ at 1200 °C in air produces an oxygen-deficient perovskite structure. Because of these oxygen vacancies, cobalt must adopt a mixed oxidation state to maintain charge balance within the lattice. Therefore, CoO (representing the divalent Co2+ state) and LaCoO3 (representing the trivalent Co3+ state) are needed as reference standards to model this mixed-valence system. | Full points for identifying CoO (for Co2+) and LaCoO3 (for Co3+) as the necessary reference spectra. |
| q2 | quantification | 40 | Estimate the fractions of the different Co oxidation states present in this CaSrFe0.7Co0.7Mn0.6O6-δ (x=0.30) sample. | The estimated fractions for the cobalt oxidation states in this sample are 76% Co3+ and 24% Co2+, with an uncertainty of 14%. These specific fractions result from the solid-state synthesis of the CaSrFe0.7Co0.7Mn0.6O6-δ (x=0.30) material, which forms an oxygen-deficient perovskite structure. The presence of oxygen vacancies (δ) in the lattice directly impacts the transition metal valence states. Consequently, a specific mixture of 76% trivalent and 24% divalent cobalt is required to balance the overall charge in this oxygen-deficient lattice. | Full points for estimating approximately 76% Co3+ and 24% Co2+ (or an average oxidation state of ~+2.76). Partial credit for identifying that it is a mixture dominated by Co3+ with a minority of Co2+. |
| q3 | reasoning | 40 | Based on the structural properties of the synthesized material, explain the physical reasoning for why cobalt adopts this specific mixture of oxidation states. | Cobalt adopts a mixed oxidation state of Co3+ and Co2+ to balance the charge within the oxygen-deficient lattice of the synthesized material. During the solid-state synthesis at 1200 °C in air, the CaSrFe0.7Co0.7Mn0.6O6-δ (x=0.30) composition crystallizes into an oxygen-deficient perovskite structure. The formation of these oxygen vacancies directly impacts the valence states of the transition metals present in the material. To compensate for the missing negative charge from the oxygen vacancies, cobalt reduces to a mixture of divalent (24%) and trivalent (76%) states, thereby maintaining overall electrical neutrality in the lattice. | Full points for explaining that the material is an oxygen-deficient perovskite, and the presence of oxygen vacancies forces the transition metals (like Co) into mixed valence states (divalent and trivalent) to maintain charge neutrality. |
Review
#713
CaSrFe1-xCo1-xMn2xO6-δ (x=0.20)
Mn K-edge
▶
LLM Prompt
Sample Information
Material: CaSrFe1-xCo1-xMn2xO6-δ (x=0.20)
Method: solid-state
Precursors: CaCO3, SrCO3, Fe2O3, Mn2O3, Co3O4
Temperature C: 1200
Duration Hours: 24
Heating Rate C Per Min: 1.67
Atmosphere: air
Cooling Method: slow cooling (100 °C/h)
Sample-Specific Conditions
- Mn concentration (x): 0.20
- Perovskite oxide with x=0.20, analyzed at the Mn K-edge
Preparation
- Solid-state synthesis. Precursors CaCO3, SrCO3, Fe2O3, Mn2O3, and Co3O4 were mixed in stoichiometric proportions, ground, pressed into a pellet, and calcined in air at 1000 °C for 24 h. Samples were reground and sintered at 1200 °C for 24 h in air, followed by slow cooling. Heating and cooling rates were 100 °C/h.
Measurement
We plan to measure the Mn K-edge XANES spectrum of this sample.
Questions
Based on all the information above:
1. What candidate reference spectra are needed to accurately determine the oxidation state of Mn in this oxygen-deficient perovskite sample using XANES?
2. Based on the solid-state synthesis conditions in air at 1200 °C, estimate the relative fractions of the Mn oxidation states in the resulting CaSrFe0.8Co0.8Mn0.4O6-δ perovskite.
3. Explain the physical reasoning behind the observed Mn oxidation states in this material, considering its structural characteristics as an oxygen-deficient perovskite.
Ground Truth
Material: CaSrFe0.8Co0.8Mn0.4O6-δ (x=0.20)
Measurement: Mn K-edge, transmission mode, beamline 9-BM at the Advanced Photon Source
Fit method: Edge energy position calibration / linear fit
Phase fractions: (±10%)
| Phase | Fraction |
|---|---|
| Mn4+ state | 0.895 |
| Mn3+ state | 0.105 |
Fit basis (paper's reference spectra):
- MnO
- Mn2O3
- MnO2
Source evidence: Figure 2f and Section 3.2, page 8
Key reasoning: XANES analysis of the Mn K-edge reveals that the manganese in CaSrFe0.8Co0.8Mn0.4O6-δ is predominantly in the tetravalent state (Mn4+), with a smaller percentage of trivalent manganese (Mn3+). The average oxidation state is determined to be +3.895 based on the edge energy position compared to reference standards (MnO, Mn2O3, MnO2). This high oxidation state is maintained despite the significant oxygen deficiency in the perovskite structure.
Reasoning source: Section 3.2, page 8 and Figure 2 caption
Scoring Rubric (total: 100 pts)
| Q | Type | Max | Question | Reference Answer | Scoring Criteria |
|---|---|---|---|---|---|
| q1 | identification | 20 | What candidate reference spectra are needed to accurately determine the oxidation state of Mn in this oxygen-deficient perovskite sample using XANES? | To accurately determine the oxidation state of Mn in this sample, the required candidate reference spectra are MnO, Mn2O3, and MnO2. These specific references are necessary because they provide the standard edge energy positions for the +2, +3, and +4 oxidation states of manganese. Given that the CaSrFe0.8Co0.8Mn0.4O6-δ (x=0.20) sample is synthesized via a solid-state reaction in an oxidizing air atmosphere at 1200 °C and then slowly cooled, the manganese is expected to adopt mixed high-valence states within the oxygen-deficient perovskite structure. By comparing the sample's edge energy position to these standards, one can accurately determine the predominant Mn4+ and minor Mn3+ species. | Full credit for identifying MnO2 (Mn4+) and Mn2O3 (Mn3+) as the primary references needed, with MnO (Mn2+) as an additional standard for calibration. |
| q2 | quantification | 40 | Based on the solid-state synthesis conditions in air at 1200 °C, estimate the relative fractions of the Mn oxidation states in the resulting CaSrFe0.8Co0.8Mn0.4O6-δ perovskite. | The relative fractions of the Mn oxidation states in the CaSrFe0.8Co0.8Mn0.4O6-δ (x=0.20) sample are 0.895 (89.5%) for the Mn4+ state and 0.105 (10.5%) for the Mn3+ state. These specific values result from the solid-state synthesis conditions, specifically the calcination and sintering in an air atmosphere at 1200 °C followed by slow cooling at 100 °C/h. This highly oxidizing environment and slow cooling process drive the manganese to predominantly achieve the tetravalent state, yielding an average oxidation state of +3.895. Consequently, this high oxidation state is stabilized and maintained despite the significant oxygen deficiency (δ) inherent to the resulting perovskite structure. | Full credit for estimating that Mn4+ is the dominant state (~90%) with a minor contribution from Mn3+ (~10%), yielding an average oxidation state of approximately +3.9. |
| q3 | reasoning | 40 | Explain the physical reasoning behind the observed Mn oxidation states in this material, considering its structural characteristics as an oxygen-deficient perovskite. | In the CaSrFe0.8Co0.8Mn0.4O6-δ (x=0.20) perovskite, manganese is found predominantly in the tetravalent state (89.5% Mn4+) alongside a minor trivalent component (10.5% Mn3+). This results in a high average oxidation state of +3.895, which is maintained despite the material's significant structural oxygen deficiency. The physical reasoning stems from the solid-state synthesis conditions: processing in an air atmosphere at 1200 °C with a slow cooling rate of 100 °C/h provides a strongly oxidizing environment. This environment drives the manganese to higher valence states, meaning the structural oxygen vacancies (δ) are accommodated by the lattice without fully reducing the manganese, allowing the Mn4+ state to dominate. | Full credit for explaining that despite the significant oxygen deficiency (vacancies) in the perovskite structure, manganese predominantly adopts a high tetravalent state (Mn4+) with only a small amount of trivalent state (Mn3+), which is characteristic of this specific composition. |
Review
#714
CaSrFe1-xCo1-xMn2xO6-δ (x=0.25)
Mn K-edge
▶
LLM Prompt
Sample Information
Material: CaSrFe1-xCo1-xMn2xO6-δ (x=0.25)
Method: solid-state
Precursors: CaCO3, SrCO3, Fe2O3, Mn2O3, Co3O4
Temperature C: 1200
Duration Hours: 24
Heating Rate C Per Min: 1.67
Atmosphere: air
Cooling Method: slow cooling (100 °C/h)
Sample-Specific Conditions
- Mn concentration (x): 0.25
- Perovskite oxide with x=0.25, analyzed at the Mn K-edge
Preparation
- Solid-state synthesis. Precursors CaCO3, SrCO3, Fe2O3, Mn2O3, and Co3O4 were mixed in stoichiometric proportions, ground, pressed into a pellet, and calcined in air at 1000 °C for 24 h. Samples were reground and sintered at 1200 °C for 24 h in air, followed by slow cooling. Heating and cooling rates were 100 °C/h.
Measurement
We plan to measure the Mn K-edge XANES spectrum of this sample.
Questions
Based on all the information above:
1. What reference spectra are required to establish a calibration curve for determining the Mn oxidation states in this perovskite sample?
2. Based on the synthesis conditions (calcined in air at 1000 °C, sintered at 1200 °C) and the composition CaSrFe0.75Co0.75Mn0.5O6-δ, estimate the fractions of the different Mn oxidation states present in the sample.
3. Explain how the Mn K-edge XANES data is used to determine the distribution of Mn oxidation states in this material, and why this specific distribution is observed.
Ground Truth
Material: CaSrFe0.75Co0.75Mn0.5O6-δ (x=0.25)
Measurement: Mn K-edge XANES in transmission mode at beamline 9-BM, Advanced Photon Source
Fit method: Linear interpolation of edge energy (EA) against reference oxidation states
Phase fractions: (±7%)
| Phase | Fraction |
|---|---|
| Mn4+ | 0.898 |
| Mn3+ | 0.102 |
Fit basis (paper's reference spectra):
- MnO
- Mn2O3
- MnO2
Source evidence: Figure 2f and Section 3.2, page 8
Key reasoning: The Mn oxidation state was determined by comparing the Mn K-edge energy (EA) to a linear fit of reference compounds (MnO, Mn2O3, MnO2). For the x=0.25 composition (CaSrFe0.75Co0.75Mn0.5O6-δ), the average Mn oxidation state is +3.898. This indicates that most of the manganese is in the tetravalent state (Mn4+), with a smaller percentage (~10%) in the trivalent state (Mn3+).
Reasoning source: Section 3.2, page 8 and Figure 2f
Scoring Rubric (total: 100 pts)
| Q | Type | Max | Question | Reference Answer | Scoring Criteria |
|---|---|---|---|---|---|
| q1 | identification | 20 | What reference spectra are required to establish a calibration curve for determining the Mn oxidation states in this perovskite sample? | The reference spectra required to establish the calibration curve are MnO, Mn2O3, and MnO2. These specific references are necessary because the solid-state synthesis of the CaSrFe0.75Co0.75Mn0.5O6-δ (x=0.25) perovskite in air at 1200 °C from the Mn2O3 precursor results in a mixed-valence state for manganese. The high-temperature air atmosphere promotes the oxidation of the precursors, requiring standards that span the possible +2, +3, and +4 oxidation states. By using these references, the Mn K-edge energy (EA) can be linearly interpolated to accurately determine the sample's average oxidation state of +3.898. | Full points for identifying MnO, Mn2O3, and MnO2 (or equivalent standard Mn2+, Mn3+, and Mn4+ oxides) as the necessary reference spectra. |
| q2 | quantification | 40 | Based on the synthesis conditions (calcined in air at 1000 °C, sintered at 1200 °C) and the composition CaSrFe0.75Co0.75Mn0.5O6-δ, estimate the fractions of the different Mn oxidation states present in the sample. | The estimated fractions of the Mn oxidation states in the sample are 89.8% Mn4+ and 10.2% Mn3+, with an uncertainty of 7%. These specific values arise because the CaSrFe0.75Co0.75Mn0.5O6-δ (x=0.25) composition was sintered at 1200 °C for 24 hours in an oxidizing air atmosphere. The prolonged high-temperature treatment in air, combined with slow cooling at 100 °C/h, drives the oxidation of the initial Mn2O3 precursor. This environment stabilizes manganese predominantly in the tetravalent state within the perovskite lattice, resulting in an average oxidation state of +3.898. | Full points for estimating ~90% Mn4+ and ~10% Mn3+ (or an average oxidation state of ~+3.9). Deduct points if the estimate falls outside the 7% uncertainty range or if incorrect oxidation states (e.g., Mn2+) are proposed. |
| q3 | reasoning | 40 | Explain how the Mn K-edge XANES data is used to determine the distribution of Mn oxidation states in this material, and why this specific distribution is observed. | The distribution of Mn oxidation states is determined by comparing the sample's Mn K-edge energy (EA) to a linear fit of reference compounds (MnO, Mn2O3, and MnO2). This linear interpolation reveals an average Mn oxidation state of +3.898, which translates to a distribution of 89.8% Mn4+ and 10.2% Mn3+. This specific, highly oxidized distribution is observed because the CaSrFe0.75Co0.75Mn0.5O6-δ (x=0.25) material is synthesized via a solid-state method and sintered at 1200 °C in air. The oxygen-rich atmosphere and slow cooling process (100 °C/h) facilitate the oxidation of the starting Mn2O3 precursor, driving the manganese ions to predominantly adopt the tetravalent (Mn4+) state to stabilize the resulting perovskite structure. | Full points for explaining that the average oxidation state is derived from the linear interpolation of the Mn K-edge energy (EA) against known references, and noting that the resulting value (+3.898) dictates a mixture heavily dominated by tetravalent Mn with a minor trivalent component. |
Review
#715
CaSrFe1-xCo1-xMn2xO6-δ (x=0.30)
Mn K-edge
▶
LLM Prompt
Sample Information
Material: CaSrFe1-xCo1-xMn2xO6-δ (x=0.30)
Method: solid-state
Precursors: CaCO3, SrCO3, Fe2O3, Mn2O3, Co3O4
Temperature C: 1200
Duration Hours: 24
Heating Rate C Per Min: 1.67
Atmosphere: air
Cooling Method: slow cooling (100 °C/h)
Sample-Specific Conditions
- Mn concentration (x): 0.30
- Perovskite oxide with x=0.30, analyzed at the Mn K-edge
Preparation
- Solid-state synthesis. Precursors CaCO3, SrCO3, Fe2O3, Mn2O3, and Co3O4 were mixed in stoichiometric proportions, ground, pressed into a pellet, and calcined in air at 1000 °C for 24 h. Samples were reground and sintered at 1200 °C for 24 h in air, followed by slow cooling. Heating and cooling rates were 100 °C/h.
Measurement
We plan to measure the Mn K-edge XANES spectrum of this sample.
Questions
Based on all the information above:
1. What candidate reference spectra are needed to perform a linear combination fitting analysis of the Mn K-edge for this sample to determine its oxidation states?
2. Estimate the phase fractions of the different Mn oxidation states in this CaSrFe0.7Co0.7Mn0.6O6-δ (x=0.30) sample.
3. Explain why manganese adopts this specific mixture of oxidation states in this material, rather than a single pure oxidation state.
Ground Truth
Material: CaSrFe0.7Co0.7Mn0.6O6-δ (x=0.30)
Measurement: Mn K-edge, transmission mode, beamline 9-BM at Advanced Photon Source
Fit method: Linear interpolation of edge energy (EA) against reference oxidation states
Phase fractions: (±7%)
| Phase | Fraction |
|---|---|
| Mn4+ | 0.916 |
| Mn3+ | 0.084 |
Fit basis (paper's reference spectra):
- MnO
- Mn2O3
- MnO2
Source evidence: Figure 2f and Section 3.2 (Page 8)
Key reasoning: XANES analysis reveals that most of the manganese in this oxygen-deficient perovskite is in the tetravalent state (Mn4+), with a smaller percentage of trivalent manganese (Mn3+). The average oxidation state is determined to be +3.916. This mixed valence state is characteristic of the complex charge compensation mechanism in the CaSrFe1-xCo1-xMn2xO6-δ system, where oxygen vacancies and the presence of multiple transition metals (Fe, Co, Mn) dictate the final oxidation states.
Reasoning source: Section 3.2, Page 8
Scoring Rubric (total: 100 pts)
| Q | Type | Max | Question | Reference Answer | Scoring Criteria |
|---|---|---|---|---|---|
| q1 | identification | 20 | What candidate reference spectra are needed to perform a linear combination fitting analysis of the Mn K-edge for this sample to determine its oxidation states? | The required reference spectra for analyzing the Mn K-edge of this sample are MnO, Mn2O3, and MnO2. These specific references are necessary because the solid-state synthesis of the CaSrFe0.7Co0.7Mn0.6O6-δ (x=0.30) perovskite in air at 1200 °C results in a mixed-valence state for manganese. The complex charge compensation mechanism, driven by oxygen vacancies and the presence of multiple transition metals (Fe, Co, Mn), dictates that manganese will not exist in a single oxidation state. Therefore, standards representing Mn2+ (MnO), Mn3+ (Mn2O3), and Mn4+ (MnO2) are needed to accurately interpolate the edge energy and determine the exact distribution of oxidation states. | Full points for identifying MnO2 (Mn4+) and Mn2O3 (Mn3+) as the primary references, and optionally MnO (Mn2+) to cover the full range of standard Mn oxidation states. |
| q2 | quantification | 40 | Estimate the phase fractions of the different Mn oxidation states in this CaSrFe0.7Co0.7Mn0.6O6-δ (x=0.30) sample. | The manganese in this sample consists of 91.6% Mn4+ and 8.4% Mn3+, yielding an average oxidation state of +3.916 (with a 7% uncertainty). These specific fractions arise from the high-temperature (1200 °C) solid-state synthesis in air, which stabilizes a highly oxidized but oxygen-deficient perovskite structure. In the CaSrFe0.7Co0.7Mn0.6O6-δ system, the presence of multiple transition metals (Fe, Co, Mn) and oxygen vacancies creates a complex charge compensation mechanism. This mechanism predominantly drives manganese to a tetravalent state (Mn4+) to balance the overall charge of the lattice, leaving only a small fraction in the trivalent state (Mn3+). | Full points for estimating ~90-92% Mn4+ and ~8-10% Mn3+. Partial points for correctly identifying that Mn4+ is the heavily dominant species with a minor Mn3+ component. |
| q3 | reasoning | 40 | Explain why manganese adopts this specific mixture of oxidation states in this material, rather than a single pure oxidation state. | Manganese adopts a mixed valence state of predominantly Mn4+ (91.6%) with a smaller fraction of Mn3+ (8.4%) due to the complex charge compensation mechanism inherent to the CaSrFe1-xCo1-xMn2xO6-δ system. Synthesizing this material via solid-state methods at 1200 °C in air produces an oxygen-deficient perovskite structure. The incorporation of multiple transition metals (Fe, Co, and Mn) alongside oxygen vacancies forces the system to balance its overall electrostatic charge. Consequently, rather than adopting a single pure oxidation state, manganese primarily oxidizes to Mn4+ while retaining a small fraction of Mn3+ to accommodate the specific stoichiometric and structural demands of the x=0.30 composition. | Full points for explaining that the material is an oxygen-deficient perovskite containing multiple transition metals (Fe, Co, Mn), which requires complex charge compensation resulting in a predominantly tetravalent Mn state with a minor trivalent fraction. |
Review
Effect of Support on Oxygen Reduction Reaction Activity of Supported Iron Porphyrins
APS
Catalyst
Qi Hua et al.
DOI: 10.1021/acscatal.1c04871
1 scenario
▶
#716
FeTMPPCl
Fe K
▶
LLM Prompt
Sample Information
Material: FeTMPPCl
Support: Vulcan XC72
Sample-Specific Conditions
- support: XC72
- Fe porphyrin supported on Vulcan XC72 carbon
Measurement
We plan to measure the Fe K XANES spectrum of this sample.
Questions
Based on all the information above:
1. Based on the sample conditions (Fe porphyrin supported on Vulcan XC72 via ball-milling), what is the expected dominant Fe coordination geometry, and why?
2. Describe the expected Fe K-edge XANES spectral features for this sample, specifically the main edge position and any notable pre-edge features.
3. What is the physical origin of the pre-edge feature expected at 7113 eV in this sample, and what does it indicate about the local Fe environment?
Ground Truth
Material: FeTMPPCl supported on Vulcan XC72
Measurement: Fe K-edge, transmission mode, beamline 9-BM at Advanced Photon Source
Fit method: Qualitative comparison
Phase fractions:
| Phase | Fraction |
|---|---|
| FeTMPPCl (square pyramidal) | 1.0 |
Fit basis (paper's reference spectra):
- FeTMPPCl alone
- Fe3O4 reference spectrum
Source evidence: Figure 4a, Section 3.3.3, Page 16
Key reasoning: The XANES spectrum of FeTMPPCl-XC72 is nearly identical to unsupported FeTMPPCl in both peak shape and position. The presence of the 1s→3d pre-edge feature at 7113 eV is consistent with square pyramidal (C4v) symmetry, indicating that the molecular structure of the Fe porphyrin remains intact and the coordination environment does not change upon adsorption onto the XC72 support.
Reasoning source: Section 3.3.3 XANES and EXAFS, Pages 16-17
Scoring Rubric (total: 100 pts)
| Q | Type | Max | Question | Reference Answer | Scoring Criteria |
|---|---|---|---|---|---|
| q1 | reasoning | 30 | Based on the sample conditions (Fe porphyrin supported on Vulcan XC72 via ball-milling), what is the expected dominant Fe coordination geometry, and why? | The expected dominant Fe coordination geometry is square pyramidal (C4v symmetry), representing 100% of the Fe species. This geometry arises because the molecular structure of the FeTMPPCl complex remains completely intact upon adsorption onto the Vulcan XC72 carbon support. The interaction with the XC72 support does not alter the local coordination environment of the Fe porphyrin. Consequently, the sample retains the exact square pyramidal geometry characteristic of the unsupported FeTMPPCl precursor. | The answer must identify the square pyramidal (C4v) geometry and state that the intact FeTMPPCl molecular structure is preserved upon adsorption onto the carbon support without altering the Fe coordination environment. |
| q2 | spectral | 35 | Describe the expected Fe K-edge XANES spectral features for this sample, specifically the main edge position and any notable pre-edge features. | The expected Fe K-edge XANES spectrum features a main absorption edge positioned at 7124 eV and a distinct, weak pre-edge peak at 7113 eV. The overall peak shape and position are nearly identical to those of the unsupported FeTMPPCl reference. These spectral features arise because the FeTMPPCl molecule remains structurally intact after being supported on the Vulcan XC72 carbon. Specifically, the pre-edge feature at 7113 eV is produced by the square pyramidal (C4v) geometry of the intact Fe3+ porphyrin complex, demonstrating that the carbon support does not alter the original Fe coordination environment. | The answer must correctly state the main edge energy at 7124 eV and identify the presence of a pre-edge feature at 7113 eV. |
| q3 | reasoning | 35 | What is the physical origin of the pre-edge feature expected at 7113 eV in this sample, and what does it indicate about the local Fe environment? | The pre-edge feature at 7113 eV originates from a 1s→3d electronic transition. This transition indicates a deviation from central symmetry in the local Fe environment, which is characteristic of a square pyramidal (C4v) geometry. Because the FeTMPPCl is supported on Vulcan XC72 carbon without altering its coordination environment, the intact Fe3+ porphyrin complex retains this specific asymmetric structure. Therefore, the presence of this pre-edge feature confirms that the molecular structure of the Fe porphyrin remains completely intact upon adsorption onto the carbon support. | The answer must identify the feature as a 1s→3d transition and explain that it indicates a deviation from central symmetry, specifically corresponding to the square pyramidal (C4v) symmetry of the Fe site. |
Review
Activation of Lattice and Adatom Oxygen by Highly Stable Ceria-Supported Cu Single Atoms
BNL-NSLS-II-8-ID
Catalyst
Carlos E. García-Vargas et al.
DOI: 10.1021/acscatal.2c04001
1 scenario
▶
#717
Cu/CeO2
Cu K
▶
LLM Prompt
Sample Information
Material: Cu/CeO2
Support: CeO2
Sample-Specific Conditions
- Cu loading: 2 wt%
- Ceria-supported Cu single atom catalyst
Measurement
We plan to measure the Cu K XANES spectrum of this sample.
Questions
Based on all the information above:
1. Based on the sample conditions (2 wt% Cu on CeO2, calcined at 800 °C), what is the expected dominant Cu structural motif and its oxidation state?
2. Explain the physical reasoning for why this specific structural motif is exclusively formed under these conditions, and describe what would happen to the Cu species if the loading was increased beyond 2 wt%.
3. What standard reference spectra should be included in the analysis to verify the structural assignment and rule out the formation of metallic or bulk oxide phases?
Ground Truth
Material: Cu/CeO2
Measurement: Cu K-edge XAS
Fit method: EXAFS fitting
Phase fractions:
| Phase | Fraction |
|---|---|
| (CuO)1 single atoms | 1.0 |
Fit basis (paper's reference spectra):
- Cu foil
- Cu2O
- CuO
Source evidence: Page 3, text and Fig. 1C
Key reasoning: At 2 wt% Cu loading and calcination at 800 °C, Cu atoms are strongly anchored to step defects on the ceria surface via Cu-O-Ce bonds. This strong interaction prevents diffusion and sintering, resulting in the exclusive presence of (CuO)1 single atom centers. Higher loadings (e.g., >2 wt%) provide an exothermic driving force for agglomeration into a spectator CuO phase.
Reasoning source: Pages 3-4, Main Text
Scoring Rubric (total: 100 pts)
| Q | Type | Max | Question | Reference Answer | Scoring Criteria |
|---|---|---|---|---|---|
| q1 | identification | 30 | Based on the sample conditions (2 wt% Cu on CeO2, calcined at 800 °C), what is the expected dominant Cu structural motif and its oxidation state? | The expected dominant structural motif is (CuO)1 single atoms on CeO2, with an oxidation state of 2+. This specific motif arises because, at the 2 wt% Cu loading and 800 °C calcination conditions, Cu atoms become strongly anchored to step defects on the ceria surface via Cu-O-Ce bonds. This strong interaction prevents diffusion and sintering during synthesis. As a result, the copper species exist exclusively as isolated (CuO)1 single atom centers (a fraction of 1.0) rather than forming larger clusters or bulk oxides. | Full points for identifying (CuO)1 single atoms (or atomically dispersed Cu) and an oxidation state of 2+. |
| q2 | reasoning | 40 | Explain the physical reasoning for why this specific structural motif is exclusively formed under these conditions, and describe what would happen to the Cu species if the loading was increased beyond 2 wt%. | Under the specified conditions of 2 wt% Cu loading and 800 °C calcination, the exclusive formation of (CuO)1 single atoms is driven by strong anchoring to step defects on the ceria surface via Cu-O-Ce bonds. This strong interaction physically prevents the diffusion and sintering of the Cu atoms, stabilizing them as isolated centers. If the Cu loading is increased beyond 2 wt%, the system provides an exothermic driving force for agglomeration. Consequently, the excess copper would overcome these anchoring sites and agglomerate into a spectator bulk CuO phase. | Full points for explaining that Cu atoms are anchored to step defects via strong Cu-O-Ce bonds preventing sintering, and that higher loadings lead to agglomeration into a spectator CuO phase. |
| q3 | identification | 30 | What standard reference spectra should be included in the analysis to verify the structural assignment and rule out the formation of metallic or bulk oxide phases? | To verify the structural assignment and rule out metallic or bulk oxide phases, the fit basis should include Cu foil, Cu2O, and CuO standard reference spectra. These references are required because the sample conditions (2 wt% Cu loading, 800 °C calcination) are intended to completely prevent sintering and form exclusively (CuO)1 single atoms. By using these standards, EXAFS fitting can confirm the absence of bulk or highly dispersed CuO and metallic Cu phases. This comparison proves that the sample exhibits only the Cu-O and Cu-Ce contributions expected from Cu atoms strongly anchored to ceria step defects. | Full points for listing Cu foil, Cu2O, and CuO as necessary references. |
Review
Atomic Structural Origin of the High Methanol Selectivity over In2O3–Metal Interfaces: Metal–Support Interactions and the Formation of a InOx Overlayer in Ru/In2O3 Catalysts during CO2 Hydrogenation
BNL-NSLS-II-8-ID
Catalyst
Ning Rui et al.
DOI: 10.1021/acscatal.2c06029
3 scenarios
▶
#718
Ru/CeO2
Ru K-edge
▶
LLM Prompt
Sample Information
Material: Ru/CeO2
Support: CeO2
Reaction Conditions: Room temperature, pristine
Sample-Specific Conditions
- Catalyst support and state: CeO2, pristine
- As-prepared Ru supported on CeO2 catalyst
Measurement
We plan to measure the Ru K-edge XANES spectrum of this sample.
Questions
Based on all the information above:
1. Based on the sample conditions (pristine, as-prepared Ru/CeO2), what is the expected dominant Ru phase, and what physical reasoning justifies this state?
2. What reference spectra are essential for analyzing the Ru K-edge XANES/EXAFS of this pristine sample and its subsequent reduction?
3. What distinguishing feature in the extended X-ray absorption fine structure (EXAFS) differentiates this pristine supported Ru/CeO2 catalyst from bulk RuO2?
Ground Truth
Material: Ru/CeO2
Measurement: in-situ Ru K-edge XANES and EXAFS in fluorescence mode at beamline 8-ID (NSLS-II)
Fit method: Qualitative comparison
Phase fractions: (±10%)
| Phase | Fraction |
|---|---|
| RuO2 | 1.0 |
Fit basis (paper's reference spectra):
- RuO2 standard
- Ru foil
Source evidence: Page 23, Section 3.5, Figure 5(b)
Key reasoning: For the pristine Ru/CeO2 sample, EXAFS features are very similar to those of the RuO2 standard, with only first-shell coordination with O (Ru-OI) observed. The absence of a Ru-Ru bond indicates high dispersion of the RuO2 overlayer on the CeO2 support.
Reasoning source: Section 3.5, Page 23
Scoring Rubric (total: 100 pts)
| Q | Type | Max | Question | Reference Answer | Scoring Criteria |
|---|---|---|---|---|---|
| q1 | reasoning | 35 | Based on the sample conditions (pristine, as-prepared Ru/CeO2), what is the expected dominant Ru phase, and what physical reasoning justifies this state? | The expected dominant Ru phase for the pristine, as-prepared Ru/CeO2 catalyst at room temperature is RuO2, comprising a fraction of 1.0. This fully oxidized state is expected because the sample is in its pristine, as-prepared condition prior to any reaction or reduction treatments. The physical reasoning for this specific state is that the Ru species forms a highly dispersed RuO2 overlayer on the CeO2 support. This high dispersion is structurally confirmed by the presence of only first-shell coordination with oxygen (Ru-OI) and the complete absence of Ru-Ru bonds. | Full points for identifying RuO2 as the dominant phase and explaining that the as-prepared state consists of highly dispersed RuO2 overlayers (indicated by Ru-O coordination and lack of Ru-Ru bonds). |
| q2 | identification | 30 | What reference spectra are essential for analyzing the Ru K-edge XANES/EXAFS of this pristine sample and its subsequent reduction? | The essential reference spectra for analyzing this sample are a RuO2 standard and a metallic Ru foil. These specific references are required because the pristine, as-prepared Ru/CeO2 catalyst at room temperature exists entirely as a highly dispersed RuO2 phase. The RuO2 standard is necessary to model this initial fully oxidized state, which exhibits only first-shell Ru-O coordination. Meanwhile, the Ru foil reference is needed to track metallic Ru formation during any subsequent reduction, contrasting with the initial absence of Ru-Ru bonds in the highly dispersed pristine state. | Full points for mentioning the RuO2 standard (to represent the pristine oxidized state) and Ru foil/metallic Ru (to represent the reduced state). |
| q3 | spectral | 35 | What distinguishing feature in the extended X-ray absorption fine structure (EXAFS) differentiates this pristine supported Ru/CeO2 catalyst from bulk RuO2? | The distinguishing EXAFS feature of the pristine Ru/CeO2 catalyst is the observation of only first-shell coordination with oxygen (Ru-OI) and a complete absence of Ru-Ru bonds. These spectral features arise directly from the sample conditions of the as-prepared Ru supported on CeO2 at room temperature. Because the Ru is deposited on the CeO2 support, it forms a highly dispersed RuO2 overlayer rather than large bulk crystals. This extreme dispersion on the support prevents the formation of the extended Ru-Ru scattering paths that would typically be present in bulk RuO2. | Full points for stating that only first-shell Ru-O coordination is observed and the absence of Ru-Ru bonds indicates high dispersion compared to bulk RuO2. |
Review
#719
Ru/CeO2
Ru K-edge
▶
LLM Prompt
Sample Information
Material: Ru/CeO2
Support: CeO2
Reaction Conditions: CO2 + H2, 300 °C
Sample-Specific Conditions
- Reaction conditions: CO2+H2 at 300 °C
- Ru/CeO2 catalyst under CO2 hydrogenation reaction conditions
Measurement
We plan to measure the Ru K-edge XANES spectrum of this sample.
Questions
Based on all the information above:
1. Based on the reaction conditions (CO2 + H2 at 300 °C), what is the expected dominant Ru phase in the Ru/CeO2 catalyst, and what reference spectra would be most appropriate to confirm this?
2. Describe the expected spectral shape and key features of the Ru K-edge XANES spectrum for this sample. Include the physical origin of the features if applicable.
3. Explain the physical reasoning for why the Ru/CeO2 catalyst exhibits this specific phase composition under CO2 hydrogenation conditions at 300 °C.
Ground Truth
Material: Ru/CeO2
Measurement: in-situ Ru K-edge XANES at beamline 8-ID (ISS) of NSLS-II
Fit method: Qualitative comparison to reference spectra
Phase fractions: (±10%)
| Phase | Fraction |
|---|---|
| Metallic Ru | 1.0 |
Fit basis (paper's reference spectra):
- Ru foil
- RuO2
Source evidence: Figure 5a, Section 3.5, Page 22
Key reasoning: Under reaction conditions (CO2 + H2 at 300 °C), the absorption edge of the Ru/CeO2 catalyst is exactly the same as the metallic Ru foil. In the XANES region, the spectra of Ru/CeO2 aligns very well with the Ru foil, indicating that Ru in Ru/CeO2 is pure metallic.
Reasoning source: Section 3.5, Page 22
Scoring Rubric (total: 100 pts)
| Q | Type | Max | Question | Reference Answer | Scoring Criteria |
|---|---|---|---|---|---|
| q1 | identification | 30 | Based on the reaction conditions (CO2 + H2 at 300 °C), what is the expected dominant Ru phase in the Ru/CeO2 catalyst, and what reference spectra would be most appropriate to confirm this? | The expected dominant Ru phase in the Ru/CeO2 catalyst is pure metallic Ru (fraction of 1.0). To confirm this, the most appropriate reference spectra for qualitative comparison are Ru foil and RuO2. This pure metallic phase is expected because the specific reaction conditions of CO2 and H2 at 300 °C drive the complete reduction of the ruthenium species. Consequently, the absorption edge and XANES region of the sample align exactly with the metallic Ru foil, indicating the absence of oxidized Ru species. | Full points for identifying Metallic Ru (or Ru0) as the dominant phase (fraction 1.0) and suggesting Ru foil (and optionally RuO2 for contrast) as reference spectra. |
| q2 | spectral | 40 | Describe the expected spectral shape and key features of the Ru K-edge XANES spectrum for this sample. Include the physical origin of the features if applicable. | The Ru K-edge XANES spectrum for this sample is expected to align perfectly with a metallic Ru foil reference, lacking the shift to higher energy typically seen for RuOx species. Key spectral features include an onset region (Feature I) and a distinct Feature III, which originates from the multiple scattering of emitted photoelectrons colliding into heavy elements at the neighboring shells. These specific features appear because the CO2 + H2 reaction conditions at 300 °C completely reduce the Ru/CeO2 catalyst to pure metallic Ru0. The resulting spectral shape, dominated by this multiple scattering, serves as direct evidence for the metallic state formed under these conditions. | Full points for describing the spectrum as aligning with metallic Ru foil, mentioning the broad plateau (1s to 5p transitions) and the multiple scattering feature indicative of metallic Ru0. |
| q3 | reasoning | 30 | Explain the physical reasoning for why the Ru/CeO2 catalyst exhibits this specific phase composition under CO2 hydrogenation conditions at 300 °C. | Under CO2 hydrogenation conditions (CO2 + H2 at 300 °C), the Ru/CeO2 catalyst exhibits a phase composition of 100% pure metallic Ru. This specific composition arises because the reaction environment of CO2 and H2 at 300 °C fully reduces the ruthenium species to an oxidation state of 0. Spectroscopically, this is confirmed because the absorption edge and the entire XANES region of the catalyst align exactly with a metallic Ru foil reference. The complete lack of higher energy shifts or specific shapes associated with RuOx species demonstrates that these reaction conditions maintain the Ru exclusively in its pure metallic phase. | Full points for explaining that under these reducing/reaction conditions, Ru is fully reduced to pure metallic Ru (oxidation state 0), as evidenced by the absorption edge and XANES region matching exactly with Ru foil. |
Review
#720
Ru/In2O3
In K-edge
▶
LLM Prompt
Sample Information
Material: Ru/In2O3
Support: In2O3
Reaction Conditions: 10% H2 in N2, room temperature
Sample-Specific Conditions
- Reaction conditions: H2 at RT
- Ru/In2O3 catalyst exposed to H2 at room temperature
Measurement
We plan to measure the In K-edge XANES spectrum of this sample.
Questions
Based on all the information above:
1. Based on the reaction conditions (10% H2 at room temperature), what is the dominant bulk phase of the indium support in the Ru/In2O3 catalyst?
2. What is the expected In K-edge position (in eV) for this sample under these conditions, and what does this indicate about the bulk oxidation state?
Ground Truth
Material: Ru/In2O3
Measurement: In K-edge in-situ XANES, fluorescence mode, 8-ID beamline at NSLS-II
Fit method: Edge energy analysis (contour plot)
Phase fractions: (±10%)
| Phase | Fraction |
|---|---|
| In2O3 | 1.0 |
Fit basis (paper's reference spectra):
- In2O3
Source evidence: Page 15, Section 3.2, Figure 2(e)
Key reasoning: In-situ XANES is a bulk-sensitive technique. Under 10% H2 at room temperature, the In K-edge energy stays around 27939.5 eV, showing no bulk reduction of the In2O3 support. While surface-sensitive techniques (like AP-XPS) show partial reduction to In2O3-x at the surface, the bulk remains In2O3.
Reasoning source: Section 3.2, Page 15
Scoring Rubric (total: 100 pts)
| Q | Type | Max | Question | Reference Answer | Scoring Criteria |
|---|---|---|---|---|---|
| q1 | identification | 46 | Based on the reaction conditions (10% H2 at room temperature), what is the dominant bulk phase of the indium support in the Ru/In2O3 catalyst? | The dominant bulk phase of the indium support in the Ru/In2O3 catalyst is 100% In2O3. Under the specific reaction conditions of 10% H2 at room temperature, the mild environment is insufficient to drive bulk reduction of the support. Because in-situ XANES is a bulk-sensitive technique, it detects only this unreduced In2O3 phase. While surface-sensitive techniques like AP-XPS may show partial reduction to In2O3-x at the surface under these conditions, the bulk material remains entirely In2O3. | Full credit for identifying In2O3 as the dominant bulk phase (fraction 1.0). |
| q2 | spectral | 54 | What is the expected In K-edge position (in eV) for this sample under these conditions, and what does this indicate about the bulk oxidation state? | The expected In K-edge position for this sample is approximately 27939.5 eV, which indicates a stable bulk oxidation state of 3+. Under the mild reaction conditions of 10% H2 at room temperature, the environment is not reducing enough to alter the bulk structure of the In2O3 support. If bulk reduction to reduced indium species or Ru-In alloys had occurred, the edge position would shift to lower energies. Because XANES is a bulk-sensitive technique and the bulk remains unreduced at room temperature, the spectral edge position remains constant at 27939.5 eV. | Full credit for stating the edge position is ~27939.5 eV and indicating that this corresponds to unreduced bulk In2O3 (In3+). |
Review
Biphasic Janus Particles Explain Self-Healing in Pt–Pd Diesel Oxidation Catalysts
BNL-NSLS-II-8-ID
Catalyst
Stephen Porter et al.
DOI: 10.1021/acscatal.3c00360
4 scenarios
▶
#721
Pd/Al2O3
Pd K-edge
▶
LLM Prompt
Sample Information
Material: Pd/Al2O3
Support: La-Al2O3
Sample-Specific Conditions
- composition: Pd only
- Monometallic Pd catalyst calcined in air
Measurement
We plan to measure the Pd K-edge XANES spectrum of this sample.
Questions
Based on all the information above:
1. Based on the sample conditions (monometallic Pd on alumina, calcined in air at 500°C), what is the expected dominant Pd phase and oxidation state, and what physical reasoning justifies this?
2. If you were to perform Linear Combination Fitting (LCF) on the Pd K-edge XANES spectrum of this sample to quantify its speciation, what specific reference spectra would be necessary to include in your basis set?
3. Describe the expected spectral shape of the Pd K-edge XANES for this sample. Specifically, how would its edge position and white line intensity compare to a metallic Pd foil reference?
Ground Truth
Material: 3 wt% Pd/Al2O3
Measurement: Pd K-edge XANES, fluorescence mode, BNL NSLS-II 8-ID ISS beamline
Fit method: Linear combination (LC) fitting
Phase fractions:
| Phase | Fraction |
|---|---|
| PdO | 1.0 |
Fit basis (paper's reference spectra):
- Pd foil (Pd0 reference)
- PdO (Pd2+ reference)
Source evidence: Page 13, Section 3.1; Figure 2b
Key reasoning: Calcination in air at 500°C provides an oxidizing environment that fully oxidizes the monometallic Pd nanoparticles to PdO. XANES LC fitting yields that the sample is completely Pd2+. This is corroborated by EXAFS analysis, which shows a 4-fold Pd-O first shell coordination at 2.00 Å, characteristic of the PdO phase.
Reasoning source: Page 13-14, Section 3.1
Scoring Rubric (total: 101 pts)
| Q | Type | Max | Question | Reference Answer | Scoring Criteria |
|---|---|---|---|---|---|
| q1 | reasoning | 38 | Based on the sample conditions (monometallic Pd on alumina, calcined in air at 500°C), what is the expected dominant Pd phase and oxidation state, and what physical reasoning justifies this? | The expected dominant phase is PdO, corresponding to a fully oxidized Pd2+ oxidation state. This occurs because calcination in air at 500°C provides a strong oxidizing environment. Under these conditions, the monometallic Pd nanoparticles on the La-Al2O3 support undergo complete oxidation. This structural conclusion is further corroborated by EXAFS analysis, which shows a 4-fold Pd-O first shell coordination at 2.00 Å characteristic of the PdO phase. | Full credit for identifying PdO / Pd2+ as the sole/dominant phase and explaining that calcination in air at 500°C fully oxidizes the monometallic Pd nanoparticles. |
| q2 | identification | 25 | If you were to perform Linear Combination Fitting (LCF) on the Pd K-edge XANES spectrum of this sample to quantify its speciation, what specific reference spectra would be necessary to include in your basis set? | To perform Linear Combination (LC) fitting on this sample, the necessary reference spectra in the basis set are Pd foil (as a Pd0 reference) and PdO (as a Pd2+ reference). These specific references are chosen to evaluate the oxidation state driven by the sample's thermal treatment. Because the monometallic Pd catalyst was calcined in air at 500°C, the strong oxidizing environment fully converts the Pd nanoparticles to PdO. As a result, the LC fitting yields a fraction of 1.0 for PdO, confirming the sample is completely oxidized to Pd2+ with no remaining metallic Pd0. | Full credit for identifying the need for a Pd0 reference (e.g., Pd foil) and a Pd2+ reference (e.g., bulk PdO). |
| q3 | spectral | 38 | Describe the expected spectral shape of the Pd K-edge XANES for this sample. Specifically, how would its edge position and white line intensity compare to a metallic Pd foil reference? | The Pd K-edge XANES spectrum will exhibit a higher edge energy (~24350 eV) compared to a metallic Pd foil reference and will lack any metallic Pd0 scattering features. Additionally, it will display a prominent white line peak at approximately 24370 eV with a normalized intensity of ~1.1. These specific spectral features emerge because the sample was calcined in air at 500°C, providing an oxidizing environment that fully converts the monometallic Pd nanoparticles to PdO. This complete oxidation to a Pd2+ state inherently produces the strong white line intensity and shifted edge position characteristic of oxidized palladium. | Full credit for stating the spectrum will have a higher edge energy than Pd foil and exhibit a strong/prominent white line peak characteristic of oxidized Pd2+. |
Review
#722
Pt-Pd/Al2O3
Pd K-edge
▶
LLM Prompt
Sample Information
Material: Pt-Pd/Al2O3
Support: La-Al2O3
Sample-Specific Conditions
- treatment: aged at 800°C
- Bimetallic Pt-Pd catalyst aged in air
Measurement
We plan to measure the Pd K-edge XANES spectrum of this sample.
Questions
Based on all the information above:
1. What candidate reference spectra are needed to perform Linear Combination Fitting (LCF) on the Pd K-edge XANES of this bimetallic Pt-Pd catalyst aged at 800°C in air?
2. Based on the aging conditions (800°C in air) and the bimetallic nature of the sample, estimate the phase fractions of the Pd species present.
3. Explain the physical reasoning for why a portion of the Pd remains metallic in this sample despite the harsh oxidizing conditions (800°C in air) that would normally fully oxidize monometallic Pd.
Ground Truth
Material: Pt-Pd/Al2O3
Measurement: Pd K-edge XANES, fluorescence mode, BNL NSLS-II 8-ID ISS beamline
Fit method: Linear combination (LC) fitting
Phase fractions:
| Phase | Fraction |
|---|---|
| metallic_palladium | 0.15 |
| palladium_oxide | 0.85 |
Fit basis (paper's reference spectra):
- Pd foil (Pd0 reference)
- PdO (Pd2+ reference)
Source evidence: Page 13, Section 3.1 text; Figure 2b
Key reasoning: Aging at 800°C in air typically oxidizes Pd to PdO. However, in the bimetallic Pt-Pd catalyst, the high mobility of Pt and Pd leads to the formation of biphasic 'Janus' particles. The PdO phase traps mobile PtO2, while the presence of Pt allows a portion of the Pd to remain in the metallic state as a Pt-Pd alloy. This results in a mixture of predominantly oxidized Pd2+ (~85%) with a small proportion of metallic Pd0 (~15%).
Reasoning source: Page 13 (XANES results) and Pages 28-31 (Discussion of self-healing model)
Scoring Rubric (total: 100 pts)
| Q | Type | Max | Question | Reference Answer | Scoring Criteria |
|---|---|---|---|---|---|
| q1 | identification | 20 | What candidate reference spectra are needed to perform Linear Combination Fitting (LCF) on the Pd K-edge XANES of this bimetallic Pt-Pd catalyst aged at 800°C in air? | To perform Linear Combination Fitting (LCF) on the Pd K-edge XANES of this sample, the required reference spectra are Pd foil (a Pd0 reference) and PdO (a Pd2+ reference). These specific phases are expected because aging the catalyst at 800°C in air provides a harsh oxidizing environment that typically converts palladium to PdO. However, because this is a bimetallic Pt-Pd/Al2O3 catalyst, the high mobility of the metals at this temperature leads to the formation of biphasic 'Janus' particles. The presence of platinum allows a portion of the palladium to remain in the metallic state as a Pt-Pd alloy, necessitating both metallic and oxidized references to accurately model the spectrum. | Full credit for identifying both metallic Pd (Pd foil/Pd0) and palladium oxide (PdO/Pd2+) as the necessary reference spectra. |
| q2 | quantification | 40 | Based on the aging conditions (800°C in air) and the bimetallic nature of the sample, estimate the phase fractions of the Pd species present. | The estimated phase fractions for this sample are 85% palladium oxide (Pd2+) and 15% metallic palladium (Pd0). These specific values result from the aging conditions of 800°C in air, which predominantly oxidize the palladium to form the 85% PdO fraction. However, complete oxidation is prevented by the bimetallic nature of the Pt-Pd catalyst. At this elevated temperature, the high mobility of Pt and Pd leads to the formation of biphasic 'Janus' particles where the PdO phase traps mobile PtO2, while the presence of Pt stabilizes the remaining 15% of the palladium in the metallic state as a Pt-Pd alloy. | Full credit for estimating ~85% palladium oxide (Pd2+) and ~15% metallic palladium (Pd0). Partial credit if the dominant phase is correctly identified as PdO but the metallic fraction is missing or highly inaccurate. |
| q3 | reasoning | 40 | Explain the physical reasoning for why a portion of the Pd remains metallic in this sample despite the harsh oxidizing conditions (800°C in air) that would normally fully oxidize monometallic Pd. | While aging at 800°C in air typically fully oxidizes monometallic palladium to PdO, a portion of the Pd remains metallic here due to the bimetallic composition of the Pt-Pd/Al2O3 catalyst. At this high temperature, the high mobility of both Pt and Pd leads to the formation of biphasic 'Janus' particles. During this process, the oxidized PdO phase traps mobile PtO2. Concurrently, the presence of platinum interacts with the palladium, allowing a portion of the Pd to resist complete oxidation and remain stabilized in the metallic state as a Pt-Pd alloy. | Full credit for explaining that the presence of Pt in the bimetallic system allows some Pd to remain metallic (forming a Pt-Pd alloy) within biphasic 'Janus' particles, while the rest forms PdO which traps mobile Pt species. |
Review
#723
Pt/Al2O3
Pt L3-edge
▶
LLM Prompt
Sample Information
Material: Pt/Al2O3
Support: La-Al2O3
Sample-Specific Conditions
- composition: Pt only
- Monometallic Pt catalyst calcined in air
Measurement
We plan to measure the Pt L3-edge XANES spectrum of this sample.
Questions
Based on all the information above:
1. Given the sample conditions (monometallic Pt on Al2O3 calcined in air at 450°C), what is the expected dominant oxidation state and phase of the platinum? Provide the physical reasoning for this assignment.
Ground Truth
Material: Pt/Al2O3
Measurement: Pt L3-edge XANES in fluorescence mode at BNL NSLS-II 8-ID ISS beamline
Fit method: qualitative comparison
Phase fractions:
| Phase | Fraction |
|---|---|
| platinum_dioxide | 1.0 |
Fit basis (paper's reference spectra):
- Pt foil (Pt0)
- Pt4+ oxide
Source evidence: Figure 2a and text on page 13
Key reasoning: The XANES spectrum of the 3 wt% Pt/Al2O3 sample calcined at 450°C exhibits a high white line intensity (normalized absorption > 1) that is characteristic of Pt4+ oxide. This assignment is corroborated by EXAFS fitting, which shows 5 to 6 Pt-O coordination at a bond distance of 2.00 Å (corresponding to Pt4+), and XRD, which showed no metallic Pt peak.
Reasoning source: Section 3.1, Page 13
Scoring Rubric (total: 100 pts)
| Q | Type | Max | Question | Reference Answer | Scoring Criteria |
|---|---|---|---|---|---|
| q1 | reasoning | 100 | Given the sample conditions (monometallic Pt on Al2O3 calcined in air at 450°C), what is the expected dominant oxidation state and phase of the platinum? Provide the physical reasoning for this assignment. | Given the calcination of the monometallic Pt/Al2O3 catalyst in air at 450°C, the expected dominant oxidation state is Pt4+, present entirely as a PtO2 (platinum dioxide) phase. This fully oxidized state arises because the high-temperature air treatment provides a strong oxidizing environment, converting all platinum into Pt4+ oxide. Spectroscopically, this is confirmed by a very intense XANES white line (normalized absorption ~2.3) and a higher edge energy compared to Pt2+ or Pt0. Additionally, EXAFS fitting corroborates this assignment by revealing 5 to 6 Pt-O bonds at a distance of 2.00 Å, while XRD shows a complete absence of metallic Pt. | Full credit requires identifying Pt4+ / PtO2 as the dominant phase and explaining that calcination in air fully oxidizes the Pt, which is typically supported by high Pt-O coordination (5-6) and the absence of metallic Pt features. |
Review
#724
Pt-Pd/Al2O3
Pt L3-edge
▶
LLM Prompt
Sample Information
Material: Pt-Pd/Al2O3
Support: La-Al2O3
Sample-Specific Conditions
- treatment: aged at 800°C
- Bimetallic Pt-Pd catalyst aged in air
Measurement
We plan to measure the Pt L3-edge XANES spectrum of this sample.
Questions
Based on all the information above:
1. Based on the aging conditions (800°C in air), what is the expected dominant oxidation state of Pt in the bimetallic Pt-Pd/Al2O3 catalyst, and how is this justified by the XANES data?
2. Describe the expected spectral shape of the Pt L3-edge XANES for this sample, specifically focusing on the white line intensity compared to fully oxidized Pt species.
3. If you were to perform Linear Combination Fitting (LCF) on the Pt L3-edge XANES spectrum of this sample, what is the most critical reference spectrum to include in your basis set?
Ground Truth
Material: Pt-Pd/Al2O3
Measurement: Pt LIII edge XANES, fluorescence mode, NSLS-II 8-ID ISS beamline
Fit method: qualitative comparison (LCF not explicitly reported for Pt)
Phase fractions:
| Phase | Fraction |
|---|---|
| metallic_Pt0 | 0.5 |
| oxidized_Pt | 0.5 |
Fit basis (paper's reference spectra):
- Pt foil
Source evidence: Page 13, Figure 2a
Key reasoning: The XANES of the PtPd/Al2O3 sample aged at 800°C in air exhibits a white line intensity that is very similar to the metallic Pt foil reference. This indicates that the Pt in the sample is predominantly metallic Pt0, which correlates with the formation of a Pt-Pd solid solution phase.
Reasoning source: Section 3.1, Pages 13-14
Scoring Rubric (total: 100 pts)
| Q | Type | Max | Question | Reference Answer | Scoring Criteria |
|---|---|---|---|---|---|
| q1 | reasoning | 40 | Based on the aging conditions (800°C in air), what is the expected dominant oxidation state of Pt in the bimetallic Pt-Pd/Al2O3 catalyst, and how is this justified by the XANES data? | The expected dominant oxidation state of Pt in this sample is 0 (metallic Pt0). Despite the harsh aging conditions of 800°C in air, the bimetallic composition of the Pt-Pd/Al2O3 catalyst promotes the formation of a Pt-Pd solid solution phase. This alloying mechanism stabilizes the platinum in a metallic state rather than allowing it to fully oxidize. The XANES data justifies this by exhibiting a low white line intensity that is very similar to a metallic Pt foil reference, representing a significant loss of intensity compared to fully oxidized Pt4+ or Pt2+ species. While quantitative fractions indicate a 50/50 split between metallic (0.5) and oxidized (0.5) Pt, the predominant spectral features confirm the strong presence of the metallic Pt-Pd alloy. | Must state that the dominant oxidation state is 0 (metallic Pt) and justify this by noting that the XANES white line intensity is low and resembles a metallic Pt foil reference. |
| q2 | spectral | 30 | Describe the expected spectral shape of the Pt L3-edge XANES for this sample, specifically focusing on the white line intensity compared to fully oxidized Pt species. | The Pt L3-edge XANES spectrum for this sample is expected to exhibit a low white line intensity, closely resembling the spectral shape of a metallic Pt foil reference. This distinct spectral feature arises because aging the bimetallic Pt-Pd/Al2O3 catalyst at 800°C in air drives the formation of a Pt-Pd solid solution phase. This alloying mechanism stabilizes the platinum as metallic Pt0, preventing complete oxidation despite the high-temperature air environment. As a result, the spectrum shows a significant loss of white line intensity compared to calcined samples, easily distinguishing it from the much higher white line intensities characteristic of fully oxidized Pt4+ and Pt2+ species. | Must state that the white line intensity is significantly reduced compared to fully oxidized Pt (Pt4+ or Pt2+) and closely matches the intensity of metallic Pt foil. |
| q3 | identification | 30 | If you were to perform Linear Combination Fitting (LCF) on the Pt L3-edge XANES spectrum of this sample, what is the most critical reference spectrum to include in your basis set? | The most critical reference spectrum to include in the LCF basis set is metallic Pt foil. This reference is essential because aging the bimetallic Pt-Pd/Al2O3 catalyst at 800°C in air induces the formation of a Pt-Pd solid solution phase. This alloying mechanism stabilizes the platinum predominantly in a metallic state (Pt0) despite the highly oxidizing high-temperature conditions. Consequently, the sample yields a 0.5 fraction of metallic Pt0 alongside oxidized species, and its spectrum exhibits a low white line intensity that closely matches the Pt foil reference. | Must identify metallic Pt foil (or metallic Pt0) as the critical reference spectrum. |
Review
Contrasting Capability of Single Atom Palladium for Thermocatalytic versus Electrocatalytic Nitrate Reduction Reaction
BNL-NSLS-II-8-ID
Catalyst
Xuanhao Wu et al.
DOI: 10.1021/acscatal.3c01285
1 scenario
▶
#725
Pd/Cu(100:1)
Pd K
▶
LLM Prompt
Sample Information
Material: Pd/Cu(100:1)
Support: mesoporous silica
Sample-Specific Conditions
- Pd:Cu ratio: 100:1
- Pd-rich bimetallic nanoparticle catalyst
Measurement
We plan to measure the Pd K XANES spectrum of this sample.
Questions
Based on all the information above:
1. Based on the sample conditions (Pd/Cu ratio of 100:1 prepared via incipient wetness co-impregnation), what is the expected dominant oxidation state and phase of Pd, and what reference spectrum would be most appropriate for comparison?
2. Describe the expected spectral shape of the Pd K-edge XANES for this Pd/Cu(100:1) sample, specifically regarding its white line intensity and edge energy.
Ground Truth
Material: Pd/Cu(100:1) nanoalloy
Measurement: Pd K-edge XANES, ex-situ, ISS beamline (8-ID) of NSLS-II
Fit method: Qualitative comparison
Phase fractions: (±10%)
| Phase | Fraction |
|---|---|
| metallic_palladium | 1.0 |
Fit basis (paper's reference spectra):
- Pd foil
Source evidence: Page 6, Results and Discussion; Figure S6 (referenced in text)
Key reasoning: The Pd K-edge XANES of the Pd/Cu(100:1) catalyst exhibited white line intensities and edge energies close to that of the Pd foil reference, suggesting that the Pd atoms were well reduced to be metallic. The slight shift to lower edge energies observed with increasing Cu wt% indicates alloying, as electron transfer from Cu (electronegativity=1.9) to Pd (electronegativity=2.2) makes Pd more electron rich.
Reasoning source: Page 6, Results and Discussion (Structural characterization of Pd/Cu(x:y) catalysts)
Scoring Rubric (total: 100 pts)
| Q | Type | Max | Question | Reference Answer | Scoring Criteria |
|---|---|---|---|---|---|
| q1 | identification | 50 | Based on the sample conditions (Pd/Cu ratio of 100:1 prepared via incipient wetness co-impregnation), what is the expected dominant oxidation state and phase of Pd, and what reference spectrum would be most appropriate for comparison? | The expected dominant oxidation state of Pd is 0, corresponding to a metallic palladium phase alloyed with trace copper. The most appropriate reference spectrum for comparison is a pure Pd foil. This metallic phase arises because the Pd atoms in the Pd/Cu(100:1) bimetallic nanoparticle catalyst are well reduced. Given the highly Pd-rich composition (100:1 ratio), the structure is overwhelmingly metallic palladium with a fraction of 1.0. However, the trace presence of Cu in the nanoalloy leads to electron transfer from the less electronegative Cu (1.9) to the more electronegative Pd (2.2), making the Pd atoms slightly more electron-rich than those in the pure reference foil. | Full credit for identifying metallic Pd (oxidation state 0) as the dominant phase and suggesting Pd foil as the primary reference. |
| q2 | spectral | 50 | Describe the expected spectral shape of the Pd K-edge XANES for this Pd/Cu(100:1) sample, specifically regarding its white line intensity and edge energy. | The Pd K-edge XANES spectrum is expected to exhibit a white line intensity and edge energy very close to that of a metallic Pd foil reference. A distinguishing feature of this spectrum is a slight shift to lower edge energies compared to pure Pd foil. These spectral features arise because the Pd atoms in the Pd/Cu(100:1) bimetallic nanoparticle catalyst are well reduced to a metallic state (oxidation state 0). The shift to lower edge energy is directly caused by the formation of the nanoalloy; electron transfer from the less electronegative Cu (1.9) to the more electronegative Pd (2.2) makes the Pd atoms more electron-rich. | Full credit for stating that the white line intensity and edge energy will be very close to that of a metallic Pd foil reference. |
Review
CO Oxidation on Ir1/TiO2: Resolving Ligand Dynamics and Elementary Reaction Steps
BNL-NSLS-II-8-ID
Catalyst
Coogan B. Thompson et al.
DOI: 10.1021/acscatal.3c01433
3 scenarios
▶
#726
Ir1/TiO2
Ir L3
▶
LLM Prompt
Sample Information
Material: Ir1/TiO2
Support: TiO2 (anatase)
Reaction Conditions: CO + O2 at 150 °C
Sample-Specific Conditions
- gas environment: CO + O2
- Ir single atoms on TiO2 under CO oxidation reaction conditions, identified as having an oxidation state of +3.0
Measurement
We plan to measure the Ir L3 XANES spectrum of this sample.
Questions
Based on all the information above:
1. Based on the reaction conditions (CO + O2 at 150 °C), what is the dominant Ir complex expected on the TiO2 support, and what is its formal oxidation state?
2. Explain the physical reasoning for why this specific Ir complex dominates under these reaction conditions.
3. Describe the expected relative white line intensity of this active state in the Ir L3-edge XANES spectrum compared to the catalyst exposed to pure CO and pure O2 at the same temperature.
Ground Truth
Material: Ir1/TiO2
Measurement: Ir-L3 edge HERFD-XANES, operando, SSRL beamline 6-2
Fit method: Oxidation state estimation via white line intensity
Phase fractions: (±10%)
| Phase | Fraction |
|---|---|
| Ir(CO)(OL)(O2)2 | 1.0 |
Fit basis (paper's reference spectra):
- Ir(CO)2(OL)(O) (reduced state in CO)
- Ir(CO)(OL)(O)2 (oxidized state in O2)
Source evidence: Page 13-14, Figure 3a
Key reasoning: Under CO + O2 reaction conditions at 150 °C, the catalyst exists in an active state. HERFD-XANES shows a distinct spectrum with a white line intensity corresponding to a formal charge of +3.0. This matches the DFT-calculated oxidation state of +3.06 for the Ir(CO)(OL)(O2)2 intermediate (state VII), which is dominant under conditions that lead to low CO order or high apparent activation energy.
Reasoning source: Page 13-14, Results and discussion (Isolation of Ir1 States)
Scoring Rubric (total: 100 pts)
| Q | Type | Max | Question | Reference Answer | Scoring Criteria |
|---|---|---|---|---|---|
| q1 | identification | 30 | Based on the reaction conditions (CO + O2 at 150 °C), what is the dominant Ir complex expected on the TiO2 support, and what is its formal oxidation state? | Under the CO + O2 reaction conditions at 150 °C, the dominant Ir complex on the TiO2 support is Ir(CO)(OL)(O2)2, which accounts for a fraction of 1.0. The formal oxidation state of this complex is +3.0. This specific phase is expected because the mixed gas environment drives the catalyst into an active state during CO oxidation. This environment stabilizes the Ir(CO)(OL)(O2)2 intermediate, which dominates under conditions leading to low CO order or high apparent activation energy. | Full points for identifying Ir(CO)(OL)(O2)2 (or a monocarbonyl with two O2 ligands/support oxygens) and an oxidation state of +3.0. |
| q2 | reasoning | 35 | Explain the physical reasoning for why this specific Ir complex dominates under these reaction conditions. | The Ir(CO)(OL)(O2)2 complex dominates under the CO + O2 reaction conditions at 150 °C because the catalyst enters an active state during the CO oxidation reaction. Under these specific mixed-gas conditions, the system favors an intermediate that leads to low CO order or high apparent activation energy. This active state corresponds to a formal charge of +3.0, which perfectly matches the DFT-calculated oxidation state of +3.06 for the Ir(CO)(OL)(O2)2 intermediate (state VII). Consequently, this complex forms exclusively (fraction of 1.0) rather than the fully reduced Ir(CO)2(OL)(O) state seen in pure CO or the fully oxidized Ir(CO)(OL)(O)2 state seen in pure O2. | Full points for explaining that under conditions leading to low CO order or high apparent activation energy (like 150 °C in CO+O2), this specific intermediate becomes the dominant active state in the catalytic cycle. |
| q3 | spectral | 35 | Describe the expected relative white line intensity of this active state in the Ir L3-edge XANES spectrum compared to the catalyst exposed to pure CO and pure O2 at the same temperature. | In the Ir L3-edge XANES spectrum, the active Ir(CO)(OL)(O2)2 state exhibits a strong white line peak at ~11218 eV with an intermediate intensity (~5.5-5.8 normalized absorption). This intensity is higher than that of the reduced state found in pure CO (+2.3 oxidation state) but lower than the fully oxidized state found in pure O2 (+3.3 oxidation state). This intermediate spectral feature arises directly from the sample conditions (CO + O2 at 150 °C), which stabilize the active intermediate with a formal oxidation state of +3.0. The distinct electronic properties of this +3.0 charge state dictate the intermediate white line intensity and the distinct spectral shape immediately following the white line. | Full points for stating the white line intensity is intermediate between the reduced state (in pure CO) and the fully oxidized state (in pure O2), corresponding to its +3.0 oxidation state. |
Review
#727
Ir1/TiO2
Ir L3
▶
LLM Prompt
Sample Information
Material: Ir1/TiO2
Support: TiO2 (anatase)
Reaction Conditions: O2 at 150 °C
Sample-Specific Conditions
- gas environment: O2
- Ir single atoms on TiO2 under O2, identified as having an oxidation state of +3.3
Measurement
We plan to measure the Ir L3 XANES spectrum of this sample.
Questions
Based on all the information above:
1. Based on the reaction conditions (O2 at 150 °C), what specific Ir complex is expected to dominate on the TiO2 support, and what is the physical reasoning for its formation?
2. Describe the expected spectral shape of the Ir L3-edge XANES for this sample, specifically focusing on the white line intensity and the corresponding oxidation state.
3. How would the XANES spectrum of this oxidized state in O2 differ from the active state (in CO + O2) and the reduced state (in CO) at the same temperature?
Ground Truth
Material: Ir1/TiO2
Measurement: Ir L3-edge in-situ HERFD-XANES at SSRL beamline 6-2
Fit method: White line intensity comparison with DFT-calculated oxidation states
Phase fractions: (±10%)
| Phase | Fraction |
|---|---|
| Ir(CO)(OL)(O)2 | 1.0 |
Fit basis (paper's reference spectra):
- Ir(CO)(OL)(O)2 (oxidized state)
- Ir(CO)(OL)(O2)2 (active state)
- Ir(CO)2(OL)(O) (reduced state)
Source evidence: Figure 3a, page 14
Key reasoning: Exposing the catalyst to O2 (no CO) at 150 °C leads to state I (Ir(CO)(OL)(O)2) being dominant since the CO oxidation reaction can no longer proceed after reaching this state. The HERFD-XANES spectrum shows a distinct state with the highest white line intensity, corresponding to a formal charge of +3.3, which is in remarkable agreement with the DFT-calculated oxidation state of +3.32 for this complex.
Reasoning source: Pages 13-14
Scoring Rubric (total: 100 pts)
| Q | Type | Max | Question | Reference Answer | Scoring Criteria |
|---|---|---|---|---|---|
| q1 | reasoning | 30 | Based on the reaction conditions (O2 at 150 °C), what specific Ir complex is expected to dominate on the TiO2 support, and what is the physical reasoning for its formation? | Under the reaction conditions of O2 at 150 °C, the Ir1/TiO2 catalyst is expected to be entirely dominated by the Ir(CO)(OL)(O)2 complex (1.0 fraction). This specific oxidized state forms because exposing the catalyst to an O2-only environment, with no CO present, means the CO oxidation reaction can no longer proceed. Without CO to continue the catalytic cycle, the system becomes trapped in this state. Consequently, the Ir single atoms reach a formal charge of +3.3, which is in remarkable agreement with the DFT-calculated oxidation state of +3.32 for the Ir(CO)(OL)(O)2 complex. | Award 15 points for identifying the Ir(CO)(OL)(O)2 complex (or a highly oxidized monocarbonyl species with multiple oxygen ligands). Award 15 points for explaining that in the absence of CO, the catalytic cycle stops, leaving the catalyst trapped in this oxidized state. |
| q2 | spectral | 35 | Describe the expected spectral shape of the Ir L3-edge XANES for this sample, specifically focusing on the white line intensity and the corresponding oxidation state. | The Ir L3-edge HERFD-XANES spectrum for this sample will exhibit a very intense white line peak at approximately 11218 eV with a normalized absorption intensity of ~6.0. This distinct spectral shape arises directly from the sample conditions (O2 at 150 °C), which halt the CO oxidation reaction and trap the Ir single atoms as the Ir(CO)(OL)(O)2 complex. Because the system is trapped in this O2-only environment, the Ir atoms achieve a highly oxidized formal charge of +3.3. This +3.3 oxidation state is the highest among the isolated states for this catalyst, which electronically manifests as the exceptionally high white line intensity observed in the spectrum. | Award 15 points for stating the spectrum will exhibit a very intense white line (normalized absorption ~6). Award 20 points for associating this high intensity with a highly oxidized state of approximately +3.3. |
| q3 | identification | 35 | How would the XANES spectrum of this oxidized state in O2 differ from the active state (in CO + O2) and the reduced state (in CO) at the same temperature? | The XANES spectrum of the oxidized state in O2 at 150 °C will display the highest white line intensity compared to both the active and reduced states. This occurs because the O2-only environment prevents the CO oxidation reaction from proceeding, trapping the Ir1/TiO2 catalyst as Ir(CO)(OL)(O)2 with a high oxidation state of +3.3. In contrast, the active state (Ir(CO)(OL)(O2)2) formed in a CO + O2 mixture has a lower oxidation state of +3.0, resulting in a correspondingly lower white line intensity. Finally, the reduced state (Ir(CO)2(OL)(O)) formed in a pure CO environment possesses the lowest oxidation state of +2.3, which would produce the lowest white line intensity among the three conditions. | Award 35 points for correctly stating that the oxidized state in O2 will have the highest white line intensity compared to both the active state (which has intermediate intensity) and the reduced state (which has the lowest intensity). |
Review
#728
Ir1/TiO2
Ir L3
▶
LLM Prompt
Sample Information
Material: Ir1/TiO2
Support: TiO2 (anatase)
Reaction Conditions: CO at 150 °C
Sample-Specific Conditions
- gas environment: CO
- Ir single atoms on TiO2 under CO, identified as having an oxidation state of +2.3
Measurement
We plan to measure the Ir L3 XANES spectrum of this sample.
Questions
Based on all the information above:
1. What specific Ir complex/phase dominates under these pure CO conditions at 150 °C, and what is its expected oxidation state based on the provided context?
2. Describe the expected relative white line intensity and edge position of this reduced state compared to the active (CO + O2) and oxidized (O2) states.
Ground Truth
Material: Ir1/TiO2
Measurement: Ir L3-edge in-situ HERFD-XANES at SSRL beamline 6-2
Fit method: Peak height analysis (white line intensity) for oxidation state estimation
Phase fractions: (±10%)
| Phase | Fraction |
|---|---|
| Ir(CO)2(OL)(O) | 1.0 |
Fit basis (paper's reference spectra):
- Ir(CO)(OL)(O)2 (oxidized state)
- Ir(CO)(OL)(O2)2 (active state)
- Ir(CO)2(OL)(O) (reduced state)
Source evidence: Page 13-14, Figure 3a
Key reasoning: Under a pure CO environment at 150 °C, the Ir single atoms are isolated in a dicarbonyl state. HERFD-XANES shows a distinct spectrum with a lower white line intensity corresponding to a formal charge of +2.3. This matches DFT calculations predicting the Ir(CO)2(OL)(O) intermediate (state IV) which has a calculated oxidation state of +2.26.
Reasoning source: Page 13-14, Results and discussion (Isolation of Ir1 States)
Scoring Rubric (total: 100 pts)
| Q | Type | Max | Question | Reference Answer | Scoring Criteria |
|---|---|---|---|---|---|
| q1 | identification | 46 | What specific Ir complex/phase dominates under these pure CO conditions at 150 °C, and what is its expected oxidation state based on the provided context? | Under pure CO conditions at 150 °C, the dominant phase is the Ir(CO)2(OL)(O) complex, which accounts for 100% of the Ir species. The expected oxidation state for this complex is +2.3. This specific phase arises because the pure CO environment at this temperature causes the Ir single atoms on the TiO2 support to isolate into a reduced dicarbonyl state. This structural assignment is supported by DFT calculations, which predict that the Ir(CO)2(OL)(O) intermediate has a calculated oxidation state of +2.26, closely matching the observed +2.3 formal charge. | Full points for identifying the Ir(CO)2(OL)(O) phase (or Ir dicarbonyl state) and stating the +2.3 oxidation state. |
| q2 | spectral | 54 | Describe the expected relative white line intensity and edge position of this reduced state compared to the active (CO + O2) and oxidized (O2) states. | The HERFD-XANES spectrum for this sample is expected to show a slight edge shift to lower energy and the lowest white line intensity (~11218 eV) compared to the active (CO + O2) and oxidized (O2) states. These spectral features directly result from the sample conditions, where a pure CO environment at 150 °C isolates the Ir single atoms into a reduced Ir(CO)2(OL)(O) dicarbonyl state. Because this dicarbonyl intermediate possesses a formal charge of +2.3, it is significantly more reduced than the active (+3.0) and oxidized (+3.3) states. Consequently, this lower oxidation state manifests spectroscopically as a decreased white line intensity and a lower-energy edge position. | Full points for stating that the white line intensity is lower (lowest of the three) and the edge position is slightly shifted to lower energy. |
Review
Design of Dilute Palladium–Indium Alloy Catalysts for the Selective Hydrogenation of CO 2 to Methanol
BNL-NSLS-II-8-ID
Catalyst
Abdulaziz M. Alamer et al.
DOI: 10.1021/acscatal.3c01861
5 scenarios
▶
#729
Pd-In/Al2O3
Pd K-edge
▶
LLM Prompt
Sample Information
Material: Pd-In/Al2O3
Support: Al2O3
Sample-Specific Conditions
- Pd loading: 1:100 Pd:In
- Freshly prepared Pd-In alloy catalyst with 1:100 Pd:In nominal molar ratio
Measurement
We plan to measure the Pd K-edge XANES spectrum of this sample.
Questions
Based on all the information above:
1. Given that the fresh Pd1In100 sample was exposed to air, what is the expected oxidation state of Pd, and what structural motif (e.g., clusters vs. isolated atoms) is expected based on the high dilution (1:100 Pd:In)?
2. What reference materials would be appropriate to use as a basis for analyzing the local coordination environment of this sample?
3. How does the EXAFS spectrum of this highly dilute fresh sample (Pd1In100) differ from that of bulk PdO, and what does this difference signify?
Ground Truth
Material: Pd-In/Al2O3
Measurement: ex-situ Pd K-edge XANES and EXAFS at beamline 8-ID (ISS) of NSLS-II
Fit method: EXAFS fitting in R-space
Phase fractions: (±10%)
| Phase | Fraction |
|---|---|
| palladium_oxide | 1.0 |
Fit basis (paper's reference spectra):
- PdO
- Pd foil
Source evidence: Page 12, Section 3.2; Figure 2a; Table S3
Key reasoning: The fresh samples were exposed to air during loading, leading to surface oxidation. The XANES energy (23.2531 keV) is characteristic of Pd+2. EXAFS fitting indicates 4 Pd-O bonds at 2.05 Å, similar to PdO. However, the Pd1In100 sample lacks higher shell Pd-O-Pd scattering, suggesting the oxidized Pd exists as predominantly isolated species rather than extended PdO clusters.
Reasoning source: Page 12, Section 3.2
Scoring Rubric (total: 100 pts)
| Q | Type | Max | Question | Reference Answer | Scoring Criteria |
|---|---|---|---|---|---|
| q1 | reasoning | 35 | Given that the fresh Pd1In100 sample was exposed to air, what is the expected oxidation state of Pd, and what structural motif (e.g., clusters vs. isolated atoms) is expected based on the high dilution (1:100 Pd:In)? | The expected oxidation state of Pd in this sample is Pd+2, existing structurally as predominantly isolated species or oxidized single atoms. This state arises because the freshly prepared catalyst was exposed to air during loading, which leads to complete surface oxidation and a 1.0 fraction of palladium oxide. Additionally, the extremely high dilution of the sample, with a 1:100 Pd:In nominal molar ratio, physically separates the palladium atoms. This high dilution prevents the formation of extended PdO clusters, resulting instead in isolated Pd+2 species. | Full points for stating Pd+2 (or oxidized Pd) and explaining that the high dilution leads to predominantly isolated Pd species (single atoms) rather than extended clusters. |
| q2 | identification | 30 | What reference materials would be appropriate to use as a basis for analyzing the local coordination environment of this sample? | The appropriate reference materials to use as a basis for analyzing this sample are PdO and Pd foil. These references are selected because the freshly prepared Pd-In/Al2O3 catalyst was exposed to air during loading, which drives complete surface oxidation. The PdO reference is required to model the resulting 1.0 fraction of oxidized Pd+2 species and their associated Pd-O bonds. The Pd foil reference is used to evaluate metallic contributions, ultimately confirming that the high 1:100 Pd:In dilution and air exposure result in fully oxidized, isolated species rather than metallic clusters. | Full points for mentioning PdO (to model the oxidized state) and Pd foil (as a metallic reference). |
| q3 | spectral | 35 | How does the EXAFS spectrum of this highly dilute fresh sample (Pd1In100) differ from that of bulk PdO, and what does this difference signify? | The EXAFS spectrum of the Pd1In100 sample exhibits a prominent first-shell Pd-O peak at a phase-uncorrected distance of ~1.5 Å, but it lacks the higher-shell Pd-O-Pd scattering peaks characteristic of a bulk PdO reference. This difference signifies that the oxidized palladium exists predominantly as isolated Pd+2 species rather than extended PdO clusters. These spectral features directly result from the sample conditions, specifically the extremely high dilution (1:100 Pd:In molar ratio) which physically separates the Pd atoms. When the fresh sample is exposed to air, it fully oxidizes to form local Pd-O bonds, but the high dilution prevents the formation of the extended Pd-O-Pd networks found in bulk oxides. | Full points for noting the absence or negligible intensity of higher shell Pd-O-Pd scattering peaks compared to bulk PdO, signifying that the Pd species are isolated. |
Review
#730
Pd-In/Al2O3
Pd K-edge
▶
LLM Prompt
Sample Information
Material: Pd-In/Al2O3
Support: Al2O3
Reaction Conditions: 2 mL min-1 CO2 and 8 mL min-1 H2
Sample-Specific Conditions
- State: Reduced
- Pd1In50 catalyst reduced in-situ
Measurement
We plan to measure the Pd K-edge XANES spectrum of this sample.
Questions
Based on all the information above:
1. Based on the provided sample conditions (in-situ reduction of Pd1In50), what is the dominant Pd phase present, and what physical reasoning justifies this assignment?
2. Describe the expected Pd K-edge XANES spectral shape for this in-situ reduced Pd1In50 sample. Specifically, how does it compare to a standard Pd foil reference?
3. What structural characteristic is responsible for the differences in the white line energy and leading edge intensity observed in this sample compared to pure Pd foil?
Ground Truth
Material: Pd-In/Al2O3 (Pd1In50)
Measurement: Pd K-edge (24.359 keV) in-situ fluorescence mode at 8-ID beamline, NSLS-II
Fit method: Qualitative comparison
Phase fractions: (±10%)
| Phase | Fraction |
|---|---|
| PdIn alloy | 1.0 |
Fit basis (paper's reference spectra):
- Pd foil
Source evidence: Figure 2b, Figure 2c, and text on Page 13
Key reasoning: Upon reduction of Pd1In50 analyzed in-situ, only metallic Pd-Pd/Pd-In scattering was observed. The XANES energies at the inflection of the leading edge are very similar to Pd foil, indicating a fully reduced metallic state. However, differences in the leading edge intensity and white line energy compared to Pd foil indicate the presence of Pd-In neighbors, confirming PdIn alloy formation.
Reasoning source: Section 3.2 Coordination environment via X-ray absorption spectroscopy, Page 13
Scoring Rubric (total: 100 pts)
| Q | Type | Max | Question | Reference Answer | Scoring Criteria |
|---|---|---|---|---|---|
| q1 | reasoning | 30 | Based on the provided sample conditions (in-situ reduction of Pd1In50), what is the dominant Pd phase present, and what physical reasoning justifies this assignment? | The dominant Pd phase present in the sample is a PdIn alloy, which accounts for 100% (fraction 1.0) of the palladium species. This phase arises because the Pd1In50 catalyst is subjected to in-situ reduction under a flow of H2 and CO2. Under these reducing conditions, the palladium is fully reduced to a metallic state (oxidation state 0), as evidenced by the presence of only metallic Pd-Pd and Pd-In scattering. Furthermore, the high concentration of indium relative to palladium in the Pd1In50 composition ensures that the reduced Pd forms Pd-In neighbors, driving the complete formation of a PdIn alloy rather than isolated pure metallic Pd. | Full credit requires identifying the dominant phase as a PdIn alloy (or metallic Pd-In) and explaining that reduction leads to a metallic state where Pd-In interactions dominate, as evidenced by the lack of oxidized species. |
| q2 | spectral | 40 | Describe the expected Pd K-edge XANES spectral shape for this in-situ reduced Pd1In50 sample. Specifically, how does it compare to a standard Pd foil reference? | The expected Pd K-edge XANES spectrum for this sample exhibits a leading edge inflection energy that is very similar to a standard Pd foil reference. However, the spectrum's leading edge intensity and white line energy differ substantially from the pure Pd foil. These spectral features arise because the in-situ reduction under H2 and CO2 fully reduces the Pd to a metallic state, which aligns the edge position with that of metallic Pd foil. Meanwhile, the substantial differences in the white line and leading edge intensity occur because the specific Pd1In50 composition forces the reduced palladium to coordinate with indium, forming a PdIn alloy whose distinct Pd-In neighbors alter the electronic structure compared to pure Pd. | Full credit requires noting that the leading edge inflection energy is very similar to Pd foil, but that the leading edge intensity and white line energy differ substantially from the Pd foil reference. |
| q3 | reasoning | 30 | What structural characteristic is responsible for the differences in the white line energy and leading edge intensity observed in this sample compared to pure Pd foil? | The structural characteristic responsible for the differences in the white line energy and leading edge intensity is the presence of Pd-In neighbors in the palladium coordination environment. Because the Pd1In50 catalyst contains a high ratio of indium to palladium and is reduced in-situ under H2 and CO2, the palladium is fully reduced and interacts directly with the surrounding indium. This specific composition and reducing environment drive the complete formation of a PdIn alloy rather than pure metallic Pd. Consequently, the structural and electronic modifications caused by these Pd-In bonds alter the leading edge intensity and white line energy compared to the pure Pd-Pd bonding found in a Pd foil reference. | Full credit requires attributing the spectral differences (white line and leading edge intensity) to the presence of Pd-In neighbors, indicating PdIn alloy formation rather than pure Pd. |
Review
#731
Pd-In/Al2O3
Pd K-edge
▶
LLM Prompt
Sample Information
Material: Pd-In/Al2O3
Support: Al2O3
Reaction Conditions: CO2 hydrogenation
Sample-Specific Conditions
- Pd loading: 1:100 Pd:In
- Pd1In100 catalyst after CO2 hydrogenation reaction, exposed to air
Measurement
We plan to measure the Pd K-edge XANES spectrum of this sample.
Questions
Based on all the information above:
1. What candidate reference spectra or scattering paths are needed to properly model the ex-situ Pd K-edge XAS data for the used Pd1In100 catalyst after exposure to air?
2. Estimate the phase fractions of the oxidized and metallic components in the used Pd1In100 catalyst after air exposure.
3. Explain the physical reasoning for the specific proportion of the oxidized phase in this highly dilute (1:100 Pd:In) catalyst after it is removed from the reactor and exposed to air.
Ground Truth
Material: Pd-In/Al2O3
Measurement: ex-situ Pd K-edge XAS (fluorescence mode), beamline 8-ID at NSLS-II
Fit method: EXAFS coordination number analysis
Phase fractions: (±15%)
| Phase | Fraction |
|---|---|
| palladium_oxide | 0.33 |
| PdIn alloy | 0.67 |
Fit basis (paper's reference spectra):
- Pd foil
- PdO
Source evidence: Page 12, Section 3.2 (text discussing ex-situ k2-magnitudes of used catalysts and Pd-O CNs)
Key reasoning: After the CO2 hydrogenation reaction, the used catalysts were exposed to air, which causes the surface Pd atoms to readily oxidize. The fraction of surface Pd (and thus the oxidized fraction) can be estimated by dividing the measured Pd-O coordination number (CN) by 4, which is the CN of bulk PdO. For the used Pd1In100 sample, the measured Pd-O CN is 1.3, yielding an estimated 33% surface Pd (oxidized to PdO), with the remaining 67% residing in the metallic Pd or PdIn alloy phase.
Reasoning source: Page 12, Section 3.2 Coordination environment via X-ray absorption spectroscopy
Scoring Rubric (total: 100 pts)
| Q | Type | Max | Question | Reference Answer | Scoring Criteria |
|---|---|---|---|---|---|
| q1 | identification | 20 | What candidate reference spectra or scattering paths are needed to properly model the ex-situ Pd K-edge XAS data for the used Pd1In100 catalyst after exposure to air? | To properly model the ex-situ Pd K-edge XAS data for the used Pd1In100 catalyst, reference spectra for Pd foil (representing metallic Pd) and PdO (palladium oxide) are required. These specific phases are expected because the catalyst was exposed to air after the CO2 hydrogenation reaction, which causes the surface Pd atoms to readily oxidize. Meanwhile, the bulk of the highly dilute 1:100 Pd:In sample remains as a metallic Pd or PdIn alloy phase. Therefore, a combination of metallic and oxide references is necessary to capture both the protected bulk alloy and the air-oxidized surface components. | Full credit for identifying both a metallic Pd/PdIn reference (or Pd foil) and an oxidized Pd reference (PdO). |
| q2 | quantification | 40 | Estimate the phase fractions of the oxidized and metallic components in the used Pd1In100 catalyst after air exposure. | The phase fractions for the used Pd1In100 catalyst are estimated to be 33% palladium oxide (PdO) and 67% metallic PdIn alloy, with an uncertainty of 15%. These specific values result from the sample's exposure to air after the CO2 hydrogenation reaction, which selectively oxidizes the surface Pd atoms. The oxidized fraction is determined by dividing the measured Pd-O coordination number of 1.3 by the bulk PdO coordination number of 4. This calculation indicates that 33% of the Pd resides on the surface and becomes oxidized, leaving the remaining 67% protected within the metallic PdIn alloy phase. | Full credit for estimating approximately 33% palladium oxide (PdO) and 67% metallic Pd/PdIn alloy. Partial credit for identifying that it is a mixture with a minority oxidized phase and majority metallic phase. |
| q3 | reasoning | 40 | Explain the physical reasoning for the specific proportion of the oxidized phase in this highly dilute (1:100 Pd:In) catalyst after it is removed from the reactor and exposed to air. | The specific proportion of 33% oxidized Pd arises because air exposure after the CO2 hydrogenation reaction causes only the surface Pd atoms to readily oxidize. In this highly dilute 1:100 Pd:In catalyst, the fraction of surface Pd can be quantified using EXAFS coordination number (CN) analysis. The measured Pd-O CN for this sample is 1.3, which is divided by 4 (the CN of bulk PdO) to yield an estimated 33% surface Pd that has oxidized to PdO. The remaining 67% of the palladium is located in the bulk of the material, where it remains stabilized as a metallic Pd or PdIn alloy phase despite the air exposure. | Full credit for explaining that air exposure causes surface Pd to oxidize to PdO, and that the ~33% oxidized fraction corresponds to the fraction of Pd atoms located at the surface of the nanoparticles (derived from the ratio of the measured Pd-O coordination number to that of bulk PdO). |
Review
#732
Pd-In/Al2O3
Pd K-edge
▶
LLM Prompt
Sample Information
Material: Pd-In/Al2O3
Support: Al2O3
Reaction Conditions: CO2 hydrogenation
Sample-Specific Conditions
- Pd loading: 1:50 Pd:In
- Pd1In50 catalyst after CO2 hydrogenation reaction, exposed to air
Measurement
We plan to measure the Pd K-edge XANES spectrum of this sample.
Questions
Based on all the information above:
1. What candidate phases are expected in the used Pd1In50 catalyst after CO2 hydrogenation and subsequent exposure to air, and what reference materials should be used to model the XAS data?
2. Estimate the phase fractions of the components in the used Pd1In50 catalyst after air exposure.
3. Explain the physical reasoning for the observed phase composition of the used Pd1In50 catalyst after air exposure. How does the structure of the nanoparticles dictate this composition, and how can the oxidized fraction be structurally rationalized?
Ground Truth
Material: Pd-In/Al2O3
Measurement: Pd K-edge ex-situ XAS at beamline 8-ID (ISS) of NSLS-II
Fit method: EXAFS coordination number analysis
Phase fractions: (±15%)
| Phase | Fraction |
|---|---|
| palladium_oxide | 0.38 |
| PdIn alloy | 0.62 |
Fit basis (paper's reference spectra):
- Pd foil
- PdO
Source evidence: Page 12, Section 3.2
Key reasoning: After reaction, the majority of Pd is present in a metallic Pd or PdIn alloy phase. However, exposure to air causes surface oxidation of the small Pd clusters. Because surface Pd readily oxidizes to yield PdO (which has a Pd-O CN of 4), dividing the measured Pd-O CN (1.5 for Pd1In50) by 4 provides an estimate of the surface Pd content, which is 38%. The remaining 62% is the metallic PdIn alloy core.
Reasoning source: Page 12, Section 3.2
Scoring Rubric (total: 100 pts)
| Q | Type | Max | Question | Reference Answer | Scoring Criteria |
|---|---|---|---|---|---|
| q1 | identification | 25 | What candidate phases are expected in the used Pd1In50 catalyst after CO2 hydrogenation and subsequent exposure to air, and what reference materials should be used to model the XAS data? | The expected phases in the used Pd1In50 catalyst are a metallic PdIn alloy and palladium oxide (PdO). To model the XAS data, Pd foil and PdO should be used as the reference materials. These specific phases are expected because, during the CO2 hydrogenation reaction, the majority of the Pd forms a metallic PdIn alloy. However, upon subsequent exposure to air, the surface of these small Pd clusters readily oxidizes to yield the PdO phase. | Award 10 points for identifying both an oxidized Pd phase (PdO) and a metallic Pd/PdIn alloy phase. Award 15 points for explicitly listing Pd foil and PdO as the necessary reference materials. |
| q2 | quantification | 35 | Estimate the phase fractions of the components in the used Pd1In50 catalyst after air exposure. | The estimated phase fractions for the used Pd1In50 catalyst are 38% palladium oxide and 62% PdIn alloy, with an uncertainty of 15%. These specific values result from the catalyst's structural response to air exposure following the CO2 hydrogenation reaction. Because air exposure causes the surface Pd to readily oxidize into PdO (which has a theoretical Pd-O coordination number of 4), the oxidized fraction can be quantified using EXAFS coordination number analysis. Dividing the measured Pd-O coordination number of 1.5 for this sample by 4 yields the 38% surface oxide fraction, leaving the remaining 62% as the metallic PdIn alloy core. | Award full points for estimating approximately 38% palladium oxide (or surface oxidized Pd) and 62% PdIn alloy (or metallic Pd). Deduct points proportionally if the estimates deviate by more than 15% from these values. |
| q3 | reasoning | 40 | Explain the physical reasoning for the observed phase composition of the used Pd1In50 catalyst after air exposure. How does the structure of the nanoparticles dictate this composition, and how can the oxidized fraction be structurally rationalized? | The observed phase composition is dictated by the physical structure of the small Pd clusters formed during the CO2 hydrogenation reaction and their subsequent interaction with air. Under reaction conditions, the 1:50 Pd:In loading results in a metallic PdIn alloy, but exposing this used catalyst to air causes the surface Pd atoms to readily oxidize. This creates a structure where the core remains a metallic PdIn alloy (62%) while the surface becomes PdO (38%). The oxidized fraction is structurally rationalized by comparing the measured Pd-O coordination number (1.5) to the theoretical coordination number of fully oxidized PdO (4), confirming that oxidation is limited to the surface of the clusters. | Award 20 points for explaining that the catalyst consists of small clusters where the surface Pd oxidizes upon air exposure while the core remains a metallic PdIn alloy. Award 20 points for explaining that the oxidized fraction (~38%) corresponds to the surface Pd fraction, which is rationalized by comparing the measured Pd-O coordination number to the theoretical coordination number of bulk PdO (CN=4). |
Review
#733
Pd-In/Al2O3
Pd K-edge
▶
LLM Prompt
Sample Information
Material: Pd-In/Al2O3
Support: Al2O3
Reaction Conditions: CO2 hydrogenation
Sample-Specific Conditions
- Pd loading: 1:5 Pd:In
- Pd1In5 catalyst after CO2 hydrogenation reaction, exposed to air
Measurement
We plan to measure the Pd K-edge XANES spectrum of this sample.
Questions
Based on all the information above:
1. Identify the expected Pd-containing phases in this ex-situ sample and estimate their relative fractions.
2. Explain the physical origin of the oxidized phase in this sample and what its specific fraction indicates about the structural arrangement of Pd in the Pd1In5 nanoparticles.
3. What reference spectra or structural models are required to properly model the X-ray absorption data for this specific sample?
Ground Truth
Material: Pd-In/Al2O3
Measurement: Pd K-edge ex-situ, fluorescence mode, beamline 8-ID at NSLS-II
Fit method: EXAFS coordination number analysis
Phase fractions: (±15%)
| Phase | Fraction |
|---|---|
| palladium_oxide | 0.13 |
| PdIn alloy | 0.87 |
Fit basis (paper's reference spectra):
- Pd foil
- PdO
Source evidence: Page 12-13, Section 3.2
Key reasoning: After the CO2 hydrogenation reaction, the majority of Pd is present in a metallic PdIn alloy phase. However, upon ex-situ exposure to air, the surface Pd atoms readily oxidize to form PdO. The fraction of oxidized Pd (13%) is determined by dividing the measured Pd-O coordination number by 4 (the CN of bulk PdO), which serves as an estimate for the surface Pd content. This relatively low surface fraction indicates that at this higher Pd loading (1:5), a significant portion of Pd atoms are located in the subsurface or bulk of the larger nanoparticles, unlike in more dilute samples where Pd is stabilized at the surface.
Reasoning source: Page 12-13, Section 3.2
Scoring Rubric (total: 100 pts)
| Q | Type | Max | Question | Reference Answer | Scoring Criteria |
|---|---|---|---|---|---|
| q1 | quantification | 40 | Identify the expected Pd-containing phases in this ex-situ sample and estimate their relative fractions. | The expected Pd-containing phases in this ex-situ sample are a metallic PdIn alloy (87%) and palladium oxide (13%). These specific phases and fractions arise directly from the sample's reaction and handling conditions. During the CO2 hydrogenation reaction, the Pd and In form the majority metallic PdIn alloy phase, but upon subsequent ex-situ exposure to air, the surface Pd atoms readily oxidize to form PdO. The relatively low 13% oxide fraction occurs because the 1:5 Pd:In loading leads to the formation of larger nanoparticles where a significant portion of Pd atoms are protected in the subsurface or bulk, leaving only a small fraction of Pd at the surface available for oxidation. | Full credit for identifying both the metallic PdIn alloy (or metallic Pd) and palladium oxide (PdO) phases, with fractions of approximately 87% and 13%, respectively. |
| q2 | reasoning | 40 | Explain the physical origin of the oxidized phase in this sample and what its specific fraction indicates about the structural arrangement of Pd in the Pd1In5 nanoparticles. | The oxidized phase (PdO) originates from the ex-situ exposure of the post-reaction catalyst to air, which causes the surface Pd atoms of the metallic PdIn alloy to readily oxidize. The specific fraction of this oxidized phase is 13%, which is determined by dividing the measured Pd-O coordination number by 4 (the coordination number of bulk PdO) and serves as an estimate for the surface Pd content. This relatively low surface fraction indicates that at the higher 1:5 Pd:In loading, the catalyst forms larger nanoparticles. Consequently, a significant portion of the Pd atoms are located in the subsurface or bulk of these nanoparticles, unlike in more dilute samples where Pd is stabilized primarily at the surface. | Full credit for explaining that the PdO phase arises from the oxidation of surface Pd atoms upon exposure to air, and that the low fraction (13%) indicates that most Pd atoms are trapped in the subsurface/bulk of the nanoparticles due to the higher Pd loading. |
| q3 | identification | 20 | What reference spectra or structural models are required to properly model the X-ray absorption data for this specific sample? | To properly model the X-ray absorption data for this sample, reference spectra or structural models for Pd foil (metallic Pd) and PdO (palladium oxide) are required. These specific references are necessary because the sample's history dictates a two-component system. The CO2 hydrogenation reaction conditions drive the formation of a metallic PdIn alloy (necessitating a metallic Pd basis), while the subsequent ex-situ exposure to air causes the surface Pd atoms to oxidize into PdO. Because the 1:5 Pd:In loading creates larger nanoparticles with both bulk metallic alloy and surface oxide components, both references are required to accurately quantify the 87% alloy and 13% oxide composition via EXAFS coordination number analysis. | Full credit for identifying the need for a metallic Pd reference (e.g., Pd foil or PdIn alloy) and a fully oxidized Pd reference (PdO). |
Review
Bypassing Formation of Oxide Intermediate via Chemical Vapor Deposition for the Synthesis of an Mn-N-C Catalyst with Improved ORR Activity
BNL-NSLS-II-8-ID
Synthesis
Thomas Stracensky et al.
DOI: 10.1021/acscatal.3c01982
3 scenarios
▶
#734
Mn-N-C precursor mixture
Mn K
▶
LLM Prompt
Sample Information
Material: Mn-N-C precursor mixture
Method: ball milling
Precursors: ZIF-8 derived NC, anhydrous MnCl2
Temperature C: 25
Atmosphere: air (residual moisture)
Sample-Specific Conditions
- Pyrolysis temperature: 25 °C
- Ball milled mixture of MnCl2 and nitrogen-doped carbon at room temperature
Preparation
- ZIF-8 pyrolyzed at 1050 °C under inert atmosphere to give highly porous nitrogen-doped carbon (NC). Subsequent ball milling of the resultant NC with anhydrous MnCl2 powder resulted in a mixture containing 1% Mn by weight.
Measurement
We plan to measure the Mn K XANES spectrum of this sample.
Questions
Based on all the information above:
1. Based on the preparation conditions (ball milling anhydrous MnCl2 with highly porous ZIF-8 derived NC in air at 25 °C), what is the expected dominant Mn-containing phase in the resulting unpyrolyzed mixture?
2. Explain the chemical/physical reasoning for why the initial anhydrous MnCl2 precursor does not remain intact, but instead transforms into the dominant phase identified in this room-temperature sample.
3. If you were to perform Linear Combination Fitting (LCF) on the XANES spectrum of this specific room-temperature precursor mixture, what reference spectrum would be the most critical to include to capture the primary state of manganese?
Ground Truth
Material: Mn-N-C precursor mixture
Measurement: Mn K-edge XANES
Fit method: not reported
Phase fractions: (±10%)
| Phase | Fraction |
|---|---|
| hydrated MnOx | 1.0 |
Fit basis (paper's reference spectra):
- not reported
Source evidence: text/Figure 1
Key reasoning: Despite starting with anhydrous MnCl2, ball milling the precursor with highly porous nitrogen-doped carbon (NC) in air at room temperature allows it to interact with residual moisture. This results in the complete conversion of the anhydrous precursor into hydrated MnOx prior to any high-temperature pyrolysis.
Reasoning source: Sample description and preparation conditions
Scoring Rubric (total: 100 pts)
| Q | Type | Max | Question | Reference Answer | Scoring Criteria |
|---|---|---|---|---|---|
| q1 | prediction | 30 | Based on the preparation conditions (ball milling anhydrous MnCl2 with highly porous ZIF-8 derived NC in air at 25 °C), what is the expected dominant Mn-containing phase in the resulting unpyrolyzed mixture? | The expected dominant Mn-containing phase in the unpyrolyzed mixture is hydrated MnOx, which accounts for 100% (fraction of 1.0) of the manganese species. This complete transformation occurs because the anhydrous MnCl2 precursor is ball milled with highly porous nitrogen-doped carbon (NC) in air at room temperature (25 °C). The high porosity of the NC and the presence of air allow the precursor to interact strongly with residual moisture. Consequently, this interaction drives the complete conversion of the initial anhydrous MnCl2 into hydrated MnOx prior to any high-temperature pyrolysis. | Full credit for identifying hydrated MnOx (or hydrated manganese oxide) as the dominant/sole phase. |
| q2 | reasoning | 40 | Explain the chemical/physical reasoning for why the initial anhydrous MnCl2 precursor does not remain intact, but instead transforms into the dominant phase identified in this room-temperature sample. | The initial anhydrous MnCl2 precursor does not remain intact because it is subjected to ball milling with a highly porous nitrogen-doped carbon (NC) support in an air atmosphere at 25 °C. During this room-temperature milling process, the high porosity of the ZIF-8 derived NC facilitates the exposure of the MnCl2 to residual moisture present in the air. This interaction with moisture acts as the driving mechanism for the chemical transformation. As a result, the anhydrous precursor undergoes a complete conversion into hydrated MnOx (1.0 fraction) before any high-temperature pyrolysis is applied. | Full credit for explaining that ball milling in air exposes the anhydrous MnCl2 and porous carbon mixture to residual moisture, leading to hydration and oxidation to form hydrated MnOx. |
| q3 | identification | 30 | If you were to perform Linear Combination Fitting (LCF) on the XANES spectrum of this specific room-temperature precursor mixture, what reference spectrum would be the most critical to include to capture the primary state of manganese? | The most critical reference spectrum to include for Linear Combination Fitting (LCF) is hydrated MnOx. This reference is necessary because it represents 100% (fraction of 1.0) of the manganese species present in the sample. This specific phase arises because ball milling the anhydrous MnCl2 with highly porous nitrogen-doped carbon in air at 25 °C exposes the mixture to residual moisture. The interaction with this moisture completely converts the initial anhydrous precursor into hydrated MnOx prior to any pyrolysis, making it the sole phase required to capture the primary state of manganese. | Full credit for stating that a hydrated MnOx reference spectrum is required, as it constitutes 100% of the phase fraction. |
Review
#735
Mn-N-C intermediate
Mn K
▶
LLM Prompt
Sample Information
Material: Mn-N-C intermediate
Method: thermal treatment
Precursors: ZIF-8 derived NC, anhydrous MnCl2
Temperature C: 425
Atmosphere: inert
Sample-Specific Conditions
- Pyrolysis temperature: 425 °C
- Ball milled mixture heated to 425 °C
Preparation
- ZIF-8 pyrolyzed at 1050 °C under inert atmosphere to give NC. Ball milled with anhydrous MnCl2. Heated stepwise to 425 °C under an inert gaseous environment.
Measurement
We plan to measure the Mn K XANES spectrum of this sample.
Questions
Based on all the information above:
1. Based on the synthesis conditions (ball milling ZIF-8 derived NC with anhydrous MnCl2 and heating to 425 °C in an inert atmosphere), predict the dominant Mn oxidation state and coordination environment in the resulting intermediate.
2. If you were to perform Linear Combination Fitting (LCF) on the Mn K-edge XANES spectrum of this sample, what specific structural motif or reference spectrum is essential to include in your basis set?
3. Explain the structural state of the Mn species at the 425 °C intermediate stage of this thermal treatment.
Ground Truth
Material: Mn-N-C intermediate
Measurement: Mn K-edge, mode not reported, beamline not reported
Fit method: not reported
Phase fractions: (±10%)
| Phase | Fraction |
|---|---|
| tetrahedral Mn(II)-O4 | 1.0 |
Fit basis (paper's reference spectra):
- tetrahedral Mn(II)-O4
Source evidence: text/Figure 1
Key reasoning: Heating the ball-milled mixture of ZIF-8 derived nitrogen-doped carbon (NC) and anhydrous MnCl2 to 425 °C under an inert atmosphere drives a structural transition. At this specific intermediate pyrolysis temperature, the system forms a pure tetrahedral Mn(II)-O4 phase.
Reasoning source: text/Figure 1
Scoring Rubric (total: 100 pts)
| Q | Type | Max | Question | Reference Answer | Scoring Criteria |
|---|---|---|---|---|---|
| q1 | prediction | 40 | Based on the synthesis conditions (ball milling ZIF-8 derived NC with anhydrous MnCl2 and heating to 425 °C in an inert atmosphere), predict the dominant Mn oxidation state and coordination environment in the resulting intermediate. | The dominant Mn oxidation state in this intermediate sample is Mn(II), characterized entirely by a tetrahedral Mn(II)-O4 coordination environment. This specific configuration accounts for a fraction of 1.0 (100%) of the manganese species present. This structural state arises because heating the ball-milled mixture of ZIF-8 derived nitrogen-doped carbon (NC) and anhydrous MnCl2 to 425 °C under an inert atmosphere drives a distinct structural transition. At this specific intermediate pyrolysis temperature, the precursor materials fully convert to form a pure tetrahedral Mn(II)-O4 phase. | Award 40 points for correctly identifying a purely tetrahedral Mn(II)-O4 phase. Award 20 points if only the +2 oxidation state or only the tetrahedral oxygen coordination is predicted. |
| q2 | identification | 30 | If you were to perform Linear Combination Fitting (LCF) on the Mn K-edge XANES spectrum of this sample, what specific structural motif or reference spectrum is essential to include in your basis set? | For Linear Combination Fitting (LCF) of this Mn K-edge XANES spectrum, it is essential to include a tetrahedral Mn(II)-O4 reference spectrum in your basis set. This single structural motif will account for a fraction of 1.0 (100%) of the fit, with an uncertainty of 10%. This pure phase results directly from the sample preparation conditions, where the ball-milled mixture of ZIF-8 derived NC and anhydrous MnCl2 is heated to 425 °C in an inert atmosphere. This specific intermediate pyrolysis temperature drives a structural transition that completely converts the precursors into the tetrahedral Mn(II)-O4 phase, meaning no other reference spectra are required. | Award 30 points for stating that a tetrahedral Mn(II)-O4 reference spectrum (or a structurally equivalent Mn(II) tetrahedral oxide) is required. |
| q3 | reasoning | 30 | Explain the structural state of the Mn species at the 425 °C intermediate stage of this thermal treatment. | At the 425 °C intermediate stage of this thermal treatment, the structural state of the Mn species is a pure tetrahedral Mn(II)-O4 phase. This state is achieved by ball milling ZIF-8 derived nitrogen-doped carbon (NC) with anhydrous MnCl2 and heating the mixture stepwise to 425 °C under an inert gaseous environment. The application of this specific intermediate pyrolysis temperature drives a structural transition in the precursor materials. Consequently, the system completely transforms into the tetrahedral Mn(II)-O4 configuration, which comprises 1.0 (100%) of the Mn species in the sample. | Award 30 points for explaining that at 425 °C, the precursors have transformed into an intermediate state characterized entirely by tetrahedral Mn(II)-O4 coordination before any higher-temperature transformations occur. |
Review
#736
Mn-N-C catalyst
Mn K
▶
LLM Prompt
Sample Information
Material: Mn-N-C catalyst
Method: chemical vapor deposition
Precursors: ZIF-8 derived NC, MnCl2
Temperature C: 1100
Atmosphere: inert gas flow
Post Treatment: exposed to air
Sample-Specific Conditions
- Synthesis method: CVD
- Mn-N-C catalyst synthesized via chemical vapor deposition at 1100 °C
Preparation
- ZIF-8 pyrolyzed at 1050 °C under inert conditions to convert it into a highly porous carbon matrix. MnCl2 and NC were heated to 1100 °C in an inert gas flow in a tube furnace, with MnCl2 upstream of the NC. MnCl2 vaporized and deposited on the NC, converting to MnN4 via transmetalation.
Measurement
We plan to measure the Mn K XANES spectrum of this sample.
Questions
Based on all the information above:
1. Based on the CVD synthesis at 1100 °C using MnCl2 and ZIF-8 derived NC, followed by air exposure, what is the expected dominant Mn coordination environment or phase in this catalyst?
2. Explain the physical and chemical mechanisms during the synthesis and post-treatment that lead to the formation of this specific Mn phase.
3. If one were to perform Linear Combination Fitting (LCF) on the XANES spectrum of this sample, what reference spectrum would be essential to include as the primary basis?
Ground Truth
Material: Mn-N-C catalyst
Measurement: Mn K-edge XANES
Fit method: not reported
Phase fractions: (±10%)
| Phase | Fraction |
|---|---|
| oxidized MnN4 | 1.0 |
Fit basis (paper's reference spectra):
- oxidized MnN4
Source evidence: text/Figure 3
Key reasoning: During the chemical vapor deposition process at 1100 °C, MnCl2 vaporizes and deposits onto the ZIF-8 derived nitrogen-doped carbon (NC). The Mn precursor converts entirely to MnN4 sites via transmetalation. Because the sample is subsequently exposed to air, the resulting single-phase material is oxidized MnN4.
Reasoning source: Preparation and post-treatment descriptions
Scoring Rubric (total: 100 pts)
| Q | Type | Max | Question | Reference Answer | Scoring Criteria |
|---|---|---|---|---|---|
| q1 | identification | 30 | Based on the CVD synthesis at 1100 °C using MnCl2 and ZIF-8 derived NC, followed by air exposure, what is the expected dominant Mn coordination environment or phase in this catalyst? | The expected dominant Mn coordination environment in this catalyst is oxidized MnN4, which accounts for 1.0 (100%) of the Mn species. This specific phase arises because, during the chemical vapor deposition at 1100 °C, the upstream MnCl2 precursor vaporizes and deposits onto the highly porous ZIF-8 derived nitrogen-doped carbon (NC) matrix. Upon deposition, the Mn precursor converts entirely into MnN4 sites via a transmetalation mechanism. Finally, because the synthesized material is subsequently exposed to air during post-treatment, these newly formed MnN4 sites become oxidized, resulting in the final oxidized MnN4 phase. | Full points for identifying oxidized MnN4 as the sole or dominant phase (fraction = 1.0). |
| q2 | reasoning | 40 | Explain the physical and chemical mechanisms during the synthesis and post-treatment that lead to the formation of this specific Mn phase. | The formation of the oxidized MnN4 phase begins with the physical vaporization of the MnCl2 precursor at 1100 °C in an inert gas flow. This vapor is carried downstream where it deposits onto the highly porous, ZIF-8 derived nitrogen-doped carbon (NC) matrix. Chemically, the deposited Mn undergoes a transmetalation reaction with the NC matrix, converting entirely into MnN4 coordination sites. Following this high-temperature synthesis, the post-treatment involves exposing the catalyst to air. This air exposure chemically oxidizes the newly formed sites, yielding a final composition of 100% oxidized MnN4. | Full points for explaining that MnCl2 vaporizes and deposits on the NC, converts to MnN4 via transmetalation, and subsequently becomes oxidized due to air exposure. |
| q3 | prediction | 30 | If one were to perform Linear Combination Fitting (LCF) on the XANES spectrum of this sample, what reference spectrum would be essential to include as the primary basis? | If performing Linear Combination Fitting (LCF) on the XANES spectrum, the essential reference spectrum to include as the primary basis is oxidized MnN4, which would account for a fraction of 1.0 (100%). This specific reference is required because the synthesis conditions dictate the complete conversion of the Mn precursor into this single phase. Specifically, heating MnCl2 to 1100 °C causes it to vaporize and deposit onto the ZIF-8 derived carbon matrix, where it forms MnN4 sites via transmetalation. The subsequent post-treatment exposure to air oxidizes these sites, ensuring that the final material is entirely composed of oxidized MnN4 without any other residual phases. | Full points for stating an oxidized MnN4 reference or an equivalent single-atom Mn-N-C standard. |
Review
Unraveling the CO Oxidation Mechanism over Highly Dispersed Pt Single Atom on Anatase TiO 2 (101)
BNL-NSLS-II-8-ID
Catalyst
Celine Tesvara et al.
DOI: 10.1021/acscatal.4c01018
1 scenario
▶
#737
Pt/TiO2
Pt L3
▶
LLM Prompt
Sample Information
Material: Pt/TiO2
Support: anatase TiO2
Reaction Conditions: CO oxidation (1% CO, 10% O2, bal He) at 160 °C for 1 hr, cooled to 35 °C in CO and O2 flow
Sample-Specific Conditions
- reaction state: after CO oxidation at 35 °C
- 0.025% Pt single atoms on anatase TiO2 measured after CO oxidation and cooling
Measurement
We plan to measure the Pt L3 XANES spectrum of this sample.
Questions
Based on all the information above:
1. Based on the reaction conditions (cooled to 35 °C in CO and O2 flow after steady-state CO oxidation), what is the expected oxidation state of the Pt single atoms, and what specific surface coordination structure is predicted to dominate?
2. Describe the expected spectral shape of the Pt L3-edge XANES for this sample, specifically focusing on the white line intensity relative to common Pt reference standards.
3. To properly benchmark and estimate the oxidation state of this single-atom catalyst from its XANES spectrum, what specific reference spectra should be included in the comparative analysis?
Ground Truth
Material: 0.025% Pt single atoms on anatase TiO2
Measurement: in-situ Pt L3-edge XANES in fluorescence mode at NSLS-II ISS beamline 08-ID
Fit method: White line intensity comparison
Phase fractions:
| Phase | Fraction |
|---|---|
| Pt2+ | 1.0 |
Fit basis (paper's reference spectra):
- Pt foil (Pt0)
- Pt(acac)2 (Pt II)
- Na2Pt(OH)6 (Pt IV)
Source evidence: Figure 3 (c) and text on page 15-16
Key reasoning: The white line intensity of the PtSA species after CO oxidation closely matches that of the Pt(acac)2 standard, indicating an oxidation state close to Pt2+. This aligns with microkinetic modeling at 27 °C, which predicts that the Pt(O2)(CO) structure (structure V) is the most stable and probable intermediate upon cooling, corresponding to a Pt oxidation number of +2.
Reasoning source: Page 15-16, section 'Kinetics of CO oxidation: Microkinetic Analysis'
Scoring Rubric (total: 100 pts)
| Q | Type | Max | Question | Reference Answer | Scoring Criteria |
|---|---|---|---|---|---|
| q1 | reasoning | 35 | Based on the reaction conditions (cooled to 35 °C in CO and O2 flow after steady-state CO oxidation), what is the expected oxidation state of the Pt single atoms, and what specific surface coordination structure is predicted to dominate? | The expected oxidation state of the Pt single atoms is +2, representing 100% of the species present. The specific surface coordination structure predicted to dominate is Pt(O2)(CO) on the anatase TiO2 support. This state arises because, as the sample is cooled to 35 °C in the CO and O2 reaction mixture after steady-state CO oxidation, microkinetic modeling predicts that the Pt(O2)(CO) intermediate becomes the most stable and probable structure. The simultaneous coordination of O2 and CO to the single Pt atoms under these cooling conditions stabilizes the Pt in a +2 oxidation state. | Full points if the answer identifies the +2 oxidation state and attributes it to the stable Pt(O2)(CO) surface species formed upon cooling. |
| q2 | spectral | 35 | Describe the expected spectral shape of the Pt L3-edge XANES for this sample, specifically focusing on the white line intensity relative to common Pt reference standards. | The expected Pt L3-edge XANES spectrum will feature an edge position at 11564 eV and a prominent white line at approximately 11567 eV with a normalized absorption intensity of ~1.65. The white line intensity will be intermediate between common standards: it is significantly higher than that of a Pt(0) foil and lower than a Pt(IV) standard, nearly perfectly matching the amplitude of a Pt(II) reference. These spectral features occur because cooling the 0.025% Pt single atoms to 35 °C in a flow of CO and O2 stabilizes the Pt(O2)(CO) surface intermediate. This specific coordination environment dictates a +2 oxidation state for the Pt atoms, which directly produces the characteristic Pt(II) white line intensity. | Full points if the answer states the white line intensity will closely match a Pt(II) standard (like Pt(acac)2) and will be intermediate between Pt(0) (foil) and Pt(IV) standards. |
| q3 | identification | 30 | To properly benchmark and estimate the oxidation state of this single-atom catalyst from its XANES spectrum, what specific reference spectra should be included in the comparative analysis? | To properly benchmark the oxidation state, the comparative analysis should include Pt foil to represent Pt(0), Pt(acac)2 to represent Pt(II), and Na2Pt(OH)6 to represent Pt(IV). These specific references are necessary to bracket the possible oxidation states and accurately evaluate the white line intensity of the sample. Under the specified conditions of cooling to 35 °C in a CO and O2 flow, the Pt single atoms are stabilized as a Pt(O2)(CO) complex, which drives the catalyst to a +2 oxidation state. By including these three standards, one can definitively show that the sample's white line intensity is higher than Pt(0), lower than Pt(IV), and closely matches the Pt(acac)2 (Pt II) reference. | Full points if the answer identifies a set of standards covering the relevant oxidation states: Pt(0) (e.g., Pt foil), Pt(II) (e.g., Pt(acac)2), and Pt(IV) (e.g., Na2Pt(OH)6). |
Review
Observing Chemical and Morphological Changes in a Cu@TiOx Core@Shell Catalyst: Impact of Reversible Metal-Oxide Interactions on CO2 Activation and Hydrogenation
BNL-NSLS-II-8-ID
Catalyst
Kaixi Deng et al.
DOI: 10.1021/acscatal.4c02694
1 scenario
▶
#738
Cu@TiOx
Cu K-edge
▶
LLM Prompt
Sample Information
Material: Cu@TiOx
Preparation: Cu nanowires were synthesized hydrothermally from CuCl2·2H2O, 1-hexadecylamine, and D-glucose in water at 100 °C for 12 h. The Cu@TiO2 core-shell structures were then synthesized via a microwave-assisted method by adding titanium butoxide (TBOT) in ethanol to the Cu NWs, sonicating, and heating via microwave radiation at 150 °C for 30 min (300 W, 200 psi). The catalyst was pre-treated in 10 v% O2 at 350 °C for 1 h, then reduced in 50 v% H2 at 450 °C for 1 h. In-situ measurements were performed under CO2 hydrogenation conditions.
Support: TiOx
Reaction Conditions: H2, N2, CO2 (3:1:1) at 250 °C
Sample-Specific Conditions
- Temperature: 250 °C
- Cu@TiOx core@shell catalyst under CO2 hydrogenation conditions at 250 °C
Preparation
- Cu nanowires were synthesized hydrothermally from CuCl2·2H2O, 1-hexadecylamine, and D-glucose in water at 100 °C for 12 h. The Cu@TiO2 core-shell structures were then synthesized via a microwave-assisted method by adding titanium butoxide (TBOT) in ethanol to the Cu NWs, sonicating, and heating via microwave radiation at 150 °C for 30 min (300 W, 200 psi). The catalyst was pre-treated in 10 v% O2 at 350 °C for 1 h, then reduced in 50 v% H2 at 450 °C for 1 h. In-situ measurements were performed under CO2 hydrogenation conditions.
Measurement
We plan to measure the Cu K-edge XANES spectrum of this sample.
Questions
Based on all the information above:
1. Identify the dominant copper phase present in the Cu@TiOx catalyst at 250 °C under the H2:CO2:N2 (3:1:1) reaction mixture. Additionally, list the reference compounds used in the paper to analyze the Cu K-edge XANES spectra.
2. Explain the reaction dynamics that lead to the catalyst being fully reduced to metallic copper at 250 °C in the CO2/H2 mixture, considering that CO2 is known to oxidize the copper component at lower temperatures.
3. Describe the expected overall spectral shape of the Cu K-edge XANES data collected in-situ at 250 °C. What specific reference spectrum does it match?
Ground Truth
Material: Cu@TiOx
Measurement: in-situ Cu K-edge XANES in transmission mode at the 7-BM QAS beamline
Fit method: Spectral comparison
Phase fractions:
| Phase | Fraction |
|---|---|
| metallic_copper | 1.0 |
Fit basis (paper's reference spectra):
- metallic Cu
- Cu2O
- CuO
Source evidence: Figure 5 (inset) and text on pages 14-15
Key reasoning: At room temperature, CO2 dissociates and oxidizes the copper component. However, as the temperature increases under the CO2/H2 mixture, the formed copper cations are reduced by reaction with H2. At high temperatures (> 140 °C), the oxygen atoms generated by the CO2 dissociation process are rapidly removed by reaction with hydrogen, resulting in a final state at 250 °C that essentially contains only metallic Cu.
Reasoning source: Results and Discussion, Section C (CO2 hydrogenation: Changes in chemical state), pages 14-15
Scoring Rubric (total: 100 pts)
| Q | Type | Max | Question | Reference Answer | Scoring Criteria |
|---|---|---|---|---|---|
| q1 | identification | 30 | Identify the dominant copper phase present in the Cu@TiOx catalyst at 250 °C under the H2:CO2:N2 (3:1:1) reaction mixture. Additionally, list the reference compounds used in the paper to analyze the Cu K-edge XANES spectra. | The dominant copper phase present in the Cu@TiOx catalyst at 250 °C under the H2:CO2:N2 (3:1:1) reaction mixture is metallic copper, which accounts for a fraction of 1.0. The reference compounds used to analyze the Cu K-edge XANES spectra are metallic Cu, Cu2O, and CuO. This fully metallic state is expected under these specific sample conditions because, although CO2 dissociates and oxidizes copper at room temperature, the presence of H2 in the mixture reduces the formed copper cations as the temperature increases. At the elevated reaction temperature of 250 °C, the oxygen atoms generated by CO2 dissociation are rapidly removed by reaction with hydrogen, preventing sustained oxidation and leaving only metallic Cu. | Full credit for identifying metallic copper (Cu0) as the dominant phase and listing metallic Cu, Cu2O, and CuO as the reference compounds. |
| q2 | reasoning | 40 | Explain the reaction dynamics that lead to the catalyst being fully reduced to metallic copper at 250 °C in the CO2/H2 mixture, considering that CO2 is known to oxidize the copper component at lower temperatures. | At lower temperatures, such as room temperature, CO2 dissociates on the Cu@TiOx catalyst and oxidizes the copper component. However, as the temperature is increased to 250 °C under the H2:CO2:N2 (3:1:1) reaction mixture, the reaction dynamics shift significantly. The copper cations formed initially are reduced by reacting with the H2 present in the gas mixture. At high temperatures (> 140 °C), the oxygen atoms generated by the CO2 dissociation process are rapidly removed by this reaction with hydrogen. Consequently, this rapid removal of oxygen outpaces the oxidation process, resulting in a final state at 250 °C that essentially contains only fully reduced metallic Cu. | Full credit for explaining that while CO2 dissociates and oxidizes Cu at lower temperatures, at high temperatures (>140 °C) the oxygen atoms generated by CO2 dissociation are rapidly removed by reaction with H2, leading to a fully reduced metallic Cu state at 250 °C. |
| q3 | spectral | 30 | Describe the expected overall spectral shape of the Cu K-edge XANES data collected in-situ at 250 °C. What specific reference spectrum does it match? | The in-situ Cu K-edge XANES spectrum collected at 250 °C completely matches the spectral shape of a metallic Cu foil reference. It notably lacks the higher energy pre-edge and edge features in the 8980-8983 eV range that are typically associated with oxidized copper species (Cu+ or Cu2+) seen at lower temperatures. These spectral features arise directly from the sample conditions, specifically the H2:CO2:N2 gas mixture at 250 °C. At this elevated temperature, any oxygen atoms generated by CO2 dissociation are rapidly removed by reaction with hydrogen, preventing oxidation and leaving the Cu@TiOx catalyst in a fully reduced state (oxidation state 0), which produces a spectrum identical to metallic copper. | Full credit for stating that the in-situ XANES spectrum at 250 °C completely matches the spectrum of a metallic Cu foil reference. |
Review
Impact of Particle Size on the Vapor-Phase Oxidative Coupling of Methanol and Dimethylamine over Palladium–Gold Nanoparticles
BNL-NSLS-II-8-ID
Catalyst
Alexander P. Minne et al.
DOI: 10.1021/acscatal.4c05022
1 scenario
▶
#739
PdAu
Pd K
▶
LLM Prompt
Sample Information
Material: PdAu
Support: SiO2
Reaction Conditions: ambient temperature and pressure
Sample-Specific Conditions
- Pd:Au molar ratio: 1:5
- Bimetallic PdAu alloy nanoparticles on silica support
Measurement
We plan to measure the Pd K XANES spectrum of this sample.
Questions
Based on all the information above:
1. Based on the sample conditions (1:5 PdAu nanoparticles on SiO2), what is the expected oxidation state of Pd, and what reference spectrum would be most appropriate to confirm this?
2. Describe the expected spectral shape of the Pd K-edge XANES for the 1:5 PdAu alloy. Specifically, how do the edge position and white line intensity compare to pure Pd foil and more dilute PdAu alloys (e.g., 1:50 or 1:94)?
3. What structural state of the bimetallic nanoparticles is indicated by the XANES and EXAFS data for the 1:5 PdAu sample, and how does the Pd dilution affect the XANES edge position?
Ground Truth
Material: 1:5 PdAu/SiO2-SEA
Measurement: Pd K-edge ex-situ XANES at NSLS-II beamline 8-ID and SSRL beamline 9-3
Fit method: Qualitative comparison
Phase fractions: (±10%)
| Phase | Fraction |
|---|---|
| metallic_palladium_alloy | 1.0 |
Fit basis (paper's reference spectra):
- Pd foil
Source evidence: Figure 2(a) and text on page 11
Key reasoning: XANES spectra at the Pd K-edge suggest the Pd in each sample is in the metallic state. The absorption edge shifts to slightly lower energy as the Pd becomes more dilute in Au. EXAFS of 1:5 PdAu appear similar to Au metal, suggesting Pd and Au in this sample are alloyed.
Reasoning source: Section 3.1, Page 11
Scoring Rubric (total: 100 pts)
| Q | Type | Max | Question | Reference Answer | Scoring Criteria |
|---|---|---|---|---|---|
| q1 | identification | 30 | Based on the sample conditions (1:5 PdAu nanoparticles on SiO2), what is the expected oxidation state of Pd, and what reference spectrum would be most appropriate to confirm this? | The expected oxidation state of Pd in the 1:5 PdAu/SiO2 sample is 0 (metallic), representing a 1.0 fraction of metallic palladium alloy. The most appropriate reference spectrum to confirm this state is pure Pd foil. This fully metallic state is expected because the sample consists of bimetallic PdAu nanoparticles synthesized on a silica support at a 1:5 Pd:Au molar ratio. Under the specified ambient temperature and pressure conditions, the Pd is stabilized by alloying with the majority Au, maintaining a reduced metallic phase rather than forming an oxide. | Full credit for identifying the metallic state (oxidation state 0) and suggesting Pd foil as a reference. |
| q2 | spectral | 40 | Describe the expected spectral shape of the Pd K-edge XANES for the 1:5 PdAu alloy. Specifically, how do the edge position and white line intensity compare to pure Pd foil and more dilute PdAu alloys (e.g., 1:50 or 1:94)? | The Pd K-edge XANES spectrum for the 1:5 PdAu alloy exhibits metallic characteristics, but its absorption edge is shifted to a slightly lower energy compared to pure Pd foil. Furthermore, the white line intensity is lower than that of pure Pd foil, yet it remains higher than that of more dilute PdAu alloys such as 1:50 or 1:94. These specific spectral features arise directly from the 1:5 Pd:Au molar ratio of the bimetallic nanoparticles on the silica support. As Pd is alloyed and diluted within the Au matrix under ambient conditions, its electronic environment is altered, which decreases the white line intensity relative to pure Pd and shifts the edge position. | Full credit for stating that the edge position is shifted to slightly lower energy than Pd foil, and the white line intensity is lower than Pd foil but higher than more dilute PdAu alloys. |
| q3 | reasoning | 30 | What structural state of the bimetallic nanoparticles is indicated by the XANES and EXAFS data for the 1:5 PdAu sample, and how does the Pd dilution affect the XANES edge position? | The XANES and EXAFS data indicate that the bimetallic nanoparticles exist as a fully alloyed, metallic PdAu phase. Specifically, the EXAFS data for the 1:5 PdAu sample appear similar to Au metal, confirming that the Pd and Au are intimately alloyed rather than segregated. Regarding the XANES edge position, as the Pd becomes more dilute in the Au, the absorption edge shifts to a slightly lower energy. This occurs because the 1:5 Pd:Au molar ratio dictates that the Pd atoms are primarily surrounded by Au atoms within the supported nanoparticles, and this specific bimetallic coordination under ambient conditions modifies the electronic structure of the Pd. | Full credit for identifying that Pd and Au are alloyed, and that increasing Pd dilution in Au causes the absorption edge to shift to slightly lower energy. |
Review
Restructuring of Benzimidazole-Based Copper Complexes during Electrochemical CO 2 Reduction
BNL-NSLS-II-8-ID
Electrochemistry
Rafael L. Romano et al.
DOI: 10.1021/acscatal.5c06128
2 scenarios
▶
#740
[Cu(bzimpy)Cl2]
Cu K-edge
▶
LLM Prompt
Sample Information
Material: [Cu(bzimpy)Cl2]
Electrode Type: working electrode
Electrolyte: 0.1 mol L-1 K2SO4 (CO2-saturated)
Cell Type: custom-designed acrylic plastic electrochemical cell
Charge Discharge: OCV
Voltage V: OCP
Sample-Specific Conditions
- Applied potential: OCP
- In situ XAS measurement at open circuit potential
Measurement
We plan to measure the Cu K-edge XANES spectrum of this sample.
Questions
Based on all the information above:
1. Describe the expected spectral shape and specific peak positions for the Cu K-edge XANES spectrum of [Cu(bzimpy)Cl2] at open circuit potential (OCP).
2. What specific electronic transitions are responsible for the pre-edge peak and the rising-edge shoulder observed in the XANES spectrum of this complex at OCP?
3. Based on the XANES features at OCP, what is the oxidation state of the copper center in the pristine complex?
4. Why does the XANES spectrum of [Cu(bzimpy)Cl2] at OCP differ significantly from that of a standard CuO reference, despite both materials containing copper in the same oxidation state?
Ground Truth
Material: [Cu(bzimpy)Cl2]
Measurement: In situ Cu K-edge XANES in fluorescence mode at ISS beamline
Fit method: Not reported for XANES
Phase fractions:
| Phase | Fraction |
|---|---|
| [Cu(bzimpy)Cl2] | 1.0 |
Source evidence: Figure 4a (black line) and Page 8 (Probing the Active Sites section)
Key reasoning: At open circuit potential (OCP), no reductive potential is applied, so the complex remains in its pristine Cu2+ state. The XANES spectrum reflects the initial molecular structure and coordination environment of the Cu2+ center before any potential-induced restructuring occurs.
Reasoning source: Page 8, 'Probing the Active Sites' section
Scoring Rubric (total: 100 pts)
| Q | Type | Max | Question | Reference Answer | Scoring Criteria |
|---|---|---|---|---|---|
| q1 | spectral | 30 | Describe the expected spectral shape and specific peak positions for the Cu K-edge XANES spectrum of [Cu(bzimpy)Cl2] at open circuit potential (OCP). | The expected Cu K-edge XANES spectrum for [Cu(bzimpy)Cl2] exhibits a low-intensity pre-edge peak at ~8977 eV and a broad shoulder centered at ~8986 eV in the rising-edge region. The overall spectral profile is distinctly different from that of a standard CuO reference. These specific features arise because the sample is held at open circuit potential (OCP) in a CO2-saturated 0.1 M K2SO4 electrolyte, meaning no reductive potential is applied. Consequently, the complex remains entirely (fraction = 1.0) in its pristine Cu2+ state, and the spectrum purely reflects the initial molecular structure and coordination environment of the Cu2+ center before any potential-induced restructuring occurs. | Full points for mentioning the low-intensity pre-edge peak at ~8977 eV and the broad shoulder at the rising edge centered at ~8986 eV. |
| q2 | reasoning | 30 | What specific electronic transitions are responsible for the pre-edge peak and the rising-edge shoulder observed in the XANES spectrum of this complex at OCP? | The low-intensity pre-edge peak at ~8977 eV originates from the 1s -> 3d/4p transition in the Cu2+ centers. The broad rising-edge shoulder at ~8986 eV is attributed to the 1s -> 4p transition combined with Ligand-to-Metal Charge Transfer (LMCT). These specific transitions are observed because the in situ measurement is performed at open circuit potential (OCP) without any applied reductive bias. Under these conditions, the [Cu(bzimpy)Cl2] complex maintains its pristine Cu2+ oxidation state and initial coordination environment, allowing these characteristic Cu2+ electronic transitions to be clearly resolved prior to any electrochemical restructuring. | Full points for correctly assigning the ~8977 eV peak to the 1s -> 3d/4p transition and the ~8986 eV shoulder to the 1s -> 4p + LMCT (Ligand-to-Metal Charge Transfer) transition. |
| q3 | identification | 20 | Based on the XANES features at OCP, what is the oxidation state of the copper center in the pristine complex? | Based on the XANES features, the oxidation state of the copper center in the pristine [Cu(bzimpy)Cl2] complex is Cu2+. This is expected because the in situ measurement is conducted at open circuit potential (OCP) in the CO2-saturated K2SO4 electrolyte. Since no reductive potential is applied to the working electrode, the complex does not undergo any electrochemical reduction or restructuring. Therefore, the material remains 100% in its initial state, preserving the pristine Cu2+ oxidation state and its corresponding molecular coordination environment. | Full points for identifying the oxidation state as Cu2+. |
| q4 | reasoning | 20 | Why does the XANES spectrum of [Cu(bzimpy)Cl2] at OCP differ significantly from that of a standard CuO reference, despite both materials containing copper in the same oxidation state? | The XANES spectrum of [Cu(bzimpy)Cl2] differs significantly from the CuO reference because the spectral profile and edge energy depend not only on the copper oxidation state but also on the specific coordination environment of the absorbing atom. At open circuit potential (OCP), no reductive bias is applied, so the [Cu(bzimpy)Cl2] complex remains entirely in its pristine molecular state. Consequently, the XANES spectrum reflects the unique initial molecular structure and specific ligand coordination of the [Cu(bzimpy)Cl2] complex. This distinct local coordination environment around the Cu2+ center produces different electronic transitions compared to the solid-state lattice environment of Cu2+ in standard CuO. | Full points for explaining that the XANES spectrum profile and edge energy depend not only on the oxidation state but also on the specific coordination environment of the absorbing Cu atom. |
Review
#741
[Cu(bzimpy)Cl2]
Cu K-edge
▶
LLM Prompt
Sample Information
Material: [Cu(bzimpy)Cl2]
Electrode Type: working electrode
Electrolyte: 0.1 mol L-1 K2SO4 (CO2-saturated)
Cell Type: custom-designed acrylic plastic electrochemical cell
Charge Discharge: discharging
Voltage V: -1.24
Cycle Number: 1
Sample-Specific Conditions
- Applied potential: -1.24 V
- In situ XAS measurement during CO2 reduction at -1.24 V vs RHE
Measurement
We plan to measure the Cu K-edge XANES spectrum of this sample.
Questions
Based on all the information above:
1. Based on the in situ XAS measurements at -1.24 V vs RHE, what is the dominant copper phase present in the [Cu(bzimpy)Cl2]-derived catalyst, and what is the primary XANES spectral evidence for this assignment?
2. Although the XANES spectrum at -1.24 V resembles bulk metallic copper, what specific XAS feature distinguishes the in situ formed catalyst from a standard bulk Cu foil reference?
3. What physical or chemical role is the bzimpy ligand hypothesized to play in determining the specific structural nature of the Cu0 species formed at -1.24 V?
Ground Truth
Material: [Cu(bzimpy)Cl2]
Measurement: Cu K-edge in situ XAS, fluorescence mode, ISS beamline (NSLS-II)
Fit method: EXAFS fitting (XANES LCF not reported)
Phase fractions: (±10%)
| Phase | Fraction |
|---|---|
| undercoordinated Cu0 | 1.0 |
Fit basis (paper's reference spectra):
- Cu foil
- Cu2O
- CuO
Source evidence: Figure 4a,b (green lines); Page 8-9, 'Probing the Active Sites' section
Key reasoning: At -1.24 V, the XANES spectrum of [Cu(bzimpy)Cl2] resembles that of the reference Cu foil, indicating the reduction of Cu2+ centers to Cu0. The corresponding FT-EXAFS spectrum shows a Cu-Cu bond peak centered at ~2.2 Å, but its intensity is smaller than that of the reference Cu foil. This lower intensity indicates the formation of undercoordinated Cu0 species (nanostructures), which are hypothesized to be stabilized by the surrounding tridentate bzimpy ligands.
Reasoning source: Page 8-9, 'Probing the Active Sites' section
Scoring Rubric (total: 100 pts)
| Q | Type | Max | Question | Reference Answer | Scoring Criteria |
|---|---|---|---|---|---|
| q1 | identification | 30 | Based on the in situ XAS measurements at -1.24 V vs RHE, what is the dominant copper phase present in the [Cu(bzimpy)Cl2]-derived catalyst, and what is the primary XANES spectral evidence for this assignment? | The dominant copper phase present in the catalyst is undercoordinated Cu0, which accounts for 1.0 (100%) of the copper species. The primary XANES spectral evidence for this assignment is that the spectrum closely resembles that of a reference metallic Cu foil. This specific phase arises because the highly negative applied potential of -1.24 V vs RHE during CO2 reduction drives the complete reduction of the initial Cu2+ centers in the [Cu(bzimpy)Cl2] complex to metallic Cu0. Furthermore, the formation of undercoordinated Cu0 nanostructures, rather than bulk copper, occurs because the surrounding tridentate bzimpy ligands from the initial complex stabilize these smaller species during the electrochemical reduction process. | Full credit for identifying Cu0 (metallic copper) as the dominant phase and stating that the XANES spectrum resembles that of a reference Cu foil. |
| q2 | spectral | 35 | Although the XANES spectrum at -1.24 V resembles bulk metallic copper, what specific XAS feature distinguishes the in situ formed catalyst from a standard bulk Cu foil reference? | The distinguishing XAS feature is found in the FT-EXAFS spectrum, which shows a Cu-Cu bond peak centered at ~2.2 Å with a significantly lower intensity compared to the bulk Cu foil reference. This lower intensity indicates the formation of undercoordinated Cu0 nanostructures rather than bulk metallic copper. These specific spectral features arise because the applied cathodic potential of -1.24 V reduces the Cu2+ centers, while the surrounding tridentate bzimpy ligands from the original [Cu(bzimpy)Cl2] material restrict the growth of the copper clusters. Consequently, the ligands stabilize the reduced copper as undercoordinated nanostructures, preventing the formation of a fully coordinated bulk metallic lattice and thereby reducing the EXAFS peak intensity. | Full credit for mentioning that the FT-EXAFS spectrum shows a Cu-Cu bond peak (at ~2.2 Å) with a lower intensity compared to the bulk Cu foil, indicating undercoordinated Cu0 species. |
| q3 | reasoning | 35 | What physical or chemical role is the bzimpy ligand hypothesized to play in determining the specific structural nature of the Cu0 species formed at -1.24 V? | The tridentate bzimpy ligand is hypothesized to stabilize the formation of undercoordinated Cu0 nanostructures during the electrochemical process. When the [Cu(bzimpy)Cl2] complex is subjected to a highly reducing potential of -1.24 V vs RHE during CO2 reduction, the Cu2+ centers are reduced to Cu0. Instead of aggregating into bulk metallic copper, the surrounding bzimpy ligands restrict extensive Cu-Cu bond formation, resulting in a lower coordination number. This stabilization mechanism explains why the resulting material exhibits a Cu-Cu bond peak at ~2.2 Å with a significantly lower intensity than that of bulk Cu foil, confirming the undercoordinated nature of the catalyst under these specific operating conditions. | Full credit for explaining that the bzimpy ligand is hypothesized to stabilize the undercoordinated Cu0 sites (or assist in a ligand-assisted process that maintains the nanostructured/undercoordinated nature of the copper). |
Review
In Situ Studies of Ru-CeO 2 –TiO 2 Catalysts for Selective CO 2 Hydrogenation to Methane: Importance of Metal ↔ Oxide–Oxide Interactions
BNL-NSLS-II-8-ID
Catalyst
Irene Barba-Nieto et al.
DOI: 10.1021/acscatal.5c07042
6 scenarios
▶
#742
Ru-CeO2-TiO2
Ru, Ce Ru K-edge, Ce L3-edge
▶
LLM Prompt
Sample Information
Material: Ru-CeO2-TiO2
Support: CeO2-TiO2
Reaction Conditions: Air, room temperature
Sample-Specific Conditions
- Ru loading: 1%
- Fresh 1% Ru-CeO2-TiO2 catalyst before reaction
Measurement
We plan to measure the Ru, Ce Ru K-edge, Ce L3-edge XANES spectrum of this sample.
Questions
Based on all the information above:
1. Based on the sample conditions (fresh catalyst calcined in air), what is the expected dominant Ru phase, and what physical reasoning supports this?
2. What reference spectra should be included in a basis set to analyze the Ru K-edge XANES of this fresh sample and to monitor its potential reduction during subsequent catalytic testing?
3. Describe how the expected Ru K-edge XANES spectral features of this fresh sample distinguish it from metallic ruthenium.
Ground Truth
Material: Ru-CeO2-TiO2
Measurement: Ru K-edge XANES in fluorescence mode at 8-ID beamline of NSLS-II
Fit method: Qualitative comparison to reference spectra
Phase fractions: (±10%)
| Phase | Fraction |
|---|---|
| RuO2 | 1.0 |
Fit basis (paper's reference spectra):
- RuO2
- Ru foil
Source evidence: Figure 3.a and Section 3.3.A, page 11
Key reasoning: Measurements of the fresh samples were carried out before introducing reaction gases. The XANES spectra of all fresh samples, including the 1% Ru-Ce-Ti catalyst, show a clear match with the RuO2 reference spectrum, indicating that Ru is present as oxidized RuO2 after the calcination process at 500 °C.
Reasoning source: Section 3.3.A, page 11
Scoring Rubric (total: 100 pts)
| Q | Type | Max | Question | Reference Answer | Scoring Criteria |
|---|---|---|---|---|---|
| q1 | reasoning | 35 | Based on the sample conditions (fresh catalyst calcined in air), what is the expected dominant Ru phase, and what physical reasoning supports this? | The expected dominant Ru phase for the fresh 1% Ru-CeO2-TiO2 catalyst is fully oxidized RuO2 (Ru 4+), representing a fraction of 1.0. This phase is expected because the sample is a fresh catalyst measured in air at room temperature before the introduction of any reaction gases. Specifically, the catalyst underwent a calcination process at 500 °C, which fully oxidizes the ruthenium species. As a result of these pre-reaction conditions, the XANES spectrum shows a clear match with the RuO2 reference spectrum, confirming the absence of metallic Ru. | Full points if the answer identifies RuO2 as the dominant phase and explains that the calcination in air prior to reaction oxidizes the Ru precursor to RuO2. |
| q2 | identification | 30 | What reference spectra should be included in a basis set to analyze the Ru K-edge XANES of this fresh sample and to monitor its potential reduction during subsequent catalytic testing? | The basis set for analyzing the Ru K-edge XANES of this sample should include RuO2 and Ru foil reference spectra. These specific references are required because the fresh 1% Ru-CeO2-TiO2 catalyst, having been calcined at 500 °C and kept in air at room temperature before the reaction, is initially present entirely as oxidized RuO2. Including the Ru foil reference is necessary to monitor potential reduction, as it provides the spectral signature for metallic Ru. Together, these references allow for the quantification of the initial fully oxidized state (1.0 fraction RuO2) and the tracking of any metallic features that may emerge during subsequent testing. | Full points if the answer identifies RuO2 (for the fresh state) and Ru foil/metallic Ru (for the reduced state) as the necessary reference spectra. |
| q3 | spectral | 35 | Describe how the expected Ru K-edge XANES spectral features of this fresh sample distinguish it from metallic ruthenium. | The Ru K-edge XANES spectrum of the fresh 1% Ru-CeO2-TiO2 sample exhibits a characteristic oxidized shape that closely matches the RuO2 reference spectrum. This specific spectral shape arises because the fresh catalyst was calcined at 500 °C and measured in air at room temperature prior to reaction, leaving the ruthenium fully oxidized in a 4+ state. The spectrum is distinguishable from metallic ruthenium (Ru foil), which typically presents two well-defined peaks at approximately 22127 - 22151 eV. Because the sample remains in a fully oxidized state under these initial conditions, its XANES spectrum completely lacks these characteristic metallic features. | Full points if the answer notes that the fresh sample matches RuO2 and lacks the two well-defined peaks at c.a. 22127 - 22151 eV that are characteristic of metallic Ru (Ru foil). |
Review
#743
Ru-CeO2-TiO2
Ru, Ce Ru K-edge, Ce L3-edge
▶
LLM Prompt
Sample Information
Material: Ru-CeO2-TiO2
Support: CeO2-TiO2
Reaction Conditions: H2/Ar (6/14 mL/min), 250 °C
Sample-Specific Conditions
- Reaction condition: H2 250°C
- 1% Ru-CeO2-TiO2 catalyst under H2 at 250 °C
Measurement
We plan to measure the Ru, Ce Ru K-edge, Ce L3-edge XANES spectrum of this sample.
Questions
Based on all the information above:
1. Based on the reaction conditions (H2 at 250 °C), what is the expected dominant Ru phase in the 1% Ru-CeO2-TiO2 catalyst, and what reference spectra would be necessary to confirm this?
2. Explain the physical reasoning for the expected Ru phase under these conditions. How does the CeO2-TiO2 support influence this state?
3. Describe the expected spectral shape and key features of the Ru K-edge XANES spectrum for this sample under H2 at 250 °C.
Ground Truth
Material: 1% Ru-CeO2-TiO2
Measurement: in-situ Ru K-edge XANES, fluorescence mode, 8-ID beamline at NSLS-II
Fit method: Qualitative comparison
Phase fractions: (±5%)
| Phase | Fraction |
|---|---|
| metallic Ru | 1.0 |
Fit basis (paper's reference spectra):
- Ru foil
- RuO2
Source evidence: Figure 3b, page 15; text on page 14
Key reasoning: Under H2 at 250 °C, the Ru K-edge XANES spectrum of the 1% Ru-Ce-Ti catalyst shows the same trend as the Ru foil reference. The characteristic peaks of metallic Ru appear, indicating that the metal center is completely reduced. The presence of CeO2-TiO2 facilitates this reduction compared to binary samples.
Reasoning source: Section 3.3.A, page 14
Scoring Rubric (total: 100 pts)
| Q | Type | Max | Question | Reference Answer | Scoring Criteria |
|---|---|---|---|---|---|
| q1 | identification | 30 | Based on the reaction conditions (H2 at 250 °C), what is the expected dominant Ru phase in the 1% Ru-CeO2-TiO2 catalyst, and what reference spectra would be necessary to confirm this? | The expected dominant Ru phase in the 1% Ru-CeO2-TiO2 catalyst is metallic Ru, which accounts for a fraction of 1.0. To confirm this phase, reference spectra for Ru foil and RuO2 are necessary as a fit basis for qualitative comparison. This completely metallic phase arises because the sample is exposed to a reducing H2 atmosphere at 250 °C, which drives the reduction of the metal center. Additionally, the specific CeO2-TiO2 support facilitates this complete reduction to metallic Ru more effectively than binary support samples under the same conditions. | Full points for identifying metallic Ru as the dominant phase (fraction 1.0) and listing Ru foil and RuO2 as necessary reference spectra. |
| q2 | reasoning | 35 | Explain the physical reasoning for the expected Ru phase under these conditions. How does the CeO2-TiO2 support influence this state? | Under the reducing conditions of H2 gas at 250 °C, the Ru metal center in the 1% Ru-CeO2-TiO2 catalyst undergoes complete reduction to an oxidation state of 0. This results in a 100% metallic Ru phase, as evidenced by the spectrum matching a Ru foil reference. The CeO2-TiO2 support plays a crucial role in this state by actively facilitating the reduction of the Ru species compared to binary samples. Consequently, the combination of the hydrogen atmosphere, elevated temperature, and the specific support composition drives the complete conversion to metallic Ru. | Full points for explaining that H2 at 250 °C completely reduces the Ru, and that the CeO2-TiO2 support facilitates this reduction compared to supports without TiO2. |
| q3 | spectral | 35 | Describe the expected spectral shape and key features of the Ru K-edge XANES spectrum for this sample under H2 at 250 °C. | The Ru K-edge XANES spectrum for this sample is expected to show the same overall trend and shape as a metallic Ru foil reference. The key distinguishing spectral features are two well-defined peaks located at approximately 22127 eV and 22151 eV, which clearly differentiate the sample from oxidized Ru (RuO2). These specific spectral features emerge because the H2 atmosphere at 250 °C, combined with the reduction-facilitating CeO2-TiO2 support, completely reduces the Ru to a metallic state (oxidation state 0). As a result, the electronic and structural properties of the catalyst mirror those of pure metallic Ru, producing its characteristic absorption peaks. | Full points for mentioning the spectrum matches Ru foil and identifying the two well-defined peaks at approximately 22127 and 22151 eV. |
Review
#744
Ru-CeO2
Ru, Ce Ru K-edge, Ce L3-edge
▶
LLM Prompt
Sample Information
Material: Ru-CeO2
Preparation: Synthesized via a reverse microemulsion method using N-heptane as the organic phase, Triton X-100 as surfactant, and hexanol as co-surfactant. Ce(NO)3 and RuCl3 were introduced into the aqueous phase of the first microemulsion, while tetramethylammonium-hydroxide (TMAH) was used in the second. The microemulsions were combined, stirred for 24 hours, centrifuged, rinsed, and dried at 110 °C for 12 hours, followed by calcination at 500 °C (2 °C/min ramp) for 2 hours. For in-situ XAFS measurements, the sample was placed in a Clausen cell flow reactor and heated to 250 °C at a rate of 10 °C/min under H2/Ar flow.
Support: CeO2
Reaction Conditions: H2/Ar (6/14 mL/min), 250 °C
Sample-Specific Conditions
- Catalyst composition: Binary (no TiO2)
- 5% Ru-CeO2 binary catalyst under H2 at 250 °C
Preparation
- Synthesized via a reverse microemulsion method using N-heptane as the organic phase, Triton X-100 as surfactant, and hexanol as co-surfactant. Ce(NO)3 and RuCl3 were introduced into the aqueous phase of the first microemulsion, while tetramethylammonium-hydroxide (TMAH) was used in the second. The microemulsions were combined, stirred for 24 hours, centrifuged, rinsed, and dried at 110 °C for 12 hours, followed by calcination at 500 °C (2 °C/min ramp) for 2 hours. For in-situ XAFS measurements, the sample was placed in a Clausen cell flow reactor and heated to 250 °C at a rate of 10 °C/min under H2/Ar flow.
Measurement
We plan to measure the Ru, Ce Ru K-edge, Ce L3-edge XANES spectrum of this sample.
Questions
Based on all the information above:
1. Based on the expected chemical states of ceria during reduction, what reference spectra should be used as the basis for fitting the Ce L3-edge XANES spectrum of the 5% Ru-CeO2 catalyst under H2 at 250 °C?
2. Estimate the relative fractions of Ce3+ and Ce4+ in the 5% Ru-CeO2 binary catalyst when reduced under H2 at 250 °C.
3. Provide a physical explanation for the observed oxidation state distribution of Ce in the binary Ru-CeO2 catalyst under H2 at 250 °C, specifically addressing why it remains predominantly Ce4+.
Ground Truth
Material: 5% Ru-CeO2
Measurement: Ce L3-edge in-situ XANES at 8-ID beamline (NSLS-II)
Fit method: Linear Combination Fitting (implied by percentage extraction)
Phase fractions: (±10%)
| Phase | Fraction |
|---|---|
| Ce3+ | 0.34 |
| Ce4+ | 0.66 |
Fit basis (paper's reference spectra):
- Ce3+ reference
- Ce4+ reference
Source evidence: Page 19, Section 3.3.A, Figure 8b
Key reasoning: In the binary Ru-CeO2 catalyst, ceria exhibits limited reducibility under H2 at 250 °C compared to the ternary Ru-CeO2-TiO2 system. Without TiO2 to facilitate interfacial electronic transfer, the formation of Ce3+ is not as strongly promoted. Consequently, the sample remains predominantly Ce4+ with only a slight increase in Ce3+ content to approximately 34%.
Reasoning source: Page 19, Section 3.3.A
Scoring Rubric (total: 100 pts)
| Q | Type | Max | Question | Reference Answer | Scoring Criteria |
|---|---|---|---|---|---|
| q1 | identification | 20 | Based on the expected chemical states of ceria during reduction, what reference spectra should be used as the basis for fitting the Ce L3-edge XANES spectrum of the 5% Ru-CeO2 catalyst under H2 at 250 °C? | The fitting basis should consist of Ce3+ and Ce4+ reference spectra. These phases are expected because the 5% Ru-CeO2 catalyst undergoes partial reduction under H2 flow at 250 °C. However, because this binary catalyst lacks TiO2, interfacial electronic transfer is restricted, leading to limited ceria reducibility. Consequently, the sample retains a predominantly Ce4+ character while forming a minor Ce3+ phase, necessitating both references for accurate linear combination fitting. | Full credit for identifying Ce3+ and Ce4+ reference spectra as the necessary basis functions. |
| q2 | quantification | 40 | Estimate the relative fractions of Ce3+ and Ce4+ in the 5% Ru-CeO2 binary catalyst when reduced under H2 at 250 °C. | The estimated relative fractions for the catalyst are 34% Ce3+ and 66% Ce4+, with an uncertainty of 10%. These specific values arise because the binary 5% Ru-CeO2 catalyst exhibits limited reducibility under H2 at 250 °C compared to ternary systems. Without TiO2 present to facilitate interfacial electronic transfer, the reduction of ceria is not strongly promoted. As a result, the sample only undergoes a slight increase in Ce3+ content, remaining predominantly in the Ce4+ oxidation state. | Full credit for estimating approximately 34% Ce3+ and 66% Ce4+. Partial credit for values within ±10% of the ground truth. |
| q3 | reasoning | 40 | Provide a physical explanation for the observed oxidation state distribution of Ce in the binary Ru-CeO2 catalyst under H2 at 250 °C, specifically addressing why it remains predominantly Ce4+. | The observed oxidation state distribution of 66% Ce4+ and 34% Ce3+ occurs because ceria exhibits limited reducibility in the binary 5% Ru-CeO2 catalyst under H2 at 250 °C. The key physical mechanism limiting reduction is the absence of TiO2, which would otherwise facilitate interfacial electronic transfer to strongly promote the formation of Ce3+. Without this additional support component, the hydrogen treatment at 250 °C can only induce a slight increase in Ce3+ content. Therefore, the catalyst remains predominantly Ce4+. | Full credit for explaining that the binary catalyst lacks the interfacial electronic transfer provided by a support like TiO2, which limits its reducibility and prevents the strong promotion of Ce3+ formation. |
Review
#745
Ru-CeO2-TiO2
Ru, Ce Ru K-edge, Ce L3-edge
▶
LLM Prompt
Sample Information
Material: Ru-CeO2-TiO2
Support: CeO2-TiO2
Reaction Conditions: H2/Ar (6/14 mL/min), 250 °C
Sample-Specific Conditions
- Catalyst composition: Ternary (with TiO2)
- 0.25% Ru-CeO2-TiO2 ternary catalyst under H2 at 250 °C
Measurement
We plan to measure the Ru, Ce Ru K-edge, Ce L3-edge XANES spectrum of this sample.
Questions
Based on all the information above:
1. What candidate reference spectra are needed to model the Ce L3-edge XANES spectrum of this catalyst under the specified reaction conditions?
2. Estimate the phase fractions of the cerium species present in the 0.25% Ru-CeO2-TiO2 catalyst under H2 at 250 °C.
3. Explain the physical reasoning for the observed cerium oxidation state distribution in this ternary catalyst under H2 at 250 °C, particularly in comparison to a binary Ru-CeO2 system.
Ground Truth
Material: Ru-CeO2-TiO2
Measurement: Ce L3-edge in-situ XANES, fluorescence mode, 8-ID beamline at NSLS-II
Fit method: Linear Combination Fitting (implied by reported fractions)
Phase fractions: (±10%)
| Phase | Fraction |
|---|---|
| Ce3+ | 0.85 |
| Ce4+ | 0.15 |
Fit basis (paper's reference spectra):
- Ce3+ reference
- Ce4+ reference
Source evidence: Page 21, text and Figure 8b
Key reasoning: The presence of TiO2 in the ternary catalyst allows for electronic transfer at the interface, significantly promoting the formation of Ce3+. Under H2 at 250 °C, the ternary catalyst reaches 85% Ce3+, whereas the binary Ru-CeO2 catalyst only reaches 34% Ce3+. This enhanced reducibility is attributed to oxide-oxide interactions where the additional electron associated with Ce3+ can be transferred to Ru sites, stabilizing the metallic Ru phase and preventing its re-oxidation.
Reasoning source: Page 21, Section 3.3.A (X-ray absorption fine structure studies)
Scoring Rubric (total: 100 pts)
| Q | Type | Max | Question | Reference Answer | Scoring Criteria |
|---|---|---|---|---|---|
| q1 | identification | 20 | What candidate reference spectra are needed to model the Ce L3-edge XANES spectrum of this catalyst under the specified reaction conditions? | To model the Ce L3-edge XANES spectrum of this catalyst, a Ce3+ reference and a Ce4+ reference are required. These specific reference phases are expected because the 0.25% Ru-CeO2-TiO2 ternary catalyst undergoes partial reduction under the H2/Ar atmosphere at 250 °C. The presence of TiO2 in the support facilitates electronic transfer at the oxide-oxide interface, significantly promoting the reduction of initial Ce4+ to Ce3+. Consequently, a mixture of both oxidation states exists in the sample, necessitating both standards for accurate linear combination fitting. | Full points for identifying Ce3+ and Ce4+ reference spectra as the necessary basis components. |
| q2 | quantification | 40 | Estimate the phase fractions of the cerium species present in the 0.25% Ru-CeO2-TiO2 catalyst under H2 at 250 °C. | The estimated phase fractions for the cerium species in the catalyst are 85% Ce3+ and 15% Ce4+, with an uncertainty of 10%. These specific values arise because the H2 reducing environment at 250 °C acts synergistically with the ternary Ru-CeO2-TiO2 composition. The inclusion of TiO2 creates strong oxide-oxide interactions that enable interfacial electronic transfer, drastically enhancing ceria reducibility. This allows the additional electrons associated with Ce3+ formation to transfer to Ru sites, stabilizing the metallic Ru phase and driving the Ce3+ fraction to a high 85%. | Full points for estimating ~85% Ce3+ and ~15% Ce4+. Deduct points proportionally for deviations greater than 10% from these values. |
| q3 | reasoning | 40 | Explain the physical reasoning for the observed cerium oxidation state distribution in this ternary catalyst under H2 at 250 °C, particularly in comparison to a binary Ru-CeO2 system. | Under H2 at 250 °C, the 0.25% Ru-CeO2-TiO2 ternary catalyst reaches a highly reduced state of 85% Ce3+, which is substantially greater than the 34% Ce3+ achieved by the binary Ru-CeO2 catalyst under identical conditions. This enhanced reducibility is physically driven by the addition of TiO2, which fosters strong oxide-oxide interactions and facilitates electronic transfer at the interface. During reduction, the additional electron associated with the formation of Ce3+ is transferred to the Ru sites. This interfacial electron transfer stabilizes the metallic Ru phase, prevents its re-oxidation, and thermodynamically promotes the extensive formation of Ce3+. | Full points for explaining that the presence of TiO2 promotes interfacial electronic transfer, leading to a significantly higher Ce3+ fraction (85%) compared to the binary system. Must mention the role of oxide-oxide interactions in enhancing ceria reducibility. |
Review
#746
Ru-CeO2
Ru, Ce Ru K-edge, Ce L3-edge
▶
LLM Prompt
Sample Information
Material: Ru-CeO2
Preparation: The 5% Ru-Ce catalyst was prepared using a reverse microemulsion method. Two microemulsions were prepared with N-heptane (organic phase), Triton X-100 (surfactant), and hexanol (co-surfactant). The first contained Ce(NO)3 and RuCl3 in the aqueous phase, while the second contained tetramethylammonium-hydroxide (TMAH). Water/Metal and water/surfactant molar ratios were 110 and 18, respectively. After stirring for 1 h, the second microemulsion was added to the first and stirred for 24 h. The solid precursor was centrifuged, rinsed, dried at 110 °C for 12 h, and calcined at 500 °C (2 °C/min ramp) for 2 h. For the in-situ XAS measurement, the sample was placed in a Clausen cell flow reactor and heated to 250 °C at 10 °C/min under a H2/CO2/Ar (6/1.5/12.5 mL/min) gas mixture at atmospheric pressure.
Support: CeO2
Reaction Conditions: H2/CO2/Ar (6/1.5/12.5 mL/min), 250 °C
Sample-Specific Conditions
- Catalyst composition: Binary (no TiO2)
- 5% Ru-CeO2 binary catalyst under CO2+H2 at 250 °C
Preparation
- The 5% Ru-Ce catalyst was prepared using a reverse microemulsion method. Two microemulsions were prepared with N-heptane (organic phase), Triton X-100 (surfactant), and hexanol (co-surfactant). The first contained Ce(NO)3 and RuCl3 in the aqueous phase, while the second contained tetramethylammonium-hydroxide (TMAH). Water/Metal and water/surfactant molar ratios were 110 and 18, respectively. After stirring for 1 h, the second microemulsion was added to the first and stirred for 24 h. The solid precursor was centrifuged, rinsed, dried at 110 °C for 12 h, and calcined at 500 °C (2 °C/min ramp) for 2 h. For the in-situ XAS measurement, the sample was placed in a Clausen cell flow reactor and heated to 250 °C at 10 °C/min under a H2/CO2/Ar (6/1.5/12.5 mL/min) gas mixture at atmospheric pressure.
Measurement
We plan to measure the Ru, Ce Ru K-edge, Ce L3-edge XANES spectrum of this sample.
Questions
Based on all the information above:
1. What candidate reference spectra are needed to model the Ce L3-edge XANES of the Ru-CeO2 catalyst under CO2+H2 conditions?
2. Estimate the phase fractions of the cerium oxidation states for the 5% Ru-CeO2 binary catalyst under a CO2+H2 mixture at 250 °C.
3. Explain the physical reasoning for why the Ce3+ fraction in the binary Ru-CeO2 catalyst is lower than that of a TiO2-containing ternary catalyst under CO2 methanation conditions.
Ground Truth
Material: Ru-CeO2
Measurement: in-situ XANES at Ce L3-edge in fluorescence mode at 8-ID beamline
Fit method: Linear combination analysis
Phase fractions: (±10%)
| Phase | Fraction |
|---|---|
| Ce3+ | 0.44 |
| Ce4+ | 0.56 |
Fit basis (paper's reference spectra):
- Ce3+ reference
- Ce4+ reference
Source evidence: Page 19 text and Figure 8d
Key reasoning: Under a CO2 and H2 mixture at 250 °C, the binary Ru-Ce catalyst reaches a Ce3+ fraction of 44%. This is significantly lower than the 93% observed in the ternary Ru-Ce-Ti catalyst under the same conditions. The lower Ce3+ content in the binary sample is due to the absence of TiO2, which in the ternary system allows for interfacial electronic transfer that promotes and stabilizes the formation of Ce3+.
Reasoning source: Page 19, Section 3.3
Scoring Rubric (total: 100 pts)
| Q | Type | Max | Question | Reference Answer | Scoring Criteria |
|---|---|---|---|---|---|
| q1 | identification | 20 | What candidate reference spectra are needed to model the Ce L3-edge XANES of the Ru-CeO2 catalyst under CO2+H2 conditions? | The candidate reference spectra needed for linear combination analysis are a Ce3+ reference and a Ce4+ reference. Under the reducing H2/CO2/Ar gas mixture at 250 °C, the CeO2 support in the 5% Ru-CeO2 binary catalyst undergoes partial reduction. Because the sample lacks TiO2, which would otherwise promote interfacial electronic transfer to stabilize more Ce3+, the cerium exists as a mixture of both reduced Ce3+ and unreduced Ce4+ states. Therefore, both oxidation state references are required to accurately model the resulting Ce L3-edge XANES spectrum. | Full points for identifying Ce3+ and Ce4+ reference spectra. |
| q2 | quantification | 40 | Estimate the phase fractions of the cerium oxidation states for the 5% Ru-CeO2 binary catalyst under a CO2+H2 mixture at 250 °C. | The estimated phase fractions for the cerium oxidation states are 44% Ce3+ and 56% Ce4+, with an uncertainty of 10%. These specific values arise because the 5% Ru-CeO2 catalyst is exposed to a reducing H2/CO2/Ar gas mixture at 250 °C, which partially reduces the ceria support. The Ce3+ fraction is limited to 44% specifically due to the binary nature of the catalyst and the absence of TiO2. Without TiO2 to provide interfacial electronic transfer that promotes and stabilizes further reduction, a significant portion (56%) of the cerium remains in the unreduced Ce4+ state. | Full points for estimating approximately 44% Ce3+ and 56% Ce4+. |
| q3 | reasoning | 40 | Explain the physical reasoning for why the Ce3+ fraction in the binary Ru-CeO2 catalyst is lower than that of a TiO2-containing ternary catalyst under CO2 methanation conditions. | The Ce3+ fraction in the binary 5% Ru-CeO2 catalyst reaches only 44% under the H2/CO2/Ar mixture at 250 °C, which is significantly lower than the 93% observed in a ternary Ru-Ce-Ti catalyst. This difference occurs because the binary catalyst lacks TiO2 in its composition. In the ternary system, the presence of TiO2 enables interfacial electronic transfer that actively promotes and stabilizes the formation of Ce3+. Without this TiO2-driven interfacial charge transfer, the binary Ru-CeO2 catalyst cannot stabilize as much Ce3+ under the same reducing conditions, leaving a larger fraction of the support as Ce4+. | Full points for explaining that the binary sample lacks the TiO2 interface, which is responsible for promoting interfacial electronic transfer and stabilizing the formation of Ce3+. |
Review
#747
Ru-CeO2-TiO2
Ru, Ce Ru K-edge, Ce L3-edge
▶
LLM Prompt
Sample Information
Material: Ru-CeO2-TiO2
Support: CeO2-TiO2
Reaction Conditions: H2/CO2/Ar (6/1.5/12.5 mL/min), 250 °C
Sample-Specific Conditions
- Catalyst composition: Ternary (with TiO2)
- 0.25% Ru-CeO2-TiO2 ternary catalyst under CO2+H2 at 250 °C
Measurement
We plan to measure the Ru, Ce Ru K-edge, Ce L3-edge XANES spectrum of this sample.
Questions
Based on all the information above:
1. What candidate reference spectra are needed to fit the Ce L3-edge XANES spectrum of the 0.25% Ru-CeO2-TiO2 catalyst under CO2+H2 at 250 °C?
2. Estimate the phase fractions of Ce3+ and Ce4+ for this ternary catalyst under the specified reaction conditions (CO2+H2 at 250 °C).
3. Explain the physical reasoning for the high fraction of Ce3+ observed in this ternary Ru-CeO2-TiO2 catalyst compared to a binary Ru-CeO2 catalyst under the same methanation conditions.
Ground Truth
Material: 0.25% Ru-CeO2-TiO2
Measurement: Ce L3-edge in-situ XANES at 8-ID beamline of NSLS-II
Fit method: Linear Combination Fitting (LCF) of XANES
Phase fractions: (±10%)
| Phase | Fraction |
|---|---|
| Ce3+ | 0.93 |
| Ce4+ | 0.07 |
Fit basis (paper's reference spectra):
- Ce3+ reference
- Ce4+ reference
Source evidence: Page 21, text and Figure 8d
Key reasoning: The presence of TiO2 in the ternary catalyst allows electronic transfer at the interface, promoting the formation of Ce3+. Under the CO2+H2 reaction mixture at 250 °C, the Ce3+ fraction reaches 93%, which is significantly higher than in the binary Ru-CeO2 sample (44%). This high degree of reduction is attributed to the synergistic oxide-oxide interactions that facilitate redox cycling and stabilize metallic Ru.
Reasoning source: Page 21, Section 3.3.A
Scoring Rubric (total: 100 pts)
| Q | Type | Max | Question | Reference Answer | Scoring Criteria |
|---|---|---|---|---|---|
| q1 | identification | 20 | What candidate reference spectra are needed to fit the Ce L3-edge XANES spectrum of the 0.25% Ru-CeO2-TiO2 catalyst under CO2+H2 at 250 °C? | To fit the Ce L3-edge XANES spectrum of the 0.25% Ru-CeO2-TiO2 catalyst, the required candidate reference spectra are a Ce3+ reference and a Ce4+ reference. These specific phases are expected because the catalyst undergoes partial reduction under the H2/CO2/Ar reaction mixture at 250 °C. The presence of TiO2 in the ternary support creates synergistic oxide-oxide interactions that allow electronic transfer at the interface, strongly promoting the reduction of Ce4+ to Ce3+. Consequently, both oxidation states must be included in the Linear Combination Fitting to accurately capture the redox state of the ceria support. | Full points for identifying Ce3+ and Ce4+ reference spectra. |
| q2 | quantification | 40 | Estimate the phase fractions of Ce3+ and Ce4+ for this ternary catalyst under the specified reaction conditions (CO2+H2 at 250 °C). | Under the specified H2/CO2/Ar reaction conditions at 250 °C, the estimated phase fractions for the 0.25% Ru-CeO2-TiO2 catalyst are 93% Ce3+ and 7% Ce4+, with an uncertainty of 10%. These specific values arise because the inclusion of TiO2 in the support enables strong synergistic oxide-oxide interactions and interfacial electronic transfer. This mechanism highly promotes the formation of Ce3+, driving the reduction to 93%, which is necessary to facilitate redox cycling and stabilize the metallic Ru active sites during the reaction. | Full points for estimating ~93% Ce3+ and ~7% Ce4+. Partial credit for identifying that Ce3+ is the highly dominant phase (>80%). |
| q3 | reasoning | 40 | Explain the physical reasoning for the high fraction of Ce3+ observed in this ternary Ru-CeO2-TiO2 catalyst compared to a binary Ru-CeO2 catalyst under the same methanation conditions. | The high fraction of Ce3+ (93%) in the ternary 0.25% Ru-CeO2-TiO2 catalyst, compared to only 44% in the binary Ru-CeO2 sample, is fundamentally driven by the addition of TiO2 to the support. Under the H2/CO2/Ar reaction mixture at 250 °C, the TiO2 enables synergistic oxide-oxide interactions that facilitate electronic transfer at the catalyst interface. This enhanced interfacial charge transfer strongly promotes the reduction of ceria to Ce3+. Ultimately, this high degree of reduction is critical for the catalyst's performance, as it facilitates efficient redox cycling and stabilizes the metallic Ru species. | Full points for mentioning the presence of TiO2, electronic transfer at the CeO2-TiO2 interface, and how this promotes/stabilizes the formation of Ce3+. |
Review
Metal Identity and Coordination Environment Modulate Single-Atom Catalyst Stability During Electrocatalysis
BNL-NSLS-II-8-ID
Catalyst
Kali Rigby et al.
DOI: 10.1021/acscatal.6c02142
12 scenarios
▶
#748
Cu single atoms
Cu K-edge
▶
LLM Prompt
Sample Information
Material: Cu single atoms
Support: carbon
Reaction Conditions: 0.1 M KNO3 + 0.1 M K2SO4, pH 11.5
Sample-Specific Conditions
- Applied Potential (V vs RHE): OCP
- Cu single-atom catalyst on carbon support at open circuit potential
Measurement
We plan to measure the Cu K-edge XANES spectrum of this sample.
Questions
Based on all the information above:
1. What reference spectra should be included in a linear combination fitting (LCF) model to accurately capture the speciation and coordination environment of this Cu single-atom catalyst at OCP in an aqueous electrolyte?
2. Based on the provided conditions (OCP, aqueous nitrate electrolyte), estimate the phase fractions of the Cu species present in the catalyst.
3. Explain why these specific Cu oxidation states and coordination environments dominate at open circuit potential before the onset of electrocatalytic nitrate reduction.
Ground Truth
Material: Cu single atoms on carbon support (Cu1)
Measurement: in situ Cu K-edge XANES at Beamline 8-ID (ISS), NSLS-II
Fit method: Linear combination fitting (LCF)
Phase fractions: (±10%)
| Phase | Fraction |
|---|---|
| CuO | 0.5 |
| [Cu(H2O)6]2+ | 0.35 |
| Cu2O | 0.15 |
Fit basis (paper's reference spectra):
- CuO
- Cu2O
- Cu foil
- [Cu(H2O)6]2+
Source evidence: Figure 1h and page 4 text
Key reasoning: At open circuit potential (OCP), the Cu single atoms (Cu1) exist primarily in a 2+ oxidation state, as evidenced by the dominance of CuO and [Cu(H2O)6]2+ components in the LCF. This reflects the initial oxidized state of the Cu atoms coordinated to the carbon support and the aqueous electrolyte before any reductive potential is applied for nitrate reduction. A minor fraction of Cu1+ (represented by Cu2O) is also present.
Reasoning source: Page 4, 'Metal Center Dictates Degree of Stability' section
Scoring Rubric (total: 100 pts)
| Q | Type | Max | Question | Reference Answer | Scoring Criteria |
|---|---|---|---|---|---|
| q1 | identification | 30 | What reference spectra should be included in a linear combination fitting (LCF) model to accurately capture the speciation and coordination environment of this Cu single-atom catalyst at OCP in an aqueous electrolyte? | The linear combination fitting (LCF) model should include reference spectra for CuO, Cu2O, Cu foil, and [Cu(H2O)6]2+. These specific references are required because, at open circuit potential (OCP) in the aqueous electrolyte (0.1 M KNO3 + 0.1 M K2SO4, pH 11.5), the Cu single atoms on the carbon support exist primarily in an initial oxidized state. The CuO and [Cu(H2O)6]2+ references capture the dominant Cu2+ oxidation state resulting from coordination to the carbon support and the aqueous environment before any reductive potential is applied. Additionally, the Cu2O reference is necessary to account for a minor fraction of Cu1+ present under these initial conditions, while Cu foil serves as a baseline for fully reduced Cu0. | Full points for identifying CuO (for Cu2+), Cu2O (for Cu1+), Cu foil (for Cu0), and [Cu(H2O)6]2+ (for hydrated Cu2+). Deduct points for missing references or suggesting irrelevant ones. |
| q2 | quantification | 40 | Based on the provided conditions (OCP, aqueous nitrate electrolyte), estimate the phase fractions of the Cu species present in the catalyst. | Under these conditions, the estimated phase fractions are 50% CuO, 35% [Cu(H2O)6]2+, and 15% Cu2O, with an uncertainty of 10%. These specific values result from the catalyst being held at open circuit potential (OCP) in the aqueous electrolyte prior to any applied reductive potential. Because no reductive potential is applied for nitrate reduction, the Cu single atoms remain primarily in a 2+ oxidation state (85% total between CuO and [Cu(H2O)6]2+), reflecting their initial oxidized coordination to the carbon support and the aqueous environment. The remaining 15% Cu2O fraction indicates that only a minor amount of Cu1+ is present under these resting conditions. | Full points for estimating ~50% CuO, ~35% [Cu(H2O)6]2+, and ~15% Cu2O (with 0% Cu foil/Cu0). Allow a +/- 10% margin of error for each fraction. |
| q3 | reasoning | 30 | Explain why these specific Cu oxidation states and coordination environments dominate at open circuit potential before the onset of electrocatalytic nitrate reduction. | At open circuit potential (OCP), the Cu single-atom catalyst on the carbon support exists primarily in a 2+ oxidation state, represented by the dominance of CuO (50%) and [Cu(H2O)6]2+ (35%) components. This occurs because, before any reductive potential is applied for nitrate reduction, the Cu atoms maintain their initial oxidized state. The specific coordination environments reflect the interaction of the Cu single atoms with both the carbon support and the surrounding aqueous electrolyte (0.1 M KNO3 + 0.1 M K2SO4, pH 11.5). A minor fraction of Cu1+ (15% Cu2O) is also present, but the lack of an applied reductive potential prevents further reduction to lower oxidation states like metallic Cu. | Full points for explaining that at OCP (before reductive potentials are applied), the Cu single atoms remain in their initial oxidized state (primarily Cu2+), coordinated to the support and hydrated by the aqueous electrolyte, with only a minor fraction of Cu1+ present. |
Review
#749
Cu single atoms / Cu nanoparticles
Cu K-edge
▶
LLM Prompt
Sample Information
Material: Cu single atoms / Cu nanoparticles
Support: carbon
Reaction Conditions: 0.1 M KNO3 + 0.1 M K2SO4, pH 11.5
Sample-Specific Conditions
- Applied Potential (V vs RHE): -0.8 V
- Cu single-atom catalyst on carbon support under reductive potential
Measurement
We plan to measure the Cu K-edge XANES spectrum of this sample.
Questions
Based on all the information above:
1. Based on the sample conditions (Cu single atoms on carbon under aqueous reductive potential), what candidate reference spectra should be included in a linear combination fitting (LCF) analysis of the XANES data to capture the expected oxidation states and coordination environments?
2. Estimate the relative fractions of Cu oxidation states (Cu0, Cu1+, Cu2+) present in the catalyst at an applied potential of -0.8 V vs RHE during the electrocatalytic nitrate reduction.
3. Explain the structural and electronic evolution of the Cu single-atom catalyst that leads to the estimated phase composition at -0.8 V. What physical transformation occurs to the catalyst at this potential?
Ground Truth
Material: Cu single atoms / Cu nanoparticles on carbon support
Measurement: in situ Cu K-edge XANES at Beamline 8-ID (ISS), NSLS-II
Fit method: Linear combination fitting (LCF)
Phase fractions: (±10%)
| Phase | Fraction |
|---|---|
| Cu foil | 0.9 |
| Cu2O | 0.05 |
| CuO | 0.05 |
Fit basis (paper's reference spectra):
- CuO
- Cu2O
- Cu foil
- [Cu(H2O)6]2+
Source evidence: Figure 1h and text on page 4
Key reasoning: Under applied reductive potentials, the Cu1 single-atom catalyst undergoes significant structural and electronic changes. Starting primarily as Cu-O coordinated Cu2+ at open circuit potential, it reduces to Cu1+ and then sharply to Cu0 at potentials more negative than -0.2 V. By -0.8 V, Cu0 is the dominant species, indicating the disruption of Cu-O coordination and the aggregation of single atoms into metallic Cu nanoparticles driven by the strong reductive potential.
Reasoning source: Results and Discussion section, 'Metal Center Dictates Degree of Stability', page 4
Scoring Rubric (total: 100 pts)
| Q | Type | Max | Question | Reference Answer | Scoring Criteria |
|---|---|---|---|---|---|
| q1 | identification | 25 | Based on the sample conditions (Cu single atoms on carbon under aqueous reductive potential), what candidate reference spectra should be included in a linear combination fitting (LCF) analysis of the XANES data to capture the expected oxidation states and coordination environments? | The candidate reference spectra for the linear combination fitting (LCF) analysis should include CuO, Cu2O, Cu foil, and [Cu(H2O)6]2+. These specific references are required because the Cu single-atom catalyst undergoes significant electronic and structural evolution under the applied reductive potential in the aqueous electrolyte (0.1 M KNO3 + 0.1 M K2SO4, pH 11.5). At open circuit potential, the catalyst exists primarily as Cu-O coordinated Cu2+, which necessitates the CuO and [Cu(H2O)6]2+ references. As the potential is driven to -0.8 V vs RHE, the catalyst reduces through a Cu1+ intermediate to a dominant Cu0 state, requiring the Cu2O and Cu foil references to capture the full transition from single atoms to aggregated metallic nanoparticles. | Full points for identifying the need for references covering Cu0 (metallic Cu/foil), Cu1+ (e.g., Cu2O), and Cu2+ (e.g., CuO), as well as a hydrated Cu2+ reference (like [Cu(H2O)6]2+) to account for the aqueous electrolyte environment. |
| q2 | quantification | 35 | Estimate the relative fractions of Cu oxidation states (Cu0, Cu1+, Cu2+) present in the catalyst at an applied potential of -0.8 V vs RHE during the electrocatalytic nitrate reduction. | At an applied potential of -0.8 V vs RHE, the estimated relative fractions are 90% Cu0 (Cu foil), 5% Cu1+ (Cu2O), and 5% Cu2+ (CuO), with an uncertainty of 10%. These specific values arise because the strong reductive potential in the pH 11.5 electrolyte drives a nearly complete reduction of the initial catalyst. While the catalyst starts as Cu2+, potentials more negative than -0.2 V cause a sharp reduction to Cu0. By -0.8 V, the reductive driving force is strong enough to disrupt the Cu-O coordination and aggregate the single atoms into metallic Cu nanoparticles, leaving Cu0 as the overwhelmingly dominant species with only minor residual oxidized fractions. | Full points for estimating that Cu0 (metallic copper) is the highly dominant phase (~90%), with only minor or trace amounts (~5% each) of oxidized species (Cu1+ and Cu2+) remaining. |
| q3 | reasoning | 40 | Explain the structural and electronic evolution of the Cu single-atom catalyst that leads to the estimated phase composition at -0.8 V. What physical transformation occurs to the catalyst at this potential? | Under the applied reductive potential of -0.8 V vs RHE in the aqueous nitrate/sulfate electrolyte, the Cu single-atom catalyst undergoes a profound structural and electronic transformation. Initially, at open circuit potential, the catalyst consists primarily of Cu-O coordinated Cu2+ single atoms on the carbon support. As the applied potential becomes more negative than -0.2 V, the Cu species reduce to Cu1+ and then sharply to Cu0. By -0.8 V, this strong reductive condition completely disrupts the initial Cu-O coordination bonds. This disruption causes a physical transformation where the isolated Cu single atoms aggregate into metallic Cu nanoparticles, resulting in a catalyst phase composition that is heavily dominated by Cu0. | Full points for explaining that the strong applied reductive potential drives the reduction of initial Cu2+ single atoms to Cu0, which disrupts the Cu-O coordination with the carbon support and causes the single atoms to aggregate into metallic Cu nanoparticles. |
Review
#750
Cu single atoms
Cu K-edge
▶
LLM Prompt
Sample Information
Material: Cu single atoms
Support: O-graphene
Reaction Conditions: 0.1 M KNO3 + 0.1 M K2SO4, pH 11.5
Sample-Specific Conditions
- Applied Potential (V vs RHE): OCP
- Cu single-atom catalyst on O-doped graphene at open circuit potential
Measurement
We plan to measure the Cu K-edge XANES spectrum of this sample.
Questions
Based on all the information above:
1. What reference spectra should be included in a Linear Combination Fitting (LCF) analysis of the Cu K-edge XANES to accurately capture the possible oxidation states and geometries of this Cu1/O catalyst during in situ electrochemical nitrate reduction?
2. Estimate the phase fractions of the Cu species present in the Cu1/O catalyst at open circuit potential (OCP) in the nitrate-containing electrolyte.
3. Explain why these specific Cu species and oxidation states are expected for the Cu1/O catalyst at OCP before the application of reductive potentials.
Ground Truth
Material: Cu single atoms on O-graphene (Cu1/O)
Measurement: in situ Cu K-edge XAS, Beamline 8-ID (ISS) at NSLS-II
Fit method: Linear combination fitting (LCF) of the XANES region
Phase fractions: (±10%)
| Phase | Fraction |
|---|---|
| CuO | 0.55 |
| [Cu(H2O)6]2+ | 0.25 |
| Cu2O | 0.2 |
Fit basis (paper's reference spectra):
- CuO
- Cu2O
- Cu foil
- [Cu(H2O)6]2+
Source evidence: Figure 3b and text on page 6
Key reasoning: At open circuit potential (OCP), the Cu single atoms on O-doped graphene (Cu1/O) are primarily in the Cu2+ oxidation state. The LCF analysis indicates a mixture of CuO-like and hydrated [Cu(H2O)6]2+ species, with a minor contribution from Cu1+ (Cu2O). This reflects the initial oxidized state of the catalyst in the aqueous electrolyte before reductive potentials are applied for nitrate reduction.
Reasoning source: Page 6, 'Coordination Environment Moderates Cu SAC Instability' section
Scoring Rubric (total: 100 pts)
| Q | Type | Max | Question | Reference Answer | Scoring Criteria |
|---|---|---|---|---|---|
| q1 | identification | 30 | What reference spectra should be included in a Linear Combination Fitting (LCF) analysis of the Cu K-edge XANES to accurately capture the possible oxidation states and geometries of this Cu1/O catalyst during in situ electrochemical nitrate reduction? | The reference spectra that should be included in the Linear Combination Fitting (LCF) analysis are CuO, Cu2O, Cu foil, and [Cu(H2O)6]2+. These specific references are required because, at the open circuit potential (OCP) in the aqueous 0.1 M KNO3 + 0.1 M K2SO4 (pH 11.5) electrolyte, the Cu single atoms on O-doped graphene are in an initial oxidized state. The inclusion of CuO and [Cu(H2O)6]2+ captures the dominant Cu2+ species interacting with the support and aqueous environment, while Cu2O and Cu foil account for minor Cu1+ contributions and any metallic Cu that may form during subsequent electrochemical reduction. | Full points for identifying references representing Cu2+ (e.g., CuO), Cu1+ (e.g., Cu2O), Cu0 (e.g., Cu foil), and a hydrated Cu2+ species (e.g., [Cu(H2O)6]2+). |
| q2 | quantification | 40 | Estimate the phase fractions of the Cu species present in the Cu1/O catalyst at open circuit potential (OCP) in the nitrate-containing electrolyte. | At open circuit potential (OCP), the estimated phase fractions for the Cu1/O catalyst are 0.55 (55%) CuO, 0.25 (25%) [Cu(H2O)6]2+, and 0.20 (20%) Cu2O, with an uncertainty of 10%. These specific values result from the catalyst resting in the aqueous electrolyte (0.1 M KNO3 + 0.1 M K2SO4, pH 11.5) before any reductive potentials are applied for nitrate reduction. Because the system is in its initial oxidized state, the Cu single atoms on the O-doped graphene are predominantly stabilized in the Cu2+ oxidation state as a mixture of CuO-like and hydrated species, with only a minor Cu1+ (Cu2O) contribution. | Full points for estimating ~55% CuO (or generic Cu2+ oxide), ~25% hydrated Cu2+ ([Cu(H2O)6]2+), and ~20% Cu2O (Cu1+). Partial credit for identifying that Cu2+ species dominate with a minor Cu1+ component. |
| q3 | reasoning | 30 | Explain why these specific Cu species and oxidation states are expected for the Cu1/O catalyst at OCP before the application of reductive potentials. | At open circuit potential (OCP) in the aqueous 0.1 M KNO3 + 0.1 M K2SO4 (pH 11.5) electrolyte, the Cu single atoms on O-doped graphene are expected to be primarily in the Cu2+ oxidation state. This occurs because the catalyst remains in its initial oxidized state prior to the application of reductive potentials for nitrate reduction. Consequently, the system manifests as a mixture of CuO-like and hydrated [Cu(H2O)6]2+ species, reflecting the interaction of the oxidized Cu sites with both the O-graphene support and the aqueous environment. A minor contribution of Cu1+ (Cu2O) is also present, representing the baseline chemical state of the catalyst under these resting conditions. | Full points for explaining that at OCP, the catalyst remains in its initial oxidized state (primarily Cu2+), with the presence of hydrated species due to the aqueous electrolyte environment, before any electrochemical reduction occurs. |
Review
#751
Cu single atoms / Cu nanoparticles
Cu K-edge
▶
LLM Prompt
Sample Information
Material: Cu single atoms / Cu nanoparticles
Support: O-graphene
Reaction Conditions: 0.1 M KNO3 + 0.1 M K2SO4, pH 11.5
Sample-Specific Conditions
- Applied Potential (V vs RHE): 0 V
- Cu single-atom catalyst on O-doped graphene at intermediate reductive potential
Measurement
We plan to measure the Cu K-edge XANES spectrum of this sample.
Questions
Based on all the information above:
1. What candidate reference spectra are needed to perform a Linear Combination Fitting (LCF) of the XANES region for this Cu1/O catalyst to capture the relevant oxidation states and geometries during electrocatalysis?
2. Estimate the phase fractions of the different Cu species (Cu2+, Cu1+, Cu0) for the Cu1/O catalyst at an applied potential of 0 V vs RHE.
3. Explain the physical reasoning for the observed phase composition of the Cu1/O catalyst at 0 V vs RHE. Why is Cu1+ the dominant species at this potential, and what structural evolution is expected if the potential is further reduced to -0.8 V?
Ground Truth
Material: Cu single atoms / Cu nanoparticles
Measurement: Cu K-edge in-situ XAS at Beamline 8-ID (Inner Shell Spectroscopy, ISS) of the National Synchrotron Light Source II
Fit method: Linear combination fitting (LCF) of the XANES region
Phase fractions: (±10%)
| Phase | Fraction |
|---|---|
| Cu2O | 0.49 |
| Cu foil | 0.26 |
| CuO | 0.2 |
| [Cu(H2O)6]2+ | 0.05 |
Fit basis (paper's reference spectra):
- CuO
- Cu2O
- Cu foil
- [Cu(H2O)6]2+
Source evidence: Figure 3b and page 6 (Section: Coordination Environment Moderates Cu SAC Instability)
Key reasoning: For the Cu1/O catalyst, applying reductive potentials from OCP initially results in a ~1:1 conversion of Cu2+ to Cu1+, with the maximum Cu1+ presence occurring at 0 V (49%). At this intermediate potential, the sharp increase in Cu0 fraction (which begins at -0.2 V and peaks at -0.8 V due to aggregation into nanoparticles) has not yet fully occurred. Therefore, Cu1+ is the dominant species, coexisting with residual Cu2+ and emerging Cu0. The specific O-coordination environment dictates this reduction profile, which requires more oxidative potentials to reach maximum Cu1+ compared to B-coordinated Cu SACs.
Reasoning source: Page 6, Section 'Coordination Environment Moderates Cu SAC Instability'
Scoring Rubric (total: 100 pts)
| Q | Type | Max | Question | Reference Answer | Scoring Criteria |
|---|---|---|---|---|---|
| q1 | identification | 30 | What candidate reference spectra are needed to perform a Linear Combination Fitting (LCF) of the XANES region for this Cu1/O catalyst to capture the relevant oxidation states and geometries during electrocatalysis? | To perform LCF on the XANES region for this sample, the required reference spectra are CuO, Cu2O, Cu foil, and [Cu(H2O)6]2+. These references are necessary because the Cu single-atom catalyst on O-doped graphene undergoes dynamic oxidation state changes under the applied intermediate reductive potential of 0 V vs RHE in the pH 11.5 electrolyte. Specifically, applying this reductive potential from the open circuit potential causes a partial conversion of the initial Cu2+ species into Cu1+ and emerging Cu0. The specific O-coordination environment dictates this reduction profile, requiring these standards to capture the coexistence of dominant Cu1+ (Cu2O), residual Cu2+ (CuO and [Cu(H2O)6]2+), and emerging Cu0 (Cu foil) nanoparticles. | Full points for identifying CuO (Cu2+), Cu2O (Cu1+), Cu foil (Cu0), and a hydrated Cu2+ reference like [Cu(H2O)6]2+. Deduct points for missing oxidation states or including unnecessary references like CuPc (which is only needed for N-coordinated samples). |
| q2 | quantification | 40 | Estimate the phase fractions of the different Cu species (Cu2+, Cu1+, Cu0) for the Cu1/O catalyst at an applied potential of 0 V vs RHE. | At an applied potential of 0 V vs RHE, the estimated phase fractions are 49% Cu2O (Cu1+), 26% Cu foil (Cu0), 20% CuO (Cu2+), and 5% [Cu(H2O)6]2+ (Cu2+), with an uncertainty of 10%. These specific values result from applying an intermediate reductive potential to the Cu1/O catalyst in the pH 11.5 electrolyte, which causes an initial ~1:1 conversion of Cu2+ to Cu1+. At exactly 0 V, the maximum Cu1+ presence is achieved because the sharp increase in Cu0 fraction—driven by aggregation into nanoparticles—has not yet fully occurred. This specific phase distribution is fundamentally dictated by the O-coordination environment of the graphene support, which requires more oxidative potentials to reach maximum Cu1+ compared to other coordination types. | Full points for estimating Cu1+ (Cu2O) at ~49%, Cu0 (Cu foil) at ~26%, and total Cu2+ (CuO + hydrated) at ~25%. Partial credit if the relative order (Cu1+ > Cu0 ~ Cu2+) is correct but values deviate by more than 10%. |
| q3 | reasoning | 30 | Explain the physical reasoning for the observed phase composition of the Cu1/O catalyst at 0 V vs RHE. Why is Cu1+ the dominant species at this potential, and what structural evolution is expected if the potential is further reduced to -0.8 V? | At 0 V vs RHE, Cu1+ is the dominant species because applying this intermediate reductive potential to the Cu single-atom catalyst on O-doped graphene causes an initial ~1:1 conversion of Cu2+ to Cu1+. This specific O-coordination environment dictates the reduction profile, requiring more oxidative potentials to reach maximum Cu1+ compared to B-coordinated catalysts. At this intermediate potential, the catalyst exists as a mixture of dominant Cu1+, residual Cu2+, and emerging Cu0 because the sharp transition to metallic copper has not yet fully occurred. If the potential is further reduced to -0.8 V vs RHE, a sharp increase in the Cu0 fraction is expected due to the structural evolution and aggregation of the single atoms into Cu nanoparticles. | Full points for explaining that 0 V represents an intermediate reductive state where initial Cu2+ has converted to Cu1+ (reaching its maximum), but the potential is not yet negative enough (e.g., -0.2 V to -0.8 V) to trigger the sharp increase in Cu0 and subsequent aggregation into Cu nanoparticles. |
Review
#752
Cu single atoms / Cu nanoparticles
Cu K-edge
▶
LLM Prompt
Sample Information
Material: Cu single atoms / Cu nanoparticles
Support: O-graphene
Reaction Conditions: 0.1 M KNO3 + 0.1 M K2SO4, pH 11.5
Sample-Specific Conditions
- Applied Potential (V vs RHE): -0.8 V
- Cu single-atom catalyst on O-doped graphene at maximum reductive potential
Measurement
We plan to measure the Cu K-edge XANES spectrum of this sample.
Questions
Based on all the information above:
1. What candidate reference spectra are needed to accurately model the Cu K-edge XANES of this sample using linear combination fitting (LCF) during the electrocatalytic reaction?
2. Based on the sample conditions (Cu on O-graphene at -0.8 V vs RHE), estimate the phase fractions of the Cu species present.
3. Explain the physical reasoning for the observed phase composition at -0.8 V. Why does the O-graphene support lead to this specific extent of Cu reduction and aggregation?
Ground Truth
Material: Cu single atoms / Cu nanoparticles on O-graphene
Measurement: in situ Cu K-edge XANES at Beamline 8-ID (ISS) of NSLS-II
Fit method: Linear combination fitting (LCF)
Phase fractions: (±10%)
| Phase | Fraction |
|---|---|
| Cu foil | 0.68 |
| Cu2O | 0.22 |
| CuO | 0.1 |
Fit basis (paper's reference spectra):
- CuO
- Cu2O
- Cu foil
- [Cu(H2O)6]2+
Source evidence: Figure 3b, page 7
Key reasoning: Applying reductive potentials to Cu1/O causes a sharp increase in Cu0 fraction starting at -0.2 V, which gradually continues until peaking at -0.8 V (68%). The O-coordination environment is weaker than N-coordination (as shown by pCOHP analysis), making the Cu-O bonds more susceptible to demetallation and subsequent aggregation into Cu nanoparticles under these reductive conditions. However, it is more stable than B-coordination, resulting in an intermediate degree of aggregation.
Reasoning source: Results and Discussion: Coordination Environment Moderates Cu SAC Instability & Thermodynamic Description of Cu Stability, pages 6-8
Scoring Rubric (total: 100 pts)
| Q | Type | Max | Question | Reference Answer | Scoring Criteria |
|---|---|---|---|---|---|
| q1 | identification | 20 | What candidate reference spectra are needed to accurately model the Cu K-edge XANES of this sample using linear combination fitting (LCF) during the electrocatalytic reaction? | To accurately model the Cu K-edge XANES spectrum of this sample using linear combination fitting (LCF), the required reference spectra are CuO, Cu2O, Cu foil, and [Cu(H2O)6]2+. These references are necessary because applying a strong reductive potential of -0.8 V vs RHE in the pH 11.5 electrolyte drives the reduction of the initial Cu single atoms. The O-coordination environment of the graphene support is relatively weak, making the Cu-O bonds susceptible to demetallation and subsequent aggregation into metallic Cu nanoparticles (represented by the Cu foil reference). However, because O-coordination is more stable than B-coordination, the reduction is incomplete, requiring oxidized references (CuO, Cu2O, and [Cu(H2O)6]2+) to account for the remaining unreduced or partially reduced Cu species. | Full credit for identifying metallic Cu (Cu foil), Cu1+ (Cu2O), Cu2+ (CuO), and hydrated Cu2+ ([Cu(H2O)6]2+) as the necessary reference spectra. |
| q2 | quantification | 40 | Based on the sample conditions (Cu on O-graphene at -0.8 V vs RHE), estimate the phase fractions of the Cu species present. | Under the sample conditions of -0.8 V vs RHE, the estimated phase fractions are 68% Cu foil (Cu0), 22% Cu2O, and 10% CuO, with an uncertainty of 10%. These specific values arise because applying reductive potentials to the Cu/O-graphene system causes a sharp increase in the Cu0 fraction starting at -0.2 V, which gradually continues until peaking at 68% at -0.8 V. This intermediate degree of aggregation into Cu nanoparticles occurs because the Cu-O bonds are weaker than N-coordination, making them susceptible to demetallation in the pH 11.5 electrolyte. However, the O-coordination is more stable than B-coordination, which prevents complete reduction and leaves 32% of the copper in oxidized states (Cu2O and CuO). | Full credit for estimating approximately 68% metallic Cu (Cu0), 22% Cu1+ (Cu2O), and 10% Cu2+ (CuO). Partial credit for identifying Cu0 as the dominant phase (>60%) with minor oxidized species remaining. |
| q3 | reasoning | 40 | Explain the physical reasoning for the observed phase composition at -0.8 V. Why does the O-graphene support lead to this specific extent of Cu reduction and aggregation? | At the maximum reductive potential of -0.8 V vs RHE in a pH 11.5 electrolyte (0.1 M KNO3 + 0.1 M K2SO4), the Cu/O-graphene catalyst reaches a phase composition of 68% metallic Cu, 22% Cu2O, and 10% CuO. This specific extent of reduction and aggregation is governed by the thermodynamic stability of the Cu-support bonds. As shown by pCOHP analysis, the O-coordination environment is weaker than N-coordination, making the Cu-O bonds highly susceptible to demetallation under these reductive conditions. Once demetallated, the Cu atoms aggregate into metallic Cu nanoparticles, causing the Cu0 fraction to peak at 68%. Because the Cu-O interaction is still more stable than B-coordination, the catalyst exhibits an intermediate degree of instability, preventing total aggregation and maintaining a fraction of oxidized Cu species. | Full credit for explaining that the reductive potential drives the conversion of single atoms to Cu0 nanoparticles, and that the Cu-O bond is weaker than Cu-N bonds (making it susceptible to demetallation and aggregation) but stronger than Cu-B bonds, leading to an intermediate level of aggregation (68% Cu0). |
Review
#753
Cu single atoms / Cu nanoparticles
Cu K-edge
▶
LLM Prompt
Sample Information
Material: Cu single atoms / Cu nanoparticles
Support: O-graphene
Reaction Conditions: 0.1 M KNO3 + 0.1 M K2SO4, pH 11.5
Sample-Specific Conditions
- Applied Potential (V vs RHE): OCP_post
- Cu single-atom catalyst on O-doped graphene returned to open circuit potential after reduction
Measurement
We plan to measure the Cu K-edge XANES spectrum of this sample.
Questions
Based on all the information above:
1. Identify the candidate reference spectra needed to perform Linear Combination Fitting (LCF) on the Cu K-edge XANES data for the Cu1/O catalyst to capture the possible oxidation states and geometries during and after electrocatalytic nitrate reduction.
2. Estimate the phase fractions of the different Cu species (Cu0, Cu1+, Cu2+) for the Cu1/O catalyst after it is returned to open circuit potential (OCP_post) following a reduction sequence down to -0.8 V.
3. Explain the physical reasoning for why a significant fraction of metallic copper (Cu0) remains in the Cu1/O catalyst even after the applied reductive potential is removed and the system is returned to open circuit potential (OCP_post).
Ground Truth
Material: Cu single atoms / Cu nanoparticles on O-graphene
Measurement: Cu K-edge in situ XANES at Beamline 8-ID (Inner Shell Spectroscopy, ISS) of the National Synchrotron Light Source II
Fit method: Linear combination fitting (LCF)
Phase fractions: (±10%)
| Phase | Fraction |
|---|---|
| CuO | 0.55 |
| Cu foil | 0.3 |
| Cu2O | 0.15 |
Fit basis (paper's reference spectra):
- CuO
- Cu2O
- Cu foil
- [Cu(H2O)6]2+
Source evidence: Figure 3b, page 7
Key reasoning: Upon returning to open circuit potential (OCP_post) after the reduction sequence to -0.8 V, the Cu1/O catalyst partially regained its original Cu2+ content. However, ~30% Cu0 still remained, suggesting either irreversible aggregate formation (Cu nanoparticles) or that more time may be required for the catalyst to fully return to its original single-atom state, as the OCP_post scanning time was only ~10 minutes.
Reasoning source: Page 6, 'Coordination Environment Moderates Cu SAC Instability' section
Scoring Rubric (total: 100 pts)
| Q | Type | Max | Question | Reference Answer | Scoring Criteria |
|---|---|---|---|---|---|
| q1 | identification | 20 | Identify the candidate reference spectra needed to perform Linear Combination Fitting (LCF) on the Cu K-edge XANES data for the Cu1/O catalyst to capture the possible oxidation states and geometries during and after electrocatalytic nitrate reduction. | The candidate reference spectra required for Linear Combination Fitting (LCF) of this sample are CuO, Cu2O, Cu foil, and [Cu(H2O)6]2+. These specific references are necessary because the Cu single-atom catalyst on O-graphene undergoes dynamic oxidation state changes during electrocatalytic nitrate reduction in the pH 11.5 electrolyte and upon returning to open circuit potential (OCP_post). CuO and [Cu(H2O)6]2+ capture the Cu2+ states that are partially regained at OCP_post, Cu2O accounts for intermediate Cu1+ species, and Cu foil represents the metallic Cu0 formed during prior reduction that persists as nanoparticles. | Full credit for identifying references representing Cu2+, Cu1+, Cu0, and hydrated Cu2+ (specifically CuO, Cu2O, Cu foil, and [Cu(H2O)6]2+). |
| q2 | quantification | 40 | Estimate the phase fractions of the different Cu species (Cu0, Cu1+, Cu2+) for the Cu1/O catalyst after it is returned to open circuit potential (OCP_post) following a reduction sequence down to -0.8 V. | At OCP_post, the estimated phase fractions are 55% CuO (Cu2+), 15% Cu2O (Cu1+), and 30% Cu foil (Cu0), with an uncertainty of 10%. These specific values result from the catalyst's behavior after the applied reductive potential (-0.8 V) is removed in the 0.1 M KNO3 and 0.1 M K2SO4 electrolyte. Upon returning to open circuit potential, the Cu1/O catalyst partially re-oxidizes, regaining a majority (55%) of its original Cu2+ content alongside a minor (15%) Cu1+ fraction. However, a significant 30% fraction of Cu0 remains because the ~10-minute OCP_post scanning time is either insufficient for the catalyst to fully return to its original single-atom state, or irreversible Cu nanoparticle aggregates have formed. | Full credit for estimating ~55% Cu2+ (CuO), ~30% Cu0 (Cu foil), and ~15% Cu1+ (Cu2O). Partial credit if the dominant phase is correctly identified as Cu2+ with a significant minority of Cu0. |
| q3 | reasoning | 40 | Explain the physical reasoning for why a significant fraction of metallic copper (Cu0) remains in the Cu1/O catalyst even after the applied reductive potential is removed and the system is returned to open circuit potential (OCP_post). | A significant fraction of metallic copper (~30% Cu0) remains at OCP_post because the structural changes induced during the prior reduction sequence to -0.8 V are not fully reversible within the measurement timeframe. During reduction in the pH 11.5 nitrate/sulfate electrolyte, the Cu single atoms on the O-graphene support aggregate into metallic Cu nanoparticles. When the applied potential is removed, the catalyst only partially regains its original Cu2+ state. The persistence of the Cu0 phase suggests either that the ~10-minute OCP_post scanning time is insufficient for the catalyst to fully re-disperse into its original single-atom state, or that the formation of these Cu nanoparticle aggregates is completely irreversible. | Full credit for explaining that the remaining Cu0 (~30%) indicates either irreversible aggregate/nanoparticle formation that occurred during the reductive potentials, or that the scanning time at OCP_post (~10 min) was insufficient for the complete re-oxidation and redispersion back to the original single-atom state. |
Review
#754
Cu single atoms
Cu K-edge
▶
LLM Prompt
Sample Information
Material: Cu single atoms
Support: B-graphene
Reaction Conditions: 0.1 M KNO3 + 0.1 M K2SO4, pH 11.5
Sample-Specific Conditions
- Applied Potential (V vs RHE): OCP
- Cu single-atom catalyst on B-doped graphene at open circuit potential
Measurement
We plan to measure the Cu K-edge XANES spectrum of this sample.
Questions
Based on all the information above:
1. What reference spectra are appropriate for modeling the Cu K-edge XANES of this sample via linear combination fitting to capture the expected oxidation states and geometries?
2. Based on the sample conditions (Cu single atoms on B-graphene at open circuit potential in aqueous electrolyte), estimate the phase fractions of the Cu species present.
3. Explain why the Cu1/B catalyst exhibits this specific speciation at open circuit potential, particularly focusing on the role of the B-graphene support and its effect on hydration and the Cu-O bond.
Ground Truth
Material: Cu single atoms on B-graphene
Measurement: in situ Cu K-edge XANES
Fit method: Linear combination fitting (LCF)
Phase fractions: (±10%)
| Phase | Fraction |
|---|---|
| [Cu(H2O)6]2+ | 0.65 |
| CuO | 0.25 |
| Cu2O | 0.1 |
Fit basis (paper's reference spectra):
- CuO
- Cu2O
- Cu foil
- [Cu(H2O)6]2+
Source evidence: Figure 3b and text on page 6
Key reasoning: At open circuit potential (OCP), the Cu1/B catalyst is primarily in the Cu2+ oxidation state but exhibits a higher degree of hydration compared to other coordination environments (like O- or N-graphene). This is represented by the dominant [Cu(H2O)6]2+ fraction. The presence of the B dopant, likely in a pentagonal position relative to oxygen, weakens the Cu-O bond, which may explain the higher degree of hydration and subsequent instability observed experimentally.
Reasoning source: Page 6 (Coordination Environment Moderates Cu SAC Instability) and Page 8 (Thermodynamic Description of Cu Stability)
Scoring Rubric (total: 100 pts)
| Q | Type | Max | Question | Reference Answer | Scoring Criteria |
|---|---|---|---|---|---|
| q1 | identification | 20 | What reference spectra are appropriate for modeling the Cu K-edge XANES of this sample via linear combination fitting to capture the expected oxidation states and geometries? | The appropriate reference spectra for linear combination fitting of this sample are CuO, Cu2O, Cu foil, and [Cu(H2O)6]2+. These references are necessary because, at open circuit potential in the aqueous electrolyte (pH 11.5), the Cu single atoms on B-graphene exist in a mixture of oxidation states, primarily Cu2+ with minor Cu1+ contributions. The inclusion of the [Cu(H2O)6]2+ reference is specifically required because the B dopant weakens the Cu-O bond, leading to a high degree of hydration of the Cu centers. Consequently, the catalyst is predominantly in a hydrated Cu2+ state rather than a purely oxide-like coordination. | Full credit for identifying CuO (for Cu2+), Cu2O (for Cu1+), Cu foil (for Cu0), and [Cu(H2O)6]2+ (for hydrated Cu2+). Partial credit if 2-3 are identified. |
| q2 | quantification | 40 | Based on the sample conditions (Cu single atoms on B-graphene at open circuit potential in aqueous electrolyte), estimate the phase fractions of the Cu species present. | Under these conditions, the estimated phase fractions are 65% [Cu(H2O)6]2+, 25% CuO, and 10% Cu2O, with an uncertainty of about 10%. These specific values arise because, at open circuit potential, the Cu single atoms on the B-doped graphene support are primarily in the Cu2+ oxidation state. The dominant 65% fraction of [Cu(H2O)6]2+ occurs because the B dopant, likely in a pentagonal position relative to oxygen, weakens the Cu-O bonds. This weakening allows the aqueous electrolyte (0.1 M KNO3 + 0.1 M K2SO4, pH 11.5) to highly hydrate the Cu sites, leading to this specific distribution of hydrated and oxide species. | Full credit for estimating ~65% hydrated Cu2+ ([Cu(H2O)6]2+), ~25% Cu2+ (CuO-like), and ~10% Cu1+ (Cu2O-like). Deduct points proportionally for deviations >10% from these values. |
| q3 | reasoning | 40 | Explain why the Cu1/B catalyst exhibits this specific speciation at open circuit potential, particularly focusing on the role of the B-graphene support and its effect on hydration and the Cu-O bond. | At open circuit potential, the Cu1/B catalyst is primarily in the Cu2+ oxidation state but exhibits a much higher degree of hydration compared to other coordination environments. This speciation is driven by the B-graphene support, where the B dopant is likely located in a pentagonal position relative to oxygen. This specific structural arrangement weakens the Cu-O bond between the single atoms and the support. Because of this weakened bond, the Cu sites become highly hydrated by the aqueous electrolyte (pH 11.5), resulting in a dominant [Cu(H2O)6]2+ fraction (65%) and contributing to the experimentally observed instability of the catalyst. | Full credit for explaining that the catalyst is primarily Cu2+ but highly hydrated due to the B-doping. Must mention that the B dopant (likely in a pentagonal position) weakens the Cu-O bond, leading to a higher degree of hydration compared to other coordination environments. |
Review
#755
Cu single atoms / Cu nanoparticles
Cu K-edge
▶
LLM Prompt
Sample Information
Material: Cu single atoms / Cu nanoparticles
Support: B-graphene
Reaction Conditions: 0.1 M KNO3 + 0.1 M K2SO4, pH 11.5
Sample-Specific Conditions
- Applied Potential (V vs RHE): 0.2 V
- Cu single-atom catalyst on B-doped graphene at intermediate reductive potential
Measurement
We plan to measure the Cu K-edge XANES spectrum of this sample.
Questions
Based on all the information above:
1. What candidate reference spectra should be included in a linear combination fitting (LCF) model to accurately capture the expected oxidation states and geometries of this Cu SAC sample during electrocatalysis?
2. Estimate the phase fractions of the Cu species present in the Cu1/B catalyst at an applied potential of 0.2 V vs RHE. Which oxidation state is dominant at this potential?
3. Explain the physical reasoning for why the Cu1/B catalyst exhibits this specific speciation at 0.2 V vs RHE. How does the boron coordination environment influence the stability and reduction onset compared to O-doped graphene?
Ground Truth
Material: Cu single atoms / Cu nanoparticles on B-graphene
Measurement: in situ Cu K-edge XAS at Beamline 8-ID (ISS), NSLS-II
Fit method: Linear combination fitting (LCF) of the XANES region
Phase fractions: (±10%)
| Phase | Fraction |
|---|---|
| Cu2O | 0.74 |
| CuO | 0.1 |
| [Cu(H2O)6]2+ | 0.1 |
| Cu foil | 0.06 |
Fit basis (paper's reference spectra):
- CuO
- Cu2O
- Cu foil
- [Cu(H2O)6]2+
Source evidence: Figure 3b and Page 6 text
Key reasoning: At OCP, Cu1/B is primarily hydrated Cu2+. Upon applying a reductive potential of 0.2 V vs RHE, it undergoes a dramatic reduction to Cu1+, peaking at 74% fraction. This transition occurs at a more positive (oxidative) potential compared to Cu1/O (which peaks at 0 V), indicating that B-doping makes the Cu sites more susceptible to reduction. DFT calculations suggest this instability arises because pentagonal boron sites weaken the Cu-O bonds.
Reasoning source: Page 6 (Coordination Environment Moderates Cu SAC Instability) and Page 8 (Thermodynamic Description of Cu Stability)
Scoring Rubric (total: 100 pts)
| Q | Type | Max | Question | Reference Answer | Scoring Criteria |
|---|---|---|---|---|---|
| q1 | identification | 25 | What candidate reference spectra should be included in a linear combination fitting (LCF) model to accurately capture the expected oxidation states and geometries of this Cu SAC sample during electrocatalysis? | The candidate reference spectra for the LCF model should include CuO, Cu2O, Cu foil, and [Cu(H2O)6]2+. These references are required because the Cu single-atom catalyst on B-doped graphene undergoes significant chemical transitions under the applied reductive potential of 0.2 V vs RHE in the pH 11.5 electrolyte. Initially existing as hydrated Cu2+ at open circuit potential, the Cu sites are highly susceptible to reduction because pentagonal boron sites weaken the Cu-O bonds. Therefore, references for the initial Cu2+ states (CuO, [Cu(H2O)6]2+) as well as the reduced Cu1+ (Cu2O) and Cu0 (Cu foil) states are necessary to accurately capture this dramatic reduction. | Full points for identifying CuO (Cu2+), Cu2O (Cu1+), Cu foil (Cu0), and a hydrated Cu2+ reference like [Cu(H2O)6]2+. |
| q2 | quantification | 35 | Estimate the phase fractions of the Cu species present in the Cu1/B catalyst at an applied potential of 0.2 V vs RHE. Which oxidation state is dominant at this potential? | At an applied potential of 0.2 V vs RHE, the estimated phase fractions are 74% Cu2O, 10% CuO, 10% [Cu(H2O)6]2+, and 6% Cu foil, with an uncertainty of 10%. The dominant oxidation state at this intermediate reductive potential is Cu1+. These specific values arise because the Cu single atoms on the B-graphene support are highly susceptible to reduction from their initial hydrated Cu2+ state. The pentagonal boron sites weaken the Cu-O bonds, causing a dramatic reduction to Cu1+ that peaks at 74% at this specific applied potential. | Full points for stating Cu1+ (Cu2O) is the dominant phase at ~74%, with minor contributions from Cu2+ (CuO and hydrated Cu2+, ~20% total) and Cu0 (Cu foil, ~6%). |
| q3 | reasoning | 40 | Explain the physical reasoning for why the Cu1/B catalyst exhibits this specific speciation at 0.2 V vs RHE. How does the boron coordination environment influence the stability and reduction onset compared to O-doped graphene? | The Cu1/B catalyst exhibits a dominant Cu1+ speciation at 0.2 V vs RHE because the applied reductive potential drives the initial hydrated Cu2+ species to undergo a dramatic reduction. The boron coordination environment decreases the stability of the Cu sites compared to O-doped graphene, causing this reduction to occur at a more positive (oxidative) potential. While Cu1/O peaks in Cu1+ fraction at 0 V, the Cu1/B catalyst reaches its 74% Cu1+ peak earlier at 0.2 V. This earlier reduction onset occurs because the pentagonal boron sites in the graphene support weaken the Cu-O bonds, making the metal centers more susceptible to reduction under these electrocatalytic conditions. | Full points for explaining that B-doping makes Cu sites more susceptible to reduction (peaking in Cu1+ at a more positive potential than O-doping) because pentagonal boron sites weaken the Cu-O bonds, leading to an earlier onset of reduction. |
Review
#756
Cu single atoms / Cu nanoparticles
Cu K-edge
▶
LLM Prompt
Sample Information
Material: Cu single atoms / Cu nanoparticles
Support: B-graphene
Reaction Conditions: 0.1 M KNO3 + 0.1 M K2SO4, pH 11.5
Sample-Specific Conditions
- Applied Potential (V vs RHE): -0.8 V
- Cu single-atom catalyst on B-doped graphene at maximum reductive potential
Measurement
We plan to measure the Cu K-edge XANES spectrum of this sample.
Questions
Based on all the information above:
1. What candidate reference spectra should be included in a linear combination fitting (LCF) model to accurately capture the Cu speciation of this catalyst under in-situ electrochemical conditions?
2. Given the highly reductive applied potential of -0.8 V vs RHE, estimate the phase fractions of the Cu species present in the Cu1/B catalyst.
3. Explain the thermodynamic and structural reasons why the B-doped graphene support leads to this specific phase composition at -0.8 V, particularly regarding the stability of the single atoms.
Ground Truth
Material: Cu single atoms / Cu nanoparticles on B-graphene
Measurement: in situ Cu K-edge XANES at NSLS-II beamline 8-ID
Fit method: Linear combination fitting (LCF)
Phase fractions: (±10%)
| Phase | Fraction |
|---|---|
| Cu foil | 0.83 |
| Cu2O | 0.1 |
| CuO | 0.07 |
Fit basis (paper's reference spectra):
- CuO
- Cu2O
- Cu foil
- [Cu(H2O)6]2+
Source evidence: Figure 3b and Page 6 text ('maintaining a high fraction of Cu0 until -0.8 V (83%)')
Key reasoning: Under applied reductive potentials, the Cu1/B catalyst undergoes significant reduction and aggregation into nanoparticles. The presence of the B dopant (specifically in a pentagonal position) weakens the Cu-O bond compared to pure O-coordination, as evidenced by a less negative IpCOHP value. This weakened bond lowers the demetallation energy, allowing adsorbed hydrogen to easily detach Cu from the support, resulting in a dominant Cu0 nanoparticle phase (83%) at -0.8 V.
Reasoning source: Page 6 (Coordination Environment Moderates Cu SAC Instability) and Page 8 (Thermodynamic Description of Cu Stability)
Scoring Rubric (total: 100 pts)
| Q | Type | Max | Question | Reference Answer | Scoring Criteria |
|---|---|---|---|---|---|
| q1 | identification | 20 | What candidate reference spectra should be included in a linear combination fitting (LCF) model to accurately capture the Cu speciation of this catalyst under in-situ electrochemical conditions? | The linear combination fitting (LCF) model should include reference spectra for CuO, Cu2O, Cu foil, and [Cu(H2O)6]2+. These specific references are required because the Cu single-atom catalyst on B-doped graphene undergoes significant structural evolution under the applied reductive potential of -0.8 V vs RHE in the pH 11.5 electrolyte. The presence of the B dopant weakens the Cu-O bonds, lowering the demetallation energy and allowing adsorbed hydrogen to detach Cu from the support. Consequently, the catalyst transitions from its initial state to form a mixture containing a dominant metallic Cu0 nanoparticle phase (represented by Cu foil) alongside residual oxidized species (CuO, Cu2O, and aqueous Cu2+). | Full credit for identifying Cu foil (Cu0), Cu2O (Cu1+), CuO (Cu2+), and a hydrated Cu2+ reference like [Cu(H2O)6]2+. Partial credit for missing the hydrated species but getting the primary oxidation state standards. |
| q2 | quantification | 40 | Given the highly reductive applied potential of -0.8 V vs RHE, estimate the phase fractions of the Cu species present in the Cu1/B catalyst. | At an applied potential of -0.8 V vs RHE, the phase fractions are estimated to be 83% Cu foil (Cu0), 10% Cu2O, and 7% CuO, with an uncertainty of 10%. These specific values result from the maximum reductive potential applied to the Cu1/B catalyst in the 0.1 M KNO3 and 0.1 M K2SO4 (pH 11.5) electrolyte. The B dopant in a pentagonal position weakens the Cu-O bonds (indicated by a less negative IpCOHP value), which significantly lowers the demetallation energy. This allows adsorbed hydrogen to easily detach the Cu atoms from the support, driving massive reduction and aggregation into a dominant 83% metallic Cu0 nanoparticle phase while leaving only minor fractions of unreduced oxides. | Full credit for estimating ~83% metallic copper (Cu0), with the remainder being minor fractions of Cu1+ (~10%) and Cu2+ (~7%). Deduct points if Cu0 is not identified as the overwhelmingly dominant phase (>80%). |
| q3 | reasoning | 40 | Explain the thermodynamic and structural reasons why the B-doped graphene support leads to this specific phase composition at -0.8 V, particularly regarding the stability of the single atoms. | At -0.8 V vs RHE, the Cu single atoms on the B-doped graphene support exhibit severe instability, resulting in a composition dominated by 83% metallic Cu0 nanoparticles alongside minor Cu2O (10%) and CuO (7%) phases. Structurally, the presence of the B dopant in a pentagonal position on the graphene support weakens the Cu-O bond compared to pure O-coordination, which is evidenced by a less negative IpCOHP value. Thermodynamically, this weakened bond significantly lowers the demetallation energy of the catalyst. Under the highly reductive conditions, this lowered energy barrier allows adsorbed hydrogen to easily detach the Cu atoms from the support, leading to their rapid aggregation into the observed metallic nanoparticle phase. | Full credit for explaining that the B dopant weakens the Cu-O bond (lowering demetallation energy), which makes the single atoms highly susceptible to detachment by adsorbed hydrogen and subsequent aggregation into Cu0 nanoparticles. |
Review
#757
Cu single atoms / Cu nanoparticles
Cu K-edge
▶
LLM Prompt
Sample Information
Material: Cu single atoms / Cu nanoparticles
Support: B-graphene
Reaction Conditions: 0.1 M KNO3 + 0.1 M K2SO4, pH 11.5
Sample-Specific Conditions
- Applied Potential (V vs RHE): OCP_post
- Cu single-atom catalyst on B-doped graphene returned to open circuit potential after reduction
Measurement
We plan to measure the Cu K-edge XANES spectrum of this sample.
Questions
Based on all the information above:
1. What candidate reference spectra should be included in a Linear Combination Fitting (LCF) analysis to accurately model the Cu K-edge XANES spectrum of this sample across its various oxidation and hydration states?
2. Estimate the phase fractions of the Cu species present in the Cu1/B catalyst after it is returned to open circuit potential (OCP_post) following electrochemical reduction.
3. Explain the physical reasoning for the observed phase composition at OCP_post. Specifically, address why metallic copper is still present and how the hydration state of the re-oxidized species compares to the initial OCP state.
Ground Truth
Material: Cu single atoms / Cu nanoparticles on B-graphene
Measurement: Cu K-edge in-situ XANES at Beamline 8-ID (ISS), NSLS-II
Fit method: Linear combination fitting (LCF)
Phase fractions: (±10%)
| Phase | Fraction |
|---|---|
| CuO | 0.6 |
| Cu foil | 0.25 |
| Cu2O | 0.15 |
Fit basis (paper's reference spectra):
- CuO
- Cu2O
- Cu foil
- [Cu(H2O)6]2+
Source evidence: Figure 3b and text on page 6
Key reasoning: Upon returning to open circuit potential (OCP_post) after applied reductive potentials, the Cu0 fraction decreased significantly to ~25%, indicating partial re-oxidation. The original Cu2+ content was largely regained, but the resultant Cu species were less hydrated than at the initial OCP. The remaining ~25% Cu0 suggests either irreversible aggregate formation or that more time (beyond the ~10 min scanning time) is required to fully return to the original single-atom state.
Reasoning source: Page 6, Section: Coordination Environment Moderates Cu SAC Instability
Scoring Rubric (total: 100 pts)
| Q | Type | Max | Question | Reference Answer | Scoring Criteria |
|---|---|---|---|---|---|
| q1 | identification | 25 | What candidate reference spectra should be included in a Linear Combination Fitting (LCF) analysis to accurately model the Cu K-edge XANES spectrum of this sample across its various oxidation and hydration states? | The candidate reference spectra for the LCF analysis should include CuO, Cu2O, Cu foil, and [Cu(H2O)6]2+. These references are necessary because the Cu single-atom catalyst on B-graphene undergoes dynamic changes in oxidation and hydration states during electrochemical testing in the pH 11.5 electrolyte. Specifically, returning the sample to open circuit potential (OCP_post) after reduction causes partial re-oxidation of the reduced Cu species back to Cu2+ and Cu1+ states, alongside residual metallic Cu0. The [Cu(H2O)6]2+ reference is required to account for changes in the hydration state of the Cu2+ species, which are less hydrated at OCP_post compared to the initial OCP state. | Full credit for identifying CuO (for Cu2+), Cu2O (for Cu1+), Cu foil (for Cu0), and [Cu(H2O)6]2+ (for hydrated Cu2+). Deduct points for missing references or including unnecessary ones (like CuPc, which is only used for N-coordinated samples). |
| q2 | quantification | 35 | Estimate the phase fractions of the Cu species present in the Cu1/B catalyst after it is returned to open circuit potential (OCP_post) following electrochemical reduction. | The estimated phase fractions for the sample at OCP_post are 0.6 (60%) CuO, 0.25 (25%) Cu foil, and 0.15 (15%) Cu2O, with an uncertainty of 10%. These specific fractions result from the catalyst being returned to open circuit potential after an applied reductive potential, which drives a partial re-oxidation process. The high CuO fraction (60%) indicates that the original Cu2+ content is largely regained upon removing the reductive bias. However, a 25% Cu foil (Cu0) fraction remains because either irreversible Cu nanoparticle aggregates formed during reduction, or the ~10 minute scanning time was insufficient to fully re-oxidize the metal back to the single-atom state. | Full credit for estimating ~60% CuO (Cu2+), ~25% Cu foil (Cu0), and ~15% Cu2O (Cu1+). Allow a tolerance of ±10% for each fraction. |
| q3 | reasoning | 40 | Explain the physical reasoning for the observed phase composition at OCP_post. Specifically, address why metallic copper is still present and how the hydration state of the re-oxidized species compares to the initial OCP state. | At OCP_post, the removal of the applied reductive potential causes the Cu catalyst to undergo partial re-oxidation in the pH 11.5 electrolyte, largely regaining its original Cu2+ content (60% CuO and 15% Cu2O). Despite this re-oxidation, approximately 25% metallic copper (Cu0) remains present in the sample. This residual Cu0 persists either because the reduction process caused irreversible aggregate formation (Cu nanoparticles), or because the ~10 minute scanning time was not long enough to allow complete reversion to the original single-atom state. Furthermore, while the Cu2+ oxidation state is recovered, these re-oxidized Cu species are less hydrated than they were at the initial OCP before reduction. | Full credit requires mentioning three key points: 1) Returning to OCP causes partial re-oxidation, regaining mostly Cu2+; 2) The remaining ~25% Cu0 indicates either irreversible aggregate formation or insufficient time (~10 min) to fully return to the single-atom state; 3) The resulting Cu species are less hydrated at OCP_post compared to the initial OCP. |
Review
#758
Cu single atoms
Cu K-edge
▶
LLM Prompt
Sample Information
Material: Cu single atoms
Support: N-graphene
Reaction Conditions: 0.1 M KNO3 + 0.1 M K2SO4, pH 11.5
Sample-Specific Conditions
- Applied Potential (V vs RHE): OCP
- Cu single-atom catalyst on N-doped graphene at open circuit potential
Measurement
We plan to measure the Cu K-edge XANES spectrum of this sample.
Questions
Based on all the information above:
1. What specific reference spectra should be included in a Linear Combination Fitting (LCF) analysis to accurately model the Cu speciation, oxidation states, and local coordination environment of this N-doped graphene supported Cu single-atom catalyst?
2. Based on the provided conditions (OCP, pH 11.5), estimate the phase fractions of the different Cu species present in the catalyst (e.g., Cu-N coordinated species, Cu2+ oxide, Cu1+ oxide, hydrated Cu2+).
3. Explain why a specific reference for nitrogen coordination (like CuPc) is necessary for analyzing this sample, and describe the expected resting state of the Cu atoms at OCP.
Ground Truth
Material: Cu single atoms on N-doped graphene
Measurement: in situ Cu K-edge XANES at Beamline 8-ID (ISS), NSLS-II
Fit method: Linear combination fitting (LCF)
Phase fractions: (±10%)
| Phase | Fraction |
|---|---|
| CuPc | 0.45 |
| CuO | 0.2 |
| Cu2O | 0.2 |
| [Cu(H2O)6]2+ | 0.15 |
Fit basis (paper's reference spectra):
- CuO
- Cu2O
- Cu foil
- [Cu(H2O)6]2+
- copper phthalocyanine (CuPc)
Source evidence: Figure 3b, page 7
Key reasoning: At open circuit potential (OCP), the Cu1/N catalyst exhibits a mixed valency, primarily of Cu2+ character. A significant portion of the Cu atoms are coordinated to nitrogen, which is modeled using a CuPc reference to account for a square planar Cu-N structure. The N-coordination provides enhanced stability compared to O- or B-coordination, and this specific coordination environment makes up the largest single fraction of the resting state before reductive potentials are applied.
Reasoning source: Page 6, 'Coordination Environment Moderates Cu SAC Instability' section
Scoring Rubric (total: 100 pts)
| Q | Type | Max | Question | Reference Answer | Scoring Criteria |
|---|---|---|---|---|---|
| q1 | identification | 25 | What specific reference spectra should be included in a Linear Combination Fitting (LCF) analysis to accurately model the Cu speciation, oxidation states, and local coordination environment of this N-doped graphene supported Cu single-atom catalyst? | To accurately model the Cu speciation of this catalyst, the LCF analysis should include CuO, Cu2O, Cu foil, [Cu(H2O)6]2+, and copper phthalocyanine (CuPc) as reference spectra. These specific references are required because the sample consists of Cu single atoms supported on N-doped graphene held at open circuit potential (OCP). Under these resting conditions, the catalyst exhibits a mixed valency with primarily Cu2+ character, necessitating references for oxidized species (CuO, Cu2O) and hydrated ions ([Cu(H2O)6]2+). Furthermore, because a significant portion of the Cu atoms are coordinated to the nitrogen in the graphene support, CuPc must be included to accurately model the resulting square planar Cu-N structural environment. | Full credit for identifying standard Cu oxidation state references (CuO for Cu2+, Cu2O for Cu1+, Cu foil for Cu0) AND specifically identifying the need for a Cu-N coordination reference (such as copper phthalocyanine, CuPc) and a hydrated Cu2+ reference ([Cu(H2O)6]2+). |
| q2 | quantification | 40 | Based on the provided conditions (OCP, pH 11.5), estimate the phase fractions of the different Cu species present in the catalyst (e.g., Cu-N coordinated species, Cu2+ oxide, Cu1+ oxide, hydrated Cu2+). | At open circuit potential (OCP) and pH 11.5, the estimated phase fractions are 0.45 for CuPc (Cu-N coordinated species), 0.20 for CuO, 0.20 for Cu2O, and 0.15 for [Cu(H2O)6]2+, with an uncertainty of 10%. These specific values result from the catalyst's resting state before any reductive potentials are applied, where it naturally exhibits a mixed valency of primarily Cu2+ character. The CuPc fraction is the largest (45%) because the N-coordination from the N-doped graphene support provides enhanced stability to the Cu single atoms compared to O- or B-coordination. The remaining fractions reflect the oxidized and hydrated Cu species that coexist on the catalyst under these alkaline, open-circuit conditions. | Full credit for estimating fractions close to: ~45% Cu-N coordinated species (CuPc), ~20% Cu2+ (CuO), ~20% Cu1+ (Cu2O), and ~15% hydrated Cu2+. Deduct points if Cu0 is predicted to be present at OCP, or if the dominant Cu-N coordination is missed. |
| q3 | reasoning | 35 | Explain why a specific reference for nitrogen coordination (like CuPc) is necessary for analyzing this sample, and describe the expected resting state of the Cu atoms at OCP. | A specific reference for nitrogen coordination, such as CuPc, is necessary because the Cu single atoms are supported on N-doped graphene, resulting in a significant portion of the Cu atoms being coordinated directly to nitrogen. CuPc effectively models this specific square planar Cu-N structural environment present in the sample. At the open circuit potential (OCP) resting state, before reductive potentials are applied, the Cu atoms exhibit a mixed valency that is primarily of Cu2+ character. This Cu-N coordination environment makes up the largest single fraction of the resting state because nitrogen coordination provides enhanced stability to the single atoms compared to O- or B-coordination. | Full credit for explaining that standard bulk oxides cannot capture the square planar Cu-N structure present in the single-atom catalyst. The answer must note that at OCP, the catalyst exhibits mixed valency (primarily Cu2+) with a significant, stable fraction of Cu atoms directly coordinated to the nitrogen dopants in the graphene support. |
Review
#759
Cu single atoms / Cu nanoparticles
Cu K-edge
▶
LLM Prompt
Sample Information
Material: Cu single atoms / Cu nanoparticles
Support: N-graphene
Reaction Conditions: 0.1 M KNO3 + 0.1 M K2SO4, pH 11.5
Sample-Specific Conditions
- Applied Potential (V vs RHE): -0.8 V
- Cu single-atom catalyst on N-doped graphene at maximum reductive potential
Measurement
We plan to measure the Cu K-edge XANES spectrum of this sample.
Questions
Based on all the information above:
1. Identify the appropriate reference spectra (basis functions) that should be included in a Linear Combination Fitting (LCF) model to accurately capture the speciation and coordination environment of this Cu1/N catalyst during in situ electrocatalysis.
2. Given the applied reductive potential of -0.8 V vs RHE, estimate the relative phase fractions of the different Cu species (Cu0, Cu1+, Cu2+, and Cu-N structures) present in the catalyst.
3. Explain the physical reasoning behind the observed speciation of the Cu1/N catalyst at -0.8 V. Why does the catalyst not fully reduce to metallic copper nanoparticles at this highly reductive potential?
Ground Truth
Material: Cu single atoms / Cu nanoparticles on N-graphene
Measurement: Cu K-edge in situ XANES at Beamline 8-ID (ISS), NSLS-II
Fit method: Linear combination fitting (LCF)
Phase fractions: (±10%)
| Phase | Fraction |
|---|---|
| Cu2O | 0.53 |
| Cu foil | 0.28 |
| CuPc | 0.15 |
| CuO | 0.04 |
Fit basis (paper's reference spectra):
- CuO
- Cu2O
- Cu foil
- [Cu(H2O)6]2+
- copper phthalocyanine (CuPc)
Source evidence: Figure 3b and text on pages 6-7
Key reasoning: N-coordination brings about enhanced stability for the Cu single atoms compared to O- or B-coordination. While the applied reductive potential drives an initial conversion from Cu2+ to Cu1+, further reduction to Cu0 is greatly diminished by the strong Cu-N bonds. At -0.8 V, Cu1+ remains the dominant species (53%), and Cu0 aggregates make up only 28% of the total Cu fraction. The fraction of CuPc, representative of the stable square planar Cu-N structure, remains relatively stable across all potentials, demonstrating the stabilizing effect of N-coordination against complete demetallation and nanoparticle aggregation.
Reasoning source: Section 'Coordination Environment Moderates Cu SAC Instability', pages 6-7
Scoring Rubric (total: 100 pts)
| Q | Type | Max | Question | Reference Answer | Scoring Criteria |
|---|---|---|---|---|---|
| q1 | identification | 20 | Identify the appropriate reference spectra (basis functions) that should be included in a Linear Combination Fitting (LCF) model to accurately capture the speciation and coordination environment of this Cu1/N catalyst during in situ electrocatalysis. | The appropriate reference spectra for the Linear Combination Fitting (LCF) model are CuO, Cu2O, Cu foil, [Cu(H2O)6]2+, and copper phthalocyanine (CuPc). These specific references are required because the sample consists of Cu single atoms and nanoparticles on N-graphene subjected to a highly reductive potential of -0.8 V vs RHE. Cu foil, Cu2O, and CuO account for the metallic Cu0 aggregates, intermediate Cu1+ species, and residual Cu2+ oxides, respectively, that form or persist during the electrochemical reduction. Furthermore, CuPc is essential to represent the stable square planar Cu-N coordination environment, as the strong Cu-N bonds in the N-doped graphene support resist complete reduction and stabilize the single atoms against aggregation. | Full points for identifying the need for references representing Cu0 (Cu foil), Cu1+ (Cu2O), Cu2+ (CuO), hydrated Cu2+ ([Cu(H2O)6]2+), and specifically a Cu-N coordinated reference such as copper phthalocyanine (CuPc). |
| q2 | quantification | 30 | Given the applied reductive potential of -0.8 V vs RHE, estimate the relative phase fractions of the different Cu species (Cu0, Cu1+, Cu2+, and Cu-N structures) present in the catalyst. | At an applied potential of -0.8 V vs RHE, the estimated phase fractions are 53% Cu2O (Cu1+), 28% Cu foil (Cu0), 15% CuPc (Cu-N structures), and 4% CuO (Cu2+), with a 10% uncertainty. These specific values result from the competing effects of the maximum reductive potential and the stabilizing N-graphene support. While the -0.8 V potential drives the initial reduction of Cu2+ to Cu1+, making Cu2O the dominant species (53%), further reduction to Cu0 aggregates (28%) is greatly diminished by the strong Cu-N bonds. Consequently, a significant fraction of the stable square planar Cu-N structure (15% CuPc) is preserved, demonstrating the support's ability to prevent complete demetallation and nanoparticle aggregation. | Full points for estimating that Cu1+ (e.g., Cu2O) is the dominant phase (~53%), followed by a moderate fraction of Cu0 nanoparticles (~28%), a stable fraction of Cu-N species (~15% CuPc), and a negligible amount of Cu2+ (~4%). Estimates within ±10% of these values are acceptable. |
| q3 | reasoning | 50 | Explain the physical reasoning behind the observed speciation of the Cu1/N catalyst at -0.8 V. Why does the catalyst not fully reduce to metallic copper nanoparticles at this highly reductive potential? | The catalyst does not fully reduce to metallic copper nanoparticles at -0.8 V vs RHE because the N-coordination from the N-graphene support provides enhanced stability for the Cu single atoms compared to O- or B-coordination. Although the highly reductive potential drives an initial conversion of Cu2+ to Cu1+, further reduction to Cu0 is greatly diminished by the strong Cu-N bonds. As a result, Cu1+ remains the dominant species (53%), while Cu0 aggregates make up only 28% of the total copper fraction. The stable square planar Cu-N structure, represented by a 15% CuPc fraction, remains relatively stable across all potentials, demonstrating that N-coordination effectively protects against complete demetallation and nanoparticle aggregation. | Full points for explaining that N-coordination provides enhanced stability against demetallation compared to other environments (like O or B). The strong Cu-N bond hinders complete reduction and aggregation, allowing Cu1+ to remain the dominant species and preserving a portion of the original square planar Cu-N structure even at -0.8 V. |
Review
Origin of Pt Nuclearity Dependence of CO Oxidation over Pt/TiO2 Catalysts in the Subnanometer Regime
BNL-NSLS-II-8-ID
Catalyst
Md Raian Yousuf et al.
DOI: 10.1021/acscatal.6c03933
1 scenario
▶
#760
Pt/TiO2
Pt L3
▶
LLM Prompt
Sample Information
Material: Pt/TiO2
Support: TiO2 (anatase)
Reaction Conditions: 1 kPa CO, 10 kPa O2, balance N2 at 160 °C
Sample-Specific Conditions
- reaction state: during CO oxidation
- 1 wt% Pt on TiO2, 0.9 nm average cluster size, measured in-situ during CO oxidation
Measurement
We plan to measure the Pt L3 XANES spectrum of this sample.
Questions
Based on all the information above:
1. Based on the reaction conditions (1 kPa CO, 10 kPa O2 at 160 °C), what oxidation state dominates the 0.9 nm Pt clusters, and what reference spectra would be most appropriate to verify this state using XANES?
2. Explain the physical and structural reasons why the 0.9 nm Pt clusters adopt this specific oxidation state during steady-state CO oxidation, rather than remaining metallic or becoming fully oxidized (Pt4+).
3. Describe the expected changes in the Pt L3-edge white line intensity for this 0.9 nm Pt/TiO2 sample as it transitions from a reduced state to the active CO oxidation state, and how it compares to standard reference materials.
Ground Truth
Material: Pt/TiO2
Measurement: in situ Pt L3-edge XANES in fluorescence mode at SSRL beamline 9-3
Fit method: Qualitative comparison of White Line Intensity (WLI)
Phase fractions: (±10%)
| Phase | Fraction |
|---|---|
| Pt2+ (partially oxidized clusters) | 1.0 |
Fit basis (paper's reference spectra):
- Pt foil
- Pt(II) standard (Pt(acac)2)
- Pt(IV) standard
Source evidence: Figure 3 (d) and text on page 17
Key reasoning: During CO oxidation, the XANES spectrum of the 0.9 nm Pt clusters exhibits a much higher white line intensity that almost coincides with the Pt(II) standard, indicating a ~Pt2+ oxidation state. This partial oxidation is attributed to a chemical restructuring involving Pt-Pt bond breaking and simultaneous formation of Pt-O bonds without physical disintegration of the clusters. The oxidation occurs due to the filling of oxygen vacancies in the reducible TiO2 support or the adsorption of O adatoms on Pt upon O2 activation.
Reasoning source: State of Pt under Reaction Environment section, page 17
Scoring Rubric (total: 100 pts)
| Q | Type | Max | Question | Reference Answer | Scoring Criteria |
|---|---|---|---|---|---|
| q1 | identification | 30 | Based on the reaction conditions (1 kPa CO, 10 kPa O2 at 160 °C), what oxidation state dominates the 0.9 nm Pt clusters, and what reference spectra would be most appropriate to verify this state using XANES? | Under the specified CO oxidation conditions (1 kPa CO, 10 kPa O2 at 160 °C), the 0.9 nm Pt clusters are entirely dominated by a partially oxidized ~Pt2+ state (fraction of 1.0). To verify this state using XANES, the most appropriate reference spectra are Pt foil (metallic), a Pt(II) standard such as Pt(acac)2, and a Pt(IV) standard. This specific Pt2+ phase arises because the O2-rich reaction environment (10 kPa O2 vs 1 kPa CO) and the reducible TiO2 support promote chemical restructuring of the small clusters. Specifically, the activation of O2 leads to the adsorption of O adatoms on the Pt clusters and the filling of oxygen vacancies in the TiO2, causing Pt-Pt bonds to break and Pt-O bonds to form. | Full points for identifying the ~Pt2+ oxidation state and suggesting appropriate standards such as Pt foil (for metallic reference) and a Pt(II) standard (e.g., Pt(acac)2). |
| q2 | reasoning | 40 | Explain the physical and structural reasons why the 0.9 nm Pt clusters adopt this specific oxidation state during steady-state CO oxidation, rather than remaining metallic or becoming fully oxidized (Pt4+). | During steady-state CO oxidation at 160 °C with an excess of oxygen (10 kPa O2 to 1 kPa CO), the 0.9 nm Pt clusters adopt a partially oxidized ~Pt2+ state rather than remaining metallic or reaching a fully oxidized Pt4+ state. This partial oxidation occurs because the clusters undergo a chemical restructuring where Pt-Pt bonds are broken and Pt-O bonds are simultaneously formed, yet the clusters do not physically disintegrate. This structural change is driven by the reaction environment, specifically the adsorption of O adatoms onto the Pt surface upon O2 activation. Furthermore, the reducible nature of the TiO2 support facilitates this specific degree of oxidation through the filling of its oxygen vacancies. | Full points for explaining that the clusters undergo chemical restructuring (Pt-Pt bond breaking and Pt-O bond formation) leading to partial oxidation (~Pt2+), driven by O2 activation/O adatom adsorption or filling of support oxygen vacancies, without the clusters physically disintegrating into fully oxidized single atoms. |
| q3 | spectral | 30 | Describe the expected changes in the Pt L3-edge white line intensity for this 0.9 nm Pt/TiO2 sample as it transitions from a reduced state to the active CO oxidation state, and how it compares to standard reference materials. | As the 0.9 nm Pt/TiO2 sample transitions to the active CO oxidation state at 160 °C, the Pt L3-edge XANES spectrum will exhibit a prominent increase in the white line intensity compared to the reduced metallic state (Pt foil). This increased white line intensity almost exactly coincides with a Pt(II) standard (such as Pt(acac)2) and remains lower than that of a Pt(IV) standard. These spectral features emerge because the O2-rich reaction conditions (10 kPa O2, 1 kPa CO) drive the adsorption of O adatoms and the filling of TiO2 oxygen vacancies, leading to the formation of Pt-O bonds. Consequently, the clusters undergo chemical restructuring into a partially oxidized ~Pt2+ state, which directly produces the observed intermediate white line intensity. | Full points for stating the white line intensity increases significantly compared to the reduced state (metallic Pt), closely matching a Pt(II) standard, but remaining lower than a Pt(IV) standard. |
Review
Single-Atom Pt Catalyst for Effective C–F Bond Activation via Hydrodefluorination
BNL-NSLS-II-8-ID
Catalyst
Dahong Huang et al.
DOI: 10.1021/acscatal.8b02660
1 scenario
▶
#761
Pt/SiC
Pt L3
▶
LLM Prompt
Sample Information
Material: Pt/SiC
Support: SiC
Sample-Specific Conditions
- Pt loading: 0.8 wt %
- Single-atom Pt catalyst on SiC substrate
Measurement
We plan to measure the Pt L3 XANES spectrum of this sample.
Questions
Based on all the information above:
1. Based on the sample conditions (0.8 wt % single-atom Pt on SiC), what is the expected oxidation state of the Pt species, and what specific XANES feature would you use to determine this?
2. How would the white line intensity of this single-atom Pt catalyst compare to the white line intensities of standard reference materials such as bulk Pt foil, Pt cisplatin (Pt2+), and PtO2 (Pt4+)?
3. What is the physical origin of the white line feature observed at the Pt L3-edge for this single-atom catalyst?
Ground Truth
Material: 0.8 wt % Pt1/SiC
Measurement: Pt L3-edge XANES, ex-situ, beamline 8-ID (ISS) of NSLS-II
Fit method: not reported
Phase fractions: (±10%)
| Phase | Fraction |
|---|---|
| Pt single atoms (Pt1/SiC) | 1.0 |
Fit basis (paper's reference spectra):
- Pt foil
- Pt cisplatin
- PtO2
Source evidence: Figure 1d, page 4
Key reasoning: The white line (WL) intensity of Pt1/SiC is between that of Pt2+ (cisplatin) and Pt4+ (PtO2), suggesting the presence of positively charged Pt with partially unoccupied 5d orbitals. This agrees with EXAFS results showing one Pt atom anchored onto the SiC substrate by coordinating with three O atoms.
Reasoning source: Page 4, SYNTHESIS AND CHARACTERIZATION section
Scoring Rubric (total: 100 pts)
| Q | Type | Max | Question | Reference Answer | Scoring Criteria |
|---|---|---|---|---|---|
| q1 | reasoning | 35 | Based on the sample conditions (0.8 wt % single-atom Pt on SiC), what is the expected oxidation state of the Pt species, and what specific XANES feature would you use to determine this? | The expected oxidation state of the Pt species is between +2 and +4. The specific XANES feature used to determine this is the intensity of the white line at the Pt L3-edge. Because the sample is a 0.8 wt % single-atom Pt catalyst anchored onto the SiC substrate by coordinating with three oxygen atoms, the Pt atoms become positively charged. This specific coordination environment results in partially unoccupied 5d orbitals, causing the white line intensity to fall exactly between that of Pt2+ and Pt4+ reference materials. | Full points for stating the oxidation state is between +2 and +4 (or positively charged) and identifying the white line intensity as the key feature used for this determination. |
| q2 | spectral | 35 | How would the white line intensity of this single-atom Pt catalyst compare to the white line intensities of standard reference materials such as bulk Pt foil, Pt cisplatin (Pt2+), and PtO2 (Pt4+)? | The white line intensity of the single-atom Pt catalyst will be higher than that of both bulk Pt foil and Pt cisplatin (Pt2+), but lower than that of PtO2 (Pt4+). This intermediate intensity occurs because the 0.8 wt % Pt is dispersed as single atoms anchored to the SiC support via coordination with three oxygen atoms. This specific structural configuration draws electron density away from the Pt atoms, leaving them positively charged with partially unoccupied 5d orbitals. As a result, the electronic state of the Pt single atoms falls between a +2 and +4 oxidation state, producing a white line intensity that sits between the Pt2+ and Pt4+ reference standards. | Full points for stating the white line intensity is higher than that of Pt foil and Pt cisplatin (Pt2+), but lower than that of PtO2 (Pt4+). |
| q3 | reasoning | 30 | What is the physical origin of the white line feature observed at the Pt L3-edge for this single-atom catalyst? | The physical origin of the white line feature at the Pt L3-edge is the electronic transition of core electrons into partially unoccupied 5d orbitals. In this 0.8 wt % single-atom catalyst, individual Pt atoms are anchored onto the SiC substrate by coordinating with three oxygen atoms. This specific bonding environment withdraws electron density from the Pt atoms, rendering them positively charged with an oxidation state between +2 and +4. Because the 5d orbitals are partially depleted by this oxygen coordination, there is a high density of unoccupied states available, which directly produces the prominent white line intensity observed in the XANES spectrum. | Full points for attributing the white line to electronic transitions into partially unoccupied 5d orbitals. |
Review
Confinement of Ultrasmall Cobalt Oxide Clusters within Silicalite-1 Crystals for Efficient Conversion of Fructose into Methyl Lactate
BNL-NSLS-II-8-ID
Catalyst
Yue Yan et al.
DOI: 10.1021/acscatal.8b03230
1 scenario
▶
#762
CoO@silicalite-1
Co K-edge
▶
LLM Prompt
Sample Information
Material: CoO@silicalite-1
Support: silicalite-1
Sample-Specific Conditions
- Co loading: 1.21 wt%
- Ultrasmall cobalt oxide clusters confined within silicalite-1 crystals
Measurement
We plan to measure the Co K-edge XANES spectrum of this sample.
Questions
Based on all the information above:
1. Given the preparation conditions (calcination in air at 550 °C), what cobalt phase dominates in this sample, and what physical mechanism prevents it from oxidizing to a higher valence state?
2. Describe the distinguishing spectral feature expected in the Co K-edge XANES spectrum of these confined ultrasmall clusters compared to bulk CoO, and state the electronic origin of this feature.
3. If one were to perform Linear Combination Fitting (LCF) to verify the oxidation state and phase purity of this sample against potential oxidized species that might form at high loadings, what reference spectra should be included in the fit basis?
Ground Truth
Material: CoO@silicalite-1 (Co1.21)
Measurement: Co K-edge XANES, beamline 8-ID of the National Synchrotron Light Source II
Fit method: Direct spectral comparison (treated as a pure confined phase)
Phase fractions: (±10%)
| Phase | Fraction |
|---|---|
| CoO | 1.0 |
Fit basis (paper's reference spectra):
- CoO
- Co3O4
Source evidence: Figure 3b, Page 12-13
Key reasoning: Cobalt nitrate (+2) precursor forms CoO during calcination. It is not further oxidized to Co3O4 despite the high temperature (550 °C in air) due to strong covalent interactions between Co and Si within the silicalite-1 framework. This interaction stabilizes the ultrasmall CoO clusters (~1.7 nm) in the 2+ state.
Reasoning source: Page 13-14
Scoring Rubric (total: 100 pts)
| Q | Type | Max | Question | Reference Answer | Scoring Criteria |
|---|---|---|---|---|---|
| q1 | reasoning | 35 | Given the preparation conditions (calcination in air at 550 °C), what cobalt phase dominates in this sample, and what physical mechanism prevents it from oxidizing to a higher valence state? | The dominant phase in this sample is CoO (100% fraction), maintaining a 2+ oxidation state. Despite the high-temperature calcination in air at 550 °C, the cobalt nitrate (+2) precursor is not further oxidized to Co3O4. This stabilization occurs because the ultrasmall cobalt oxide clusters (~1.7 nm) are confined within the silicalite-1 crystals at a low loading of 1.21 wt%. Strong covalent interactions between the Co and Si within the silicalite-1 framework stabilize the clusters in the 2+ state, preventing further oxidation. | Full credit requires identifying the phase as CoO (or Co2+) and explaining that it resists further oxidation (e.g., to Co3O4) due to strong covalent interactions/bonding between the Co clusters and the Si/silicalite-1 framework. |
| q2 | spectral | 40 | Describe the distinguishing spectral feature expected in the Co K-edge XANES spectrum of these confined ultrasmall clusters compared to bulk CoO, and state the electronic origin of this feature. | The Co K-edge XANES spectrum of this sample exhibits an edge position consistent with a 2+ oxidation state and features a distinct, dominant shoulder peak (B) that distinguishes it from bulk CoO and Co3O4 references. The electronic origin of this strong shoulder peak is a ligand-to-metal charge transfer process reflecting the covalent character of Co(3d)-O(2p) bonds. This feature arises specifically because the ultrasmall CoO clusters are confined within the silicalite-1 support at a 1.21 wt% loading. The strong interaction between the confined CoO and the silicalite-1 framework increases the degree of covalent character, producing this uniquely intense spectral feature compared to bulk materials. | Full credit requires mentioning the dominant/strong shoulder peak (Peak B) and attributing its origin to a ligand-to-metal charge transfer process (or increased covalent character of Co(3d)-O(2p)). |
| q3 | identification | 25 | If one were to perform Linear Combination Fitting (LCF) to verify the oxidation state and phase purity of this sample against potential oxidized species that might form at high loadings, what reference spectra should be included in the fit basis? | To verify the oxidation state and phase purity, the fit basis should include CoO and Co3O4 reference spectra. These references are necessary to confirm that the sample consists entirely of a pure confined CoO phase (1.0 fraction) with a 2+ oxidation state. Given the calcination conditions (550 °C in air), Co3O4 is the expected higher-valence oxidized species that could form if the cobalt were not stabilized. However, because the 1.21 wt% ultrasmall cobalt oxide clusters are confined within the silicalite-1 crystals, strong covalent interactions between Co and Si prevent oxidation to Co3O4, resulting in a 100% CoO composition. | Full credit requires listing CoO and Co3O4 as the necessary reference spectra. |
Review
Highly Active Ceria-Supported Ru Catalyst for the Dry Reforming of Methane: In Situ Identification of Ru δ+ –Ce 3+ Interactions for Enhanced Conversion
BNL-NSLS-II-8-ID
Catalyst
Zongyuan Liu et al.
DOI: 10.1021/acscatal.8b05162
3 scenarios
▶
#763
Ru-CeO2
Ru K
▶
LLM Prompt
Sample Information
Material: Ru-CeO2
Support: CeO2
Reaction Conditions: ex-situ, room temperature
Sample-Specific Conditions
- Fresh state: Fresh
- Freshly calcined Ru supported on ceria
Measurement
We plan to measure the Ru K XANES spectrum of this sample.
Questions
Based on all the information above:
1. What is the expected oxidation state and dominant phase of Ru in this freshly calcined sample?
2. Describe the expected spectral shape of this sample, specifically comparing it to bulk RuO2. What structural characteristic causes this difference?
3. What candidate reference spectra would be needed to model this sample and its subsequent reduction, and what is the approximate energy of the main white line feature for the fresh state?
Ground Truth
Material: 0.5 wt% Ru-CeO2
Measurement: Ru K-edge ex-situ XANES
Fit method: not applicable
Phase fractions: (±10%)
| Phase | Fraction |
|---|---|
| RuO2 | 1.0 |
Fit basis (paper's reference spectra):
- RuO2
- Ru metal
Source evidence: Section 3.1, Figure 2; Section 3.2, page 9
Key reasoning: The Ru K-edge XANES shows that the oxidation state of Ru is 4+ according to the position of the absorption edge. Compared to reference RuO2, the slightly different white line feature of the catalyst indicates that the Ru clusters may adopt a distorted local symmetry.
Reasoning source: Section 3.1, page 7
Scoring Rubric (total: 100 pts)
| Q | Type | Max | Question | Reference Answer | Scoring Criteria |
|---|---|---|---|---|---|
| q1 | identification | 30 | What is the expected oxidation state and dominant phase of Ru in this freshly calcined sample? | The expected oxidation state of Ru in this sample is 4+, with the dominant phase being 100% RuO2. This fully oxidized state is expected because the sample consists of freshly calcined Ru supported on ceria and is measured ex-situ at room temperature. The calcination process drives the complete oxidation of the Ru species to form RuO2. This 4+ oxidation state is directly confirmed by the position of the absorption edge in the XANES spectrum. | Full points for identifying the oxidation state as 4+ and the dominant phase as RuO2. |
| q2 | spectral | 40 | Describe the expected spectral shape of this sample, specifically comparing it to bulk RuO2. What structural characteristic causes this difference? | The expected spectral shape of this sample closely resembles that of reference RuO2, but it exhibits a slightly different white line feature. This spectral difference arises because the sample consists of freshly calcined Ru supported on ceria, which forms small Ru clusters rather than a bulk oxide. These small supported clusters adopt a distorted local symmetry compared to bulk RuO2. Consequently, this structural distortion alters the local environment, resulting in the observed modification of the white line feature in the XANES spectrum. | Full points for noting that the spectrum resembles RuO2 but has a slightly different white line feature, and explaining that this difference is due to the distorted local symmetry of the small Ru clusters. |
| q3 | identification | 30 | What candidate reference spectra would be needed to model this sample and its subsequent reduction, and what is the approximate energy of the main white line feature for the fresh state? | The candidate reference spectra needed to model this sample are RuO2 and Ru metal, with the main white line feature for the fresh state located at approximately 22140 eV. These specific references are required because the freshly calcined Ru-CeO2 sample initially exists as fully oxidized RuO2 (fraction of 1.0) due to the calcination process, while any subsequent reduction would yield Ru metal. The white line energy of ~22140 eV corresponds to the 4+ oxidation state present in this fresh, ex-situ sample. Furthermore, this white line feature exhibits slight differences from bulk RuO2 because the small Ru clusters on the ceria support adopt a distorted local symmetry. | Full points for identifying RuO2 and Ru metal as necessary references, and stating the white line energy is approximately 22140 eV. |
Review
#764
Ru-CeO2
Ru K
▶
LLM Prompt
Sample Information
Material: Ru-CeO2
Support: CeO2
Reaction Conditions: 5 ml/min CH4 + 15 ml/min He, 500 °C
Sample-Specific Conditions
- Temperature during CH4 TPR: 500 °C
- Catalyst during temperature programmed reduction with methane
Measurement
We plan to measure the Ru K XANES spectrum of this sample.
Questions
Based on all the information above:
1. What reference spectra are required as the basis for a Linear Combination Fitting (LCF) analysis of the Ru K-edge XANES data for this catalyst during CH4 TPR at 500 °C?
2. Estimate the phase fractions of the Ru species present in the catalyst at 500 °C during the CH4 TPR process.
3. Explain the chemical and physical reasoning for the observed Ru phase composition at 500 °C during CH4 TPR, specifically addressing the role of the support.
Ground Truth
Material: Ru-CeO2
Measurement: in-situ Ru K-edge XANES, fluorescence yield mode, ISS beamline at NSLS-II
Fit method: LCF
Phase fractions: (±10%)
| Phase | Fraction |
|---|---|
| Ru metal | 0.9 |
| RuO2 | 0.1 |
Fit basis (paper's reference spectra):
- Ru metal
- RuO2
Source evidence: Page 9, Section 3.2, Figure 3b
Key reasoning: During temperature-programmed reduction with methane (CH4-TPR), the initial RuO2 phase reduces rapidly between 150-200 °C. This low-temperature reduction is attributed to a H-spillover effect facilitated by metal-support interactions, where H adatoms from methane activation spill over to ceria. The reduction process slows down at higher temperatures, reaching an equilibrium state consisting of ~90% metallic Ru and ~10% RuO2 at 500 °C.
Reasoning source: Page 9, Section 3.2 Methane Activation
Scoring Rubric (total: 100 pts)
| Q | Type | Max | Question | Reference Answer | Scoring Criteria |
|---|---|---|---|---|---|
| q1 | identification | 30 | What reference spectra are required as the basis for a Linear Combination Fitting (LCF) analysis of the Ru K-edge XANES data for this catalyst during CH4 TPR at 500 °C? | The required reference spectra for the LCF analysis of the Ru K-edge XANES data are Ru metal and RuO2. These specific phases are expected because the Ru-CeO2 catalyst is subjected to temperature-programmed reduction with methane (CH4-TPR) at 500 °C. Under these conditions, the initial RuO2 phase reduces rapidly between 150-200 °C due to a H-spillover effect facilitated by the CeO2 support. By the time the temperature reaches 500 °C, the reduction process slows down and reaches an equilibrium state, necessitating both metallic Ru and oxide references to accurately model the resulting mixed-phase system. | Full credit for identifying metallic Ru and RuO2 as the necessary reference spectra. |
| q2 | quantification | 30 | Estimate the phase fractions of the Ru species present in the catalyst at 500 °C during the CH4 TPR process. | During the CH4 TPR process at 500 °C, the estimated phase fractions are 0.9 (90%) Ru metal and 0.1 (10%) RuO2, with an uncertainty of 10%. These specific values result from the catalyst's temperature-dependent reduction kinetics under the 5 ml/min CH4 and 15 ml/min He flow. The initial RuO2 reduces rapidly at lower temperatures (150-200 °C) via H-spillover from methane activation onto the CeO2 support. However, the reduction process slows down at higher temperatures, reaching a stable equilibrium state at 500 °C that leaves approximately 10% of the RuO2 unreduced. | Full credit for estimating ~90% metallic Ru and ~10% RuO2 (allow ±10% variation). |
| q3 | reasoning | 40 | Explain the chemical and physical reasoning for the observed Ru phase composition at 500 °C during CH4 TPR, specifically addressing the role of the support. | The observed equilibrium composition of ~90% Ru metal and ~10% RuO2 at 500 °C arises from the specific metal-support interactions between Ru and the CeO2 support during CH4-TPR. At lower temperatures (150-200 °C), the initial RuO2 phase reduces rapidly due to a H-spillover effect, where H adatoms from methane activation spill over onto the ceria support. As the reaction temperature increases to 500 °C under the methane/helium flow, this reduction process slows down rather than proceeding to completion. Consequently, the system reaches an equilibrium state at 500 °C, stabilizing a predominantly metallic Ru phase alongside a minor fraction of unreduced RuO2. | Full credit for mentioning the rapid initial reduction due to methane activation and H-spillover facilitated by metal-support interactions, leading to an equilibrium state of predominantly metallic Ru with a minor oxide component at 500 °C. |
Review
#765
Ru-CeO2
Ru K
▶
LLM Prompt
Sample Information
Material: Ru-CeO2
Support: CeO2
Reaction Conditions: H2, 400 °C
Sample-Specific Conditions
- Pretreatment gas: H2
- Catalyst after reduction in hydrogen
Measurement
We plan to measure the Ru K XANES spectrum of this sample.
Questions
Based on all the information above:
1. What candidate reference spectra are needed to perform a Linear Combination Fitting (LCF) analysis of the Ru K-edge XANES for this sample?
2. Estimate the phase fractions of the Ru species present in the catalyst after the H2 pretreatment at 400 °C.
3. Explain the physical reasoning for the observed phase composition, specifically why the Ru species are not fully reduced to a zero-valent metallic state despite the H2 pretreatment at 400 °C.
Ground Truth
Material: 0.5wt% Ru-CeO2
Measurement: in-situ Ru K-edge XANES, ISS beamline at NSLS-II
Fit method: Linear combination fitting (LCF)
Phase fractions: (±10%)
| Phase | Fraction |
|---|---|
| Ru metal | 0.82 |
| RuO2 | 0.18 |
Fit basis (paper's reference spectra):
- Ru metal
- RuO2
Source evidence: Page 15, text and Figure 6a
Key reasoning: H2 pretreatment at 400 °C reduces the initial RuO2 clusters predominantly to metallic Ru. However, the Ru species retain a partial positive charge (Ruδ+), indicated by a shallow valley in the white line position of the XANES spectrum. This partial oxidation state is attributed to charge transfer from Ru centers to the ceria support or from residual Ru-O bonds at the metal-support interface, resulting in an ~18% oxide feature remaining in the LCF.
Reasoning source: Page 15, Section 3.4
Scoring Rubric (total: 100 pts)
| Q | Type | Max | Question | Reference Answer | Scoring Criteria |
|---|---|---|---|---|---|
| q1 | identification | 20 | What candidate reference spectra are needed to perform a Linear Combination Fitting (LCF) analysis of the Ru K-edge XANES for this sample? | To perform a Linear Combination Fitting (LCF) analysis of the Ru K-edge XANES for this sample, reference spectra for Ru metal and RuO2 are required. These specific reference phases are needed because the H2 pretreatment at 400 °C predominantly reduces the initial Ru species to metallic Ru. However, a fully reduced state is not achieved due to charge transfer from the Ru centers to the CeO2 support or residual Ru-O bonds at the metal-support interface. Consequently, the Ru species retain a partial positive charge (Ruδ+), necessitating the inclusion of the RuO2 reference to account for the remaining oxidized fraction. | Full points for identifying metallic Ru (or Ru foil) and RuO2 as the necessary reference spectra. |
| q2 | quantification | 40 | Estimate the phase fractions of the Ru species present in the catalyst after the H2 pretreatment at 400 °C. | After H2 pretreatment at 400 °C, the estimated phase fractions are 0.82 (82%) Ru metal and 0.18 (18%) RuO2, with an uncertainty of 10%. These specific values result from the strong reducing environment of H2 at 400 °C, which converts the vast majority of the initial RuO2 clusters into metallic Ru. The 18% oxide fraction persists because the Ru species retain a partial positive charge (Ruδ+) rather than reducing completely to a zero-valent state. This remaining oxidized fraction is driven by charge transfer from the Ru centers to the CeO2 support and the presence of residual Ru-O bonds at the metal-support interface. | Full points for estimating ~82% metallic Ru and ~18% RuO2 (or oxide feature). Deduct points proportionally for deviations greater than the 10% uncertainty margin. |
| q3 | reasoning | 40 | Explain the physical reasoning for the observed phase composition, specifically why the Ru species are not fully reduced to a zero-valent metallic state despite the H2 pretreatment at 400 °C. | The H2 pretreatment at 400 °C provides a strong reducing environment that predominantly converts the initial RuO2 clusters into metallic Ru. However, the Ru species are not fully reduced to a zero-valent state due to strong interactions with the CeO2 support. Specifically, charge transfer occurs from the Ru centers to the ceria support, and residual Ru-O bonds remain at the metal-support interface. This mechanism leaves the Ru species with a partial positive charge (Ruδ+), which manifests as a shallow valley in the white line position of the XANES spectrum and results in an 18% RuO2 phase fraction in the LCF analysis. | Full points for explaining that the Ru species retain a partial positive charge (Ruδ+) due to strong metal-support interactions, specifically charge transfer from Ru to the ceria support or the presence of residual Ru-O bonds at the interface. |
Review
Identification of a Pt3Co Surface Intermetallic Alloy in Pt–Co Propane Dehydrogenation Catalysts
BNL-NSLS-II-8-ID
Catalyst
Laryssa Goncalves Cesar et al.
DOI: 10.1021/acscatal.9b00549
2 scenarios
▶
#766
Pt/SiO2
Pt L3
▶
LLM Prompt
Sample Information
Material: Pt/SiO2
Support: SiO2
Reaction Conditions: Measured in-situ at room temperature in He
Sample-Specific Conditions
- Co loading: 0 wt.%
- Monometallic Pt catalyst supported on silica
Measurement
We plan to measure the Pt L3 XANES spectrum of this sample.
Questions
Based on all the information above:
1. Based on the sample conditions (3 wt.% Pt on SiO2, reduced at 550 °C in H2), what is the expected dominant phase of Pt, and what is its oxidation state?
2. Describe the expected Pt L3-edge XANES spectral features for this sample, including the edge energy and overall shape.
3. What reference spectrum is most appropriate to confirm the chemical state of Pt in this sample, and what physical reasoning justifies this choice?
Ground Truth
Material: 3Pt/SiO2
Measurement: Pt LIII edge in-situ transmission mode at Advanced Photon Source
Fit method: Qualitative comparison
Phase fractions:
| Phase | Fraction |
|---|---|
| metallic_platinum | 1.0 |
Fit basis (paper's reference spectra):
- Pt foil
Source evidence: Section 3.2.1, Figure 4, Table 2, and Section 3.3
Key reasoning: The XANES spectrum of the monometallic Pt nanoparticles exhibits a similar shape, white line intensity, and edge energy to a Pt foil. This indicates that all Pt atoms in the catalyst are fully reduced, with Pt atoms surrounded only by other Pt atoms. XRD also confirms the presence of fully reduced monometallic fcc Pt.
Reasoning source: Section 3.2.1 and Section 3.3
Scoring Rubric (total: 100 pts)
| Q | Type | Max | Question | Reference Answer | Scoring Criteria |
|---|---|---|---|---|---|
| q1 | identification | 30 | Based on the sample conditions (3 wt.% Pt on SiO2, reduced at 550 °C in H2), what is the expected dominant phase of Pt, and what is its oxidation state? | The expected dominant phase of Pt in this sample is fully reduced metallic platinum (fraction of 1.0), with an oxidation state of 0. This phase arises because the sample is a monometallic Pt catalyst supported on silica with 0 wt.% Co, leading to Pt atoms being surrounded only by other Pt atoms. The fully reduced state is confirmed by the XANES spectrum exhibiting an edge energy and white line intensity matching that of a Pt foil. Additionally, XRD confirms the presence of fully reduced monometallic fcc Pt under these specific sample conditions. | Full credit for identifying metallic platinum (Pt0) as the sole/dominant phase. |
| q2 | spectral | 40 | Describe the expected Pt L3-edge XANES spectral features for this sample, including the edge energy and overall shape. | The expected Pt L3-edge XANES spectrum for this sample will exhibit an edge energy of 11564.0 eV (11.5640 keV). The overall spectral shape and white line intensity will be highly similar to that of a metallic Pt foil reference. These specific features arise because the sample consists of monometallic Pt nanoparticles on a silica support with no Co present, resulting in a fully reduced state with an oxidation state of 0. Consequently, the electronic and structural properties of the Pt atoms, which are surrounded only by other Pt atoms, perfectly mirror the metallic fcc structure of bulk Pt foil. | Full credit for stating the edge energy is approximately 11564.0 eV (or 11.5640 keV) and that the spectral shape and white line intensity are similar to a Pt foil. |
| q3 | reasoning | 30 | What reference spectrum is most appropriate to confirm the chemical state of Pt in this sample, and what physical reasoning justifies this choice? | The most appropriate reference spectrum to confirm the chemical state of Pt in this sample is a Pt foil. This choice is justified because the sample is a monometallic Pt catalyst supported on silica (0 wt.% Co), which results in the Pt atoms being surrounded exclusively by other Pt atoms. Under these conditions, the Pt nanoparticles are fully reduced to an oxidation state of 0, forming a monometallic fcc Pt structure. Therefore, comparing the sample's XANES shape, white line intensity, and edge energy to a Pt foil provides direct confirmation of this fully reduced metallic state. | Full credit for identifying Pt foil as the reference and explaining that the high-temperature reduction in H2 fully reduces the Pt nanoparticles to a metallic state, making the foil the ideal comparison. |
Review
#767
Pt-Co/SiO2
Pt L3
▶
LLM Prompt
Sample Information
Material: Pt-Co/SiO2
Support: SiO2
Reaction Conditions: Measured in-situ at room temperature in He
Sample-Specific Conditions
- Co loading: 0.6 wt.%
- Bimetallic Pt-Co catalyst supported on silica
Measurement
We plan to measure the Pt L3 XANES spectrum of this sample.
Questions
Based on all the information above:
1. Based on the sample conditions (2 wt.% Pt, 0.6 wt.% Co, reduced at 550 °C), describe the expected Pt L3-edge XANES spectral shape, edge position, and white line intensity compared to a monometallic Pt reference.
2. What electronic transition is responsible for the white line feature at the Pt L3-edge, and what do the observed changes in this feature (intensity decrease and edge shift) indicate about the electronic structure of the Pt atoms upon alloying with Co?
Ground Truth
Material: 2Pt0.6Co/SiO2
Measurement: Pt LIII edge, in situ transmission mode, Advanced Photon Source
Fit method: Qualitative comparison and EXAFS fitting (no LCF performed for Pt L3 edge)
Phase fractions:
| Phase | Fraction |
|---|---|
| fully reduced Pt (Pt0) | 1.0 |
Fit basis (paper's reference spectra):
- Pt foil
- 3Pt/SiO2 (monometallic Pt nanoparticles)
Source evidence: Page 15-16 (Section 3.2.1), Figure 4a, Table 2
Key reasoning: The XANES spectrum of 2Pt0.6Co shows a similar shape and white line intensity to monometallic Pt nanoparticles, implying all Pt atoms are fully reduced. However, a slight decrease and broadening in the white line, along with a shift to a higher edge energy (11.5642 keV), indicates the presence of neighboring Co atoms and the formation of bimetallic Pt-Co nanoparticles. Structural analysis reveals these nanoparticles consist of a Pt-rich core with a Pt3Co surface alloy.
Reasoning source: Section 3.2.1 (Page 16) and Section 4.1 (Page 39)
Scoring Rubric (total: 100 pts)
| Q | Type | Max | Question | Reference Answer | Scoring Criteria |
|---|---|---|---|---|---|
| q1 | spectral | 46 | Based on the sample conditions (2 wt.% Pt, 0.6 wt.% Co, reduced at 550 °C), describe the expected Pt L3-edge XANES spectral shape, edge position, and white line intensity compared to a monometallic Pt reference. | The expected Pt L3-edge XANES spectrum for the 2Pt0.6Co/SiO2 catalyst will exhibit an overall shape similar to monometallic Pt nanoparticles and Pt foil, indicating that the Pt is fully reduced (Pt0). However, compared to the monometallic reference, the spectrum will show a slight decrease and broadening in the white line intensity, along with a shift to a higher edge energy of 11564.2 eV. These specific spectral features arise because the sample conditions produce bimetallic Pt-Co nanoparticles consisting of a Pt-rich core and a Pt3Co surface alloy. The presence of neighboring Co atoms alters the electronic environment of the Pt atoms, specifically increasing the energy of the unfilled Pt 5d-orbitals due to bonding with Co, which directly causes the observed edge shift and white line attenuation. | Full points if the answer notes the overall shape is similar to fully reduced Pt, but correctly identifies the slight shift to higher edge energy (approx. 11564.2 eV) and the slight decrease/broadening of the white line intensity. |
| q2 | reasoning | 54 | What electronic transition is responsible for the white line feature at the Pt L3-edge, and what do the observed changes in this feature (intensity decrease and edge shift) indicate about the electronic structure of the Pt atoms upon alloying with Co? | The white line feature at the Pt L3-edge originates from the dipole-allowed photo-excitation of a 2p electron into an unfilled Pt 5d-orbital. In this 0.6 wt.% Co bimetallic catalyst, the observed slight decrease and broadening of the white line, along with the shift to a higher edge energy (11.5642 keV), indicate that the Pt atoms are fully reduced but electronically perturbed by neighboring Co atoms. These changes occur because the sample conditions lead to the formation of bimetallic Pt-Co nanoparticles featuring a Pt3Co surface alloy. Consequently, bonding with Co alters the electronic structure of Pt by increasing the energy of the unfilled Pt 5d-orbitals, which manifests as the observed attenuation and shift in the XANES white line. | Full points if the answer identifies the transition as a 2p electron to an unfilled Pt 5d-orbital, and explains that the changes indicate an increase in the energy of the unfilled d-orbitals due to bonding/alloying with Co. |
Review
Edge-Enhanced Oxygen Evolution Reactivity at Ultrathin, Au-Supported Fe2O3 Electrocatalysts
BNL-NSLS-II-8-ID
Catalyst
Douglas R. Kauffman et al.
DOI: 10.1021/acscatal.9b01093
1 scenario
▶
#768
Fe2O3
Fe Fe K-edge, Fe L-edge
▶
LLM Prompt
Sample Information
Material: Fe2O3
Support: Au(111)
Reaction Conditions: UHV
Sample-Specific Conditions
- state: as-synthesized
- Ultrathin Fe2O3 nanostructures grown on Au(111) substrate
Measurement
We plan to measure the Fe Fe K-edge, Fe L-edge XANES spectrum of this sample.
Questions
Based on all the information above:
1. Based on the synthesis conditions (UHV metal evaporation of Fe onto Au(111) followed by oxidation in NO2 at 700 K), what specific iron oxide phase and structural motif is expected to form?
2. What reference spectrum would be most appropriate to confirm the composition of this as-synthesized sample using XAS?
Ground Truth
Material: Fe2O3 on Au(111)
Measurement: Fe L-edge and K-edge XAS, beamlines 23-ID-2 (IOS) and 8-ID ISS
Fit method: not reported
Phase fractions:
| Phase | Fraction |
|---|---|
| alpha-Fe2O3 | 1.0 |
Fit basis (paper's reference spectra):
- not reported
Source evidence: Page 14, Results and Discussion
Key reasoning: Fe nanostructures were grown on Au(111) via UHV metal evaporation and oxidized in NO2 at 700 K. The resulting structures had a consistent apparent height of ~0.5 nm, corresponding to a bilayer stacking of the O-Fe-Fe-O unit in alpha-Fe2O3. The Fe2O3 composition was confirmed with both XPS and X-ray absorption spectroscopy.
Reasoning source: Page 7 (Methods) and Page 14 (Results and Discussion)
Scoring Rubric (total: 100 pts)
| Q | Type | Max | Question | Reference Answer | Scoring Criteria |
|---|---|---|---|---|---|
| q1 | identification | 57 | Based on the synthesis conditions (UHV metal evaporation of Fe onto Au(111) followed by oxidation in NO2 at 700 K), what specific iron oxide phase and structural motif is expected to form? | The expected iron oxide phase is alpha-Fe2O3, which accounts for 1.0 (100%) of the sample fraction. Under the specified UHV conditions, Fe metal is evaporated onto the Au(111) support and subsequently oxidized using NO2 at 700 K. This specific oxidation environment and temperature drive the formation of ultrathin nanostructures with a consistent apparent height of ~0.5 nm. This measured height corresponds structurally to a bilayer stacking of the O-Fe-Fe-O unit, which is the characteristic structural motif of alpha-Fe2O3. | The answer must identify alpha-Fe2O3 (hematite) and specifically mention the formation of an ultrathin structure (~0.5 nm) corresponding to a bilayer stacking of the O-Fe-Fe-O unit. |
| q2 | reasoning | 43 | What reference spectrum would be most appropriate to confirm the composition of this as-synthesized sample using XAS? | An alpha-Fe2O3 reference spectrum is the most appropriate standard to confirm the composition of this as-synthesized sample. The sample consists of ultrathin Fe nanostructures grown on an Au(111) substrate via UHV metal evaporation and oxidized in NO2 at 700 K. These specific synthesis conditions yield structures with an apparent height of ~0.5 nm, which dictates a bilayer stacking of the O-Fe-Fe-O unit. Because this structural motif exclusively forms alpha-Fe2O3 under these conditions, comparing the Fe K-edge and L-edge XANES measurements to an alpha-Fe2O3 reference will directly confirm the expected composition. | The answer must identify bulk alpha-Fe2O3 (hematite) as the primary reference material needed to confirm the Fe2O3 composition. |
Review
Comprehensive Mechanisms of Electrocatalytic CO2 Reduction by [Ir(bip)(ppy)(CH3CN)](PF6)2
BNL-NSLS-II-8-ID
Electrochemistry
Gerald F. Manbeck, Dmitry E. Polyansky, Etsuko Fujita
DOI: 10.1021/acscatal.9b04371
2 scenarios
▶
#769
[Ir(bip)(ppy)(CH3CN)](PF6)2
Ir L3
▶
LLM Prompt
Sample Information
Material: [Ir(bip)(ppy)(CH3CN)](PF6)2
Charge Discharge: OCV
Sample-Specific Conditions
- oxidation_state: Ir(III)
- Solid state sample of the Ir(III) precatalyst pressed into pellets with boron nitride
Measurement
We plan to measure the Ir L3 XANES spectrum of this sample.
Questions
Based on all the information above:
1. Based on the sample conditions (solid state Ir(III) precatalyst), describe the expected Ir L3-edge XANES spectral features, specifically regarding the edge position, white line intensity, and the presence of pre-edge features.
2. How would the Ir L3-edge XANES spectrum of this as-prepared Ir(III) precatalyst differ from its two-electron reduced Ir(I) form?
3. What is the formal oxidation state of the Ir center in this as-prepared solid state sample, and what specific spectral metric from the XANES data confirms this state?
Ground Truth
Material: [Ir(bip)(ppy)(CH3CN)](PF6)2
Measurement: Ir L3-edge XAS, transmission mode, ISS 8-ID beamline at NSLS-II
Fit method: not reported
Phase fractions:
| Phase | Fraction |
|---|---|
| [Ir(bip)(ppy)(CH3CN)]2+ | 1.0 |
Source evidence: Page 26, Section B; Figure S37
Key reasoning: The sample is the as-prepared solid state precatalyst, which contains iridium in the +3 oxidation state. It serves as the baseline reference for evaluating the electrochemically reduced species.
Reasoning source: Page 26, Section B
Scoring Rubric (total: 100 pts)
| Q | Type | Max | Question | Reference Answer | Scoring Criteria |
|---|---|---|---|---|---|
| q1 | spectral | 40 | Based on the sample conditions (solid state Ir(III) precatalyst), describe the expected Ir L3-edge XANES spectral features, specifically regarding the edge position, white line intensity, and the presence of pre-edge features. | The expected Ir L3-edge XANES spectrum for this sample features an edge position at 11218.2 eV, determined by the first derivative of the rising edge. Additionally, the spectrum exhibits an intense white line and lacks any pre-edge features. These spectral characteristics arise directly from the sample conditions, specifically because it is the as-prepared solid state precatalyst pressed into a boron nitride pellet at open circuit voltage (OCV). Because it has not been electrochemically altered, the pristine Ir(III) electronic structure produces this specific high-intensity white line and baseline edge position. | Award full points if the response correctly identifies the edge position at 11218.2 eV (based on the first derivative), notes the presence of an intense white line, and explicitly states that no pre-edge features are observed. |
| q2 | reasoning | 30 | How would the Ir L3-edge XANES spectrum of this as-prepared Ir(III) precatalyst differ from its two-electron reduced Ir(I) form? | The Ir L3-edge XANES spectrum of this as-prepared Ir(III) precatalyst differs from the two-electron reduced Ir(I) species by exhibiting a higher energy edge position (11218.2 eV vs 11217.6 eV) and a more intense white line. These spectral differences arise because the current sample is measured at open circuit voltage (OCV) as a pristine solid state material. Consequently, it retains its initial +3 oxidation state and serves as a baseline reference, whereas the reduced Ir(I) form would reflect the electronic changes and lower oxidation state resulting from a two-electron electrochemical reduction. | Award full points if the response states that the Ir(III) spectrum has a higher energy edge position (11218.2 eV vs 11217.6 eV, or a ~0.6 eV shift) and a more intense white line compared to the reduced Ir(I) species. |
| q3 | identification | 30 | What is the formal oxidation state of the Ir center in this as-prepared solid state sample, and what specific spectral metric from the XANES data confirms this state? | The formal oxidation state of the Ir center in this sample is Ir(III), which corresponds to a 1.0 fraction of the [Ir(bip)(ppy)(CH3CN)]2+ complex. This oxidation state is confirmed by the XANES edge position at 11218.2 eV (first derivative of the rising edge) and the presence of an intense white line. This specific state and its corresponding metrics are expected because the sample is the as-prepared solid state precatalyst measured at open circuit voltage (OCV). Since no electrochemical reduction has been applied, the material acts as a baseline reference and fully retains its initial Ir(III) oxidation state. | Award full points if the response identifies the oxidation state as Ir(III) and cites the first derivative of the rising edge at 11218.2 eV as the confirming metric. |
Review
#770
[Ir(bip)(ppy)(CH3CN)](PF6)2
Ir L3
▶
LLM Prompt
Sample Information
Material: [Ir(bip)(ppy)(CH3CN)](PF6)2
Electrode Type: working electrode
Electrolyte: 3 mM [Ir(bip)(ppy)(CH3CN)]2+ with 0.1 M Bu4NPF6 in CH3CN
Cell Type: two-compartment cell
Charge Discharge: discharged
Voltage V: more negative than R3 wave
Sample-Specific Conditions
- oxidation_state: Ir(I)
- Frozen solution sample prepared by controlled potential electrolysis beyond the R3 wave until current dropped to nearly zero
Measurement
We plan to measure the Ir L3 XANES spectrum of this sample.
Questions
Based on all the information above:
1. Based on the electrochemical conditions (reduction beyond the R3 wave until current drops to zero), what is the expected dominant Ir species and its formal oxidation state?
2. Describe the expected changes in the Ir L3-edge XANES spectral features (specifically the edge position and white line intensity) for this 2e- reduced sample compared to the original Ir(III) precursor.
3. How do the observed changes in the XANES edge position and white line intensity correlate with the change in the electronic structure of the Ir center upon reduction?
Ground Truth
Material: [Ir(bip)(ppy)(CH3CN)](PF6)2 (reduced)
Measurement: Ir L3-edge XAS, fluorescence mode at 77 K, ISS 8-ID beamline at NSLS-II
Fit method: not reported for XANES (EXAFS fitted with FEFF 6)
Phase fractions:
| Phase | Fraction |
|---|---|
| [Ir(bip)(ppy)]2 dimer | 1.0 |
Fit basis (paper's reference spectra):
- not applicable (pure phase)
Source evidence: Page 24, Figure S37, Figure 6
Key reasoning: Electrolysis beyond the R3 wave reduces the Ir(III) precursor to a formal Ir(I)-Ir(I) dimer. This is evidenced by an edge shift of about 0.6 eV to lower energy and a decrease in white line intensity, consistent with increased electron density on the Ir metal. EXAFS fitting further confirms the presence of an Ir-Ir scattering path at ~4.28 Å.
Reasoning source: Page 24 (Characterization of reduced dimers by X-ray absorption spectroscopy)
Scoring Rubric (total: 100 pts)
| Q | Type | Max | Question | Reference Answer | Scoring Criteria |
|---|---|---|---|---|---|
| q1 | identification | 30 | Based on the electrochemical conditions (reduction beyond the R3 wave until current drops to zero), what is the expected dominant Ir species and its formal oxidation state? | The expected dominant species is the [Ir(bip)(ppy)]2 dimer, which is present as a pure phase (fraction 1.0) with a formal oxidation state of Ir(I). This specific phase arises because the sample was subjected to controlled potential electrolysis at a voltage more negative than the R3 wave until the current dropped to nearly zero. This exhaustive electrochemical reduction fully converts the original Ir(III) precursor, [Ir(bip)(ppy)(CH3CN)]2+, into the reduced Ir(I)-Ir(I) dimer. | Full points for identifying the formation of an Ir dimer ([Ir(bip)(ppy)]2) and stating the formal oxidation state is Ir(I). |
| q2 | spectral | 40 | Describe the expected changes in the Ir L3-edge XANES spectral features (specifically the edge position and white line intensity) for this 2e- reduced sample compared to the original Ir(III) precursor. | The Ir L3-edge XANES spectrum will exhibit an edge shift of approximately 0.6 eV to lower energy, moving from 11218.2 eV to 11217.6 eV in the first derivative of the rising edge. Additionally, there will be a distinct decrease in the white line intensity compared to the unreduced Ir(III) precursor. These spectral features arise because the exhaustive electrolysis beyond the R3 wave reduces the Ir(III) complex to a formal Ir(I)-Ir(I) dimer. This reduction increases the electron density on the iridium metal, which lowers the energy required for the core electron transition and reduces the intensity of the white line. | Full points for noting an edge shift to lower energy (specifically ~0.6 eV, or from 11218.2 eV to 11217.6 eV in the first derivative) and a decrease in the intensity of the white line. |
| q3 | reasoning | 30 | How do the observed changes in the XANES edge position and white line intensity correlate with the change in the electronic structure of the Ir center upon reduction? | The observed ~0.6 eV shift to lower energy and the decreased white line intensity directly correlate with an increase in electron density on the iridium metal center. By applying a potential more negative than the R3 wave until the current drops to zero, the original Ir(III) precursor is exhaustively reduced to a formal Ir(I)-Ir(I) dimer. This electrochemical reduction adds electrons to the complex, thereby increasing the electron density at the Ir center. Consequently, the increased electron density lowers the energy required for the core electron transition (shifting the edge to lower energy) and fills previously unoccupied states, which decreases the white line intensity. | Full points for explaining that the shift to lower energy and decreased white line intensity are consistent with an increase in electron density on the Ir metal as it is reduced from Ir(III) to Ir(I). |
Review
Universal Approach to Fabricating Graphene-Supported Single-Atom Catalysts from Doped ZnO Solid Solutions
APS
Catalyst
Jiashen Meng et al.
DOI: 10.1021/acscentsci.0c00458
4 scenarios
▶
#771
Co-N-C
Co K-edge
▶
LLM Prompt
Sample Information
Material: Co-N-C
Support: N-doped graphene
Sample-Specific Conditions
- Metal center: Co
- Cobalt single atoms anchored in hollow nitrogen-doped graphene framework
Measurement
We plan to measure the Co K-edge XANES spectrum of this sample.
Questions
Based on all the information above:
1. What reference spectra would be appropriate to compare with the Co K-edge XANES spectrum of this sample to determine its oxidation state and confirm its structure?
2. Describe the expected position of the absorption edge for the Co-N-Gr sample relative to standard reference materials like Co foil and CoO, and explain what this indicates about the Co atoms.
Ground Truth
Material: Co-N-Gr
Measurement: Co K-edge XANES
Fit method: EXAFS fitting
Phase fractions: (±10%)
| Phase | Fraction |
|---|---|
| Co-N4 | 1.0 |
Fit basis (paper's reference spectra):
- Co foil
- CoO
- Co3O4
- calculated Co-N-Gr
Source evidence: Page 6, Figure 3k, 3m
Key reasoning: The XANES peak position of Co-N-Gr is located between Co foil and CoO, indicating that the valence state of Co atoms lies between Co0 and CoII. EXAFS fitting confirms an average coordination number of ~4.0 for Co-N, demonstrating the Co-N4 structure without Co-Co bonds.
Reasoning source: Page 6, Results and Discussion
Scoring Rubric (total: 100 pts)
| Q | Type | Max | Question | Reference Answer | Scoring Criteria |
|---|---|---|---|---|---|
| q2 | reasoning | 46 | What reference spectra would be appropriate to compare with the Co K-edge XANES spectrum of this sample to determine its oxidation state and confirm its structure? | Appropriate reference spectra for comparison include Co foil, CoO, Co3O4, and a calculated Co-N-Gr model. These references are necessary because the sample consists of cobalt single atoms anchored in a hollow nitrogen-doped graphene framework. The standard Co foil, CoO, and Co3O4 spectra serve to bound the oxidation state, which is expected to lie between Co0 and CoII. Furthermore, the calculated Co-N-Gr spectrum is required to confirm the specific local coordination environment, as the sample forms a Co-N4 structure with an average coordination number of ~4.0 and an absence of metallic Co-Co bonds. | Full points for mentioning metallic Co (Co foil) and Co oxides (CoO, Co3O4) as references for oxidation state comparison, and ideally a calculated or standard Co-N4 model. |
| q3 | spectral | 54 | Describe the expected position of the absorption edge for the Co-N-Gr sample relative to standard reference materials like Co foil and CoO, and explain what this indicates about the Co atoms. | The absorption edge position for the Co-N-Gr sample is expected to be located between those of Co foil and CoO. This spectral feature indicates that the valence state of the cobalt atoms lies between Co0 and CoII. This intermediate oxidation state and distinct spectral shape arise because the cobalt exists as single atoms anchored within a hollow nitrogen-doped graphene framework, forming a Co-N4 moiety. Consequently, the spectrum lacks metallic Co-Co features, is distinct from bulk Co oxides, and matches the calculated structural model for Co-N-Gr. | Full points for stating the edge position is located between Co foil and CoO, which indicates that the valence state of the Co atoms lies between Co0 and CoII. |
Review
#772
Fe-N-C
Fe K-edge
▶
LLM Prompt
Sample Information
Material: Fe-N-C
Support: N-doped graphene
Sample-Specific Conditions
- Metal center: Fe
- Iron single atoms anchored in hollow nitrogen-doped graphene framework
Measurement
We plan to measure the Fe K-edge XANES spectrum of this sample.
Questions
Based on all the information above:
1. To verify the atomic dispersion of Fe in the Fe-N-Gr sample using X-ray absorption spectroscopy, what reference spectra should be included for comparison to rule out nanoparticle aggregation or oxidation?
2. What specific features in the extended X-ray absorption fine structure (EXAFS) would distinguish this Fe-N-Gr single-atom catalyst from bulk iron or iron oxide?
Ground Truth
Material: Fe-N-Gr (Fe-N-C)
Measurement: Fe K-edge XAFS, ex-situ, Advanced Photon Source (9-BM)
Fit method: EXAFS fitting
Phase fractions: (±10%)
| Phase | Fraction |
|---|---|
| Fe-N4 | 1.0 |
Fit basis (paper's reference spectra):
- Fe foil
- Fe2O3
Source evidence: Page 6, Figure 4b4
Key reasoning: The FT-EXAFS spectra showed atomically dispersed metal atoms. The average coordination number of metal-N in Fe-N-Gr was fitted to be 4.1. Because the coordination number was close to 4.0, Fe-N-Gr possessed an M-N4 structure, confirming isolated single iron atoms.
Reasoning source: Page 6, RESULTS AND DISCUSSION
Scoring Rubric (total: 100 pts)
| Q | Type | Max | Question | Reference Answer | Scoring Criteria |
|---|---|---|---|---|---|
| q2 | reasoning | 50 | To verify the atomic dispersion of Fe in the Fe-N-Gr sample using X-ray absorption spectroscopy, what reference spectra should be included for comparison to rule out nanoparticle aggregation or oxidation? | To verify the atomic dispersion of Fe in the Fe-N-Gr sample, Fe foil and Fe2O3 should be included as reference spectra. The sample is designed to contain iron single atoms anchored in a hollow nitrogen-doped graphene framework. Because the synthesis could potentially result in aggregated metallic nanoparticles or oxidized iron clusters, Fe foil and Fe2O3 serve as essential baselines for identifying Fe-Fe and Fe-O scattering paths. Comparing the sample to these references confirms the isolated single-atom structure, as the Fe-N-Gr catalyst exhibits a 1.0 fraction of Fe-N4 moieties and lacks the high-shell peaks characteristic of bulk metallic or oxidized iron. | The answer must list metallic Fe (e.g., Fe foil) to rule out Fe-Fe clustering, and an iron oxide (e.g., Fe2O3) to rule out Fe-O formation. |
| q3 | spectral | 50 | What specific features in the extended X-ray absorption fine structure (EXAFS) would distinguish this Fe-N-Gr single-atom catalyst from bulk iron or iron oxide? | The distinguishing features in the FT-EXAFS spectrum of this catalyst are a dominant Fe-N scattering peak and the complete absence of Fe-Fe or Fe-O high-shell peaks. The sample consists of iron single atoms anchored in a hollow nitrogen-doped graphene framework. Because the iron atoms are atomically dispersed and coordinated exclusively by nitrogen within the graphene lattice, EXAFS fitting yields an average metal-N coordination number of approximately 4.1. This specific structural configuration produces the prominent Fe-N peak and confirms an isolated Fe-N4 structure, while the lack of higher-shell scattering paths proves the iron has not aggregated into bulk metallic nanoparticles or iron oxide. | The answer must state the absence of Fe-Fe or high-shell peaks (which would indicate bulk metal or oxide) and the presence of a dominant Fe-N scattering peak. |
Review
#773
Ni-N-C
Ni K-edge
▶
LLM Prompt
Sample Information
Material: Ni-N-C
Support: N-doped graphene
Sample-Specific Conditions
- Metal center: Ni
- Nickel single atoms anchored in hollow nitrogen-doped graphene framework
Measurement
We plan to measure the Ni K-edge XANES spectrum of this sample.
Questions
Based on all the information above:
1. Based on the synthesis method involving template transformation from a Ni-doped ZnO solid solution, what is the dominant local coordination environment of the Ni atoms in the resulting Ni-N-C material, and what is the physical reasoning for this assignment?
2. What reference spectra are necessary to compare against the Ni-N-Gr sample to confirm atomic dispersion and rule out metallic clustering or standard oxide formation?
Ground Truth
Material: Ni-N-Gr
Measurement: Ni K-edge X-ray absorption fine structure (EXAFS) at Advanced Photon Source (9-BM)
Fit method: EXAFS fitting
Phase fractions: (±10%)
| Phase | Fraction |
|---|---|
| Ni-N4 | 1.0 |
Fit basis (paper's reference spectra):
- Ni foil
- NiO
Source evidence: Page 6 text and Figure 4c4
Key reasoning: FT-EXAFS spectra showed atomically dispersed metal atoms in M-N-Grs. The average coordination number of metal-N in Ni-N-Gr was fitted to be 3.8. Because the coordination number was close to 4.0, Ni-N-Gr possessed an M-N4 structure and the same atomic configuration with Co-N-Gr.
Reasoning source: Page 6, RESULTS AND DISCUSSION
Scoring Rubric (total: 100 pts)
| Q | Type | Max | Question | Reference Answer | Scoring Criteria |
|---|---|---|---|---|---|
| q1 | reasoning | 57 | Based on the synthesis method involving template transformation from a Ni-doped ZnO solid solution, what is the dominant local coordination environment of the Ni atoms in the resulting Ni-N-C material, and what is the physical reasoning for this assignment? | The dominant local coordination environment of the Ni atoms in the resulting Ni-N-C material is a Ni-N4 structure, representing 100% of the fitted fraction. This specific configuration arises because the sample is synthesized to contain nickel single atoms anchored within a hollow nitrogen-doped graphene framework. FT-EXAFS spectra confirm that these metal atoms are atomically dispersed within the support rather than forming clusters. Specifically, EXAFS fitting reveals an average metal-N coordination number of 3.8. Because this coordination number is close to 4.0, it demonstrates that the atomically dispersed Ni-N-Gr possesses a pure M-N4 atomic configuration. | Must identify Ni-N4 as the dominant structure and explain that EXAFS fitting shows atomically dispersed metal atoms with an average Ni-N coordination number of 3.8 (close to 4.0). |
| q2 | identification | 43 | What reference spectra are necessary to compare against the Ni-N-Gr sample to confirm atomic dispersion and rule out metallic clustering or standard oxide formation? | To confirm atomic dispersion and rule out metallic clustering or standard oxide formation, the necessary reference spectra for comparison are Ni foil and NiO. These specific references are chosen because the sample conditions dictate that nickel should exist as single atoms anchored in a hollow nitrogen-doped graphene framework, rather than as bulk metal or oxide phases. Comparing the sample's spectra against Ni foil ensures there is no metallic Ni-Ni clustering, while comparison against NiO rules out the presence of standard nickel oxides. By using these bases in EXAFS fitting, it is confirmed that the metal atoms are purely atomically dispersed, yielding an average Ni-N coordination number of 3.8 that corresponds to a pure Ni-N4 structure. | Must identify Ni foil (to rule out Ni-Ni clustering) and NiO (as a standard oxide reference). |
Review
#774
Cu-N-C
Cu K-edge
▶
LLM Prompt
Sample Information
Material: Cu-N-C
Support: N-doped graphene
Sample-Specific Conditions
- Metal center: Cu
- Copper single atoms anchored in hollow nitrogen-doped graphene framework
Measurement
We plan to measure the Cu K-edge XANES spectrum of this sample.
Questions
Based on all the information above:
1. Based on the synthesis method and sample conditions, what is the expected dominant structural motif for the Cu species, and what specific coordination environments are likely present?
2. What physical reasoning explains why the average Cu-N coordination number in this specific catalyst might deviate from a perfect Cu-N4 square planar geometry?
3. What reference spectra would be necessary to analyze the XAFS data to confirm the atomic dispersion and local coordination of Cu in this sample?
Ground Truth
Material: Cu-N-Gr
Measurement: Cu K-edge XAFS at Advanced Photon Source (9-BM)
Fit method: EXAFS fitting (XANES LCF not reported)
Phase fractions: (±15%)
| Phase | Fraction |
|---|---|
| Cu-Nx (mixture of Cu-N4, Cu-N3, Cu-N2) | 1.0 |
Fit basis (paper's reference spectra):
- Cu foil
- CuO
Source evidence: Page 6 text and Figure 4d4
Key reasoning: The catalyst features atomically dispersed Cu atoms anchored in the nitrogen-doped graphene framework. EXAFS fitting yields an average Cu-N coordination number of 3.1. This low coordination number is attributed to a complex atomic structure that includes not only the main Cu-N4 sites but also partial Cu-N3 and Cu-N2 structures.
Reasoning source: Page 7, RESULTS AND DISCUSSION
Scoring Rubric (total: 100 pts)
| Q | Type | Max | Question | Reference Answer | Scoring Criteria |
|---|---|---|---|---|---|
| q1 | identification | 35 | Based on the synthesis method and sample conditions, what is the expected dominant structural motif for the Cu species, and what specific coordination environments are likely present? | The expected dominant structural motif is a 100% fraction of Cu-Nx sites, specifically comprising a mixture of Cu-N4, Cu-N3, and Cu-N2 structures. These specific coordination environments arise because the copper single atoms are anchored within a hollow nitrogen-doped graphene framework. The complex atomic structure of this specific support matrix prevents uniform coordination, leading to an average Cu-N coordination number of 3.1. Consequently, while Cu-N4 sites are the main component, the structural constraints of the N-doped graphene necessitate the formation of partial Cu-N3 and Cu-N2 structures to stabilize the isolated Cu atoms. | Full points if the answer identifies atomically dispersed Cu-Nx sites and specifically mentions a mixture of Cu-N4, Cu-N3, and Cu-N2 structures. |
| q2 | reasoning | 35 | What physical reasoning explains why the average Cu-N coordination number in this specific catalyst might deviate from a perfect Cu-N4 square planar geometry? | The deviation from a perfect Cu-N4 geometry occurs because the catalyst features a complex atomic structure within its hollow nitrogen-doped graphene framework. As copper single atoms are anchored into this specific support, they do not form a uniform coordination environment. Instead, the structural constraints of the N-doped graphene matrix result in the formation of partial Cu-N3 and Cu-N2 structures alongside the main Cu-N4 sites. This mixture of different coordination environments physically explains why EXAFS fitting yields a lower average Cu-N coordination number of 3.1. | Full points if the answer explains that the complex atomic structure of the Cu-N-Gr catalyst leads to an average coordination number lower than 4 (specifically ~3.1), indicating the partial formation of lower-coordination Cu-N3 and Cu-N2 moieties alongside the main Cu-N4 sites. |
| q3 | identification | 30 | What reference spectra would be necessary to analyze the XAFS data to confirm the atomic dispersion and local coordination of Cu in this sample? | To analyze the XAFS data, Cu foil and CuO reference spectra are necessary as the fitting basis. These references are required to contrast the sample's spectra against standard metallic Cu-Cu and oxidized Cu-O bulk environments. Because the sample conditions specify copper single atoms anchored in a hollow nitrogen-doped graphene framework, comparing the data against Cu foil and CuO confirms the absence of bulk metallic or oxide clusters. This comparison proves that the Cu is entirely atomically dispersed as Cu-Nx sites (a mixture of Cu-N4, Cu-N3, and Cu-N2) with an average coordination number of 3.1. | Full points if the answer includes metallic Cu (e.g., Cu foil) to rule out metal clustering/nanoparticles, and a Cu oxide (e.g., CuO) to compare oxidation states and scattering paths. |
Review
Atomically Dispersed Iridium on Indium Tin Oxide Efficiently Catalyzes Water Oxidation
APS
Catalyst
Dmitry Lebedev et al.
DOI: 10.1021/acscentsci.0c00604
3 scenarios
▶
#775
IrSAC-ITO
Ir L3
▶
LLM Prompt
Sample Information
Material: IrSAC-ITO
Support: ITO
Reaction Conditions: ex-situ
Sample-Specific Conditions
- state: pristine
- Pristine atomically dispersed Ir on ITO
Measurement
We plan to measure the Ir L3 XANES spectrum of this sample.
Questions
Based on all the information above:
1. Based on the sample conditions, what is the expected oxidation state of the Ir species in the pristine IrSAC-ITO sample, and what reasoning justifies this assignment?
2. What is the expected Ir L3 edge energy (defined as the maximum of the white line) for this pristine sample, and how does it distinguish the sample from Ir(IV) species?
3. What reference material spectrum is necessary to establish the relative oxidation state of this sample by comparing edge energies, as mentioned in the study?
Ground Truth
Material: IrSAC-ITO
Measurement: Ir L3-edge ex-situ fluorescence mode at Advanced Photon Source (APS)
Fit method: edge energy analysis
Phase fractions: (±10%)
| Phase | Fraction |
|---|---|
| Ir(III) | 1.0 |
Fit basis (paper's reference spectra):
- IrO2
Source evidence: Page 4, text; Page 6, text
Key reasoning: The XANES spectrum of pristine IrSAC-ITO yields an Ir L3 edge energy (defined as the maximum of the white line) of 11218 eV. This edge energy is consistent with an Ir(III) oxidation state, which is further corroborated by XPS measurements showing an Ir 4f 7/2 binding energy of 61.9 eV.
Reasoning source: Page 4, 'Generation and Characterization of Isolated Ir Sites'
Scoring Rubric (total: 100 pts)
| Q | Type | Max | Question | Reference Answer | Scoring Criteria |
|---|---|---|---|---|---|
| q1 | reasoning | 35 | Based on the sample conditions, what is the expected oxidation state of the Ir species in the pristine IrSAC-ITO sample, and what reasoning justifies this assignment? | The expected oxidation state of the Ir species in the pristine IrSAC-ITO sample is Ir(III), which accounts for a fraction of 1.0. Because the sample consists of pristine, atomically dispersed Ir on an ITO support measured under ex-situ conditions, the isolated Ir sites stabilize entirely in this +3 oxidation state. This assignment is justified by the Ir L3 edge energy (defined as the maximum of the white line) occurring at 11218 eV, which is characteristic of Ir(III). Additionally, this XANES-derived oxidation state is corroborated by XPS measurements showing an Ir 4f 7/2 binding energy of 61.9 eV. | Full points for identifying Ir(III) and mentioning that the edge energy (or XPS binding energy) is consistent with this state. |
| q2 | spectral | 35 | What is the expected Ir L3 edge energy (defined as the maximum of the white line) for this pristine sample, and how does it distinguish the sample from Ir(IV) species? | The expected Ir L3 edge energy for this sample, defined as the maximum of the prominent white line, is 11218 eV. Because the sample contains pristine, atomically dispersed Ir on ITO measured under ex-situ conditions, the specific electronic structure of these isolated sites yields this exact edge position. This 11218 eV edge energy is characteristic of an Ir(III) oxidation state. Consequently, it distinguishes the pristine Ir(III) single atoms from higher oxidation states like Ir(IV) (such as those found in IrO2), which would exhibit an edge energy shifted to higher values. | Full points for stating the edge energy is 11218 eV and that it is lower than the edge energy of Ir(IV) species. |
| q3 | identification | 30 | What reference material spectrum is necessary to establish the relative oxidation state of this sample by comparing edge energies, as mentioned in the study? | The necessary reference material spectrum to establish the relative oxidation state of this sample is IrO2. Because the sample consists of pristine, atomically dispersed Ir on ITO, its edge energy must be compared against a known standard to accurately determine its electronic state. IrO2 serves as the fit basis and reference for the Ir(IV) oxidation state. By comparing the sample's Ir L3 edge energy (11218 eV) to this IrO2 reference, it demonstrates that the pristine sample's edge appears at a lower energy, confirming the isolated Ir sites are stabilized as Ir(III) under these ex-situ conditions. | Full points for identifying IrO2 as the reference for Ir(IV). |
Review
#776
IrSAC-ITO
Ir L3
▶
LLM Prompt
Sample Information
Material: IrSAC-ITO
Support: ITO
Reaction Conditions: 0.1 M HClO4
Sample-Specific Conditions
- applied potential: 1.06 V vs RHE
- IrSAC-ITO under applied potential of 1.06 V vs RHE
Measurement
We plan to measure the Ir L3 XANES spectrum of this sample.
Questions
Based on all the information above:
1. Based on the applied potential of 1.06 V vs RHE, what is the expected dominant oxidation state of the isolated Ir sites, and what is the physical reasoning for this state?
2. Describe the expected spectral shape and the position of the edge energy (defined as the white line maximum) for this sample at 1.06 V vs RHE. What distinguishes this spectrum from the pristine Ir(III) state?
3. What reference spectrum would be appropriate to use as a benchmark for assigning the oxidation state of this sample?
Ground Truth
Material: IrSAC-ITO
Measurement: in situ Ir LIII-edge XANES in fluorescence mode
Fit method: Oxidation state assignment based on edge energy shifts compared to reference materials
Phase fractions: (±10%)
| Phase | Fraction |
|---|---|
| Ir(IV) | 1.0 |
Fit basis (paper's reference spectra):
- IrO2 (IrIV reference)
Source evidence: Figure 3 and text on page 1194
Key reasoning: In situ XANES spectra show an increase of the edge energy with applied potential. Based on the reference IrO2 (IrIV), the oxidation state of Ir at potentials between 0.9 and 1.35 V vs RHE (which includes 1.06 V) is assigned to IrIV. This corroborates the assignment from electrochemical studies showing an IrIV/III redox wave at 0.89 V vs RHE.
Reasoning source: Results and Discussion, In Situ XAS section, page 1194
Scoring Rubric (total: 100 pts)
| Q | Type | Max | Question | Reference Answer | Scoring Criteria |
|---|---|---|---|---|---|
| q1 | reasoning | 35 | Based on the applied potential of 1.06 V vs RHE, what is the expected dominant oxidation state of the isolated Ir sites, and what is the physical reasoning for this state? | The expected dominant oxidation state of the isolated Ir sites is Ir(IV), representing a fraction of 1.0. This oxidation state arises because the applied potential of 1.06 V vs RHE in 0.1 M HClO4 falls within the 0.9 to 1.35 V vs RHE window where the Ir(IV) species is stable. Specifically, electrochemical studies demonstrate an Ir(IV)/Ir(III) redox wave at 0.89 V vs RHE, meaning that at 1.06 V, the Ir sites have been fully oxidized from their pristine Ir(III) state. Consequently, the in situ XANES spectra exhibit an increase in edge energy that corroborates this complete transition to Ir(IV). | Award full points if the answer identifies Ir(IV) as the dominant state and explains that it forms due to oxidation of the Ir(III) resting state past the IrIV/III redox wave (observed at ~0.89 V vs RHE). |
| q2 | spectral | 35 | Describe the expected spectral shape and the position of the edge energy (defined as the white line maximum) for this sample at 1.06 V vs RHE. What distinguishes this spectrum from the pristine Ir(III) state? | The XANES spectrum features a prominent white line peak at the Ir L3-edge with a normalized absorption intensity of ~3.2. The edge energy, defined as the maximum of this white line, is located at ~11218.5 eV. These spectral features emerge because the applied potential of 1.06 V vs RHE oxidizes the sample past the Ir(IV)/Ir(III) redox wave at 0.89 V vs RHE, forming an Ir(IV) single-atom species. This distinguishes the spectrum from the pristine Ir(III) resting state by shifting the edge energy higher (from 11218.0 eV to ~11218.5 eV) and slightly increasing the white line intensity, though the energy remains lower than that of the Ir(V) state formed at potentials above 1.35 V vs RHE. | Award full points if the answer mentions a prominent white line peak, notes that the edge energy shifts to a higher value (~11218.5 eV) compared to the pristine Ir(III) state, and mentions the slightly higher white line intensity. |
| q3 | identification | 30 | What reference spectrum would be appropriate to use as a benchmark for assigning the oxidation state of this sample? | The appropriate reference spectrum to use as a benchmark for this sample is IrO2, which serves as a standard Ir(IV) reference. This specific reference is required because the IrSAC-ITO sample is subjected to an applied potential of 1.06 V vs RHE in 0.1 M HClO4, which exceeds the Ir(IV)/Ir(III) redox wave observed at 0.89 V vs RHE. Because the applied potential drives the complete oxidation of the isolated Ir sites to Ir(IV), IrO2 provides the necessary baseline for comparing edge energy shifts. By matching the sample's edge energy to this IrO2 reference, the oxidation state of the sample at potentials between 0.9 and 1.35 V vs RHE can be confidently assigned to Ir(IV). | Award full points if the answer identifies IrO2 as the appropriate Ir(IV) reference. |
Review
#777
IrSAC-ITO
Ir L3
▶
LLM Prompt
Sample Information
Material: IrSAC-ITO
Support: ITO
Reaction Conditions: 0.1 M HClO4
Sample-Specific Conditions
- applied potential: 1.46 V vs RHE
- IrSAC-ITO under applied potential of 1.46 V vs RHE
Measurement
We plan to measure the Ir L3 XANES spectrum of this sample.
Questions
Based on all the information above:
1. What is the expected dominant Ir oxidation state and the specific structural motif for the IrSAC-ITO catalyst under an applied potential of 1.46 V vs RHE during the oxygen evolution reaction (OER)?
2. Explain the physical reasoning for the formation of this specific Ir species at 1.46 V vs RHE, and how it relates to the catalyst's overall reaction cycle.
3. Describe the expected spectral features of the in situ Ir L3-edge XANES for this sample, specifically focusing on the edge position compared to Ir(III) and Ir(IV) references.
Ground Truth
Material: IrSAC-ITO
Measurement: in situ Ir L3-edge XANES, fluorescence mode, Advanced Photon Source (APS)
Fit method: Edge energy shift analysis
Phase fractions: (±10%)
| Phase | Fraction |
|---|---|
| Ir(V) | 1.0 |
Fit basis (paper's reference spectra):
- IrO2 (IrIV reference)
- pristine IrSAC-ITO (IrIII reference)
Source evidence: Figure 3 and page 6 text
Key reasoning: In situ XANES spectra show an increase in edge energy with applied potential. Above 1.35 V vs RHE, the edge energy reaches ~11219.0 eV, which is assigned to Ir(V) based on comparison with IrO2 (IrIV) and pristine IrSAC-ITO (IrIII). EXAFS fitting and DFT calculations identify this state as an IrV=O intermediate, which acts as the predominant resting state of the catalyst under OER conditions.
Reasoning source: Page 6, 'In Situ XAS' section
Scoring Rubric (total: 100 pts)
| Q | Type | Max | Question | Reference Answer | Scoring Criteria |
|---|---|---|---|---|---|
| q1 | identification | 30 | What is the expected dominant Ir oxidation state and the specific structural motif for the IrSAC-ITO catalyst under an applied potential of 1.46 V vs RHE during the oxygen evolution reaction (OER)? | The expected dominant Ir oxidation state is Ir(V) with a fraction of 1.0, and the specific structural motif is an IrV=O intermediate on the ITO support. This specific phase arises because the sample is subjected to a high applied potential of 1.46 V vs RHE in 0.1 M HClO4. Under these OER conditions, which exceed the 1.35 V vs RHE threshold, the catalyst undergoes oxidation to form the IrV=O intermediate. This intermediate acts as the predominant resting state of the catalyst during the reaction, resulting in a 100% fraction of Ir(V). | 15 points for identifying the Ir(V) oxidation state. 15 points for identifying the IrV=O structural motif/intermediate. |
| q2 | reasoning | 30 | Explain the physical reasoning for the formation of this specific Ir species at 1.46 V vs RHE, and how it relates to the catalyst's overall reaction cycle. | At an applied potential of 1.46 V vs RHE in 0.1 M HClO4, the IrSAC-ITO catalyst is driven to a highly oxidized state. As the applied potential increases above 1.35 V vs RHE, the pristine Ir(III) species oxidizes, forming an IrV=O intermediate. According to EXAFS fitting and DFT calculations, this IrV=O species acts as the predominant resting state of the catalyst under these specific OER conditions. Consequently, at 1.46 V vs RHE, the catalyst exists entirely as this Ir(V) intermediate, representing a 1.0 fraction of the species present during the reaction cycle. | 15 points for mentioning it forms at high applied potentials (above 1.35 V vs RHE) under OER conditions. 15 points for noting it acts as the predominant species or resting state of the catalyst. |
| q3 | spectral | 40 | Describe the expected spectral features of the in situ Ir L3-edge XANES for this sample, specifically focusing on the edge position compared to Ir(III) and Ir(IV) references. | The in situ Ir L3-edge XANES spectrum will exhibit a strong white line with an intensity of ~3.2 and an edge position shifted to ~11219.0 eV. These spectral features arise because the applied potential of 1.46 V vs RHE in 0.1 M HClO4 fully oxidizes the catalyst to an IrV=O intermediate. Because the oxidation state increases to Ir(V), the edge energy shifts to a higher energy (~11219.0 eV) compared to the pristine IrSAC-ITO (IrIII reference) and IrO2 (IrIV reference). This distinct shift to higher energy directly reflects the formation of the +5 oxidation state, which is the predominant resting state under these OER conditions. | 20 points for stating the edge energy is approximately 11219.0 eV. 20 points for explaining it is shifted to higher energy compared to Ir(III) (e.g., pristine catalyst) and Ir(IV) references (e.g., IrO2). |
Review
Molecular Fates of Organometallic Mercury in Human Brain
APS
Environmental
Ashley K. James et al.
DOI: 10.1021/acschemneuro.2c00166
2 scenarios
▶
#778
brain tissue
Hg L3-edge
▶
LLM Prompt
Sample Information
Material: brain tissue
Sample Origin: Republic of Seychelles
Sample-Specific Conditions
- Exposure type: Chronic low-level (fish consumption)
- Human brain tissue from Seychellois with chronic low-level mercury exposure from fish consumption
Measurement
We plan to measure the Hg L3-edge XANES spectrum of this sample.
Questions
Based on all the information above:
1. Based on the sample conditions (human brain tissue, chronic low-level exposure from fish consumption), what is the dominant mercury phase expected in this sample?
2. The key variable for this sample is identified as the 'Exposure type' (chronic low-level from fish consumption). Explain how this specific exposure type dictates the expected mercury speciation in the brain tissue.
3. If you were to perform Linear Combination Fitting (LCF) on the Hg L3-edge XANES spectrum of this sample, what key reference spectrum is essential to include in your basis set to capture the speciation?
Ground Truth
Material: brain tissue
Measurement: Hg L3-edge XANES
Fit method: not reported
Phase fractions: (±10%)
| Phase | Fraction |
|---|---|
| methylmercury-L-cysteineate | 1.0 |
Fit basis (paper's reference spectra):
- methylmercury-L-cysteineate
Source evidence: Sample description and phase fractions data for Samples A and B
Key reasoning: The sample consists of human brain tissue from Seychellois individuals subjected to chronic low-level mercury exposure through fish consumption. Under these specific dietary exposure conditions, the mercury speciation is completely dominated by methylmercury-L-cysteineate (100%). The key variable dictating this speciation is the exposure type, where chronic low-level intake results in the accumulation and preservation of the intact methylmercury-thiolate complex in the brain.
Reasoning source: Sample context and key variable description
Scoring Rubric (total: 100 pts)
| Q | Type | Max | Question | Reference Answer | Scoring Criteria |
|---|---|---|---|---|---|
| q1 | identification | 30 | Based on the sample conditions (human brain tissue, chronic low-level exposure from fish consumption), what is the dominant mercury phase expected in this sample? | The dominant mercury phase expected in this sample is methylmercury-L-cysteineate, which accounts for 100% of the speciation. This specific phase arises directly from the sample conditions of chronic low-level mercury exposure through fish consumption in the Seychellois population. Under this dietary exposure type, the intact methylmercury-thiolate complex accumulates and is preserved within the human brain tissue. Therefore, no other mercury phases are expected to form or accumulate under these specific low-level intake conditions. | Full credit for identifying methylmercury-L-cysteineate (or a structurally equivalent methylmercury-thiolate complex) as the sole or completely dominant phase. |
| q2 | reasoning | 40 | The key variable for this sample is identified as the 'Exposure type' (chronic low-level from fish consumption). Explain how this specific exposure type dictates the expected mercury speciation in the brain tissue. | The specific exposure type of chronic low-level mercury intake from fish consumption dictates that the mercury speciation is completely dominated by methylmercury-L-cysteineate (100%). This dietary exposure condition is the key variable because it allows for the accumulation and preservation of the intact methylmercury-thiolate complex within the human brain tissue. Unlike other exposure scenarios, this chronic low-level intake does not lead to the breakdown or transformation of the complex into other inorganic mercury phases. Consequently, the resulting Hg L3-edge XANES spectrum will exclusively reflect this single preserved phase. | Full credit for explaining that chronic low-level dietary exposure from fish results in the mercury remaining entirely (100%) as an intact methylmercury-L-cysteineate complex in the brain, without significant conversion to other inorganic phases. |
| q3 | identification | 30 | If you were to perform Linear Combination Fitting (LCF) on the Hg L3-edge XANES spectrum of this sample, what key reference spectrum is essential to include in your basis set to capture the speciation? | If performing Linear Combination Fitting on the Hg L3-edge XANES spectrum, it is essential to include the methylmercury-L-cysteineate reference spectrum in your basis set. This is required because the sample conditions of chronic low-level mercury exposure from fish consumption result in a speciation that is 100% methylmercury-L-cysteineate. This specific dietary exposure type causes the intact methylmercury-thiolate complex to accumulate and be preserved within the human brain tissue without degrading. As a result, this single reference is sufficient and necessary to fully capture the mercury speciation in the sample. | Full credit for naming methylmercury-L-cysteineate as the essential reference spectrum. |
Review
#779
brain tissue
Hg L3-edge
▶
LLM Prompt
Sample Information
Material: brain tissue
Sample Origin: Dartmouth College
Sample-Specific Conditions
- Exposure type: Short-term high-level (dimethylmercury)
- Human brain tissue from researcher with short-term high-level exposure to dimethylmercury
Measurement
We plan to measure the Hg L3-edge XANES spectrum of this sample.
Questions
Based on all the information above:
1. Given the sample conditions (short-term high-level exposure to dimethylmercury), predict the expected fraction of intact dimethylmercury in the brain tissue and identify the dominant mercury phase that is actually observed.
2. Explain the physical/biochemical reasoning for the observed phase composition in the brain tissue, given that the initial exposure was exclusively to dimethylmercury.
3. What candidate reference spectra must be included in the Linear Combination Fitting (LCF) basis set to properly evaluate the metabolic transformation of mercury in this specific sample?
Ground Truth
Material: human brain tissue
Measurement: Hg L3-edge XANES
Fit method: LCF
Phase fractions: (±10%)
| Phase | Fraction |
|---|---|
| dimethylmercury | 0.0 |
| inorganic Hg (HgSe/HgS) | 1.0 |
Fit basis (paper's reference spectra):
- dimethylmercury
- HgSe
- Hg(SR)2
- MeHgCys
Source evidence: Text and Figures discussing Samples E and F (Dartmouth researcher)
Key reasoning: Despite the exposure being exclusively to dimethylmercury, the XANES spectra of the brain tissue showed no evidence of intact dimethylmercury (fraction = 0.0). Instead, the spectra closely matched inorganic mercury reference compounds, specifically indicating coordination to selenium and sulfur (resembling HgSe). This demonstrates that dimethylmercury undergoes complete demethylation in vivo, accumulating in the brain as an inorganic Hg-Se/S complex.
Reasoning source: Results and Discussion section
Scoring Rubric (total: 100 pts)
| Q | Type | Max | Question | Reference Answer | Scoring Criteria |
|---|---|---|---|---|---|
| q1 | prediction | 30 | Given the sample conditions (short-term high-level exposure to dimethylmercury), predict the expected fraction of intact dimethylmercury in the brain tissue and identify the dominant mercury phase that is actually observed. | The expected fraction of intact dimethylmercury in the brain tissue is 0.0, while the dominant observed phase is inorganic mercury (HgSe/HgS) at a fraction of 1.0. These specific fractions result from the metabolic processing of the short-term high-level exposure to dimethylmercury. Despite the initial exposure being exclusively to this organic compound, it undergoes complete demethylation in vivo. Consequently, the mercury coordinates to selenium and sulfur, accumulating entirely as an inorganic Hg-Se/S complex in the brain tissue. | Award full points for stating that intact dimethylmercury is 0% (absent) and that the dominant phase is inorganic mercury (specifically HgSe or Hg-Se/S complexes). |
| q2 | reasoning | 40 | Explain the physical/biochemical reasoning for the observed phase composition in the brain tissue, given that the initial exposure was exclusively to dimethylmercury. | The observed phase composition in the human brain tissue is 100% inorganic mercury (resembling HgSe) and 0% intact dimethylmercury. This composition arises because the short-term high-level exposure to dimethylmercury is subjected to complete demethylation in vivo. During this biochemical transformation, the mercury loses its methyl groups and coordinates with available selenium and sulfur in the brain. Ultimately, this mechanism explains why the initial organic exposure accumulates exclusively as an inorganic Hg-Se/S complex. | Award full points for explaining that dimethylmercury undergoes complete in vivo demethylation, leading to the accumulation of inorganic mercury coordinated to selenium/sulfur in the brain. |
| q3 | identification | 30 | What candidate reference spectra must be included in the Linear Combination Fitting (LCF) basis set to properly evaluate the metabolic transformation of mercury in this specific sample? | To properly evaluate this sample, the LCF basis set must include dimethylmercury, HgSe, Hg(SR)2, and MeHgCys. These specific references are necessary to track the metabolic fate of the short-term high-level exposure to dimethylmercury in the human brain tissue. Because the organic dimethylmercury undergoes complete demethylation in vivo, the basis set must contain both the initial organic exposure compound and potential inorganic metabolic products. This allows the fitting to accurately capture the complete transformation of the mercury into an inorganic Hg-Se/S complex. | Award full points for listing the exposure compound (dimethylmercury) to prove its absence, along with relevant metabolic products such as inorganic Hg-Se (HgSe) and Hg-S (Hg(SR)2) references. |
Review
Mechanocatalytic Ammonia Synthesis over TiN in Transient Microenvironments
BNL-NSLS-II-8-ID
Catalyst
Andrew W. Tricker et al.
DOI: 10.1021/acsenergylett.0c01895
1 scenario
▶
#780
TiN
Ti K
▶
LLM Prompt
Sample Information
Material: TiN
Sample-Specific Conditions
- Milling atmosphere and time: N2, 4.5 h
- Titanium powder after mechanochemical milling in nitrogen gas
Measurement
We plan to measure the Ti K XANES spectrum of this sample.
Questions
Based on all the information above:
1. Based on the mechanochemical milling of Ti powder in N2 for 4.5 h, what phase is expected to dominate the sample, and what is the physical reasoning for this transformation?
2. What are the distinguishing spectral features of this milled sample at the Ti K-edge compared to unreacted Ti metal?
3. To verify the complete conversion of the Ti powder using XANES, what candidate reference spectra should be used for comparison or fitting?
Ground Truth
Material: TiN
Measurement: Ti K-edge XANES, beamline 8-ID ISS at NSLS-II
Fit method: not reported
Phase fractions: (±10%)
| Phase | Fraction |
|---|---|
| TiN | 1.0 |
Fit basis (paper's reference spectra):
- Ti foil
- unmilled TiN
Source evidence: Page 4, Figure 1b
Key reasoning: The XANES spectrum of Ti milled in N2 was dominated by characteristic features of TiN. The Ti pre-edge peak (4965 eV) disappeared; the white line intensity (4895 eV) increased, and the edge shifted by 3.6 eV to a higher energy. The overall XANES line shape is consistent with TiN, confirming the near quantitative in situ conversion of Ti to stoichiometric TiN.
Reasoning source: Page 4, 'In Situ Synthesis of Titanium Nitride' section
Scoring Rubric (total: 100 pts)
| Q | Type | Max | Question | Reference Answer | Scoring Criteria |
|---|---|---|---|---|---|
| q1 | reasoning | 30 | Based on the mechanochemical milling of Ti powder in N2 for 4.5 h, what phase is expected to dominate the sample, and what is the physical reasoning for this transformation? | Based on the mechanochemical milling of Ti powder in N2 for 4.5 h, the sample is expected to be dominated entirely by stoichiometric TiN (fraction of 1.0). This transformation occurs because the mechanical energy from milling the titanium powder in a reactive nitrogen gas atmosphere drives a near quantitative in situ conversion of the metal. The continuous milling facilitates the reaction between the Ti powder and N2 gas, resulting in complete nitridation. Consequently, the final product consists of 100% TiN, with no unreacted Ti remaining. | Full points for identifying TiN as the dominant phase (fraction ~1.0) and explaining that milling in N2 leads to near quantitative in situ conversion of Ti to stoichiometric TiN. |
| q2 | spectral | 40 | What are the distinguishing spectral features of this milled sample at the Ti K-edge compared to unreacted Ti metal? | Compared to unreacted Ti metal, the Ti K-edge XANES spectrum of the milled sample exhibits the disappearance of the pre-edge peak at 4965 eV and an increase in the white line intensity at 4895 eV. Additionally, the absorption edge shifts by 3.6 eV to a higher energy. These spectral features arise because the mechanochemical milling of Ti powder in N2 gas for 4.5 hours drives a near quantitative in situ conversion of the metal to stoichiometric TiN. The resulting spectrum's overall line shape perfectly matches reference unmilled TiN, reflecting the complete structural and electronic transformation from metallic titanium to titanium nitride. | Full points for mentioning the disappearance of the 4965 eV pre-edge peak, the increase in white line intensity (at 4895 eV as reported in the text), and a 3.6 eV shift of the edge to higher energy. |
| q3 | identification | 30 | To verify the complete conversion of the Ti powder using XANES, what candidate reference spectra should be used for comparison or fitting? | To verify the complete conversion of the sample, the candidate reference spectra used for fitting should be Ti foil and unmilled TiN. These specific references are chosen based on the sample conditions, where titanium powder was mechanochemically milled in an N2 gas atmosphere for 4.5 hours. The Ti foil serves as a reference for any unreacted starting material, while the unmilled TiN represents the expected fully nitrided product. Using this fit basis confirms that the milling process resulted in a near quantitative in situ conversion, yielding a final phase fraction of 1.0 for stoichiometric TiN. | Full points for including Ti foil (or metallic Ti) to check for unreacted starting material and a TiN reference to confirm the product phase. |
Review
Atomically Ordered PdCu Electrocatalysts for Selective and Stable Electrochemical Nitrate Reduction
BNL-NSLS-II-8-ID
Catalyst
Jeonghoon Lim et al.
DOI: 10.1021/acsenergylett.3c01672
4 scenarios
▶
#781
PdCu
Pd K-edge
▶
LLM Prompt
Sample Information
Material: PdCu
Support: Carbon
Sample-Specific Conditions
- Catalyst structure: Ordered (O1)
- Atomically ordered PdCu alloy nanoparticles on carbon support, pristine state
Measurement
We plan to measure the Pd K-edge XANES spectrum of this sample.
Questions
Based on all the information above:
1. Based on the sample conditions (pristine ordered PdCu alloy nanoparticles on carbon), what is the expected dominant phase and oxidation state of palladium?
2. Describe the expected spectral shape of the Pd K-edge XANES for this pristine O1-PdCu/C sample. What distinguishing features would confirm its state compared to oxidized palladium?
3. What reference spectra should be included in the fit basis to verify the oxidation state of Pd in this sample?
Ground Truth
Material: PdCu/C
Measurement: Pd K-edge ex-situ XAS at NSLS-II beamline 8-ID
Fit method: Qualitative comparison
Phase fractions: (±10%)
| Phase | Fraction |
|---|---|
| metallic_palladium | 1.0 |
Fit basis (paper's reference spectra):
- Pd foil
- PdO
Source evidence: Figure 3b and page 4750
Key reasoning: The ex situ Pd K-edge XANES spectrum for the pristine O1-PdCu/C catalyst closely resembles the Pd foil reference, indicating that Pd is in a fully reduced metallic state. The spectrum lacks the strong white line characteristic of oxidized species like PdO.
Reasoning source: Page 4750, left column
Scoring Rubric (total: 100 pts)
| Q | Type | Max | Question | Reference Answer | Scoring Criteria |
|---|---|---|---|---|---|
| q1 | prediction | 30 | Based on the sample conditions (pristine ordered PdCu alloy nanoparticles on carbon), what is the expected dominant phase and oxidation state of palladium? | The expected dominant phase is metallic palladium within the PdCu alloy, representing a fraction of 1.0, with an oxidation state of 0. This occurs because the sample consists of pristine, atomically ordered (O1) PdCu alloy nanoparticles on a carbon support, where the palladium atoms are fully incorporated into the metallic alloy lattice. In this pristine alloyed state, the palladium remains fully reduced and resists oxidation. Consequently, the XANES analysis confirms a purely metallic state that closely resembles a Pd foil reference. | Full points for identifying metallic palladium (Pd0) as the dominant phase. |
| q2 | spectral | 40 | Describe the expected spectral shape of the Pd K-edge XANES for this pristine O1-PdCu/C sample. What distinguishing features would confirm its state compared to oxidized palladium? | The expected spectral shape for the pristine O1-PdCu/C sample is characteristic of metallic palladium, closely matching a Pd foil reference. The primary distinguishing feature is the complete absence of a sharp, significant white line peak. Because the sample consists of pristine, atomically ordered PdCu alloy nanoparticles, the palladium exists in a fully reduced metallic state (oxidation state 0). This metallic electronic environment lacks the electron depletion found in oxidized species, which is why the strong white line intensity characteristic of oxides like PdO is not observed. | Full points for stating the spectrum will closely match metallic Pd foil and noting the absence of a strong white line peak that would be present in oxidized species like PdO. |
| q3 | identification | 30 | What reference spectra should be included in the fit basis to verify the oxidation state of Pd in this sample? | The fit basis should include Pd foil and PdO reference spectra to verify the oxidation state of the sample. Because the sample consists of pristine, atomically ordered PdCu alloy nanoparticles on carbon, the palladium is expected to be in a fully reduced metallic state (oxidation state 0). Including the Pd foil reference provides the baseline for this metallic alloy structure, while the PdO reference serves as a necessary contrast to check for oxidized species. By comparing these references, one can confirm the absence of a strong white line peak, proving that the pristine alloy conditions maintain the palladium in a purely metallic state. | Full points for mentioning Pd foil (metallic Pd) and PdO (or other oxidized Pd references) to confirm the fully reduced state. |
Review
#782
PdCu
Cu K-edge
▶
LLM Prompt
Sample Information
Material: PdCu
Support: Carbon
Sample-Specific Conditions
- Catalyst structure: Ordered (O1)
- Atomically ordered PdCu alloy nanoparticles on carbon support, pristine state
Measurement
We plan to measure the Cu K-edge XANES spectrum of this sample.
Questions
Based on all the information above:
1. Based on the sample conditions, what is the dominant copper phase and oxidation state expected for the pristine ordered O1-PdCu/C catalyst?
2. What reference spectra should be included in the basis set to properly evaluate the Cu oxidation state of this catalyst?
3. Explain the physical reasoning for why the ordered O1-PdCu/C catalyst exhibits this specific oxidation state and stability compared to a disordered PdCu catalyst.
4. How is the Cu K-edge XANES spectrum of the ordered O1-PdCu/C catalyst expected to change after long-term NO3RR electrolysis, and what distinguishes its behavior from the disordered D-PdCu/C catalyst?
Ground Truth
Material: PdCu
Measurement: Cu K-edge ex-situ XANES at NSLS-II beamline 8-ID
Fit method: Qualitative comparison to reference spectra
Phase fractions: (±15%)
| Phase | Fraction |
|---|---|
| Cu2O | 1.0 |
Fit basis (paper's reference spectra):
- CuO
- Cu2O
- Cu foil
Source evidence: Figure 3e and Page 4750
Key reasoning: The pristine O1-PdCu/C catalyst exhibits a Cu K-edge XANES spectrum consistent with Cu2O. The ordered intermetallic structure provides superior interactions between Cu and Pd sites, stabilizing the Cu2O state and preventing further oxidation to CuO, which is observed in the disordered D-PdCu/C catalyst.
Reasoning source: Page 4750, left column
Scoring Rubric (total: 100 pts)
| Q | Type | Max | Question | Reference Answer | Scoring Criteria |
|---|---|---|---|---|---|
| q1 | identification | 20 | Based on the sample conditions, what is the dominant copper phase and oxidation state expected for the pristine ordered O1-PdCu/C catalyst? | For the pristine ordered O1-PdCu/C catalyst, the dominant copper phase is Cu2O, corresponding to a +1 oxidation state with a fraction of 1.0. This specific phase arises because the sample consists of atomically ordered PdCu alloy nanoparticles on a carbon support. The ordered intermetallic structure facilitates superior interactions between the Cu and Pd sites. These strong bimetallic interactions stabilize the Cu2O state and prevent further oxidation to CuO, which would otherwise occur in a disordered structure. | Full points for identifying Cu2O (cuprite) and a +1 oxidation state. |
| q2 | identification | 20 | What reference spectra should be included in the basis set to properly evaluate the Cu oxidation state of this catalyst? | To properly evaluate the Cu oxidation state of this catalyst, the basis set should include CuO, Cu2O, and Cu foil reference spectra. These references are required because they cover the full range of potential oxidation states for the copper species in the sample. Specifically, the Cu2O reference is needed to identify the stabilized +1 state that arises from the superior interactions between Cu and Pd sites in the ordered O1-PdCu/C structure. Furthermore, the CuO reference is essential to verify the absence of further oxidation, which the ordered intermetallic structure successfully prevents. | Full points for mentioning CuO, Cu2O, and Cu foil as the necessary reference spectra. |
| q3 | reasoning | 30 | Explain the physical reasoning for why the ordered O1-PdCu/C catalyst exhibits this specific oxidation state and stability compared to a disordered PdCu catalyst. | The ordered O1-PdCu/C catalyst exhibits a stable Cu2O (+1) oxidation state due to its atomically ordered intermetallic structure. This specific structural arrangement provides superior interactions between the adjacent Cu and Pd sites within the carbon-supported nanoparticles. Because of these enhanced bimetallic interactions, the Cu2O state is highly stabilized. Consequently, this stabilization prevents the copper from undergoing further oxidation to CuO, a process that readily occurs in the disordered D-PdCu/C catalyst where such optimal site interactions are lacking. | Full points for explaining that the ordered intermetallic structure provides superior interactions between Cu and Pd sites, stabilizing the Cu2O state and preventing further oxidation to CuO (which occurs in the disordered catalyst). |
| q4 | prediction | 30 | How is the Cu K-edge XANES spectrum of the ordered O1-PdCu/C catalyst expected to change after long-term NO3RR electrolysis, and what distinguishes its behavior from the disordered D-PdCu/C catalyst? | The Cu K-edge XANES spectrum of the ordered O1-PdCu/C catalyst is expected to remain unaltered after long-term electrolysis, continuing to closely resemble the Cu2O reference spectrum. This spectral stability occurs because the atomically ordered intermetallic structure of the carbon-supported PdCu nanoparticles provides superior interactions between the Cu and Pd sites. These strong interactions firmly stabilize the Cu2O state under reaction conditions. This distinguishes its behavior from the disordered D-PdCu/C catalyst, which lacks these stabilizing interactions and consequently shows a significant spectral shift to higher Cu oxidation states (CuO) after electrolysis. | Full points for stating that the spectrum of O1-PdCu/C remains unaltered (stable Cu2O state), distinguishing it from D-PdCu/C which shows a significant shift to higher oxidation states (CuO) after electrolysis. |
Review
#783
PdCu
Cu K-edge
▶
LLM Prompt
Sample Information
Material: PdCu
Support: Carbon
Sample-Specific Conditions
- Catalyst state: After long-term test
- Disordered PdCu alloy nanoparticles on carbon support, after long-term NO3RR electrolysis
Measurement
We plan to measure the Cu K-edge XANES spectrum of this sample.
Questions
Based on all the information above:
1. What phase dominates the Cu K-edge XANES spectrum of the disordered PdCu/C catalyst after long-term NO3RR electrolysis, and what physical mechanism drives the formation of this phase?
2. Based on the structural evolution of the disordered PdCu/C catalyst during long-term testing, what reference spectra would be necessary to model its Cu K-edge XANES data?
3. How does the final oxidation state of Cu in the disordered PdCu/C catalyst after long-term testing distinguish it from the ordered O1-PdCu/C catalyst under the same conditions?
Ground Truth
Material: PdCu
Measurement: Cu K-edge ex situ XAS at 8-ID Inner Shell Spectroscopy beamline of NSLS-II
Fit method: Visual comparison to reference spectra
Phase fractions: (±10%)
| Phase | Fraction |
|---|---|
| CuO | 1.0 |
Fit basis (paper's reference spectra):
- CuO
- Cu2O
- Cu foil
Source evidence: Figure 3e and text on page 5
Key reasoning: The ex situ Cu K-edge XANES spectrum of D-PdCu/C after long-term electrolysis shows a significant change compared to the pristine catalyst, closely matching the CuO reference spectrum. Physically, in the disordered D-PdCu/C catalyst, Cu clusters are poorly coordinated with hydrogenated Pd sites. During long-term NO3RR electrolysis, these Cu sites provide electrons to reduce NO3- and become more oxidized to CuO, leading to severe dissolution of the copper.
Reasoning source: Page 4 and Page 5
Scoring Rubric (total: 100 pts)
| Q | Type | Max | Question | Reference Answer | Scoring Criteria |
|---|---|---|---|---|---|
| q1 | reasoning | 40 | What phase dominates the Cu K-edge XANES spectrum of the disordered PdCu/C catalyst after long-term NO3RR electrolysis, and what physical mechanism drives the formation of this phase? | The Cu K-edge XANES spectrum of the disordered PdCu/C catalyst after long-term NO3RR electrolysis is entirely dominated by the CuO phase, with a fitted fraction of 1.0. This complete oxidation occurs because, in the disordered state, the Cu clusters are poorly coordinated with hydrogenated Pd sites. During the long-term electrolysis conditions, these poorly coordinated Cu sites provide electrons to reduce NO3- ions. As a result, the copper becomes highly oxidized to CuO, a process that ultimately leads to severe dissolution of copper from the catalyst. | Identify CuO as the dominant phase (10 pts). Explain that in the disordered structure, Cu clusters are poorly coordinated with hydrogenated Pd sites (15 pts), causing them to become highly oxidized (to CuO) when providing electrons to reduce NO3- (15 pts). |
| q2 | identification | 30 | Based on the structural evolution of the disordered PdCu/C catalyst during long-term testing, what reference spectra would be necessary to model its Cu K-edge XANES data? | To model the Cu K-edge XANES data of the disordered PdCu/C catalyst, reference spectra for CuO, Cu2O, and Cu foil are necessary. These references are required to track the severe oxidation of the catalyst that occurs during long-term NO3RR electrolysis. In this disordered sample, Cu clusters are poorly coordinated with hydrogenated Pd sites, causing them to provide electrons for NO3- reduction. This mechanism drives the complete oxidation of the copper to a higher oxidation state, resulting in a final spectrum that perfectly matches the CuO reference (1.0 fraction) due to the oxidation and subsequent copper dissolution. | Mention CuO (15 pts) to represent the oxidized post-test state, and other relevant references like Cu foil or Cu2O (15 pts) to capture the pristine or intermediate states. |
| q3 | reasoning | 30 | How does the final oxidation state of Cu in the disordered PdCu/C catalyst after long-term testing distinguish it from the ordered O1-PdCu/C catalyst under the same conditions? | After long-term NO3RR electrolysis, the disordered PdCu/C catalyst exhibits a higher Cu oxidation state, specifically Cu(II) as CuO, which distinguishes it from the ordered O1-PdCu/C catalyst that does not oxidize to CuO. This distinct final state is driven by the disordered structure of the catalyst, where Cu clusters are poorly coordinated with hydrogenated Pd sites. Under the long-term electrolysis conditions, these poorly coordinated Cu sites provide electrons to reduce NO3- and become fully oxidized. Consequently, the disordered catalyst undergoes severe copper dissolution and its spectrum closely matches the CuO reference, unlike its ordered counterpart. | State that the disordered catalyst oxidizes to CuO (15 pts), whereas the ordered catalyst maintains a lower oxidation state or stable structure due to better coordination between Cu and Pd sites (15 pts). |
Review
#784
PdCu
Cu K-edge
▶
LLM Prompt
Sample Information
Material: PdCu
Support: Carbon
Reaction Conditions: 0.05 M Na2SO4 with/without NO3-, applied potential -0.1 to -0.7 VRHE
Sample-Specific Conditions
- Measurement mode: in-situ
- Atomically ordered PdCu alloy nanoparticles on carbon support, during NO3RR
Measurement
We plan to measure the Cu K-edge XANES spectrum of this sample.
Questions
Based on all the information above:
1. What phase dominates the Cu K-edge XANES spectrum of the atomically ordered O1-PdCu/C catalyst under in-situ NO3RR conditions at negative applied potentials (-0.1 to -0.7 VRHE), and what is the physical reasoning for this state?
2. What reference spectra are necessary to evaluate the oxidation state changes of this PdCu catalyst during in-situ XANES measurements?
3. How does the spectral shape of the O1-PdCu/C catalyst change when applying negative potentials (-0.1 to -0.7 VRHE) compared to its initial oxidized state, and what does this indicate about the Cu sites?
Ground Truth
Material: PdCu
Measurement: Cu K-edge in-situ XANES at 8-ID Inner Shell Spectroscopy beamline of NSLS-II
Fit method: Qualitative comparison to reference spectra
Phase fractions: (±10%)
| Phase | Fraction |
|---|---|
| metallic_copper | 1.0 |
Fit basis (paper's reference spectra):
- Cu foil
- Cu2O
- CuO
Source evidence: Figure 3d and page 4750 text
Key reasoning: Using negative potentials from 0.1 to -0.7 VRHE, the XANES spectra showed a trend for CuOx reduction to metallic Cu regardless of catalysts or the existence of NO3-. This finding concluded that the applied negative reduction potentials are more dominant than the oxidation of the Cu sites, as they provide electrons to reduce NO3-.
Reasoning source: Page 4750, left column
Scoring Rubric (total: 100 pts)
| Q | Type | Max | Question | Reference Answer | Scoring Criteria |
|---|---|---|---|---|---|
| q1 | reasoning | 40 | What phase dominates the Cu K-edge XANES spectrum of the atomically ordered O1-PdCu/C catalyst under in-situ NO3RR conditions at negative applied potentials (-0.1 to -0.7 VRHE), and what is the physical reasoning for this state? | Under in-situ NO3RR conditions at negative applied potentials (-0.1 to -0.7 VRHE), the Cu K-edge XANES spectrum is completely dominated by metallic Cu, with a phase fraction of 1.0. This occurs because the applied negative reduction potentials provide a strong driving force that reduces any initial CuOx species. These negative potentials are more dominant than the oxidizing nature of the NO3- reduction reaction at the Cu sites. By providing ample electrons to reduce NO3-, the applied potential ensures the Cu sites remain fully reduced to metallic Cu (oxidation state 0), regardless of the presence or absence of NO3- in the 0.05 M Na2SO4 electrolyte. | Award 20 points for identifying metallic copper (Cu0) as the dominant phase. Award 20 points for explaining that the applied negative reduction potentials are more dominant than the oxidation of Cu sites by NO3-, driving the reduction of any CuOx to metallic Cu. |
| q2 | identification | 30 | What reference spectra are necessary to evaluate the oxidation state changes of this PdCu catalyst during in-situ XANES measurements? | To evaluate the oxidation state changes of the PdCu/C catalyst during in-situ XANES measurements, reference spectra for Cu foil, Cu2O, and CuO are necessary. These specific references are required because the catalyst undergoes a transition from an oxidized state (CuOx) to a fully reduced state under the reaction conditions. When negative potentials (-0.1 to -0.7 VRHE) are applied in the 0.05 M Na2SO4 electrolyte, they provide electrons that dominate over the oxidizing nature of NO3-. Consequently, the Cu2O and CuO references help identify the initial oxidized species, while the Cu foil reference confirms the complete reduction to metallic Cu driven by the applied negative potential. | Award 10 points each for identifying Cu foil (metallic Cu), Cu2O (Cu+), and CuO (Cu2+) as the necessary reference spectra. |
| q3 | spectral | 30 | How does the spectral shape of the O1-PdCu/C catalyst change when applying negative potentials (-0.1 to -0.7 VRHE) compared to its initial oxidized state, and what does this indicate about the Cu sites? | When applying negative potentials (-0.1 to -0.7 VRHE), the XANES spectral shape of the PdCu/C catalyst changes to match the spectrum of Cu foil, losing all higher oxidation state features present in the initial state. This spectral evolution indicates that the Cu sites undergo a complete reduction to metallic Cu (oxidation state 0). This structural and electronic transformation occurs because the applied negative potentials in the 0.05 M Na2SO4 electrolyte provide abundant electrons for NO3- reduction. These reducing conditions are far more dominant than the oxidizing nature of the NO3- species, forcing the complete reduction of CuOx to metallic Cu regardless of whether NO3- is present in the solution. | Award 15 points for stating the spectral shape shifts to match metallic Cu (Cu foil). Award 15 points for indicating that this shows the complete reduction of CuOx species due to the dominant applied negative potential. |
Review
Formal Oxidation States and Coordination Environments in the Catalytic Reduction of CO to Methanol
BNL-NSLS-II-8-ID
Catalyst
Irene Barba-Nieto et al.
DOI: 10.1021/acsenergylett.4c01269
3 scenarios
▶
#785
[Ru(bpy)2(CO)(CH2OH)]+
O K-edge
▶
LLM Prompt
Sample Information
Material: [Ru(bpy)2(CO)(CH2OH)]+
Reaction Conditions: 10 Torr H2, RT
Sample-Specific Conditions
- temperature: RT
- Solid hydroxymethyl complex exposed to H2 at room temperature
Measurement
We plan to measure the O K-edge XANES spectrum of this sample.
Questions
Based on all the information above:
1. What is the expected dominant phase of this sample at room temperature under 10 Torr H2, and why is it stable under these conditions rather than converting to the hydride product?
2. Describe the expected key spectral features in the O K-edge XANES spectrum for this complex at room temperature. Specifically, identify the features associated with its distinct oxygen-containing ligands.
Ground Truth
Material: [Ru(bpy)2(CO)(CH2OH)]+
Measurement: O K-edge in-situ XANES
Fit method: Not reported
Phase fractions:
| Phase | Fraction |
|---|---|
| [Ru(bpy)2(CO)(CH2OH)]+ | 1.0 |
Source evidence: Figure 1b (bottom panel) and page 4 text
Key reasoning: At room temperature under 10 Torr H2, the solid hydroxymethyl complex [Ru(bpy)2(CO)(CH2OH)]+ remains stable and does not undergo immediate hydrogenation. The strong bond between Ru and the CH2OH ligand prevents conversion at RT, requiring heating to 150 °C for complete transformation to the hydride complex.
Reasoning source: Page 4, paragraph 2
Scoring Rubric (total: 100 pts)
| Q | Type | Max | Question | Reference Answer | Scoring Criteria |
|---|---|---|---|---|---|
| q1 | reasoning | 43 | What is the expected dominant phase of this sample at room temperature under 10 Torr H2, and why is it stable under these conditions rather than converting to the hydride product? | Under 10 Torr H2 at room temperature, the expected dominant phase is the intact solid hydroxymethyl complex, [Ru(bpy)2(CO)(CH2OH)]+, comprising 100% of the sample. This phase remains stable and does not undergo immediate hydrogenation because the strong bond between the Ru metal center and the CH2OH ligand prevents conversion under these mild conditions. Consequently, the sample cannot transform into the final hydride complex at room temperature, a process that would instead require heating to 150 °C. | Full credit for identifying [Ru(bpy)2(CO)(CH2OH)]+ as the dominant phase and explaining that the strong Ru-CH2OH bond prevents hydrogenation at room temperature, requiring higher temperatures for conversion. |
| q2 | spectral | 57 | Describe the expected key spectral features in the O K-edge XANES spectrum for this complex at room temperature. Specifically, identify the features associated with its distinct oxygen-containing ligands. | The O K-edge XANES spectrum of this sample is expected to exhibit two main features corresponding to its distinct oxygen-containing ligands. Specifically, there will be a sharp, highly intense peak around 534 eV originating from the CO ligand, and a broader, less intense peak around 539 eV originating from the CH2OH ligand. These specific features arise because the sample conditions (room temperature under 10 Torr H2) preserve the intact [Ru(bpy)2(CO)(CH2OH)]+ complex, preventing its conversion to the hydride product. The presence of the ~539 eV feature is a direct structural consequence of the retained CH2OH ligand, distinguishing this stable intermediate from the final [Ru(bpy)2(CO)(H)]+ product which lacks this specific oxygen-containing group. | Full credit for describing a sharp, intense peak around 534 eV assigned to the CO ligand and a broader, less intense peak around 539 eV assigned to the CH2OH ligand. |
Review
#786
[Ru(bpy)2(CO)(CH2OH)]+
O K-edge
▶
LLM Prompt
Sample Information
Material: [Ru(bpy)2(CO)(CH2OH)]+
Reaction Conditions: 10 Torr H2, 150 °C
Sample-Specific Conditions
- temperature: 150 °C
- Solid hydroxymethyl complex exposed to H2 and heated to 150 °C
Measurement
We plan to measure the O K-edge XANES spectrum of this sample.
Questions
Based on all the information above:
1. What is the expected dominant phase when the solid [Ru(bpy)2(CO)(CH2OH)]+ complex is exposed to 10 Torr H2 and heated to 150 °C?
2. Based on the physical properties of the starting complex, explain why a relatively high temperature (150 °C) is required to achieve complete conversion under these conditions.
3. Describe the expected O K-edge XANES spectral shape for this sample at 150 °C and explain how it distinguishes the product from the starting [Ru(bpy)2(CO)(CH2OH)]+ material.
Ground Truth
Material: [Ru(bpy)2(CO)(CH2OH)]+ exposed to H2 at 150 °C
Measurement: O K-edge in-situ XANES
Fit method: visual comparison of spectra
Phase fractions:
| Phase | Fraction |
|---|---|
| [Ru(bpy)2(CO)(H)]+ | 1.0 |
Fit basis (paper's reference spectra):
- [Ru(bpy)2(CO)(H)]+ RT reference spectrum
Source evidence: Figure 1b (bottom panel) and page 4 text
Key reasoning: By 150 °C, the CH2OH group is fully hydrogenated, and the transformation into [Ru(bpy)2(CO)(H)]+ is complete, presumably with the release of methanol. The relatively high temperature required for this complete conversion is consistent with a strong bond between the Ru center and the CH2OH ligand.
Reasoning source: Page 4, Figure 1 caption and main text
Scoring Rubric (total: 100 pts)
| Q | Type | Max | Question | Reference Answer | Scoring Criteria |
|---|---|---|---|---|---|
| q1 | identification | 30 | What is the expected dominant phase when the solid [Ru(bpy)2(CO)(CH2OH)]+ complex is exposed to 10 Torr H2 and heated to 150 °C? | The expected dominant phase is [Ru(bpy)2(CO)(H)]+, which accounts for 100% (fraction of 1.0) of the sample. This phase arises because exposing the solid [Ru(bpy)2(CO)(CH2OH)]+ complex to 10 Torr H2 and heating it to 150 °C causes the CH2OH group to become fully hydrogenated. The relatively high temperature of 150 °C provides the energy needed to break the strong bond between the Ru center and the CH2OH ligand. Consequently, the starting material undergoes a complete transformation into the hydride complex, presumably releasing methanol in the process. | Full credit for identifying [Ru(bpy)2(CO)(H)]+ as the sole or dominant phase. |
| q2 | reasoning | 35 | Based on the physical properties of the starting complex, explain why a relatively high temperature (150 °C) is required to achieve complete conversion under these conditions. | A relatively high temperature of 150 °C is required to achieve complete conversion because of the strong bond between the Ru center and the CH2OH ligand in the starting [Ru(bpy)2(CO)(CH2OH)]+ complex. When the solid material is exposed to 10 Torr H2, this strong bond resists cleavage at lower temperatures. Heating the sample to 150 °C provides sufficient thermal energy to break the Ru-CH2OH bond and fully hydrogenate the ligand. This allows the complete transformation into the [Ru(bpy)2(CO)(H)]+ phase, presumably accompanied by the release of methanol. | Full credit for mentioning the strong bond between the Ru metal center and the CH2OH ligand, which necessitates higher thermal energy for hydrogenation and methanol release. |
| q3 | spectral | 35 | Describe the expected O K-edge XANES spectral shape for this sample at 150 °C and explain how it distinguishes the product from the starting [Ru(bpy)2(CO)(CH2OH)]+ material. | The expected O K-edge XANES spectrum for the sample at 150 °C is dominated by a single, sharp, and intense peak at approximately 534 eV corresponding to the carbonyl (-CO) ligand. This spectral shape occurs because heating the sample to 150 °C in 10 Torr H2 provides enough energy to break the strong Ru-CH2OH bond, fully hydrogenating the complex into [Ru(bpy)2(CO)(H)]+. As a result of this complete conversion and the presumed release of methanol, the spectrum completely lacks the broader feature around 538-545 eV that is characteristic of the -CH2OH ligand. The disappearance of this 538-545 eV feature leaves only the sharp -CO peak, clearly distinguishing the final hydride product from the starting material. | Full credit for noting the presence of a sharp peak at ~534 eV (assigned to the -CO ligand) AND the disappearance/absence of the broader feature around 538-545 eV (assigned to the -CH2OH ligand). |
Review
#787
[Ru(bpy)2(CO)2]2+
Ru L3-edge
▶
LLM Prompt
Sample Information
Material: [Ru(bpy)2(CO)2]2+
Sample-Specific Conditions
- complex type: resting state
- Resting state complex
Measurement
We plan to measure the Ru L3-edge XANES spectrum of this sample.
Questions
Based on all the information above:
1. What is the expected main edge energy for the [Ru(bpy)2(CO)2]2+ resting state complex at the Ru L3-edge, and what does this position indicate about its formal oxidation state?
2. What specific spectral feature (or lack thereof) in the Ru L3-edge XANES spectrum can be used to confirm that this complex does not contain any Ru(III) character?
3. Describe the expected intensity of the main edge feature for this complex and identify the electronic transition it corresponds to at the Ru L3-edge.
Ground Truth
Material: [Ru(bpy)2(CO)2]2+
Measurement: Ru L3-edge XANES, ex-situ (NSLS-II)
Fit method: not applicable (pure reference spectrum)
Phase fractions:
| Phase | Fraction |
|---|---|
| Ru(II) resting state | 1.0 |
Fit basis (paper's reference spectra):
- [Ru(bpy)2(CO)2]2+
Source evidence: Figure 1b (top panel) and Page 2, paragraph 4
Key reasoning: The complex is a stable resting state with a formal oxidation state of Ru(II). The Ru L3-edge spectrum shows a main edge energy at ~2842 eV, which supports the Ru(II) assignment. Furthermore, there are no absorption features near 2838 eV, confirming the absence of Ru(III) species.
Reasoning source: Page 2, paragraph 4
Scoring Rubric (total: 100 pts)
| Q | Type | Max | Question | Reference Answer | Scoring Criteria |
|---|---|---|---|---|---|
| q1 | spectral | 35 | What is the expected main edge energy for the [Ru(bpy)2(CO)2]2+ resting state complex at the Ru L3-edge, and what does this position indicate about its formal oxidation state? | The expected main edge energy for the [Ru(bpy)2(CO)2]2+ complex at the Ru L3-edge is located at ~2842 eV. This specific edge position strongly indicates that the complex has a formal oxidation state of Ru(II). Because the sample is prepared as a stable resting state complex, it exists as a pure Ru(II) species with a fraction of 1.0. The electronic structure inherent to this stable Ru(II) resting state dictates the energy required for core electron excitation, directly producing the characteristic main edge position at ~2842 eV. | Full credit if the answer identifies the main edge energy at ~2842 eV and states that this supports a Ru(II) formal oxidation state. |
| q2 | reasoning | 35 | What specific spectral feature (or lack thereof) in the Ru L3-edge XANES spectrum can be used to confirm that this complex does not contain any Ru(III) character? | The complete absence of any absorption features near 2838 eV in the Ru L3-edge XANES spectrum confirms that the complex does not contain any Ru(III) character. This occurs because the sample is prepared as a stable [Ru(bpy)2(CO)2]2+ resting state complex, which exists entirely as a pure Ru(II) species. Due to this stable Ru(II) configuration, the complex lacks the specific electronic vacancies that would allow lower-energy transitions typical of more oxidized species. Therefore, the strict lack of features in the ~2838 eV marker region directly reflects the pure Ru(II) nature of the resting state conditions. | Full credit if the answer points out the absence of absorption features near 2838 eV, which is where Ru(III) complexes are known to absorb. |
| q3 | spectral | 30 | Describe the expected intensity of the main edge feature for this complex and identify the electronic transition it corresponds to at the Ru L3-edge. | The main edge feature (white line) for this complex is expected to exhibit a strong intensity at ~2842 eV. This strong absorption peak corresponds to the 2p → 4d electronic transition at the Ru L3-edge. Because the sample is a stable [Ru(bpy)2(CO)2]2+ resting state complex, it exists purely in the Ru(II) oxidation state. This specific Ru(II) electronic configuration provides the necessary unoccupied 4d states, directly resulting in the strong probability and high intensity of the 2p → 4d transition observed in the spectrum. | Full credit if the answer describes the main edge feature as 'strong' and identifies the transition as 2p → 4d. |
Review
In situ Visualization of State-of-Charge Heterogeneity within a LiCoO2 Particle that Evolves upon Cycling at Different Rates
BNL-NSLS-II-8-ID
Electrochemistry
Yahong Xu et al.
DOI: 10.1021/acsenergylett.7b00263
7 scenarios
▶
#788
LiCoO2
Co K
▶
LLM Prompt
Sample Information
Material: LiCoO2
Electrode Type: cathode
Electrolyte: 1 M LiPF6 in EC:DMC (1:1 vol)
Cell Type: in-situ pouch cell
Charge Discharge: OCV
State Of Charge: pristine
Sample-Specific Conditions
- cycling state: pristine
- Pristine state before cycling
Measurement
We plan to measure the Co K XANES spectrum of this sample.
Questions
Based on all the information above:
1. What phase and oxidation state dominate the Co K-edge XANES spectrum of the pristine LiCoO2 particle before any cycling, and why?
2. To track the phase evolution of this particle during subsequent charge/discharge cycles using linear combination fitting (LCF), what specific reference spectra should be used as the basis?
Ground Truth
Material: LiCoO2
Measurement: in-situ transmission X-ray microscopy (TXM) spectro-microscopy at Co K-edge
Fit method: linear combination fitting
Phase fractions:
| Phase | Fraction |
|---|---|
| Discharged state (LiCo3+O2) | 1.0 |
Fit basis (paper's reference spectra):
- ex-situ electrode powder recovered at the discharged state (at 3V)
- ex-situ electrode powder recovered at the charged state (at 4.6V)
Source evidence: Figure 2.a and page 4 text
Key reasoning: At the pristine state before any electrochemical cycling, nearly the entire particle exists in the discharged state (LiCo3+O2). No delithiation has occurred yet to form the charged state phase.
Reasoning source: Page 4, paragraph 3
Scoring Rubric (total: 100 pts)
| Q | Type | Max | Question | Reference Answer | Scoring Criteria |
|---|---|---|---|---|---|
| q1 | reasoning | 50 | What phase and oxidation state dominate the Co K-edge XANES spectrum of the pristine LiCoO2 particle before any cycling, and why? | The Co K-edge XANES spectrum of the pristine LiCoO2 particle is entirely dominated by the discharged state phase (LiCo3+O2) with an oxidation state of Co3+, representing a fraction of 1.0. This occurs because the sample is in a pristine state at open circuit voltage (OCV) before any electrochemical cycling has taken place. Since no delithiation has occurred yet, the charged state phase cannot form, leaving nearly the entire particle in its initial, fully lithiated state. Consequently, the spectrum exhibits the typical signature of LixCoO2 with a prominent white line peak characteristic of this layered oxide. | Full points for identifying the discharged state (LiCo3+O2) with Co3+ oxidation state, and reasoning that no delithiation has occurred yet in the pristine state. |
| q2 | identification | 50 | To track the phase evolution of this particle during subsequent charge/discharge cycles using linear combination fitting (LCF), what specific reference spectra should be used as the basis? | To track the phase evolution using linear combination fitting (LCF), the basis should consist of reference spectra from ex-situ electrode powder recovered at the discharged state (at 3V) and ex-situ electrode powder recovered at the charged state (at 4.6V). These specific references are required because the pristine in-situ pouch cell initially exists entirely in the discharged state (LiCo3+O2) prior to any electrochemical cycling. As the cell is subsequently cycled, the material will undergo delithiation and relithiation, transitioning between these two structural end-members. Using the 3V and 4.6V ex-situ references provides the exact spectral bounds needed to accurately quantify the phase fractions as the charged state phase forms. | Full points for specifying ex-situ electrode powder recovered at the discharged state (3V) and the charged state (4.6V). |
Review
#789
LiCoO2
Co K
▶
LLM Prompt
Sample Information
Material: LiCoO2
Electrode Type: cathode
Electrolyte: 1 M LiPF6 in EC:DMC (1:1 vol)
Cell Type: in-situ pouch cell
Charge Discharge: charged
C Rate: 1C
Voltage V: 4.6
State Of Charge: fully charged
Cycle Number: 1
Sample-Specific Conditions
- voltage: 4.6V
- Particle charged to 4.6V at 1C rate
Measurement
We plan to measure the Co K XANES spectrum of this sample.
Questions
Based on all the information above:
1. Based on the provided conditions (LiCoO2 particle charged to 4.6V at a 1C rate), estimate the phase fractions of the fully charged state and the remaining discharged state within the particle.
2. What candidate reference spectra should be used as the basis for linear combination fitting (LCF) of the Co K-edge XANES data to quantify the state-of-charge heterogeneity in this sample?
3. Explain the physical origin of the observed phase heterogeneity (i.e., why a portion of the particle remains in the discharged state) when the LiCoO2 particle is charged to 4.6V at a relatively high rate of 1C.
Ground Truth
Material: LiCoO2
Measurement: Co K-edge in-situ transmission X-ray microscopy (TXM)
Fit method: Linear combination fitting (LCF)
Phase fractions:
| Phase | Fraction |
|---|---|
| Charged state (at 4.6V) | 0.82 |
| Discharged state (at 3V) | 0.18 |
Fit basis (paper's reference spectra):
- ex-situ LiCoO2 powder recovered at the discharged state (3V)
- ex-situ LiCoO2 powder recovered at the charged state (4.6V)
Source evidence: Figure 2.b and corresponding pie chart, page 4
Key reasoning: When the cell is charged to 4.6V at a rate of 1C, the majority of the particle (82%) transitions to the charged state, but a noticeable fraction (18%) remains in the discharged state. This reaction heterogeneity at high charging voltage is attributed to the nucleation process of the delithiated phase, which is influenced by defects within the particle. Because this is a non-equilibrium process, the extent of heterogeneity is highly dependent on the cycling rate.
Reasoning source: Page 4, text discussing Figure 2
Scoring Rubric (total: 100 pts)
| Q | Type | Max | Question | Reference Answer | Scoring Criteria |
|---|---|---|---|---|---|
| q1 | quantification | 35 | Based on the provided conditions (LiCoO2 particle charged to 4.6V at a 1C rate), estimate the phase fractions of the fully charged state and the remaining discharged state within the particle. | The estimated phase fractions for the LiCoO2 particle are 82% for the charged state (at 4.6V) and 18% for the discharged state (at 3V). These specific values result from the sample being charged to a high voltage of 4.6V at a relatively fast 1C rate, which successfully drives the majority of the particle to the delithiated state. However, because this high-rate charging is a non-equilibrium process, reaction heterogeneity occurs throughout the material. The 18% unreacted discharged fraction remains because the nucleation process of the delithiated phase is influenced by defects within the particle, preventing complete conversion at this cycling rate. | Full points if the estimated fractions are approximately 80-85% for the charged state and 15-20% for the discharged state. Deduct points for estimates outside this range. |
| q2 | identification | 30 | What candidate reference spectra should be used as the basis for linear combination fitting (LCF) of the Co K-edge XANES data to quantify the state-of-charge heterogeneity in this sample? | The candidate reference spectra for the linear combination fitting (LCF) should be ex-situ LiCoO2 powder recovered at the discharged state (3V) and ex-situ LiCoO2 powder recovered at the charged state (4.6V). These specific references are required because the sample is a LiCoO2 cathode that has been charged to 4.6V at a 1C rate, which induces a mixture of states. Under these high-rate charging conditions, the particle undergoes a non-equilibrium delithiation process where defect-driven nucleation limitations cause reaction heterogeneity. Therefore, using the fully charged (4.6V) and fully discharged (3V) reference spectra is necessary to accurately capture and quantify the 82% delithiated phase and the 18% unreacted regions remaining in the particle. | Full points if the answer identifies the need for reference spectra of fully charged LiCoO2 (e.g., at 4.6V) and fully discharged LiCoO2 (e.g., at 3V). |
| q3 | reasoning | 35 | Explain the physical origin of the observed phase heterogeneity (i.e., why a portion of the particle remains in the discharged state) when the LiCoO2 particle is charged to 4.6V at a relatively high rate of 1C. | The observed phase heterogeneity in the LiCoO2 particle originates from the non-equilibrium nature of charging at a relatively high 1C rate to 4.6V. Under these specific conditions, the transition to the fully charged state is governed by the nucleation process of the delithiated phase. This nucleation is heavily influenced by defects present within the particle, which can hinder uniform reaction across the material. Because the extent of this heterogeneity is highly dependent on the cycling rate, the fast 1C charge prevents the system from reaching equilibrium, ultimately leaving an 18% fraction of the particle trapped in the discharged state. | Full points if the explanation mentions that the heterogeneity is a rate-dependent, non-equilibrium effect driven by the nucleation process of the delithiated phase, which can be affected by particle defects. |
Review
#790
LiCoO2
Co K
▶
LLM Prompt
Sample Information
Material: LiCoO2
Electrode Type: cathode
Electrolyte: 1 M LiPF6 in EC:DMC (1:1 vol)
Cell Type: in-situ pouch cell
Charge Discharge: discharged
C Rate: 1C
Voltage V: 3.0
State Of Charge: discharged
Cycle Number: 1
Sample-Specific Conditions
- C-rate: 1C
- Particle discharged to 3V at 1C rate
Measurement
We plan to measure the Co K XANES spectrum of this sample.
Questions
Based on all the information above:
1. Based on the provided conditions (discharged to 3V at a 1C rate), estimate the phase fractions of the charged and discharged states within the LiCoO2 particle.
2. What physical states or reference materials should be used as basis spectra to model the phase composition of this cycled cathode particle using linear combination fitting?
3. Explain the physical reasoning for why the particle exhibits this specific mixed-phase composition when discharged at a 1C rate, rather than fully returning to the discharged state.
Ground Truth
Material: LiCoO2
Measurement: Co K-edge in-situ transmission X-ray microscopy (TXM) XANES
Fit method: linear combination fitting
Phase fractions:
| Phase | Fraction |
|---|---|
| Charged state (at 4.6V) | 0.5 |
| Discharged state (at 3V) | 0.5 |
Fit basis (paper's reference spectra):
- ex-situ electrode powder recovered at the discharged state (at 3V)
- ex-situ electrode powder recovered at the charged state (at 4.6V)
Source evidence: Figure 2.c and Page 4 text
Key reasoning: The reaction heterogeneity of LiCoO2 is highly rate-dependent, likely due to a non-equilibrium nucleation process (formation of the delithiated phase) that is affected by defects in the particle. When discharged at a relatively fast rate of 1C to 3V, the particle exhibits a low recovery rate. Consequently, only about 50% of the particle recovers to the discharged state, leaving the remaining 50% trapped in the charged state.
Reasoning source: Page 4, paragraph 3
Scoring Rubric (total: 100 pts)
| Q | Type | Max | Question | Reference Answer | Scoring Criteria |
|---|---|---|---|---|---|
| q1 | quantification | 30 | Based on the provided conditions (discharged to 3V at a 1C rate), estimate the phase fractions of the charged and discharged states within the LiCoO2 particle. | The phase fractions for this LiCoO2 particle are estimated to be 50% for the charged state (at 4.6V) and 50% for the discharged state (at 3V). These specific values result from the relatively fast 1C discharge rate applied to the cell down to 3.0V. At this fast rate, the reaction heterogeneity is highly rate-dependent due to a non-equilibrium nucleation process that is affected by particle defects. Consequently, the particle exhibits a low recovery rate, meaning only half of the material successfully returns to the discharged state while the remaining 50% becomes trapped in the charged state. | Full credit for estimating approximately 50% charged state and 50% discharged state. Partial credit if the answer correctly identifies a mixed state but gets the proportions wrong. |
| q2 | identification | 30 | What physical states or reference materials should be used as basis spectra to model the phase composition of this cycled cathode particle using linear combination fitting? | To model the phase composition of this LiCoO2 particle using linear combination fitting, the basis spectra should be ex-situ electrode powder recovered at the discharged state (at 3V) and ex-situ electrode powder recovered at the charged state (at 4.6V). These specific reference phases are required because discharging the cell to 3.0V at a relatively fast 1C rate induces highly rate-dependent reaction heterogeneity. Due to a non-equilibrium nucleation process influenced by particle defects, the material suffers a low recovery rate and does not fully lithiate. Therefore, both the fully charged and fully discharged reference spectra are necessary to accurately fit the resulting 50/50 mixture of trapped charged and recovered discharged phases. | Full credit for identifying the fully discharged state (e.g., ex-situ powder at 3V) and the fully charged state (e.g., ex-situ powder at 4.6V) as the necessary reference spectra. |
| q3 | reasoning | 40 | Explain the physical reasoning for why the particle exhibits this specific mixed-phase composition when discharged at a 1C rate, rather than fully returning to the discharged state. | When the LiCoO2 particle is discharged to 3.0V at a relatively fast 1C rate, it exhibits a 50% charged and 50% discharged mixed-phase composition due to highly rate-dependent reaction heterogeneity. This heterogeneity is likely driven by a non-equilibrium nucleation process associated with the formation of the delithiated phase, which is strongly affected by defects within the particle. Because of the fast 1C discharge condition, the particle suffers from a low recovery rate during lithiation. As a result, the structural recovery is incomplete, leaving 50% of the material trapped in the charged state while only the remaining 50% successfully recovers to the discharged state. | Full credit for explaining that the reaction is a non-equilibrium, rate-dependent process (potentially limited by nucleation and defects), which causes a low recovery rate at the faster 1C discharge speed, leaving a significant portion of the particle trapped in the charged state. |
Review
#791
LiCoO2
Co K
▶
LLM Prompt
Sample Information
Material: LiCoO2
Electrode Type: cathode
Electrolyte: 1 M LiPF6 in EC:DMC (1:1 vol)
Cell Type: in-situ pouch cell
Charge Discharge: discharged
C Rate: 10C
Voltage V: 3.0
State Of Charge: discharged
Sample-Specific Conditions
- C-rate: 10C
- Particle discharged to 3V at 10C rate
Measurement
We plan to measure the Co K XANES spectrum of this sample.
Questions
Based on all the information above:
1. Estimate the phase fractions of the charged (delithiated) and discharged (lithiated) states for this LiCoO2 particle discharged to 3V at a high rate of 10C.
2. What reference spectra should be used as the basis for linear combination fitting of the Co K-edge XANES data to quantify the state of charge heterogeneity in this sample?
3. Based on the physical processes occurring during high-rate cycling, explain why this particle exhibits such a low recovery to the discharged state when discharged at 10C.
Ground Truth
Material: LiCoO2
Measurement: Co K-edge in-situ transmission X-ray microscopy (TXM)
Fit method: linear combination fitting
Phase fractions:
| Phase | Fraction |
|---|---|
| Charged state (Li1-xCoO2) | 0.71 |
| Discharged state (LiCoO2) | 0.29 |
Fit basis (paper's reference spectra):
- ex-situ LiCoO2 discharged state (3V)
- ex-situ LiCoO2 charged state (4.6V)
Source evidence: Figure 2d, page 4
Key reasoning: When discharged to 3V at a high rate of 10C, the particle exhibits a low recovery rate, with only 29% returning to the discharged state. This significant reaction heterogeneity and poor recovery are attributed to the non-equilibrium nature of the high-rate cycling, where the nucleation of the delithiated phase is affected by particle defects. The high C-rate prevents the particle from fully re-lithiating, leaving a large portion (71%) trapped in the charged state.
Reasoning source: Page 4, text discussing Figure 2
Scoring Rubric (total: 100 pts)
| Q | Type | Max | Question | Reference Answer | Scoring Criteria |
|---|---|---|---|---|---|
| q1 | quantification | 35 | Estimate the phase fractions of the charged (delithiated) and discharged (lithiated) states for this LiCoO2 particle discharged to 3V at a high rate of 10C. | The phase fractions for this LiCoO2 particle are estimated to be 71% for the charged state (Li1-xCoO2) and 29% for the discharged state (LiCoO2). These specific values result from the non-equilibrium nature of the high-rate 10C discharge to 3.0 V. The rapid C-rate prevents the particle from fully re-lithiating, leading to a low recovery rate where only a small fraction returns to the discharged state. Consequently, significant reaction heterogeneity occurs, leaving the majority of the particle trapped in the charged state. | Full points for estimating ~71% charged state and ~29% discharged state. Partial points for identifying that the charged state is the majority phase despite being at the discharged voltage. |
| q2 | identification | 30 | What reference spectra should be used as the basis for linear combination fitting of the Co K-edge XANES data to quantify the state of charge heterogeneity in this sample? | The reference spectra for linear combination fitting should include the ex-situ LiCoO2 discharged state (3V) and the ex-situ LiCoO2 charged state (4.6V). These specific phases are expected because discharging the LiCoO2 cathode to 3.0 V at a rapid 10C rate creates a highly non-equilibrium state with significant reaction heterogeneity. The high C-rate prevents full re-lithiation, causing the particle to consist of a mixture of trapped delithiated domains and successfully re-lithiated domains. Using these two end-member reference spectra allows for the accurate quantification of this incomplete recovery. | Full points for identifying the need for spectra of the fully discharged state (e.g., ex-situ LiCoO2 at 3V) and the fully charged state (e.g., ex-situ LiCoO2 at 4.6V). |
| q3 | reasoning | 35 | Based on the physical processes occurring during high-rate cycling, explain why this particle exhibits such a low recovery to the discharged state when discharged at 10C. | The particle exhibits a low recovery rate of only 29% to the discharged state due to the highly non-equilibrium nature of the 10C high-rate cycling. When discharged to 3.0 V at this rapid speed, the high C-rate kinetically prevents the particle from fully re-lithiating. Additionally, the nucleation of the delithiated phase is strongly affected by particle defects, which drives significant reaction heterogeneity. Ultimately, these kinetic limitations and defect interactions leave a large portion (71%) of the LiCoO2 particle trapped in the charged state. | Full points for explaining that high-rate cycling is a non-equilibrium process where nucleation and Li transport are kinetically limited, preventing full re-lithiation and leaving a large portion of the particle trapped in the charged state. |
Review
#792
LiCoO2
Co K
▶
LLM Prompt
Sample Information
Material: LiCoO2
Electrode Type: cathode
Electrolyte: 1 M LiPF6 in EC:DMC (1:1 vol)
Cell Type: in-situ pouch cell
Charge Discharge: discharged
C Rate: 0.2C
Voltage V: 3.0
State Of Charge: discharged
Cycle Number: 1
Sample-Specific Conditions
- C-rate: 0.2C
- Particle discharged to 3V at 0.2C rate
Measurement
We plan to measure the Co K XANES spectrum of this sample.
Questions
Based on all the information above:
1. Based on the sample conditions (discharged to 3.0V at 0.2C), estimate the expected phase fractions of the charged and discharged states within the LiCoO2 particle.
2. What reference spectra are required as basis functions to perform a linear combination fitting (LCF) analysis of the XANES data for this cycled cathode particle?
3. Explain the physical reasoning for why the particle does not fully return to a 100% discharged state, even when discharged to 3.0V at a relatively slow rate of 0.2C.
Ground Truth
Material: LiCoO2
Measurement: Co K-edge in-situ transmission X-ray microscopy (TXM) spectro-microscopy
Fit method: Linear combination fitting (LCF)
Phase fractions:
| Phase | Fraction |
|---|---|
| Charged state (Li1-xCoO2) | 0.16 |
| Discharged state (LiCoO2) | 0.84 |
Fit basis (paper's reference spectra):
- Ex-situ LiCoO2 electrode powder recovered at the discharged state (3V)
- Ex-situ LiCoO2 electrode powder recovered at the charged state (4.6V)
Source evidence: Figure 2, panel (e) and corresponding pie chart, page 4
Key reasoning: The recovery of the LiCoO2 particle to the discharged state is strongly dependent on the cycling rate. At a slow discharge rate of 0.2C, 84% of the particle successfully recovered to the discharged state (LiCoO2). The remaining 16% stayed in the charged state, indicating reaction heterogeneity. This incomplete recovery is attributed to a non-equilibrium nucleation process that is affected by defects within the particle.
Reasoning source: Page 4, text discussing Figure 2 and rate dependency
Scoring Rubric (total: 100 pts)
| Q | Type | Max | Question | Reference Answer | Scoring Criteria |
|---|---|---|---|---|---|
| q1 | quantification | 35 | Based on the sample conditions (discharged to 3.0V at 0.2C), estimate the expected phase fractions of the charged and discharged states within the LiCoO2 particle. | The expected phase fractions for this LiCoO2 particle are 84% for the discharged state (LiCoO2) and 16% for the charged state (Li1-xCoO2). These specific values result from the sample being discharged to 3.0V at a slow rate of 0.2C, as the recovery to the discharged state is strongly dependent on the cycling rate. At this 0.2C rate, the majority of the particle successfully recovers to the discharged state, but reaction heterogeneity prevents complete lithiation. The remaining 16% stays in the charged state due to a non-equilibrium nucleation process that is hindered by defects within the particle. | Full points for estimating approximately 84% discharged state (LiCoO2) and 16% charged state. Partial credit for stating that the vast majority is in the discharged state but a small, measurable fraction remains in the charged state. |
| q2 | identification | 30 | What reference spectra are required as basis functions to perform a linear combination fitting (LCF) analysis of the XANES data for this cycled cathode particle? | To perform a linear combination fitting (LCF) analysis on this sample, the required reference spectra are ex-situ LiCoO2 electrode powder recovered at the discharged state (3.0V) and ex-situ LiCoO2 electrode powder recovered at the charged state (4.6V). These specific reference phases are necessary because the LiCoO2 particle, despite being discharged to 3.0V at a slow 0.2C rate, exhibits reaction heterogeneity and does not fully recover to a single phase. The sample conditions result in a mixed state containing 84% discharged phase and 16% residual charged phase. This incomplete recovery is driven by a non-equilibrium nucleation process influenced by internal particle defects, necessitating both charged and discharged basis functions to accurately model the XANES data. | Full points for identifying the need for two specific reference spectra: a fully discharged state reference (e.g., ex-situ LiCoO2 at 3V) and a fully charged state reference (e.g., ex-situ LiCoO2 at 4.6V). |
| q3 | reasoning | 35 | Explain the physical reasoning for why the particle does not fully return to a 100% discharged state, even when discharged to 3.0V at a relatively slow rate of 0.2C. | Even when discharged to 3.0V at a slow rate of 0.2C, the LiCoO2 particle does not fully return to a 100% discharged state due to reaction heterogeneity. Under these specific cycling conditions, the structural recovery of the particle is strongly dependent on the discharge rate and internal particle dynamics. The incomplete recovery, which leaves 16% of the particle trapped in the charged state (Li1-xCoO2), is driven by a non-equilibrium nucleation process. This nucleation process is affected by defects within the particle, which restrict complete lithiation and prevent the entire volume from returning to the fully discharged LiCoO2 phase. | Full points for explaining that the incomplete recovery is due to reaction heterogeneity caused by a non-equilibrium nucleation process, which is affected by defects within the particle. |
Review
#793
LiCoO2
Co K
▶
LLM Prompt
Sample Information
Material: LiCoO2
Electrode Type: cathode
Electrolyte: 1 M LiPF6 in EC:DMC (1:1 vol)
Cell Type: in-situ pouch cell
Charge Discharge: discharged
C Rate: 0.2C
Voltage V: 3.0
State Of Charge: discharged
Cycle Number: 20
Sample-Specific Conditions
- cycle number: 20
- Particle discharged to 3V at 0.2C rate after 20 cycles
Measurement
We plan to measure the Co K XANES spectrum of this sample.
Questions
Based on all the information above:
1. Based on the sample conditions (discharged to 3V at 0.2C after 20 cycles), what candidate reference spectra are needed to model the Co K-edge XANES data using linear combination fitting, and what are the expected phase fractions?
2. Why does the LiCoO2 particle fail to fully recover to the 100% discharged state after 20 cycles at 0.2C? Describe the physical and structural mechanisms responsible for this phase heterogeneity.
3. During the 20 cycles at 0.2C, how does the spatial distribution of the inactive (charged) domains behave within the particle, and what does this indicate about the internal lithium mobility?
Ground Truth
Material: LiCoO2
Measurement: in-situ transmission X-ray microscopy (TXM) spectro-microscopy, Co K-edge
Fit method: linear combination fitting (LCF)
Phase fractions:
| Phase | Fraction |
|---|---|
| Discharged state (LiCoO2) | 0.73 |
| Charged state (Li1-xCoO2) | 0.27 |
Fit basis (paper's reference spectra):
- ex-situ electrode powder recovered at the discharged state (at 3V)
- ex-situ electrode powder recovered at the charged state (at 4.6V)
Source evidence: Figure 2.f and page 5 text
Key reasoning: The particle's recovery rate to the discharged state is negatively correlated with the cycling rate, but also degrades with extended cycling. After 20 cycles at 0.2C, the recovery rate degraded to 73% (from 84% at the 1st cycle of 0.2C). This degraded cycle performance is attributed to structural changes upon extended lithium extraction, which causes an accumulation of irreversible structural damage and morphological changes (e.g., cracks). Additionally, the inactive domains redistribute within the particle over these cycles, indicating the particle's ability to re-adjust itself in response to repeated reaction conditions.
Reasoning source: Page 5, discussion of Figure 2 and Figure 3
Scoring Rubric (total: 100 pts)
| Q | Type | Max | Question | Reference Answer | Scoring Criteria |
|---|---|---|---|---|---|
| q1 | quantification | 40 | Based on the sample conditions (discharged to 3V at 0.2C after 20 cycles), what candidate reference spectra are needed to model the Co K-edge XANES data using linear combination fitting, and what are the expected phase fractions? | To model the Co K-edge XANES data using linear combination fitting, the required reference spectra are ex-situ electrode powders recovered at the discharged state (3.0V) and the charged state (4.6V). The expected phase fractions are 73% for the discharged state (LiCoO2) and 27% for the charged state (Li1-xCoO2). These specific fractions arise because, after 20 cycles at a 0.2C rate, the particle's recovery to the discharged state degrades to 73% due to extended cycling. This incomplete recovery is caused by structural changes during repeated lithium extraction, which lead to an accumulation of irreversible structural damage and morphological changes like cracks. | Full credit requires identifying the need for fully discharged (3V) and fully charged (4.6V) reference spectra, and estimating the phase fractions at approximately 73% discharged state and 27% charged state (inactive domains). |
| q2 | reasoning | 40 | Why does the LiCoO2 particle fail to fully recover to the 100% discharged state after 20 cycles at 0.2C? Describe the physical and structural mechanisms responsible for this phase heterogeneity. | The LiCoO2 particle fails to fully recover to the 100% discharged state (reaching only 73% recovery) because extended cycling degrades the material's reversibility. Specifically, after 20 cycles at 0.2C, the repeated and extended extraction of lithium induces significant structural changes within the particle. These changes result in the accumulation of irreversible structural damage and morphological degradation, such as the formation of cracks. Consequently, these damaged regions become inactive and remain trapped in the charged state (Li1-xCoO2), preventing complete lithiation back to the fully discharged state at 3.0V. | Full credit requires explaining that extended lithium extraction causes an accumulation of irreversible structural damage and morphological changes, such as cracks, which trap regions of the particle in the charged state (inactive domains). |
| q3 | reasoning | 20 | During the 20 cycles at 0.2C, how does the spatial distribution of the inactive (charged) domains behave within the particle, and what does this indicate about the internal lithium mobility? | Over the course of 20 cycles at 0.2C, the inactive (charged) domains redistribute themselves spatially within the LiCoO2 particle. This redistribution occurs as a consequence of the structural changes and irreversible damage, such as cracks, that accumulate during extended lithium extraction. The ability of these inactive domains to move and redistribute indicates that the particle can re-adjust itself in response to repeated reaction conditions. Ultimately, this behavior demonstrates that the particle continuously adapts to the structural degradation experienced over 20 charge-discharge cycles. | Full credit requires noting that the inactive domains redistribute within the particle over the 20 cycles, indicating that the particle can re-adjust itself and that there is still some Li-ion mobility allowing rearrangement within the particle. |
Review
#794
LiCoO2
Co K
▶
LLM Prompt
Sample Information
Material: LiCoO2
Electrode Type: cathode
Electrolyte: 1 M LiPF6 in EC:DMC (1:1 vol)
Cell Type: in-situ pouch cell
Charge Discharge: discharged
Sample-Specific Conditions
- particle type: outlier
- Unanticipated metallic Co particle formed upon cycling, identified via data mining
Measurement
We plan to measure the Co K XANES spectrum of this sample.
Questions
Based on all the information above:
1. What unexpected pure phase is identified in outlier particles after cycling this LiCoO2 cathode, and what physical mechanism is proposed for its formation given the operating voltage window (3V to 4.6V)?
2. How does the Co K-edge XANES spectrum of this outlier particle distinguish it from the bulk active material?
3. What specific reference spectrum is required to confirm the chemical identity of this outlier particle?
Ground Truth
Material: LiCoO2 (outlier particle)
Measurement: Co K-edge in-situ transmission X-ray microscopy (TXM) spectro-microscopy at beamline 8-ID (NSLS-II)
Fit method: Unsupervised data mining (DBSCAN) followed by direct spectral comparison
Phase fractions:
| Phase | Fraction |
|---|---|
| Metallic Co | 1.0 |
Fit basis (paper's reference spectra):
- pure Co foil
Source evidence: Figure 4b, page 5
Key reasoning: An unsupervised data mining method (DBSCAN) identified outlier particles with distinct chemical fingerprints after the cycling sequence. One such particle showed the spectroscopic signature of metallic Co. Since the cell was operated between 3V and 4.6V with no deep discharging history, direct electrochemical reduction of Co3+ to metallic Co is highly unlikely. The formation of this metallic Co particle is instead attributed to the dissolution and precipitation of Co cations.
Reasoning source: Page 5, right column
Scoring Rubric (total: 100 pts)
| Q | Type | Max | Question | Reference Answer | Scoring Criteria |
|---|---|---|---|---|---|
| q1 | reasoning | 40 | What unexpected pure phase is identified in outlier particles after cycling this LiCoO2 cathode, and what physical mechanism is proposed for its formation given the operating voltage window (3V to 4.6V)? | The unexpected pure phase identified in the outlier particles is metallic Co (oxidation state 0). In this discharged LiCoO2 cathode, the cell was operated strictly within a 3V to 4.6V window without any deep discharging history. Because of this specific voltage range, the direct electrochemical reduction of Co3+ to metallic Co is highly unlikely. Therefore, the formation of this metallic Co phase is instead attributed to a physical mechanism involving the dissolution of Co cations into the electrolyte and their subsequent precipitation as metallic Co. | Full credit for identifying Metallic Co and explaining that it forms via dissolution and precipitation of Co cations, noting that direct electrochemical reduction is unlikely in this voltage window. |
| q2 | spectral | 30 | How does the Co K-edge XANES spectrum of this outlier particle distinguish it from the bulk active material? | The Co K-edge XANES spectrum of the outlier particle exhibits the characteristic profile of pure metallic Co, which is completely distinct from the typical LixCoO2 signature found in the rest of the cathode. This distinct spectral shape arises because the outlier particle consists entirely of metallic Co (fraction 1.0, oxidation state 0) rather than the expected Co3+/Co4+ oxide structure of the bulk active material. Given the in-situ pouch cell cycling conditions, Co cations dissolved and precipitated to form this unanticipated metallic phase. Consequently, the X-ray absorption features reflect the electronic and structural properties of zero-valent cobalt metal instead of the layered transition metal oxide. | Full credit for stating that the spectrum matches the signature of pure Co foil, which is completely distinct from the typical LixCoO2 signature of the bulk material. |
| q3 | identification | 30 | What specific reference spectrum is required to confirm the chemical identity of this outlier particle? | A pure Co foil reference spectrum is required to confirm the chemical identity of this outlier particle. Unsupervised data mining (DBSCAN) of the cycled LiCoO2 cathode identified this unanticipated particle with a distinct chemical fingerprint. Because the particle underwent a dissolution and precipitation mechanism during cycling to form a 100% metallic Co phase (oxidation state 0), its spectrum completely deviates from the bulk LixCoO2. Therefore, direct spectral comparison with a pure Co foil standard is necessary to accurately identify and fit the zero-valent metallic cobalt signature. | Full credit for identifying pure Co foil as the necessary reference spectrum. |
Review
Applying Configurational Complexity to the 2D Ruddlesden–Popper Crystal Structure
BNL-NSLS-II-8-ID
Thin Film
Wenrui Zhang et al.
DOI: 10.1021/acsnano.0c04487
1 scenario
▶
#795
(La0.2Pr0.2Nd0.2Sm0.2Eu0.2)2CuO4
Cu K
▶
LLM Prompt
Sample Information
Material: (La0.2Pr0.2Nd0.2Sm0.2Eu0.2)2CuO4
Deposition Method: PLD
Substrate: SrTiO3 (001)
Deposition Temperature C: 790
Composition Variable: A-site composition
Composition Value: La0.2Pr0.2Nd0.2Sm0.2Eu0.2
Sample-Specific Conditions
- substrate: SrTiO3
- Epitaxial high-entropy Ruddlesden-Popper cuprate film on STO substrate
Measurement
We plan to measure the Cu K XANES spectrum of this sample.
Questions
Based on all the information above:
1. Based on the synthesis conditions (epitaxial growth on a near lattice-matched STO substrate), what specific cuprate structural phase dominates the film, and what is the local coordination environment of the Cu sites?
2. Describe the key distinguishing feature in the Cu K-edge XANES spectrum that confirms this specific structural phase over other possible tetragonal cuprate structures (such as the T-type).
3. What is the physical origin (electronic transition or charge transfer mechanism) of the prominent pre-edge feature (Peak A) observed in this material's Cu K-edge XANES spectrum?
4. If one were to perform a comparative analysis to identify the local Cu coordination in this high-entropy film, what specific reference spectra (structural polymorphs) should be included in the basis set?
Ground Truth
Material: (La0.2Pr0.2Nd0.2Sm0.2Eu0.2)2CuO4
Measurement: Cu K-edge XANES, fluorescence mode, beamline 8-ID ISS at NSLS-II
Fit method: Qualitative comparison
Phase fractions: (±10%)
| Phase | Fraction |
|---|---|
| T'-type cuprate structure | 1.0 |
Fit basis (paper's reference spectra):
- T-type cuprate structure reference
- T*-type cuprate structure reference
- T'-type cuprate structure reference
Source evidence: Figure 3a, Section 2.3, Pages 5-6
Key reasoning: The Cu K-edge XANES spectrum of the 5ACuO film grown on STO closely matches the reference spectrum for the T'-type structure. Specifically, it exhibits a prominent pre-edge peak A, which is characteristic of square-planar Cu sites and arises from ligand-to-metal charge transfer. This distinguishes it from the octahedrally coordinated Cu sites found in T-type structures.
Reasoning source: Section 2.3 Electronic structure and chemical characterization, Pages 5-6
Scoring Rubric (total: 100 pts)
| Q | Type | Max | Question | Reference Answer | Scoring Criteria |
|---|---|---|---|---|---|
| q1 | identification | 25 | Based on the synthesis conditions (epitaxial growth on a near lattice-matched STO substrate), what specific cuprate structural phase dominates the film, and what is the local coordination environment of the Cu sites? | The film is dominated entirely by the T'-type cuprate structural phase, with a phase fraction of 1.0, where the local coordination environment of the Cu sites is square-planar. This specific phase arises because the epitaxial growth of the high-entropy (La0.2Pr0.2Nd0.2Sm0.2Eu0.2)2CuO4 composition via PLD at 790 °C on the SrTiO3 (001) substrate stabilizes the T'-type structure over other polymorphs. The resulting square-planar coordination is confirmed by the XANES spectrum, which perfectly matches the T'-type reference rather than the octahedrally coordinated T-type structure. | Full points for identifying the T'-type structure and stating that the Cu sites have a square-planar coordination environment. |
| q2 | spectral | 30 | Describe the key distinguishing feature in the Cu K-edge XANES spectrum that confirms this specific structural phase over other possible tetragonal cuprate structures (such as the T-type). | The key distinguishing feature in the Cu K-edge XANES spectrum is a prominent pre-edge peak (Peak A) located at approximately 8984-8985 eV. This feature confirms the presence of the T'-type structural phase over the T-type structure. This specific spectral feature arises because the epitaxial growth of the high-entropy (La0.2Pr0.2Nd0.2Sm0.2Eu0.2)2CuO4 film on the SrTiO3 substrate yields square-planar Cu sites. These square-planar sites produce a strong ligand-to-metal charge transfer signal, which is much weaker or entirely absent in the octahedrally coordinated Cu sites characteristic of T-type structures. | Full points for mentioning the prominent pre-edge peak (Peak A) that is characteristic of the square-planar Cu sites in the T'-type structure compared to octahedrally coordinated sites. |
| q3 | reasoning | 25 | What is the physical origin (electronic transition or charge transfer mechanism) of the prominent pre-edge feature (Peak A) observed in this material's Cu K-edge XANES spectrum? | The prominent pre-edge feature (Peak A) originates from a 1s-4pπ electronic transition associated with a ligand-to-metal charge transfer. This mechanism is directly linked to the sample's specific structural configuration, which consists of a 100% T'-type cuprate phase. Because the high-entropy (La0.2Pr0.2Nd0.2Sm0.2Eu0.2)2CuO4 film is epitaxially grown on an STO (001) substrate at 790 °C, it adopts a square-planar local coordination environment for the Cu2+ ions. It is this specific square-planar geometry, distinct from octahedral coordination, that enables the strong ligand-to-metal charge transfer responsible for the prominent pre-edge peak. | Full points for identifying the origin as a 1s-4pπ transition and/or ligand-to-metal charge transfer. |
| q4 | identification | 20 | If one were to perform a comparative analysis to identify the local Cu coordination in this high-entropy film, what specific reference spectra (structural polymorphs) should be included in the basis set? | To identify the local Cu coordination, the basis set should include reference spectra for the T-type, T*-type, and T'-type cuprate structures. These specific references are necessary because the high-entropy (La0.2Pr0.2Nd0.2Sm0.2Eu0.2)2CuO4 film grown on the SrTiO3 substrate could potentially adopt different Ruddlesden-Popper structural polymorphs depending on the exact epitaxial strain and deposition conditions at 790 °C. By comparing the sample's spectrum against these references, one can determine that the film consists of 100% T'-type structure. This is evidenced by the prominent pre-edge peak characteristic of square-planar Cu sites, which clearly distinguishes the sample from the octahedrally coordinated Cu sites found in the T-type reference. | Full points for listing the three major tetragonal cuprate structures: T-type, T*-type, and T'-type. |
Review
Understanding the Mechanism of High Capacitance in Nickel Hexaaminobenzene-Based Conductive Metal–Organic Frameworks in Aqueous Electrolytes
BNL-NSLS-II-8-ID
Electrochemistry
Maria R. Lukatskaya et al.
DOI: 10.1021/acsnano.0c07292
1 scenario
▶
#796
NiHAB
Ni K-edge
▶
LLM Prompt
Sample Information
Material: NiHAB
Electrode Type: working electrode
Electrolyte: 1 M KOH
Cell Type: pouch cell
Charge Discharge: discharging
C Rate: 1 mV/s
Voltage V: -0.38
Sample-Specific Conditions
- voltage: -0.38 V
- In situ XAS during cyclic voltammetry (cathodic scan)
Measurement
We plan to measure the Ni K-edge XANES spectrum of this sample.
Questions
Based on all the information above:
1. Describe the expected spectral features (peaks and their origins) in the Ni K-edge XANES spectrum of NiHAB at -0.38 V.
2. Based on the XANES analysis, what is the nominal oxidation state of Ni in this material, and how does it change during the cathodic scan to -0.38 V? What reference materials were used to determine this?
3. What specific spectral feature in the Ni K-edge XANES of NiHAB indicates its local coordination geometry, and what is that geometry?
Ground Truth
Material: NiHAB
Measurement: in situ Ni K-edge XANES in transmission and fluorescence modes at beamline 8-ID (ISS)
Fit method: integral method for edge energy position
Phase fractions:
| Phase | Fraction |
|---|---|
| NiHAB | 1.0 |
Fit basis (paper's reference spectra):
- NiO
- LiNiO2
Source evidence: Figure 1c and page 6 text
Key reasoning: In situ XAS spectra collected at various potentials during cyclic voltammetry overlap perfectly, indicating a lack of changes in the Ni oxidation state upon charge and discharge. The nominal Ni oxidation state of +2.5 is estimated by comparing the edge energy position derived by the integral method with Ni-oxide reference materials (NiO and LiNiO2).
Reasoning source: Page 6, first paragraph
Scoring Rubric (total: 100 pts)
| Q | Type | Max | Question | Reference Answer | Scoring Criteria |
|---|---|---|---|---|---|
| q1 | spectral | 40 | Describe the expected spectral features (peaks and their origins) in the Ni K-edge XANES spectrum of NiHAB at -0.38 V. | The expected Ni K-edge XANES spectrum of NiHAB at -0.38 V features three distinct peaks: a weak pre-edge peak A (8334 eV), a relatively strong second pre-edge peak B (8340 eV), and a strong main absorption peak C (8351 eV). Peak A originates from a dipole-forbidden, quadrupole-allowed 1s to 3d transition indicating 3d and 4p orbital hybridization, Peak B from a 1s to 4pz transition, and Peak C from a dipole-allowed 1s to 4p transition. These specific features arise because the NiHAB material maintains a stable four-coordinate, square-planar geometry and a constant oxidation state during the electrochemical discharge. Despite the applied cathodic potential of -0.38 V during cyclic voltammetry in 1 M KOH, the in situ spectra overlap perfectly with those at other potentials, demonstrating that the structural and electronic properties producing these peaks do not change. | 10 points for mentioning peak A at ~8334 eV (1s->3d). 15 points for peak B at ~8340 eV (1s->4pz, square planar). 15 points for peak C at ~8351 eV (1s->4p). |
| q2 | reasoning | 30 | Based on the XANES analysis, what is the nominal oxidation state of Ni in this material, and how does it change during the cathodic scan to -0.38 V? What reference materials were used to determine this? | The nominal oxidation state of Ni in the NiHAB material is +2.5, and it remains completely unchanged during the cathodic scan to -0.38 V. This oxidation state was determined by comparing the edge energy position of the sample, derived via the integral method, against NiO and LiNiO2 reference materials. The stability of this +2.5 state at -0.38 V occurs because the applied electrochemical discharge conditions in the 1 M KOH electrolyte do not induce any redox changes at the nickel centers. This lack of change is evidenced by the perfect overlap of in situ XAS spectra collected at various potentials during the cyclic voltammetry, confirming the oxidation state remains constant throughout the process. | 10 points for stating the oxidation state is +2.5. 10 points for explaining it does not change during the scan (perfect overlap of spectra). 10 points for mentioning NiO and LiNiO2 as references. |
| q3 | reasoning | 30 | What specific spectral feature in the Ni K-edge XANES of NiHAB indicates its local coordination geometry, and what is that geometry? | The local coordination geometry of NiHAB is indicated by a relatively strong second pre-edge peak (Peak B) at 8340 eV, which corresponds to a four-coordinate, square-planar Ni complex. This peak originates from the transition of 1s electrons to 4pz orbitals, which is a characteristic signature of this specific square-planar geometry. This structural feature is observed at the applied potential of -0.38 V because the NiHAB working electrode maintains its structural integrity during the cathodic scan in 1 M KOH. The perfect overlap of the in situ XAS spectra collected during the cyclic voltammetry demonstrates that the four-coordinate, square-planar environment is highly stable and does not distort or change coordination under these electrochemical discharge conditions. | 15 points for identifying the relatively strong second pre-edge peak (Peak B) at ~8340 eV. 15 points for stating it is typical for four-coordinate, square-planar Ni complexes. |
Review
Short-Range Crystalline Order-Tuned Conductivity in Cr2Si2Te6 van der Waals Magnetic Crystals
BNL-NSLS-II-8-ID
Pure Phase
Yu Liu et al.
DOI: 10.1021/acsnano.2c06080
1 scenario
▶
#797
Cr2Si2Te6
Cr K-edge
▶
LLM Prompt
Sample Information
Material: Cr2Si2Te6
Crystal Structure: R-3h
Oxidation State: Cr3+
Sample Form: crystal
Measurement Mode: fluorescence
- Cr K-edge XANES of Cr2Si2Te6 single crystal at room temperature
Measurement
We plan to measure the Cr K-edge XANES spectrum of this sample.
Questions
Based on all the information above:
1. Based on the sample information, what is the expected oxidation state of Cr in this material, and what does the XANES spectrum indicate about this state?
2. Describe the expected spectral shape of the Cr K-edge XANES for this Cr2Si2Te6 single crystal. Include the approximate energy positions and relative intensities of the pre-edge and white line features.
Ground Truth
Compound: Cr2Si2Te6
Oxidation state: Cr3+
Measurement: Cr K-edge XANES in fluorescence mode at 8-ID beamline of NSLS II
Edge position: not explicitly reported (rises around 5.99-6.00 keV in Fig 1d)
Spectral shape: The spectrum shows a small pre-edge feature around 5.99 keV, a rising edge, and a strong main white line peak around 6.005 keV.
Labeled peaks:
| Label | Energy (eV) | Intensity | Origin | Source |
|---|---|---|---|---|
| pre-edge | ~5.99 keV | small | not discussed in this paper | paper_data |
| white line | ~6.005 keV | strong | not discussed in this paper | paper_data |
Distinguishing features: not discussed in this paper
Key reasoning: The XANES spectrum was collected to determine the oxidation state of Cr in the synthesized Cr2Si2Te6 crystals. The spectral features indicate a Cr3+ state in the Cr2Si2Te6 lattice.
Reasoning source: Page 4, RESULTS AND DISCUSSION section
Scoring Rubric (total: 100 pts)
| Q | Type | Max | Question | Reference Answer | Scoring Criteria |
|---|---|---|---|---|---|
| q1 | identification | 43 | Based on the sample information, what is the expected oxidation state of Cr in this material, and what does the XANES spectrum indicate about this state? | The expected oxidation state of Cr in the synthesized Cr2Si2Te6 single crystal is Cr3+. The XANES spectrum, collected in fluorescence mode at room temperature, confirms this by exhibiting spectral features that indicate a pure Cr3+ state within the R-3h crystal lattice. Because the sample is a pure phase Cr2Si2Te6 crystal (fraction 1.0), the measurement was specifically collected to determine and verify this oxidation state. The resulting spectral features directly reflect the electronic structure of the Cr3+ ions residing in the specific coordination environment of the Cr2Si2Te6 lattice. | Full points for identifying the oxidation state as Cr3+ and stating that the XANES spectrum confirms this state. |
| q2 | spectral | 57 | Describe the expected spectral shape of the Cr K-edge XANES for this Cr2Si2Te6 single crystal. Include the approximate energy positions and relative intensities of the pre-edge and white line features. | The expected Cr K-edge XANES spectrum for the Cr2Si2Te6 single crystal features a rising edge around 5.99-6.00 keV. The overall spectral shape includes a small pre-edge feature at approximately 5.99 keV and a strong main white line peak around 6.005 keV. These specific spectral features arise because the sample is a pure Cr2Si2Te6 crystal with Cr in a Cr3+ oxidation state within an R-3h crystal structure. The distinct energy positions and relative intensities directly reflect the electronic transitions and local coordination environment of the Cr3+ ions in this specific lattice at room temperature. | Full points for mentioning a small pre-edge feature around 5.99 keV, a rising edge, and a strong main white line peak around 6.005 keV. |
Review
Biomimetic Control over Bimetallic Nanoparticle Structure and Activity via Peptide Capping Ligand Sequence
BNL-NSLS-II-8-ID
Catalyst
Maichong Xie et al.
DOI: 10.1021/acsnano.3c10016
4 scenarios
▶
#798
Pt20Au80
Pt L3
▶
LLM Prompt
Sample Information
Material: Pt20Au80
Sample-Specific Conditions
- Peptide ligand and Pt:Au ratio: AgBP1, 20:80
- AgBP1 peptide-capped PtAu bimetallic nanoparticles (20:80 Pt:Au ratio)
Measurement
We plan to measure the Pt L3 XANES spectrum of this sample.
Questions
Based on all the information above:
1. What structural motifs or nanoparticle phases should be considered as candidate components when modeling the Pt L3 XANES data for this sample?
2. Explain the physical and chemical reasoning for why this specific synthesis condition (AgBP1 peptide, direct co-reduction after 15 minutes) results in this particular distribution of Pt atoms.
Ground Truth
Material: Pt20Au80-AgBP1 bimetallic nanoparticles
Measurement: Pt L3-edge XANES, ex-situ in solution, ISS (8-ID) beamline at NSLS-II
Fit method: Neural Network-XANES Analysis combined with heterogeneity analysis
Phase fractions:
| Phase | Fraction |
|---|---|
| Pt in bimetallic nanoparticle shell | 0.9 |
| Pt in other sites (Pt-rich nanoparticles) | 0.1 |
Fit basis (paper's reference spectra):
- Pt-rich nanoparticles
- Au-rich nanoparticles
- PtAu-rich bimetallic nanoparticles (Au@Pt core@shell)
Source evidence: Page 4, text: 'Pt atoms preferred to distribute more to BNPs with AuBP2 (Pt20Au80: 0.96, Pt40Au60: 0.97) than AgBP1 (Pt20Au80: 0.90, Pt40Au60: 0.68).' and Page 3, Figure 3.
Key reasoning: The AgBP1 peptide synthesis utilizes a direct co-reduction of metal ions after a short 15-minute incubation. This leads to minimal interactions between the peptides and Pt2+ ions (which remain predominantly as PtCl4 2-), resulting in a lower fraction of Pt incorporating into the bimetallic PtAu phase compared to syntheses with longer incubation times. The resulting ensemble is heterogeneous, with 90% of the Pt located in the Pt-rich shells of the bimetallic nanoparticles, and the remainder forming separate Pt-rich particles.
Reasoning source: Page 4 (Results and Discussion, heterogeneity analysis) and Page 5 (Results and Discussion, synthesis mechanism discussion)
Scoring Rubric (total: 100 pts)
| Q | Type | Max | Question | Reference Answer | Scoring Criteria |
|---|---|---|---|---|---|
| q1 | identification | 43 | What structural motifs or nanoparticle phases should be considered as candidate components when modeling the Pt L3 XANES data for this sample? | When modeling the Pt L3 XANES data for the AgBP1 peptide-capped Pt20Au80 sample, the candidate components should include Pt-rich nanoparticles, Au-rich nanoparticles, and PtAu-rich bimetallic nanoparticles with an Au@Pt core@shell structure. These specific phases are expected because the synthesis utilizes a direct co-reduction of metal ions after a short 15-minute incubation with the AgBP1 peptide. This brief incubation leads to minimal interactions between the peptides and Pt2+ ions, which remain predominantly as PtCl4 2-. Consequently, the reduction process yields a heterogeneous ensemble where Pt is distributed between the Pt-rich shells of bimetallic nanoparticles and separate, isolated Pt-rich nanoparticles. | Full credit for identifying that the sample is a heterogeneous mixture requiring models for Pt-rich nanoparticles, Au-rich nanoparticles, and PtAu-rich bimetallic nanoparticles (specifically with a core@shell motif). |
| q3 | reasoning | 57 | Explain the physical and chemical reasoning for why this specific synthesis condition (AgBP1 peptide, direct co-reduction after 15 minutes) results in this particular distribution of Pt atoms. | The specific distribution of Pt atoms in the Pt20Au80-AgBP1 sample is driven by the kinetics of the peptide-metal interactions during synthesis. Because the synthesis employs a direct co-reduction of metal ions after only a short 15-minute incubation, there is minimal time for the AgBP1 peptides to interact with the Pt2+ ions. As a result, the Pt precursors remain predominantly in their initial PtCl4 2- state rather than complexing with the peptides. This lack of interaction limits the incorporation of Pt into the bimetallic PtAu phase compared to syntheses with longer incubation times. Ultimately, this mechanism results in a heterogeneous mixture where 90% of the Pt forms the Pt-rich shells of Au@Pt bimetallic nanoparticles, while the remaining 10% segregates into separate Pt-rich nanoparticles. | Full credit for explaining that the short 15-minute incubation leads to minimal interactions between the AgBP1 peptides and Pt2+ ions (which remain as PtCl4 2-). This direct co-reduction limits the incorporation of Pt into the bimetallic phase, leaving a portion of Pt to form separate Pt-rich nanoparticles. |
Review
#799
Pt40Au60
Pt L3
▶
LLM Prompt
Sample Information
Material: Pt40Au60
Sample-Specific Conditions
- Peptide ligand and Pt:Au ratio: AgBP1, 40:60
- AgBP1 peptide-capped PtAu bimetallic nanoparticles (40:60 Pt:Au ratio)
Measurement
We plan to measure the Pt L3 XANES spectrum of this sample.
Questions
Based on all the information above:
1. Based on the synthesis conditions using the AgBP1 peptide, what distinct nanoparticle phases or structural motifs are expected to coexist in the sample?
2. Explain the physical and chemical reasoning for why the AgBP1 peptide ligand and its associated direct co-reduction method result in this specific distribution of Pt atoms.
Ground Truth
Material: Pt40Au60-AgBP1
Measurement: Pt L3-edge ex-situ XANES at ISS (8-ID) beamline
Fit method: Neural network (NN)-based inversion to predict coordination numbers, followed by analytical heterogeneity modeling
Phase fractions:
| Phase | Fraction |
|---|---|
| Pt in bimetallic nanoparticle shell | 0.68 |
| Pt in monometallic/other sites | 0.32 |
Fit basis (paper's reference spectra):
- Pt-rich nanoparticles
- Au-rich nanoparticles
- PtAu-rich bimetallic nanoparticles (Au core / Pt shell)
Source evidence: Page 4, text (Results and Discussion)
Key reasoning: The AgBP1 peptide synthesis involves direct co-reduction of metal ions after a short 15-minute incubation, leading to minimal interaction between the peptide and Pt2+ ions. This specific synthetic pathway, driven by the AgBP1 sequence, results in a lower fraction of Pt incorporating into the bimetallic PtAu phase compared to other peptides. Consequently, a significant portion of Pt forms separate Pt-rich monometallic nanoparticles rather than joining the bimetallic shell.
Reasoning source: Page 5, Results and Discussion
Scoring Rubric (total: 100 pts)
| Q | Type | Max | Question | Reference Answer | Scoring Criteria |
|---|---|---|---|---|---|
| q1 | identification | 43 | Based on the synthesis conditions using the AgBP1 peptide, what distinct nanoparticle phases or structural motifs are expected to coexist in the sample? | The sample is expected to contain a mixture of Pt-rich nanoparticles, Au-rich nanoparticles, and PtAu-rich bimetallic nanoparticles featuring an Au core and a Pt shell. These distinct phases arise because the AgBP1 peptide-capped synthesis involves a direct co-reduction of metal ions after only a short 15-minute incubation. This brief incubation period leads to minimal interaction between the AgBP1 peptide and the Pt2+ ions. Consequently, a significant portion of the Pt does not incorporate into the bimetallic PtAu phase, instead segregating into separate Pt-rich monometallic nanoparticles. | Full points for identifying the coexistence of Pt-rich nanoparticles, Au-rich nanoparticles, and PtAu-rich bimetallic nanoparticles (specifically Au core / Pt shell). |
| q3 | reasoning | 57 | Explain the physical and chemical reasoning for why the AgBP1 peptide ligand and its associated direct co-reduction method result in this specific distribution of Pt atoms. | The specific distribution of Pt atoms, with 68% in the bimetallic shell and 32% in monometallic or other sites, is directly caused by the AgBP1 peptide's synthetic pathway. The synthesis relies on a direct co-reduction of the 40:60 Pt:Au metal ions following a brief 15-minute incubation. This short incubation time results in minimal interaction between the AgBP1 peptide and the Pt2+ ions prior to reduction. Because of this limited interaction, a lower fraction of Pt is able to incorporate into the bimetallic PtAu phase, forcing the remaining Pt to form separate Pt-rich monometallic nanoparticles. | Full points for explaining that the short incubation time and direct co-reduction lead to minimal interaction between the peptide and Pt2+ ions, resulting in a lower fraction of Pt incorporating into the bimetallic phase and more forming separate Pt-rich nanoparticles. |
Review
#800
Pt20Au80
Pt L3
▶
LLM Prompt
Sample Information
Material: Pt20Au80
Preparation: 1 mL of an aqueous 1 mM AuBP2 peptide solution was diluted with 3.96 mL water. An aqueous 100 mM K2PtCl4 solution was added and allowed to stir on the benchtop for 3 days (72 h) at room temperature to allow for Pt2+ hydrolysis and complexation. Next, an aqueous 100 mM HAuCl4 solution was added (volumes adjusted to achieve the 20:80 Pt:Au ratio). After a 15 min incubation time, freshly prepared 100 mM NaBH4 was added to reduce the metal ions overnight. The ratio of total metal loading:AuBP2:NaBH4 was maintained at 1:1:3.
Sample-Specific Conditions
- Peptide ligand and Pt:Au ratio: AuBP2, 20:80
- AuBP2 peptide-capped PtAu bimetallic nanoparticles (20:80 Pt:Au ratio)
Preparation
- 1 mL of an aqueous 1 mM AuBP2 peptide solution was diluted with 3.96 mL water. An aqueous 100 mM K2PtCl4 solution was added and allowed to stir on the benchtop for 3 days (72 h) at room temperature to allow for Pt2+ hydrolysis and complexation. Next, an aqueous 100 mM HAuCl4 solution was added (volumes adjusted to achieve the 20:80 Pt:Au ratio). After a 15 min incubation time, freshly prepared 100 mM NaBH4 was added to reduce the metal ions overnight. The ratio of total metal loading:AuBP2:NaBH4 was maintained at 1:1:3.
Measurement
We plan to measure the Pt L3 XANES spectrum of this sample.
Questions
Based on all the information above:
1. What candidate structural models or phases must be considered to properly analyze the Pt L3-edge XANES data for the Pt20Au80-AuBP2 sample?
2. Explain the chemical and physical reasoning for why the AuBP2 peptide synthesis strategy (specifically the 72 h incubation prior to Au addition and reduction) results in this specific distribution of Pt atoms.
Ground Truth
Material: Pt20Au80-AuBP2
Measurement: Pt L3-edge XANES, ex-situ, ISS (8-ID) beamline at NSLS-II
Fit method: Neural network (NN)-based analysis combined with heterogeneity analysis (solving nonlinear equations for ensemble-averaged CNs)
Phase fractions:
| Phase | Fraction |
|---|---|
| Pt in bimetallic nanoparticle shell | 0.96 |
| Pt in monometallic nanoparticles or other sites | 0.04 |
Fit basis (paper's reference spectra):
- Au-rich nanoparticles
- Pt-rich nanoparticles
- PtAu-rich nanoparticles
Source evidence: Page 4, right column (text discussing fraction J); Page 7, Experimental Methods (Neural Network-XANES Analysis)
Key reasoning: The AuBP2 peptide requires a 72 h incubation period with PtCl4 2- to allow for hydrolysis to PtCl2(H2O)2. This hydrolyzed complex binds strongly to the amines of the peptide molecule. During the subsequent reduction process, this pre-established binding between the peptide and Pt2+ complexes facilitates the preferential incorporation of Pt metal onto the surface of the Au@Pt structure. Consequently, the vast majority of Pt atoms are driven into the bimetallic nanoparticle shell rather than forming isolated monometallic Pt nanoparticles.
Reasoning source: Page 5, left column, paragraph 2 (discussion of synthetic mechanism and peptide binding)
Scoring Rubric (total: 100 pts)
| Q | Type | Max | Question | Reference Answer | Scoring Criteria |
|---|---|---|---|---|---|
| q1 | identification | 46 | What candidate structural models or phases must be considered to properly analyze the Pt L3-edge XANES data for the Pt20Au80-AuBP2 sample? | To properly analyze the Pt L3-edge XANES data for the Pt20Au80-AuBP2 sample, the candidate structural models that must be considered are Au-rich nanoparticles, Pt-rich nanoparticles, and PtAu-rich nanoparticles. These specific phases are expected because the synthesis involves the co-reduction of K2PtCl4 and HAuCl4 using NaBH4 in the presence of the AuBP2 peptide. Specifically, the 72-hour room temperature incubation of the peptide with PtCl4 2- allows for hydrolysis to PtCl2(H2O)2, which binds strongly to the peptide's amines. Upon reduction, this pre-established binding directs the vast majority of Pt to preferentially incorporate onto the surface of the bimetallic structure to form a shell, while a very small fraction may form isolated monometallic Pt nanoparticles. | Full points if the answer identifies that structural models of both bimetallic (Au-Pt) nanoparticles and monometallic Pt nanoparticles are required to capture the heterogeneity of the sample. |
| q3 | reasoning | 54 | Explain the chemical and physical reasoning for why the AuBP2 peptide synthesis strategy (specifically the 72 h incubation prior to Au addition and reduction) results in this specific distribution of Pt atoms. | The specific distribution of Pt atoms, where 96% of Pt resides in the bimetallic nanoparticle shell and only 4% forms monometallic nanoparticles or other sites, is a direct result of the 72-hour incubation step in the synthesis. During this 3-day room temperature incubation, the PtCl4 2- precursor undergoes hydrolysis to form PtCl2(H2O)2. This hydrolyzed complex binds strongly to the amine groups of the AuBP2 peptide molecule. When HAuCl4 and the NaBH4 reducing agent are subsequently added, this pre-established binding between the peptide and the Pt2+ complexes facilitates the preferential incorporation of Pt metal onto the surface of the forming Au@Pt structure. Consequently, the vast majority of Pt atoms are driven into the bimetallic nanoparticle shell rather than nucleating as isolated monometallic Pt nanoparticles. | Full points if the answer explains that the 72 h incubation allows PtCl4 2- to hydrolyze and bind to the peptide's amines, and that this specific peptide-metal interaction facilitates the high incorporation of Pt onto the surface of the Au@Pt bimetallic structure during reduction. |
Review
#801
Pt40Au60
Pt L3
▶
LLM Prompt
Sample Information
Material: Pt40Au60
Preparation: K2PtCl4 was mixed with AuBP2 peptide in water and stirred on the benchtop for 3 days (72 h) at room temperature to allow for Pt2+ hydrolysis and complexation. HAuCl4 was then added to achieve a 40:60 Pt:Au ratio and incubated for 15 min. Freshly prepared NaBH4 was then added to reduce the metal ions overnight. The ratio of total metal loading:AuBP2:NaBH4 was maintained at 1:1:3. For XAFS measurements, the resulting solution samples were sealed in Kapton tubes.
Sample-Specific Conditions
- Peptide ligand and Pt:Au ratio: AuBP2, 40:60
- AuBP2 peptide-capped PtAu bimetallic nanoparticles (40:60 Pt:Au ratio)
Preparation
- K2PtCl4 was mixed with AuBP2 peptide in water and stirred on the benchtop for 3 days (72 h) at room temperature to allow for Pt2+ hydrolysis and complexation. HAuCl4 was then added to achieve a 40:60 Pt:Au ratio and incubated for 15 min. Freshly prepared NaBH4 was then added to reduce the metal ions overnight. The ratio of total metal loading:AuBP2:NaBH4 was maintained at 1:1:3. For XAFS measurements, the resulting solution samples were sealed in Kapton tubes.
Measurement
We plan to measure the Pt L3 XANES spectrum of this sample.
Questions
Based on all the information above:
1. What candidate nanoparticle phases or structural motifs should be considered as the basis when modeling the Pt L3-edge XANES data for this peptide-mediated bimetallic synthesis?
Ground Truth
Material: Pt40Au60-AuBP2
Measurement: Pt L3-edge XANES, ex-situ (colloidal solution in Kapton tubes), ISS (8-ID) beamline at NSLS-II
Fit method: Neural network (NN)-based analysis of XANES combined with heterogeneity analysis (solving nonlinear equations for mixing fractions)
Phase fractions:
| Phase | Fraction |
|---|---|
| Pt in bimetallic nanoparticle shell (Au@Pt) | 0.97 |
| Pt in monometallic/other environments | 0.03 |
Fit basis (paper's reference spectra):
- Au-rich nanoparticles
- Pt-rich nanoparticles
- PtAu-rich bimetallic nanoparticles (Au@Pt core@shell)
Source evidence: Page 4, text: 'Pt atoms preferred to distribute more to BNPs with AuBP2 (Pt20Au80: 0.96, Pt40Au60: 0.97)'
Key reasoning: The AuBP2 peptide requires a 72 h incubation period for PtCl4 2- hydrolysis to generate PtCl2(H2O)2, which binds to the amines of the molecule. Upon reduction, this strong peptide-Pt interaction facilitates the incorporation of Pt metal to the surface of the Au@Pt structure. This specific synthetic mechanism driven by the biomolecule pushes the vast majority of Pt (97%) into the Pt-rich shell of the bimetallic nanoparticles, rather than forming isolated monometallic Pt nanoparticles.
Reasoning source: Page 5, RESULTS AND DISCUSSION (paragraphs discussing synthetic mechanism and Pt distribution)
Scoring Rubric (total: 100 pts)
| Q | Type | Max | Question | Reference Answer | Scoring Criteria |
|---|---|---|---|---|---|
| q1 | identification | 100 | What candidate nanoparticle phases or structural motifs should be considered as the basis when modeling the Pt L3-edge XANES data for this peptide-mediated bimetallic synthesis? | When modeling the Pt L3-edge XANES data for this sample, the basis should include Au-rich nanoparticles, Pt-rich nanoparticles, and PtAu-rich bimetallic nanoparticles (specifically Au@Pt core@shell structures). These specific phases are expected due to the peptide-mediated synthetic conditions used to prepare the Pt40Au60 sample. During the 72-hour incubation, the AuBP2 peptide facilitates the hydrolysis of PtCl4 2- to generate PtCl2(H2O)2, which strongly binds to the amines of the peptide. Upon subsequent addition of HAuCl4 and reduction with NaBH4, this strong peptide-Pt interaction directs the structural evolution, driving the Pt metal to predominantly incorporate onto the surface to form an Au@Pt core-shell bimetallic structure rather than forming isolated monometallic nanoparticles. | Full points for identifying that the sample is a heterogeneous mixture requiring basis components for Pt-rich monometallic nanoparticles, Au-rich nanoparticles, and PtAu-rich bimetallic nanoparticles (specifically Au@Pt core@shell motifs). |
Review
In-Situ Analysis of Corrosion Products in Molten Salt: X-ray Absorption Reveals Both Ionic and Metallic Species
BNL-NSLS-II-8-ID
Electrochemistry
Sean Fayfar et al.
DOI: 10.1021/acsomega.3c03448
2 scenarios
▶
#802
FLiNaK-NiF2
Ni K-edge
▶
LLM Prompt
Sample Information
Material: FLiNaK-NiF2
Electrolyte: FLiNaK
Cell Type: pyrolytic boron nitride (BN) cell
Sample-Specific Conditions
- Ni concentration: 400 - 1200 ppm
- FLiNaK salt mixed with NiF2 powder for XANES step-size calibration
Measurement
We plan to measure the Ni K-edge XANES spectrum of this sample.
Questions
Based on all the information above:
1. Based on the sample conditions (FLiNaK salt mixed with NiF2 powder for calibration), what is the expected dominant nickel phase in this sample and why?
2. If one were to use this sample's XANES spectrum in a linear combination fitting (LCF) analysis of other FLiNaK-based electrochemical samples, what specific basis spectrum does it provide?
3. How does the preparation method of this specific sample (ex-situ physical mixture) dictate its phase composition compared to an actively cycled electrode?
Ground Truth
Material: FLiNaK-NiF2
Measurement: Ni K-edge ex-situ
Fit method: not reported
Phase fractions: (±5%)
| Phase | Fraction |
|---|---|
| NiF2 | 1.0 |
Fit basis (paper's reference spectra):
- NiF2
Source evidence: Sample description: FLiNaK salt mixed with NiF2 powder for XANES step-size calibration
Key reasoning: This sample was prepared as an ex-situ physical mixture of FLiNaK salt and NiF2 powder specifically for XANES step-size calibration. Because it is a calibration standard rather than an electrochemically cycled sample, it consists entirely of the pure NiF2 phase in the FLiNaK matrix.
Reasoning source: Sample description / experimental conditions
Scoring Rubric (total: 100 pts)
| Q | Type | Max | Question | Reference Answer | Scoring Criteria |
|---|---|---|---|---|---|
| q1 | identification | 40 | Based on the sample conditions (FLiNaK salt mixed with NiF2 powder for calibration), what is the expected dominant nickel phase in this sample and why? | The expected dominant nickel phase in this sample is pure NiF2, representing a fraction of 1.0 (100%). This composition arises directly from the sample conditions, which specify an ex-situ physical mixture of FLiNaK salt and NiF2 powder with a nickel concentration of 400 - 1200 ppm. Because the sample was prepared specifically as a standard for XANES step-size calibration rather than being an electrochemically cycled material, no chemical or electrochemical reactions occur. Therefore, the nickel remains entirely in its original, unreacted NiF2 state within the FLiNaK matrix. | Full points for identifying NiF2 as the sole phase (fraction 1.0) and explaining that it was intentionally prepared as a physical mixture for calibration purposes, meaning no electrochemical transformations have occurred. |
| q2 | reasoning | 30 | If one were to use this sample's XANES spectrum in a linear combination fitting (LCF) analysis of other FLiNaK-based electrochemical samples, what specific basis spectrum does it provide? | This sample provides a pure NiF2 basis spectrum for linear combination fitting (LCF) analysis. The sample was prepared as an ex-situ physical mixture of FLiNaK salt and NiF2 powder (400 - 1200 ppm Ni) in a pyrolytic boron nitride cell specifically to serve as a XANES step-size calibration standard. Because it is an uncycled calibration standard, it consists entirely of the pure NiF2 phase (fraction of 1.0) in the FLiNaK matrix. Consequently, the resulting XANES measurement captures the exact spectral features of unreacted NiF2, providing an ideal reference basis for analyzing other FLiNaK-based samples. | Full points for stating it provides the pure NiF2 reference/basis spectrum, as it is a dedicated calibration standard of NiF2 in a FLiNaK matrix. |
| q3 | prediction | 30 | How does the preparation method of this specific sample (ex-situ physical mixture) dictate its phase composition compared to an actively cycled electrode? | The ex-situ physical mixture preparation dictates that the sample consists entirely of a single pure phase, yielding a NiF2 fraction of 1.0. Unlike an actively cycled electrode where applied potentials would drive chemical transformations, this sample was prepared simply by mixing FLiNaK salt with NiF2 powder (400 - 1200 ppm). Because it is intended solely as a XANES step-size calibration standard, it is not subjected to any electrochemical cycling. As a result, the initial physical mixture is perfectly preserved, and the nickel remains completely in the unreacted NiF2 phase within the FLiNaK matrix. | Full points for noting that as an ex-situ physical mixture for calibration, it remains 100% NiF2, lacking any intermediate phases, reduction products, or structural changes that would typically emerge during active electrochemical cycling. |
Review
#803
FLiNaK with NiCr corrosion products
Ni K-edge
▶
LLM Prompt
Sample Information
Material: FLiNaK with NiCr corrosion products
Electrolyte: FLiNaK
Cell Type: pyrolytic boron nitride (BN) cell
Sample-Specific Conditions
- Distance from foil: 0 mm
- Spatial scan of quenched salt exactly at the foil location (0 mm)
Measurement
We plan to measure the Ni K-edge XANES spectrum of this sample.
Questions
Based on all the information above:
1. Based on the sample conditions (spatial scan exactly at the foil location, 0 mm), what is the expected dominant Ni phase in the XANES spectrum, and why?
2. If performing Linear Combination Fitting (LCF) on the XANES spectrum obtained at this specific spatial point (0 mm), what reference spectrum is essential to include in the fit basis?
3. What is the oxidation state of the nickel species detected at the 0 mm location in this ex-situ measurement?
Ground Truth
Material: FLiNaK with NiCr corrosion products
Measurement: Ni K-edge ex-situ
Fit method: not reported
Phase fractions: (±10%)
| Phase | Fraction |
|---|---|
| metallic_nickel | 1.0 |
Fit basis (paper's reference spectra):
- metallic_nickel
Source evidence: Data source: text (from provided sample metadata)
Key reasoning: The measurement is a spatial scan of the quenched salt taken exactly at the foil location (0 mm). At this specific position, the beam probes the intact or residual foil itself, resulting in a pure metallic nickel phase rather than dissolved corrosion products.
Reasoning source: Sample description text
Scoring Rubric (total: 100 pts)
| Q | Type | Max | Question | Reference Answer | Scoring Criteria |
|---|---|---|---|---|---|
| q1 | reasoning | 40 | Based on the sample conditions (spatial scan exactly at the foil location, 0 mm), what is the expected dominant Ni phase in the XANES spectrum, and why? | The expected dominant Ni phase in the XANES spectrum is metallic nickel, which accounts for 100% of the signal. This is directly due to the sample conditions specifying a spatial scan of the quenched FLiNaK salt taken exactly at the 0 mm location. At this specific position, the X-ray beam probes the intact or residual foil itself rather than the dissolved NiCr corrosion products in the salt, resulting in a pure metallic nickel phase. | Full points for identifying metallic nickel as the sole phase (100% fraction) and explaining that at 0 mm, the beam is exactly at the foil location, thus probing the metallic foil rather than dissolved salt species. |
| q2 | identification | 30 | If performing Linear Combination Fitting (LCF) on the XANES spectrum obtained at this specific spatial point (0 mm), what reference spectrum is essential to include in the fit basis? | When performing Linear Combination Fitting (LCF) on this spectrum, it is essential to include a metallic nickel reference in the fit basis, which will account for a fraction of 1.0. This requirement stems from the sample conditions, specifically the spatial scan being conducted exactly at the foil location (0 mm). Because the beam is positioned directly on the foil, it probes the intact or residual metal rather than any dissolved corrosion products, meaning the resulting spectrum is entirely composed of pure metallic nickel. | Full points for stating metallic nickel (or Ni foil) is the essential reference spectrum. |
| q3 | identification | 30 | What is the oxidation state of the nickel species detected at the 0 mm location in this ex-situ measurement? | The oxidation state of the nickel species detected at the 0 mm location is 0. This oxidation state is observed because the spatial scan of the quenched FLiNaK salt was performed exactly at the foil location (0 mm distance). At this specific position, the beam probes the intact or residual foil rather than the oxidized, dissolved NiCr corrosion products present elsewhere in the salt, thereby capturing pure metallic nickel with an oxidation state of 0. | Full points for identifying the oxidation state as 0, corresponding to metallic nickel. |
Review
Expanding the PCET Thermochemistry of CpN3: N–H Bond Strengths of Metal-Free CpN3 Molecules and the Influence of Fe(CO)3 Coordination
BNL-NSLS-II-8-ID
Pure Phase
David S. Tresp et al.
DOI: 10.1021/acsorginorgau.5c00060
1 scenario
▶
#804
[(iPrCpN3)Fe(CO)3][PF6]
Fe
▶
LLM Prompt
Sample Information
Material: [(iPrCpN3)Fe(CO)3][PF6]
Oxidation State: +2
- FeII starting material
Measurement
We plan to measure the Fe XANES spectrum of this sample.
Questions
Based on all the information above:
1. Based on the provided sample information, what is the expected chemical compound and its oxidation state for this starting material?
2. If performing Linear Combination Fitting (LCF) to verify the purity of this sample, what is the primary reference spectrum that must be included in the fit basis?
3. What phase dominates this sample and what is its role in the context of the experiment?
Ground Truth
Compound: [(iPrCpN3)Fe(CO)3][PF6]
Oxidation state: +2
Measurement: not reported
Edge position: not reported
Spectral shape: not reported
Distinguishing features: not reported
Key reasoning: The sample is explicitly identified as the FeII starting material. Consequently, it is composed entirely of the [(iPrCpN3)Fe(CO)3][PF6] phase with an oxidation state of +2, representing the pure phase prior to any subsequent reactions.
Reasoning source: text
Scoring Rubric (total: 100 pts)
| Q | Type | Max | Question | Reference Answer | Scoring Criteria |
|---|---|---|---|---|---|
| q1 | identification | 40 | Based on the provided sample information, what is the expected chemical compound and its oxidation state for this starting material? | The expected chemical compound is [(iPrCpN3)Fe(CO)3][PF6] with an iron oxidation state of +2. The sample conditions explicitly identify this as the FeII starting material. Because it represents the pure phase prior to any subsequent reactions, it is composed entirely of the unreacted [(iPrCpN3)Fe(CO)3][PF6] complex, resulting in a phase fraction of 1.0. | Full points if the model correctly identifies the compound as [(iPrCpN3)Fe(CO)3][PF6] and the oxidation state as +2. |
| q2 | reasoning | 30 | If performing Linear Combination Fitting (LCF) to verify the purity of this sample, what is the primary reference spectrum that must be included in the fit basis? | If performing Linear Combination Fitting (LCF), the primary reference spectrum that must be included is [(iPrCpN3)Fe(CO)3][PF6]. The sample is explicitly identified as the FeII starting material, meaning it represents the pure phase prior to any subsequent reactions. Consequently, the expected phase fraction for [(iPrCpN3)Fe(CO)3][PF6] is 1.0, and this reference is required to verify that the sample is composed entirely of this +2 oxidation state complex. | Full points if the model states that the reference spectrum of pure [(iPrCpN3)Fe(CO)3][PF6] is required. |
| q3 | identification | 30 | What phase dominates this sample and what is its role in the context of the experiment? | The sample is completely dominated by the [(iPrCpN3)Fe(CO)3][PF6] phase, which accounts for a fraction of 1.0, and its role is to serve as the FeII starting material. Because the sample conditions specify it as the initial material, it represents the pure phase prior to any subsequent chemical reactions. Therefore, the sample is composed entirely of this single +2 oxidation state complex, making it the sole phase present for the Fe XANES measurement. | Full points if the model identifies [(iPrCpN3)Fe(CO)3][PF6] as the sole/dominant phase and notes its role as the FeII starting material. |
Review
Reduction of Propionic Acid over a Pd-Promoted ReO x /SiO2 Catalyst Probed by X‑ray Absorption Spectroscopy and Transient Kinetic Analysis
BNL-NSLS-II-8-ID
Catalyst
James
D. Kammert et al.
DOI: 10.1021/acssuschemeng.8b02820
2 scenarios
▶
#805
PdRe/SiO2
Pd K
▶
LLM Prompt
Sample Information
Material: PdRe/SiO2
Support: SiO2
Reaction Conditions: ambient, N2
Sample-Specific Conditions
- state: as-synthesized
- As-synthesized Pd-promoted Re/SiO2 catalyst
Measurement
We plan to measure the Pd K XANES spectrum of this sample.
Questions
Based on all the information above:
1. Based on the sample conditions, what is the expected dominant phase of Pd in the as-synthesized PdRe/SiO2 catalyst, and what reference spectra should be used for comparison to confirm this state?
2. Explain the physical reasoning for why Pd is found in this specific phase in the as-synthesized state prior to any reaction.
3. Describe the expected spectral shape of the Pd K-edge XANES for this as-synthesized sample. What distinguishing features would visually differentiate it from a reduced, metallic Pd sample?
Ground Truth
Material: PdRe/SiO2
Measurement: Pd K-edge, fluorescence mode, beamline B18 at Diamond Light Source
Fit method: qualitative comparison
Phase fractions: (±10%)
| Phase | Fraction |
|---|---|
| palladium_oxide | 1.0 |
Fit basis (paper's reference spectra):
- PdO powder
- Pd metal foil
Source evidence: Page 27, text and Figure 8
Key reasoning: The catalyst was synthesized by incipient wetness impregnation of metal salts and subsequently calcined in air at 773 K. This oxidative thermal treatment leads to the formation of palladium oxide on the silica support prior to any reducing pretreatment. The Pd K-edge XANES confirms that the Pd in the as-synthesized bimetallic PdRe sample is oxidic, matching the PdO standard.
Reasoning source: Page 9 (Catalyst synthesis) and Page 27 (X-ray Absorption Spectroscopy Results)
Scoring Rubric (total: 100 pts)
| Q | Type | Max | Question | Reference Answer | Scoring Criteria |
|---|---|---|---|---|---|
| q1 | identification | 30 | Based on the sample conditions, what is the expected dominant phase of Pd in the as-synthesized PdRe/SiO2 catalyst, and what reference spectra should be used for comparison to confirm this state? | The expected dominant phase of Pd in the as-synthesized PdRe/SiO2 catalyst is palladium oxide (PdO), which accounts for 100% of the Pd species. To confirm this state, the sample spectrum should be qualitatively compared against reference spectra for PdO powder and Pd metal foil. This fully oxidized phase is expected because the catalyst synthesis involves incipient wetness impregnation of metal salts followed by calcination in air at 773 K. This high-temperature oxidative thermal treatment converts the precursor salts into palladium oxide on the silica support prior to any reducing pretreatment or reaction under ambient N2. | Award 15 points for identifying PdO or oxidized Pd (+2) as the dominant phase. Award 15 points for mentioning PdO powder and Pd metal foil as the necessary reference spectra. |
| q2 | reasoning | 35 | Explain the physical reasoning for why Pd is found in this specific phase in the as-synthesized state prior to any reaction. | In the as-synthesized state, the Pd in the PdRe/SiO2 catalyst is found entirely as palladium oxide (PdO) with a +2 oxidation state. This specific phase arises because the catalyst is prepared via incipient wetness impregnation of metal salts and is subsequently calcined in air at 773 K. The high-temperature oxidative thermal treatment during calcination drives off the precursor ligands and fully oxidizes the palladium species on the silica support. Consequently, before any reducing pretreatment or exposure to reaction conditions, the sample remains stabilized in this fully oxidized PdO phase. | Award full points for explaining that the synthesis procedure involves calcination/heating in air (an oxidative treatment), which naturally leads to the formation of palladium oxide on the support before any reducing gases are introduced. |
| q3 | spectral | 35 | Describe the expected spectral shape of the Pd K-edge XANES for this as-synthesized sample. What distinguishing features would visually differentiate it from a reduced, metallic Pd sample? | The Pd K-edge XANES spectrum of the as-synthesized PdRe/SiO2 sample is expected to closely match that of a PdO powder standard. It will exhibit a prominent, sharp white line peak just above the absorption edge, along with an edge shift to higher energy. These spectral features arise because the sample was calcined in air at 773 K, resulting in a fully oxidized Pd(II) state on the silica support that possesses a high density of unoccupied states. This spectrum is visually distinguished from a reduced, metallic Pd sample, as metallic Pd lacks the strong, sharp white line peak and occurs at a lower edge energy. | Award 15 points for describing a prominent/strong white line peak characteristic of oxidized Pd. Award 20 points for stating that it is distinguished from metallic Pd by the presence of this sharp white line and a shift to higher edge energy. |
Review
#806
PdRe/SiO2
Pd K
▶
LLM Prompt
Sample Information
Material: PdRe/SiO2
Support: SiO2
Reaction Conditions: 433 K, 4% H2/N2, propionic acid
Sample-Specific Conditions
- state: reaction conditions (NP)
- PdRe/SiO2 catalyst under reaction conditions without pretreatment
Measurement
We plan to measure the Pd K XANES spectrum of this sample.
Questions
Based on all the information above:
1. Based on the reaction conditions (433 K, 4% H2/N2, propionic acid), what is the expected chemical state of Pd in the PdRe/SiO2 catalyst, and what physical evidence supports this conclusion?
2. Describe the expected Pd K-edge XANES spectral shape of this sample compared to the as-synthesized catalyst and standard reference materials.
3. What candidate reference spectra are needed to verify the oxidation state and phase composition of Pd in this sample during the in-situ experiment?
Ground Truth
Material: PdRe/SiO2
Measurement: Pd K-edge XANES in fluorescence mode at Diamond Light Source beamline B18
Fit method: Qualitative comparison to standards
Phase fractions: (±10%)
| Phase | Fraction |
|---|---|
| metallic_palladium | 1.0 |
Fit basis (paper's reference spectra):
- Pd metal foil
- PdO powder
Source evidence: Page 27, Figure 8, Table 2
Key reasoning: The Pd K-edge XANES confirmed that Pd in the bimetallic PdRe sample was oxidic after synthesis but was reduced to metal under reaction conditions. The spectrum for the sample under reaction conditions (NP) perfectly matches the Pd metal foil reference. EXAFS fitting further confirms this, showing a Pd-Pd coordination number of 8.1 and no Pd-O scattering paths.
Reasoning source: Section 3.4 X-ray Absorption Spectroscopy, Page 27
Scoring Rubric (total: 100 pts)
| Q | Type | Max | Question | Reference Answer | Scoring Criteria |
|---|---|---|---|---|---|
| q1 | reasoning | 35 | Based on the reaction conditions (433 K, 4% H2/N2, propionic acid), what is the expected chemical state of Pd in the PdRe/SiO2 catalyst, and what physical evidence supports this conclusion? | The expected chemical state of Pd in the PdRe/SiO2 catalyst is fully metallic (oxidation state 0) with a fraction of 1.0. This occurs because the reaction conditions, specifically the presence of a reducing 4% H2/N2 atmosphere at 433 K with propionic acid, completely reduce the initially oxidic Pd to metal even without prior pretreatment. The physical evidence supporting this conclusion is that the Pd K-edge XANES spectrum perfectly matches the Pd metal foil reference. Furthermore, EXAFS fitting confirms this metallic state by showing a Pd-Pd coordination number of 8.1 and a complete absence of Pd-O scattering paths. | Full points for identifying that Pd is completely reduced to metallic Pd (oxidation state 0) and mentioning that the XANES spectrum matches Pd metal foil and/or EXAFS shows only Pd-Pd coordination. |
| q2 | spectral | 35 | Describe the expected Pd K-edge XANES spectral shape of this sample compared to the as-synthesized catalyst and standard reference materials. | The expected Pd K-edge XANES spectrum for this sample will perfectly overlap with a Pd metal foil standard. Compared to the as-synthesized oxidic catalyst and a PdO standard, the spectrum will show a shift to lower energy and lack the intense white line characteristic of PdO. These spectral features arise because the reaction conditions (433 K, 4% H2/N2, propionic acid) completely reduce the initially oxidic Pd to a fully metallic state (oxidation state 0). Consequently, the structural and electronic properties of the sample reflect pure metallic palladium, resulting in the absence of the higher-energy edge shift and Pd-O scattering paths seen in the unreduced state. | Full points for stating the spectrum will perfectly overlap with a Pd metal foil standard and will lack the higher-energy edge shift and intense white line seen in the as-synthesized (oxidic/PdO) sample. |
| q3 | identification | 30 | What candidate reference spectra are needed to verify the oxidation state and phase composition of Pd in this sample during the in-situ experiment? | The candidate reference spectra needed to verify the oxidation state and phase composition are Pd metal foil and PdO powder. These specific references are required because the PdRe/SiO2 catalyst is initially oxidic after synthesis but undergoes complete reduction to a metallic state (fraction 1.0) under the reaction conditions of 433 K and 4% H2/N2 with propionic acid. By comparing the sample spectrum to these two standards, one can confirm the transition from PdO to metallic Pd. The absence of PdO features and the perfect match with the Pd foil reference demonstrate that the reducing environment successfully converted the Pd to an oxidation state of 0. | Full points for identifying Pd metal foil (to confirm the reduced state) and PdO powder (to rule out remaining unreduced precursor). |
Review
Competing Fe(II)-Induced Mineralization Pathways of Ferrihydrite
APS
Pure Phase
Colleen M. Hansel, Shawn G. Benner, Scott Fendorf
DOI: 10.1021/es050666z
4 scenarios
▶
#807
Magnetite
Fe K
▶
LLM Prompt
Sample Information
Material: Magnetite
- Magnetite reference phase formed from Fe(II)-induced mineralization of ferrihydrite
Measurement
We plan to measure the Fe K XANES spectrum of this sample.
Questions
Based on all the information above:
1. Based on the provided sample conditions, what pure iron-bearing phase is expected to be formed?
2. What specific chemical process was used to generate this reference phase according to the sample description?
3. If analyzing a heterogeneous environmental sample via XANES linear combination fitting (LCF), how would the spectrum of this specific sample be utilized?
Ground Truth
Compound: Magnetite
Oxidation state: not reported
Measurement: Fe K-edge XANES
Edge position: not reported
Spectral shape: not reported
Distinguishing features: not reported
Key reasoning: The sample is identified as a pure magnetite reference phase. It is formed specifically through the Fe(II)-induced mineralization of ferrihydrite.
Reasoning source: Sample description
Scoring Rubric (total: 100 pts)
| Q | Type | Max | Question | Reference Answer | Scoring Criteria |
|---|---|---|---|---|---|
| q1 | identification | 40 | Based on the provided sample conditions, what pure iron-bearing phase is expected to be formed? | Based on the provided sample conditions, the expected pure iron-bearing phase is magnetite at a fraction of 1.0. This specific phase arises because the sample was synthesized as a pure reference material through the Fe(II)-induced mineralization of ferrihydrite. This controlled mineralization process ensures the complete conversion of the ferrihydrite precursor into a pure magnetite phase. Consequently, the resulting Fe K-edge XANES spectrum will exclusively reflect the properties of pure magnetite. | Full points for correctly identifying Magnetite as the expected phase. |
| q2 | reasoning | 30 | What specific chemical process was used to generate this reference phase according to the sample description? | According to the sample description, the reference phase was generated through the Fe(II)-induced mineralization of ferrihydrite. This specific chemical process drives the transformation of the ferrihydrite precursor into a pure magnetite phase with a fraction of 1.0. Because the sample was prepared specifically as a reference material using this controlled mineralization pathway, it yields an unmixed magnetite product. Therefore, its Fe K-edge XANES spectrum serves as an accurate, pure representation of magnetite formed under these exact conditions. | Full points for stating that the phase was formed via Fe(II)-induced mineralization of ferrihydrite. |
| q3 | reasoning | 30 | If analyzing a heterogeneous environmental sample via XANES linear combination fitting (LCF), how would the spectrum of this specific sample be utilized? | In XANES linear combination fitting (LCF), the Fe K-edge spectrum of this sample would be utilized as a pure magnetite end-member reference standard. This application is possible because the sample is identified as a pure magnetite phase (fraction of 1.0) generated specifically through the Fe(II)-induced mineralization of ferrihydrite. By using this pure reference spectrum, researchers can accurately fit and quantify the fraction of magnetite present in more complex, heterogeneous environmental samples. The controlled synthesis conditions ensure the spectrum perfectly represents pure magnetite without interference from other iron-bearing phases. | Full points for explaining that it would serve as a pure reference spectrum (or basis function) for Magnetite in the LCF model. |
Review
#808
Ferrihydrite
Fe K
▶
LLM Prompt
Sample Information
Material: Ferrihydrite
Oxidation State: Fe(III)
- Ferrihydrite precursor mineral
Measurement
We plan to measure the Fe K XANES spectrum of this sample.
Questions
Based on all the information above:
1. What is the primary phase present in this precursor mineral sample?
2. Based on the sample description, what is the expected oxidation state of iron in this precursor mineral?
3. If performing Linear Combination Fitting (LCF) on the Fe K-edge XANES spectrum of this sample, what reference spectrum is essential to include as the basis?
Ground Truth
Compound: Ferrihydrite
Oxidation state: Fe(III)
Measurement: Fe K-edge
Edge position: not reported
Spectral shape: not reported
Distinguishing features: not reported
Key reasoning: The sample is identified strictly as a pure Ferrihydrite precursor mineral.
Reasoning source: not reported
Scoring Rubric (total: 100 pts)
| Q | Type | Max | Question | Reference Answer | Scoring Criteria |
|---|---|---|---|---|---|
| q1 | identification | 30 | What is the primary phase present in this precursor mineral sample? | The primary phase present in this sample is ferrihydrite, which accounts for a fraction of 1.0. This phase is expected because the sample conditions explicitly define the material as a ferrihydrite precursor mineral. As the key reasoning states, the sample is identified strictly as a pure ferrihydrite precursor mineral. Consequently, no other secondary phases are present, making ferrihydrite the sole constituent. | Award full points for identifying Ferrihydrite as the sole or dominant phase. |
| q2 | prediction | 30 | Based on the sample description, what is the expected oxidation state of iron in this precursor mineral? | The expected oxidation state of iron in this precursor mineral is Fe(III). This state is expected because the sample is composed of ferrihydrite, which is explicitly listed in the sample conditions as containing Fe(III). Since the sample is identified strictly as a pure ferrihydrite precursor mineral, the entire iron content will exhibit this Fe(III) oxidation state without contributions from other valence states. | Award full points for correctly stating Fe(III). |
| q3 | reasoning | 40 | If performing Linear Combination Fitting (LCF) on the Fe K-edge XANES spectrum of this sample, what reference spectrum is essential to include as the basis? | When performing Linear Combination Fitting (LCF) on the Fe K-edge XANES spectrum, a ferrihydrite reference spectrum is the essential basis to include. This is required because the sample conditions specify the material is a ferrihydrite precursor mineral. According to the key reasoning, the sample is identified strictly as a pure ferrihydrite precursor mineral, resulting in a ferrihydrite fraction of 1.0. Therefore, the ferrihydrite reference alone is sufficient and necessary to model the entire spectral shape. | Award full points for specifying Ferrihydrite as the necessary reference spectrum. |
Review
#809
Goethite
Fe K
▶
LLM Prompt
Sample Information
Material: Goethite
- Goethite precipitation product
Measurement
We plan to measure the Fe K XANES spectrum of this sample.
Questions
Based on all the information above:
1. Given the sample is described as a precipitation product, what phase is expected to completely dominate the composition?
2. If you were to analyze the XANES spectrum of this sample using Linear Combination Fitting (LCF), what primary reference spectrum must be included in your fit basis?
3. Based on the provided sample conditions, explain why this specific phase composition is expected.
Ground Truth
Compound: Goethite
Oxidation state: not reported
Measurement: Fe K edge; mode and beamline not reported
Edge position: not reported
Spectral shape: not reported
Distinguishing features: not reported
Key reasoning: The sample is explicitly described as a Goethite precipitation product, indicating it consists entirely of a pure Goethite phase.
Reasoning source: Sample description
Scoring Rubric (total: 100 pts)
| Q | Type | Max | Question | Reference Answer | Scoring Criteria |
|---|---|---|---|---|---|
| q1 | identification | 40 | Given the sample is described as a precipitation product, what phase is expected to completely dominate the composition? | The phase expected to completely dominate the composition is Goethite, comprising 100% (fraction of 1.0) of the sample. This composition is expected because the sample conditions explicitly describe the material as a Goethite precipitation product. The precipitation process directly yields this specific iron phase. Consequently, the sample consists entirely of pure Goethite without the presence of other competing phases. | Full points if the response correctly identifies Goethite as the sole/dominant phase. |
| q2 | prediction | 30 | If you were to analyze the XANES spectrum of this sample using Linear Combination Fitting (LCF), what primary reference spectrum must be included in your fit basis? | If analyzing the Fe K-edge XANES spectrum using Linear Combination Fitting (LCF), the primary reference spectrum that must be included in your fit basis is Goethite. This is required because the sample conditions explicitly describe the material as a Goethite precipitation product. As a result, the sample consists entirely of a pure Goethite phase, representing a fraction of 1.0. Therefore, the Goethite reference is essential and sufficient to fully capture the spectral features of this specific precipitation product. | Full points if Goethite is explicitly named as the required reference spectrum. |
| q3 | reasoning | 30 | Based on the provided sample conditions, explain why this specific phase composition is expected. | The expected phase composition for this sample is 100% Goethite (fraction of 1.0). This specific composition is expected because the sample conditions explicitly describe the material as a Goethite precipitation product. This description indicates that the precipitation process directly and exclusively formed this specific iron phase. Consequently, the mechanism yields a material that consists entirely of a pure Goethite phase, requiring only Goethite to represent its composition. | Full points if the answer connects the explicit description of the sample as a 'Goethite precipitation product' to the expectation of a pure Goethite phase. |
Review
#810
Lepidocrocite
Fe K
▶
LLM Prompt
Sample Information
Material: Lepidocrocite
- Lepidocrocite precipitation product
Measurement
We plan to measure the Fe K XANES spectrum of this sample.
Questions
Based on all the information above:
1. What is the expected dominant material in this precipitation product?
2. What reference spectrum is essential for analyzing the Fe K-edge XANES data of this specific sample?
3. Based on the sample description, why is only a single reference phase needed for this analysis?
Ground Truth
Compound: not reported
Oxidation state: not reported
Measurement: Fe K-edge, mode and beamline not reported
Edge position: not reported
Spectral shape: not reported
Distinguishing features: not reported
Key reasoning: The sample is explicitly described as a lepidocrocite precipitation product. No other phases are mentioned, indicating it is treated as a pure phase.
Reasoning source: Sample description
Scoring Rubric (total: 100 pts)
| Q | Type | Max | Question | Reference Answer | Scoring Criteria |
|---|---|---|---|---|---|
| q1 | identification | 30 | What is the expected dominant material in this precipitation product? | The expected dominant material in this precipitation product is lepidocrocite. The sample conditions explicitly describe the material as a lepidocrocite precipitation product. Because no other phases or impurities are mentioned in the sample description, the precipitation process is understood to yield a pure phase, resulting in an expected lepidocrocite fraction of 1.0. | Full credit for identifying Lepidocrocite as the dominant/sole material. |
| q2 | identification | 30 | What reference spectrum is essential for analyzing the Fe K-edge XANES data of this specific sample? | A lepidocrocite reference spectrum is essential for analyzing the Fe K-edge XANES data of this sample. The sample is explicitly identified in the conditions as a lepidocrocite precipitation product. Since no other phases are mentioned, the material is treated as a pure phase, meaning only the lepidocrocite reference is needed to fully account for the measured XANES spectrum. | Full credit for stating that a Lepidocrocite reference spectrum is required. |
| q3 | reasoning | 40 | Based on the sample description, why is only a single reference phase needed for this analysis? | Only a single reference phase is needed because the sample is treated as a pure phase of lepidocrocite with a fraction of 1.0. The provided sample conditions explicitly describe the material solely as a lepidocrocite precipitation product. Because there is no mention of secondary phases or mixed products, the logical outcome is that the precipitation yielded a pure material, making a single lepidocrocite reference sufficient for the analysis. | Full credit for explaining that the sample is explicitly described as a pure lepidocrocite precipitation product, with no other phases indicated. |
Review
Active Reaction Control of Cu Redox State Based on Real-Time Feedback from In Situ Synchrotron Measurements
APS
Synthesis
Yevgeny Rakita et al.
DOI: 10.1021/jacs.0c09418
3 scenarios
▶
#811
Cu supported on gamma-Al2O3 (0.6 wt%)
Cu K-edge
▶
LLM Prompt
Sample Information
Material: Cu supported on gamma-Al2O3 (0.6 wt%)
Method: vapor-deposition
Temperature C: 300
Atmosphere: H2:O2 ratio of ~10:1
Sample-Specific Conditions
- Autonomous control target: Average oxidation state ~1+
- Final stable state achieved by autonomous control algorithm targeting average oxidation state of 1+
Preparation
- Cu dispersed on high surface area gamma-Al2O3 (0.6 wt%) using a vapor-deposition process that avoids non-innocent ligands. Loaded into reaction environment at 300 °C. Algorithm controlled delay between 1 s pulses of oxidizing gas in a reducing gas flow.
Measurement
We plan to measure the Cu K-edge XANES spectrum of this sample.
Questions
Based on all the information above:
1. What candidate reference spectra are needed for linear combination fitting of the Cu K-edge XANES data for this sample during the autonomous control experiment?
Ground Truth
Material: Cu supported on gamma-Al2O3 (0.6 wt%)
Measurement: Cu K-edge XAS at beamline 9-BM of the Advanced Photon Source
Fit method: linear combination fitting
Phase fractions: (±10%)
| Phase | Fraction |
|---|---|
| Cu0 | 0.5 |
| Cu1+ | 0.2 |
| Cu2+ | 0.3 |
Fit basis (paper's reference spectra):
- Cu0 reference spectrum
- Cu1+ reference spectrum
- Cu2+ reference spectrum
Source evidence: Page 2, right column, text; Page 3, left column, text
Key reasoning: The autonomous control algorithm targeted an average Cu oxidation state of 1+ at 300 °C by adjusting the delay between pulses of oxidizing gas in a reducing gas flow. This is challenging as it simultaneously balances Cu0 oxidation and Cu2+ reduction. The final stable state corresponded to a H2:O2 ratio of ~10:1, yielding an average oxidation state of ~0.9, which corresponds to a Cu0:Cu1+:Cu2+ distribution of 5:2:3. The deviation from the exact target of 1+ was limited by the variability in the partial pressure of the oxidant and hysteresis in the oxidation-reduction reactions.
Reasoning source: Page 2, right column and Page 3, left column
Scoring Rubric (total: 100 pts)
| Q | Type | Max | Question | Reference Answer | Scoring Criteria |
|---|---|---|---|---|---|
| q1 | identification | 100 | What candidate reference spectra are needed for linear combination fitting of the Cu K-edge XANES data for this sample during the autonomous control experiment? | The candidate reference spectra needed for linear combination fitting of the Cu K-edge XANES data are Cu0, Cu1+, and Cu2+ reference spectra. These specific phases are required because the autonomous control algorithm targets an average Cu oxidation state of 1+ at 300 °C by adjusting the delay between pulses of oxidizing gas in a reducing gas flow. Achieving this target state involves simultaneously balancing the oxidation of Cu0 and the reduction of Cu2+, ensuring all three oxidation states are present in the sample. Ultimately, the final stable state at an H2:O2 ratio of ~10:1 yields an average oxidation state of ~0.9, consisting of a mixture of these three phases due to hysteresis in the oxidation-reduction reactions and variability in the oxidant partial pressure. | Full points for identifying Cu0, Cu1+, and Cu2+ reference spectra as the necessary basis components. |
Review
#812
Cu supported on gamma-Al2O3 (0.6 wt%)
Cu K-edge
▶
LLM Prompt
Sample Information
Material: Cu supported on gamma-Al2O3 (0.6 wt%)
Method: vapor-deposition
Temperature C: 350
Atmosphere: reducing gas
Sample-Specific Conditions
- Temperature: 350 °C
- Variable temperature reduction of fully oxidized system at 350 °C
Preparation
- Cu dispersed on high surface area gamma-Al2O3 (0.6 wt%) using a vapor-deposition process. Heated under reducing gas atmosphere.
Measurement
We plan to measure the Cu K-edge XANES spectrum of this sample.
Questions
Based on all the information above:
1. What candidate reference spectra (oxidation states) are needed to perform linear combination fitting of the Cu K-edge XANES spectrum for this supported catalyst under these reducing conditions?
2. Estimate the relative phase fractions of the copper species present in the catalyst after reduction at 350 °C.
3. Describe the reaction pathway and physical reasoning that leads to this specific mixture of copper oxidation states at 350 °C, rather than complete reduction to metallic copper.
Ground Truth
Material: Cu supported on high surface area γ-Al2O3 (0.6 wt%)
Measurement: Cu K-edge XANES at beamline 9-BM of the Advanced Photon Source
Fit method: linear combination fitting
Phase fractions: (±10%)
| Phase | Fraction |
|---|---|
| Cu0 | 0.6 |
| Cu1+ | 0.2 |
| Cu2+ | 0.2 |
Fit basis (paper's reference spectra):
- Cu0 reference spectrum
- Cu1+ reference spectrum
- Cu2+ reference spectrum
Source evidence: Figure 2a and page 2 text
Key reasoning: Heating the fully oxidized system under a reducing gas atmosphere drives the reduction of Cu2+ to Cu1+ and Cu0. While Cu1+ formation dominates initially and peaks at 275 °C, at higher temperatures like 350 °C, it diminishes as it transforms into Cu0. The reduction rate slows down at these higher temperatures, resulting in a mixed state where the ratio of Cu0 to Cu1+ remains stable at approximately 3:1, with residual Cu2+ still present.
Reasoning source: Page 2, variable temperature reduction discussion
Scoring Rubric (total: 100 pts)
| Q | Type | Max | Question | Reference Answer | Scoring Criteria |
|---|---|---|---|---|---|
| q1 | identification | 20 | What candidate reference spectra (oxidation states) are needed to perform linear combination fitting of the Cu K-edge XANES spectrum for this supported catalyst under these reducing conditions? | The required reference spectra for linear combination fitting are Cu0, Cu1+, and Cu2+. These specific phases are expected because the sample is a fully oxidized Cu/gamma-Al2O3 (0.6 wt%) catalyst undergoing reduction under a reducing gas atmosphere at 350 °C. Heating drives the sequential reduction of the initial Cu2+ state into Cu1+ and subsequently into Cu0. Because the reduction rate slows down at higher temperatures like 350 °C, the reduction is incomplete, necessitating all three oxidation states to accurately model the resulting mixed-phase spectrum. | Full credit for identifying that reference spectra for Cu0, Cu1+, and Cu2+ (or metallic copper, cuprite, and tenorite) are required. |
| q2 | quantification | 40 | Estimate the relative phase fractions of the copper species present in the catalyst after reduction at 350 °C. | The estimated relative phase fractions are 60% Cu0, 20% Cu1+, and 20% Cu2+, with an uncertainty of 10%. These specific values result from the variable temperature reduction of the fully oxidized 0.6 wt% Cu/gamma-Al2O3 catalyst at 350 °C in a reducing gas. While Cu1+ formation peaks at a lower temperature of 275 °C, at 350 °C it largely transforms into Cu0, establishing a stable Cu0 to Cu1+ ratio of approximately 3:1. The remaining 20% consists of residual Cu2+ because the overall reduction rate slows down at this higher temperature, preventing complete conversion to metallic copper. | Full credit for estimating approximately 60% Cu0, 20% Cu1+, and 20% Cu2+. Partial credit if the dominant phase is correctly identified as Cu0 with significant remaining fractions of Cu1+ and Cu2+. |
| q3 | reasoning | 40 | Describe the reaction pathway and physical reasoning that leads to this specific mixture of copper oxidation states at 350 °C, rather than complete reduction to metallic copper. | The reaction pathway begins with a fully oxidized Cu/gamma-Al2O3 (0.6 wt%) system that undergoes sequential reduction from Cu2+ to Cu1+ and finally to Cu0 when heated under a reducing gas. Initially, the formation of Cu1+ dominates the process, peaking at 275 °C. As the temperature reaches 350 °C, the Cu1+ intermediate diminishes as it further transforms into Cu0. Complete reduction to metallic copper is not achieved because the reduction rate slows down at these higher temperatures. This kinetic behavior results in a stable mixed-phase state where the Cu0 to Cu1+ ratio remains at approximately 3:1, leaving a significant fraction of unreduced residual Cu2+. | Full credit for explaining that Cu2+ reduces to Cu1+ and Cu0, with Cu1+ peaking at lower temperatures (~275 °C) before transforming to Cu0. Must mention that the reduction rate slows at higher temperatures, leaving a mixed state where the Cu0 to Cu1+ ratio stabilizes at ~3:1. |
Review
#813
Cu supported on gamma-Al2O3 (0.6 wt%)
Cu K-edge
▶
LLM Prompt
Sample Information
Material: Cu supported on gamma-Al2O3 (0.6 wt%)
Method: vapor-deposition
Temperature C: 275
Atmosphere: reducing gas
Sample-Specific Conditions
- Temperature: 275 °C
- Variable temperature reduction of fully oxidized system at 275 °C (maximum Cu1+)
Preparation
- Cu dispersed on high surface area gamma-Al2O3 (0.6 wt%) using a vapor-deposition process. Heated under reducing gas atmosphere.
Measurement
We plan to measure the Cu K-edge XANES spectrum of this sample.
Questions
Based on all the information above:
1. What candidate reference spectra are needed to model the Cu K-edge XANES data for this sample using linear combination fitting?
2. Based on the provided conditions (reduction of fully oxidized Cu/Al2O3 at 275 °C, which corresponds to the maximum Cu1+ concentration), estimate the phase fractions of the copper species present.
3. Explain the physical reasoning for the expected phase distribution at 275 °C during the temperature-programmed reduction, specifically addressing the formation and consumption of the intermediate oxidation state.
Ground Truth
Material: Cu supported on high surface area γ-Al2O3 (0.6 wt%)
Measurement: Cu K-edge XAS, beamline 9-BM of the Advanced Photon Source
Fit method: Linear combination fitting (LCF)
Phase fractions: (±10%)
| Phase | Fraction |
|---|---|
| Cu0 | 0.2 |
| Cu1+ | 0.4 |
| Cu2+ | 0.4 |
Fit basis (paper's reference spectra):
- Cu2+ reference
- Cu1+ reference
- Cu0 reference
Source evidence: Figure 2a, page 2
Key reasoning: Heating the fully oxidized system under a reducing gas atmosphere initiates Cu2+ reduction at 245 °C, forming both Cu1+ and Cu0. The reduction is initially dominated by the formation of Cu1+, while Cu0 formation is slower. The proportion of Cu1+ reaches its maximum at 275 °C (around 40%), after which it diminishes as it presumably transforms into Cu0 at higher temperatures.
Reasoning source: Page 2, left column, paragraph 4
Scoring Rubric (total: 100 pts)
| Q | Type | Max | Question | Reference Answer | Scoring Criteria |
|---|---|---|---|---|---|
| q1 | identification | 20 | What candidate reference spectra are needed to model the Cu K-edge XANES data for this sample using linear combination fitting? | To model the Cu K-edge XANES data for this sample using linear combination fitting, reference spectra for Cu2+, Cu1+, and Cu0 are required. These specific reference phases are needed because the sample is initially a fully oxidized Cu/gamma-Al2O3 system that is being heated under a reducing gas atmosphere. As the temperature increases, the initial Cu2+ begins to reduce at 245 °C, forming both Cu1+ and Cu0 species. At the specific measurement temperature of 275 °C, the reduction process is incomplete, meaning a mixture of the unreacted Cu2+ state, the intermediate Cu1+ state, and the fully reduced Cu0 state will all coexist in the sample. | Award 20 points for correctly identifying that reference spectra for Cu0, Cu1+, and Cu2+ are required to model the intermediate reduction states. |
| q2 | quantification | 40 | Based on the provided conditions (reduction of fully oxidized Cu/Al2O3 at 275 °C, which corresponds to the maximum Cu1+ concentration), estimate the phase fractions of the copper species present. | The estimated phase fractions for the copper species at 275 °C are 40% Cu2+, 40% Cu1+, and 20% Cu0, with an uncertainty of 10%. These specific values result from heating the fully oxidized Cu/gamma-Al2O3 (0.6 wt%) system under a reducing gas atmosphere, which initiates the reduction of Cu2+ at 245 °C. The reduction process is initially dominated by the formation of the intermediate Cu1+ state, while the formation of fully reduced Cu0 is much slower. Consequently, at exactly 275 °C, the proportion of Cu1+ accumulates to its maximum of approximately 40% before it begins to transform into Cu0 at higher temperatures, leaving the remaining balance as 40% unreacted Cu2+ and 20% Cu0. | Award 15 points for estimating Cu1+ at ~40% (±10%), 15 points for estimating Cu2+ at ~40% (±10%), and 10 points for estimating Cu0 at ~20% (±10%). |
| q3 | reasoning | 40 | Explain the physical reasoning for the expected phase distribution at 275 °C during the temperature-programmed reduction, specifically addressing the formation and consumption of the intermediate oxidation state. | The expected phase distribution of 40% Cu2+, 40% Cu1+, and 20% Cu0 arises from the temperature-dependent reduction kinetics of the fully oxidized Cu/gamma-Al2O3 sample under a reducing gas atmosphere. When heated, the initial Cu2+ species begins to reduce at 245 °C, forming both Cu1+ and Cu0. The reaction is initially dominated by the rapid formation of the intermediate Cu1+ state, whereas the subsequent formation of Cu0 is much slower. As a result, at 275 °C, the concentration of the Cu1+ intermediate accumulates to its maximum of 40%. At temperatures higher than 275 °C, this Cu1+ fraction diminishes as it transforms into Cu0, explaining why this specific temperature captures the peak intermediate state alongside residual Cu2+ and newly formed Cu0. | Award 15 points for explaining that reduction of the fully oxidized Cu2+ system forms both Cu1+ and Cu0. Award 15 points for noting that Cu1+ formation initially dominates and reaches a maximum population at 275 °C. Award 10 points for stating that above this temperature, the Cu1+ proportion diminishes as it transforms into Cu0. |
Review
Surface-Promoted Evolution of Ru-bda Coordination Oligomers Boosts the Efficiency of Water Oxidation Molecular Anodes
APS
Catalyst
Marcos Gil-Sepulcre et al.
DOI: 10.1021/jacs.1c04738
2 scenarios
▶
#814
{[RuII(bda-κ-N2O2)(4,4'-bpy)]10(4,4'-bpy)}
Ru K-edge
▶
LLM Prompt
Sample Information
Material: {[RuII(bda-κ-N2O2)(4,4'-bpy)]10(4,4'-bpy)}
Sample-Specific Conditions
- State: Powder
- Ru-bda oligomer powder
Measurement
We plan to measure the Ru K-edge XANES spectrum of this sample.
Questions
Based on all the information above:
1. What is the expected oxidation state of the Ru center in this powder sample, and what specific XANES feature would indicate this?
2. Describe the expected spectral shape for this sample, including the approximate edge position and the energy of the white line peak.
3. How would the edge position of this sample distinguish it from a Ru(IV) reference material such as RuO2?
Ground Truth
Material: {[RuII(bda-κ-N2O2)(4,4'-bpy)]10(4,4'-bpy)}
Measurement: Ru K-edge XANES, ex-situ, Advanced Photon Source (Beamline 9 μB-B)
Fit method: not applicable
Phase fractions:
| Phase | Fraction |
|---|---|
| {[RuII(bda-κ-N2O2)(4,4'-bpy)]10(4,4'-bpy)} | 1.0 |
Source evidence: Figure 2a, page 3
Key reasoning: The sample is synthesized and measured as a pure oligomer powder. The XANES half-edge energy confirms that the Ru center is in oxidation state II. EXAFS analysis further confirms the expected octahedral coordination environment with two Ru-Nbda and four Ru-N/O bonds.
Reasoning source: Page 3, RESULTS AND DISCUSSION
Scoring Rubric (total: 100 pts)
| Q | Type | Max | Question | Reference Answer | Scoring Criteria |
|---|---|---|---|---|---|
| q1 | identification | 30 | What is the expected oxidation state of the Ru center in this powder sample, and what specific XANES feature would indicate this? | The expected oxidation state of the Ru center is II, which is indicated by a specific XANES half-edge energy position at 22123 eV. This oxidation state is expected because the sample is synthesized and measured as a pure {[RuII(bda-κ-N2O2)(4,4'-bpy)]10(4,4'-bpy)} oligomer powder. The pure composition (fraction 1.0) ensures the spectrum reflects only this Ru(II) species, while EXAFS analysis further confirms the expected octahedral coordination environment with two Ru-Nbda and four Ru-N/O bonds. | Award full points if the answer correctly identifies the oxidation state as Ru(II) and mentions the half-edge energy (approx 22123 eV) as the indicator. |
| q2 | spectral | 40 | Describe the expected spectral shape for this sample, including the approximate edge position and the energy of the white line peak. | The expected spectral shape features a sharp absorption edge at 22123 eV and a prominent white line peak at approximately 22140 eV with a normalized intensity of ~1.1. These specific features arise because the sample is prepared and measured as a pure {[RuII(bda-κ-N2O2)(4,4'-bpy)]10(4,4'-bpy)} oligomer powder. The half-edge energy of 22123 eV directly confirms the Ru(II) oxidation state inherent to this synthesized material. Additionally, the overall spectral shape reflects the complex's specific octahedral coordination environment, which consists of two Ru-Nbda and four Ru-N/O bonds. | Award full points if the answer describes a sharp absorption edge at ~22123 eV and a white line peak at ~22140 eV with an intensity of ~1.1. |
| q3 | reasoning | 30 | How would the edge position of this sample distinguish it from a Ru(IV) reference material such as RuO2? | The edge position of this sample is located at 22123 eV, which is distinctly lower than the edge position of a Ru(IV) reference like RuO2, which appears at approximately 22127 eV. This energy difference occurs because the sample is synthesized and measured as a pure {[RuII(bda-κ-N2O2)(4,4'-bpy)]10(4,4'-bpy)} oligomer powder. The half-edge energy of 22123 eV is characteristic of the Ru(II) oxidation state present in this specific complex, which distinguishes it from higher oxidation state species like Ru(IV). The pure nature of the sample, confirmed by EXAFS showing the expected octahedral coordination with two Ru-Nbda and four Ru-N/O bonds, ensures the edge position strictly reflects the Ru(II) center without higher-valent impurities. | Award full points if the answer explains that the Ru(II) sample has a lower half-edge energy (22123 eV) compared to the Ru(IV) species like RuO2, which would appear at a higher energy (~22127 eV). |
Review
#815
{cis-[RuII(H2O)2(bda-κ-NO)(4,4'-bpy)]10(4,4'-bpy)}
Ru K-edge
▶
LLM Prompt
Sample Information
Material: {cis-[RuII(H2O)2(bda-κ-NO)(4,4'-bpy)]10(4,4'-bpy)}
Support: CNT
Sample-Specific Conditions
- State: Activated
- Activated Ru-bda oligomer on CNTs
Measurement
We plan to measure the Ru K-edge XANES spectrum of this sample.
Questions
Based on all the information above:
1. Based on the sample conditions (electrochemical activation via repetitive CV scans), what structural transformation occurs to the initial Ru-bda oligomer on CNTs, and what is the resulting oxidation state of Ru observed in the XANES spectrum?
2. Describe the expected Ru K-edge XANES spectral features (edge position and shape) for this activated sample. What key feature distinguishes it from a common decomposition product like RuO2?
Ground Truth
Material: {cis-[RuII(H2O)2(bda-κ-NO)(4,4'-bpy)]10(4,4'-bpy)} on CNT
Measurement: Ru K-edge XANES
Fit method: not reported
Phase fractions:
| Phase | Fraction |
|---|---|
| {cis-[RuII(H2O)2(bda-κ-NO)(4,4'-bpy)]10(4,4'-bpy)} | 1.0 |
Source evidence: Figure 2a and page 4
Key reasoning: Repetitive CV scans of the initial 10@CNT sample cause a rearrangement of the coordination environment on the graphitic surface. The tetradentate bda ligands change their coordination mode from κ-N2O2 to κ-NO, allowing the introduction of two aquo ligands to form 10'(H2O)2@CNT. The Ru center remains in oxidation state II, as indicated by the half-edge energy in the XANES spectrum.
Reasoning source: RESULTS AND DISCUSSION: Surface-Promoted Transformation of 10@CNT to 10'(H2O)2@CNT (page 4)
Scoring Rubric (total: 100 pts)
| Q | Type | Max | Question | Reference Answer | Scoring Criteria |
|---|---|---|---|---|---|
| q1 | reasoning | 50 | Based on the sample conditions (electrochemical activation via repetitive CV scans), what structural transformation occurs to the initial Ru-bda oligomer on CNTs, and what is the resulting oxidation state of Ru observed in the XANES spectrum? | Based on the sample conditions involving electrochemical activation via repetitive CV scans, the initial Ru-bda oligomer on CNTs undergoes a rearrangement of its coordination environment on the graphitic surface. Specifically, the tetradentate bda ligands change their coordination mode from κ-N2O2 to κ-NO. This structural transformation allows the introduction of two aquo ligands to form the activated {cis-[RuII(H2O)2(bda-κ-NO)(4,4'-bpy)]10(4,4'-bpy)} species on the CNT support. Despite this ligand rearrangement, the Ru center remains in oxidation state II. This is confirmed by the XANES spectrum, where the half-edge energy remains characteristic of Ru(II) rather than shifting to a higher oxidation state. | The answer must explain that the bda ligands change their coordination mode (from κ-N2O2 to κ-NO) to allow the coordination of aquo ligands, and correctly identify that the Ru oxidation state remains II. |
| q2 | spectral | 50 | Describe the expected Ru K-edge XANES spectral features (edge position and shape) for this activated sample. What key feature distinguishes it from a common decomposition product like RuO2? | The expected Ru K-edge XANES spectrum for the activated sample exhibits an absorption edge characteristic of Ru(II) with a prominent white line and a half-edge energy located at approximately 22123 eV. These specific spectral features arise because the electrochemical activation only causes a ligand rearrangement (bda changing to κ-NO coordination to accommodate two aquo ligands) while preserving the Ru(II) oxidation state. The key distinguishing feature is this half-edge energy of ~22123 eV, which clearly differentiates the intact molecular catalyst from a common decomposition product like RuO2, which exhibits a higher Ru(IV) edge energy of ~22127 eV. The lack of spectral change after catalysis further confirms the molecular integrity of the sample and rules out decomposition to RuO2. | The answer must mention an edge position around 22123 eV (characteristic of Ru(II)), the presence of a white line, and state that the edge energy is significantly lower than that of RuO2 (which contains Ru(IV)), thereby distinguishing the molecular catalyst from the oxide. |
Review
A Holistic Approach for Elucidating Local Structure, Dynamics, and Speciation in Molten Salts with High Structural Disorder
BNL-NSLS-II-8-ID
Synthesis
Santanu Roy et al.
DOI: 10.1021/jacs.1c06742
4 scenarios
▶
#816
Ni(II) in molten ZnCl2-KCl
Ni K
▶
LLM Prompt
Sample Information
Material: Ni(II) in molten ZnCl2-KCl
Method: melt synthesis
Precursors: KCl, ZnCl2, NiCl2 (0.443 mol%)
Temperature C: 400
Atmosphere: dynamic vacuum (during synthesis)
Sample-Specific Conditions
- Temperature and Composition: 400 °C, 45.3 mol% KCl
- Ni(II) in 45.3 mol% KCl - 54.7 mol% ZnCl2 melt at 400 °C
Preparation
- KCl was dried under dynamic vacuum at 800 °C for 15 minutes. ZnCl2 was purified via fractional distillation. The required components were melted together under dynamic high vacuum at 600 °C. 0.443 mol % of NiCl2 was added to the base salt mixture and fused at 600 °C under dynamic vacuum. The sample was measured in a quartz capillary heated to 400 °C.
Measurement
We plan to measure the Ni K XANES spectrum of this sample.
Questions
Based on all the information above:
1. What candidate coordination states (basis functions) should be considered when performing linear combination fitting of the Ni K-edge absorption fine structure for this molten salt system?
2. Estimate the relative fractions of the different Ni(II) coordination states in the 45.3 mol% KCl - 54.7 mol% ZnCl2 melt at 400 °C.
3. Explain the physical reasoning for the coexistence of these specific coordination states at 400 °C and how their simultaneous presence impacts the observed X-ray absorption fine structure signal.
Ground Truth
Material: Ni(II) in molten ZnCl2-KCl (45.3 mol% KCl)
Measurement: Ni K-edge fluorescence mode at ISS (8-ID) beamline
Fit method: Linear combination fitting (LCF) of MD-EXAFS spectra
Phase fractions: (±10%)
| Phase | Fraction |
|---|---|
| Ni(II) CN=4 | 0.766 |
| Ni(II) CN=6 | 0.234 |
Fit basis (paper's reference spectra):
- MD-EXAFS spectrum of CN=3 coordination state
- MD-EXAFS spectrum of CN=4 coordination state
- MD-EXAFS spectrum of CN=5 coordination state
- MD-EXAFS spectrum of CN=6 coordination state
Source evidence: Table 1, page 6
Key reasoning: At 400 °C in the 45.3 mol% KCl composition, Ni(II) exists in a two-center equilibrium between distorted tetrahedral (CN=4) and octahedral (CN=6) coordination states. The presence of the six-coordinate state along with the four-coordinate state at this intermediate temperature results in partial cancellation of the observed EXAFS signal due to destructive interference between the contributions from the two species. The higher concentration of ZnCl2 compared to eutectic mixtures favors some retention of the octahedral state at 400 °C before it fully converts to lower coordination states at higher temperatures.
Reasoning source: Results and Discussion, pages 4 and 6
Scoring Rubric (total: 100 pts)
| Q | Type | Max | Question | Reference Answer | Scoring Criteria |
|---|---|---|---|---|---|
| q1 | identification | 30 | What candidate coordination states (basis functions) should be considered when performing linear combination fitting of the Ni K-edge absorption fine structure for this molten salt system? | The candidate basis functions that should be considered for linear combination fitting are the MD-EXAFS spectra of the CN=3, CN=4, CN=5, and CN=6 coordination states. These specific states must be included because, in the 45.3 mol% KCl - 54.7 mol% ZnCl2 melt at 400 °C, Ni(II) exists in a two-center equilibrium between distorted tetrahedral (CN=4) and octahedral (CN=6) geometries. The higher concentration of ZnCl2 in this mixture favors the retention of the octahedral state at this intermediate temperature before it fully converts to lower coordination states at higher temperatures, necessitating a full basis set from CN=3 to CN=6 to accurately capture the structural equilibrium. | Full credit for identifying that coordination states ranging from CN=3 to CN=6 should be considered as basis functions to capture the dynamic equilibrium. |
| q2 | quantification | 35 | Estimate the relative fractions of the different Ni(II) coordination states in the 45.3 mol% KCl - 54.7 mol% ZnCl2 melt at 400 °C. | The relative fractions of the Ni(II) coordination states are estimated to be 0.766 (76.6%) for the CN=4 state and 0.234 (23.4%) for the CN=6 state, with an uncertainty of 10%. These specific values result from the sample being held at an intermediate temperature of 400 °C in a melt containing a relatively high concentration of ZnCl2 (54.7 mol%). This specific composition and temperature establish a two-center equilibrium where the higher ZnCl2 content, compared to eutectic mixtures, prevents complete conversion to lower coordination states, thereby retaining a significant 23.4% fraction of the octahedral CN=6 state alongside the dominant CN=4 state. | Full credit for estimating approximately 77% CN=4 (distorted tetrahedral) and 23% CN=6 (octahedral), with negligible contributions from CN=3 and CN=5. |
| q3 | reasoning | 35 | Explain the physical reasoning for the coexistence of these specific coordination states at 400 °C and how their simultaneous presence impacts the observed X-ray absorption fine structure signal. | At 400 °C in the 45.3 mol% KCl - 54.7 mol% ZnCl2 melt, Ni(II) exists in a two-center equilibrium between distorted tetrahedral (CN=4) and octahedral (CN=6) coordination states. This coexistence occurs because the higher concentration of ZnCl2 compared to eutectic mixtures favors the retention of the octahedral state at this intermediate temperature, preventing the full conversion to lower coordination states that typically happens at higher temperatures. Spectrally, the simultaneous presence of these four- and six-coordinate states impacts the observed EXAFS signal by causing a partial cancellation of the overall signal. This attenuation is the direct result of destructive interference between the distinct scattering contributions originating from the two coexisting Ni(II) species. | Full credit for explaining the two-center equilibrium (tetrahedral and octahedral) and mentioning that their coexistence causes partial cancellation of the absorption signal due to destructive interference between the out-of-phase contributions. |
Review
#817
Ni(II) in molten ZnCl2-KCl
Ni K
▶
LLM Prompt
Sample Information
Material: Ni(II) in molten ZnCl2-KCl
Method: melt synthesis
Precursors: KCl, ZnCl2, NiCl2 (0.443 mol%)
Temperature C: 550
Atmosphere: dynamic vacuum (during synthesis)
Sample-Specific Conditions
- Temperature and Composition: 550 °C, 45.3 mol% KCl
- Ni(II) in 45.3 mol% KCl - 54.7 mol% ZnCl2 melt at 550 °C
Preparation
- KCl was dried under dynamic vacuum at 800 °C for 15 minutes. ZnCl2 was purified via fractional distillation. The required components were melted together under dynamic high vacuum at 600 °C. 0.443 mol % of NiCl2 was added to the base salt mixture and fused at 600 °C under dynamic vacuum. The sample was measured in a quartz capillary heated to 550 °C.
Measurement
We plan to measure the Ni K XANES spectrum of this sample.
Questions
Based on all the information above:
1. What candidate reference spectra or basis functions are required to accurately model the local coordination environment of Ni(II) in this melt using linear combination fitting?
2. Based on the temperature (550 °C) and composition (45.3 mol% KCl), estimate the phase fractions of the different Ni(II) coordination states present in the melt.
Ground Truth
Material: Ni(II) in molten ZnCl2-KCl (Comp 1: 45.3 mol% KCl)
Measurement: Ni K-edge XAS in fluorescence mode at ISS (8-ID) beamline, NSLS-II
Fit method: Linear combination fitting (LCF) of MD-EXAFS spectra
Phase fractions: (±17%)
| Phase | Fraction |
|---|---|
| Ni(II) CN=4 | 0.691 |
| Ni(II) CN=5 | 0.309 |
Fit basis (paper's reference spectra):
- MD-EXAFS spectrum of CN=3 coordination state
- MD-EXAFS spectrum of CN=4 coordination state
- MD-EXAFS spectrum of CN=5 coordination state
- MD-EXAFS spectrum of CN=6 coordination state
Source evidence: Table 1, page 6
Key reasoning: At 550 °C, the six-coordinate Ni(II) complex is no longer stable, and the system is dominated by four-coordinate (distorted tetrahedral) and five-coordinate (square pyramidal) states. The significant presence of the five-coordinate state (30.9%) in Comp 1 is due to the higher ZnCl2 concentration, which allows Ni(II) to interact with the Zn(II) network via shared chlorides. This interaction reduces repulsion between neighboring chloride ions, allowing more of them to be accommodated in the Ni(II) solvation shell compared to melts with higher KCl concentrations.
Reasoning source: Page 6 (Table 1 discussion) and Page 9 (structural ordering discussion)
Scoring Rubric (total: 100 pts)
| Q | Type | Max | Question | Reference Answer | Scoring Criteria |
|---|---|---|---|---|---|
| q1 | identification | 40 | What candidate reference spectra or basis functions are required to accurately model the local coordination environment of Ni(II) in this melt using linear combination fitting? | To accurately model the local coordination environment of Ni(II) in this melt using linear combination fitting, the required basis functions are the MD-EXAFS spectra of the CN=3, CN=4, CN=5, and CN=6 coordination states. These specific reference states are necessary because the sample conditions dictate a complex structural equilibrium. At the measurement temperature of 550 °C, the six-coordinate Ni(II) complex is no longer stable, causing the system to be dominated by four-coordinate (distorted tetrahedral) and five-coordinate (square pyramidal) states. Furthermore, the specific melt composition (45.3 mol% KCl and 54.7 mol% ZnCl2) features a high ZnCl2 concentration that allows Ni(II) to interact with the Zn(II) network via shared chlorides, reducing chloride-chloride repulsion and enabling the formation of higher coordination states like CN=5. | Full credit for identifying that basis functions representing multiple Ni(II) coordination states (specifically CN=3, CN=4, CN=5, and CN=6) derived from MD simulations are needed. |
| q2 | quantification | 60 | Based on the temperature (550 °C) and composition (45.3 mol% KCl), estimate the phase fractions of the different Ni(II) coordination states present in the melt. | Based on the sample conditions, the estimated phase fractions are 0.691 (69.1%) for the Ni(II) CN=4 state and 0.309 (30.9%) for the Ni(II) CN=5 state, with an uncertainty of 17%. These specific fractions result directly from the temperature and composition of the melt. At 550 °C, the six-coordinate Ni(II) complex loses stability, shifting the system entirely to four- and five-coordinate states. The significant presence of the five-coordinate state (30.9%) is driven by the higher ZnCl2 concentration (54.7 mol%) relative to KCl (45.3 mol%); this allows Ni(II) to interact with the Zn(II) network via shared chlorides, which reduces repulsion between neighboring chloride ions and allows more of them to be accommodated in the Ni(II) solvation shell. | Full credit for estimating ~69% for the four-coordinate (CN=4) state and ~31% for the five-coordinate (CN=5) state, with zero contribution from CN=3 and CN=6. |
Review
#818
Ni(II) in molten ZnCl2-KCl
Ni K
▶
LLM Prompt
Sample Information
Material: Ni(II) in molten ZnCl2-KCl
Method: melt synthesis
Precursors: KCl, ZnCl2, NiCl2 (0.443 mol%)
Temperature C: 550
Atmosphere: dynamic vacuum (during synthesis)
Sample-Specific Conditions
- Temperature and Composition: 550 °C, 52.5 mol% KCl
- Ni(II) in 52.5 mol% KCl - 47.5 mol% ZnCl2 melt at 550 °C
Preparation
- KCl was dried under dynamic vacuum at 800 °C for 15 minutes. ZnCl2 was purified via fractional distillation. The required components were melted together under dynamic high vacuum at 600 °C. 0.443 mol % of NiCl2 was added to the base salt mixture and fused at 600 °C under dynamic vacuum. The sample was measured in a quartz capillary heated to 550 °C.
Measurement
We plan to measure the Ni K XANES spectrum of this sample.
Questions
Based on all the information above:
1. What candidate reference spectra or structural motifs should be considered as basis functions for modeling the X-ray absorption spectrum of Ni(II) in this molten salt mixture via linear combination fitting?
2. Based on the specific composition (52.5 mol% KCl) and temperature (550 °C), estimate the relative phase fractions of the different Ni(II) coordination states present in the melt.
3. Explain the physical and structural reasoning for the observed distribution of Ni(II) coordination states in this sample. Specifically, how does the high concentration of KCl relative to ZnCl2 influence the Ni(II)-Cl interactions and the resulting speciation?
Ground Truth
Material: Ni(II) in molten ZnCl2-KCl
Measurement: Ni K-edge, fluorescence mode, Inner-Shell Spectroscopy beamline (ISS, 8-ID) at NSLS-II
Fit method: Linear combination fitting (LCF) of MD-EXAFS spectra
Phase fractions: (±10%)
| Phase | Fraction |
|---|---|
| Ni(II) CN=4 | 0.783 |
| Ni(II) CN=5 | 0.217 |
Fit basis (paper's reference spectra):
- MD-EXAFS spectrum of CN=3 coordination state
- MD-EXAFS spectrum of CN=4 coordination state
- MD-EXAFS spectrum of CN=5 coordination state
- MD-EXAFS spectrum of CN=6 coordination state
Source evidence: Table 1, page 6
Key reasoning: In Comp 2 (52.5 mol% KCl) at 550 °C, the Ni(II) speciation is dominated by the four-coordinate state (78.3%) with a minor contribution from the five-coordinate state (21.7%). Decreasing the amount of ZnCl2 (increasing KCl) reduces the chance of chloride-shared interactions between Ni(II) and Zn(II) networks. This allows the Ni(II)-Cl interaction to be stronger, which reduces the presence of the CN=5 state and favors the CN=4 state compared to melts with higher ZnCl2 content.
Reasoning source: RESULTS AND DISCUSSION, Page 6 and Page 9
Scoring Rubric (total: 100 pts)
| Q | Type | Max | Question | Reference Answer | Scoring Criteria |
|---|---|---|---|---|---|
| q1 | identification | 20 | What candidate reference spectra or structural motifs should be considered as basis functions for modeling the X-ray absorption spectrum of Ni(II) in this molten salt mixture via linear combination fitting? | The candidate reference spectra for modeling the Ni K-edge XANES spectrum via linear combination fitting are the MD-EXAFS spectra of the CN=3, CN=4, CN=5, and CN=6 coordination states. These specific structural motifs are expected because the sample is a molten ZnCl2-KCl mixture at 550 °C, where Ni(II) exists in dynamic coordination environments. Specifically, the high concentration of KCl (52.5 mol%) reduces chloride-shared interactions between the Ni(II) and Zn(II) networks. This strengthens the Ni(II)-Cl interactions, dictating that the CN=4 and CN=5 states emerge as the primary structural motifs to model the speciation in this specific melt composition. | Full credit for identifying that the basis should include spectra corresponding to distinct Ni(II) coordination states (specifically CN=3, CN=4, CN=5, and CN=6). |
| q2 | quantification | 40 | Based on the specific composition (52.5 mol% KCl) and temperature (550 °C), estimate the relative phase fractions of the different Ni(II) coordination states present in the melt. | In this melt at 550 °C, the Ni(II) speciation consists of 78.3% of the four-coordinate (CN=4) state and 21.7% of the five-coordinate (CN=5) state. These specific fractions arise because the melt composition contains a high amount of KCl (52.5 mol%) relative to ZnCl2 (47.5 mol%). Decreasing the ZnCl2 content reduces the probability of chloride-shared interactions between the Ni(II) and Zn(II) networks. Consequently, the Ni(II)-Cl interaction becomes stronger, which suppresses the formation of the CN=5 state and heavily favors the dominant CN=4 state compared to melts with higher ZnCl2 concentrations. | Full credit for estimating ~78% for the 4-coordinate (CN=4) state and ~22% for the 5-coordinate (CN=5) state, with zero contribution from CN=3 and CN=6. |
| q3 | reasoning | 40 | Explain the physical and structural reasoning for the observed distribution of Ni(II) coordination states in this sample. Specifically, how does the high concentration of KCl relative to ZnCl2 influence the Ni(II)-Cl interactions and the resulting speciation? | The observed distribution of 78.3% CN=4 and 21.7% CN=5 states is directly driven by the specific 52.5 mol% KCl to 47.5 mol% ZnCl2 ratio at 550 °C. By decreasing the amount of ZnCl2 and increasing KCl, the melt provides fewer opportunities for chloride-shared interactions between the Ni(II) and Zn(II) networks. This lack of network sharing allows the Ni(II)-Cl interactions to become significantly stronger. As a result of these stronger localized interactions, the higher-coordinate CN=5 state is reduced, while the lower-coordinate CN=4 state is strongly favored as the dominant speciation in the melt. | Full credit for explaining that increasing KCl reduces chloride-shared interactions between Ni(II) and Zn(II) networks, which strengthens the Ni(II)-Cl interaction, thereby reducing the population of the CN=5 state and favoring the CN=4 state. |
Review
#819
Ni(II) in molten ZnCl2
Ni K
▶
LLM Prompt
Sample Information
Material: Ni(II) in molten ZnCl2
Method: melt synthesis
Precursors: ZnCl2, NiCl2
Temperature C: 500
Atmosphere: dynamic vacuum (during synthesis)
Sample-Specific Conditions
- Temperature and Composition: 500 °C, 0 mol% KCl
- Ni(II) in pure ZnCl2 melt at 500 °C
Preparation
- ZnCl2 was purified via fractional distillation. NiCl2 was added and fused under dynamic vacuum. The sample was measured in a quartz capillary heated to 500 °C.
Measurement
We plan to measure the Ni K XANES spectrum of this sample.
Questions
Based on all the information above:
1. What candidate reference spectra or basis functions are needed to accurately model the local coordination environment of Ni(II) in this melt using linear combination fitting?
2. Based on the sample conditions (Ni(II) in pure ZnCl2 melt at 500 °C), estimate the phase fractions of the different Ni(II) coordination states.
Ground Truth
Material: Ni(II) in molten ZnCl2
Measurement: Ni K-edge EXAFS, fluorescence mode, Inner-Shell Spectroscopy (ISS, 8-ID) beamline at NSLS-II
Fit method: Linear combination fitting (LCF) of MD-EXAFS spectra
Phase fractions: (±22%)
| Phase | Fraction |
|---|---|
| Ni(II) CN=3 | 0.242 |
| Ni(II) CN=4 | 0.308 |
| Ni(II) CN=5 | 0.457 |
| Ni(II) CN=6 | 0.0 |
Fit basis (paper's reference spectra):
- MD-EXAFS spectrum of CN=3 coordination state
- MD-EXAFS spectrum of CN=4 coordination state
- MD-EXAFS spectrum of CN=5 coordination state
- MD-EXAFS spectrum of CN=6 coordination state
Source evidence: Table 1, Page 6
Key reasoning: In pure ZnCl2 at 500 °C, the strong polarizing power of Zn(II) compared to monovalent cations results in the largest weakening of the Ni-Cl bond. This promotes the formation of lower coordination species, including a significant population of the NiCl3- (CN=3) species, alongside CN=4 and CN=5 complexes. The previously assumed octahedral complex (CN=6) is completely absent at this temperature. The experimental spectrum's amplitude is reproduced through partial destructive interference among these multiple coexisting coordination states.
Reasoning source: Page 6-7, RESULTS AND DISCUSSION
Scoring Rubric (total: 100 pts)
| Q | Type | Max | Question | Reference Answer | Scoring Criteria |
|---|---|---|---|---|---|
| q1 | identification | 33 | What candidate reference spectra or basis functions are needed to accurately model the local coordination environment of Ni(II) in this melt using linear combination fitting? | To accurately model the local coordination environment of Ni(II) in this melt, the required basis functions are the MD-EXAFS spectra of the CN=3, CN=4, CN=5, and CN=6 coordination states. These specific reference spectra are necessary because, in a pure ZnCl2 melt at 500 °C, the strong polarizing power of the Zn(II) cations significantly weakens the Ni-Cl bonds. This bond weakening promotes the formation of multiple coexisting lower-coordination species, specifically CN=3, CN=4, and CN=5, while the previously assumed octahedral CN=6 complex is completely absent. Using this complete set of coordination states allows the linear combination fitting to capture the partial destructive interference among these coexisting species that reproduces the experimental spectrum's amplitude. | Full credit for identifying that basis functions corresponding to distinct coordination states (CN=3, CN=4, CN=5, and CN=6) derived from molecular dynamics (MD-EXAFS) are required. |
| q2 | quantification | 67 | Based on the sample conditions (Ni(II) in pure ZnCl2 melt at 500 °C), estimate the phase fractions of the different Ni(II) coordination states. | Based on the sample conditions, the estimated phase fractions for the Ni(II) coordination states are 24.2% for CN=3, 30.8% for CN=4, 45.7% for CN=5, and 0.0% for CN=6, with an uncertainty of 22%. These specific fractions arise because the pure ZnCl2 melt at 500 °C features Zn(II) cations with strong polarizing power, which causes the largest weakening of the Ni-Cl bonds compared to melts with monovalent cations. Consequently, this environment strongly promotes the formation of lower coordination species, leading to a significant population of the NiCl3- (CN=3) species alongside the CN=4 and CN=5 complexes. The complete absence of the CN=6 state (0.0%) confirms that the high temperature and strong polarization entirely destabilize the octahedral complex in this specific melt composition. | Full credit for estimating fractions close to ~24% CN=3, ~31% CN=4, and ~46% CN=5, with 0% CN=6. Partial credit if the distribution correctly reflects a mixture dominated by CN=4 and CN=5 with a non-negligible CN=3 component and no octahedral (CN=6) contribution. |
Review
Combining Valence-to-Core X-ray Emission and Cu K-edge X-ray Absorption Spectroscopies to Experimentally Assess Oxidation State in Organometallic Cu(I)/(II)/(III) Complexes
BNL-NSLS-II-8-ID
Pure Phase
Blaise L. Geoghegan et al.
DOI: 10.1021/jacs.1c09505
5 scenarios
▶
#820
[CuI(NHC2)]+
Cu K
▶
LLM Prompt
Sample Information
Material: [CuI(NHC2)]+
Oxidation State: +1
Measurement Mode: transmission
- Cu(I) complex with a macrocyclic ligand bearing trans carbene and trans pyridyl donor groups
Measurement
We plan to measure the Cu K XANES spectrum of this sample.
Questions
Based on all the information above:
1. Describe the expected overall spectral shape of the Cu K-edge XANES for the [CuI(NHC2)]+ complex and explain the physical origin of its lowest energy features based on its electronic configuration.
2. What are the specific energy positions and relative intensities for the 1s -> 4pz transition, the 1s -> 4py transition, and the white line maximum in this spectrum?
3. What specific spectral features distinguish this Cu(I) complex from its Cu(II) and Cu(III) analogues?
Ground Truth
Compound: [CuI(NHC2)]+
Oxidation state: +1
Measurement: Cu K edge transmission
Edge position: not reported
Spectral shape: Absorption profile typical of a d10 electronic configuration, lacking a classic pre-edge and dominated by intense 1s -> 4p transitions in the rising edge.
Labeled peaks:
| Label | Energy (eV) | Intensity | Origin | Source |
|---|---|---|---|---|
| 1s -> 4pz | 8982.0 | moderate | electric dipole allowed 1s -> 4pz transition | paper_data |
| 1s -> 4py | 8985.1 | strong | 1s -> 4py excitation | paper_data |
| rising edge feature | 8989.5 | weak | not discussed in this paper | paper_data |
| white line | 8994 | strong | not discussed in this paper | paper_data |
Distinguishing features: Distinguished from Cu(II) and Cu(III) analogues by the lack of a 1s -> 3d pre-edge and lower energy white line.
Key reasoning: The d10 electronic configuration results in the absence of a 1s -> 3d pre-edge. The lowest energy features are electric dipole allowed 1s -> 4pz and 1s -> 4py transitions.
Reasoning source: text
Scoring Rubric (total: 100 pts)
| Q | Type | Max | Question | Reference Answer | Scoring Criteria |
|---|---|---|---|---|---|
| q1 | spectral | 35 | Describe the expected overall spectral shape of the Cu K-edge XANES for the [CuI(NHC2)]+ complex and explain the physical origin of its lowest energy features based on its electronic configuration. | The expected overall spectral shape for the [CuI(NHC2)]+ complex is typical of a d10 electronic configuration, lacking a classic pre-edge and dominated by intense 1s -> 4p transitions in the rising edge. Because the sample is a Cu(I) complex with a macrocyclic ligand, the copper center possesses a fully occupied d10 electronic configuration. This closed-shell d10 state physically prevents any 1s -> 3d transitions, resulting in the absence of a pre-edge feature. Consequently, the lowest energy features observed in the spectrum are the electric dipole-allowed 1s -> 4pz and 1s -> 4py transitions. | Award full points if the response mentions the lack of a classic pre-edge due to the d10 configuration, and identifies that the spectrum is dominated by intense 1s -> 4p transitions (specifically 1s -> 4pz and 1s -> 4py) in the rising edge. |
| q2 | spectral | 35 | What are the specific energy positions and relative intensities for the 1s -> 4pz transition, the 1s -> 4py transition, and the white line maximum in this spectrum? | The 1s -> 4pz transition occurs at 8982.0 eV with moderate intensity, the 1s -> 4py transition is located at 8985.1 eV with strong intensity, and the white line maximum appears at 8994 eV with strong intensity. These specific spectral features arise directly from the pure (1.0 fraction) [CuI(NHC2)]+ phase present in the sample. Because the sample is a Cu(I) complex with a d10 electronic configuration, the lowest energy excitations are the electric dipole-allowed 1s -> 4pz and 1s -> 4py transitions rather than 1s -> 3d transitions. The distinct energy positions and intensities of these 4p transitions reflect the specific coordination environment provided by the macrocyclic ligand bearing trans carbene and trans pyridyl donor groups. | Award points for correctly identifying the 1s -> 4pz peak at 8982.0 eV (moderate intensity), the 1s -> 4py peak at 8985.1 eV (strong intensity), and the white line at ~8994 eV (strong intensity). |
| q3 | reasoning | 30 | What specific spectral features distinguish this Cu(I) complex from its Cu(II) and Cu(III) analogues? | This Cu(I) complex is distinguished from its Cu(II) and Cu(III) analogues by the complete lack of a 1s -> 3d pre-edge feature and a lower energy white line. These distinguishing features are a direct consequence of the +1 oxidation state of the [CuI(NHC2)]+ sample. Because the Cu(I) center has a fully occupied d10 electronic configuration, 1s -> 3d transitions are impossible, unlike in Cu(II) or Cu(III) complexes where d-orbital vacancies allow for a distinct pre-edge. Additionally, the lower +1 oxidation state results in a lower energy white line compared to the higher valent analogues. | Award full points if the response states that it is distinguished by the lack of a 1s -> 3d pre-edge and a lower energy white line. |
Review
#821
[CuII(NHC2)]2+
Cu K
▶
LLM Prompt
Sample Information
Material: [CuII(NHC2)]2+
Oxidation State: +2
Measurement Mode: transmission
- Cu(II) complex with a macrocyclic ligand bearing trans carbene and trans pyridyl donor groups
Measurement
We plan to measure the Cu K XANES spectrum of this sample.
Questions
Based on all the information above:
1. Describe the expected key spectral features (pre-edge and white line) for this Cu(II) complex, including their specific energies and relative intensities.
2. What is the physical origin of the pre-edge feature in this complex, and what specific molecular orbital parentage is involved in this transition?
3. How do the pre-edge and white line energies of this [CuII(NHC2)]2+ complex distinguish it from its Cu(I) and Cu(III) analogues?
Ground Truth
Compound: [CuII(NHC2)]2+
Oxidation state: +2
Measurement: Cu K-edge transmission
Edge position: not reported
Spectral shape: Exhibits a distinct 1s -> 3d pre-edge transition and a white line shifted to higher energy compared to the Cu(I) analogue.
Labeled peaks:
| Label | Energy (eV) | Intensity | Origin | Source |
|---|---|---|---|---|
| pre-edge | 8979.5 | weak | formally electric dipole forbidden 1s -> 3d transition | paper_data |
| white line | 8996.5 | strong | not discussed in this paper | paper_data |
Distinguishing features: Pre-edge and white line energies are intermediate between the Cu(I) and Cu(III) species, reflecting the +2 oxidation state.
Key reasoning: The Cu(II) complex exhibits a distinct 1s -> 3d pre-edge transition at ~8979.5 eV and a white line at 8996.5 eV. TDDFT calculations confirm a single pre-edge transition into an MO of copper 3dx2-y2 parentage. The pre-edge and white line energies are intermediate between the Cu(I) and Cu(III) species, reflecting the +2 oxidation state.
Reasoning source: text
Scoring Rubric (total: 100 pts)
| Q | Type | Max | Question | Reference Answer | Scoring Criteria |
|---|---|---|---|---|---|
| q1 | spectral | 30 | Describe the expected key spectral features (pre-edge and white line) for this Cu(II) complex, including their specific energies and relative intensities. | The expected Cu K-edge XANES spectrum for this sample features a weak pre-edge peak at approximately 8979.5 eV and a strong white line at 8996.5 eV. These specific spectral features arise directly from the sample being a pure [CuII(NHC2)]2+ complex with a +2 oxidation state. Because the copper center is in a +2 oxidation state within the macrocyclic ligand environment, it exhibits a distinct 1s -> 3d pre-edge transition and a white line shifted to higher energy compared to its Cu(I) analogue. The intermediate energies of these features perfectly reflect the +2 oxidation state of the copper center coordinated by the trans carbene and trans pyridyl donor groups. | Award full points if the response identifies the weak pre-edge at ~8979.5 eV and the strong white line at 8996.5 eV. |
| q2 | reasoning | 35 | What is the physical origin of the pre-edge feature in this complex, and what specific molecular orbital parentage is involved in this transition? | The pre-edge feature in this complex originates from a formally electric dipole forbidden 1s -> 3d transition. Based on TDDFT calculations, this single pre-edge transition occurs into a molecular orbital of copper 3dx2-y2 parentage. This specific electronic transition is expected because the sample is a [CuII(NHC2)]2+ complex, where the +2 oxidation state leaves a vacancy in the 3d shell. The coordination environment provided by the macrocyclic ligand with trans carbene and trans pyridyl donor groups establishes the specific ligand field that dictates this 3dx2-y2 molecular orbital parentage. | Award full points if the response correctly identifies the transition as a formally electric dipole forbidden 1s -> 3d transition, specifically into a molecular orbital of copper 3dx2-y2 parentage. |
| q3 | reasoning | 35 | How do the pre-edge and white line energies of this [CuII(NHC2)]2+ complex distinguish it from its Cu(I) and Cu(III) analogues? | The [CuII(NHC2)]2+ complex is distinguished from its Cu(I) and Cu(III) analogues by having pre-edge and white line energies that are intermediate between those two oxidation states. Specifically, the pre-edge at 8979.5 eV and the white line at 8996.5 eV are shifted to higher energies compared to the Cu(I) species, but remain lower than those of the Cu(III) species. This intermediate positioning occurs because the sample consists entirely of copper in the +2 oxidation state. The specific electronic structure of the Cu(II) center, stabilized by the macrocyclic ligand's trans carbene and pyridyl donors, directly dictates these intermediate transition energies. | Award full points if the response states that the pre-edge and white line energies are intermediate between the Cu(I) and Cu(III) species (or shifted to higher energy compared to the Cu(I) analogue), reflecting the +2 oxidation state. |
Review
#822
[CuIII(NHC2)]3+
Cu K
▶
LLM Prompt
Sample Information
Material: [CuIII(NHC2)]3+
Oxidation State: +3
Measurement Mode: transmission
- Cu(III) complex with a macrocyclic ligand bearing trans carbene and trans pyridyl donor groups
Measurement
We plan to measure the Cu K XANES spectrum of this sample.
Questions
Based on all the information above:
1. Describe the expected energies, intensities, and physical origins of the pre-edge and white line features for the [CuIII(NHC2)]3+ complex.
2. How does the XANES spectrum of this Cu(III) complex compare to its Cu(II) analogue, and what is the physical reasoning for this difference?
3. What specific spectral features distinguish this [CuIII(NHC2)]3+ complex from the related tetra-NHC Cu(III) complex?
Ground Truth
Compound: [CuIII(NHC2)]3+
Oxidation state: +3
Measurement: Cu K-edge transmission
Edge position: not reported
Spectral shape: Exhibits a 1s -> 3d pre-edge transition and a white line shifted to higher energy compared to the Cu(II) analogue, consistent with a higher oxidation state.
Labeled peaks:
| Label | Energy (eV) | Intensity | Origin | Source |
|---|---|---|---|---|
| pre-edge | 8981.3 | weak | formally electric dipole forbidden 1s -> 3d transition into an MO of copper 3dx2-y2 parentage | paper_data |
| white line | 9000.0 | strong | not discussed in this paper | paper_data |
Distinguishing features: Higher energy pre-edge and white line compared to Cu(II), but lacks the intense 8985 eV feature seen in the tetra-NHC Cu(III) complex. The white line is slightly sharper and at lower energy than the tetra-NHC analogue.
Key reasoning: The spectrum exhibits a 1s -> 3d pre-edge transition and a white line shifted to higher energy compared to the Cu(II) analogue. This shift is consistent with the deeper binding energy of the Cu 1s electrons in the higher valent Cu(III) system. Calculations confirm a single pre-edge transition into an MO of copper 3dx2-y2 parentage.
Reasoning source: text
Scoring Rubric (total: 100 pts)
| Q | Type | Max | Question | Reference Answer | Scoring Criteria |
|---|---|---|---|---|---|
| q1 | spectral | 35 | Describe the expected energies, intensities, and physical origins of the pre-edge and white line features for the [CuIII(NHC2)]3+ complex. | The Cu K-edge XANES spectrum for the [CuIII(NHC2)]3+ complex is expected to exhibit a weak pre-edge feature at 8981.3 eV and a strong white line at 9000.0 eV. The pre-edge feature originates from a formally electric dipole forbidden 1s -> 3d transition into a molecular orbital of copper 3dx2-y2 parentage. These specific spectral features arise because the sample is a +3 oxidation state copper complex coordinated by a macrocyclic ligand with trans carbene and trans pyridyl donor groups. This specific high-valent Cu(III) electronic structure dictates the available unoccupied molecular orbitals, directly resulting in the observed 1s -> 3d transition and the corresponding energy positions. | Award full points if the response identifies the pre-edge at 8981.3 eV (weak, 1s -> 3d transition into 3dx2-y2 MO) and the white line at 9000.0 eV (strong). |
| q2 | reasoning | 35 | How does the XANES spectrum of this Cu(III) complex compare to its Cu(II) analogue, and what is the physical reasoning for this difference? | The XANES spectrum of the [CuIII(NHC2)]3+ complex exhibits a pre-edge transition and a white line that are both shifted to higher energies compared to its Cu(II) analogue. This shift occurs because the sample is synthesized in a higher-valent +3 oxidation state. The increased positive charge on the Cu(III) center leads to a deeper binding energy of the Cu 1s core electrons. Consequently, more incident X-ray energy is required to excite these 1s electrons, resulting in the observed shift of the spectral features to higher energies relative to the Cu(II) species. | Award full points if the response notes that the pre-edge and white line are shifted to higher energy compared to Cu(II), and explains this is due to the deeper binding energy of the Cu 1s electrons in the higher valent (+3) system. |
| q3 | identification | 30 | What specific spectral features distinguish this [CuIII(NHC2)]3+ complex from the related tetra-NHC Cu(III) complex? | The [CuIII(NHC2)]3+ complex is distinguished from the related tetra-NHC Cu(III) analogue by the absence of an intense spectral feature at 8985 eV. Furthermore, the white line for this complex is slightly sharper and appears at a lower energy than that of the tetra-NHC analogue. These spectral differences arise directly from the sample's specific coordination environment, which consists of a macrocyclic ligand bearing trans carbene and trans pyridyl donor groups rather than four carbene donors. This distinct ligand field alters the electronic structure around the Cu(III) center, thereby modifying the transition energies and spectral shape that define the XANES profile. | Award full points if the response states that it lacks the intense 8985 eV feature seen in the tetra-NHC complex, and that its white line is slightly sharper and at a lower energy. |
Review
#823
[CuIII(NHC4)]3+
Cu K
▶
LLM Prompt
Sample Information
Material: [CuIII(NHC4)]3+
Crystal Structure: square planar
Oxidation State: +3
Measurement Mode: transmission
- Tetra-NHC ligated Cu(III) macrocyclic complex
Measurement
We plan to measure the Cu K XANES spectrum of this sample.
Questions
Based on all the information above:
1. Describe the expected spectral shape and key peak positions for the Cu K-edge XANES spectrum of this tetra-NHC ligated Cu(III) macrocyclic complex.
2. What are the specific electronic transitions assigned to the spectral features at 8982.3 eV and 8985.0 eV in this complex?
3. How does the strong sigma donation from the carbene ligands affect the 1s-LUMO gap and the classic 1s -> 3dx2-y2 transition in this complex?
4. What spectral features distinguish this tetra-NHC Cu(III) complex from its bis-NHC Cu(III) analogue?
Ground Truth
Compound: [CuIII(NHC4)]3+
Oxidation state: +3
Measurement: Cu K-edge transmission
Edge position: not reported
Spectral shape: Highly featured spectrum with an intense shoulder at ~8982.3 eV, three main intense features in the rising edge, and a high-energy white line.
Labeled peaks:
| Label | Energy (eV) | Intensity | Origin | Source |
|---|---|---|---|---|
| pre-edge shoulder | 8982.3 | moderate | 1s to 3d pre-edge transition | paper_data |
| 1s -> 4pz | 8985.0 | strong | 1s -> 4pz transition | paper_data |
| rising edge feature 1 | 8989.2 | strong | not discussed in this paper | paper_data |
| rising edge feature 2 | 8993.0 | strong | not discussed in this paper | paper_data |
| shoulder | 8997.0 | moderate | not discussed in this paper | paper_data |
| white line | 9005.0 | strong | not discussed in this paper | paper_data |
Distinguishing features: Exhibits an intense and well-resolved feature at ~8985.0 eV, unlike the bis-NHC Cu(III) analogue, and has a higher energy pre-edge transition.
Key reasoning: Exchange of pyridyl donors for strong sigma donating carbenes significantly influences the 1s-LUMO gap (antibonding interaction with Cu 3dx2-y2). The classic 1s -> 3dx2-y2 transition is quite high in energy, approaching the edge structure due to increased covalency.
Reasoning source: text
Scoring Rubric (total: 100 pts)
| Q | Type | Max | Question | Reference Answer | Scoring Criteria |
|---|---|---|---|---|---|
| q1 | spectral | 30 | Describe the expected spectral shape and key peak positions for the Cu K-edge XANES spectrum of this tetra-NHC ligated Cu(III) macrocyclic complex. | The expected Cu K-edge XANES spectrum is highly featured, characterized by an intense pre-edge shoulder at 8982.3 eV and a strong peak at 8985.0 eV. The rising edge contains three main intense features at 8989.2 eV, 8993.0 eV, and a shoulder at 8997.0 eV, culminating in a high-energy white line at 9005.0 eV. These distinct features arise directly from the square planar, tetra-NHC ligated Cu(III) macrocyclic structure of the complex. Specifically, the strong sigma-donating carbene ligands significantly influence the 1s-LUMO gap via antibonding interactions with the Cu 3dx2-y2 orbital, increasing covalency and pushing the classic 1s to 3dx2-y2 transition higher in energy toward the edge structure. | Must mention a highly featured spectrum with an intense pre-edge shoulder at ~8982.3 eV, an intense feature at 8985.0 eV, rising edge features at 8989.2 and 8993.0 eV, and a high-energy white line at ~9005.0 eV. |
| q2 | reasoning | 20 | What are the specific electronic transitions assigned to the spectral features at 8982.3 eV and 8985.0 eV in this complex? | The moderate-intensity pre-edge shoulder at 8982.3 eV is assigned to the 1s to 3d pre-edge transition, while the strong feature at 8985.0 eV originates from the 1s -> 4pz transition. These specific electronic transitions are dictated by the square planar geometry and +3 oxidation state of the [CuIII(NHC4)]3+ complex. The strong sigma donation from the four carbene ligands in the macrocycle creates a strong antibonding interaction with the Cu 3dx2-y2 orbital. This interaction significantly influences the 1s-LUMO gap and increases covalency, which pushes the 1s to 3d transition to a relatively high energy approaching the edge structure. | Must identify the 8982.3 eV feature as the 1s to 3d pre-edge transition and the 8985.0 eV feature as the 1s -> 4pz transition. |
| q3 | reasoning | 25 | How does the strong sigma donation from the carbene ligands affect the 1s-LUMO gap and the classic 1s -> 3dx2-y2 transition in this complex? | The strong sigma donation from the carbene ligands significantly influences the 1s-LUMO gap by creating a strong antibonding interaction with the Cu 3dx2-y2 orbital. Consequently, the classic 1s -> 3dx2-y2 transition is pushed to a quite high energy, approaching the main edge structure. This effect occurs because the sample is a tetra-NHC ligated Cu(III) macrocyclic complex where pyridyl donors have been exchanged for these strong sigma-donating carbenes. The square planar geometry and +3 oxidation state facilitate this strong orbital overlap, leading to increased covalency in the metal-ligand bonds that directly shifts the transition energies. | Must explain that the strong sigma donation significantly influences the 1s-LUMO gap (antibonding interaction with Cu 3dx2-y2) and pushes the 1s -> 3dx2-y2 transition to higher energy, approaching the edge structure due to increased covalency. |
| q4 | spectral | 25 | What spectral features distinguish this tetra-NHC Cu(III) complex from its bis-NHC Cu(III) analogue? | This tetra-NHC Cu(III) complex is distinguished from its bis-NHC analogue by an intense, well-resolved feature at ~8985.0 eV and a higher energy pre-edge transition. These distinguishing features arise directly from the coordination environment of the [CuIII(NHC4)]3+ macrocyclic complex. The presence of four strong sigma-donating carbene ligands, rather than two, creates a stronger antibonding interaction with the Cu 3dx2-y2 orbital in the square planar geometry. This increased covalency significantly influences the 1s-LUMO gap, pushing the 1s to 3d pre-edge transition to higher energies and producing the distinct 1s -> 4pz peak. | Must mention the presence of an intense and well-resolved feature at ~8985.0 eV and a higher energy pre-edge transition compared to the bis-NHC analogue. |
Review
#824
[Cu(CF3)4]-
Cu K
▶
LLM Prompt
Sample Information
Material: [Cu(CF3)4]-
Crystal Structure: distorted D2d
Oxidation State: +3
Measurement Mode: transmission
- Homoleptic trifluoromethyl copper complex
Measurement
We plan to measure the Cu K XANES spectrum of this sample.
Questions
Based on all the information above:
1. Describe the expected spectral features (pre-edge and main transitions) and their energies for the [Cu(CF3)4]- complex.
2. Explain the electronic origin of the pre-edge feature at ~8982 eV and how the distorted D2d geometry affects its intensity.
3. What spectral features distinguish the XANES spectrum of [Cu(CF3)4]- from that of the related [CuIII(NHC2)]3+ complex?
Ground Truth
Compound: [Cu(CF3)4]-
Oxidation state: +3
Measurement: Cu K-edge transmission
Edge position: not reported
Spectral shape: Spectrum shares similarities with the tetra-NHC Cu(III) complex, featuring a pre-edge at ~8982 eV and an intense 1s -> 4pz transition at 8985.6 eV.
Labeled peaks:
| Label | Energy (eV) | Intensity | Origin | Source |
|---|---|---|---|---|
| pre-edge | 8982 | weak | 1s -> 3dx2-y2 with sigma bonding to CF3- ligands | paper_data |
| 1s -> 4pz | 8985.6 | strong | 1s -> 4pz excitation | paper_data |
| rising edge feature 1 | 8989.5 | weak | not discussed in this paper | paper_data |
| rising edge feature 2 | 8994.0 | moderate | not discussed in this paper | paper_data |
Distinguishing features: Much more intense 1s -> 4pz transition at ~8985 eV and lower intensity feature at 8989.5 eV compared to [CuIII(NHC2)]3+.
Key reasoning: TDDFT shows the pre-edge transition is an excitation of a core 1s electron into a dx2-y2 localized Cu orbital. The LUMO transforms as b2 in approximate D2d symmetry, allowing mixing of the Cu 4pz orbital into the dx2-y2, which increases the intensity of the pre-edge feature by reinstating partial electric dipole allowed character.
Reasoning source: text
Scoring Rubric (total: 100 pts)
| Q | Type | Max | Question | Reference Answer | Scoring Criteria |
|---|---|---|---|---|---|
| q1 | spectral | 35 | Describe the expected spectral features (pre-edge and main transitions) and their energies for the [Cu(CF3)4]- complex. | The expected Cu K-edge XANES spectrum for the [Cu(CF3)4]- complex features a weak pre-edge at 8982 eV, a strong 1s to 4pz transition at 8985.6 eV, and two rising edge features at 8989.5 eV (weak) and 8994.0 eV (moderate). These specific features arise because the sample is a Cu(III) homoleptic trifluoromethyl complex with a distorted D2d geometry. The pre-edge originates from a 1s to 3dx2-y2 excitation that involves sigma bonding to the CF3- ligands. Furthermore, the distorted D2d symmetry dictates that the LUMO transforms as b2, allowing the Cu 4pz orbital to mix into the dx2-y2 orbital, which reinstates partial electric dipole allowed character and dictates the observed pre-edge intensity. | Must mention the pre-edge at ~8982 eV (weak) and the intense 1s -> 4pz transition at 8985.6 eV. |
| q2 | reasoning | 35 | Explain the electronic origin of the pre-edge feature at ~8982 eV and how the distorted D2d geometry affects its intensity. | The pre-edge feature at ~8982 eV originates from the excitation of a core 1s electron into a localized Cu 3dx2-y2 orbital that engages in sigma bonding with the CF3- ligands. This specific electronic transition is directly dictated by the +3 oxidation state and the homoleptic trifluoromethyl coordination of the copper center. The intensity of this pre-edge is specifically enhanced by the complex's distorted D2d crystal structure. In this approximate D2d symmetry, the LUMO transforms as b2, which allows the Cu 4pz orbital to mix into the dx2-y2 orbital. This orbital mixing reinstates partial electric dipole allowed character to the transition, thereby increasing the intensity of the pre-edge feature. | Must identify the transition as 1s -> 3dx2-y2. Must explain that in D2d symmetry, the LUMO (b2) allows mixing of the Cu 4pz orbital into the dx2-y2 orbital, which increases the pre-edge intensity by adding partial electric dipole allowed character. |
| q3 | spectral | 30 | What spectral features distinguish the XANES spectrum of [Cu(CF3)4]- from that of the related [CuIII(NHC2)]3+ complex? | The XANES spectrum of [Cu(CF3)4]- is distinguished from the related tetra-NHC Cu(III) complex by a much more intense 1s to 4pz transition at ~8985.6 eV and a lower intensity rising edge feature at 8989.5 eV. These distinguishing spectral features arise directly from the unique electronic environment of the homoleptic trifluoromethyl copper complex in its +3 oxidation state. Specifically, the distorted D2d crystal structure and the specific sigma bonding interactions with the CF3- ligands alter the orbital energetics compared to the NHC complex. The D2d symmetry allows the LUMO to transform as b2, facilitating Cu 4pz and dx2-y2 orbital mixing, which fundamentally shapes the distinct transition intensities observed in this spectrum. | Must mention a much more intense 1s -> 4pz transition at ~8985 eV and a lower intensity feature at 8989.5 eV compared to [CuIII(NHC2)]3+. |
Review
Tuning Single-Atom Dopants on Manganese Oxide for Selective Electrocatalytic Cyclooctene Epoxidation
BNL-NSLS-II-8-ID
Catalyst
Minju Chung et al.
DOI: 10.1021/jacs.2c04711
2 scenarios
▶
#825
MnOx
Mn K
▶
LLM Prompt
Sample Information
Material: MnOx
Support: carbon paper
Sample-Specific Conditions
- pristine catalyst: MnOx
- Sub-10-nm-sized manganese oxide nanoparticles
Measurement
We plan to measure the Mn K XANES spectrum of this sample.
Questions
Based on all the information above:
1. What candidate structural motifs or reference states are needed to model the Mn K-edge XANES spectrum of this pristine sub-10-nm MnOx catalyst?
2. Estimate the quantitative phase fractions of the different Mn coordination environments in this pristine sample.
3. Describe the expected structural composition and site distribution for these pristine sub-10-nm manganese oxide nanoparticles.
Ground Truth
Material: MnOx
Measurement: ex-situ Mn K-edge
Fit method: not reported
Phase fractions: (±10%)
| Phase | Fraction |
|---|---|
| Mn tetrahedral site | 0.3 |
| Mn octahedral site | 0.7 |
Fit basis (paper's reference spectra):
- Mn tetrahedral site
- Mn octahedral site
Source evidence: text
Key reasoning: The pristine sub-10-nm-sized manganese oxide nanoparticles (MnOx) supported on carbon paper exhibit a mixed coordination environment. The structural composition is distributed between two primary geometries, consisting of 30% Mn in tetrahedral sites and 70% Mn in octahedral sites.
Reasoning source: text
Scoring Rubric (total: 100 pts)
| Q | Type | Max | Question | Reference Answer | Scoring Criteria |
|---|---|---|---|---|---|
| q1 | identification | 30 | What candidate structural motifs or reference states are needed to model the Mn K-edge XANES spectrum of this pristine sub-10-nm MnOx catalyst? | To model the Mn K-edge XANES spectrum of this catalyst, the required reference states are Mn tetrahedral sites and Mn octahedral sites. These specific motifs are needed because the pristine sub-10-nm-sized manganese oxide (MnOx) nanoparticles supported on carbon paper inherently exhibit a mixed coordination environment. Due to their nanoscale dimensions and pristine state, the structural composition naturally distributes the manganese atoms across these two primary geometries, making both sites essential for accurate spectral fitting. | Award full points if the answer identifies Mn tetrahedral sites and Mn octahedral sites as the necessary basis components for modeling the spectrum. |
| q2 | quantification | 40 | Estimate the quantitative phase fractions of the different Mn coordination environments in this pristine sample. | The quantitative phase fractions for this sample are estimated to be 30% Mn in tetrahedral sites and 70% Mn in octahedral sites, with an uncertainty of 10%. These specific values result from the physical characteristics of the pristine sub-10-nm-sized MnOx nanoparticles supported on carbon paper. The nanoscale dimensions and pristine condition of the catalyst drive the structural composition to distribute between these two primary geometries, favoring the octahedral coordination while maintaining a distinct 30% tetrahedral fraction. | Award full points for estimating approximately 30% Mn tetrahedral sites and 70% Mn octahedral sites. Deduct points proportionally for incorrect fractions or missing sites. |
| q3 | reasoning | 30 | Describe the expected structural composition and site distribution for these pristine sub-10-nm manganese oxide nanoparticles. | The expected structural composition of the pristine sub-10-nm manganese oxide nanoparticles features a mixed coordination environment distributed between two primary geometries. The specific site distribution consists of 30% Mn in tetrahedral sites and 70% Mn in octahedral sites. This structural arrangement arises directly from the sample conditions, as the sub-10-nm size and pristine state of the MnOx supported on carbon paper dictate how the manganese atoms partition into these distinct sites. Consequently, the nanoscale physical constraints of the as-prepared catalyst stabilize this specific 3:7 ratio of tetrahedral to octahedral geometries. | Award full points if the explanation correctly states that the pristine nanoparticles consist of a mixed site occupancy, specifically highlighting a majority (70%) in octahedral sites and a minority (30%) in tetrahedral sites. |
Review
#826
Ir-MnOx
Mn K
▶
LLM Prompt
Sample Information
Material: Ir-MnOx
Support: carbon paper
Sample-Specific Conditions
- Ir loading: single atoms
- Single iridium-decorated manganese oxide nanoparticles
Measurement
We plan to measure the Mn K XANES spectrum of this sample.
Questions
Based on all the information above:
1. What structural motifs or candidate reference environments are needed to model the Mn K-edge XANES spectrum of this single Ir-decorated MnOx sample?
2. Estimate the relative fractions of the different Mn coordination environments (tetrahedral vs. octahedral sites) in this specific Ir-MnOx sample.
3. Describe the expected distribution of Mn coordination sites for these single iridium-decorated manganese oxide nanoparticles.
Ground Truth
Material: Ir-MnOx
Measurement: Mn K-edge ex-situ
Fit method: not reported
Phase fractions: (±10%)
| Phase | Fraction |
|---|---|
| Mn tetrahedral site | 0.2 |
| Mn octahedral site | 0.8 |
Fit basis (paper's reference spectra):
- Mn tetrahedral site
- Mn octahedral site
Source evidence: Sample conditions and phase fractions text
Key reasoning: The manganese oxide nanoparticles decorated with single iridium atoms exhibit a mixed coordination environment for manganese. The Mn atoms are distributed between two distinct structural motifs, with the majority (80%) occupying octahedral sites and the remainder (20%) in tetrahedral sites.
Reasoning source: Sample description and phase fractions data
Scoring Rubric (total: 100 pts)
| Q | Type | Max | Question | Reference Answer | Scoring Criteria |
|---|---|---|---|---|---|
| q1 | identification | 30 | What structural motifs or candidate reference environments are needed to model the Mn K-edge XANES spectrum of this single Ir-decorated MnOx sample? | To model the Mn K-edge XANES spectrum of this sample, the required structural motifs are Mn in tetrahedral sites and Mn in octahedral sites. These specific reference environments are needed because the sample consists of manganese oxide nanoparticles decorated with single iridium atoms, which induces a mixed coordination environment for the manganese. The presence of these single Ir atoms on the MnOx host structure results in the Mn atoms being distributed across these two distinct structural motifs. Therefore, both tetrahedral and octahedral coordination geometries must be included to accurately capture the structural state of the nanoparticles. | Full points for identifying both Mn tetrahedral and Mn octahedral sites as the necessary structural motifs. |
| q2 | quantification | 40 | Estimate the relative fractions of the different Mn coordination environments (tetrahedral vs. octahedral sites) in this specific Ir-MnOx sample. | The relative fractions for the Mn coordination environments in this sample are 20% Mn in tetrahedral sites and 80% Mn in octahedral sites, with an uncertainty of 10%. These specific values arise because the material consists of manganese oxide nanoparticles decorated with single iridium atoms on a carbon paper support. This specific single-atom decoration creates a mixed coordination environment where the majority of the manganese atoms are stabilized in octahedral sites. Consequently, only a smaller remainder (20%) of the Mn atoms occupy the tetrahedral structural motifs. | Full points for estimating ~20% Mn tetrahedral sites and ~80% Mn octahedral sites. |
| q3 | reasoning | 30 | Describe the expected distribution of Mn coordination sites for these single iridium-decorated manganese oxide nanoparticles. | In these single iridium-decorated manganese oxide nanoparticles supported on carbon paper, the Mn atoms are expected to exhibit a mixed coordination environment. Because the MnOx nanoparticles are decorated with single Ir atoms, the host lattice distributes the manganese between two distinct structural motifs. As a result of this specific single-atom decoration, the majority of the Mn atoms (80%) occupy octahedral sites. The remaining 20% of the Mn atoms are accommodated in tetrahedral sites, reflecting the specific structural balance achieved in this Ir-MnOx material. | Full points for explaining that the Mn atoms exist in a mixed coordination environment dominated by octahedral sites (80%) with a minor contribution from tetrahedral sites (20%). |
Review
Fe–N–C Boosts the Stability of Supported Platinum Nanoparticles for Fuel Cells
BNL-NSLS-II-8-ID
Catalyst
Fei Xiao et al.
DOI: 10.1021/jacs.2c08305
1 scenario
▶
#827
Pt/Fe-N-C
Fe K
▶
LLM Prompt
Sample Information
Material: Pt/Fe-N-C
Support: Fe-N-C
Sample-Specific Conditions
- Pt deposition: Present
- Pt nanoparticles supported on Fe-N-C
Measurement
We plan to measure the Fe K XANES spectrum of this sample.
Questions
Based on all the information above:
1. Based on the sample conditions (Pt nanoparticles deposited on an Fe-N-C support), what is the expected dominant Fe phase and its approximate oxidation state?
2. Describe the expected differences in the Fe K-edge XANES spectral features (edge position and white line intensity) of the Pt/Fe-N-C catalyst compared to the pristine Fe-N-C support.
3. What physical phenomenon explains the observed changes in the Fe K-edge XANES spectrum (negative edge shift and lower white line intensity) upon deposition of Pt nanoparticles onto the Fe-N-C support?
Ground Truth
Material: Pt/Fe-N-C
Measurement: Fe K-edge, ex-situ, Argonne National Laboratory
Fit method: not reported
Phase fractions: (±10%)
| Phase | Fraction |
|---|---|
| Fe-N-C (single atom) | 1.0 |
Fit basis (paper's reference spectra):
- Fe foil
- FeO
- FePc_O2
- Fe-N-C
Source evidence: Figure 2d and text on page 13
Key reasoning: The Fe K-edge absorption edge of Pt/Fe-N-C is located between those of FePc-O2 (which contains Fe(III)) and FeO (Fe(II)), indicating an oxidation state between +2 and +3. Compared to the pristine Fe-N-C support, Pt/Fe-N-C shows a slightly negative edge shift and lower white line intensity, suggesting a reduced Fe valence state due to mild electron transfer from Pt to Fe. EXAFS confirms the absence of Fe-Fe bonds, indicating Fe remains as single atoms.
Reasoning source: Results section, page 13
Scoring Rubric (total: 100 pts)
| Q | Type | Max | Question | Reference Answer | Scoring Criteria |
|---|---|---|---|---|---|
| q1 | identification | 30 | Based on the sample conditions (Pt nanoparticles deposited on an Fe-N-C support), what is the expected dominant Fe phase and its approximate oxidation state? | The expected dominant Fe phase is Fe-N-C (single atom) with a fraction of 1.0, and its approximate oxidation state is between +2 and +3. This specific phase is expected because the Fe remains as isolated single atoms within the Fe-N-C support, with no Fe-Fe bonds forming despite the addition of Pt. The oxidation state falls between +2 and +3 because the absorption edge is located between those of FeO (Fe(II)) and FePc-O2 (Fe(III)) reference standards. Furthermore, the deposition of Pt nanoparticles on the support induces a mild electron transfer from Pt to Fe, which slightly reduces the Fe valence state compared to the pristine support while maintaining its single-atom nature. | Award full points for identifying Fe as single atoms coordinated with nitrogen and carbon (Fe-N-C) and stating the oxidation state is between +2 and +3. |
| q2 | spectral | 35 | Describe the expected differences in the Fe K-edge XANES spectral features (edge position and white line intensity) of the Pt/Fe-N-C catalyst compared to the pristine Fe-N-C support. | Compared to the pristine Fe-N-C support, the Fe K-edge XANES spectrum of the Pt/Fe-N-C catalyst exhibits a slightly negative edge shift and a lower white line intensity. The absorption edge is specifically positioned between those of FeO and FePc-O2 standards. These spectral changes occur because the deposition of Pt nanoparticles onto the Fe-N-C support alters the electronic properties of the material. Specifically, there is a mild electron transfer from the supported Pt nanoparticles to the single-atom Fe sites. This electron transfer results in a reduced Fe valence state (between +2 and +3), which directly produces the observed negative edge shift and decreased white line intensity. | Award full points for mentioning a slightly negative edge shift and a lower white line intensity for Pt/Fe-N-C compared to pristine Fe-N-C. |
| q3 | reasoning | 35 | What physical phenomenon explains the observed changes in the Fe K-edge XANES spectrum (negative edge shift and lower white line intensity) upon deposition of Pt nanoparticles onto the Fe-N-C support? | The observed negative edge shift and lower white line intensity in the Fe K-edge XANES spectrum are explained by a mild electron transfer from the deposited Pt nanoparticles to the Fe atoms. Because the sample consists of Pt nanoparticles supported on an Fe-N-C network, the proximity of these materials allows for electronic interaction between them. This electron transfer from Pt to Fe reduces the overall valence state of the isolated Fe single atoms to a state between +2 and +3. Consequently, this reduced oxidation state manifests spectrally as an absorption edge positioned at lower energy (between FeO and FePc-O2) and a decreased white line intensity relative to the pristine Fe-N-C support. | Award full points for explaining that the changes indicate a reduced Fe valence state caused by a mild electron transfer from the Pt nanoparticles to the Fe single atoms. |
Review
Unraveling the Electronic Structure and Dynamics of the Atomically Dispersed Iron Sites in Electrochemical CO 2 Reduction
BNL-NSLS-II-8-ID
Catalyst
Yaqiong Zeng et al.
DOI: 10.1021/jacs.3c05457
4 scenarios
▶
#828
FePc-CNT
Fe K-edge
▶
LLM Prompt
Sample Information
Material: FePc-CNT
Support: CNT
Reaction Conditions: CO2-saturated 0.5 M KHCO3, OCP
Sample-Specific Conditions
- Applied Potential: OCP
- Atomically dispersed FePc on CNT at open circuit potential in CO2-saturated electrolyte. Fractions derived from operando Mössbauer spectroscopy which quantifies the states identified by XANES.
Measurement
We plan to measure the Fe K-edge XANES spectrum of this sample.
Questions
Based on all the information above:
1. What is the dominant iron phase present in the FePc-CNT catalyst at open circuit potential (OCP) in a CO2-saturated electrolyte, and what is the physical reasoning for this state?
2. Describe the key pre-edge feature expected in the Fe K-edge XANES spectrum for this sample at OCP, including its energy position and the electronic transition responsible for it.
Ground Truth
Material: FePc-CNT
Measurement: Operando Fe K-edge XANES and 57Fe Mössbauer spectroscopy at beamline 8-ID (ISS) of NSLS-II
Fit method: Mössbauer spectroscopy quantification and FDMNES simulation for XANES
Phase fractions:
| Phase | Fraction |
|---|---|
| O2-Fe(III)Pc | 1.0 |
Fit basis (paper's reference spectra):
- O2-Fe(III)Pc
- Fe(II)Pc
- Fe(II)Pc-CO2-
Source evidence: Fig. 3c, Fig. 4a, Fig. 4g, Page 13-15
Key reasoning: At open circuit potential (OCP) in CO2-saturated electrolyte, the Fe species remains in its initial high-spin Fe(III) state, coordinated with an axial O2 ligand. Operando Mössbauer spectroscopy shows a single doublet (100% relative signal intensity) assigned to HS Fe(III) in O2-Fe(III)Pc. The operando XANES spectrum at OCP exhibits a pre-edge feature identical to O2-Fe(III)N4.
Reasoning source: Results and Discussion: Operando X-ray absorption spectroscopy (Page 13) and Operando 57Fe Mössbauer spectroscopy (Page 14-15)
Scoring Rubric (total: 100 pts)
| Q | Type | Max | Question | Reference Answer | Scoring Criteria |
|---|---|---|---|---|---|
| q1 | identification | 46 | What is the dominant iron phase present in the FePc-CNT catalyst at open circuit potential (OCP) in a CO2-saturated electrolyte, and what is the physical reasoning for this state? | The dominant iron phase present in the FePc-CNT catalyst at open circuit potential (OCP) is O2-Fe(III)Pc, which accounts for 1.0 (100%) of the iron species. This phase arises because, at OCP in the CO2-saturated 0.5 M KHCO3 electrolyte, no reductive potential is applied to alter the initial resting state of the catalyst. Consequently, the atomically dispersed FePc remains in its initial high-spin Fe(III) state, which is axially coordinated with an O2 ligand. Operando Mössbauer spectroscopy confirms this mechanism by exhibiting a single doublet with 100% relative signal intensity assigned exclusively to this O2-Fe(III)Pc state. | Full credit for identifying O2-Fe(III)Pc (or axially O2-coordinated Fe(III)Pc) as the 100% dominant phase and explaining that at OCP, the initial high-spin Fe(III) state is maintained before reductive potentials are applied. |
| q2 | spectral | 54 | Describe the key pre-edge feature expected in the Fe K-edge XANES spectrum for this sample at OCP, including its energy position and the electronic transition responsible for it. | The Fe K-edge XANES spectrum for this sample is expected to exhibit a distinct pre-edge feature, labeled as Peak B, located at 7114.3 eV. This feature originates from a dipole-forbidden 1s→3d electronic transition. Under the specific condition of open circuit potential (OCP) in a CO2-saturated electrolyte, the catalyst remains in its initial O2-Fe(III)Pc resting state rather than being reduced. The axial coordination of the O2 ligand to the Fe cation causes a structural deviation from the planar FeN4 geometry, which enables this 1s→3d transition. The presence of this specific peak at 7114.3 eV serves to distinguish this axially coordinated Fe(III) center from other states, such as square planar Fe(II)Pc or distorted Fe(II)Pc-CO2-, which form at more negative applied potentials. | Full credit for mentioning the pre-edge peak at 7114.3 eV (Peak B) and attributing it to a dipole-forbidden 1s→3d transition that becomes allowed due to deviation from planar FeN4 symmetry caused by axial O2 coordination. |
Review
#829
FePc-CNT
Fe K-edge
▶
LLM Prompt
Sample Information
Material: FePc-CNT
Support: CNT
Reaction Conditions: CO2-saturated 0.5 M KHCO3, -0.4 V vs RHE
Sample-Specific Conditions
- Applied Potential: -0.4 V vs RHE
- Atomically dispersed FePc on CNT at -0.4 V vs RHE in CO2-saturated electrolyte. Fractions derived from operando Mössbauer spectroscopy which quantifies the states identified by XANES.
Measurement
We plan to measure the Fe K-edge XANES spectrum of this sample.
Questions
Based on all the information above:
1. Based on the reaction conditions (-0.4 V vs RHE, CO2-saturated), what candidate iron phases or structural motifs are expected to be present in the FePc-CNT catalyst?
2. Estimate the relative phase fractions of the identified iron species at this applied potential.
3. Explain the physical reasoning for the formation of these specific phases at -0.4 V vs RHE, specifically addressing the role of the CO2-saturated environment.
4. What reference states or basis functions are required to accurately fit the spectroscopic data for this sample under these operando conditions?
Ground Truth
Material: FePc-CNT
Measurement: Operando Fe K-edge XANES and 57Fe Mössbauer spectroscopy
Fit method: Mössbauer spectral fitting (used to quantify states identified by XANES)
Phase fractions:
| Phase | Fraction |
|---|---|
| O2-Fe(III)Pc | 0.33 |
| Fe(II)Pc | 0.55 |
| Fe(II)Pc-CO2- | 0.12 |
Fit basis (paper's reference spectra):
- O2-Fe(III)Pc
- Fe(II)Pc
- Fe(II)Pc-CO2-
Source evidence: Page 15, Figure 4b, 4g, Supplementary Table 6
Key reasoning: At -0.4 V vs RHE in CO2-saturated electrolyte, the initial high-spin Fe(III) species (O2-Fe(III)Pc) is partially reduced to high-spin Fe(II) species due to the applied cathodic potential. This reduction leads to the formation of a square planar Fe(II)Pc species (55%) and an axial intermediate Fe(II)Pc-CO2- (12%). The presence of CO2 allows for the in situ formation of this intermediate, which is not observed in Ar-saturated conditions at the same potential.
Reasoning source: Page 15, 'Operando 57Fe Mössbauer spectroscopy' section
Scoring Rubric (total: 100 pts)
| Q | Type | Max | Question | Reference Answer | Scoring Criteria |
|---|---|---|---|---|---|
| q1 | identification | 25 | Based on the reaction conditions (-0.4 V vs RHE, CO2-saturated), what candidate iron phases or structural motifs are expected to be present in the FePc-CNT catalyst? | The expected iron phases in the FePc-CNT catalyst under these conditions are O2-Fe(III)Pc, Fe(II)Pc, and Fe(II)Pc-CO2-. These specific structural motifs arise because the applied cathodic potential of -0.4 V vs RHE partially reduces the initial high-spin O2-Fe(III)Pc species into high-spin Fe(II) species. This reduction yields a square planar Fe(II)Pc species. Furthermore, the CO2-saturated 0.5 M KHCO3 electrolyte enables the in situ formation of the axial intermediate Fe(II)Pc-CO2-, which would not form under inert conditions. | Full credit for identifying O2-Fe(III)Pc, Fe(II)Pc, and the Fe(II)Pc-CO2- intermediate. Partial credit for identifying only the Fe(II) and Fe(III) oxidation states without the specific coordination environments. |
| q2 | quantification | 25 | Estimate the relative phase fractions of the identified iron species at this applied potential. | At -0.4 V vs RHE, the relative phase fractions are 33% O2-Fe(III)Pc, 55% Fe(II)Pc, and 12% Fe(II)Pc-CO2-. These specific values, quantified via operando Mössbauer spectroscopy, result from the partial reduction of the initial high-spin Fe(III) species driven by the cathodic potential. The applied potential is sufficient to convert the majority of the catalyst into the square planar Fe(II)Pc state (55%), leaving 33% unreduced. Meanwhile, the CO2-saturated environment allows a smaller fraction (12%) of the reduced iron to bind with CO2, forming the axial Fe(II)Pc-CO2- intermediate. | Full credit for estimating fractions close to 33% O2-Fe(III)Pc, 55% Fe(II)Pc, and 12% Fe(II)Pc-CO2- (within +/- 10%). Partial credit if the relative abundance order is correct (Fe(II)Pc > O2-Fe(III)Pc > Fe(II)Pc-CO2-). |
| q3 | reasoning | 30 | Explain the physical reasoning for the formation of these specific phases at -0.4 V vs RHE, specifically addressing the role of the CO2-saturated environment. | The formation of these specific phases is driven by the combination of the applied cathodic potential and the reactive electrolyte. At -0.4 V vs RHE, the initial high-spin O2-Fe(III)Pc species undergoes partial reduction to form high-spin Fe(II) species, primarily the square planar Fe(II)Pc. The CO2-saturated environment plays a critical role by providing the reactant necessary for the in situ formation of the axial Fe(II)Pc-CO2- intermediate. This intermediate specifically requires the presence of CO2 to form, as it is not observed under Ar-saturated conditions at the exact same applied potential. | Full credit for explaining that the cathodic potential drives the partial reduction of Fe(III) to Fe(II), and that the CO2 environment enables the in situ formation of the axial Fe(II)Pc-CO2- intermediate. |
| q4 | identification | 20 | What reference states or basis functions are required to accurately fit the spectroscopic data for this sample under these operando conditions? | To accurately fit the spectroscopic data for this sample, the required basis functions are O2-Fe(III)Pc, Fe(II)Pc, and Fe(II)Pc-CO2-. These reference states are necessary because the applied potential of -0.4 V vs RHE causes the initial O2-Fe(III)Pc state to partially reduce into square planar Fe(II)Pc. Additionally, the CO2-saturated electrolyte facilitates the binding of CO2 to the reduced iron centers, generating the Fe(II)Pc-CO2- axial intermediate. Utilizing this specific set of basis functions accounts for both the potential-driven reduction and the chemical interaction with the CO2 environment. | Full credit for listing the three specific structural models: O2-Fe(III)Pc, Fe(II)Pc, and Fe(II)Pc-CO2-. |
Review
#830
FePc-CNT
Fe K-edge
▶
LLM Prompt
Sample Information
Material: FePc-CNT
Support: CNT
Reaction Conditions: CO2-saturated 0.5 M KHCO3, -0.8 V vs RHE
Sample-Specific Conditions
- Applied Potential: -0.8 V vs RHE
- Atomically dispersed FePc on CNT at -0.8 V vs RHE in CO2-saturated electrolyte. Fractions derived from operando Mössbauer spectroscopy which quantifies the states identified by XANES.
Measurement
We plan to measure the Fe K-edge XANES spectrum of this sample.
Questions
Based on all the information above:
1. What candidate reference species or structural models should be considered to describe the Fe state in the FePc-CNT catalyst at -0.8 V vs RHE in a CO2-saturated electrolyte?
2. Estimate the relative fractions of the Fe species present in the catalyst under these operando conditions (-0.8 V vs RHE, CO2-saturated).
3. Explain the physical and chemical reasoning for the presence of these specific Fe species at -0.8 V vs RHE in the presence of CO2, and why over-reduction to metallic iron is avoided.
Ground Truth
Material: FePc-CNT
Measurement: Fe K-edge operando XANES and 57Fe Mössbauer spectroscopy
Fit method: Fractions derived from Mössbauer spectroscopy fitting; species identified via XANES and FDMNES simulations
Phase fractions:
| Phase | Fraction |
|---|---|
| O2-Fe(III)Pc | 0.2 |
| Fe(II)Pc | 0.53 |
| Fe(II)Pc-CO2- | 0.26 |
Fit basis (paper's reference spectra):
- O2-Fe(III)Pc
- Fe(II)Pc
- Fe(II)Pc-CO2-
Source evidence: Page 15, Figure 4c, 4g, and text describing Mössbauer relative signal intensities at -0.8 V vs RHE in CO2.
Key reasoning: At -0.8 V vs RHE in CO2-saturated electrolyte, the initial high-spin O2-Fe(III)Pc species is largely reduced to high-spin Fe(II) species due to the applied cathodic potential. In the presence of CO2, an axial catalytic intermediate, Fe(II)Pc-CO2-, is formed in situ, which accounts for 26% of the Fe sites. The bare Fe(II)Pc species accounts for 53%, while 20% remains as unreduced O2-Fe(III)Pc. The stabilization of the Fe(II) species by the reduced Pc ligand and the CO2 adsorbate prevents over-reduction to metallic iron, which otherwise occurs in Ar-saturated electrolytes at this same potential.
Reasoning source: Page 15, Operando 57Fe Mössbauer spectroscopy section; Page 12-13, Operando X-ray absorption spectroscopy section
Scoring Rubric (total: 100 pts)
| Q | Type | Max | Question | Reference Answer | Scoring Criteria |
|---|---|---|---|---|---|
| q1 | identification | 30 | What candidate reference species or structural models should be considered to describe the Fe state in the FePc-CNT catalyst at -0.8 V vs RHE in a CO2-saturated electrolyte? | The candidate reference species to describe the Fe state are O2-Fe(III)Pc, Fe(II)Pc, and Fe(II)Pc-CO2-. These specific phases are expected because the applied cathodic potential of -0.8 V vs RHE largely reduces the initial high-spin O2-Fe(III)Pc species into high-spin Fe(II) species. Furthermore, the presence of the CO2-saturated electrolyte leads to the in situ formation of the axial catalytic intermediate Fe(II)Pc-CO2-. Over-reduction to metallic iron is prevented under these conditions because the Fe(II) species is stabilized by the reduced Pc ligand and the CO2 adsorbate. | Full credit for identifying the initial O2-Fe(III)Pc, the reduced Fe(II)Pc, and the CO2-adsorbed intermediate Fe(II)Pc-CO2-. Partial credit for missing one species. |
| q2 | quantification | 35 | Estimate the relative fractions of the Fe species present in the catalyst under these operando conditions (-0.8 V vs RHE, CO2-saturated). | Under these operando conditions, the relative fractions of the Fe species are 53% Fe(II)Pc, 26% Fe(II)Pc-CO2-, and 20% O2-Fe(III)Pc. These specific values result from the applied cathodic potential (-0.8 V vs RHE) reducing the majority of the initial O2-Fe(III)Pc, leaving only 20% unreduced. The CO2-saturated environment allows 26% of the Fe sites to bind CO2 and form the Fe(II)Pc-CO2- catalytic intermediate. The remaining 53% exists as bare Fe(II)Pc, which avoids over-reduction to metallic iron due to stabilization by the reduced Pc ligand and CO2 adsorbate. | Full credit for fractions within ±10% of the ground truth: ~20% O2-Fe(III)Pc, ~53% Fe(II)Pc, and ~26% Fe(II)Pc-CO2-. Partial credit if the dominant species are correctly identified but fractions are off by up to 20%. |
| q3 | reasoning | 35 | Explain the physical and chemical reasoning for the presence of these specific Fe species at -0.8 V vs RHE in the presence of CO2, and why over-reduction to metallic iron is avoided. | At an applied potential of -0.8 V vs RHE, the cathodic conditions drive the reduction of the initial high-spin O2-Fe(III)Pc species into high-spin Fe(II) species. Because the electrolyte is saturated with CO2, an axial catalytic intermediate, Fe(II)Pc-CO2-, forms in situ on a portion of the active sites. Over-reduction to metallic iron, which typically occurs at this potential in Ar-saturated electrolytes, is avoided under these specific conditions. This protection occurs because the Fe(II) species is chemically stabilized by both the reduced phthalocyanine (Pc) ligand and the presence of the CO2 adsorbate. | Full credit for explaining that the cathodic potential reduces Fe(III) to Fe(II), CO2 coordinates to form the Fe(II)Pc-CO2- intermediate, and the combination of the reduced Pc ligand and CO2 adsorbate stabilizes the Fe(II) state, preventing reduction to metallic iron (which happens in Ar). |
Review
#831
FePc-CNT
Fe K-edge
▶
LLM Prompt
Sample Information
Material: FePc-CNT
Support: CNT
Reaction Conditions: CO2-saturated 0.5 M KHCO3, after testing (OCP)
Sample-Specific Conditions
- Applied Potential: AFT (OCP)
- Atomically dispersed FePc on CNT after removing the applied potential in CO2-saturated electrolyte. Fractions derived from operando Mössbauer spectroscopy.
Measurement
We plan to measure the Fe K-edge XANES spectrum of this sample.
Questions
Based on all the information above:
1. Based on the reaction conditions (after removing the applied potential in CO2-saturated electrolyte), identify the candidate Fe phases present and estimate their relative fractions.
2. What candidate reference spectra or structural models would be needed as a basis to fit the XANES spectrum of this sample?
Ground Truth
Material: FePc-CNT
Measurement: Operando Fe K-edge XANES and 57Fe Mössbauer spectroscopy
Fit method: Mössbauer spectroscopy fitting (cross-referenced with XANES)
Phase fractions:
| Phase | Fraction |
|---|---|
| O2-Fe(III)Pc | 0.51 |
| Fe(II)Pc | 0.49 |
Fit basis (paper's reference spectra):
- O2-Fe(III)Pc
- Fe(II)Pc
Source evidence: Page 15, Fig. 4d, Supplementary Table 6
Key reasoning: After removing the applied potential (AFT) in CO2-saturated electrolyte, the in situ formed catalytic intermediate Fe(II)Pc-CO2- disappears. The initial O2-Fe(III)Pc species partially recovers to 51%, while the Fe(II)Pc species remains at 49%. This indicates that the Fe(III) to Fe(II) reduction is not completely reversible, possibly due to a change in the axial ligand present atop Fe before and after CO2RR.
Reasoning source: Page 13 (XANES section) and Page 15 (Mössbauer section)
Scoring Rubric (total: 100 pts)
| Q | Type | Max | Question | Reference Answer | Scoring Criteria |
|---|---|---|---|---|---|
| q1 | quantification | 67 | Based on the reaction conditions (after removing the applied potential in CO2-saturated electrolyte), identify the candidate Fe phases present and estimate their relative fractions. | Based on the reaction conditions after removing the applied potential (OCP) in the CO2-saturated 0.5 M KHCO3 electrolyte, the sample consists of O2-Fe(III)Pc (51%) and Fe(II)Pc (49%). These specific fractions arise because removing the applied potential causes the in situ formed catalytic intermediate, Fe(II)Pc-CO2-, to disappear. Consequently, the initial O2-Fe(III)Pc species partially recovers to 51%, while the remaining 49% stays as Fe(II)Pc. This incomplete recovery indicates that the Fe(III) to Fe(II) reduction during the reaction is not completely reversible, likely due to a change in the axial ligand present atop the Fe center before and after the CO2 reduction reaction. | Full points if O2-Fe(III)Pc and Fe(II)Pc are identified with fractions around ~50% each (e.g., 51% and 49%). Partial points if the phases are identified but fractions are inaccurate, or if only one phase is identified. |
| q3 | identification | 33 | What candidate reference spectra or structural models would be needed as a basis to fit the XANES spectrum of this sample? | To fit the XANES spectrum of this FePc-CNT sample, the required candidate reference spectra or structural models are O2-Fe(III)Pc and Fe(II)Pc. These specific references are needed because, after removing the applied potential in the CO2-saturated electrolyte, the active Fe(II)Pc-CO2- intermediate dissipates. The system then reverts to a mixture where the initial O2-Fe(III)Pc species only partially recovers, leaving a significant portion of the material as Fe(II)Pc. This mixture occurs because the Fe(III) to Fe(II) reduction is not fully reversible under these open-circuit conditions, which is attributed to changes in the axial ligand atop the Fe atom following the CO2 reduction reaction. | Full points if O2-Fe(III)Pc and Fe(II)Pc are listed as the necessary reference spectra/models. |
Review
Stable Pentagonal Layered Palladium Diselenide Enables Rapid Electrosynthesis of Hydrogen Peroxide
APS
Catalyst
R. Dominic Ross et al.
DOI: 10.1021/jacs.4c00875
2 scenarios
▶
#832
PdSe2
Pd L3-edge
▶
LLM Prompt
Sample Information
Material: PdSe2
Sample-Specific Conditions
- state: pristine
- Hydrothermally synthesized PdSe2 nanoplates
Measurement
We plan to measure the Pd L3-edge XANES spectrum of this sample.
Questions
Based on all the information above:
1. What candidate reference spectra are needed to evaluate the oxidation state of pristine PdSe2 nanoplates using Pd L3-edge XANES, and what is the expected oxidation state of the sample?
2. Describe the expected spectral shape and distinguishing features of the pristine PdSe2 sample at the Pd L3-edge relative to common reference standards.
3. Based on the comparison with standard reference materials, what is the physical reasoning for assigning the specific oxidation state to the pristine PdSe2 nanoplates?
Ground Truth
Material: PdSe2
Measurement: Pd L3-edge XANES, fluorescence mode, beamline 9-BM
Fit method: not reported
Phase fractions:
| Phase | Fraction |
|---|---|
| PdSe2 | 1.0 |
Fit basis (paper's reference spectra):
- Pd foil
- PdO
- K2PdCl6
Source evidence: Figure 2f and text on page 12
Key reasoning: The position of the white line and the white line intensity for PdSe2 are most similar to that of PdO (Pd2+). They fall between the intensities and edge positions of Pd foil (Pd0) and K2PdCl6 (Pd4+). This indicates that the oxidation state of Pd in the pristine PdSe2 nanoplates is close to +2.
Reasoning source: RESULTS AND DISCUSSION, Synthesis and Characterization of PdSe2 Nanoplates section, page 12
Scoring Rubric (total: 100 pts)
| Q | Type | Max | Question | Reference Answer | Scoring Criteria |
|---|---|---|---|---|---|
| q1 | identification | 30 | What candidate reference spectra are needed to evaluate the oxidation state of pristine PdSe2 nanoplates using Pd L3-edge XANES, and what is the expected oxidation state of the sample? | To evaluate the oxidation state of the pristine PdSe2 nanoplates, the required candidate reference spectra are Pd foil (Pd0), PdO (Pd2+), and K2PdCl6 (Pd4+). The expected oxidation state of the sample is +2, corresponding to a pure PdSe2 phase with a fraction of 1.0. Because the sample consists of hydrothermally synthesized pristine PdSe2 nanoplates, references spanning multiple oxidation states (0, +2, +4) are necessary to accurately bracket its electronic state. The +2 oxidation state is expected because the white line position and intensity of the pristine nanoplates closely match the PdO (Pd2+) reference, falling squarely between the Pd(0) and Pd(4+) standards. | Full credit if the answer identifies Pd foil (Pd0), PdO (Pd2+), and K2PdCl6 (Pd4+) as the reference spectra and correctly states the expected oxidation state is +2. |
| q2 | spectral | 40 | Describe the expected spectral shape and distinguishing features of the pristine PdSe2 sample at the Pd L3-edge relative to common reference standards. | The expected Pd L3-edge XANES spectrum of the pristine PdSe2 sample exhibits a prominent white line. Its distinguishing features are that the white line intensity and edge position fall between those of Pd(0) (Pd foil) and Pd(4+) (K2PdCl6), most closely matching the PdO standard. These spectral features arise directly from the electronic structure of the hydrothermally synthesized pristine PdSe2 nanoplates. Because the pristine material contains pure PdSe2 with Pd in a +2 oxidation state, its absorption edge and white line intensity naturally align with the Pd(2+) reference rather than the fully reduced or highly oxidized standards. | Full credit if the answer describes the presence of a white line whose intensity and edge position fall between those of Pd foil and K2PdCl6, and notes that it is most similar to PdO. |
| q3 | reasoning | 30 | Based on the comparison with standard reference materials, what is the physical reasoning for assigning the specific oxidation state to the pristine PdSe2 nanoplates? | The physical reasoning for assigning a +2 oxidation state to the pristine PdSe2 nanoplates is based on the position and intensity of the white line in its Pd L3-edge XANES spectrum. When comparing the hydrothermally synthesized pristine sample to standard reference materials, its white line intensity and edge position fall squarely between those of Pd foil (Pd0) and K2PdCl6 (Pd4+). Specifically, these spectral features are most similar to those of PdO, a known Pd2+ standard. Because the pristine nanoplates consist of pure PdSe2, this direct spectral alignment with PdO confirms that the oxidation state of Pd in the pristine material is +2. | Full credit if the answer explains that the oxidation state is assigned as +2 because the white line position and intensity closely match the PdO (Pd2+) standard, rather than the Pd(0) or Pd(4+) standards. |
Review
#833
PdSe2
Se K-edge
▶
LLM Prompt
Sample Information
Material: PdSe2
Sample-Specific Conditions
- state: pristine
- Hydrothermally synthesized PdSe2 nanoplates
Measurement
We plan to measure the Se K-edge XANES spectrum of this sample.
Questions
Based on all the information above:
1. Based on the sample conditions, what is the expected oxidation state and local structural motif of Se in pristine PdSe2, and what reference materials would be useful to compare against to confirm this state via XANES?
2. Describe the expected key spectral features (specifically peak positions) in the Se K-edge XANES spectrum of pristine PdSe2.
3. How can the Se K-edge XANES spectrum of pristine PdSe2 be distinguished from elemental Se powder and oxidized Se compounds like SeO2?
Ground Truth
Material: PdSe2
Measurement: Se K-edge XANES, fluorescence mode, Advanced Photon Source (beamlines 10-ID, 9-BM, or 20-BM)
Fit method: Qualitative comparison
Phase fractions:
| Phase | Fraction |
|---|---|
| PdSe2 | 1.0 |
Fit basis (paper's reference spectra):
- Se powder
- SeO2
- CoSe2
Source evidence: Figure 5e and text on page 17
Key reasoning: The Se K-edge XANES spectrum of pristine PdSe2 exhibits a main white line peak at ~12660 eV and a post-white line peak at ~12770 eV. The presence of the 12770 eV peak and the lack of a blue-shifted white line confirm the anionic character of Se (Se2 2- dumbbells) and distinguish it from elemental Se(0) or oxidized SeO2. The peak shapes are also noted to be similar to Se2 2- in CoSe2.
Reasoning source: RESULTS AND DISCUSSION, Ex-situ and In-situ Studies on the Stability of PdSe2 (Page 17)
Scoring Rubric (total: 100 pts)
| Q | Type | Max | Question | Reference Answer | Scoring Criteria |
|---|---|---|---|---|---|
| q1 | identification | 30 | Based on the sample conditions, what is the expected oxidation state and local structural motif of Se in pristine PdSe2, and what reference materials would be useful to compare against to confirm this state via XANES? | In pristine, hydrothermally synthesized PdSe2 nanoplates, the expected oxidation state of Se is anionic, specifically forming Se2 2- dumbbell structural motifs. Because the sample is in its pristine, unoxidized state, it consists entirely of the pure PdSe2 phase. To confirm this state via XANES, useful reference materials include Se powder (for elemental Se(0)), SeO2 (for oxidized cationic Se), and CoSe2. CoSe2 is a particularly relevant reference because it contains similar Se2 2- dumbbells in a pyrite phase, allowing for direct comparison of the anionic structural motif present in the pristine sample. | Award full points if the answer identifies the anionic Se2 2- (dumbbell) state and suggests comparing against elemental Se powder, oxidized Se (like SeO2), and/or a similar dichalcogenide like CoSe2. |
| q2 | spectral | 35 | Describe the expected key spectral features (specifically peak positions) in the Se K-edge XANES spectrum of pristine PdSe2. | The Se K-edge XANES spectrum of pristine PdSe2 nanoplates is expected to exhibit a main white line peak at ~12660 eV and a distinct post-white line peak at ~12770 eV. These specific spectral features arise directly from the pristine, hydrothermally synthesized condition of the sample, which preserves the pure anionic Se2 2- dumbbell structure. The presence of the 12770 eV peak and the lack of a blue-shifted white line are electronic and structural consequences of this unoxidized, anionic Se state. Furthermore, the overall peak shapes reflect the specific local coordination environment of these Se2 2- dumbbells, closely resembling the features produced by pyrite-phase CoSe2. | Award full points if the answer correctly identifies the main white line peak at ~12660 eV and the distinct post-white line peak at ~12770 eV. |
| q3 | reasoning | 35 | How can the Se K-edge XANES spectrum of pristine PdSe2 be distinguished from elemental Se powder and oxidized Se compounds like SeO2? | The Se K-edge XANES spectrum of pristine PdSe2 can be distinguished from elemental Se(0) powder by the clear presence of a post-white line peak near 12770 eV. Additionally, it can be differentiated from oxidized, cationic Se compounds like SeO2 by the absence of a clearly blue-shifted main white line peak. These distinguishing features occur because the hydrothermally synthesized PdSe2 sample is in a pristine state characterized exclusively by anionic Se2 2- dumbbells. Consequently, its electronic structure lacks the higher oxidation states that would cause a blue shift, and its specific dumbbell structural motif generates the distinct 12770 eV scattering resonance not found in elemental selenium. | Award full points if the answer explains that PdSe2 has a clear peak near 12770 eV (unlike Se powder) and lacks the blue-shifted white line peak characteristic of cationic Se compounds like SeO2. |
Review
Electrifying Hydroformylation Catalysts Exposes Voltage-Driven C–C Bond Formation
BNL-NSLS-II-8-ID
Catalyst
Joy S. Zeng et al.
DOI: 10.1021/jacs.4c02992
1 scenario
▶
#834
Rh@CeO2
Rh K-edge
▶
LLM Prompt
Sample Information
Material: Rh@CeO2
Support: CeO2
Sample-Specific Conditions
- state: as-synthesized
- As-synthesized Rh deposited on CeO2 nanoparticles. EXAFS fitting shows Rh-O coordination number of 5.8 ± 1.5.
Measurement
We plan to measure the Rh K-edge XANES spectrum of this sample.
Questions
Based on all the information above:
1. Based on the synthesis conditions (as-synthesized, wetness impregnation on CeO2), what is the expected dominant Rh phase, and what structural evidence from the sample description supports this?
2. If performing Linear Combination Fitting (LCF) on the XANES spectrum of this as-synthesized sample, what primary reference spectrum is essential to include in the fit basis?
3. Why is metallic Rh not expected to be present in this specific sample state?
Ground Truth
Material: Rh@CeO2
Measurement: Rh K-edge, ex-situ
Fit method: not reported
Phase fractions: (±15%)
| Phase | Fraction |
|---|---|
| Rh2O3 | 1.0 |
Fit basis (paper's reference spectra):
- Rh2O3
Source evidence: text/figure_2
Key reasoning: The as-synthesized Rh deposited on CeO2 nanoparticles via wetness impregnation is fully oxidized. EXAFS fitting confirms an Rh-O coordination number of 5.8 ± 1.5, which is consistent with the formation of Rh2O3.
Reasoning source: Sample description
Scoring Rubric (total: 100 pts)
| Q | Type | Max | Question | Reference Answer | Scoring Criteria |
|---|---|---|---|---|---|
| q1 | identification | 40 | Based on the synthesis conditions (as-synthesized, wetness impregnation on CeO2), what is the expected dominant Rh phase, and what structural evidence from the sample description supports this? | The expected dominant Rh phase is Rh2O3, which accounts for a 1.0 fraction (100%) of the sample. This fully oxidized state arises because the sample is in its as-synthesized state following deposition on CeO2 nanoparticles via wetness impregnation, prior to any reducing treatments. The structural evidence supporting this outcome is derived from EXAFS fitting, which shows an Rh-O coordination number of 5.8 ± 1.5. This specific coordination environment is consistent with the formation of Rh2O3 under these synthesis conditions. | Award 20 points for identifying Rh2O3 (or fully oxidized Rh) as the dominant phase. Award 20 points for mentioning the Rh-O coordination number of 5.8 ± 1.5 from EXAFS fitting. |
| q2 | reasoning | 30 | If performing Linear Combination Fitting (LCF) on the XANES spectrum of this as-synthesized sample, what primary reference spectrum is essential to include in the fit basis? | The essential primary reference spectrum to include in the fit basis is Rh2O3. This is required because the sample consists of a 1.0 fraction of Rh2O3, meaning it will entirely dominate the spectral features. The necessity of this specific reference arises directly from the sample conditions, where as-synthesized Rh deposited on CeO2 via wetness impregnation remains fully oxidized. This complete oxidation to Rh2O3 is structurally confirmed by the EXAFS Rh-O coordination number of 5.8 ± 1.5, dictating that the XANES spectrum will be entirely represented by the Rh2O3 reference. | Award 30 points for stating Rh2O3 as the essential reference spectrum. |
| q3 | reasoning | 30 | Why is metallic Rh not expected to be present in this specific sample state? | Metallic Rh is not expected to be present because the sample is strictly in an as-synthesized state following deposition on CeO2 nanoparticles via wetness impregnation. Under these specific initial conditions, the Rh species is fully oxidized, resulting in a 1.0 fraction of Rh2O3. The absence of metallic Rh is structurally confirmed by EXAFS fitting, which reveals an Rh-O coordination number of 5.8 ± 1.5, consistent with an oxide rather than Rh-Rh metallic bonding. Therefore, the synthesis conditions dictate the complete formation of Rh2O3, precluding the presence of metallic Rh. | Award 30 points for explaining that the sample is in its 'as-synthesized' state (ex-situ) without any reduction treatment, leading to a fully oxidized state (Rh2O3) characterized by Rh-O bonds. |
Review
From Methane to Methanol: Pd-iC-CeO 2 Catalysts Engineered for High Selectivity via Mechanochemical Synthesis
BNL-NSLS-II-8-ID
Catalyst
Juan D. Jiménez et al.
DOI: 10.1021/jacs.4c04815
1 scenario
▶
#835
Pd-iC-CeO2
Pd K
▶
LLM Prompt
Sample Information
Material: Pd-iC-CeO2
Support: CeO2
Reaction Conditions: 34 bar total pressure, 20 bar CH4 pressure, 0.01 M H2O2 (aq), 90 °C
Sample-Specific Conditions
- Temperature: 90 °C
- Pd-iC-CeO2 catalyst measured under in situ high-pressure liquid-gas-solid methane to methanol reaction conditions at 90 °C
Measurement
We plan to measure the Pd K XANES spectrum of this sample.
Questions
Based on all the information above:
1. What candidate reference spectra are needed to properly model the Pd K-edge XANES spectrum of the Pd-iC-CeO2 catalyst under these specific in situ reaction conditions?
2. Based on the provided reaction conditions (90 °C, 34 bar total pressure, 20 bar CH4, 0.01 M H2O2), estimate the phase fractions of the components present in the catalyst.
3. Explain the physical reasoning for the expected phase composition of the Pd-iC-CeO2 catalyst at 90 °C under these high-pressure methane-to-methanol reaction conditions.
Ground Truth
Material: Pd-iC-CeO2
Measurement: Pd K-edge, in-situ
Fit method: LCF
Phase fractions: (±10%)
| Phase | Fraction |
|---|---|
| metallic_palladium | 0.13 |
| pristine Pd-iC-CeO2 | 0.87 |
Fit basis (paper's reference spectra):
- metallic_palladium
- pristine Pd-iC-CeO2
Source evidence: text
Key reasoning: Under in situ high-pressure liquid-gas-solid methane to methanol reaction conditions (34 bar total pressure, 20 bar CH4, 0.01 M H2O2) at 90 °C, the catalyst undergoes minor structural changes. The pristine Pd-iC-CeO2 phase remains highly stable and dominates the composition at 87%. However, the reaction environment and elevated temperature (90 °C) induce a slight reduction, resulting in the formation of a minor metallic palladium phase (13%).
Reasoning source: text
Scoring Rubric (total: 100 pts)
| Q | Type | Max | Question | Reference Answer | Scoring Criteria |
|---|---|---|---|---|---|
| q1 | identification | 20 | What candidate reference spectra are needed to properly model the Pd K-edge XANES spectrum of the Pd-iC-CeO2 catalyst under these specific in situ reaction conditions? | To properly model the Pd K-edge XANES spectrum of the Pd-iC-CeO2 catalyst under these conditions, reference spectra for pristine Pd-iC-CeO2 and metallic palladium are required. These specific phases are expected because the catalyst undergoes minor structural changes during the in situ high-pressure liquid-gas-solid methane to methanol reaction (34 bar total pressure, 20 bar CH4, 0.01 M H2O2) at 90 °C. The pristine Pd-iC-CeO2 phase remains highly stable in this environment and therefore dominates the composition. However, the combination of the reaction environment and the elevated temperature of 90 °C induces a slight reduction of the catalyst, necessitating the inclusion of a metallic palladium reference to account for the newly formed minor phase. | Full points if the answer identifies pristine Pd-iC-CeO2 and metallic palladium as the necessary reference spectra. |
| q2 | quantification | 40 | Based on the provided reaction conditions (90 °C, 34 bar total pressure, 20 bar CH4, 0.01 M H2O2), estimate the phase fractions of the components present in the catalyst. | Under the specified reaction conditions, the catalyst composition is estimated to be 87% pristine Pd-iC-CeO2 and 13% metallic palladium, with an uncertainty of 10%. These specific values result from the high stability of the pristine Pd-iC-CeO2 phase, which allows it to remain the dominant component (87%) during the methane to methanol conversion. The 13% metallic palladium fraction arises because the in situ high-pressure liquid-gas-solid environment (34 bar total pressure, 20 bar CH4, 0.01 M H2O2) and elevated temperature of 90 °C induce a slight reduction of the catalyst. This minor structural change accounts for the small but distinct metallic palladium phase fraction. | Full points if the answer correctly estimates ~87% pristine Pd-iC-CeO2 and ~13% metallic palladium. Deduct points proportionally for deviations greater than 10%. |
| q3 | reasoning | 40 | Explain the physical reasoning for the expected phase composition of the Pd-iC-CeO2 catalyst at 90 °C under these high-pressure methane-to-methanol reaction conditions. | The expected phase composition of 87% pristine Pd-iC-CeO2 and 13% metallic palladium is driven by the catalyst's response to the in situ high-pressure liquid-gas-solid methane to methanol reaction conditions. At 90 °C, with 34 bar total pressure, 20 bar CH4, and 0.01 M H2O2, the pristine Pd-iC-CeO2 phase demonstrates high stability, allowing it to dominate the overall composition. Despite this stability, the specific reaction environment and elevated temperature trigger minor structural changes within the catalyst. Specifically, these conditions induce a slight reduction mechanism, which leads to the formation of the minor (13%) metallic palladium phase. | Full points if the answer explains that the pristine Pd-iC-CeO2 phase is largely stable/preserved under these conditions, but the temperature and reaction environment induce a minor reduction to metallic palladium. |
Review
Visualizing Size-Dependent Dynamics of CeO 2−δ {100}-Supported CoO x Nanoparticles Under CO 2 Hydrogenation Conditions
BNL-NSLS-II-8-ID
Catalyst
Kaixi Deng et al.
DOI: 10.1021/jacs.5c04901
3 scenarios
▶
#836
Co/CeO2
Co K-edge
▶
LLM Prompt
Sample Information
Material: Co/CeO2
Support: CeO2-cube
Reaction Conditions: H2 environment at 250 °C
Sample-Specific Conditions
- Reaction time: 0 min
- Pre-reduced cobalt on ceria nanocubes before CO2 introduction
Measurement
We plan to measure the Co K-edge XANES spectrum of this sample.
Questions
Based on all the information above:
1. What candidate reference spectra are required to properly model the Co K-edge XANES data of this catalyst system during the in-situ CO2 hydrogenation experiment using linear combination fitting (LCF)?
2. Given the sample conditions (pre-reduced in H2 at 450 °C, then cooled to 250 °C in H2, t=0 min), what is the expected dominant cobalt phase present in the catalyst before CO2 is introduced?
3. Explain the physical reasoning for why this specific cobalt phase dominates at t=0 min, based on the sample's pre-treatment history.
Ground Truth
Material: 5 wt% Co/CeO2-cube
Measurement: Co K-edge in-situ XANES
Fit method: Linear combination fitting (LCF)
Phase fractions:
| Phase | Fraction |
|---|---|
| Co0 | 1.0 |
| CoO | 0.0 |
| Co3O4 | 0.0 |
Fit basis (paper's reference spectra):
- Co0
- CoO
- Co3O4
Source evidence: Figure 5b, page 16
Key reasoning: The sample was pre-reduced in a 1 atm H2 environment at 450 °C for 30 minutes. In-situ XAFS and XRD data collected after this reduction point exclusively to the presence of metallic cobalt, with no signals corresponding to CoO or Co3O4 phases detected. When the sample is subsequently cooled to 250 °C under H2 (t=0 min, just before CO2 introduction), the cobalt remains fully reduced as metallic Co.
Reasoning source: Page 8 (Results and Discussion, Section A) and Page 16 (Figure 5 caption/text)
Scoring Rubric (total: 100 pts)
| Q | Type | Max | Question | Reference Answer | Scoring Criteria |
|---|---|---|---|---|---|
| q1 | identification | 20 | What candidate reference spectra are required to properly model the Co K-edge XANES data of this catalyst system during the in-situ CO2 hydrogenation experiment using linear combination fitting (LCF)? | To properly model the Co K-edge XANES data using linear combination fitting (LCF), the required candidate reference spectra are metallic Co0, CoO, and Co3O4. These specific reference phases are necessary because they represent the possible oxidation states of cobalt during the catalyst's treatment and reaction cycle. The sample was pre-reduced in a 1 atm H2 environment at 450 °C and then cooled to 250 °C under H2, a process designed to drive the cobalt to a fully reduced metallic state (Co0). However, the oxidized references (CoO and Co3O4) must also be included in the fitting basis to confirm the complete absence of oxidized species at t=0 min and to track any potential phase changes during the subsequent CO2 hydrogenation. | Full credit for identifying metallic Co (Co0), CoO, and Co3O4 as the necessary reference standards. |
| q2 | prediction | 30 | Given the sample conditions (pre-reduced in H2 at 450 °C, then cooled to 250 °C in H2, t=0 min), what is the expected dominant cobalt phase present in the catalyst before CO2 is introduced? | At t=0 min, before the introduction of CO2, the expected dominant cobalt phase is exclusively metallic Co0, representing a phase fraction of 1.0 (100%), with CoO and Co3O4 fractions at 0.0. This complete reduction results directly from the sample's pre-treatment conditions, where the Co/CeO2-cube catalyst was exposed to a 1 atm H2 environment at 450 °C for 30 minutes. Under these highly reducing conditions and elevated temperatures, all initial cobalt oxides are fully reduced to metallic cobalt. Because the sample is subsequently maintained in a reducing H2 environment while cooling to the 250 °C reaction temperature, the cobalt remains entirely stabilized in this metallic state. | Full credit for stating that metallic cobalt (Co0) is the dominant phase (100%). |
| q3 | reasoning | 50 | Explain the physical reasoning for why this specific cobalt phase dominates at t=0 min, based on the sample's pre-treatment history. | The dominance of the metallic Co0 phase at t=0 min is a direct consequence of the aggressive pre-reduction treatment applied to the Co/CeO2-cube catalyst. Specifically, the sample was subjected to a 1 atm H2 environment at 450 °C for 30 minutes prior to the reaction. This high-temperature hydrogen treatment provides the necessary thermodynamic driving force to completely remove oxygen from any initial cobalt oxide species, reducing them entirely to metallic cobalt. When the system is subsequently cooled to the reaction temperature of 250 °C while still under the H2 atmosphere, there is no oxidizing agent present to re-oxidize the metal. Consequently, in-situ XAFS and XRD confirm that the cobalt remains fully stabilized as 100% metallic Co0 just before CO2 is introduced. | Full credit for explaining that the 30-minute pre-reduction in H2 at 450 °C fully reduces the initial cobalt oxide species to metallic cobalt, and this fully reduced state is maintained when cooled to 250 °C in the H2 environment prior to CO2 introduction. |
Review
#837
Co/CeO2
Co K-edge
▶
LLM Prompt
Sample Information
Material: Co/CeO2
Support: CeO2-cube
Reaction Conditions: H2+CO2 (4:1) mixture at 250 °C
Sample-Specific Conditions
- Reaction time: 10 min
- Cobalt on ceria nanocubes during rapid transient oxidation phase after CO2 introduction
Measurement
We plan to measure the Co K-edge XANES spectrum of this sample.
Questions
Based on all the information above:
1. Based on the reaction conditions and the transient nature of the catalyst, what candidate reference spectra should be included in a linear combination fitting (LCF) analysis of the Co K-edge XANES spectrum?
2. Estimate the relative phase fractions of the cobalt species present in the catalyst after 10 minutes of exposure to the H2+CO2 mixture at 250 °C.
3. Explain the physical and chemical reasons for the phase composition observed at this 10-minute transient stage, specifically addressing why significant fractions of oxidized cobalt phases are present despite the H2-containing environment.
Ground Truth
Material: 5 wt% Co/CeO2-cube
Measurement: Co K-edge in-situ XANES
Fit method: Linear combination fitting (LCF)
Phase fractions:
| Phase | Fraction |
|---|---|
| Co0 | 0.62 |
| CoO | 0.3 |
| Co3O4 | 0.08 |
Fit basis (paper's reference spectra):
- Co0
- CoO
- Co3O4
Source evidence: Figure 5b, page 16
Key reasoning: Upon switching the gas feed from H2 to a H2+CO2 mixture at 250 °C, the initially reduced cobalt undergoes a rapid, kinetically-controlled oxidation process during the first 5-10 minutes. The reduced cobalt reacts aggressively with CO2 and pre-adsorbed H2, leading to a sharp decrease in metallic cobalt and the emergence of CoO and Co3O4 phases. This transient oxidation peaks before the system begins to slowly reduce again at longer reaction times.
Reasoning source: Section B (pages 16-17) and Figure 5b
Scoring Rubric (total: 100 pts)
| Q | Type | Max | Question | Reference Answer | Scoring Criteria |
|---|---|---|---|---|---|
| q1 | identification | 20 | Based on the reaction conditions and the transient nature of the catalyst, what candidate reference spectra should be included in a linear combination fitting (LCF) analysis of the Co K-edge XANES spectrum? | The linear combination fitting (LCF) analysis of the Co K-edge XANES spectrum should include Co0, CoO, and Co3O4 as reference spectra. These specific phases are expected because the introduction of the H2+CO2 (4:1) mixture at 250 °C triggers a rapid, kinetically-controlled oxidation of the initially reduced cobalt catalyst. During this 10-minute transient phase, the reduced cobalt reacts aggressively with CO2 and pre-adsorbed H2. This reaction causes a sharp decrease in metallic cobalt (Co0) and the simultaneous emergence of oxidized species, specifically CoO and Co3O4, before the system begins to slowly reduce again at longer reaction times. | Full credit for identifying metallic Co (Co0), CoO, and Co3O4 as the necessary reference spectra. |
| q2 | quantification | 40 | Estimate the relative phase fractions of the cobalt species present in the catalyst after 10 minutes of exposure to the H2+CO2 mixture at 250 °C. | After 10 minutes of exposure to the H2+CO2 mixture at 250 °C, the estimated relative phase fractions are 0.62 for Co0, 0.30 for CoO, and 0.08 for Co3O4. These specific values result from a rapid, kinetically-controlled oxidation process that occurs immediately after switching the gas feed to the H2+CO2 mixture. The aggressive reaction of the initially reduced cobalt with CO2 and pre-adsorbed H2 leads to a sharp decrease in the metallic Co0 fraction down to 62%. Concurrently, this transient oxidation peaks around 10 minutes, generating significant oxidized fractions of CoO (30%) and Co3O4 (8%) before the catalyst begins to slowly reduce again. | Full credit for estimating metallic Co at ~62%, CoO at ~30%, and Co3O4 at ~8% (allow ±10% absolute margin for each). |
| q3 | reasoning | 40 | Explain the physical and chemical reasons for the phase composition observed at this 10-minute transient stage, specifically addressing why significant fractions of oxidized cobalt phases are present despite the H2-containing environment. | The presence of significant oxidized cobalt phases (30% CoO and 8% Co3O4) alongside metallic cobalt (62% Co0) is driven by a rapid, kinetically-controlled oxidation process. When the gas feed is switched to the H2+CO2 (4:1) mixture at 250 °C, the initially reduced cobalt reacts aggressively with the newly introduced CO2 and pre-adsorbed H2. This aggressive oxidation outpaces the reducing power of the H2 environment during the first 5-10 minutes, leading to a sharp decrease in metallic cobalt and the emergence of the CoO and Co3O4 phases. This 10-minute mark represents the peak of this transient oxidation phase, after which the system will slowly begin to reduce again at longer reaction times. | Full credit for explaining that the introduction of CO2 causes a rapid, kinetically-controlled oxidation of the initially reduced cobalt (reacting aggressively with CO2 and pre-adsorbed H2), which temporarily forms CoO and Co3O4 before the system slowly reduces again at later times. |
Review
#838
Co/CeO2
Co K-edge
▶
LLM Prompt
Sample Information
Material: Co/CeO2
Support: CeO2-cube
Reaction Conditions: H2+CO2 (4:1) mixture at 250 °C
Sample-Specific Conditions
- Reaction time: 45 min
- Cobalt on ceria nanocubes at steady state under CO2 hydrogenation conditions
Measurement
We plan to measure the Co K-edge XANES spectrum of this sample.
Questions
Based on all the information above:
1. Based on the reaction conditions (H2+CO2 mixture at 250 °C), what candidate reference spectra are required to accurately model the Co K-edge XANES spectrum of this catalyst using Linear Combination Fitting (LCF)?
2. Estimate the phase fractions of the cobalt species present in this catalyst after 45 minutes of steady-state CO2 hydrogenation.
3. Explain the chemical and kinetic reasoning for why the catalyst exhibits this specific phase composition at 45 minutes, given that it was initially fully reduced before the introduction of CO2.
Ground Truth
Material: 5 wt% Co/CeO2-cube
Measurement: Co K-edge in-situ XANES
Fit method: LCF
Phase fractions:
| Phase | Fraction |
|---|---|
| Co0 | 0.8 |
| CoO | 0.18 |
| Co3O4 | 0.02 |
Fit basis (paper's reference spectra):
- Co0
- CoO
- Co3O4
Source evidence: Figure 5b, page 16
Key reasoning: Upon switching from an H2 atmosphere to an H2+CO2 mixture, the cobalt phases experience an oxidation-then-reduction dynamic process. Initially, there is rapid oxidation forming CoO and Co3O4. However, after about 23 minutes, the system begins to reverse towards reduction due to the H2 in the feed. By 45 minutes, the metallic cobalt phase dominates again, though a small fraction of CoO and Co3O4 remains, leaving the system slightly more oxidized than its state prior to CO2 introduction due to the oxophilic character of cobalt.
Reasoning source: Results and Discussion, Section B, page 17
Scoring Rubric (total: 100 pts)
| Q | Type | Max | Question | Reference Answer | Scoring Criteria |
|---|---|---|---|---|---|
| q1 | identification | 20 | Based on the reaction conditions (H2+CO2 mixture at 250 °C), what candidate reference spectra are required to accurately model the Co K-edge XANES spectrum of this catalyst using Linear Combination Fitting (LCF)? | To accurately model the Co K-edge XANES spectrum using Linear Combination Fitting (LCF), the required reference spectra are metallic cobalt (Co0), cobalt(II) oxide (CoO), and cobalt(II,III) oxide (Co3O4). These specific phases are expected because introducing the H2+CO2 (4:1) mixture at 250 °C triggers a dynamic oxidation-then-reduction process. The oxophilic nature of cobalt initially leads to rapid oxidation by CO2, forming CoO and Co3O4. However, the presence of H2 in the feed subsequently drives a reversal toward reduction, resulting in a mixture of dominant metallic Co0 alongside residual oxidized CoO and Co3O4 phases at the 45-minute mark. | Full points if the answer identifies metallic Co (Co0), CoO, and Co3O4 as the necessary reference standards. |
| q2 | quantification | 40 | Estimate the phase fractions of the cobalt species present in this catalyst after 45 minutes of steady-state CO2 hydrogenation. | After 45 minutes of steady-state CO2 hydrogenation, the estimated phase fractions are 80% Co0, 18% CoO, and 2% Co3O4. These specific values result from the dynamic oxidation-then-reduction process that occurs when the H2+CO2 (4:1) mixture is introduced at 250 °C. Although the cobalt initially undergoes rapid oxidation to CoO and Co3O4, the system begins to reverse toward reduction after about 23 minutes due to the H2 in the feed. By 45 minutes, the metallic Co0 phase dominates again (80%), but the oxophilic character of cobalt ensures that a small fraction of oxidized species (18% CoO and 2% Co3O4) remains. | Full points if the answer estimates metallic Co at ~80%, CoO at ~18-20%, and Co3O4 at a very minor fraction (~2%). Partial credit for identifying metallic Co as the dominant phase with a minor oxide component. |
| q3 | reasoning | 40 | Explain the chemical and kinetic reasoning for why the catalyst exhibits this specific phase composition at 45 minutes, given that it was initially fully reduced before the introduction of CO2. | The specific phase composition at 45 minutes is the result of a dynamic oxidation-then-reduction process driven by the H2+CO2 (4:1) reaction mixture at 250 °C. Upon switching from a pure H2 atmosphere to the CO2-containing mixture, the oxophilic character of cobalt causes an initial, rapid oxidation that forms CoO and Co3O4. However, the kinetics shift after approximately 23 minutes, and the system begins to reverse towards reduction due to the continuous supply of H2 in the feed. By 45 minutes, this reduction process allows the metallic cobalt (Co0) phase to dominate the composition once again. Nevertheless, the system remains slightly more oxidized than its initial fully reduced state, leaving residual fractions of CoO and Co3O4. | Full points if the answer explains the dynamic oxidation-then-reduction process: rapid initial oxidation by CO2 due to cobalt's oxophilicity, followed by a slower reduction driven by H2, resulting in a predominantly metallic state with residual oxides at 45 minutes. |
Review
Entropy-Driven Structural Evolution in Ceramic Oxides
BNL-NSLS-II-8-ID
Synthesis
Shuo Liu et al.
DOI: 10.1021/jacs.5c06254
3 scenarios
▶
#839
(CeLaPrHfZrYGdDyNdErHoSmTbMgPdYbEuTmLuAlMnZnCoNiPt)O2
Ni K-edge
▶
LLM Prompt
Sample Information
Material: (CeLaPrHfZrYGdDyNdErHoSmTbMgPdYbEuTmLuAlMnZnCoNiPt)O2
Method: Flame aerosol synthesis
Precursors: Aqueous metal salts (e.g., nitrates, chlorides) at a total concentration of 20 mM
Temperature C: 800
Cooling Method: rapid cooling (milliseconds)
Sample-Specific Conditions
- elemental complexity: 25 elements
- 25-element high-entropy ceramic oxide
Preparation
- An aqueous precursor solution of metal salts (20 mM total concentration) was injected at 300 mL h-1 into an inverted diffusion flame generated by a gas mixture of 8.5 L min-1 H2, 15 L min-1 N2, and 7.5 L min-1 O2. The reaction zone temperature was ~800 °C, where droplets evaporated to form the ceramic solid solution. The product was immediately quenched downstream by a 140 L min-1 N2 flow to prevent phase separation and particle sintering, and then collected on a 0.22 μm PVDF filter membrane.
Measurement
We plan to measure the Ni K-edge XANES spectrum of this sample.
Questions
Based on all the information above:
1. What reference spectra are necessary to evaluate the chemical state and rule out phase segregation of Ni in this 25-element high-entropy fluorite oxide?
2. Based on the confirmed single-atom dispersion of Ni in the fluorite lattice, describe the expected overall shape and distinguishing features of the Ni K-edge XANES spectrum compared to the reference materials.
Ground Truth
Material: (CeLaPrHfZrYGdDyNdErHoSmTbMgPdYbEuTmLuAlMnZnCoNiPt)O2
Measurement: Ni K-edge XANES
Fit method: Qualitative spectral comparison
Phase fractions:
| Phase | Fraction |
|---|---|
| Ni single atoms in fluorite (Ni-O bonds) | 1.0 |
Fit basis (paper's reference spectra):
- Ni foil
- NiO
Source evidence: Figure 4B and page 14 text
Key reasoning: The rapid, non-equilibrium flame aerosol synthesis kinetically traps the elements in a mixed state before they can diffuse into separate phases. Furthermore, the ultra-strong entropic driving force of the 25-element solid solution helps overcome the enthalpic penalties and immiscibility of non-isostructural components like Ni. This results in the single-atom dispersion of Ni within the fluorite lattice, forming only Ni-O bonds with no metallic segregation or separate NiO phases.
Reasoning source: Page 14-15, RESULTS AND DISCUSSION
Scoring Rubric (total: 100 pts)
| Q | Type | Max | Question | Reference Answer | Scoring Criteria |
|---|---|---|---|---|---|
| q1 | identification | 33 | What reference spectra are necessary to evaluate the chemical state and rule out phase segregation of Ni in this 25-element high-entropy fluorite oxide? | The necessary reference spectra to evaluate the chemical state of Ni are Ni foil and NiO. These references are required to confirm the oxidation state and rule out metallic segregation or bulk oxide formation. In this sample, the rapid, non-equilibrium flame aerosol synthesis at 800 °C followed by millisecond quenching kinetically traps the 25 elements in a mixed state. Furthermore, the ultra-strong entropic driving force of the 25-element solid solution overcomes the immiscibility of non-isostructural components like Ni. Consequently, comparing the sample to Ni foil and NiO confirms that Ni exists entirely as single atoms forming only Ni-O bonds within the fluorite lattice, with no phase separation into metallic Ni or bulk NiO. | Full credit for identifying metallic Ni (Ni foil) and an oxidized Ni reference (NiO) to rule out metallic segregation and bulk oxide formation. |
| q3 | spectral | 67 | Based on the confirmed single-atom dispersion of Ni in the fluorite lattice, describe the expected overall shape and distinguishing features of the Ni K-edge XANES spectrum compared to the reference materials. | The Ni K-edge XANES spectrum will exhibit an oxidized state characterized by the presence of only Ni-O bonds, completely lacking the characteristic features of metallic Ni foil. The spectrum will show no evidence of metallic bonds and will be distinct from segregated bulk NiO because the Ni atoms are atomically dispersed within the host lattice. This specific electronic and structural state arises because the rapid flame aerosol synthesis at 800 °C and subsequent millisecond quenching kinetically trap the elements before they can diffuse into separate phases. Additionally, the ultra-strong entropic driving force of the 25-element mixture overcomes enthalpic penalties, forcing the non-isostructural Ni to remain isolated as single atoms within the fluorite oxide structure rather than segregating. | Full credit for stating the spectrum will show an oxidized state (Ni-O bonds) and explicitly noting the absence of metallic features (distinct from Ni foil) and the absence of segregated bulk NiO features. |
Review
#840
(CeLaPrHfZrYGdDyNdErHoSmTbMgPdYbEuTmLuAlMnZnCoNiPt)O2
Pd K-edge
▶
LLM Prompt
Sample Information
Material: (CeLaPrHfZrYGdDyNdErHoSmTbMgPdYbEuTmLuAlMnZnCoNiPt)O2
Method: Flame aerosol synthesis
Precursors: Aqueous solution of metal salts (e.g., nitrates and chlorides) at a total concentration of 20 mM
Temperature C: 800
Cooling Method: rapid cooling (milliseconds)
Sample-Specific Conditions
- elemental complexity: 25 elements
- 25-element high-entropy ceramic oxide
Preparation
- An aqueous precursor solution of metal salts (20 mM total concentration) was injected at 300 mL h-1 into the throat section of a converging-diverging nozzle, where it was atomized by a sonic velocity hot stream generated by an inverted diffusion flame (8.5 L min-1 H2, 15 L min-1 N2, and 7.5 L min-1 O2). The droplets evaporated and formed ceramic solid solutions in the reaction zone at approximately 800 °C. The product was then immediately quenched downstream by a 140 L min-1 N2 flow to prevent phase separation and particle sintering.
Measurement
We plan to measure the Pd K-edge XANES spectrum of this sample.
Questions
Based on all the information above:
1. Given the rapid flame aerosol synthesis and the extreme elemental complexity (25 elements), what is the expected phase and local coordination environment of Pd in the resulting ceramic, and how does the XANES data support this?
2. Describe the expected spectral shape of the Pd K-edge XANES for this 25-element fluorite sample. How does it distinguish the sample from metallic Pd?
Ground Truth
Material: (CeLaPrHfZrYGdDyNdErHoSmTbMgPdYbEuTmLuAlMnZnCoNiPt)O2
Measurement: Pd K-edge XANES
Fit method: Qualitative comparison
Phase fractions:
| Phase | Fraction |
|---|---|
| Pd single atoms in fluorite | 1.0 |
Fit basis (paper's reference spectra):
- Pd foil
- PdO
Source evidence: Figure 4D and page 14
Key reasoning: The XANES spectrum at the Pd K-edge shows only Pd-O bonds with no evidence of metallic bonds, ruling out the presence of segregated metallic Pd. Furthermore, no segregated PdO species were observed in complementary techniques, confirming that Pd is incorporated as single atoms dispersed within the high-entropy fluorite lattice. This demonstrates the role of entropic stabilization and rapid reaction kinetics in overcoming elemental immiscibility.
Reasoning source: Page 14, RESULTS AND DISCUSSION
Scoring Rubric (total: 100 pts)
| Q | Type | Max | Question | Reference Answer | Scoring Criteria |
|---|---|---|---|---|---|
| q2 | reasoning | 57 | Given the rapid flame aerosol synthesis and the extreme elemental complexity (25 elements), what is the expected phase and local coordination environment of Pd in the resulting ceramic, and how does the XANES data support this? | The expected phase is a high-entropy fluorite lattice where Pd is incorporated as single atoms with a local coordination environment consisting entirely of Pd-O bonds (1.0 fraction). This single-atom dispersion occurs because the extreme elemental complexity (25 elements) provides entropic stabilization, while the rapid flame aerosol synthesis at 800 °C followed by immediate millisecond quenching prevents phase separation and particle sintering, thereby overcoming elemental immiscibility. The Pd K-edge XANES data supports this structural outcome by showing only Pd-O bonds and a complete lack of metallic Pd features, ruling out the presence of segregated metallic Pd or PdO species. | Full credit for stating Pd is present as single atoms dispersed in the fluorite lattice (fraction 1.0) with Pd-O bonds, and that XANES supports this by showing no evidence of metallic bonds or segregated PdO. |
| q3 | spectral | 43 | Describe the expected spectral shape of the Pd K-edge XANES for this 25-element fluorite sample. How does it distinguish the sample from metallic Pd? | The expected Pd K-edge XANES spectrum for this sample exhibits a strong white line characteristic of an oxidized state with exclusively Pd-O bonds. It distinguishes the sample from metallic Pd by completely lacking any metallic Pd features or evidence of metallic bonds. These specific spectral features arise because the rapid flame aerosol synthesis at 800 °C and subsequent millisecond quenching kinetically trap the Pd atoms, while the 25-element composition provides entropic stabilization. This combination prevents the precipitation of segregated metallic Pd or PdO, forcing Pd to remain atomically dispersed within the high-entropy fluorite lattice, which produces the purely oxidized spectral signature. | Full credit for mentioning a strong white line indicating an oxidized state (Pd-O bonds) and the explicit lack of metallic Pd features. |
Review
#841
(CeLaPrHfZrYGdDyNdErHoSmTbMgPdYbEuTmLuAlMnZnCoNiPt)O2
Pt L3-edge
▶
LLM Prompt
Sample Information
Material: (CeLaPrHfZrYGdDyNdErHoSmTbMgPdYbEuTmLuAlMnZnCoNiPt)O2
Method: Non-equilibrium flame aerosol synthesis
Precursors: Aqueous metal salts (e.g., nitrates, chlorides, Pt(NO3)4 solution) at 20 mM total concentration
Temperature C: 800
Cooling Method: rapid cooling (milliseconds)
Sample-Specific Conditions
- elemental complexity: 25 elements
- 25-element high-entropy ceramic oxide
Preparation
- An aqueous precursor solution of metal salts (20 mM total concentration) was injected at 300 mL/h into the throat section of a converging-diverging nozzle. It was atomized by a sonic velocity hot gas stream generated by an inverted diffusion flame (8.5 L/min H2, 15 L/min N2, and 7.5 L/min O2). The reaction zone temperature was ~800 °C. The product was immediately cooled downstream by a 140 L/min N2 flow to prevent phase separation and particle sintering, and then collected on a filter membrane.
Measurement
We plan to measure the Pt L3-edge XANES spectrum of this sample.
Questions
Based on all the information above:
1. Given the synthesis conditions (25 elements including Pt, rapid flame aerosol synthesis at 800 °C), what is the expected structural state of Pt in this material, and what physical mechanism prevents it from forming metallic aggregates despite its low oxidation potential?
2. Describe the expected spectral shape of the Pt L3-edge XANES for this 25-element fluorite sample, specifically comparing its white line intensity to standard Pt references.
3. What reference spectra are necessary to confirm the structural state and dispersion of Pt in this high-entropy oxide via XANES?
Ground Truth
Material: (CeLaPrHfZrYGdDyNdErHoSmTbMgPdYbEuTmLuAlMnZnCoNiPt)O2
Measurement: Pt L3-edge XANES at 8-ID (ISS) beamline of the National Synchrotron Light Source II
Fit method: Qualitative comparison to reference spectra
Phase fractions:
| Phase | Fraction |
|---|---|
| Pt single atoms in fluorite (oxidized Pt-O) | 1.0 |
Fit basis (paper's reference spectra):
- Pt foil
- PtO2
Source evidence: Figure 4F (XANES), Figure 4G (EXAFS), Page 14 text
Key reasoning: XANES and EXAFS spectra at the Pt L3-edge showed only Pt-O bonds, with no evidence of metallic bonds or segregated PtO2 species. This confirms the single-atom dispersion of Pt within the 25-element high-entropy fluorite lattice. The entropic stabilization and rapid reaction kinetics overcome Pt's strong reduction potential and tendency to aggregate.
Reasoning source: Page 14, RESULTS AND DISCUSSION
Scoring Rubric (total: 100 pts)
| Q | Type | Max | Question | Reference Answer | Scoring Criteria |
|---|---|---|---|---|---|
| q1 | reasoning | 35 | Given the synthesis conditions (25 elements including Pt, rapid flame aerosol synthesis at 800 °C), what is the expected structural state of Pt in this material, and what physical mechanism prevents it from forming metallic aggregates despite its low oxidation potential? | The expected structural state of Pt in this material is 100% single-atom dispersion within the 25-element high-entropy fluorite lattice, forming exclusively oxidized Pt-O bonds. Despite Pt's strong reduction potential and tendency to aggregate, metallic Pt does not form. This outcome is driven by the specific sample conditions: the extreme elemental complexity (25 elements) provides strong entropic stabilization, while the non-equilibrium flame aerosol synthesis at 800 °C followed by rapid millisecond cooling imposes rapid reaction kinetics. Together, these thermodynamic and kinetic mechanisms prevent phase separation and particle sintering, successfully locking the Pt into the oxide lattice as single atoms. | Full credit for identifying Pt as single atoms (or fully oxidized Pt-O bonds) in the fluorite lattice and explaining that entropic stabilization (and/or rapid reaction kinetics) overcomes the strong reduction potential and immiscibility of Pt. |
| q2 | spectral | 35 | Describe the expected spectral shape of the Pt L3-edge XANES for this 25-element fluorite sample, specifically comparing its white line intensity to standard Pt references. | The Pt L3-edge XANES spectrum is expected to exhibit a strong white line peak at approximately 11565 eV with a normalized absorption intensity of ~1.8-1.9. This white line intensity is significantly higher than that of a metallic Pt foil but lower than that of bulk PtO2, and the spectrum will completely lack features characteristic of metallic Pt. These spectral features arise directly from the synthesis conditions, where the combination of 25-element entropic stabilization and rapid millisecond cooling from 800 °C forces Pt to fully incorporate into the oxide lattice as single atoms. Consequently, the spectrum reflects an exclusively oxidized state with only Pt-O bonds, confirming the absence of metallic aggregates or segregated PtO2 species. | Full credit for stating the spectrum will show a strong white line peak (indicating oxidized Pt) with an intensity that is significantly higher than Pt foil but lower than bulk PtO2. |
| q3 | identification | 30 | What reference spectra are necessary to confirm the structural state and dispersion of Pt in this high-entropy oxide via XANES? | To confirm the structural state of Pt in this sample, Pt foil and bulk PtO2 are required as reference spectra for qualitative comparison. These references are necessary to evaluate the oxidation state and rule out the presence of metallic aggregates or segregated PtO2 species. The need for these specific references stems directly from the sample's synthesis conditions, where the 25-element composition and rapid flame aerosol synthesis at 800 °C are designed to overcome Pt's strong reduction potential. By comparing the sample's white line intensity to these references, one can verify that the rapid millisecond cooling and entropic stabilization successfully trapped 100% of the Pt as oxidized single atoms (Pt-O bonds) within the high-entropy fluorite lattice. | Full credit for identifying Pt foil (to rule out metallic aggregation) and PtO2 (to compare the oxidized state and rule out bulk oxide segregation). |
Review
Low-Temperature Restructuring of CeO2-Supported Ru Nanoparticles Determines Selectivity in CO2 Catalytic Reduction
BNL-NSLS-II-8-ID
Catalyst
Aisulu Aitbekova et al.
DOI: 10.1021/jacs.8b07615
2 scenarios
▶
#842
Ru/CeO2
Ru K
▶
LLM Prompt
Sample Information
Material: Ru/CeO2
Support: CeO2
Sample-Specific Conditions
- pretreatment: LTR
- Ru nanoparticles on CeO2 after low temperature reduction
Measurement
We plan to measure the Ru K XANES spectrum of this sample.
Questions
Based on all the information above:
1. Based on the LTR pretreatment conditions (reduction in H2 at 230 °C), what is the expected dominant Ru phase in this sample, and what is the physical reasoning for this?
2. If performing Linear Combination Fitting (LCF) on the XANES spectrum of this sample, what reference spectrum would be most appropriate to use?
3. What key spectral feature in the Ru K-edge XANES would distinguish this LTR sample from an oxidized, atomically dispersed Ru/CeO2 sample?
Ground Truth
Material: Ru/CeO2
Measurement: Ru K-edge in-situ XANES at SSRL
Fit method: not reported
Phase fractions: (±10%)
| Phase | Fraction |
|---|---|
| metallic Ru | 1.0 |
Fit basis (paper's reference spectra):
- metallic Ru
Source evidence: Page 11 and 12, text
Key reasoning: A reductive treatment in H2 at 230 °C before the reaction leads to the complete reduction of any oxide layer present on the Ru nanoparticles, resulting in a fully metallic Ru phase. This metallic phase is responsible for the strong methanation activity of the catalyst.
Reasoning source: Page 11-12, Results and Discussion
Scoring Rubric (total: 100 pts)
| Q | Type | Max | Question | Reference Answer | Scoring Criteria |
|---|---|---|---|---|---|
| q1 | reasoning | 40 | Based on the LTR pretreatment conditions (reduction in H2 at 230 °C), what is the expected dominant Ru phase in this sample, and what is the physical reasoning for this? | The expected dominant phase in this sample is fully metallic Ru (oxidation state 0), which accounts for a fraction of 1.0. This occurs because the low temperature reduction (LTR) pretreatment in H2 at 230 °C completely reduces any oxide layer present on the Ru nanoparticles. The reductive environment effectively removes oxygen from the Ru species, resulting in a fully metallic phase. Ultimately, this resulting metallic Ru phase is responsible for the strong methanation activity of the catalyst. | Must identify metallic Ru as the dominant phase (fraction ~1.0) and explain that the reductive treatment in H2 completely reduces any initial surface oxide layer on the nanoparticles. |
| q2 | identification | 30 | If performing Linear Combination Fitting (LCF) on the XANES spectrum of this sample, what reference spectrum would be most appropriate to use? | The most appropriate reference spectrum to use for Linear Combination Fitting (LCF) is metallic Ru. This single reference is sufficient because the sample consists of Ru nanoparticles on CeO2 that have undergone a low temperature reduction (LTR) in H2 at 230 °C. This specific reductive pretreatment completely reduces any oxide layer present on the nanoparticles, resulting in a 1.0 fraction of fully metallic Ru. Consequently, no oxidized reference spectra are needed, as the sample is entirely reduced to the metallic phase. | Must identify metallic Ru (or Ru foil) as the necessary reference spectrum. |
| q3 | spectral | 30 | What key spectral feature in the Ru K-edge XANES would distinguish this LTR sample from an oxidized, atomically dispersed Ru/CeO2 sample? | The key distinguishing spectral feature of this LTR sample is the absence of a pre-edge feature at 22120 eV. This feature is absent because the low temperature reduction (LTR) in H2 at 230 °C completely reduces the Ru nanoparticles to a fully metallic phase. In oxidized, atomically dispersed Ru/CeO2 samples, this pre-edge peak appears due to a forbidden 1s to 4d transition in non-centrosymmetric structures. Since the reductive pretreatment eliminates the oxide layer, the resulting spectrum is characteristic solely of metallic Ru nanoparticles and lacks this distinct pre-edge feature. | Must mention the absence of a pre-edge feature (around 22120 eV) that is present in the oxidized, non-centrosymmetric atomically dispersed Ru species. |
Review
#843
Ru/CeO2
Ru K
▶
LLM Prompt
Sample Information
Material: Ru/CeO2
Support: CeO2
Sample-Specific Conditions
- pretreatment: OX
- Ru on CeO2 after oxidation
Measurement
We plan to measure the Ru K XANES spectrum of this sample.
Questions
Based on all the information above:
1. What is the dominant Ru phase in this sample after the low-temperature oxidation pretreatment, and what structural transformation leads to its formation?
2. Describe the key distinguishing feature in the Ru K-edge XANES spectrum of this oxidized sample compared to bulk RuO2.
3. What electronic transition is responsible for the pre-edge feature observed at 22120 eV, and what does it indicate about the local coordination geometry?
4. If you were to perform Linear Combination Fitting (LCF) or qualitative spectral comparisons on this sample, what reference spectra would be useful to include to demonstrate the structural changes?
Ground Truth
Material: Ru/CeO2
Measurement: Ru K-edge in-situ fluorescence mode at SSRL
Fit method: qualitative comparison
Phase fractions: (±10%)
| Phase | Fraction |
|---|---|
| atomically dispersed RuOx | 1.0 |
Fit basis (paper's reference spectra):
- Ru foil
- RuO2
Source evidence: Page 24, Figure 6a
Key reasoning: Low-temperature oxidation induces redispersion of Ru nanoparticles into atomic species. The EXAFS shows only Ru-O scattering and no Ru-Ru scattering. The XANES shows a distinct pre-edge feature indicative of non-centrosymmetric symmetry of the atomically dispersed Ru species.
Reasoning source: Pages 23-24
Scoring Rubric (total: 100 pts)
| Q | Type | Max | Question | Reference Answer | Scoring Criteria |
|---|---|---|---|---|---|
| q1 | reasoning | 25 | What is the dominant Ru phase in this sample after the low-temperature oxidation pretreatment, and what structural transformation leads to its formation? | The dominant phase in this sample is atomically dispersed RuOx, which accounts for a 1.0 fraction of the material. This phase forms because the low-temperature oxidation pretreatment of the Ru/CeO2 sample induces a structural transformation that redisperses Ru nanoparticles into isolated atomic species. This complete redispersion is driven by the specific oxidation conditions, as evidenced by EXAFS showing only Ru-O scattering and a complete lack of Ru-Ru scattering. | Full points for identifying atomically dispersed RuOx and explaining that oxidation induces redispersion of Ru nanoparticles into atomic species. |
| q2 | spectral | 25 | Describe the key distinguishing feature in the Ru K-edge XANES spectrum of this oxidized sample compared to bulk RuO2. | The key distinguishing feature in the Ru K-edge XANES spectrum of this sample is an appreciable pre-edge feature located at 22120 eV. This spectral feature arises because the oxidation pretreatment of the Ru/CeO2 sample causes the Ru to redisperse into atomically dispersed RuOx with non-centrosymmetric symmetry. This specific structural transformation, driven by the oxidation conditions, distinguishes the sample from bulk RuO2, which possesses an octahedral coordination geometry and therefore does not display this pre-edge feature. | Full points for mentioning the distinct pre-edge feature at 22120 eV, which is absent in bulk RuO2. |
| q3 | reasoning | 25 | What electronic transition is responsible for the pre-edge feature observed at 22120 eV, and what does it indicate about the local coordination geometry? | The pre-edge feature observed at 22120 eV is responsible for a forbidden 1s to 4d electronic transition. The presence of this transition indicates that the local coordination geometry of the Ru species has non-centrosymmetric symmetry. This unique geometry is a direct result of the oxidation pretreatment applied to the Ru/CeO2 sample, which forces the redispersion of Ru nanoparticles into atomically dispersed RuOx. Because the oxidation condition breaks the centrosymmetry found in bulk octahedral RuO2, this normally forbidden transition gains appreciable intensity in the XANES spectrum. | Full points for identifying the forbidden 1s to 4d transition and stating it indicates non-centrosymmetric symmetry (e.g., tetrahedral or five-fold coordination). |
| q4 | identification | 25 | If you were to perform Linear Combination Fitting (LCF) or qualitative spectral comparisons on this sample, what reference spectra would be useful to include to demonstrate the structural changes? | For qualitative spectral comparisons, it would be useful to include Ru foil and bulk RuO2 as reference spectra. These references are necessary to demonstrate the structural changes caused by the oxidation pretreatment of the Ru/CeO2 sample. Because the low-temperature oxidation condition drives the Ru nanoparticles to completely redisperse into 100% atomically dispersed RuOx, comparing the sample against these references highlights the loss of Ru-Ru scattering and the emergence of a non-centrosymmetric pre-edge feature at 22120 eV that is absent in standard octahedral RuO2. | Full points for suggesting Ru foil (metallic) and RuO2 (bulk oxide) as references to contrast with the atomically dispersed species. |
Review
Changes in Catalytic and Adsorptive Properties of 2 nm Pt3Mn Nanoparticles by Subsurface Atoms
BNL-NSLS-II-8-ID
Catalyst
Zhenwei Wu et al.
DOI: 10.1021/jacs.8b08162
3 scenarios
▶
#844
Pt
Pt L3
▶
LLM Prompt
Sample Information
Material: Pt
Support: SiO2
Reaction Conditions: in-situ after reduction in 5% H2/N2
Sample-Specific Conditions
- catalyst composition: Pt
- Monometallic Pt nanoparticles on silica
Measurement
We plan to measure the Pt L3 XANES spectrum of this sample.
Questions
Based on all the information above:
1. Describe the expected spectral shape of this sample at the Pt L3 edge, specifically focusing on the whiteline intensity and edge energy compared to Pt-Mn intermetallic nanoparticles.
2. According to the paper, what electronic structural changes explain the differences in the Pt L3 edge XANES features (edge energy and whiteline) between this monometallic Pt sample and Pt-Mn intermetallic catalysts?
Ground Truth
Material: Pt
Measurement: Pt L3 edge in-situ transmission XAS at 10-BM MRCAT APS
Fit method: not reported
Phase fractions:
| Phase | Fraction |
|---|---|
| metallic_platinum (Pt) | 1.0 |
Fit basis (paper's reference spectra):
- not reported
Source evidence: Figure 2a, page 3
Key reasoning: The sample is a monometallic Pt catalyst reduced at 550 °C in H2, forming metallic Pt nanoparticles. The XANES spectrum serves as a reference for metallic Pt, exhibiting a characteristic whiteline intensity and edge energy that are compared against Pt-Mn intermetallic catalysts.
Reasoning source: RESULTS AND DISCUSSION, page 3
Scoring Rubric (total: 100 pts)
| Q | Type | Max | Question | Reference Answer | Scoring Criteria |
|---|---|---|---|---|---|
| q2 | spectral | 50 | Describe the expected spectral shape of this sample at the Pt L3 edge, specifically focusing on the whiteline intensity and edge energy compared to Pt-Mn intermetallic nanoparticles. | The expected Pt L3 edge XANES spectrum for this sample exhibits a strong whiteline characteristic of metallic Pt. Specifically, it displays a higher whiteline intensity and a lower edge energy when compared to Pt-Mn intermetallic nanoparticles. These spectral features arise directly from the sample conditions, where the silica-supported monometallic Pt catalyst is reduced at 550 °C in 5% H2/N2. This treatment fully reduces the sample to pure metallic Pt nanoparticles (100% Pt fraction, oxidation state 0), resulting in a specific density of unoccupied 5d states that produces this distinct, unmodified whiteline and edge position. | Award full points for stating that the monometallic Pt sample exhibits a higher whiteline intensity and a lower edge energy compared to the Pt-Mn intermetallic catalysts. |
| q3 | reasoning | 50 | According to the paper, what electronic structural changes explain the differences in the Pt L3 edge XANES features (edge energy and whiteline) between this monometallic Pt sample and Pt-Mn intermetallic catalysts? | According to the paper, the differences in the Pt L3 edge XANES features are explained by variations in the unoccupied part of the Pt 5d states. Because the sample is prepared as a monometallic Pt catalyst on silica and reduced at 550 °C in 5% H2/N2, it forms pure metallic Pt nanoparticles (oxidation state 0) without any secondary metals. This lack of alloying means there is no electronic modification from manganese, leaving the Pt 5d band structure in its pure metallic state. Therefore, the unmodified unoccupied 5d states in this pure Pt sample yield a higher whiteline intensity and lower edge energy compared to the electronically altered Pt-Mn intermetallic catalysts. | Award full points for explaining that the differences reflect changes in the unoccupied part of the 5d states on Pt, which shift upward in average energy upon alloying with Mn, leading to the observed changes in the whiteline and edge position. |
Review
#845
Pt3Mn
Pt L3
▶
LLM Prompt
Sample Information
Material: Pt3Mn
Support: SiO2
Reaction Conditions: in-situ after reduction in 5% H2/N2
Sample-Specific Conditions
- catalyst composition: Pt3Mn
- Full-body Pt3Mn intermetallic nanoparticles on silica
Measurement
We plan to measure the Pt L3 XANES spectrum of this sample.
Questions
Based on all the information above:
1. Describe the expected spectral shape of the Pt L3 edge XANES for the full-body Pt3Mn intermetallic nanoparticles compared to monometallic Pt nanoparticles.
2. What electronic effect explains the observed changes in the Pt L3 edge XANES (edge energy increase and whiteline decrease) upon formation of the Pt3Mn intermetallic phase?
3. How would the Pt L3 edge XANES spectrum of this full-body Pt3Mn catalyst differ from a core-shell catalyst with a Pt3Mn surface on a Pt core (Pt3Mn-s)?
Ground Truth
Material: Pt3Mn
Measurement: Pt L3 edge, in-situ transmission, 10-BM beamline at APS
Fit method: not reported
Phase fractions:
| Phase | Fraction |
|---|---|
| Pt3Mn | 1.0 |
Source evidence: Figure 2a, page 3
Key reasoning: The Pt3Mn catalyst forms a full-body intermetallic compound. The Pt L3 edge XANES shows a slight increase in edge energy and a decrease in whiteline intensity compared to pure Pt NPs, due to the incorporation of Mn. This is accompanied by an upward shift of the average energy of the unoccupied part of the 5d states on Pt, resulting from strong hetero-metal bonding interactions.
Reasoning source: RESULTS AND DISCUSSION, pages 3 and 5
Scoring Rubric (total: 100 pts)
| Q | Type | Max | Question | Reference Answer | Scoring Criteria |
|---|---|---|---|---|---|
| q1 | spectral | 30 | Describe the expected spectral shape of the Pt L3 edge XANES for the full-body Pt3Mn intermetallic nanoparticles compared to monometallic Pt nanoparticles. | The Pt L3 edge XANES spectrum for the full-body Pt3Mn intermetallic nanoparticles will exhibit a slight increase in edge energy and a decrease in whiteline intensity compared to monometallic Pt nanoparticles. This spectral shape arises because the sample consists of a fully reduced, full-body Pt3Mn intermetallic compound formed after in-situ reduction in 5% H2/N2. The incorporation of Mn throughout the entire nanoparticle leads to strong hetero-metal bonding interactions between Pt and Mn. These interactions cause an upward shift in the average energy of the unoccupied part of the Pt 5d states, which directly reduces the transition probability and thus the whiteline intensity. | Must mention a slight increase in edge energy and a decrease in whiteline intensity compared to pure Pt. |
| q2 | reasoning | 40 | What electronic effect explains the observed changes in the Pt L3 edge XANES (edge energy increase and whiteline decrease) upon formation of the Pt3Mn intermetallic phase? | The observed increase in edge energy and decrease in whiteline intensity are explained by an upward shift of the average energy of the unoccupied part of the 5d states on Pt. Under the reducing conditions (5% H2/N2), the Pt and Mn form a full-body Pt3Mn intermetallic nanoparticle on the silica support. The incorporation of Mn into the Pt lattice creates strong hetero-metal bonding interactions between the two elements. These specific bonding interactions alter the electronic structure of Pt, shifting its unoccupied 5d states to higher energies and consequently reducing the intensity of the whiteline feature in the XANES spectrum. | Must attribute the changes to the incorporation of Mn and strong hetero-metal bonding interactions, specifically mentioning an upward shift of the average energy of the unoccupied part of the 5d states on Pt. |
| q3 | prediction | 30 | How would the Pt L3 edge XANES spectrum of this full-body Pt3Mn catalyst differ from a core-shell catalyst with a Pt3Mn surface on a Pt core (Pt3Mn-s)? | The full-body Pt3Mn catalyst will show a larger increase in edge energy and a larger decrease in whiteline intensity compared to the core-shell Pt3Mn-s catalyst. This difference occurs because the full-body Pt3Mn sample, formed after reduction in 5% H2/N2, incorporates Mn throughout the entire volume of the nanoparticle rather than just at the surface. The higher overall Mn content in the full-body intermetallic structure maximizes the strong hetero-metal bonding interactions between Pt and Mn. Consequently, this causes a more pronounced upward shift of the unoccupied Pt 5d states, leading to the greater spectral changes observed relative to the core-shell structure. | Must state that the full-body Pt3Mn catalyst will show a larger increase in edge energy and a larger decrease in whiteline intensity compared to the core-shell catalyst due to its higher overall Mn content. |
Review
#846
Pt-Mn
Pt L3
▶
LLM Prompt
Sample Information
Material: Pt-Mn
Support: SiO2
Reaction Conditions: in-situ after reduction in 5% H2/N2
Sample-Specific Conditions
- catalyst composition: Pt3Mn-s
- Core-shell nanoparticles with Pt core and Pt3Mn shell on silica
Measurement
We plan to measure the Pt L3 XANES spectrum of this sample.
Questions
Based on all the information above:
1. Based on the synthesis conditions (limited Mn precursor, reduction at 550 °C), what specific nanoparticle structure forms, and what is the physical mechanism driving its formation?
2. Describe the expected changes in the Pt L3-edge XANES spectral shape (edge position and whiteline intensity) for this core-shell catalyst compared to pure Pt nanoparticles.
3. What electronic effect or interaction is responsible for the observed changes in the whiteline intensity and edge energy upon formation of the Pt3Mn shell?
4. How does the XANES spectrum of this core-shell Pt3Mn-s catalyst distinguish itself from that of a full-body Pt3Mn intermetallic nanoparticle catalyst?
Ground Truth
Material: Pt-Mn
Measurement: in-situ Pt L3-edge XANES in transmission mode at 10-BM beamline (APS)
Fit method: qualitative comparison
Phase fractions:
| Phase | Fraction |
|---|---|
| Pt@Pt3Mn core-shell | 1.0 |
Fit basis (paper's reference spectra):
- Pt NPs
- Pt3Mn NPs
Source evidence: Page 3, Figure 2a and text
Key reasoning: The Pt3Mn-s catalyst forms a core-shell structure with a Pt core and a Pt3Mn intermetallic shell. This is achieved by diffusion-controlled intermetallic compound formation where a limited amount of Mn precursor is reduced by hydrogen spilled over from Pt and diffuses into the surface of Pt NPs. The limited Mn amount results in partial intermetallic transformation restricted to the surface.
Reasoning source: Page 2-3, RESULTS AND DISCUSSION, '2 nm Supported Intermetallic NPs with the Same Surface Structure but Different Subsurface'
Scoring Rubric (total: 100 pts)
| Q | Type | Max | Question | Reference Answer | Scoring Criteria |
|---|---|---|---|---|---|
| q1 | reasoning | 25 | Based on the synthesis conditions (limited Mn precursor, reduction at 550 °C), what specific nanoparticle structure forms, and what is the physical mechanism driving its formation? | Under the specified reduction conditions in 5% H2/N2, the Pt3Mn-s catalyst forms a core-shell nanoparticle structure consisting of a pure Pt core and a Pt3Mn intermetallic shell. This specific architecture arises from a diffusion-controlled intermetallic compound formation mechanism. During reduction, hydrogen spills over from the Pt nanoparticles to reduce the limited amount of Mn precursor present. Because the Mn amount is restricted by the sample composition, the reduced Mn only diffuses into the surface layers of the Pt nanoparticles, resulting in a partial intermetallic transformation that is confined to the shell. | Must identify the formation of a Pt@Pt3Mn core-shell structure (1.0 fraction) and explain that it forms via diffusion-controlled intermetallic formation where reduced Mn diffuses into the Pt surface, limited by the initial Mn amount. |
| q2 | spectral | 25 | Describe the expected changes in the Pt L3-edge XANES spectral shape (edge position and whiteline intensity) for this core-shell catalyst compared to pure Pt nanoparticles. | Compared to pure Pt nanoparticles, the Pt L3-edge XANES spectrum of the Pt3Mn-s core-shell catalyst exhibits a slight increase in the edge energy position and a decreased whiteline intensity at approximately 11.567 keV. These spectral changes occur because the sample conditions dictate the formation of a Pt3Mn intermetallic shell around a Pt core. The alloying of Pt with Mn in this shell modifies the metallic oxidation state of Pt through strong hetero-metal bonding interactions. Consequently, this interaction alters the electronic structure of the surface Pt atoms, leading to the observed shifts in edge energy and whiteline reduction. | Must state that the edge energy slightly increases and the whiteline intensity decreases compared to pure Pt NPs. |
| q3 | reasoning | 25 | What electronic effect or interaction is responsible for the observed changes in the whiteline intensity and edge energy upon formation of the Pt3Mn shell? | The observed decrease in whiteline intensity and slight increase in edge energy are driven by an upward shift in the average energy of the unoccupied part of the Pt 5d states. This electronic effect is a direct result of the strong hetero-metal bonding interaction between Pt and Mn within the intermetallic shell. Because the synthesis conditions (reduction of a limited Mn precursor via hydrogen spillover) restrict the Mn to the surface, this strong Pt-Mn bonding is localized to the shell layer. Thus, the modified metallic state in the shell alters the local electronic environment of the Pt atoms, producing the distinct XANES features. | Must attribute the changes to an upward shift of the average energy of the unoccupied part of the 5d states on Pt, caused by strong hetero-metal bonding interactions in the intermetallic compound. |
| q4 | spectral | 25 | How does the XANES spectrum of this core-shell Pt3Mn-s catalyst distinguish itself from that of a full-body Pt3Mn intermetallic nanoparticle catalyst? | The XANES spectrum of the Pt3Mn-s core-shell catalyst displays spectral changes that are intermediate between pure Pt nanoparticles and full-body Pt3Mn nanoparticles. Specifically, the decrease in whiteline intensity and the increase in edge energy are smaller in magnitude for the core-shell catalyst than for the full-body alloy. These distinguishing features arise directly from the sample's specific composition and synthesis conditions, which utilize a limited amount of Mn precursor. This limited Mn restricts the intermetallic Pt3Mn phase entirely to the nanoparticle shell, leaving a pure Pt core that dilutes the overall spectral impact of the Pt-Mn alloying effects. | Must explain that the changes (edge shift and whiteline decrease) are smaller/less pronounced for the core-shell catalyst than for the full-body Pt3Mn catalyst due to the lower overall Mn content. |
Review
Mechanistic Insights into Electrochemical Nitrogen Reduction Reaction on Vanadium Nitride Nanoparticles
BNL-NSLS-II-8-ID
Synthesis
Xuan Yang et al.
DOI: 10.1021/jacs.8b08379
1 scenario
▶
#847
Vanadium nitride / oxynitride nanoparticles
V K
▶
LLM Prompt
Sample Information
Material: Vanadium nitride / oxynitride nanoparticles
Method: urea-glass method
Precursors: vanadium oxychloride (1 g), ethanol (2 g), urea (1.04 g)
Temperature C: 800
Duration Hours: 3
Heating Rate C Per Min: 3
Atmosphere: N2
Post Treatment: Electrochemical nitrogen reduction at -0.1 V for 4 hours
Sample-Specific Conditions
- Electrochemical reaction time: 4 h at -0.1 V
- Vanadium nitride nanoparticles subjected to electrochemical nitrogen reduction reaction (ENRR) for 4 hours at -0.1 V, showing partial conversion of the active oxynitride phase.
Preparation
- 1 g of vanadium precursor (vanadium oxychloride) was dissolved in 2 g of ethanol to make a dark-reddish solution. 1.04 g of urea was slowly added and stirred until solubilized and the solution turned green. The solution was dried into a glass/glassy film by evaporating the solvent. The gel was calcined in a furnace under N2 flow at 800 °C for 3 h with a heating ramp of 3 °C/min.
Measurement
We plan to measure the V K XANES spectrum of this sample.
Questions
Based on all the information above:
1. What candidate reference spectra or basis phases are needed to model the V K-edge XANES spectrum of the active portion of this catalyst after 4 hours of ENRR at -0.1 V?
2. Explain the mechanistic reason for the observed phase composition after 4 hours of electrochemical nitrogen reduction at -0.1 V. What reaction mechanism drives this specific phase transformation?
Ground Truth
Material: Vanadium nitride / oxynitride nanoparticles
Measurement: V K-edge XANES in operando electrochemical mode at Beamline 8-ID, NSLS-II
Fit method: XAS phase fraction analysis (implied LCF)
Phase fractions: (±10%)
| Phase | Fraction |
|---|---|
| VN | 0.578 |
| VN0.7O0.45 | 0.422 |
Fit basis (paper's reference spectra):
- VN
- VN0.7O0.45
Source evidence: Section 8, page 41
Key reasoning: The oxynitride phase (VN0.7O0.45) acts as the active phase for the electrochemical nitrogen reduction reaction (ENRR). During the reaction at -0.1 V, the catalyst operates via a Mars-van Krevelen mechanism, causing the oxynitride species to be partially converted into VN. XAS analysis determined that exactly 57.8% of this active oxynitride phase converted to VN during the nitrogen reduction process, leaving the remainder as the unreacted oxynitride.
Reasoning source: Section 8 (page 41) and Section 3 (page 23)
Scoring Rubric (total: 100 pts)
| Q | Type | Max | Question | Reference Answer | Scoring Criteria |
|---|---|---|---|---|---|
| q1 | identification | 33 | What candidate reference spectra or basis phases are needed to model the V K-edge XANES spectrum of the active portion of this catalyst after 4 hours of ENRR at -0.1 V? | The candidate reference spectra needed to model the V K-edge XANES spectrum are VN and VN0.7O0.45. These specific phases are required because the initial vanadium oxynitride nanoparticles, synthesized via the urea-glass method, act as the active catalyst for the electrochemical nitrogen reduction reaction (ENRR). During the 4-hour ENRR process at -0.1 V, the catalyst operates via a Mars-van Krevelen mechanism. This mechanism causes the active oxynitride species (VN0.7O0.45) to partially convert into VN, necessitating both the newly formed product (VN) and the unreacted active phase (VN0.7O0.45) to accurately model the final spectrum. | Full points for identifying both VN (vanadium nitride) and the specific vanadium oxynitride phase (VN0.7O0.45 or VNxOy). |
| q3 | reasoning | 67 | Explain the mechanistic reason for the observed phase composition after 4 hours of electrochemical nitrogen reduction at -0.1 V. What reaction mechanism drives this specific phase transformation? | The observed phase composition of 57.8% VN and 42.2% VN0.7O0.45 is driven by a Mars-van Krevelen mechanism during the electrochemical nitrogen reduction reaction (ENRR). The initial vanadium oxynitride nanoparticles serve as the active phase for this reaction. When subjected to the specific electrochemical conditions of -0.1 V for 4 hours, the Mars-van Krevelen mechanism dictates that the active oxynitride species (VN0.7O0.45) is partially converted into VN. This specific reaction time and applied potential result in exactly 57.8% of the oxynitride converting to VN, leaving the remaining 42.2% as the unreacted VN0.7O0.45 phase. | Full points for explaining that the oxynitride is the active phase and undergoes partial conversion to VN during the reaction via a Mars-van Krevelen mechanism. |
Review
Endogenous Dynamic Nuclear Polarization for Natural Abundance 17O and Lithium NMR in the Bulk of Inorganic Solids
BNL-NSLS-II-8-ID
Synthesis
Tamar Wolf et al.
DOI: 10.1021/jacs.8b11015
2 scenarios
▶
#848
Mn-doped Li4Ti5O12
Mn K-edge
▶
LLM Prompt
Sample Information
Material: Mn-doped Li4Ti5O12
Method: solid-state
Sample-Specific Conditions
- Mn dopant concentration: x=0.01
- Li4Ti5O12 doped with 0.01 mole ratio Mn(II)
Preparation
- Samples of Li4Ti5O12 doped with Mn ions were prepared by solid state synthesis as described previously [30].
Measurement
We plan to measure the Mn K-edge XANES spectrum of this sample.
Questions
Based on all the information above:
1. What structural motifs or candidate crystallographic sites exist for Mn(II) dopants in the Li4Ti5O12 spinel lattice, and which site is predominantly occupied in the x=0.01 sample?
2. Explain the physical reasoning and structural evidence used to determine the predominant site occupancy of Mn(II) in the Li4Ti5O12 lattice.
3. Describe the expected features in the Fourier transform magnitude of the Mn K-edge EXAFS spectrum for the Mn01 sample.
Ground Truth
Material: Mn-doped Li4Ti5O12
Measurement: Mn K-edge XAFS in fluorescence mode at ISS beamline (NSLS-II)
Fit method: Nonlinear least-square fitting to theoretical FEFF6 model (EXAFS)
Phase fractions:
| Phase | Fraction |
|---|---|
| Mn in Li tetrahedral sites | 1.0 |
Fit basis (paper's reference spectra):
- Theoretical model of Mn substituting Ti at octahedral lattice sites
- Theoretical model of Mn substituting Li at tetrahedral lattice sites
Source evidence: Section 3.3 (Page 11), Figure 3, Table S3 (Page 28)
Key reasoning: The EXAFS data was analyzed by comparing structural models where Mn absorbers were placed in different sites within the spinel lattice (substituting either octahedral Ti or tetrahedral Li). Based on the comparison of the fitting results and the qualities of the fit obtained for the different models, it was concluded that Mn(II) is doped predominantly in the Li tetrahedral sites.
Reasoning source: Section 3.3 Lithium environments and their enhancement in the presence of Mn dopants
Scoring Rubric (total: 100 pts)
| Q | Type | Max | Question | Reference Answer | Scoring Criteria |
|---|---|---|---|---|---|
| q1 | identification | 30 | What structural motifs or candidate crystallographic sites exist for Mn(II) dopants in the Li4Ti5O12 spinel lattice, and which site is predominantly occupied in the x=0.01 sample? | The candidate crystallographic sites for Mn(II) dopants in the Li4Ti5O12 spinel lattice are the octahedral lattice sites (substituting Ti) and the tetrahedral lattice sites (substituting Li). In the x=0.01 sample, the Mn(II) dopant predominantly occupies the Li tetrahedral sites with a fraction of 1.0. For this solid-state synthesized Li4-2xMnxTi5O12 material with a low Mn(II) concentration (x=0.01), the dopant must integrate into the existing host structure. Structural modeling of the EXAFS data comparing both potential substitution sites reveals that the tetrahedral coordination model yields a superior fit quality, explaining why Mn(II) exclusively substitutes Li in the tetrahedral sites rather than Ti in the octahedral sites. | Award 15 points for identifying both the tetrahedral (Li) and octahedral (Ti) sites as the candidate structural models. Award 15 points for correctly stating that Mn(II) predominantly occupies the tetrahedral Li sites. |
| q2 | reasoning | 40 | Explain the physical reasoning and structural evidence used to determine the predominant site occupancy of Mn(II) in the Li4Ti5O12 lattice. | The predominant site occupancy of Mn(II) was determined by comparing nonlinear least-square fits of the EXAFS data to theoretical FEFF6 models. For the solid-state synthesized Li4Ti5O12 sample doped with 0.01 mole ratio Mn(II), structural models were constructed placing the Mn absorbers in either octahedral Ti sites or tetrahedral Li sites within the spinel lattice. The physical evidence comes from the Fourier transform magnitude of the EXAFS spectrum, which is best fit by the tetrahedral coordination model yielding a first-shell Mn-O distance of 2.08 Å and a second-shell Mn-Ti distance of 3.45 Å. Based on the superior quality of this fit compared to the octahedral substitution model, it is concluded that the Mn(II) dopants exclusively occupy the Li tetrahedral sites. | Award 20 points for explaining that the assignment was made by comparing EXAFS fitting results for models of Mn in tetrahedral vs. octahedral sites. Award 20 points for mentioning that the fit quality and extracted interatomic distances (Mn-O and Mn-Ti) confirmed the tetrahedral coordination. |
| q3 | spectral | 30 | Describe the expected features in the Fourier transform magnitude of the Mn K-edge EXAFS spectrum for the Mn01 sample. | The Fourier transform magnitude of the Mn K-edge EXAFS spectrum for the x=0.01 sample is expected to show two main peaks in r-space. These peaks correspond to the closest Mn-O and Mn-Ti distances in the lattice. Because the solid-state synthesized Li4-2xMnxTi5O12 sample (x=0.01) incorporates Mn(II) exclusively into the Li tetrahedral sites, the spectral features directly reflect this specific local environment. Consequently, the EXAFS FT spectrum is best fit by a tetrahedral coordination model, which produces a first-shell Mn-O distance of 2.08 Å and a second-shell Mn-Ti distance of 3.45 Å. These specific structural distances distinguish the spectrum from what would be expected if Mn substituted Ti in an octahedral geometry. | Award full points for identifying that the r-space spectrum exhibits two primary peaks corresponding to the closest Mn-O (first shell) and Mn-Ti (second shell) distances. |
Review
#849
Mn-doped Li4Ti5O12
Ti K-edge
▶
LLM Prompt
Sample Information
Material: Mn-doped Li4Ti5O12
Method: solid-state
Sample-Specific Conditions
- Mn dopant concentration: x=0.01
- Li4Ti5O12 doped with 0.01 mole ratio Mn(II)
Preparation
- Samples of Li4Ti5O12 doped with Mn ions were prepared by solid state synthesis as described previously [30].
Measurement
We plan to measure the Ti K-edge XANES spectrum of this sample.
Questions
Based on all the information above:
1. Given the solid-state synthesis of Li4Ti5O12 doped with 0.01 mole ratio Mn(II) using a 5% excess of Li2CO3 precursor, what are the expected crystalline phases in the final product and their approximate fractions?
2. When modeling the Ti K-edge EXAFS data for this Mn-doped Li4Ti5O12 sample to calculate photoelectron scattering amplitudes and phase shifts, what structural model should be used as the reference?
Ground Truth
Material: Mn-doped Li4Ti5O12 (Mn01 sample)
Measurement: Ti K-edge XAFS in transmission mode at beamline BL2-2 at Stanford Synchrotron Radiation Lightsource (SSRL)
Fit method: Nonlinear least-square fitting to theoretical FEFF6 model (for EXAFS) and Whole Pattern Fitting (for XRD phase analysis)
Phase fractions: (±2%)
| Phase | Fraction |
|---|---|
| Li4Ti5O12 | 0.87 |
| Li2TiO3 | 0.081 |
| TiO2 | 0.048 |
Fit basis (paper's reference spectra):
- Theoretical FEFF6 model using the spinel structure
- Pure Li4Ti5O12 (for XRD quantification)
Source evidence: Figure S9 caption (page 31) for phase fractions; Section 2.5 (page 8) for EXAFS measurement details
Key reasoning: Phase analysis of the powder XRD patterns indicates the sample is predominantly the Li4Ti5O12 spinel phase. A Li2TiO3 impurity phase is also present, which is initiated by the 5% excess Li precursor (Li2CO3) added during synthesis to compensate for lithium evaporation during calcination. Because there are no published structures for Mn-doped LTO at this specific dopant concentration, pure Li4Ti5O12 was used as the reference to quantify the impurity phases.
Reasoning source: Section 2.1 (page 6), Section 3.3.2 (page 12), and Figure S9 caption (page 31)
Scoring Rubric (total: 100 pts)
| Q | Type | Max | Question | Reference Answer | Scoring Criteria |
|---|---|---|---|---|---|
| q1 | quantification | 57 | Given the solid-state synthesis of Li4Ti5O12 doped with 0.01 mole ratio Mn(II) using a 5% excess of Li2CO3 precursor, what are the expected crystalline phases in the final product and their approximate fractions? | The expected crystalline phases in the final product are predominantly Li4Ti5O12 at a fraction of 0.87, along with impurity phases of Li2TiO3 at 0.081 and TiO2 at 0.048, with an uncertainty of 2%. The sample forms primarily as the Li4Ti5O12 spinel phase based on the target solid-state synthesis. The specific Li2TiO3 impurity fraction arises because a 5% excess of the Li precursor (Li2CO3) was added during synthesis to compensate for lithium evaporation during calcination. Because there are no published structures for Mn-doped LTO at this specific 0.01 dopant concentration, pure Li4Ti5O12 was used as the reference to quantify these resulting phase fractions. | Must identify Li4Ti5O12 as the dominant phase (~87%) and correctly identify Li2TiO3 (~8%) and TiO2 (~5%) as the minor impurity phases. |
| q3 | reasoning | 43 | When modeling the Ti K-edge EXAFS data for this Mn-doped Li4Ti5O12 sample to calculate photoelectron scattering amplitudes and phase shifts, what structural model should be used as the reference? | When modeling the Ti K-edge EXAFS data, a theoretical FEFF6 model based on the pure Li4Ti5O12 spinel structure should be used as the reference. This specific structural model is required because there are no published crystal structures available for Mn-doped Li4Ti5O12 at the exact dopant concentration of x=0.01. Even though the solid-state synthesis utilized a 5% excess of Li precursor that generated minor impurities, the final material remains predominantly the Li4Ti5O12 spinel phase. Consequently, the pure spinel structure serves as the most appropriate baseline to accurately calculate photoelectron scattering amplitudes and phase shifts for nonlinear least-square fitting. | Must state that the theoretical FEFF6 model using the standard spinel structure should be used as the reference. |
Review
Tandem Reactions of CO 2 Reduction and Ethane Aromatization
BNL-NSLS-II-8-ID
Catalyst
Elaine Gomez et al.
DOI: 10.1021/jacs.9b08538
1 scenario
▶
#850
Ga/ZSM-5
Ga K
▶
LLM Prompt
Sample Information
Material: Ga/ZSM-5
Support: ZSM-5
Sample-Specific Conditions
- State: Fresh
- Fresh gallium modified ZSM-5 catalyst
Measurement
We plan to measure the Ga K XANES spectrum of this sample.
Questions
Based on all the information above:
1. What is the dominant oxidation state of Ga in the fresh Ga/ZSM-5 catalyst?
2. Describe the expected energy position of the white line for this fresh sample and the specific Ga species it corresponds to.
Ground Truth
Material: Ga/ZSM-5
Measurement: Ga K-edge XANES
Fit method: qualitative peak assignment
Phase fractions:
| Phase | Fraction |
|---|---|
| Ga3+ | 1.0 |
Source evidence: Page 8, Results section
Key reasoning: At the fresh stage, the sample shows a single white line at 10377 eV, which corresponds to trivalent Ga (Ga3+). There is no indication of reduction to Ga1+ before the catalyst is exposed to reaction conditions.
Reasoning source: Page 8, Results section
Scoring Rubric (total: 100 pts)
| Q | Type | Max | Question | Reference Answer | Scoring Criteria |
|---|---|---|---|---|---|
| q1 | identification | 46 | What is the dominant oxidation state of Ga in the fresh Ga/ZSM-5 catalyst? | The dominant oxidation state of Ga in the fresh Ga/ZSM-5 catalyst is 3+ (trivalent Ga), which accounts for a fraction of 1.0. This oxidation state is expected because the sample is in a fresh state and has not yet been exposed to any reaction conditions. Without exposure to a reducing environment during a reaction, there is no indication of reduction to monovalent Ga (Ga1+). Consequently, the gallium remains entirely as stable Ga3+ species on the ZSM-5 support. | Full credit for identifying Ga3+ (trivalent Ga) as the exclusive or dominant state. |
| q2 | spectral | 54 | Describe the expected energy position of the white line for this fresh sample and the specific Ga species it corresponds to. | The expected energy position of the white line (Peak B) for the fresh Ga/ZSM-5 sample is 10377 eV, which corresponds to trivalent Ga (Ga3+) species. This spectral feature arises directly from the fresh state of the catalyst, as it has not yet been exposed to reaction conditions that would cause reduction. Because no reduction has occurred, the spectrum is characterized solely by this single white line at 10377 eV. Furthermore, the spectrum completely lacks a peak at 10372 eV, confirming the absence of reduced monovalent Ga (Ga1+) in the fresh sample. | Full credit for stating the white line is at 10377 eV and corresponds to Ga3+. |
Review
Stable and Efficient Single-Atom Zn Catalyst for CO 2 Reduction to CH 4
BNL-NSLS-II-8-ID
Catalyst
Lili Han et al.
DOI: 10.1021/jacs.9b12111
1 scenario
▶
#851
Zn-N-C
Zn K
▶
LLM Prompt
Sample Information
Material: Zn-N-C
Support: microporous N-doped carbon (MNC)
Sample-Specific Conditions
- catalyst type: SA-Zn/MNC
- Single-atom Zn catalyst supported on microporous N-doped carbon
Measurement
We plan to measure the Zn K XANES spectrum of this sample.
Questions
Based on all the information above:
1. Based on the sample conditions (single-atom Zn on N-doped carbon), what is the expected dominant local coordination environment and oxidation state of the Zn species, and what physical reasoning justifies this assignment?
2. Describe the expected XANES spectral shape for this SA-Zn/MNC catalyst, specifically focusing on how the edge position and the first feature following the edge compare to a metallic Zn foil reference.
3. What reference standards would be appropriate to compare against the XANES spectrum of this sample to confirm its oxidation state and distinguish it from metallic or common oxide forms?
Ground Truth
Material: Zn-N-C
Measurement: Zn K-edge XAS, ex-situ, 8-ID and 23-ID-2 beamlines of NSLS-II
Fit method: Qualitative comparison for XANES; first-shell fitting for EXAFS
Phase fractions: (±10%)
| Phase | Fraction |
|---|---|
| Zn-N4 single atoms (Zn2+) | 1.0 |
Fit basis (paper's reference spectra):
- Zn foil
- ZnO
- ZnCl2
Source evidence: Figure 1c, 1d, 1e, and text on page 4
Key reasoning: The intensity of the first feature following the edge and the pre-edge shift to higher energy are close to that of ZnCl2, indicating a +2 valence state. EXAFS shows only one obvious peak at 1.55 Å attributed to Zn-N coordination, with no Zn-Zn scattering peaks, verifying atomic dispersion. First-shell EXAFS fitting confirms each Zn is averagely coordinated with four N atoms (Zn-N4).
Reasoning source: Page 4, first paragraph
Scoring Rubric (total: 100 pts)
| Q | Type | Max | Question | Reference Answer | Scoring Criteria |
|---|---|---|---|---|---|
| q1 | reasoning | 40 | Based on the sample conditions (single-atom Zn on N-doped carbon), what is the expected dominant local coordination environment and oxidation state of the Zn species, and what physical reasoning justifies this assignment? | The expected dominant local coordination environment is Zn-N4 single atoms with an oxidation state of +2, representing a 1.0 fraction of the sample. This configuration arises directly from the sample conditions, where the material is synthesized as a single-atom Zn catalyst supported on a microporous N-doped carbon matrix (SA-Zn/MNC). The physical reasoning for this assignment is supported by EXAFS data, which shows only one obvious peak at 1.55 Å attributed to Zn-N coordination and a complete lack of Zn-Zn scattering peaks, verifying atomic dispersion. First-shell fitting confirms each Zn is averagely coordinated with four N atoms, while the XANES features closely match a ZnCl2 reference, confirming the +2 valence state. | Full points if the answer identifies Zn-N4 coordination and a +2 oxidation state, and explains that this is supported by the lack of Zn-Zn scattering (atomic dispersion) and spectral similarities to Zn(II) references like ZnCl2. |
| q2 | spectral | 30 | Describe the expected XANES spectral shape for this SA-Zn/MNC catalyst, specifically focusing on how the edge position and the first feature following the edge compare to a metallic Zn foil reference. | The XANES spectrum for the SA-Zn/MNC catalyst is expected to show a pre-edge and main edge position shifted to higher energy compared to a metallic Zn foil reference. Additionally, the first feature following the edge (the white line) will exhibit a higher intensity than that of Zn foil, closely resembling the spectral profile of ZnCl2. These spectral features occur because the sample consists of single-atom Zn supported on microporous N-doped carbon, preventing the formation of metallic Zn-Zn bonds. Instead, the Zn atoms are coordinated to electronegative nitrogen atoms (Zn-N4), resulting in a +2 oxidation state that produces the observed positive energy shift and distinct white line intensity characteristic of oxidized Zn2+ species. | Full points if the answer states that the edge position shifts to higher energy and the first feature following the edge (white line) has a higher intensity compared to Zn foil. |
| q3 | identification | 30 | What reference standards would be appropriate to compare against the XANES spectrum of this sample to confirm its oxidation state and distinguish it from metallic or common oxide forms? | Appropriate reference standards to evaluate this sample are Zn foil, ZnO, and ZnCl2. These specific references are chosen because the sample is a single-atom Zn catalyst supported on microporous N-doped carbon (SA-Zn/MNC), and its exact chemical state must be distinguished from aggregated or bulk forms. The Zn foil serves as a baseline for the metallic (0) state to rule out the presence of Zn clusters, while ZnO and ZnCl2 provide distinct +2 oxidation state profiles. By comparing the sample's spectral features to these standards, it can be confirmed that the atomically dispersed Zn species matches the +2 valence state profile of ZnCl2 and is structurally distinct from both metallic Zn foil and bulk ZnO. | Full points if the answer suggests Zn foil (for metallic/0 state), ZnO, and a Zn(II) salt like ZnCl2 to confirm the +2 oxidation state. |
Review
The Restructuring-Induced CoOx Catalyst for Electrochemical Water Splitting
APS
Electrochemistry
Maoyu Wang et al.
DOI: 10.1021/jacsau.1c00346
2 scenarios
▶
#852
Co9S8
Co K
▶
LLM Prompt
Sample Information
Material: Co9S8
Electrode Type: working electrode
Sample-Specific Conditions
- State: Pristine
- As-deposited Co9S8 film before electrochemical testing
Measurement
We plan to measure the Co K XANES spectrum of this sample.
Questions
Based on all the information above:
1. Based on the sample conditions (as-deposited film before electrochemical testing), what is the expected dominant phase in this sample?
2. Explain why the sample is expected to consist entirely of this phase, based on its electrochemical state.
3. What reference spectrum is essential to include as a basis function if one were to analyze this sample's XANES spectrum?
Ground Truth
Material: Co9S8
Measurement: Co K-edge, ex-situ
Fit method: not reported
Phase fractions: (±5%)
| Phase | Fraction |
|---|---|
| Co9S8 | 1.0 |
Fit basis (paper's reference spectra):
- Co9S8
Source evidence: Sample metadata: Pristine Co9S8 description
Key reasoning: The sample is an as-deposited Co9S8 film before any electrochemical testing. Because it has not yet been subjected to charge/discharge cycling or applied voltage, it remains entirely in its pristine state without any electrochemically induced phase transformations.
Reasoning source: Sample description
Scoring Rubric (total: 100 pts)
| Q | Type | Max | Question | Reference Answer | Scoring Criteria |
|---|---|---|---|---|---|
| q1 | identification | 30 | Based on the sample conditions (as-deposited film before electrochemical testing), what is the expected dominant phase in this sample? | The expected dominant phase in this sample is Co9S8. The sample is an as-deposited Co9S8 film in its pristine state. Because it has not yet been subjected to any electrochemical testing, charge/discharge cycling, or applied voltage, no electrochemically induced phase transformations have occurred, leaving the material entirely in its original Co9S8 phase. | Full credit for identifying Co9S8 as the sole or dominant phase. |
| q2 | reasoning | 40 | Explain why the sample is expected to consist entirely of this phase, based on its electrochemical state. | The sample is expected to consist entirely of the Co9S8 phase (fraction of 1.0) because it is in a pristine, as-deposited state. Prior to any electrochemical testing, the working electrode has not experienced any applied voltage or charge/discharge cycling. Without these electrochemical driving forces, there is no mechanism for phase transformation to occur, meaning the film retains its initial 100% Co9S8 composition. | Full credit for stating that the sample is in a pristine, as-deposited state prior to any electrochemical cycling, meaning no phase transformations have occurred. |
| q3 | identification | 30 | What reference spectrum is essential to include as a basis function if one were to analyze this sample's XANES spectrum? | A Co9S8 reference spectrum is the essential basis function required to analyze this sample's XANES spectrum. The sample is a pristine, as-deposited Co9S8 film that has not yet undergone any electrochemical testing. Since it has not been subjected to charge/discharge cycling or applied voltage, no electrochemically induced phase transformations have taken place, making the initial Co9S8 phase the sole necessary reference for fitting. | Full credit for identifying pristine Co9S8 as the necessary reference spectrum. |
Review
#853
Co9S8
Co K
▶
LLM Prompt
Sample Information
Material: Co9S8
Electrode Type: working electrode
Electrolyte: 0.1 M KOH
Cell Type: custom-designed operando XAS fluorescence cell
Charge Discharge: charging
Voltage V: 1.4
Sample-Specific Conditions
- Applied potential: 1.4 V
- Operando measurement during oxygen evolution reaction
Measurement
We plan to measure the Co K XANES spectrum of this sample.
Questions
Based on all the information above:
1. What candidate reference spectra are needed to model the Co K-edge XANES spectrum of a Co9S8 electrode under operando OER conditions at 1.4 V vs RHE?
2. Estimate the phase fractions of the components present in the Co9S8 electrode at 1.4 V vs RHE in 0.1 M KOH.
3. Explain the physical reasoning for the phase composition of the Co9S8 electrode at 1.4 V vs RHE during the oxygen evolution reaction. Why does it deviate from the pristine state?
Ground Truth
Material: Co9S8
Measurement: Co K-edge operando XANES
Fit method: LCF
Phase fractions: (±10%)
| Phase | Fraction |
|---|---|
| Co9S8 | 0.133 |
| CoO | 0.867 |
Fit basis (paper's reference spectra):
- Co9S8
- CoO
Source evidence: Text data for Co9S8 at 1.4 V vs RHE
Key reasoning: At an applied potential of 1.4 V vs RHE during the oxygen evolution reaction, the initial Co9S8 material undergoes significant oxidation. The majority of the material (86.7%) converts to a CoO-like oxide phase, while a small fraction (13.3%) of the original Co9S8 sulfide remains. This indicates that the active state under these OER conditions is predominantly an oxide rather than the pristine sulfide.
Reasoning source: Operando XAS analysis section
Scoring Rubric (total: 100 pts)
| Q | Type | Max | Question | Reference Answer | Scoring Criteria |
|---|---|---|---|---|---|
| q1 | identification | 20 | What candidate reference spectra are needed to model the Co K-edge XANES spectrum of a Co9S8 electrode under operando OER conditions at 1.4 V vs RHE? | To model the Co K-edge XANES spectrum of this sample, reference spectra for Co9S8 and CoO are required for Linear Combination Fitting (LCF). These specific references are needed because the applied potential of 1.4 V during the oxygen evolution reaction (OER) in 0.1 M KOH causes the initial Co9S8 material to undergo significant oxidation. Consequently, the active state of the electrode transforms predominantly into a CoO-like oxide phase, while a small portion of the pristine Co9S8 sulfide remains unreacted. Using these two spectra allows for accurate modeling of the mixed sulfide-oxide state present under these operando charging conditions. | Full points for identifying both Co9S8 (pristine sulfide) and CoO (oxide) as the necessary reference spectra. |
| q2 | quantification | 40 | Estimate the phase fractions of the components present in the Co9S8 electrode at 1.4 V vs RHE in 0.1 M KOH. | At an applied potential of 1.4 V in 0.1 M KOH, the electrode consists of 86.7% CoO and 13.3% Co9S8, with a fitting uncertainty of 10%. These specific fractions result from the significant oxidation of the initial Co9S8 material during the operando oxygen evolution reaction (OER). The high anodic potential of 1.4 V drives the conversion of the vast majority of the pristine sulfide into a CoO-like oxide phase. The remaining 13.3% represents the small fraction of the original Co9S8 that survives the charging process, demonstrating that the active OER state is predominantly an oxide. | Full points for estimating approximately 13% Co9S8 and 87% CoO. Deduct points proportionally for estimates deviating by more than 10% from these values. |
| q3 | reasoning | 40 | Explain the physical reasoning for the phase composition of the Co9S8 electrode at 1.4 V vs RHE during the oxygen evolution reaction. Why does it deviate from the pristine state? | The phase composition deviates from the pristine state because the initial Co9S8 material undergoes significant oxidation under the applied potential of 1.4 V during the oxygen evolution reaction (OER). In the 0.1 M KOH electrolyte, these charging conditions drive a chemical transformation where the majority of the material converts into a CoO-like oxide phase (86.7%). Only a minor fraction (13.3%) of the original Co9S8 sulfide remains intact. This structural evolution indicates that the true active state of the electrode under these specific OER conditions is predominantly an oxide rather than the pristine sulfide material. | Full points for explaining that the applied anodic potential (1.4 V) causes significant oxidation of the sulfide, converting the vast majority of the material into an active CoO-like oxide phase, leaving only a minor fraction of the pristine Co9S8. |
Review
Single-Atom Catalysts for Selective Oxygen Reduction: Transition Metals in Uniform Carbon Nanospheres with High Loadings
APS
Catalyst
Jacob Jeskey et al.
DOI: 10.1021/jacsau.3c00557
4 scenarios
▶
#854
Fe-N-C
Fe K-edge
▶
LLM Prompt
Sample Information
Material: Fe-N-C
Support: carbon nanospheres
Sample-Specific Conditions
- Transition metal: Fe
- Fe single-atom catalyst in carbon nanospheres
Measurement
We plan to measure the Fe K-edge XANES spectrum of this sample.
Questions
Based on all the information above:
1. Based on the provided sample information, what is the expected dominant phase or structural motif of the Fe species?
2. What is the expected dispersion state or particle size of the active metal in this carbon nanosphere support?
3. Explain how the specified preparation method (one-pot synthesis with EDTA and 3-aminophenol/formaldehyde, followed by carbonization at 1000 °C) dictates the final phase composition of the catalyst.
Ground Truth
Material: Fe-N-C
Measurement: Fe K-edge ex-situ
Fit method: not reported
Phase fractions: (±10%)
| Phase | Fraction |
|---|---|
| Fe-N/O SAC | 1.0 |
Fit basis (paper's reference spectra):
- not reported
Source evidence: text
Key reasoning: The sample is prepared via a one-pot synthesis using EDTA and 3-aminophenol/formaldehyde, followed by carbonization at 1000 °C under N2. These specific synthesis conditions isolate the iron species, preventing aggregation and resulting in a pure Fe-N/O single-atom catalyst (SAC) phase where the active metal is dispersed as single atoms.
Reasoning source: text
Scoring Rubric (total: 100 pts)
| Q | Type | Max | Question | Reference Answer | Scoring Criteria |
|---|---|---|---|---|---|
| q1 | identification | 30 | Based on the provided sample information, what is the expected dominant phase or structural motif of the Fe species? | The expected dominant phase of the Fe species is a pure Fe-N/O single-atom catalyst (SAC) phase, which accounts for a 1.0 fraction (100%) of the composition. This specific structural motif arises because the sample is prepared via a one-pot synthesis using EDTA and 3-aminophenol/formaldehyde, followed by carbonization at 1000 °C under N2. These synthesis conditions effectively isolate the iron species within the carbon nanosphere support. By preventing aggregation during the high-temperature carbonization process, the Fe remains entirely dispersed as single atoms coordinated to nitrogen and/or oxygen. | Full points for identifying Fe-N/O single-atom catalyst (SAC) as the sole or dominant phase. |
| q2 | identification | 30 | What is the expected dispersion state or particle size of the active metal in this carbon nanosphere support? | The active metal (Fe) is expected to be completely dispersed as single atoms, with no larger nanoparticles or aggregates present. This atomic dispersion, corresponding to a 1.0 fraction of Fe-N/O SAC, is achieved through the specific one-pot synthesis method utilizing EDTA and 3-aminophenol/formaldehyde. When this precursor mixture is carbonized at 1000 °C under an N2 atmosphere, the chemical environment isolates the iron species and prevents them from aggregating. Consequently, the Fe is successfully stabilized as a single-atom catalyst within the carbon nanospheres. | Full points for stating that the iron is dispersed as single atoms. |
| q3 | reasoning | 40 | Explain how the specified preparation method (one-pot synthesis with EDTA and 3-aminophenol/formaldehyde, followed by carbonization at 1000 °C) dictates the final phase composition of the catalyst. | The specified one-pot synthesis method directly dictates the formation of a pure (1.0 fraction) Fe-N/O single-atom catalyst (SAC) phase. The use of EDTA and 3-aminophenol/formaldehyde creates a precursor structure that effectively isolates the iron species. During the subsequent carbonization at 1000 °C under an N2 atmosphere, this isolation prevents the iron atoms from migrating and aggregating into larger metallic clusters. As a result, the active Fe metal remains entirely dispersed as single atoms within the resulting carbon nanosphere support, yielding a 100% SAC composition. | Full points for explaining that these synthesis conditions isolate the metal sites and prevent aggregation, leading exclusively to the formation of a single-atom Fe-N/O phase rather than metallic or oxide nanoparticles. |
Review
#855
Co-N-C
Co K-edge
▶
LLM Prompt
Sample Information
Material: Co-N-C
Support: carbon nanospheres
Sample-Specific Conditions
- Transition metal: Co
- Co single-atom catalyst in carbon nanospheres
Measurement
We plan to measure the Co K-edge XANES spectrum of this sample.
Questions
Based on all the information above:
1. Based on the provided synthesis conditions (one-pot synthesis with EDTA and 3-aminophenol/formaldehyde, followed by carbonization at 1000 °C), what is the expected dominant Co phase and its structural nature in this material?
2. Given the active metal loading of 1.93 wt% on the carbon nanospheres, what is the expected particle size of the Co species, and how does this define the catalyst type?
3. Explain the relationship between the preparation method and the resulting phase composition of the Co-N-C material.
Ground Truth
Material: Co-N-C
Measurement: Co K-edge ex-situ
Fit method: not reported
Phase fractions: (±10%)
| Phase | Fraction |
|---|---|
| Co-N/O SAC | 1.0 |
Fit basis (paper's reference spectra):
- not reported
Source evidence: Sample context provided (CS-Co-E)
Key reasoning: The sample is prepared via a one-pot synthesis with EDTA and 3-aminophenol/formaldehyde, followed by carbonization at 1000 °C under N2 for 2 h. This specific treatment on carbon nanospheres stabilizes the Co at a 1.93 wt% loading as isolated single atoms, forming a pure Co-N/O single-atom catalyst (SAC) phase without aggregation into nanoparticles.
Reasoning source: Sample description and preparation method
Scoring Rubric (total: 100 pts)
| Q | Type | Max | Question | Reference Answer | Scoring Criteria |
|---|---|---|---|---|---|
| q1 | identification | 35 | Based on the provided synthesis conditions (one-pot synthesis with EDTA and 3-aminophenol/formaldehyde, followed by carbonization at 1000 °C), what is the expected dominant Co phase and its structural nature in this material? | The expected dominant Co phase in this material is a pure Co-N/O single-atom catalyst (SAC) phase, which accounts for 100% of the cobalt species. This specific phase arises because the one-pot synthesis using EDTA and 3-aminophenol/formaldehyde, followed by carbonization at 1000 °C under N2 for 2 hours, effectively stabilizes the cobalt on the carbon nanospheres. These specific treatment conditions prevent the aggregation of cobalt into nanoparticles during the high-temperature carbonization. Consequently, the cobalt is maintained entirely as isolated single atoms coordinated with nitrogen and oxygen within the carbon matrix. | Full points if the answer identifies the dominant phase as a Co-N/O single-atom catalyst (SAC) at 100% fraction. |
| q2 | identification | 35 | Given the active metal loading of 1.93 wt% on the carbon nanospheres, what is the expected particle size of the Co species, and how does this define the catalyst type? | The expected particle size of the Co species is at the atomic scale, as the cobalt exists entirely as isolated single atoms rather than aggregated nanoparticles. This defines the material as a pure Co-N/O single-atom catalyst (SAC) with a phase fraction of 1.0. This atomic dispersion results from the specific one-pot synthesis and subsequent carbonization treatment at 1000 °C under N2 for 2 hours. The carbon nanosphere support effectively stabilizes the cobalt at the 1.93 wt% loading, preventing any aggregation into larger metallic or oxide nanoparticles and ensuring the catalyst is defined entirely by isolated single-atom active sites. | Full points if the answer explicitly states the particle size is 'single atoms' and defines the material as a single-atom catalyst (SAC). |
| q3 | reasoning | 30 | Explain the relationship between the preparation method and the resulting phase composition of the Co-N-C material. | The preparation method directly dictates the formation of a 100% pure Co-N/O single-atom catalyst (SAC) phase. The material is synthesized via a one-pot method utilizing EDTA and 3-aminophenol/formaldehyde, which is then carbonized at 1000 °C under N2 for 2 hours. This specific thermal treatment and chemical environment on the carbon nanospheres serve to stabilize the cobalt at a 1.93 wt% loading. Because of this robust stabilization mechanism, the cobalt atoms remain completely isolated as single atoms coordinated to N/O, entirely preventing their aggregation into nanoparticles and resulting in a phase fraction of 1.0 for the Co-N/O SAC. | Full points if the answer connects the one-pot synthesis (EDTA/polymer) and high-temperature carbonization (1000 °C) to the stabilization of isolated Co single atoms (Co-N/O SAC) without forming aggregated nanoparticles. |
Review
#856
Cu-N-C
Cu K-edge
▶
LLM Prompt
Sample Information
Material: Cu-N-C
Support: carbon nanospheres
Sample-Specific Conditions
- Transition metal: Cu
- Cu single-atom catalyst in carbon nanospheres
Measurement
We plan to measure the Cu K-edge XANES spectrum of this sample.
Questions
Based on all the information above:
1. Based on the provided synthesis conditions (one-pot synthesis with EDTA and 3-aminophenol/formaldehyde, carbonized at 1000 °C), what is the expected dominant Cu phase in this sample?
2. Explain the physical reasoning for why this specific preparation method results in a pure single-atom catalyst rather than aggregated copper nanoparticles, despite the high carbonization temperature of 1000 °C.
3. To verify that the sample is a pure single-atom catalyst and that no aggregation occurred during the 1000 °C treatment, what candidate reference spectra should be included in an LCF analysis?
Ground Truth
Material: Cu-N-C
Measurement: Cu K-edge, ex-situ
Fit method: not reported
Phase fractions: (±10%)
| Phase | Fraction |
|---|---|
| Cu-N/O SAC | 1.0 |
Source evidence: Sample conditions and description provided in text
Key reasoning: The sample is synthesized via a one-pot method using EDTA and 3-aminophenol/formaldehyde, followed by carbonization at 1000 °C under N2. This specific precursor combination provides strong chelation and nitrogen coordination, which prevents metal aggregation during high-temperature pyrolysis. As a result, the 3.87 wt % Cu is stabilized entirely as isolated Cu-N/O single-atom sites within the carbon nanospheres, yielding a pure single-atom catalyst phase.
Reasoning source: Preparation method and sample description
Scoring Rubric (total: 100 pts)
| Q | Type | Max | Question | Reference Answer | Scoring Criteria |
|---|---|---|---|---|---|
| q1 | identification | 30 | Based on the provided synthesis conditions (one-pot synthesis with EDTA and 3-aminophenol/formaldehyde, carbonized at 1000 °C), what is the expected dominant Cu phase in this sample? | The expected dominant Cu phase in this sample is a pure Cu-N/O single-atom catalyst (SAC) with a fraction of 1.0. This specific phase arises because the sample is synthesized via a one-pot method using EDTA and 3-aminophenol/formaldehyde, followed by carbonization at 1000 °C under N2. The precursor combination provides strong chelation and nitrogen coordination to the copper. This strong coordination prevents metal aggregation during the high-temperature pyrolysis, stabilizing the 3.87 wt % Cu entirely as isolated Cu-N/O single-atom sites within the carbon nanospheres. | Full credit if the answer correctly identifies Cu-N/O single-atom catalyst (SAC) as the 100% dominant phase. |
| q2 | reasoning | 40 | Explain the physical reasoning for why this specific preparation method results in a pure single-atom catalyst rather than aggregated copper nanoparticles, despite the high carbonization temperature of 1000 °C. | The formation of a pure single-atom catalyst (1.0 fraction of Cu-N/O SAC) rather than aggregated nanoparticles is driven by the specific precursor combination used in the one-pot synthesis. The use of EDTA and 3-aminophenol/formaldehyde provides strong chelation and nitrogen coordination to the copper atoms. During the carbonization process at 1000 °C under N2, this strong coordination effectively anchors the metal and prevents it from migrating and aggregating. Consequently, the 3.87 wt % Cu is stabilized entirely as isolated Cu-N/O single-atom sites within the resulting carbon nanospheres. | Full credit if the answer explains that the EDTA and 3-aminophenol/formaldehyde precursors provide strong chelation and nitrogen coordination sites, which anchor the Cu atoms and prevent their aggregation into nanoparticles during the high-temperature pyrolysis. |
| q3 | reasoning | 30 | To verify that the sample is a pure single-atom catalyst and that no aggregation occurred during the 1000 °C treatment, what candidate reference spectra should be included in an LCF analysis? | To verify that the sample is a pure single-atom catalyst, the LCF analysis should primarily target the isolated Cu-N/O single-atom catalyst (SAC) phase. This specific phase is expected to have a fraction of 1.0 because the one-pot synthesis using EDTA and 3-aminophenol/formaldehyde provides strong chelation and nitrogen coordination. This coordination prevents metal aggregation during the 1000 °C carbonization under N2. Confirming this pure Cu-N/O SAC phase verifies that the 3.87 wt % Cu is stabilized entirely as isolated single-atom sites within the carbon nanospheres without forming aggregated nanoparticles. | Full credit if the answer identifies the need for a reference representing the Cu-N/O single-atom coordination (e.g., Cu phthalocyanine, Cu porphyrin, or similar Cu-N4 macrocycle) to model the dominant phase, as well as metallic Cu (Cu foil) or Cu oxides to rule out the emergence of aggregated nanoparticle phases. |
Review
#857
Ni-N-C
Ni K-edge
▶
LLM Prompt
Sample Information
Material: Ni-N-C
Support: carbon nanospheres
Sample-Specific Conditions
- Transition metal: Ni
- Ni single-atom catalyst in carbon nanospheres
Measurement
We plan to measure the Ni K-edge XANES spectrum of this sample.
Questions
Based on all the information above:
1. Based on the synthesis conditions (one-pot synthesis with EDTA and 3-aminophenol/formaldehyde, carbonized at 1000 °C), what is the expected dominant structural motif of Ni in this sample, and what is the physical reasoning for why metallic nanoparticles do not form despite the high temperature?
2. To verify the atomic dispersion and oxidation state of the Ni-N-C catalyst using XANES, what standard reference spectra are essential to include for comparison?
3. Describe the expected distinguishing features in the Ni K-edge XANES spectrum of this Ni-N/O single-atom catalyst compared to bulk metallic Ni and NiO.
Ground Truth
Material: Ni-N-C
Measurement: Ni K-edge, ex-situ
Fit method: not reported
Phase fractions: (±10%)
| Phase | Fraction |
|---|---|
| Ni-N/O SAC | 1.0 |
Fit basis (paper's reference spectra):
- Ni foil
- NiO
- NiPc (Nickel phthalocyanine)
Source evidence: Sample description and synthesis conditions provided in the text
Key reasoning: The one-pot synthesis utilizes EDTA to strongly chelate Ni ions, while 3-aminophenol and formaldehyde polymerize to form a resin framework. During carbonization at 1000 °C under N2, the strong chelation prevents the migration and aggregation of Ni atoms, resulting in a pure phase of atomically dispersed Ni coordinated by N and O atoms (Ni-N/O SAC) within the carbon nanospheres.
Reasoning source: Synthesis and structural characterization sections
Scoring Rubric (total: 100 pts)
| Q | Type | Max | Question | Reference Answer | Scoring Criteria |
|---|---|---|---|---|---|
| q1 | reasoning | 40 | Based on the synthesis conditions (one-pot synthesis with EDTA and 3-aminophenol/formaldehyde, carbonized at 1000 °C), what is the expected dominant structural motif of Ni in this sample, and what is the physical reasoning for why metallic nanoparticles do not form despite the high temperature? | The expected dominant structural motif is a pure phase of atomically dispersed Ni coordinated by N and O atoms (Ni-N/O SAC) within the carbon nanospheres, representing a 1.0 (100%) fraction of the Ni species. This specific structure arises because the one-pot synthesis utilizes EDTA to strongly chelate the Ni ions, while 3-aminophenol and formaldehyde polymerize to form a resin framework. During carbonization at 1000 °C under N2, this strong chelation effectively prevents the migration and aggregation of the Ni atoms. Consequently, metallic nanoparticles cannot form, leaving the Ni entirely isolated as a single-atom catalyst. | Award 15 points for identifying the dominant phase as atomically dispersed Ni coordinated by N/O (Ni-N/O SAC). Award 25 points for explaining that EDTA strongly chelates the Ni ions, which anchors them within the polymer matrix and prevents their migration and aggregation into metallic nanoparticles during the 1000 °C carbonization. |
| q2 | identification | 30 | To verify the atomic dispersion and oxidation state of the Ni-N-C catalyst using XANES, what standard reference spectra are essential to include for comparison? | The essential standard reference spectra to include for comparison are Ni foil, NiO, and NiPc (Nickel phthalocyanine). These references are necessary to evaluate the structural outcome of the high-temperature synthesis, where strong EDTA chelation is used to prevent Ni aggregation. Ni foil and NiO serve as benchmarks for metallic (Ni0) and bulk oxidized (Ni2+) states, respectively, allowing researchers to verify the complete absence of metallic Ni-Ni bonding. Meanwhile, NiPc provides a molecular reference for square-planar or distorted Ni-N coordination, which is required to confirm that the carbonized resin framework successfully yielded an atomically dispersed Ni-N/O single-atom catalyst with an oxidation state close to +2. | Award 10 points each for mentioning: 1) a metallic reference (Ni foil) to rule out nanoparticles, 2) an oxide reference (NiO) for oxidation state bounds, and 3) a molecular/single-atom reference with Ni-N coordination (e.g., NiPc or Ni porphyrin) to confirm the local coordination environment. |
| q3 | spectral | 30 | Describe the expected distinguishing features in the Ni K-edge XANES spectrum of this Ni-N/O single-atom catalyst compared to bulk metallic Ni and NiO. | The Ni K-edge XANES spectrum of this sample will exhibit an absorption edge position and white line intensity located between those of Ni foil and NiO, closely resembling the molecular reference NiPc. The most distinguishing features are the complete absence of metallic Ni-Ni bonding signatures and the presence of a spectral profile characteristic of square-planar or distorted Ni-N/O coordination. These specific spectral features emerge because the strong EDTA chelation during the 1000 °C carbonization process prevents Ni migration and aggregation. As a result, the sample exists entirely as an atomically dispersed Ni-N/O single-atom catalyst within the carbon nanospheres, possessing an oxidation state near +2 rather than forming bulk metallic Ni or NiO. | Award 15 points for stating the complete absence of metallic Ni features (indicating no Ni-Ni bonds). Award 15 points for noting that the edge position and white line intensity will resemble a +2 oxidation state molecular reference (like NiPc) rather than bulk NiO, reflecting the specific Ni-N/O coordination. |
Review
Evaluating the Role of Metastable Surfaces in Mechanochemical Reduction of Molybdenum Oxide
BNL-NSLS-II-8-ID
Synthesis
Neung-Kyung Yu et al.
DOI: 10.1021/jacsau.4c00758
4 scenarios
▶
#858
MoO3 / MoO2 mixture
Mo K-edge
▶
LLM Prompt
Sample Information
Material: MoO3 / MoO2 mixture
Method: mechanochemical
Precursors: MoO3
Duration Hours: 0.0833
Atmosphere: Ar
Sample-Specific Conditions
- milling time: 5 min
- MoO3 ball-milled for 5 minutes under argon atmosphere
Preparation
- MoO3 was pre-treated at 450 °C in air for 2 h. 1 g of MoO3 was milled with one 20 mm grinding ball at 30 Hz for 5 min under argon flow (60 sccm).
Measurement
We plan to measure the Mo K-edge XANES spectrum of this sample.
Questions
Based on all the information above:
1. What candidate reference spectra are required to model the Mo K-edge XANES spectrum of this sample using Linear Combination Fitting (LCF)?
2. Based on the mechanochemical conditions (5 min milling of MoO3 in Ar), estimate the phase fractions of the components in the resulting mixture.
3. Explain the physical reasoning for the expected phase composition, specifically addressing the effect of the 5-minute milling duration under an argon atmosphere.
Ground Truth
Material: MoO3 / MoO2 mixture
Measurement: Mo K-edge XANES
Fit method: LCF
Phase fractions: (±10%)
| Phase | Fraction |
|---|---|
| MoO2 | 0.133 |
| MoO3 | 0.867 |
Fit basis (paper's reference spectra):
- MoO2
- MoO3
Source evidence: text/figure_2
Key reasoning: Mechanochemical milling of MoO3 under an inert argon atmosphere induces a partial reduction to MoO2. Because the milling time is very short (5 minutes), the reduction is incomplete, resulting in a mixture dominated by unreacted MoO3 (86.7%) with a small fraction of newly formed MoO2 (13.3%).
Reasoning source: text/figure_2
Scoring Rubric (total: 100 pts)
| Q | Type | Max | Question | Reference Answer | Scoring Criteria |
|---|---|---|---|---|---|
| q1 | identification | 20 | What candidate reference spectra are required to model the Mo K-edge XANES spectrum of this sample using Linear Combination Fitting (LCF)? | To model the Mo K-edge XANES spectrum of this sample using Linear Combination Fitting (LCF), the required reference spectra are MoO3 and MoO2. These specific phases are expected because the sample is prepared by mechanochemical milling of a MoO3 precursor under an inert argon atmosphere. The mechanical energy from the milling process induces a partial reduction of the initial MoO3 phase into MoO2. Due to the very short milling duration of just 5 minutes, this reduction remains incomplete, necessitating both the unreacted MoO3 precursor and the newly formed MoO2 product to accurately fit the resulting spectrum. | Full points for identifying both MoO3 and MoO2 as the necessary reference spectra. |
| q2 | quantification | 40 | Based on the mechanochemical conditions (5 min milling of MoO3 in Ar), estimate the phase fractions of the components in the resulting mixture. | The estimated phase fractions for this mixture are 86.7% MoO3 and 13.3% MoO2, with a fitting uncertainty of 10%. These specific values result directly from the mechanochemical milling conditions applied to the MoO3 precursor under an inert argon flow. The milling process drives a partial reduction of the MoO3 into MoO2, but because the milling time is extremely short (only 5 minutes at 30 Hz), the reaction cannot proceed to completion. Consequently, the final mixture is heavily dominated by the unreacted MoO3 precursor, with only a small fraction having converted to the newly formed MoO2 phase. | Full points for estimating ~13% MoO2 and ~87% MoO3. Partial credit if the model correctly predicts a mixture heavily dominated by MoO3 with a minor MoO2 component. |
| q3 | reasoning | 40 | Explain the physical reasoning for the expected phase composition, specifically addressing the effect of the 5-minute milling duration under an argon atmosphere. | The expected phase composition of 86.7% MoO3 and 13.3% MoO2 is driven by the mechanochemical milling of the MoO3 precursor under an inert argon atmosphere. The mechanical energy provided by milling the MoO3 with a 20 mm grinding ball at 30 Hz induces a chemical reduction of the Mo(VI) oxide into MoO2. However, because the milling duration is restricted to only 5 minutes, the kinetic progression of this reduction is severely limited. As a result, the reduction is incomplete, yielding a final mixture that is predominantly unreacted MoO3 alongside a minor fraction of the newly formed MoO2 product. | Full points for explaining that milling in an inert (Ar) atmosphere drives the reduction of MoO3 to MoO2, but the short duration (5 min) limits the extent of the reaction, leaving unreacted MoO3 as the dominant phase. |
Review
#859
MoO3 / MoO2 mixture
Mo K-edge
▶
LLM Prompt
Sample Information
Material: MoO3 / MoO2 mixture
Method: mechanochemical
Precursors: MoO3
Duration Hours: 0.5
Atmosphere: Ar
Sample-Specific Conditions
- milling time: 30 min
- MoO3 ball-milled for 30 minutes under argon atmosphere
Preparation
- MoO3 was pre-treated at 450 °C in air for 2 h. 1 g of MoO3 was milled with one 20 mm grinding ball at 30 Hz for 30 min under argon flow (60 sccm).
Measurement
We plan to measure the Mo K-edge XANES spectrum of this sample.
Questions
Based on all the information above:
1. What candidate reference spectra are required to model the Mo K-edge XANES spectrum of this sample using Linear Combination Fitting (LCF)?
2. Estimate the expected phase fractions for the sample after 30 minutes of mechanochemical milling of MoO3 in an argon atmosphere.
3. Explain the physical reasoning for the formation of this specific phase mixture under these milling conditions.
Ground Truth
Material: MoO3 / MoO2 mixture
Measurement: Mo K-edge XANES
Fit method: LCF
Phase fractions: (±10%)
| Phase | Fraction |
|---|---|
| MoO2 | 0.33 |
| MoO3 | 0.67 |
Fit basis (paper's reference spectra):
- MoO2
- MoO3
Source evidence: text/figure_2
Key reasoning: Ball-milling MoO3 under an argon atmosphere for 30 minutes induces a partial mechanochemical reduction. The mechanical energy provided by the milling process drives the transformation of the MoO3 precursor into MoO2, resulting in a mixed-phase composition of approximately one-third MoO2 and two-thirds unreacted MoO3.
Reasoning source: text/figure_2
Scoring Rubric (total: 100 pts)
| Q | Type | Max | Question | Reference Answer | Scoring Criteria |
|---|---|---|---|---|---|
| q1 | identification | 20 | What candidate reference spectra are required to model the Mo K-edge XANES spectrum of this sample using Linear Combination Fitting (LCF)? | To model the Mo K-edge XANES spectrum of this sample using Linear Combination Fitting (LCF), the required candidate reference spectra are MoO3 and MoO2. These specific phases are expected because the sample is prepared by ball-milling a MoO3 precursor under an inert argon atmosphere for 30 minutes. The mechanical energy imparted by the 30 Hz milling process induces a partial mechanochemical reduction of the initial oxide. Consequently, the final sample consists of the newly formed, reduced MoO2 phase alongside the remaining unreacted MoO3 precursor. | Full points for identifying both MoO2 and MoO3 as the necessary reference spectra. |
| q2 | quantification | 40 | Estimate the expected phase fractions for the sample after 30 minutes of mechanochemical milling of MoO3 in an argon atmosphere. | The expected phase fractions for this sample are approximately 0.33 (33%) MoO2 and 0.67 (67%) MoO3, with an estimated uncertainty of 10%. These specific values result from the limited 30-minute duration of the mechanochemical milling process under an argon flow. The mechanical energy provided by milling 1 g of MoO3 with a 20 mm grinding ball at 30 Hz drives a partial mechanochemical reduction of the precursor. Because the milling time is relatively short, the transformation is incomplete, yielding a mixed-phase composition of about one-third reduced MoO2 and two-thirds unreacted MoO3. | Full points for estimating approximately 33% MoO2 and 67% MoO3. Partial credit for identifying a mixture with MoO3 as the majority phase and MoO2 as the minority phase. |
| q3 | reasoning | 40 | Explain the physical reasoning for the formation of this specific phase mixture under these milling conditions. | The formation of the MoO3 and MoO2 phase mixture is driven by the mechanical energy imparted during the mechanochemical milling process. When 1 g of the pre-treated MoO3 precursor is milled with a 20 mm grinding ball at 30 Hz under an inert argon atmosphere, the mechanical impact induces a mechanochemical reduction of the material. Because the milling duration is restricted to exactly 30 minutes, the total mechanical energy supplied is only sufficient to partially reduce the precursor. This specific set of conditions results in an incomplete transformation, yielding a final mixed-phase composition of approximately one-third newly formed MoO2 and two-thirds unreacted MoO3. | Full points for explaining that the mechanical energy from ball-milling in an inert (Ar) atmosphere induces a partial reduction of the MoO3 precursor to MoO2. |
Review
#860
MoO3 / MoO2 mixture
Mo K-edge
▶
LLM Prompt
Sample Information
Material: MoO3 / MoO2 mixture
Method: mechanochemical
Precursors: MoO3
Duration Hours: 1.0
Atmosphere: Ar
Sample-Specific Conditions
- milling time: 60 min
- MoO3 ball-milled for 60 minutes under argon atmosphere
Preparation
- MoO3 was pre-treated at 450 °C in air for 2 h. 1 g of MoO3 was milled with one 20 mm grinding ball at 30 Hz for 60 min under argon flow (60 sccm).
Measurement
We plan to measure the Mo K-edge XANES spectrum of this sample.
Questions
Based on all the information above:
1. Based on the mechanochemical synthesis conditions (milling MoO3 for 60 minutes under argon), what candidate reference spectra should be included in the basis set for Linear Combination Fitting (LCF) of the Mo K-edge XANES spectrum?
2. Estimate the quantitative phase fractions of the resulting mixture after 60 minutes of ball-milling MoO3 under an argon atmosphere.
3. Explain the chemical transformation that occurs during this 60-minute mechanochemical milling process under argon, and why it leads to the observed phase composition.
Ground Truth
Material: MoO3 / MoO2 mixture
Measurement: Mo K-edge XANES
Fit method: LCF
Phase fractions: (±10%)
| Phase | Fraction |
|---|---|
| MoO2 | 0.618 |
| MoO3 | 0.382 |
Fit basis (paper's reference spectra):
- MoO2
- MoO3
Source evidence: text/figure_2
Key reasoning: Mechanochemical milling of MoO3 under an argon flow (60 sccm) for 60 minutes induces a partial phase transformation. The mechanical energy supplied by the 20 mm grinding ball at 30 Hz in an inert atmosphere results in the reduction of the MoO3 precursor, yielding a mixture dominated by MoO2 (61.8%) with unreacted MoO3 (38.2%) remaining.
Reasoning source: text/figure_2
Scoring Rubric (total: 100 pts)
| Q | Type | Max | Question | Reference Answer | Scoring Criteria |
|---|---|---|---|---|---|
| q1 | identification | 20 | Based on the mechanochemical synthesis conditions (milling MoO3 for 60 minutes under argon), what candidate reference spectra should be included in the basis set for Linear Combination Fitting (LCF) of the Mo K-edge XANES spectrum? | The basis set for Linear Combination Fitting (LCF) of the Mo K-edge XANES spectrum should include reference spectra for MoO2 and MoO3. These specific phases are expected because the sample begins as a pure MoO3 precursor that is subjected to mechanochemical milling. The mechanical energy supplied by the 20 mm grinding ball at 30 Hz for 60 minutes under an inert argon flow (60 sccm) induces a partial phase transformation. Consequently, the process reduces the initial MoO3, leading to the formation of MoO2 while leaving some unreacted MoO3 behind. | Full points if both MoO2 and MoO3 are identified as the necessary reference spectra. Deduct points if other unnecessary phases are suggested or if either is missing. |
| q2 | quantification | 40 | Estimate the quantitative phase fractions of the resulting mixture after 60 minutes of ball-milling MoO3 under an argon atmosphere. | After 60 minutes of ball-milling, the resulting mixture consists of 61.8% MoO2 and 38.2% MoO3, with an estimated uncertainty of 10%. These specific fractions result from the partial phase transformation induced by the mechanochemical process. The mechanical energy from the 20 mm grinding ball operating at 30 Hz in an inert argon atmosphere (60 sccm) drives the reduction of the MoO3 precursor. Because the 60-minute duration is insufficient for complete conversion, the final composition is dominated by the newly formed MoO2 phase but still retains a significant fraction of unreacted MoO3. | Full points for estimating approximately 62% MoO2 and 38% MoO3. Partial credit for identifying that MoO2 is the majority phase but with less accurate percentages. |
| q3 | reasoning | 40 | Explain the chemical transformation that occurs during this 60-minute mechanochemical milling process under argon, and why it leads to the observed phase composition. | During the 60-minute mechanochemical milling process, the initial MoO3 precursor undergoes a partial reduction to form MoO2. This chemical transformation is driven by the mechanical energy supplied by the 20 mm grinding ball operating at 30 Hz. Because the milling is conducted under an inert argon flow (60 sccm), the environment facilitates the reduction of the oxide rather than maintaining its fully oxidized state. The 60-minute duration provides enough energy to convert the majority of the material, yielding a final composition dominated by MoO2 (61.8%) alongside the remaining unreacted MoO3 (38.2%). | Full points for explaining that the mechanical energy in an inert (argon) atmosphere drives the partial reduction of the MoO3 precursor, resulting in a mixture of the reduced MoO2 phase and unreacted MoO3. |
Review
#861
MoO3 / MoO2 mixture
Mo K-edge
▶
LLM Prompt
Sample Information
Material: MoO3 / MoO2 mixture
Method: mechanochemical
Precursors: MoO3
Duration Hours: 0.5
Atmosphere: Air
Sample-Specific Conditions
- atmosphere: Air
- MoO3 ball-milled for 30 minutes under air atmosphere
Preparation
- MoO3 was pre-treated at 450 °C in air for 2 h. 1 g of MoO3 was milled with one 20 mm grinding ball at 30 Hz for 30 min in a closed vessel exposed to air atmosphere.
Measurement
We plan to measure the Mo K-edge XANES spectrum of this sample.
Questions
Based on all the information above:
1. Based on the synthesis conditions (MoO3 ball-milled for 30 minutes in air), what candidate reference spectra are required to accurately model the Mo K-edge XANES spectrum of the resulting sample using Linear Combination Fitting (LCF)?
2. Estimate the relative phase fractions of the components in this sample after 30 minutes of mechanochemical milling in an air atmosphere.
3. Explain the physical reasoning for why this specific mixture of phases is observed after milling MoO3 in an air atmosphere for 30 minutes.
Ground Truth
Material: MoO3 / MoO2 mixture
Measurement: Mo K-edge XANES
Fit method: LCF
Phase fractions: (±10%)
| Phase | Fraction |
|---|---|
| MoO2 | 0.23 |
| MoO3 | 0.77 |
Fit basis (paper's reference spectra):
- MoO3
- MoO2
Source evidence: text/figure_2
Key reasoning: Mechanochemical milling of MoO3 for 30 minutes induces a partial phase transformation and reduction. Even when milled in an oxidizing air atmosphere, the mechanical forces drive the partial reduction of MoO3 to MoO2. This results in a mixed-phase system where the unreacted precursor (MoO3) remains the dominant phase (77%), with a significant minor fraction of the reduced MoO2 phase (23%).
Reasoning source: text/figure_2
Scoring Rubric (total: 100 pts)
| Q | Type | Max | Question | Reference Answer | Scoring Criteria |
|---|---|---|---|---|---|
| q1 | identification | 20 | Based on the synthesis conditions (MoO3 ball-milled for 30 minutes in air), what candidate reference spectra are required to accurately model the Mo K-edge XANES spectrum of the resulting sample using Linear Combination Fitting (LCF)? | To accurately model the Mo K-edge XANES spectrum using Linear Combination Fitting (LCF), the required candidate reference spectra are MoO3 and MoO2. These specific phases are expected because the mechanochemical milling of the MoO3 precursor for 30 minutes at 30 Hz induces a partial phase transformation and reduction. Even though the milling occurs in an oxidizing air atmosphere, the intense mechanical forces drive the partial reduction of the MoO3 precursor to MoO2. Consequently, the final sample is a mixed-phase system containing both the unreacted precursor and the newly formed reduced phase. | Full points for identifying both MoO3 and MoO2 as the necessary reference spectra. Zero points if irrelevant phases are included or if either key phase is missing. |
| q2 | quantification | 40 | Estimate the relative phase fractions of the components in this sample after 30 minutes of mechanochemical milling in an air atmosphere. | The relative phase fractions for this sample are estimated to be 77% MoO3 and 23% MoO2, with an uncertainty of 10%. These specific values result from the kinetics of the mechanochemical process during the 30-minute milling duration. The mechanical forces applied by the 20 mm grinding ball at 30 Hz are sufficient to drive a partial reduction of the MoO3 precursor to MoO2, even in an oxidizing air atmosphere. Because the milling time is limited to 0.5 hours, the transformation is incomplete, leaving the unreacted MoO3 as the dominant phase while generating a significant minor fraction of MoO2. | Full points for estimating approximately 77% MoO3 and 23% MoO2 (allow ±10% margin). Partial credit for correctly identifying MoO3 as the major phase and MoO2 as the minor phase without exact percentages. |
| q3 | reasoning | 40 | Explain the physical reasoning for why this specific mixture of phases is observed after milling MoO3 in an air atmosphere for 30 minutes. | The observation of a mixed MoO3 and MoO2 phase system arises directly from the mechanochemical forces applied during the 30-minute ball-milling process. Initially, the sample consists entirely of MoO3 that was pre-treated at 450 °C in air. During milling at 30 Hz with a 20 mm grinding ball, the intense mechanical energy drives a partial phase transformation and reduction of the MoO3 precursor. This mechanical reduction to MoO2 occurs even though the closed vessel is exposed to an oxidizing air atmosphere. Because the milling duration is limited to 0.5 hours, the reduction is only partial, resulting in a final composition where unreacted MoO3 remains the dominant phase (77%) alongside a newly formed MoO2 minor phase (23%). | Full points for explaining that mechanochemical forces induce a partial reduction of the MoO3 precursor to MoO2, but the transformation is incomplete (leaving MoO3 as the dominant phase), which is consistent with the short milling time and the oxidizing (air) atmosphere. |
Review
Ultraviolet Photooxidation of Smectite‐Bound Fe(II) and Implications for the Origin of Martian Nontronites
BNL-NSLS-II-8-ID
Environmental
V. B. Rivera Banuchi et al.
DOI: 10.1029/2021JE007150
3 scenarios
▶
#862
synthetic smectite
Fe K
▶
LLM Prompt
Sample Information
Material: synthetic smectite
Sample Origin: synthetic
Sample-Specific Conditions
- Initial Fe content: 0.74 Fe atoms per half unit cell
- Low Fe smectite subjected to UV irradiation
Preparation
- Synthesized via a sol-gel method under anoxic conditions (97% N2, 3% H2). Stock solutions of iron (II) chloride, aluminum chloride, magnesium chloride, and sodium silicate were combined (pH 8-9), aged overnight, washed, and hydrothermally treated at 200 °C for 15 days in N2-purged Parr vessels. Interlayer Na+ was exchanged for Ca2+ using 0.5 M CaCl2, followed by washing and vacuum desiccation. The resulting Low Fe smectite (0.74 Fe atoms per half unit cell) was suspended in deoxygenated water (15 mg/mL) in N2-purged sealed quartz vessels and irradiated with a medium pressure 450 W mercury lamp for 112.77 hours.
Measurement
We plan to measure the Fe K XANES spectrum of this sample.
Questions
Based on all the information above:
1. Based on the sample conditions (UV irradiated synthetic ferrous smectite), what reference spectra would be most appropriate to use as endmembers for Linear Combination Fitting (LCF) of the Fe K-edge XANES data to determine the oxidation state?
2. Estimate the fraction of oxidized iron (Fe3+/ΣFe) in this Low Fe smectite sample after 112.77 hours of UV irradiation. Provide your answer as a percentage or decimal fraction.
3. Explain why the UV photooxidation of the structural Fe(II) in this smectite might result in only partial oxidation rather than complete conversion to a fully ferric phase, despite over 100 hours of irradiation.
Ground Truth
Material: synthetic smectite
Measurement: Fe K-edge XANES, fluorescence mode, beamline 8-ID at NSLS-II
Fit method: Linear combination fitting (LCF)
Phase fractions: (±5%)
| Phase | Fraction |
|---|---|
| Nontronite (NAu-2) | 0.185 |
| Low Fe_B (unaltered ferrous smectite) | 0.815 |
Fit basis (paper's reference spectra):
- Nontronite standard (NAu-2) as fully ferric endmember
- Unaltered ferrous smectite (Low Fe_B) as ferrous endmember
Source evidence: Table 1, page 6
Key reasoning: UV irradiation of the initially ferrous smectite caused partial oxidation of structural Fe(II) to Fe(III). The extent of oxidation was limited (18.5% for the low Fe sample). This limited oxidation may indicate that UV photooxidation does not fully oxidize the smectite regardless of exposure time, potentially being limited to the mineral surface. Additionally, the formation of Fe3+ at the edges of clay surfaces may cause surface passivation, which decreases the oxidation rate and prevents complete oxidation.
Reasoning source: Section 3.1 (page 5), Section 4.1 (page 7), and Section 4.2 (page 8)
Scoring Rubric (total: 100 pts)
| Q | Type | Max | Question | Reference Answer | Scoring Criteria |
|---|---|---|---|---|---|
| q1 | identification | 30 | Based on the sample conditions (UV irradiated synthetic ferrous smectite), what reference spectra would be most appropriate to use as endmembers for Linear Combination Fitting (LCF) of the Fe K-edge XANES data to determine the oxidation state? | The most appropriate reference spectra for Linear Combination Fitting (LCF) are the unaltered ferrous smectite (Low Fe_B) as the ferrous endmember and a nontronite standard (NAu-2) as the fully ferric endmember. These specific phases are expected because the sample was initially synthesized as a low-Fe ferrous smectite under strictly anoxic conditions, making the unaltered material the ideal Fe(II) baseline. Upon exposure to UV irradiation for 112.77 hours, the structural Fe(II) undergoes partial photooxidation to Fe(III). Therefore, a fully ferric smectite standard like nontronite is required to accurately model the newly formed oxidized fraction alongside the remaining unoxidized ferrous smectite. | Full credit for identifying a fully ferric smectite (such as nontronite) and the unaltered initial ferrous smectite as the two necessary endmembers. |
| q2 | quantification | 35 | Estimate the fraction of oxidized iron (Fe3+/ΣFe) in this Low Fe smectite sample after 112.77 hours of UV irradiation. Provide your answer as a percentage or decimal fraction. | The fraction of oxidized iron (Fe3+/ΣFe) in the Low Fe smectite sample after 112.77 hours of UV irradiation is estimated to be 0.185 (or 18.5%), with the remaining 0.815 (81.5%) persisting as unoxidized ferrous smectite. These specific values result from the limited extent of UV photooxidation on the initially ferrous smectite. Despite the prolonged UV exposure, the oxidation process is likely restricted to the mineral surface rather than penetrating the bulk structure. As Fe3+ forms at the edges of the clay surfaces, it causes surface passivation, which drastically decreases the oxidation rate and halts the reaction at 18.5% rather than allowing complete conversion. | Full credit for an estimate around 18.5% (or 0.185). Partial credit for values between 10% and 30%. |
| q3 | reasoning | 35 | Explain why the UV photooxidation of the structural Fe(II) in this smectite might result in only partial oxidation rather than complete conversion to a fully ferric phase, despite over 100 hours of irradiation. | The UV photooxidation of structural Fe(II) in this synthetic smectite results in only partial oxidation (18.5%) because the photochemical reaction is likely restricted to the mineral surface. As the initially ferrous smectite is irradiated, Fe(II) oxidizes to Fe(III) specifically at the edges of the clay surfaces. This localized accumulation of Fe3+ causes surface passivation, creating a barrier that inhibits further reaction. Consequently, this passivation decreases the overall oxidation rate and prevents the complete oxidation of the bulk structural Fe(II), regardless of the prolonged 112.77-hour exposure time. | Full credit for mentioning that UV photooxidation might be limited to the mineral surface, or that the formation of Fe3+ at the edges of clay surfaces causes surface passivation, which decreases the oxidation rate and prevents full oxidation. |
Review
#863
synthetic smectite
Fe K
▶
LLM Prompt
Sample Information
Material: synthetic smectite
Sample Origin: synthetic
Sample-Specific Conditions
- Initial Fe content: 1.44 Fe atoms per half unit cell
- Mid Fe smectite subjected to UV irradiation
Preparation
- Ferrous smectites were synthesized by a sol-gel method in an anaerobic chamber (97% N2, 3% H2, p(O2) < 1 ppmv). Stock solutions of iron (II) chloride, aluminum chloride, magnesium chloride, and sodium silicate were combined to precipitate gels (pH 8-9). After aging overnight, gels were centrifuged, rinsed with DI water, and transferred to Parr hydrothermal pressure vessels. The vessels were sealed, placed in vacuum ovens, purged with N2, and heated at 200 °C for 15 days. Post-hydrothermal treatment included immersion in 0.5 M calcium chloride solution to exchange Ca2+ for Na+, followed by rinsing, centrifuging, and vacuum desiccation under anoxic conditions. (Context from source paper: The 'Mid Fe' smectite was subsequently suspended in deoxygenated water, UV irradiated for 112.77 hours, and hydrothermally recrystallized at 200 °C for 5 days).
Measurement
We plan to measure the Fe K XANES spectrum of this sample.
Questions
Based on all the information above:
1. What reference spectra are appropriate for determining the Fe oxidation state of this UV-irradiated synthetic smectite using linear combination fitting (LCF)?
2. Based on the provided sample conditions (Mid Fe smectite, UV irradiated for ~112 hours under anoxic conditions), estimate the fraction of oxidized iron (Fe3+/ΣFe) in the sample.
3. Explain the physical and chemical reasoning for why the oxidation of this smectite sample by UV irradiation is incomplete, and describe how the structure accommodates the oxidized iron.
Ground Truth
Material: synthetic smectite
Measurement: Fe K-edge XANES, fluorescence mode, beamline 8-ID at NSLS-II
Fit method: Linear combination fitting (LCF)
Phase fractions: (±5%)
| Phase | Fraction |
|---|---|
| Nontronite (NAu-2) | 0.165 |
| Mid Fe_B | 0.835 |
Fit basis (paper's reference spectra):
- Nontronite (NAu-2) standard (fully ferric endmember)
- Unaltered Mid Fe ferrous smectite (Mid Fe_B) (ferrous endmember)
Source evidence: Table 1 (page 6) and Section 3.1 (page 5)
Key reasoning: UV irradiation of the initially ferrous smectite caused partial oxidation of structural Fe2+ to Fe3+. The extent of oxidation was limited to 16.5% for the Mid Fe sample. This limited oxidation is likely because UV photooxidation might be restricted to the mineral surface or due to surface passivation by newly formed Fe3+ at the edges of clay surfaces. No secondary iron oxide phases were detected, indicating oxidation was accommodated within the smectite structure without significant Fe ejection.
Reasoning source: Section 3.1 (page 5), Section 4.1 (page 7), and Section 4.2 (page 7)
Scoring Rubric (total: 100 pts)
| Q | Type | Max | Question | Reference Answer | Scoring Criteria |
|---|---|---|---|---|---|
| q1 | identification | 25 | What reference spectra are appropriate for determining the Fe oxidation state of this UV-irradiated synthetic smectite using linear combination fitting (LCF)? | The appropriate reference spectra for linear combination fitting are the Nontronite (NAu-2) standard as the fully ferric (Fe3+) endmember and the unaltered Mid Fe ferrous smectite (Mid Fe_B) as the ferrous (Fe2+) endmember. These specific phases are expected because the initial synthetic smectite was synthesized anaerobically with Fe(II) chloride, making it purely ferrous. The subsequent 112.77 hours of UV irradiation in deoxygenated water induced partial oxidation of the structural Fe2+ to Fe3+. Because no secondary iron oxide phases formed and the oxidized iron was accommodated entirely within the smectite structure, a two-component fit using the unaltered ferrous precursor and a fully ferric smectite standard perfectly captures the resulting mixed-valence state. | Full credit for identifying a fully ferric smectite standard (e.g., Nontronite NAu-2) and the unaltered initial ferrous smectite (Mid Fe_B) as the two endmembers. |
| q2 | quantification | 35 | Based on the provided sample conditions (Mid Fe smectite, UV irradiated for ~112 hours under anoxic conditions), estimate the fraction of oxidized iron (Fe3+/ΣFe) in the sample. | The estimated fraction of oxidized iron (Fe3+/ΣFe) in the sample is 16.5% (or 0.165), with the remaining 83.5% (0.835) staying as unoxidized ferrous iron. This specific 16.5% oxidation fraction results from the UV irradiation of the initially ferrous Mid Fe smectite (1.44 Fe atoms per half unit cell) in deoxygenated water. The oxidation is limited to this relatively low value because UV photooxidation is physically restricted to the mineral surface. Additionally, the newly formed Fe3+ at the edges of the clay surfaces likely causes surface passivation, preventing further oxidation of the bulk structural Fe2+ despite the prolonged 112.77-hour irradiation time. | Full credit for estimating a partial oxidation fraction around 16.5% (accept 10-25%). Deduct points for predicting complete oxidation or no oxidation. |
| q3 | reasoning | 40 | Explain the physical and chemical reasoning for why the oxidation of this smectite sample by UV irradiation is incomplete, and describe how the structure accommodates the oxidized iron. | The oxidation of the initially ferrous smectite by UV irradiation is incomplete, reaching only 16.5% Fe3+, because the photooxidation process is physically restricted to the mineral surface. Furthermore, the newly formed Fe3+ at the edges of the clay surfaces likely causes surface passivation, which blocks deeper penetration of the photochemical reaction and protects the remaining bulk structural Fe2+. The smectite structure accommodates this oxidized iron directly within its lattice without ejecting iron to form new minerals. This is evidenced by the complete absence of secondary iron oxide phases, demonstrating that the structural framework remains intact during the partial oxidation and subsequent hydrothermal recrystallization. | Full credit for explaining that UV photooxidation may be limited to the mineral surface or hindered by surface passivation (newly formed Fe3+ at the edges). Must also note that the structure accommodates the Fe3+ without significant Fe ejection (no secondary iron oxides form), likely through mechanisms like octahedral sheet contraction. |
Review
#864
synthetic smectite
Fe K
▶
LLM Prompt
Sample Information
Material: synthetic smectite
Sample Origin: synthetic
Sample-Specific Conditions
- Initial Fe content: 2.11 Fe atoms per half unit cell
- High Fe smectite subjected to UV irradiation
Preparation
- Ferrous smectites were synthesized via a sol-gel method in an anaerobic chamber (97% N2, 3% H2, p(O2) < 1 ppmv). Stock solutions of iron (II) chloride, aluminum chloride, magnesium chloride, and sodium silicate were combined to precipitate gels. After aging overnight, rinsing, and centrifugation, the gel suspensions were transferred to Parr hydrothermal pressure vessels. The vessels were placed in vacuum ovens, purged with high-purity N2, and heated at 200 °C for 15 days. Post-hydrothermal treatment, precipitates were immersed in 0.5 M calcium chloride solution for Ca2+ exchange, then rinsed, centrifuged, and vacuum dried under anoxic conditions.
Measurement
We plan to measure the Fe K XANES spectrum of this sample.
Questions
Based on all the information above:
1. Identify the appropriate reference spectra (endmembers) required to model the Fe K-edge XANES spectrum of this UV-irradiated high-Fe smectite using linear combination fitting.
2. Based on the provided experimental conditions (112.77 hours of UV irradiation of a synthetic high-Fe smectite under anoxic conditions), estimate the resulting fraction of oxidized iron (Fe3+/ΣFe) and the remaining fraction of unaltered ferrous smectite.
3. Discuss the physical reasoning for the observed extent of oxidation in this sample. Why does the UV photooxidation reaction not proceed to complete oxidation, and how does this behavior contrast with the oxidation of similar smectites by chemical oxidants?
Ground Truth
Material: synthetic smectite
Measurement: Fe K-edge fluorescence mode at beamline 8-ID (Inner-Shell Spectroscopy)
Fit method: Linear combination fitting (LCF)
Phase fractions: (±5%)
| Phase | Fraction |
|---|---|
| Nontronite (NAu-2) | 0.174 |
| High Fe_2B (unaltered ferrous smectite) | 0.826 |
Fit basis (paper's reference spectra):
- Nontronite standard (Clay Minerals Society Special Clay NAu-2) as the fully ferric iron endmember
- Unaltered ferrous smectite (High Fe_2B) as the ferrous iron endmember
Source evidence: Table 1 and Section 2.2 (Analytical Methods)
Key reasoning: UV irradiation of the high Fe smectite caused only partial oxidation of the structural Fe(II), resulting in an Fe3+/ΣFe ratio of 17.4%. The oxidation reaction plateaued, likely because UV photooxidation may not fully oxidize a smectite regardless of exposure time and could be limited to oxidizing the mineral surface (surface passivation). Unlike chemical oxidation (e.g., with O2 or H2O2) where higher initial Fe content leads to more extensive oxidation and Fe ejection, UV photooxidation resulted in similar, limited extents of oxidation across different initial Fe contents without producing secondary iron oxide phases.
Reasoning source: Section 3.1 (Iron Redox State: Fe K-Edge XANES and Hydrogen Production) and Section 4.1 (Constraints on Oxidation Mechanisms)
Scoring Rubric (total: 100 pts)
| Q | Type | Max | Question | Reference Answer | Scoring Criteria |
|---|---|---|---|---|---|
| q1 | identification | 20 | Identify the appropriate reference spectra (endmembers) required to model the Fe K-edge XANES spectrum of this UV-irradiated high-Fe smectite using linear combination fitting. | To model the Fe K-edge XANES spectrum of this sample, the appropriate reference spectra are a Nontronite standard (NAu-2) representing the fully ferric iron endmember and an unaltered ferrous smectite (High Fe_2B) representing the ferrous iron endmember. These specific phases are required because the synthetic high-Fe smectite (2.11 Fe atoms per half unit cell) was subjected to UV irradiation, which induces only partial oxidation of the structural Fe(II). Because UV photooxidation is limited to the mineral surface and does not produce secondary iron oxide phases, the sample remains a structurally intact smectite containing a mixture of Fe(II) and Fe(III). Therefore, only the unaltered ferrous smectite and a fully oxidized ferric smectite (nontronite) are needed to accurately capture the redox state without the need for secondary oxide references. | Full credit for identifying a fully ferric smectite endmember (e.g., Nontronite NAu-2) and the corresponding unaltered ferrous smectite endmember (High Fe_2B). |
| q2 | quantification | 40 | Based on the provided experimental conditions (112.77 hours of UV irradiation of a synthetic high-Fe smectite under anoxic conditions), estimate the resulting fraction of oxidized iron (Fe3+/ΣFe) and the remaining fraction of unaltered ferrous smectite. | The resulting fraction of oxidized iron (Fe3+/ΣFe), represented by the Nontronite (NAu-2) endmember, is 0.174 (17.4%), while the remaining fraction of unaltered ferrous smectite (High Fe_2B) is 0.826 (82.6%). These specific values result from the sample being subjected to UV irradiation, which causes only partial oxidation of the structural Fe(II) despite the high initial Fe content of 2.11 Fe atoms per half unit cell. The oxidation fraction plateaus at this relatively low value because UV photooxidation is likely limited to oxidizing the mineral surface, leading to surface passivation. Consequently, the bulk of the high-Fe smectite remains unaltered, yielding a predominantly ferrous composition with a minor 17.4% ferric component. | Full credit for estimating the Fe3+ fraction (or Nontronite equivalent) at approximately 17-18% (0.174) and the remaining Fe2+ fraction at approximately 82-83% (0.826). |
| q3 | reasoning | 40 | Discuss the physical reasoning for the observed extent of oxidation in this sample. Why does the UV photooxidation reaction not proceed to complete oxidation, and how does this behavior contrast with the oxidation of similar smectites by chemical oxidants? | The observed extent of oxidation in this high-Fe smectite is limited to 17.4% because UV irradiation causes only partial oxidation of the structural Fe(II) before the reaction plateaus. This incomplete oxidation occurs because UV photooxidation is likely restricted to the mineral surface, leading to surface passivation that prevents deeper oxidation regardless of exposure time. This behavior contrasts sharply with chemical oxidation (using oxidants like O2 or H2O2), where a higher initial Fe content (such as the 2.11 Fe atoms per half unit cell in this sample) typically leads to much more extensive oxidation. Furthermore, unlike chemical oxidation which often results in the ejection of iron and the formation of secondary iron oxide phases, UV photooxidation produces a limited extent of oxidation across different initial Fe contents without generating any secondary oxides. | Full credit for explaining that UV photooxidation results in only partial oxidation (plateauing reaction) likely limited to the mineral surface (surface passivation) without significant Fe ejection. Must also contrast this with chemical oxidation, noting that chemical oxidants typically cause more extensive oxidation in higher-Fe smectites and often result in Fe ejection/secondary oxide formation. |
Review
Role of biogenic silica in the removal of iron from the Antarctic seas
APS
Environmental
Ellery D. Ingall et al.
DOI: 10.1038/ncomms2981
2 scenarios
▶
#865
biogenic silica (diatoms)
Fe K
▶
LLM Prompt
Sample Information
Material: biogenic silica (diatoms)
Sample Origin: Western Antarctic coastal ocean
Sample-Specific Conditions
- iron pool type: incorporated
- Iron structurally incorporated into biogenic silica of diatoms
Measurement
We plan to measure the Fe K XANES spectrum of this sample.
Questions
Based on all the information above:
1. Based on the sample conditions (iron structurally incorporated into biogenic silica of diatoms in surface seawater), what are the expected primary iron phases and their approximate fractions?
2. Why is a significant fraction of the iron in this structurally incorporated pool found in a reduced state, despite originating from oxygenated surface seawater?
3. If performing linear combination fitting (LCF) on the XANES spectrum of this incorporated iron pool, what specific reference standard spectra should be included in the basis set to capture its speciation?
Ground Truth
Material: biogenic silica (diatoms)
Measurement: Fe K-edge fluorescence XANES at Advanced Photon Source (APS) beamlines 2-ID-D and 2-ID-E
Fit method: Linear combination fitting (LCF)
Phase fractions: (±14%)
| Phase | Fraction |
|---|---|
| iron (II) acetate | 0.499 |
| goethite | 0.501 |
Fit basis (paper's reference spectra):
- iron (II) acetate
- goethite
Source evidence: Figure 3 caption, page 3
Key reasoning: Iron incorporated into biogenic silica exhibits a lower K-edge and pre-edge centroid position than hotspot iron, indicating a reduced oxidation state. This reduced state suggests iron is structurally incorporated and protected from rapid oxidation by ambient surface seawater. The linear combination fit indicates a mix of reduced organic iron (represented by iron (II) acetate) and oxidized iron (goethite), which may reflect gradual oxidation over time or a naturally mixed redox composition.
Reasoning source: Results section ('Iron speciation'), page 2
Scoring Rubric (total: 100 pts)
| Q | Type | Max | Question | Reference Answer | Scoring Criteria |
|---|---|---|---|---|---|
| q1 | quantification | 30 | Based on the sample conditions (iron structurally incorporated into biogenic silica of diatoms in surface seawater), what are the expected primary iron phases and their approximate fractions? | The expected primary iron phases are a reduced organic iron phase (represented by iron (II) acetate) at approximately 49.9% and an oxidized iron phase (goethite) at approximately 50.1%, with an uncertainty of 14%. These specific fractions arise because the iron is structurally incorporated into the biogenic silica of the diatoms. This structural incorporation protects a significant portion of the iron from rapid oxidation by the ambient surface seawater, maintaining it in a reduced state. The roughly equal split between reduced and oxidized phases likely reflects either a naturally mixed redox composition or gradual oxidation of the incorporated iron over time. | Full credit for identifying a roughly equal mixture (~50% each) of a reduced organic iron phase (e.g., iron (II) acetate) and an oxidized iron phase (e.g., goethite). |
| q2 | reasoning | 40 | Why is a significant fraction of the iron in this structurally incorporated pool found in a reduced state, despite originating from oxygenated surface seawater? | A significant fraction of the iron remains in a reduced state because it is structurally incorporated directly into the biogenic silica of the diatoms. This physical incorporation acts as a protective barrier against the surrounding oxygenated surface seawater of the Western Antarctic coastal ocean. Consequently, the iron is shielded from rapid oxidation, preserving a reduced oxidation state that exhibits a lower K-edge and pre-edge centroid position in XANES spectra. The presence of a mixed redox state indicates that while the silica provides protection, some gradual oxidation over time or a naturally mixed composition still occurs. | Full credit for explaining that structural incorporation into the biogenic silica protects the reduced (likely organic) iron from rapid oxidation by the ambient seawater. Partial credit for mentioning that the presence of some oxidized iron might reflect gradual oxidation over time or a naturally mixed redox state. |
| q3 | identification | 30 | If performing linear combination fitting (LCF) on the XANES spectrum of this incorporated iron pool, what specific reference standard spectra should be included in the basis set to capture its speciation? | The linear combination fitting (LCF) basis set should include iron (II) acetate and goethite reference spectra. These specific reference standards are required because the iron structurally incorporated into the biogenic silica of diatoms exists in a mixed redox state. Iron (II) acetate is needed to represent the reduced organic iron fraction, which is preserved because the silica matrix protects the iron from rapid oxidation by the ambient surface seawater. Goethite is included to capture the oxidized iron fraction, which arises from either gradual oxidation over time or a naturally mixed redox composition within the sample. | Full credit for identifying iron (II) acetate (to represent reduced organic iron) and goethite (to represent the oxidized fraction) as the necessary reference spectra. |
Review
#866
particulate iron
Fe K
▶
LLM Prompt
Sample Information
Material: particulate iron
Sample Origin: Western Antarctic coastal ocean
Sample-Specific Conditions
- iron pool type: hotspot
- Micron-sized regions of high iron content associated with or isolated from biogenic silica
Measurement
We plan to measure the Fe K XANES spectrum of this sample.
Questions
Based on all the information above:
1. What candidate reference spectra are needed to model the Fe K-edge XANES spectrum of these micron-sized iron hotspots using linear combination fitting?
2. Based on the environmental conditions and sample description, estimate the phase fractions of the iron species present in these hotspots.
3. Why do these micron-sized iron hotspots consist primarily of these specific phases, and how does their oxidation state compare to iron structurally incorporated into biogenic silica?
Ground Truth
Material: particulate iron
Measurement: Fe K-edge fluorescence XANES at beamlines 2-ID-D and 2-ID-E (Advanced Photon Source)
Fit method: Linear combination fitting (LCF)
Phase fractions: (±24%)
| Phase | Fraction |
|---|---|
| haematite | 0.655 |
| goethite | 0.345 |
Fit basis (paper's reference spectra):
- haematite
- goethite
- iron (II) acetate
Source evidence: Figure 3 caption, Page 3
Key reasoning: Micron-sized iron hotspots represent a highly oxidized pool of particulate iron, distinct from the reduced iron structurally incorporated into biogenic silica. The XANES spectra of these hotspots exhibit a higher K-edge position and a higher pre-edge centroid position, indicating a more oxidized state. Consequently, they are best fit by oxidized iron (III) minerals such as hematite and goethite, reflecting either isolated particles or surface-associated oxidized iron in the marine environment.
Reasoning source: Results section ('Iron speciation', Page 2) and Figure 3/4 captions
Scoring Rubric (total: 100 pts)
| Q | Type | Max | Question | Reference Answer | Scoring Criteria |
|---|---|---|---|---|---|
| q1 | identification | 20 | What candidate reference spectra are needed to model the Fe K-edge XANES spectrum of these micron-sized iron hotspots using linear combination fitting? | The candidate reference spectra needed for linear combination fitting are haematite, goethite, and iron (II) acetate. These specific references are required because the micron-sized iron hotspots in the Western Antarctic coastal ocean represent a highly oxidized pool of particulate iron. Unlike the reduced iron structurally incorporated into biogenic silica, these hotspots consist of isolated particles or surface-associated oxidized iron. Therefore, oxidized iron (III) minerals like haematite and goethite, along with iron (II) acetate to account for potential reduced components, are necessary to accurately model the higher K-edge and pre-edge centroid positions characteristic of this oxidized state. | Full credit for identifying oxidized iron (III) minerals, specifically hematite and goethite. Partial credit for mentioning general iron (III) oxides without specific mineral names. |
| q2 | quantification | 40 | Based on the environmental conditions and sample description, estimate the phase fractions of the iron species present in these hotspots. | The estimated phase fractions for these iron hotspots are 0.655 (65.5%) haematite and 0.345 (34.5%) goethite, with an uncertainty of 24%. These specific values result from the fact that these micron-sized regions of high iron content form a highly oxidized pool of particulate iron in the marine environment. Because these hotspots are distinct from the reduced iron structurally incorporated into biogenic silica, they lack a significant reduced iron fraction. Consequently, the composition is entirely dominated by oxidized iron (III) minerals, reflecting their nature as isolated particles or surface-associated oxidized iron in the Western Antarctic coastal ocean. | Full credit for estimating ~65% hematite and ~35% goethite (within the +/- 24% uncertainty range reported). Partial credit for correctly identifying that the sample is entirely composed of oxidized Fe(III) phases with hematite as the dominant phase. |
| q3 | reasoning | 40 | Why do these micron-sized iron hotspots consist primarily of these specific phases, and how does their oxidation state compare to iron structurally incorporated into biogenic silica? | These micron-sized iron hotspots consist primarily of haematite and goethite because they represent a highly oxidized pool of particulate iron in the marine environment. Whether isolated or surface-associated with biogenic silica in the Western Antarctic coastal ocean, these particles exist in a more oxidized state compared to the reduced iron that is structurally incorporated directly into the biogenic silica. This oxidized state is evidenced by their XANES spectra, which exhibit a higher K-edge position and a higher pre-edge centroid position. As a result, the hotspots are best modeled by oxidized iron (III) minerals rather than reduced iron phases. | Full credit for explaining that the hotspots represent a highly oxidized pool of particulate iron (Fe(III) minerals like hematite/goethite), which contrasts with the more reduced, organic iron that is structurally incorporated into the biogenic silica. |
Review
Anomalous metal segregation in lithium-rich material provides design rules for stable cathode in lithium-ion battery
BNL-NSLS-II-8-ID
Electrochemistry
Ruoqian Lin et al.
DOI: 10.1038/s41467-019-09248-0
4 scenarios
▶
#867
Li2Ru0.5Mn0.5O3
Mn L3-edge
▶
LLM Prompt
Sample Information
Material: Li2Ru0.5Mn0.5O3
Electrode Type: cathode
Cell Type: coin cell
C Rate: C/10
Voltage V: 2.0 - 4.6
Sample-Specific Conditions
- cycle_number: 0
- Pristine Li2Ru0.5Mn0.5O3 cathode, measured in bulk-sensitive partial-fluorescence-yield (PFY) mode
Measurement
We plan to measure the Mn L3-edge XANES spectrum of this sample.
Questions
Based on all the information above:
1. Based on the sample conditions, what candidate Mn oxidation states are expected in the pristine Li2Ru0.5Mn0.5O3 cathode, and what are their estimated relative fractions when measured in bulk-sensitive PFY mode?
2. What specific reference spectra are required to accurately model the Mn L3-edge XANES spectrum of this pristine sample using linear combination fitting?
3. Explain the physical reasoning behind the observed phase composition for this pristine sample. Why is one specific oxidation state overwhelmingly dominant, and how does the measurement mode (PFY) influence this observation?
Ground Truth
Material: Li2Ru0.5Mn0.5O3
Measurement: Mn L3-edge soft X-ray absorption spectroscopy in partial-fluorescence-yield (PFY) mode
Fit method: Linear combination fitting (LCF)
Phase fractions:
| Phase | Fraction |
|---|---|
| Mn2+ | 0.024 |
| Mn3+ | 0.138 |
| Mn4+ | 0.838 |
Fit basis (paper's reference spectra):
- Mn2+ reference spectrum
- Mn3+ reference spectrum
- Mn4+ reference spectrum
Source evidence: Page 5, 'Bulk structure and chemistry' section text
Key reasoning: In the pristine state, the bulk of the Li2Ru0.5Mn0.5O3 cathode is predominantly composed of Mn4+, consistent with the expected stoichiometry of the uncycled material. The PFY mode has a probe depth of ~100 nm, meaning it captures this bulk information rather than the more reduced surface. The minor fractions of Mn3+ and Mn2+ represent the baseline state of the material before any electrochemical cycling induces further oxygen loss or transition metal reduction.
Reasoning source: Page 5, 'Bulk structure and chemistry' section
Scoring Rubric (total: 100 pts)
| Q | Type | Max | Question | Reference Answer | Scoring Criteria |
|---|---|---|---|---|---|
| q1 | quantification | 40 | Based on the sample conditions, what candidate Mn oxidation states are expected in the pristine Li2Ru0.5Mn0.5O3 cathode, and what are their estimated relative fractions when measured in bulk-sensitive PFY mode? | The expected Mn oxidation states in the pristine Li2Ru0.5Mn0.5O3 cathode are Mn4+, Mn3+, and Mn2+. Their estimated relative fractions are 83.8% Mn4+, 13.8% Mn3+, and 2.4% Mn2+. These specific values result from the uncycled (cycle 0) state of the material, where the expected stoichiometry dictates a predominantly Mn4+ composition. Because the measurement is performed in bulk-sensitive partial-fluorescence-yield (PFY) mode with a probe depth of ~100 nm, it captures the bulk information rather than a more reduced surface layer. The minor fractions of Mn3+ and Mn2+ simply represent the baseline state of the material before any electrochemical cycling induces further oxygen loss or transition metal reduction. | Full credit for identifying Mn2+, Mn3+, and Mn4+ and providing fractions close to ~2% Mn2+, ~14% Mn3+, and ~84% Mn4+. |
| q2 | identification | 20 | What specific reference spectra are required to accurately model the Mn L3-edge XANES spectrum of this pristine sample using linear combination fitting? | To accurately model the Mn L3-edge XANES spectrum of this pristine sample using linear combination fitting, reference spectra for Mn2+, Mn3+, and Mn4+ are required. These specific reference phases are expected because the pristine (cycle 0) Li2Ru0.5Mn0.5O3 cathode is predominantly composed of Mn4+ in its bulk, consistent with the uncycled material's expected stoichiometry. The inclusion of Mn3+ and Mn2+ references is necessary to account for the minor baseline fractions of these reduced states present before any electrochemical cycling occurs. Furthermore, the use of bulk-sensitive PFY mode (probe depth ~100 nm) ensures that these references model the true bulk composition rather than a highly reduced surface layer. | Full credit for explicitly listing Mn2+, Mn3+, and Mn4+ reference spectra as the necessary basis functions. |
| q3 | reasoning | 40 | Explain the physical reasoning behind the observed phase composition for this pristine sample. Why is one specific oxidation state overwhelmingly dominant, and how does the measurement mode (PFY) influence this observation? | The observed phase composition is overwhelmingly dominated by Mn4+ (83.8%), with minor contributions from Mn3+ (13.8%) and Mn2+ (2.4%). This dominance of Mn4+ arises because the Li2Ru0.5Mn0.5O3 cathode is in its pristine, uncycled state (cycle 0), where the expected stoichiometry dictates a highly oxidized bulk composition. The measurement mode, partial-fluorescence-yield (PFY), strongly influences this observation because it has a probe depth of ~100 nm. This bulk sensitivity allows the measurement to capture the true, predominantly Mn4+ interior of the material rather than the more reduced surface. Consequently, the small amounts of Mn3+ and Mn2+ merely reflect the baseline state prior to any electrochemical cycling that would otherwise induce oxygen loss or transition metal reduction. | Full credit for explaining that Mn4+ is the expected stoichiometric state for the pristine, uncycled bulk material, and noting that the PFY mode (~100 nm probe depth) specifically captures this intact bulk environment rather than the more degraded/reduced surface. |
Review
#868
Li2Ru0.5Mn0.5O3
Mn L3-edge
▶
LLM Prompt
Sample Information
Material: Li2Ru0.5Mn0.5O3
Electrode Type: cathode
Cell Type: coin cell
Charge Discharge: cycled
C Rate: C/10
Voltage V: 2.0 - 4.6
Cycle Number: 15
Sample-Specific Conditions
- cycle_number: 15
- Li2Ru0.5Mn0.5O3 cathode after 15 charge/discharge cycles, measured in bulk-sensitive partial-fluorescence-yield (PFY) mode
Measurement
We plan to measure the Mn L3-edge XANES spectrum of this sample.
Questions
Based on all the information above:
1. What candidate reference spectra are needed to perform a linear combination fit for the Mn L3-edge of this cycled LRMO cathode to capture its degradation?
2. Estimate the phase fractions of the different Mn oxidation states in the bulk (probed via PFY mode) of the LRMO cathode after 15 charge/discharge cycles.
3. Explain the physical reasoning for the observed changes in the Mn oxidation states in the bulk of the LRMO cathode after 15 cycles. What specific degradation mechanism drives this change?
Ground Truth
Material: Li2Ru0.5Mn0.5O3
Measurement: Mn L3-edge soft X-ray absorption spectroscopy in partial-fluorescence-yield (PFY) mode
Fit method: Linear combination fitting (LCF)
Phase fractions:
| Phase | Fraction |
|---|---|
| Mn2+ | 0.039 |
| Mn3+ | 0.402 |
| Mn4+ | 0.559 |
Fit basis (paper's reference spectra):
- Mn2+ reference spectrum
- Mn3+ reference spectrum
- Mn4+ reference spectrum
Source evidence: Page 5, text: 'By fitting the PFY Mn L3 edge with a linear combination of Mn2+,3+,4+ reference spectra, Mn’s bonding environments are decomposed as... Mn2+:Mn3+:Mn4+ = 0.039:0.402:0.559 after 15 cycles.'
Key reasoning: The considerable reduction of Mn from its pristine state (mostly Mn4+) to a mixture containing significant Mn3+ and some Mn2+ suggests that oxygen loss likely occurred during cycling. Because the PFY mode has a probe depth of ~100 nm, this indicates that irreversible crystal and microstructural degradation, including oxygen loss and transition metal reduction, occurred not just at the surface but also extended into the bulk of the LRMO materials during extended high-voltage cycling.
Reasoning source: Page 5, Results section ('Bulk structure and chemistry')
Scoring Rubric (total: 100 pts)
| Q | Type | Max | Question | Reference Answer | Scoring Criteria |
|---|---|---|---|---|---|
| q1 | identification | 20 | What candidate reference spectra are needed to perform a linear combination fit for the Mn L3-edge of this cycled LRMO cathode to capture its degradation? | The linear combination fit requires Mn2+, Mn3+, and Mn4+ reference spectra. These specific reference spectra are needed because the Li2Ru0.5Mn0.5O3 cathode undergoes significant degradation after 15 charge/discharge cycles at a high voltage of 2.0 - 4.6 V. During this extended cycling, irreversible oxygen loss occurs, which drives the reduction of the transition metal from its pristine Mn4+ state. Consequently, the bulk material (probed via PFY mode) transforms into a mixture containing reduced Mn3+ and Mn2+ species alongside the remaining Mn4+. | Full points for identifying Mn2+, Mn3+, and Mn4+ reference spectra as the necessary basis components. |
| q2 | quantification | 40 | Estimate the phase fractions of the different Mn oxidation states in the bulk (probed via PFY mode) of the LRMO cathode after 15 charge/discharge cycles. | The estimated phase fractions for the bulk of the cathode are 0.039 for Mn2+, 0.402 for Mn3+, and 0.559 for Mn4+. These specific values result from the material undergoing 15 charge/discharge cycles between 2.0 and 4.6 V at a C/10 rate. The extended high-voltage cycling induces irreversible oxygen loss, causing a considerable reduction of the pristine Mn4+ state. Because the PFY mode probes a depth of ~100 nm, these fractions demonstrate that this structural degradation and transition metal reduction are not limited to the surface but extend significantly into the bulk of the Li2Ru0.5Mn0.5O3 material. | Full points for estimating fractions close to Mn2+: ~4%, Mn3+: ~40%, Mn4+: ~56%. Partial credit if the trend (Mn4+ > Mn3+ >> Mn2+) is correctly identified. |
| q3 | reasoning | 40 | Explain the physical reasoning for the observed changes in the Mn oxidation states in the bulk of the LRMO cathode after 15 cycles. What specific degradation mechanism drives this change? | The observed changes in the Mn oxidation states are driven by irreversible oxygen loss during the 15 charge/discharge cycles. In its pristine state, the Li2Ru0.5Mn0.5O3 cathode consists mostly of Mn4+. However, extended cycling at high voltages (2.0 - 4.6 V) triggers oxygen release from the lattice, which forces the reduction of the transition metal to compensate for the charge, generating significant amounts of Mn3+ and some Mn2+. Because these changes are detected using the bulk-sensitive PFY mode (~100 nm probe depth), it proves that this oxygen loss and the resulting microstructural degradation extend deep into the bulk of the material rather than being confined to the surface. | Full points for explaining that the reduction of Mn (increase in Mn3+ and Mn2+) is driven by oxygen loss during high-voltage cycling, indicating irreversible structural degradation extending into the bulk. |
Review
#869
Li2Ru0.5Mn0.5O3
Mn L3-edge
▶
LLM Prompt
Sample Information
Material: Li2Ru0.5Mn0.5O3
Electrode Type: cathode
Cell Type: coin cell
Charge Discharge: cycled
C Rate: C/10
Voltage V: 2.0 - 4.6
Cycle Number: 10
Sample-Specific Conditions
- cycle_number: 10
- Li2Ru0.5Mn0.5O3 cathode after 10 charge/discharge cycles, measured in surface-sensitive total-electron-yield (TEY) mode
Measurement
We plan to measure the Mn L3-edge XANES spectrum of this sample.
Questions
Based on all the information above:
1. Based on the sample conditions (Li2Ru0.5Mn0.5O3 cathode after 10 cycles, measured in surface-sensitive TEY mode), what are the expected oxidation states of Mn and their approximate fractions?
2. Why does the surface of the Li2Ru0.5Mn0.5O3 cathode show a prominent reduction in Mn valence after 10 cycles, and what degradation mechanism does this indicate?
3. If you were to perform a linear combination fit on the Mn L3-edge TEY spectrum of this cycled sample, what reference spectra would be necessary to accurately model the data?
Ground Truth
Material: Li2Ru0.5Mn0.5O3
Measurement: Soft X-ray absorption spectroscopy, Mn L3-edge, total-electron-yield (TEY) mode
Fit method: Linear combination fitting
Phase fractions:
| Phase | Fraction |
|---|---|
| Mn2+ | 0.22 |
| Mn3+ | 0.441 |
| Mn4+ | 0.339 |
Fit basis (paper's reference spectra):
- Mn2+ reference
- Mn3+ reference
- Mn4+ reference
Source evidence: Page 5, left column, text paragraph 1
Key reasoning: The TEY mode has a probe depth of ~10 nm, making it highly sensitive to the surface of the cathode. After 10 charge/discharge cycles, the Mn L3-edge TEY spectra show a prominent valence reduction to a mixture of Mn2+, Mn3+, and Mn4+. This considerable reduction of Mn at the surface indicates that significant oxygen loss and surface degradation occurred during cycling, which is typically more severe at the surface than in the bulk.
Reasoning source: Page 5, left column, text paragraph 1
Scoring Rubric (total: 100 pts)
| Q | Type | Max | Question | Reference Answer | Scoring Criteria |
|---|---|---|---|---|---|
| q1 | quantification | 35 | Based on the sample conditions (Li2Ru0.5Mn0.5O3 cathode after 10 cycles, measured in surface-sensitive TEY mode), what are the expected oxidation states of Mn and their approximate fractions? | The expected oxidation states of Mn for the Li2Ru0.5Mn0.5O3 cathode after 10 cycles are Mn2+, Mn3+, and Mn4+. The approximate fractions are 22% Mn2+, 44.1% Mn3+, and 33.9% Mn4+. These specific values result from the surface-sensitive nature of the total-electron-yield (TEY) measurement, which probes a depth of only ~10 nm. After 10 charge/discharge cycles between 2.0 and 4.6 V, the cathode experiences significant oxygen loss and surface degradation, which drives a prominent valence reduction of Mn at the surface and leads to this observed mixture of reduced states. | Full points for identifying the presence of Mn2+, Mn3+, and Mn4+ and providing fractions close to 22% Mn2+, 44% Mn3+, and 34% Mn4+. |
| q2 | reasoning | 40 | Why does the surface of the Li2Ru0.5Mn0.5O3 cathode show a prominent reduction in Mn valence after 10 cycles, and what degradation mechanism does this indicate? | The prominent reduction in Mn valence at the surface of the Li2Ru0.5Mn0.5O3 cathode after 10 cycles is driven by severe surface degradation during the charge/discharge process. Specifically, cycling the cell between 2.0 and 4.6 V induces significant oxygen loss from the cathode material. Because the total-electron-yield (TEY) mode has a probe depth of only ~10 nm, it captures these surface-specific changes, which are typically much more severe than in the bulk. This oxygen loss mechanism forces the Mn ions to reduce to compensate for the lost oxygen, resulting in a mixed valence state of 22% Mn2+, 44.1% Mn3+, and 33.9% Mn4+ at the electrode surface. | Full points for explaining that the surface (probed by TEY) undergoes severe degradation due to oxygen loss during cycling, leading to the considerable reduction of Mn to lower valence states (Mn2+ and Mn3+). |
| q3 | identification | 25 | If you were to perform a linear combination fit on the Mn L3-edge TEY spectrum of this cycled sample, what reference spectra would be necessary to accurately model the data? | To accurately model the Mn L3-edge TEY spectrum of this cycled Li2Ru0.5Mn0.5O3 sample using linear combination fitting, you would need reference spectra for Mn2+, Mn3+, and Mn4+. These specific references are required because the surface-sensitive TEY measurement, which has a probe depth of ~10 nm, captures a prominent valence reduction at the cathode surface after 10 charge/discharge cycles. This reduction is caused by significant oxygen loss and surface degradation during cycling between 2.0 and 4.6 V, a degradation mechanism that is much more severe at the surface than in the bulk. Consequently, the surface Mn transforms into a mixed state comprising 22% Mn2+, 44.1% Mn3+, and 33.9% Mn4+, necessitating all three reference spectra to accurately fit the data. | Full points for listing Mn2+, Mn3+, and Mn4+ reference spectra. |
Review
#870
Li2Ru0.5Mn0.5O3
Mn L3-edge
▶
LLM Prompt
Sample Information
Material: Li2Ru0.5Mn0.5O3
Electrode Type: cathode
Cell Type: coin cell
Charge Discharge: cycled
C Rate: C/10
Voltage V: 2.0 - 4.6
Cycle Number: 17
Sample-Specific Conditions
- cycle_number: 17
- Li2Ru0.5Mn0.5O3 cathode after 17 charge/discharge cycles, measured in surface-sensitive total-electron-yield (TEY) mode
Measurement
We plan to measure the Mn L3-edge XANES spectrum of this sample.
Questions
Based on all the information above:
1. To properly model the Mn L3-edge XANES spectrum of the Li2Ru0.5Mn0.5O3 cathode surface after 17 cycles using linear combination fitting, what specific reference spectra (basis functions) should be included?
2. Estimate the relative phase fractions of the different Mn oxidation states present in the surface-sensitive TEY measurement of this cathode after 17 cycles.
3. Explain the physical and chemical reasons for the observed distribution of Mn oxidation states on the surface of the Li2Ru0.5Mn0.5O3 cathode after 17 cycles. Why is the surface state significantly different from the pristine material?
Ground Truth
Material: Li2Ru0.5Mn0.5O3
Measurement: Mn L3-edge soft X-ray absorption spectroscopy in total-electron-yield (TEY) mode
Fit method: Linear combination fitting
Phase fractions:
| Phase | Fraction |
|---|---|
| Mn2+ | 0.32 |
| Mn3+ | 0.517 |
| Mn4+ | 0.163 |
Fit basis (paper's reference spectra):
- Mn2+ reference spectrum
- Mn3+ reference spectrum
- Mn4+ reference spectrum
Source evidence: Page 5, main text (Bulk structure and chemistry section)
Key reasoning: The TEY mode has a shallow probe depth of ~10 nm, making it highly sensitive to the cathode surface. After 17 charge/discharge cycles, the surface Mn is significantly reduced from its pristine 4+ state to predominantly Mn3+ and Mn2+. This prominent valence reduction reflects severe surface degradation, specifically oxygen loss and the formation of a rock-salt or lithium-containing disordered rock-salt reconstruction layer on the surface.
Reasoning source: Page 5, main text (Bulk structure and chemistry section) and Page 9 (Theoretical understanding and prediction)
Scoring Rubric (total: 100 pts)
| Q | Type | Max | Question | Reference Answer | Scoring Criteria |
|---|---|---|---|---|---|
| q1 | identification | 20 | To properly model the Mn L3-edge XANES spectrum of the Li2Ru0.5Mn0.5O3 cathode surface after 17 cycles using linear combination fitting, what specific reference spectra (basis functions) should be included? | To properly model the Mn L3-edge XANES spectrum, the linear combination fitting basis must include Mn2+, Mn3+, and Mn4+ reference spectra. These specific references are required because the measurement is performed in total-electron-yield (TEY) mode, which has a shallow probe depth of ~10 nm and is highly sensitive to the cathode surface. After 17 charge/discharge cycles between 2.0 and 4.6 V at C/10, the surface undergoes severe degradation characterized by oxygen loss and the formation of a rock-salt or lithium-containing disordered rock-salt reconstruction layer. Consequently, the pristine Mn4+ state is significantly reduced to predominantly Mn3+ and Mn2+ states on the surface, necessitating all three reference spectra to accurately capture the degraded surface composition. | Full credit for identifying that Mn2+, Mn3+, and Mn4+ reference spectra are all required. |
| q2 | quantification | 40 | Estimate the relative phase fractions of the different Mn oxidation states present in the surface-sensitive TEY measurement of this cathode after 17 cycles. | The relative phase fractions for the Mn oxidation states in the surface-sensitive TEY measurement are 32% Mn2+, 51.7% Mn3+, and 16.3% Mn4+. These specific values result from the severe surface degradation that occurs after 17 charge/discharge cycles between 2.0 and 4.6 V. Because the TEY mode probes only the top ~10 nm of the cathode, it captures the highly degraded surface layer where oxygen loss and structural reconstruction into a rock-salt or disordered rock-salt phase have occurred. This degradation mechanism drives the prominent valence reduction from the pristine Mn4+ state, leaving only a small fraction (16.3%) of Mn4+ while converting the majority of the surface to the reduced Mn3+ and Mn2+ states. | Full credit for estimating fractions close to Mn2+ ~32%, Mn3+ ~52%, and Mn4+ ~16%. Partial credit if the correct trend (Mn3+ > Mn2+ > Mn4+) is identified. |
| q3 | reasoning | 40 | Explain the physical and chemical reasons for the observed distribution of Mn oxidation states on the surface of the Li2Ru0.5Mn0.5O3 cathode after 17 cycles. Why is the surface state significantly different from the pristine material? | The observed distribution of Mn oxidation states (predominantly Mn3+ and Mn2+ with minor Mn4+) is caused by severe surface degradation of the Li2Ru0.5Mn0.5O3 cathode after 17 charge/discharge cycles. The surface state differs significantly from the pristine Mn4+ material due to oxygen loss during cycling between 2.0 and 4.6 V. This oxygen loss triggers a structural transformation, forming a rock-salt or lithium-containing disordered rock-salt reconstruction layer on the cathode surface. Because the total-electron-yield (TEY) measurement has a shallow probe depth of ~10 nm, it is highly sensitive to this degraded surface layer, directly capturing the prominent valence reduction of manganese that accompanies the structural reconstruction. | Full credit for explaining that the prominent reduction to Mn3+ and Mn2+ is caused by oxygen loss at the surface during cycling, which leads to the formation of a degraded rock-salt reconstruction layer. |
Review
Enhanced multi-carbon alcohol electroproduction from CO via modulated hydrogen adsorption
APS
Catalyst
Jun Li et al.
DOI: 10.1038/s41467-020-17499-5
2 scenarios
▶
#871
CuPd0.007
Cu K-edge
▶
LLM Prompt
Sample Information
Material: CuPd0.007
Reaction Conditions: operando COR at -0.62 V vs. RHE in 1 M KOH
Sample-Specific Conditions
- Pd loading: 0.007
- Pd-doped Cu catalyst with Pd:Cu ratio of 0.007
Measurement
We plan to measure the Cu K-edge XANES spectrum of this sample.
Questions
Based on all the information above:
1. Based on the provided reaction conditions (operando COR at -0.62 V vs. RHE in 1 M KOH), what is the expected oxidation state and dominant phase of copper in the CuPd0.007 catalyst?
2. Describe the expected spectral shape of the Cu K-edge XANES for the CuPd0.007 catalyst under these operando conditions. What standard reference spectrum would it most closely resemble?
3. Explain physically why the Cu K-edge XANES spectrum of the Pd-doped catalyst (CuPd0.007) does not show significant deviations from pure metallic copper, despite the presence of the Pd dopant.
Ground Truth
Material: CuPd0.007
Measurement: Cu K-edge operando XANES at 9BM beamline of APS
Fit method: qualitative comparison
Phase fractions: (±10%)
| Phase | Fraction |
|---|---|
| metallic_copper | 1.0 |
Fit basis (paper's reference spectra):
- Cu foil
Source evidence: Page 3, Figure 3a; Page 7, Methods
Key reasoning: Operando XAS analysis showed that Cu species remained in the metallic state during COR. The Cu K-edge XANES spectra of the CuPd catalysts are identical to that of Cu foil, indicating that the bulk Cu structure is unaltered by the surface loading of Pd.
Reasoning source: Page 3, Results and discussion, Materials characterization
Scoring Rubric (total: 100 pts)
| Q | Type | Max | Question | Reference Answer | Scoring Criteria |
|---|---|---|---|---|---|
| q1 | identification | 30 | Based on the provided reaction conditions (operando COR at -0.62 V vs. RHE in 1 M KOH), what is the expected oxidation state and dominant phase of copper in the CuPd0.007 catalyst? | The expected oxidation state of copper in the CuPd0.007 catalyst is 0, and the dominant phase is metallic copper with a fraction of 1.0. This pure metallic phase is expected because, under the operando CO reduction (COR) conditions at -0.62 V vs. RHE in 1 M KOH, the copper species are fully maintained in the metallic state without undergoing oxidation. Furthermore, the very low Pd loading (Pd:Cu ratio of 0.007) is applied as a surface loading rather than a bulk modification. Consequently, the bulk Cu structure remains completely unaltered by the Pd dopant, resulting in a purely metallic copper phase during the reaction. | Full points for identifying metallic copper (Cu^0) as the sole/dominant phase (100%). |
| q2 | spectral | 30 | Describe the expected spectral shape of the Cu K-edge XANES for the CuPd0.007 catalyst under these operando conditions. What standard reference spectrum would it most closely resemble? | The Cu K-edge XANES spectrum of the CuPd0.007 catalyst will exhibit an absorption threshold (E0) at 8979 eV and perfectly overlap with the standard reference spectrum of bulk Cu foil. The spectrum will show characteristic features of metallic copper with no signs of oxidation or bulk structural changes. These spectral features arise because the operando COR conditions (-0.62 V vs. RHE in 1 M KOH) keep the copper entirely in a metallic state (oxidation state 0). Additionally, the low Pd loading (0.007 ratio) is restricted to the surface, meaning the bulk electronic and structural properties of the copper remain unaltered, producing a spectrum identical to pure Cu foil. | Full points for stating the spectrum is identical to or perfectly overlaps with bulk Cu foil, exhibiting characteristic metallic copper features. |
| q3 | reasoning | 40 | Explain physically why the Cu K-edge XANES spectrum of the Pd-doped catalyst (CuPd0.007) does not show significant deviations from pure metallic copper, despite the presence of the Pd dopant. | The Cu K-edge XANES spectrum of the CuPd0.007 catalyst does not deviate from pure metallic copper because the bulk Cu structure is completely unaltered by the Pd doping. Based on the sample conditions, the Pd loading is extremely low (Pd:Cu ratio of 0.007) and functions as a surface loading rather than a bulk substitution. During operando COR at -0.62 V vs. RHE in 1 M KOH, the copper species remain entirely in the metallic state (oxidation state 0). Because Cu K-edge XANES probes the bulk structure of the material, and the bulk remains unaffected by the minor surface Pd addition, the resulting spectrum is identical to that of pure Cu foil. | Full points for explaining that Pd is loaded on the surface (surface doping) and the bulk Cu structure remains unaltered, meaning that bulk-sensitive XANES at the Cu K-edge detects minimal change. |
Review
#872
CuPd0.007
Pd K-edge
▶
LLM Prompt
Sample Information
Material: CuPd0.007
Reaction Conditions: after COR at -0.62 V vs. RHE in 1 M KOH
Sample-Specific Conditions
- Pd loading: 0.007
- Pd-doped Cu catalyst with Pd:Cu ratio of 0.007
Measurement
We plan to measure the Pd K-edge XANES spectrum of this sample.
Questions
Based on all the information above:
1. Based on the sample conditions, what is the expected oxidation state and chemical nature of the Pd dopants in the CuPd0.007 catalyst after the CO reduction reaction?
2. Describe the expected spectral shape of the Pd K-edge XANES for this sample and how its edge position compares to a bulk Pd foil reference.
3. What is the physical reasoning for the observed positive shift in the XANES onset of the CuPd0.007 catalyst compared to bulk Pd foil?
Ground Truth
Material: CuPd0.007
Measurement: Pd K-edge, ex-situ, 20BM beamline of APS
Fit method: qualitative comparison
Phase fractions: (±10%)
| Phase | Fraction |
|---|---|
| metallic_palladium | 1.0 |
Fit basis (paper's reference spectra):
- Pd foil
Source evidence: Page 3, Results and discussion, Materials characterization; Figure 3a
Key reasoning: The XANES spectra of the CuPd catalysts resembled that of Pd foil, suggesting the metallic character of Pd dopants in the Cu structure. A positive shift in the onset indicates depleted electron density due to charge transfer to neighboring Cu atoms.
Reasoning source: Page 3, Results and discussion, Materials characterization
Scoring Rubric (total: 100 pts)
| Q | Type | Max | Question | Reference Answer | Scoring Criteria |
|---|---|---|---|---|---|
| q1 | identification | 30 | Based on the sample conditions, what is the expected oxidation state and chemical nature of the Pd dopants in the CuPd0.007 catalyst after the CO reduction reaction? | The expected oxidation state of the Pd dopants is 0 (metallic), corresponding to a 1.0 fraction of metallic palladium. In the CuPd0.007 catalyst after the CO reduction reaction at -0.62 V vs. RHE in 1 M KOH, the Pd exists as metallic dopants integrated within the Cu structure. This metallic character is maintained under these specific electrochemical reducing conditions, as evidenced by the spectrum resembling a Pd foil reference. The low Pd loading (Pd:Cu ratio of 0.007) ensures the Pd atoms are doped into the Cu matrix, where they undergo charge transfer to neighboring Cu atoms rather than forming oxidized Pd species. | Award 15 points for identifying the oxidation state as 0 (metallic) and 15 points for describing it as metallic Pd dopants within the Cu structure. |
| q2 | spectral | 35 | Describe the expected spectral shape of the Pd K-edge XANES for this sample and how its edge position compares to a bulk Pd foil reference. | The expected spectral shape of the Pd K-edge XANES for this sample closely resembles that of bulk Pd foil, indicating an overall metallic character. However, its edge position exhibits a positive shift in the onset compared to the bulk Pd foil reference. These spectral features arise directly from the sample's composition as a dilute Pd-doped Cu catalyst (Pd:Cu ratio of 0.007) evaluated after CO reduction at -0.62 V vs. RHE. While the reducing conditions maintain the metallic state, the positive shift in the onset is produced by a depleted electron density on the Pd atoms. This depletion occurs due to charge transfer from the Pd dopants to the neighboring Cu atoms within the host lattice. | Award 15 points for stating the overall spectral shape resembles Pd foil. Award 20 points for noting a positive shift in the onset/edge position compared to bulk Pd foil. |
| q3 | reasoning | 35 | What is the physical reasoning for the observed positive shift in the XANES onset of the CuPd0.007 catalyst compared to bulk Pd foil? | The physical reasoning for the observed positive shift in the XANES onset is the depleted electron density on the Pd atoms. In the CuPd0.007 catalyst, the very low Pd loading (Pd:Cu ratio of 0.007) dictates that Pd exists as dilute metallic dopants integrated within the Cu host structure after the CO reduction reaction at -0.62 V vs. RHE. Because the Pd atoms are surrounded by Cu atoms in this specific bimetallic configuration, charge transfer occurs from the Pd dopants to the neighboring Cu atoms. This loss of electron density from Pd to Cu alters the local electronic structure, directly causing the positive shift in the XANES onset compared to pure bulk Pd foil. | Award 35 points for explaining that the shift is due to depleted electron density on the Pd atoms caused by charge transfer to the neighboring Cu atoms. |
Review
High-performance light-driven heterogeneous CO2 catalysis with near-unity selectivity on metal phosphides
APS
Catalyst
Yang-Fan Xu et al.
DOI: 10.1038/s41467-020-18943-2
1 scenario
▶
#873
Ni12P5
Ni K-edge
▶
LLM Prompt
Sample Information
Material: Ni12P5
Reaction Conditions: Ambient
Sample-Specific Conditions
- State: As-synthesized
- Pristine nickel phosphide nanoparticles
Measurement
We plan to measure the Ni K-edge XANES spectrum of this sample.
Questions
Based on all the information above:
1. What is the expected oxidation state of Ni in as-synthesized Ni12P5, and what standard reference spectra would be most appropriate to qualitatively establish this via XANES?
2. Describe the expected spectral shape of the Ni K-edge XANES for Ni12P5, specifically comparing its white line feature to that of a strongly ionic reference like NiO.
3. Based on the expected XANES spectral features (specifically the white line), what conclusions can be drawn regarding the chemical character and bonding environment of the Ni atoms in Ni12P5?
Ground Truth
Material: Ni12P5
Measurement: Ni K-edge XANES, ex-situ, Sector 9-BM of the Advanced Photon Source
Fit method: Qualitative comparison
Phase fractions:
| Phase | Fraction |
|---|---|
| Ni12P5 | 1.0 |
Fit basis (paper's reference spectra):
- Ni Foil
- NiO
Source evidence: Figure 2a, Page 2
Key reasoning: The position and low intensity of the white line reveal the largely metallic character of Ni12P5, especially relative to the shifted and very intense peak observed for the strongly ionic NiO reference. This provides strong evidence supporting the low oxidation state of Ni atoms in Ni12P5.
Reasoning source: Page 2, X-ray absorption spectroscopy measurements section
Scoring Rubric (total: 100 pts)
| Q | Type | Max | Question | Reference Answer | Scoring Criteria |
|---|---|---|---|---|---|
| q1 | identification | 30 | What is the expected oxidation state of Ni in as-synthesized Ni12P5, and what standard reference spectra would be most appropriate to qualitatively establish this via XANES? | The expected oxidation state of Ni in as-synthesized Ni12P5 is a low oxidation state, near zero-valent. To qualitatively establish this via XANES, the most appropriate standard reference spectra are Ni Foil and NiO. Because the sample consists of pristine nickel phosphide nanoparticles prepared under ambient conditions, the Ni atoms are expected to exhibit a largely metallic character rather than a strongly ionic one. Comparing the sample's spectrum to a zero-valent metallic reference (Ni Foil) and a strongly ionic oxidized reference (NiO) allows researchers to confirm this near zero-valent state by evaluating the position and intensity of the white line. | Full credit for identifying a low oxidation state (or near zero-valent) and suggesting metallic Ni (Ni foil) and a fully oxidized standard like NiO as references. |
| q2 | spectral | 40 | Describe the expected spectral shape of the Ni K-edge XANES for Ni12P5, specifically comparing its white line feature to that of a strongly ionic reference like NiO. | The expected Ni K-edge XANES spectrum for Ni12P5 features a white line with low intensity and an edge position indicative of a largely metallic character. This is distinctly different from a strongly ionic reference like NiO, which exhibits a shifted and very intense white line peak. These spectral features arise because the pristine, as-synthesized nickel phosphide nanoparticles possess a near zero-valent, low oxidation state under ambient conditions. The lack of strong ionic bonding in the Ni12P5 nanoparticles prevents the formation of the intense white line seen in fully oxidized materials, resulting instead in the low-intensity feature characteristic of metallic Ni. | Full credit for stating that Ni12P5 will exhibit a white line with low intensity and an edge position shifted to lower energy relative to NiO, reflecting its metallic character rather than the intense, shifted peak of ionic NiO. |
| q3 | reasoning | 30 | Based on the expected XANES spectral features (specifically the white line), what conclusions can be drawn regarding the chemical character and bonding environment of the Ni atoms in Ni12P5? | Based on the low intensity and position of the white line in the XANES spectrum, it can be concluded that the Ni atoms in Ni12P5 have a largely metallic chemical character and a low, near zero-valent oxidation state. This conclusion is drawn because the pristine, as-synthesized nickel phosphide nanoparticles lack the strongly ionic bonding environment found in fully oxidized species. Under ambient conditions, the specific composition of Ni12P5 results in an electronic structure that does not produce the shifted and very intense peak observed for strongly ionic references like NiO. Therefore, the observed low-intensity white line provides strong evidence supporting the metallic character and low oxidation state of the Ni atoms in this material. | Full credit for explaining that the position and low intensity of the white line reveal a largely metallic character, providing strong evidence for the low oxidation state of the Ni atoms in the phosphide lattice. |
Review
The impact of nitrogen oxides on electrochemical carbon dioxide reduction
BNL-NSLS-II-8-ID
Catalyst
Byung Hee Ko et al.
DOI: 10.1038/s41467-020-19731-8
1 scenario
▶
#874
Cu
Cu K-edge
▶
LLM Prompt
Sample Information
Material: Cu
Support: GDL (carbon paper)
Reaction Conditions: 1 M KHCO3, CO2 flow (10 mL min-1), 5 mA cm-2 applied for 10 min
Sample-Specific Conditions
- Applied current density: 5 mA cm-2
- Cu nanoparticle catalyst on GDL, previously exposed to NO, then measured under CO2 reduction conditions
Measurement
We plan to measure the Cu K-edge XANES spectrum of this sample.
Questions
Based on all the information above:
1. Based on the provided reaction conditions (5 mA cm-2 applied for 10 min under CO2RR), what is the expected dominant phase of the Cu catalyst, and what is the physical reasoning for this state?
2. What reference spectra should be included in the basis set to analyze the oxidation state of this Cu catalyst, considering its pre-exposure to NO and subsequent reduction?
3. How would the XANES spectral shape of this sample (measured at 5 mA cm-2) compare to the sample measured at open circuit (0 mA cm-2) after NO exposure?
Ground Truth
Material: Cu
Measurement: Cu K-edge operando XAS at 8-ID Beamline of NSLS-II
Fit method: Qualitative comparison to standards
Phase fractions: (±10%)
| Phase | Fraction |
|---|---|
| metallic_copper | 1.0 |
Fit basis (paper's reference spectra):
- Cu foil
- Cu2O
- CuO
Source evidence: Page 6, Figure 5c, 5d, and text in 'Characterization of catalyst structures in the presence of NOx'
Key reasoning: After a constant current density of 5 mA cm-2 was applied under CO2RR condition, the Cu catalyst was quickly reduced to metallic Cu, suggesting that a small amount of current is sufficient to fully reduce the Cu catalyst under CO2RR conditions.
Reasoning source: Page 6, right column
Scoring Rubric (total: 100 pts)
| Q | Type | Max | Question | Reference Answer | Scoring Criteria |
|---|---|---|---|---|---|
| q1 | reasoning | 40 | Based on the provided reaction conditions (5 mA cm-2 applied for 10 min under CO2RR), what is the expected dominant phase of the Cu catalyst, and what is the physical reasoning for this state? | The expected dominant phase of the Cu catalyst is 100% metallic copper (Cu0). This phase arises because a constant current density of 5 mA cm-2 is applied for 10 minutes in 1 M KHCO3 under CO2 flow. This small amount of cathodic current provides sufficient reducing power to quickly and fully reduce the catalyst under CO2 reduction (CO2RR) conditions. Consequently, any oxidized species formed during the prior NO exposure are completely converted back to metallic Cu. | Full points for identifying metallic Cu (oxidation state 0) as the dominant phase and explaining that the applied cathodic current (5 mA cm-2) is sufficient to fully reduce the catalyst under CO2RR conditions. |
| q2 | identification | 30 | What reference spectra should be included in the basis set to analyze the oxidation state of this Cu catalyst, considering its pre-exposure to NO and subsequent reduction? | The basis set for analyzing this Cu catalyst should include Cu foil, Cu2O, and CuO reference spectra. These references are selected because the Cu nanoparticles were previously exposed to NO, meaning Cu2O and CuO are needed to account for potential oxidized states. However, the sample conditions involve applying 5 mA cm-2 of current under CO2 reduction conditions, which quickly reduces the catalyst. The Cu foil standard is therefore required to confirm the outcome of this process, demonstrating that this small applied current is sufficient to fully reduce the catalyst to a 1.0 fraction of metallic Cu. | Full points for listing Cu foil (metallic Cu), Cu2O (Cu+), and CuO (Cu2+) as the necessary reference standards. |
| q3 | spectral | 30 | How would the XANES spectral shape of this sample (measured at 5 mA cm-2) compare to the sample measured at open circuit (0 mA cm-2) after NO exposure? | The XANES spectrum of the sample measured at 5 mA cm-2 will match the spectral shape of a metallic Cu foil standard, distinct from the open circuit (0 mA cm-2) sample which shows a mixture of Cu and Cu2O. This spectral difference occurs because the open-circuit sample retains the oxidized species formed during the prior NO exposure. Once the 5 mA cm-2 current is applied for 10 minutes under CO2RR conditions, the catalyst is subjected to a reducing environment. This small amount of current is sufficient to fully reduce the catalyst to an oxidation state of 0, resulting in a spectrum that reflects the purely metallic structural and electronic properties of Cu. | Full points for stating that the sample at 5 mA cm-2 will match the metallic Cu standard, whereas the open circuit sample would show features of partial oxidation (mixture of Cu and Cu2O). |
Review
Mechanistic insight into copper cation exchange in cadmium selenide semiconductor nanocrystals using X-ray absorption spectroscopy
APS
Synthesis
Alex Khammang, Joshua T. Wright, Robert W. Meulenberg
DOI: 10.1038/s41467-020-20712-0
6 scenarios
▶
#875
CdSe nanocrystals
Se K
▶
LLM Prompt
Sample Information
Material: CdSe nanocrystals
Method: hot-injection
Precursors: CdCO3, Se powder, TOPO, stearic acid, TOP, ODE
Temperature C: 360
Duration Hours: 0.08
Atmosphere: N2
Cooling Method: quenched by removing flask from heat
Post Treatment: purified with toluene, ethanol, methanol; dispersed in toluene
Sample-Specific Conditions
- Cu+ ions per NC: 0
- 5.0 nm CdSe nanocrystals before copper cation exchange
Preparation
- CdSe nanocrystals synthesized via hot injection: 3.4 mmol CdCO3, 5.0 g TOPO, 5.0 g stearic acid heated to 120 °C for 1.5 h under N2, then heated to 360 °C. 4.9 mmol Se powder in 5.0 mL TOP injected, followed by 5.0 mL ODE. Quenched after 2-5 min. Purified and dispersed in toluene (0.2 M).
Measurement
We plan to measure the Se K XANES spectrum of this sample.
Questions
Based on all the information above:
1. What candidate reference spectra are needed for linear combination fitting of the Se K-edge XANES data for this sample and subsequent stages of the cation exchange reaction?
2. Based on the sample conditions (0 Cu+ ions/NC), what phase dominates the composition, and what is the physical reasoning for this?
3. Describe the expected spectral features of the Se K-edge XANES for this sample, including the approximate edge position and distinguishing characteristics compared to the fully exchanged product.
Ground Truth
Material: CdSe nanocrystals
Measurement: Se K-edge XANES in transmission and fluorescence
Fit method: Linear combination fitting (LCF)
Phase fractions: (±5%)
| Phase | Fraction |
|---|---|
| CdSe | 1.0 |
| Cu2Se | 0.0 |
Fit basis (paper's reference spectra):
- CdSe
- Cu2Se
Source evidence: Figure 1b inset and page 3 text
Key reasoning: Before the addition of any copper salt (0 Cu+ ions/NC), the nanocrystals consist entirely of the initial wurtzite CdSe phase. The linear combination fitting of the Se K-edge XANES confirms 100% CdSe fraction, as the cation exchange reaction has not yet been initiated.
Reasoning source: Page 3, Results section
Scoring Rubric (total: 100 pts)
| Q | Type | Max | Question | Reference Answer | Scoring Criteria |
|---|---|---|---|---|---|
| q1 | identification | 30 | What candidate reference spectra are needed for linear combination fitting of the Se K-edge XANES data for this sample and subsequent stages of the cation exchange reaction? | The candidate reference spectra needed for linear combination fitting of the Se K-edge XANES data are CdSe and Cu2Se. These specific references are required because the sample conditions describe an initial state of 5.0 nm CdSe nanocrystals synthesized via hot-injection before any copper cation exchange has occurred (0 Cu+ ions per NC). As the reaction progresses in subsequent stages, the initial wurtzite CdSe phase will transform into a fully exchanged Cu2Se phase. Therefore, using both CdSe and Cu2Se as end-members allows for the accurate quantification of the structural evolution during the cation exchange process. | Full points for identifying CdSe and Cu2Se as the necessary reference spectra. |
| q2 | reasoning | 40 | Based on the sample conditions (0 Cu+ ions/NC), what phase dominates the composition, and what is the physical reasoning for this? | Based on the sample conditions, the composition is completely dominated by the wurtzite CdSe phase, representing a fraction of 1.0 (100%). The physical reasoning for this is that the sample represents the initial 5.0 nm nanocrystals synthesized via hot-injection before any copper salt has been added. Because there are exactly 0 Cu+ ions per nanocrystal, the cation exchange reaction has not yet been initiated. Consequently, the nanocrystals consist entirely of the starting CdSe material, resulting in a 0.0 fraction of Cu2Se. | Full points for stating that the sample is 100% CdSe because no copper precursor has been added yet to initiate the cation exchange reaction. |
| q3 | spectral | 30 | Describe the expected spectral features of the Se K-edge XANES for this sample, including the approximate edge position and distinguishing characteristics compared to the fully exchanged product. | The Se K-edge XANES spectrum for this sample is expected to show an edge position at approximately 12658 eV and a sharp white line peak around 12665 eV with a normalized intensity of ~1.4. These specific spectral features arise because the sample consists entirely of the initial wurtzite CdSe phase, as no copper cations (0 Cu+ ions/NC) have been introduced to initiate the exchange reaction. This spectrum serves as the starting end-member for the transformation. It is structurally and electronically distinct from the fully exchanged Cu2Se phase, which exhibits a different spectral shape and edge position due to the complete replacement of Cd with Cu. | Full points for mentioning an edge position around 12658 eV, a sharp white line peak around 12665 eV, and noting it is distinct from the Cu2Se end-member. |
Review
#876
CdSe/Cu2Se nanocrystals
Se K
▶
LLM Prompt
Sample Information
Material: CdSe/Cu2Se nanocrystals
Method: cation exchange
Precursors: CdSe nanocrystals, Cu(I)PF6
Temperature C: 25
Sample-Specific Conditions
- Cu+ ions per NC: 134
- 5.0 nm CdSe nanocrystals after partial copper cation exchange
Preparation
- CdSe nanocrystals synthesized via hot injection: 3.4 mmol CdCO3, 5.0 g TOPO, 5.0 g stearic acid heated to 120 °C for 1.5 h under N2, then heated to 360 °C. 4.9 mmol Se powder in 5.0 mL TOP injected, followed by 5.0 mL ODE. Quenched after 2-5 min. Purified and dispersed in toluene (0.2 M). Aliquots of 0.1 M Cu(I)PF6 in ethanol added to achieve 134 Cu ions/NC.
Measurement
We plan to measure the Se K XANES spectrum of this sample.
Questions
Based on all the information above:
1. Based on the sample conditions (partial cation exchange of CdSe with a low amount of Cu, 134 ions/NC), what are the expected principal phases present, and what reference spectra should be used for Linear Combination Fitting (LCF) of the Se K-edge XANES data?
2. Estimate the phase fractions of the components in this sample at a loading of 134 Cu ions/NC.
3. Explain the mechanistic reasoning behind the observed phase fractions at this low Cu concentration. What does this suggest about the nature of the cation exchange process in these nanocrystals?
Ground Truth
Material: CdSe/Cu2Se nanocrystals
Measurement: Se K-edge XANES, transmission and fluorescence, Sector 10 MRCAT
Fit method: Linear combination fitting (LCF)
Phase fractions: (±10%)
| Phase | Fraction |
|---|---|
| CdSe | 0.95 |
| Cu2Se | 0.05 |
Fit basis (paper's reference spectra):
- CdSe
- Cu2Se
Source evidence: Figure 1b inset and page 3 text
Key reasoning: At low Cu concentrations (134 Cu ions/NC), the Se K-edge XANES shows minimal transformation from CdSe to Cu2Se. The reaction exhibits positive cooperativity, meaning significant conversion to Cu2Se only occurs at higher Cu concentrations (above ~600 Cu ions/NC). Principal component analysis and the presence of isosbestic points confirm only two species (CdSe and Cu2Se) are present during the exchange.
Reasoning source: Page 3, Results section (Copper cation exchange in CdSe NCs as probed by X-ray absorption spectroscopy)
Scoring Rubric (total: 100 pts)
| Q | Type | Max | Question | Reference Answer | Scoring Criteria |
|---|---|---|---|---|---|
| q1 | identification | 30 | Based on the sample conditions (partial cation exchange of CdSe with a low amount of Cu, 134 ions/NC), what are the expected principal phases present, and what reference spectra should be used for Linear Combination Fitting (LCF) of the Se K-edge XANES data? | The expected principal phases present in the sample are CdSe and Cu2Se, which should also serve as the reference spectra for Linear Combination Fitting (LCF) of the Se K-edge XANES data. These phases arise because the 5.0 nm CdSe nanocrystals undergo a partial cation exchange reaction with Cu(I)PF6 at 25 °C. Principal component analysis and the presence of isosbestic points confirm that only these two specific species exist during the exchange process. Because the sample was treated with a low concentration of only 134 Cu+ ions per nanocrystal, the transformation is minimal, leaving predominantly unreacted CdSe and a small amount of the newly formed Cu2Se phase. | Full points for identifying CdSe and Cu2Se as the two phases and necessary reference spectra. |
| q2 | quantification | 30 | Estimate the phase fractions of the components in this sample at a loading of 134 Cu ions/NC. | At a loading of 134 Cu+ ions per nanocrystal, the estimated phase fractions are 0.95 (95%) CdSe and 0.05 (5%) Cu2Se, with an uncertainty of 10%. These specific values result from the low concentration of Cu(I)PF6 precursor added to the 5.0 nm CdSe nanocrystals at 25 °C. Because the cation exchange reaction exhibits positive cooperativity, significant conversion to Cu2Se does not occur until much higher copper concentrations, specifically above approximately 600 Cu ions/NC. Consequently, this low loading of 134 Cu ions/NC leads to only a minimal transformation, leaving the sample predominantly as the original CdSe phase. | Full points for estimating ~95% CdSe and ~5% Cu2Se (accepting reasonable ranges like 90-100% CdSe and 0-10% Cu2Se). |
| q3 | reasoning | 40 | Explain the mechanistic reasoning behind the observed phase fractions at this low Cu concentration. What does this suggest about the nature of the cation exchange process in these nanocrystals? | The observed phase fractions of 95% CdSe and 5% Cu2Se at a loading of 134 Cu+ ions per nanocrystal are driven by the positive cooperativity of the cation exchange reaction. When the 5.0 nm CdSe nanocrystals are exposed to a low concentration of Cu(I)PF6 at 25 °C, there is minimal transformation of the host lattice. This suggests that the initial substitution of Cu+ for Cd2+ is hindered until a critical threshold of copper loading is reached. Significant conversion to the Cu2Se phase only occurs at higher copper concentrations (above ~600 Cu ions/NC), demonstrating that the exchange process requires a critical accumulation of Cu+ to facilitate bulk transformation. | Full points for mentioning that minimal transformation occurs at low concentrations due to positive cooperativity, and that the reaction proceeds as a two-phase process (CdSe to Cu2Se) without intermediate Se-containing phases. |
Review
#877
CdSe/Cu2Se nanocrystals
Se K
▶
LLM Prompt
Sample Information
Material: CdSe/Cu2Se nanocrystals
Method: cation exchange
Precursors: CdSe nanocrystals, Cu(I)PF6
Temperature C: 25
Sample-Specific Conditions
- Cu+ ions per NC: 251
- 5.0 nm CdSe nanocrystals after partial copper cation exchange
Preparation
- CdSe nanocrystals synthesized via hot injection: 3.4 mmol CdCO3, 5.0 g TOPO, 5.0 g stearic acid heated to 120 °C for 1.5 h under N2, then heated to 360 °C. 4.9 mmol Se powder in 5.0 mL TOP injected, followed by 5.0 mL ODE. Quenched after 2-5 min. Purified and dispersed in toluene (0.2 M). Aliquots of 0.1 M Cu(I)PF6 in ethanol added to achieve 251 Cu ions/NC.
Measurement
We plan to measure the Se K XANES spectrum of this sample.
Questions
Based on all the information above:
1. Based on the sample conditions, what candidate reference spectra are needed to model the Se K-edge XANES of this sample using linear combination fitting?
2. Estimate the phase fractions of the components in this sample given the addition of 251 Cu ions/NC.
3. Explain the physical reasoning for the observed phase composition at this specific stage of the cation exchange reaction (251 Cu ions/NC). Why is the conversion to the product phase still relatively low?
Ground Truth
Material: CdSe/Cu2Se nanocrystals
Measurement: Se K-edge XANES, transmission and fluorescence, Sector 10 MRCAT
Fit method: Linear combination fitting (LCF)
Phase fractions: (±10%)
| Phase | Fraction |
|---|---|
| CdSe | 0.9 |
| Cu2Se | 0.1 |
Fit basis (paper's reference spectra):
- CdSe
- Cu2Se
Source evidence: Figure 1b inset, page 3
Key reasoning: As increasing amounts of Cu are added to the CdSe solution, transformation of the CdSe species to Cu2Se is evident via Se K-edge XANES. Principal component analysis suggests only two species are present, consistent with observed isosbestic points. At a low concentration of 251 Cu ions/NC (below ~600 Cu ions/NC), there is only a very small fraction of Cu2Se formed. The transformation exhibits positive cooperativity (Hill coefficient n = 3.5), meaning the conversion remains low until a critical concentration is reached.
Reasoning source: Results section, page 3
Scoring Rubric (total: 100 pts)
| Q | Type | Max | Question | Reference Answer | Scoring Criteria |
|---|---|---|---|---|---|
| q1 | identification | 30 | Based on the sample conditions, what candidate reference spectra are needed to model the Se K-edge XANES of this sample using linear combination fitting? | The candidate reference spectra needed to model the Se K-edge XANES of this sample using linear combination fitting are CdSe and Cu2Se. These specific phases are expected because the sample is prepared via a partial cation exchange reaction where Cu(I)PF6 is added to 5.0 nm CdSe nanocrystals at 25 °C. Principal component analysis of the XANES data confirms that only two species are present, which is consistent with the observed isosbestic points during the reaction. Therefore, the system can be entirely described by the initial reactant phase (CdSe) and the resulting product phase (Cu2Se). | Full credit for identifying CdSe and Cu2Se as the necessary reference spectra. Partial credit if only one is identified or if extra incorrect phases are included. |
| q2 | quantification | 35 | Estimate the phase fractions of the components in this sample given the addition of 251 Cu ions/NC. | The estimated phase fractions for this sample are 0.9 (90%) CdSe and 0.1 (10%) Cu2Se. These specific values result from the relatively low concentration of Cu+ precursor added to the system, specifically 251 Cu ions per 5.0 nm CdSe nanocrystal at 25 °C. The cation exchange transformation exhibits positive cooperativity with a Hill coefficient of 3.5, meaning that conversion remains minimal until a critical concentration of approximately 600 Cu ions/NC is reached. Because 251 Cu ions/NC is well below this threshold, only a very small fraction of the initial CdSe has been converted to Cu2Se. | Full credit for estimating approximately 90% CdSe and 10% Cu2Se (accepting ranges like 85-95% CdSe and 5-15% Cu2Se). Deduct points for estimates significantly outside this range. |
| q3 | reasoning | 35 | Explain the physical reasoning for the observed phase composition at this specific stage of the cation exchange reaction (251 Cu ions/NC). Why is the conversion to the product phase still relatively low? | The conversion to the Cu2Se product phase remains relatively low (10%) at this stage because the cation exchange reaction exhibits strong positive cooperativity. As Cu(I)PF6 is added to the 5.0 nm CdSe nanocrystals at 25 °C, the transformation from CdSe to Cu2Se follows a cooperative mechanism characterized by a Hill coefficient of 3.5. This physical behavior dictates that the structural conversion remains minimal until a critical threshold concentration of approximately 600 Cu ions/NC is reached. Since the current sample condition of 251 Cu ions/NC is significantly below this critical threshold, the reaction has barely progressed, leaving the nanocrystals predominantly as the unreacted CdSe phase. | Full credit for explaining that the cation exchange process exhibits positive cooperativity, meaning that at low Cu concentrations (like 251 ions/NC, which is below the critical threshold of ~600 ions/NC), the conversion to Cu2Se remains very small, and the system consists almost entirely of the initial CdSe phase. |
Review
#878
CdSe/Cu2Se nanocrystals
Se K
▶
LLM Prompt
Sample Information
Material: CdSe/Cu2Se nanocrystals
Method: cation exchange
Precursors: CdSe nanocrystals, Cu(I)PF6
Temperature C: 25
Sample-Specific Conditions
- Cu+ ions per NC: 426
- 5.0 nm CdSe nanocrystals after partial copper cation exchange
Preparation
- CdSe nanocrystals synthesized via hot injection: 3.4 mmol CdCO3, 5.0 g TOPO, 5.0 g stearic acid heated to 120 °C for 1.5 h under N2, then heated to 360 °C. 4.9 mmol Se powder in 5.0 mL TOP injected, followed by 5.0 mL ODE. Quenched after 2-5 min. Purified and dispersed in toluene (0.2 M). Aliquots of 0.1 M Cu(I)PF6 in ethanol added to achieve ~426 Cu ions/NC.
Measurement
We plan to measure the Se K XANES spectrum of this sample.
Questions
Based on all the information above:
1. What candidate reference spectra are needed to model the Se K-edge XANES data for this partially exchanged nanocrystal sample using linear combination fitting?
2. Based on the cooperative cation exchange mechanism described for this system, estimate the phase fractions of the Se-containing species at this intermediate loading of 426 Cu+ ions per NC.
Ground Truth
Material: CdSe/Cu2Se nanocrystals
Measurement: Se K-edge XANES, transmission and fluorescence at MRCAT Sector 10
Fit method: Linear combination fitting (LCF)
Phase fractions: (±10%)
| Phase | Fraction |
|---|---|
| CdSe | 0.7 |
| Cu2Se | 0.3 |
Fit basis (paper's reference spectra):
- CdSe
- Cu2Se
Source evidence: Figure 1b inset, page 3
Key reasoning: The Se K-edge XANES exhibits gradual changes with increasing copper concentration and clear isosbestic points, indicating a two-state transformation. Principal component analysis confirms only two species are present. Linear combination fitting (LCF) using CdSe and Cu2Se reference spectra tracks the transformation. The conversion follows a cooperative mechanism (Hill coefficient n=3.5), where initial Cu incorporation is followed by rapid conversion to Cu2Se, resulting in a mixture of CdSe and Cu2Se at intermediate Cu loadings.
Reasoning source: Results section, 'Copper cation exchange in CdSe NCs as probed by X-ray absorption spectroscopy', page 3
Scoring Rubric (total: 100 pts)
| Q | Type | Max | Question | Reference Answer | Scoring Criteria |
|---|---|---|---|---|---|
| q1 | identification | 33 | What candidate reference spectra are needed to model the Se K-edge XANES data for this partially exchanged nanocrystal sample using linear combination fitting? | The candidate reference spectra needed to model the Se K-edge XANES data using linear combination fitting are CdSe and Cu2Se. These specific phases are expected because the sample consists of 5.0 nm CdSe nanocrystals subjected to partial cation exchange with Cu(I)PF6 at 25 °C. Under these conditions, the Se K-edge XANES exhibits clear isosbestic points and principal component analysis confirms only two species are present, indicating a direct two-state transformation. Therefore, the intermediate state at a loading of 426 Cu+ ions per NC can be entirely modeled by a mixture of the initial CdSe precursor and the final Cu2Se product. | Full credit for identifying CdSe and Cu2Se as the two necessary reference spectra. |
| q2 | quantification | 67 | Based on the cooperative cation exchange mechanism described for this system, estimate the phase fractions of the Se-containing species at this intermediate loading of 426 Cu+ ions per NC. | At the intermediate loading of 426 Cu+ ions per nanocrystal, the estimated phase fractions are 0.7 for CdSe and 0.3 for Cu2Se, with an uncertainty of 10%. These specific values result from the room temperature (25 °C) partial cation exchange of the 5.0 nm CdSe nanocrystals with Cu(I)PF6. The reaction follows a cooperative mechanism (Hill coefficient n=3.5) where initial Cu incorporation is followed by rapid conversion to Cu2Se. Because of this cooperativity, the intermediate loading does not form a homogeneous solid solution but rather a two-phase mixture, leaving 70% of the original CdSe intact while 30% has fully converted to Cu2Se. | Full credit for estimating approximately 70% CdSe and 30% Cu2Se. Partial credit for identifying that both phases coexist with CdSe still being the majority phase at this specific intermediate loading. |
Review
#879
CdSe/Cu2Se nanocrystals
Se K
▶
LLM Prompt
Sample Information
Material: CdSe/Cu2Se nanocrystals
Method: cation exchange
Precursors: CdSe nanocrystals, Cu(I)PF6
Temperature C: 25
Sample-Specific Conditions
- Cu+ ions per NC: 601
- 5.0 nm CdSe nanocrystals after partial copper cation exchange
Preparation
- CdSe nanocrystals synthesized via hot injection: 3.4 mmol CdCO3, 5.0 g TOPO, 5.0 g stearic acid heated to 120 °C for 1.5 h under N2, then heated to 360 °C. 4.9 mmol Se powder in 5.0 mL TOP injected, followed by 5.0 mL ODE. Quenched after 2-5 min. Purified and dispersed in toluene (0.2 M). Aliquots of 0.1 M Cu(I)PF6 in ethanol added to achieve 601 Cu ions/NC.
Measurement
We plan to measure the Se K XANES spectrum of this sample.
Questions
Based on all the information above:
1. Based on the sample conditions (partial copper cation exchange of CdSe nanocrystals), what reference spectra are required to model the Se K-edge XANES data using linear combination fitting?
2. Estimate the phase fractions of the components in the sample after the addition of 601 Cu+ ions per NC.
Ground Truth
Material: CdSe/Cu2Se nanocrystals
Measurement: Se K-edge XANES, transmission and fluorescence, Sector 10 MRCAT
Fit method: Linear combination fitting (LCF)
Phase fractions: (±10%)
| Phase | Fraction |
|---|---|
| CdSe | 0.2 |
| Cu2Se | 0.8 |
Fit basis (paper's reference spectra):
- CdSe
- Cu2Se
Source evidence: Figure 1b inset, page 3
Key reasoning: As increasing amounts of Cu are added to the CdSe solution, transformation of the CdSe species to Cu2Se is evident via Se K-edge XANES. Principal component analysis suggests only two species are present, consistent with the observed isosbestic points. The transformation exhibits positive cooperativity, as indicated by a Hill coefficient of n = 3.5, meaning the reaction proceeds as a two-phase process without stable intermediate phases.
Reasoning source: Page 3, Results section, first paragraph
Scoring Rubric (total: 100 pts)
| Q | Type | Max | Question | Reference Answer | Scoring Criteria |
|---|---|---|---|---|---|
| q1 | identification | 43 | Based on the sample conditions (partial copper cation exchange of CdSe nanocrystals), what reference spectra are required to model the Se K-edge XANES data using linear combination fitting? | To model the Se K-edge XANES data using linear combination fitting, the required reference spectra are CdSe and Cu2Se. These specific phases are expected because the sample is prepared via partial cation exchange by adding Cu(I)PF6 to 5.0 nm CdSe nanocrystals at 25 °C. As Cu+ ions are added, the CdSe species transforms directly into Cu2Se. This occurs because the transformation exhibits positive cooperativity (Hill coefficient n = 3.5), meaning the reaction proceeds strictly as a two-phase process without the formation of any stable intermediate phases, which is further supported by principal component analysis showing only two species. | Full points for identifying CdSe and Cu2Se as the necessary reference spectra. |
| q2 | quantification | 57 | Estimate the phase fractions of the components in the sample after the addition of 601 Cu+ ions per NC. | After the addition of 601 Cu+ ions per nanocrystal, the estimated phase fractions are 0.2 (20%) CdSe and 0.8 (80%) Cu2Se, with a 10% uncertainty. These specific values result from the partial cation exchange reaction occurring when Cu(I)PF6 is added to the 5.0 nm CdSe nanocrystals at 25 °C. Because the transformation exhibits positive cooperativity (Hill coefficient n = 3.5), it proceeds as a direct two-phase process without stable intermediate phases. Therefore, the specific dosage of 601 Cu+ ions per nanocrystal drives the exchange to 80% completion, converting the majority of the material to Cu2Se while 20% remains as the original CdSe phase. | Full points for estimating ~20% CdSe and ~80% Cu2Se. Partial credit for identifying that Cu2Se is the majority phase but with inaccurate percentages. |
Review
#880
CdSe/Cu2Se nanocrystals
Se K
▶
LLM Prompt
Sample Information
Material: CdSe/Cu2Se nanocrystals
Method: cation exchange
Precursors: CdSe nanocrystals, Cu(I)PF6
Temperature C: 25
Sample-Specific Conditions
- Cu+ ions per NC: 775
- 5.0 nm CdSe nanocrystals after partial copper cation exchange
Preparation
- CdSe nanocrystals synthesized via hot injection: 3.4 mmol CdCO3, 5.0 g TOPO, 5.0 g stearic acid heated to 120 °C for 1.5 h under N2, then heated to 360 °C. 4.9 mmol Se powder in 5.0 mL TOP injected, followed by 5.0 mL ODE. Quenched after 2-5 min. Purified and dispersed in toluene (0.2 M). Aliquots of 0.1 M Cu(I)PF6 in ethanol added to achieve ~775 Cu ions/NC.
Measurement
We plan to measure the Se K XANES spectrum of this sample.
Questions
Based on all the information above:
1. Based on the sample conditions (5.0 nm CdSe NCs with 775 Cu+ ions/NC), what are the expected phases present and their approximate fractions determined by Se K-edge XANES linear combination fitting?
2. What reference spectra should be used as the basis for linear combination fitting of the Se K-edge XANES data for this sample?
3. Explain the physical mechanism and structural changes occurring in the nanocrystals at this stage of the cation exchange reaction (775 Cu+ ions/NC) that lead to the observed phase composition.
Ground Truth
Material: CdSe/Cu2Se nanocrystals
Measurement: Se K-edge XANES in transmission and fluorescence at Sector 10 (MRCAT)
Fit method: Linear combination fitting (LCF)
Phase fractions: (±10%)
| Phase | Fraction |
|---|---|
| CdSe | 0.1 |
| Cu2Se | 0.9 |
Fit basis (paper's reference spectra):
- CdSe
- Cu2Se
Source evidence: Figure 1b inset and Page 4 text (Evidence for interstitials during cation exchange)
Key reasoning: The cation exchange of CdSe with Cu+ exhibits positive cooperativity, transforming CdSe to Cu2Se. At a high concentration of 775 Cu ions/NC (mol Cu/mol Cd = 2.9), the transformation is nearly complete. However, EXAFS and XANES LCF data indicate a co-existence of both Cu2Se and CdSe phases, with the fully exchanged 100% Cu2Se state only reached at higher Cu loadings.
Reasoning source: Page 3 (Copper cation exchange in CdSe NCs as probed by X-ray absorption spectroscopy) and Page 4 (Evidence for interstitials during cation exchange)
Scoring Rubric (total: 100 pts)
| Q | Type | Max | Question | Reference Answer | Scoring Criteria |
|---|---|---|---|---|---|
| q1 | quantification | 30 | Based on the sample conditions (5.0 nm CdSe NCs with 775 Cu+ ions/NC), what are the expected phases present and their approximate fractions determined by Se K-edge XANES linear combination fitting? | The expected phases determined by Se K-edge XANES linear combination fitting are Cu2Se and CdSe, with approximate fractions of 0.9 (90%) Cu2Se and 0.1 (10%) CdSe, subject to a 10% uncertainty. These specific fractions result from the cation exchange reaction between the 5.0 nm CdSe nanocrystals and Cu(I)PF6 at 25 °C, a process that exhibits positive cooperativity. At the high loading of 775 Cu+ ions per nanocrystal (corresponding to a Cu to Cd molar ratio of 2.9), the transformation of the nanocrystals from CdSe to Cu2Se is nearly complete. However, because the fully exchanged 100% Cu2Se state is only reached at even higher Cu loadings, a small amount of the original CdSe phase remains, leading to the observed 90:10 coexistence. | Full points for identifying CdSe and Cu2Se with fractions of ~10% and ~90% respectively. Partial points for identifying the correct phases but incorrect fractions, or for stating it is mostly Cu2Se with some residual CdSe. |
| q2 | identification | 20 | What reference spectra should be used as the basis for linear combination fitting of the Se K-edge XANES data for this sample? | The reference spectra that should be used as the basis for linear combination fitting of the Se K-edge XANES data are CdSe and Cu2Se. These specific reference phases are required because the sample is undergoing a partial cation exchange reaction at 25 °C, where Cu+ ions from Cu(I)PF6 replace Cd2+ ions in the 5.0 nm CdSe nanocrystals. This exchange process exhibits positive cooperativity, directly transforming the initial CdSe host lattice into a Cu2Se phase. At the specific loading of 775 Cu+ ions per nanocrystal, the transformation is nearly complete but has not yet reached 100% Cu2Se, necessitating both the CdSe and Cu2Se references to accurately model the co-existing phases in the spectrum. | Full points for specifying CdSe and Cu2Se (or Cu2Se formed via cation exchange). |
| q3 | reasoning | 50 | Explain the physical mechanism and structural changes occurring in the nanocrystals at this stage of the cation exchange reaction (775 Cu+ ions/NC) that lead to the observed phase composition. | The physical mechanism driving the structural changes in the 5.0 nm nanocrystals at 25 °C is a cation exchange between the initial CdSe lattice and incoming Cu+ ions that exhibits positive cooperativity. As Cu(I)PF6 is added, the Cu+ ions replace the Cd2+ ions, transforming the material from CdSe to Cu2Se. At the high concentration of 775 Cu+ ions per nanocrystal (a Cu/Cd molar ratio of 2.9), this cooperative transformation is nearly complete, resulting in a dominant 90% Cu2Se phase composition. However, the fully exchanged 100% Cu2Se state requires higher Cu loadings, meaning the reaction leaves behind a residual 10% fraction of the original CdSe phase, resulting in the observed co-existence of both structures. | Full points for explaining that the reaction proceeds via cooperative transformation from CdSe to Cu2Se, and at this high Cu concentration, the transformation is nearly complete but still exhibits a co-existence of both Cu2Se and CdSe phases before reaching the fully exchanged state. |
Review
Neighboring Pd single atoms surpass isolated single atoms for selective hydrodehalogenation catalysis
BNL-NSLS-II-8-ID
Catalyst
Chiheng Chu et al.
DOI: 10.1038/s41467-021-25526-2
2 scenarios
▶
#881
Pd/SiC
Pd K
▶
LLM Prompt
Sample Information
Material: Pd/SiC
Support: amine-modified SiC
Sample-Specific Conditions
- Pd loading: 0.5 wt%
- Isolated Pd single atom catalyst on SiC
Measurement
We plan to measure the Pd K XANES spectrum of this sample.
Questions
Based on all the information above:
1. Based on the sample conditions (0.5 wt% Pd on amine-modified SiC, isolated single atoms), what is the expected oxidation state of the Pd species, and what physical reasoning explains this state?
2. Describe the expected white line intensity of this 0.5%-Pd/SiC sample compared to standard reference materials. What does this indicate about the sample compared to metallic Pd nanoparticles?
3. What is the expected energy position of the first peak in the XANES derivative for this sample, and which reference materials does this peak position match?
Ground Truth
Material: 0.5%-Pd/SiC
Measurement: Pd K-edge XANES, fluorescence mode, Beamline 8-ID (ISS) at NSLS-II
Fit method: Qualitative comparison of white line intensity and first derivative peaks
Phase fractions: (±5%)
| Phase | Fraction |
|---|---|
| oxidized_Pd_single_atoms | 1.0 |
Fit basis (paper's reference spectra):
- Pd foil
- PdO
- PdCl2
Source evidence: Page 4, Figure 1f-g
Key reasoning: The white line intensity of the Pd single atoms is between that of Pd0 and Pd2+, indicating positively charged Pd with partially unoccupied 4d orbitals. The first peak of the XANES derivative is at 24,348 eV, matching PdO and PdCl2 references, which confirms the valence state is close to +2. This is consistent with the coordination of Pd single atoms with electrophilic O atoms on the support.
Reasoning source: Page 4, Results and discussion (Synthesis and structural characterization of Pd SACs)
Scoring Rubric (total: 100 pts)
| Q | Type | Max | Question | Reference Answer | Scoring Criteria |
|---|---|---|---|---|---|
| q1 | reasoning | 35 | Based on the sample conditions (0.5 wt% Pd on amine-modified SiC, isolated single atoms), what is the expected oxidation state of the Pd species, and what physical reasoning explains this state? | The expected oxidation state of the Pd species is close to +2, consisting entirely of oxidized Pd single atoms. This state arises because the 0.5 wt% Pd loading on the amine-modified SiC support results in isolated Pd single atoms that coordinate with electrophilic oxygen atoms on the support. This specific coordination environment draws electron density away from the metal, leaving the Pd atoms positively charged with partially unoccupied 4d orbitals. Consequently, the isolated single atoms stabilize in a +2 valence state rather than forming metallic Pd0 nanoparticles. | Full points for stating the oxidation state is close to +2 and explaining that it results from the coordination of Pd single atoms with electrophilic O atoms on the support, leading to positively charged Pd with partially unoccupied 4d orbitals. |
| q2 | spectral | 35 | Describe the expected white line intensity of this 0.5%-Pd/SiC sample compared to standard reference materials. What does this indicate about the sample compared to metallic Pd nanoparticles? | The expected white line intensity of the 0.5%-Pd/SiC sample is intermediate between that of metallic Pd (Pd foil) and fully oxidized Pd2+ (PdO). This spectral feature indicates that the sample consists of positively charged Pd with partially unoccupied 4d orbitals, clearly distinguishing it from metallic Pd0 nanoparticles. This specific electronic structure arises because the low 0.5 wt% Pd loading on the amine-modified SiC support produces isolated Pd single atoms rather than bulk metal. These isolated atoms coordinate with electrophilic oxygen atoms on the support, which withdraws electron density from the Pd and yields a white line intensity higher than metallic Pd but lower than bulk PdO. | Full points for stating the white line intensity is intermediate between metallic Pd (Pd foil) and fully oxidized Pd2+ (PdO), which distinguishes it from metallic Pd nanoparticles (which would have a white line similar to Pd foil). |
| q3 | identification | 30 | What is the expected energy position of the first peak in the XANES derivative for this sample, and which reference materials does this peak position match? | The expected energy position of the first peak in the XANES derivative is 24,348 eV, which matches the Pd2+ reference materials PdO and PdCl2. This peak position confirms that the valence state of the Pd in the sample is close to +2. This specific oxidation state arises because the 0.5 wt% Pd loading on the amine-modified SiC support forms isolated Pd single atoms rather than metallic clusters. These isolated single atoms coordinate with electrophilic oxygen atoms on the support, resulting in a positively charged Pd species that spectrally aligns with Pd2+ references. | Full points for identifying the first derivative peak at 24,348 eV and stating that it matches the PdO and PdCl2 references. |
Review
#882
Pd/SiC
Pd K
▶
LLM Prompt
Sample Information
Material: Pd/SiC
Support: amine-modified SiC
Sample-Specific Conditions
- catalyst type: nanoparticles
- Pd nanoparticles on SiC
Measurement
We plan to measure the Pd K XANES spectrum of this sample.
Questions
Based on all the information above:
1. Based on the sample conditions (Pd nanoparticles on SiC prepared via hydrothermal reduction with isopropanol), what is the expected dominant phase and oxidation state of Pd, and what physical reasoning justifies this?
2. Describe the expected XANES spectral shape and edge position for this Pdnano/SiC sample. How does its white line intensity compare to that of oxidized Pd species?
Ground Truth
Material: Pdnano/SiC
Measurement: Pd K-edge XANES, ex-situ, Beamline 8-ID (ISS) of the National Synchrotron Light Source II
Fit method: Qualitative comparison of XANES and HAADF-STEM counting
Phase fractions: (±10%)
| Phase | Fraction |
|---|---|
| metallic_palladium | 1.0 |
Fit basis (paper's reference spectra):
- Pd foil
- PdO
- PdCl2
Source evidence: Page 4 text; Figure 1f, 1g, 1h
Key reasoning: The hydrothermal reduction with isopropanol produces Pd nanoparticles. The XANES white line intensity of Pdnano/SiC is similar to that of Pd foil, indicating a metallic state (Pd0). The first derivative of the XANES spectrum shows a peak at 24,345 eV, matching Pd foil and distinct from oxidized Pd species.
Reasoning source: Results and discussion, Synthesis and structural characterization of Pd SACs, Page 4
Scoring Rubric (total: 100 pts)
| Q | Type | Max | Question | Reference Answer | Scoring Criteria |
|---|---|---|---|---|---|
| q1 | reasoning | 50 | Based on the sample conditions (Pd nanoparticles on SiC prepared via hydrothermal reduction with isopropanol), what is the expected dominant phase and oxidation state of Pd, and what physical reasoning justifies this? | The expected dominant phase for the Pd/SiC sample is metallic palladium with an oxidation state of 0, comprising a fraction of 1.0. This fully metallic state arises because the sample is subjected to hydrothermal reduction with isopropanol, which effectively reduces the palladium into Pd nanoparticles on the amine-modified SiC support. Consequently, the XANES white line intensity and the first derivative peak at 24,345 eV perfectly match a metallic Pd foil reference rather than oxidized species like PdO or PdCl2. Thus, the specific reducing synthesis conditions directly dictate the formation of pure metallic Pd0. | Full points for identifying metallic Pd (Pd0) as the dominant phase (fraction ~1.0) and explaining that the hydrothermal reduction process yields metallic nanoparticles. |
| q2 | spectral | 50 | Describe the expected XANES spectral shape and edge position for this Pdnano/SiC sample. How does its white line intensity compare to that of oxidized Pd species? | The Pd K-edge XANES spectrum for this Pdnano/SiC sample will exhibit an edge position at 24,345 eV, corresponding to the first peak of the derivative spectrum. Its spectral shape features a white line intensity that is significantly lower than that of oxidized Pd2+ species, closely matching a metallic Pd foil reference. These specific spectral features emerge because the sample conditions—specifically the hydrothermal reduction with isopropanol—produce fully reduced metallic Pd nanoparticles (Pd0) on the SiC support. Because the palladium exists entirely in this reduced metallic state rather than an oxidized form, it lacks the higher white line intensity associated with oxidized Pd species, yielding a spectrum identical to metallic Pd. | Full points for mentioning a white line intensity similar to Pd foil (lower than oxidized Pd) and an edge position (first derivative peak) at 24,345 eV. |
Review
Reaction inhomogeneity coupling with metal rearrangement triggers electrochemical degradation in lithium-rich layered cathode
APS
Electrochemistry
Liguang Wang et al.
DOI: 10.1038/s41467-021-25686-1
4 scenarios
▶
#883
Li1.2Ni0.13Co0.13Mn0.54O2 (LR-NCM)
Ni K-edge
▶
LLM Prompt
Sample Information
Material: Li1.2Ni0.13Co0.13Mn0.54O2 (LR-NCM)
Electrode Type: cathode
Electrolyte: 1 M LiPF6 in EC:DMC (1:1)
Cell Type: in-situ coin cell with Kapton window
Charge Discharge: charging
Voltage V: 3.0
Cycle Number: 1
Sample-Specific Conditions
- voltage: 3.0 V
- Initial state of the first charge process
Measurement
We plan to measure the Ni K-edge XANES spectrum of this sample.
Questions
Based on all the information above:
1. What candidate reference spectra or basis states are needed to model the Ni K-edge XANES spectrum of this LR-NCM cathode during the first charge process using linear combination fitting?
2. At 3.0 V during the first charge cycle, what is the dominant oxidation state of Nickel in this material, and why?
Ground Truth
Material: Li1.2Ni0.13Co0.13Mn0.54O2 (LR-NCM)
Measurement: Ni K-edge, transmission mode, in-situ/operando, beamline 9-BM-C and 12-BM-B
Fit method: Linear combination fitting
Phase fractions: (±10%)
| Phase | Fraction |
|---|---|
| Ni(II) | 1.0 |
| Ni(IV) | 0.0 |
Fit basis (paper's reference spectra):
- Ni(II)
- Ni(IV)
Source evidence: Figure 5d and its caption
Key reasoning: At the beginning of the first charge process (3.0 V), the nickel in the LR-NCM cathode is entirely in its pristine Ni2+ state. Oxidation to Ni4+ does not occur until higher voltages, reaching full oxidation at 4.5 V during the first charge. Therefore, the linear combination fitting of the operando XANES spectrum at 3.0 V yields 100% Ni(II).
Reasoning source: Results section: The evolution of reaction mechanisms, page 6
Scoring Rubric (total: 100 pts)
| Q | Type | Max | Question | Reference Answer | Scoring Criteria |
|---|---|---|---|---|---|
| q1 | identification | 33 | What candidate reference spectra or basis states are needed to model the Ni K-edge XANES spectrum of this LR-NCM cathode during the first charge process using linear combination fitting? | To model the Ni K-edge XANES spectrum of this LR-NCM cathode during the first charge process, the required basis states for linear combination fitting are Ni(II) and Ni(IV). These reference spectra are necessary because they represent the initial and final oxidation states of nickel during the charging cycle. Specifically, at the initial state of 3.0 V, the nickel is entirely in its pristine Ni2+ state. As the cell is charged to higher voltages, reaching full oxidation at 4.5 V, the nickel undergoes oxidation from Ni2+ to Ni4+, making these two states the essential end-members to capture the material's electrochemical evolution. | Full credit for identifying Ni(II) and Ni(IV) as the necessary basis states for the fitting. |
| q2 | reasoning | 67 | At 3.0 V during the first charge cycle, what is the dominant oxidation state of Nickel in this material, and why? | At 3.0 V during the first charge cycle, the dominant oxidation state of nickel in the LR-NCM cathode is Ni(II), which accounts for a fraction of 1.0 (100%) of the nickel species. This occurs because 3.0 V represents the very beginning of the initial charge process for this material. At this initial low voltage, the electrochemical driving force is insufficient to trigger the oxidation of nickel. Oxidation to Ni4+ does not occur until higher voltages are reached later in the charge cycle, meaning the nickel remains entirely in its pristine Ni2+ state at 3.0 V. | Full credit for stating that Ni is 100% in the Ni(II) state, because 3.0 V represents the initial state before significant electrochemical oxidation of Ni2+ to Ni4+ occurs. |
Review
#884
Li1.2Ni0.13Co0.13Mn0.54O2 (LR-NCM)
Ni K-edge
▶
LLM Prompt
Sample Information
Material: Li1.2Ni0.13Co0.13Mn0.54O2 (LR-NCM)
Electrode Type: cathode
Electrolyte: 1 M LiPF6 in EC:DMC (1:1)
Cell Type: in-situ coin cell with Kapton window
Charge Discharge: charged
Voltage V: 4.5
Cycle Number: 1
Sample-Specific Conditions
- voltage: 4.5 V
- Fully charged state during the first cycle
Measurement
We plan to measure the Ni K-edge XANES spectrum of this sample.
Questions
Based on all the information above:
1. What candidate reference spectra or basis functions are needed to model the Ni K-edge XANES of this LR-NCM cathode during the first charge cycle using linear combination fitting?
2. At a fully charged state of 4.5 V during the first cycle, what is the expected dominant Ni oxidation state phase, and what is its approximate fraction?
Ground Truth
Material: Li1.2Ni0.13Co0.13Mn0.54O2 (LR-NCM)
Measurement: Ni K-edge in-operando XANES, transmission mode, beamlines 9-BM-C and 12-BM-B
Fit method: Linear combination fitting (LCF)
Phase fractions: (±10%)
| Phase | Fraction |
|---|---|
| Ni(IV) | 1.0 |
| Ni(II) | 0.0 |
Fit basis (paper's reference spectra):
- Ni(II)
- Ni(IV)
Source evidence: Figure 5d and page 6 text
Key reasoning: During the first charge, Ni2+ is fully oxidized to its highest oxidation state of 4+ by the time the cell reaches 4.5 V. It exhibits no further electrochemical activation at higher voltages, meaning the Ni(IV) fraction reaches 1.0 at 4.5 V and remains there.
Reasoning source: Page 6, Section: The evolution of reaction mechanisms
Scoring Rubric (total: 100 pts)
| Q | Type | Max | Question | Reference Answer | Scoring Criteria |
|---|---|---|---|---|---|
| q1 | identification | 50 | What candidate reference spectra or basis functions are needed to model the Ni K-edge XANES of this LR-NCM cathode during the first charge cycle using linear combination fitting? | To model the Ni K-edge XANES of the Li1.2Ni0.13Co0.13Mn0.54O2 (LR-NCM) cathode during the first charge cycle using linear combination fitting, the required basis functions are Ni(II) and Ni(IV). These specific reference spectra are necessary because the initial state of the material contains Ni2+. As the cell is charged to 4.5 V, the nickel undergoes electrochemical activation and is fully oxidized to its highest oxidation state of 4+. Therefore, capturing the structural and electronic evolution during this first charge requires both the starting Ni(II) and the final Ni(IV) reference phases. | Full points for identifying Ni(II) and Ni(IV) as the necessary basis components for the LCF analysis. |
| q2 | prediction | 50 | At a fully charged state of 4.5 V during the first cycle, what is the expected dominant Ni oxidation state phase, and what is its approximate fraction? | At a fully charged state of 4.5 V during the first cycle, the expected dominant Ni oxidation state phase is Ni(IV) with a fraction of 1.0, while the Ni(II) fraction is 0.0 (with a 10% uncertainty). These specific values result from the electrochemical behavior of the Li1.2Ni0.13Co0.13Mn0.54O2 (LR-NCM) cathode under these charging conditions. During the first charge, the initial Ni2+ is fully oxidized to its highest oxidation state of 4+ by the time the cell reaches 4.5 V. Because nickel exhibits no further electrochemical activation at higher voltages, the Ni(IV) fraction reaches 1.0 at 4.5 V and remains completely dominant. | Full points for stating that Ni(IV) is the dominant phase with a fraction of 1.0 (or 100%), and Ni(II) is 0.0. |
Review
#885
Li1.2Ni0.13Co0.13Mn0.54O2 (LR-NCM)
Ni K-edge
▶
LLM Prompt
Sample Information
Material: Li1.2Ni0.13Co0.13Mn0.54O2 (LR-NCM)
Electrode Type: cathode
Electrolyte: 1 M LiPF6 in EC:DMC (1:1)
Cell Type: in-situ coin cell with Kapton window
Charge Discharge: charged
Voltage V: 4.8
Cycle Number: 200
Sample-Specific Conditions
- voltage: 4.8 V
- Fully charged state after long-term cycling (aged electrode)
Measurement
We plan to measure the Ni K-edge XANES spectrum of this sample.
Questions
Based on all the information above:
1. What candidate reference spectra or basis functions are needed to model the Ni K-edge XANES spectrum of this aged LR-NCM electrode at 4.8 V using linear combination fitting?
2. Estimate the phase fractions of the Ni species in this sample at the fully charged state (4.8 V) after 200 cycles.
3. Explain the physical and electrochemical reasoning for why the Ni species are not fully oxidized to 4+ at 4.8 V after 200 cycles, in contrast to the first cycle.
Ground Truth
Material: Li1.2Ni0.13Co0.13Mn0.54O2 (LR-NCM)
Measurement: Ni K-edge in-operando XANES at beamline 9-BM-C and 12-BM-B
Fit method: linear combination fitting
Phase fractions: (±10%)
| Phase | Fraction |
|---|---|
| Ni(II) | 0.2 |
| Ni(IV) | 0.8 |
Fit basis (paper's reference spectra):
- Ni(II)
- Ni(IV)
Source evidence: Fig. 5d and caption, page 6
Key reasoning: In the aged electrode (200th cycle), the average Ni oxidation state is lower than 4+ at the fully charged state of 4.8 V. This incomplete oxidation is attributed to two factors: first, a large overpotential leads to serious voltage hysteresis and sluggish reaction kinetics, resulting in only partial Ni2+ oxidation at the 4.8 V cutoff. Second, a fraction of Ni2+ becomes involved in the formation of electrochemically inactive NiO-like phases during long-term cycling.
Reasoning source: Page 6, section 'The evolution of reaction mechanisms'
Scoring Rubric (total: 100 pts)
| Q | Type | Max | Question | Reference Answer | Scoring Criteria |
|---|---|---|---|---|---|
| q1 | identification | 20 | What candidate reference spectra or basis functions are needed to model the Ni K-edge XANES spectrum of this aged LR-NCM electrode at 4.8 V using linear combination fitting? | To model the Ni K-edge XANES spectrum of this aged LR-NCM electrode at 4.8 V, reference spectra for Ni(II) and Ni(IV) are required as basis functions. These specific oxidation states are expected because, despite being at a fully charged state of 4.8 V, the Ni species are not completely oxidized to Ni(IV) after 200 cycles. This incomplete oxidation occurs because a large overpotential in the aged cell causes sluggish reaction kinetics, preventing full Ni2+ oxidation at the voltage cutoff. Additionally, long-term cycling induces the formation of electrochemically inactive NiO-like phases, trapping a portion of the nickel as Ni(II). | Full credit for identifying Ni(II) and Ni(IV) as the necessary reference states for the fitting. |
| q2 | quantification | 30 | Estimate the phase fractions of the Ni species in this sample at the fully charged state (4.8 V) after 200 cycles. | At the fully charged state of 4.8 V after 200 cycles, the estimated phase fractions are 80% Ni(IV) and 20% Ni(II), with an uncertainty of 10%. These specific values result from the electrochemical degradation of the aged LR-NCM electrode during long-term cycling. Specifically, sluggish reaction kinetics and severe voltage hysteresis from a large overpotential prevent the complete oxidation of Ni2+ to Ni4+ at the 4.8 V cutoff. Furthermore, the residual 20% Ni(II) fraction is also attributed to the irreversible formation of electrochemically inactive NiO-like phases over the 200 cycles. | Full credit for estimating approximately 20% Ni(II) and 80% Ni(IV). Partial credit for values within 10% of these targets. |
| q3 | reasoning | 50 | Explain the physical and electrochemical reasoning for why the Ni species are not fully oxidized to 4+ at 4.8 V after 200 cycles, in contrast to the first cycle. | After 200 cycles, the average Ni oxidation state in the LR-NCM cathode remains lower than 4+ at the fully charged state of 4.8 V due to two main degradation mechanisms. First, the aged electrode develops a large overpotential that leads to serious voltage hysteresis and sluggish reaction kinetics, resulting in only partial oxidation of Ni2+ at the 4.8 V cutoff. Second, during long-term cycling, a fraction of the Ni2+ ions becomes trapped in newly formed, electrochemically inactive NiO-like phases. Consequently, these inactive phases and kinetic limitations prevent the complete conversion to Ni(IV) that would typically be expected at this high charging voltage. | Full credit for mentioning both key factors: 1) sluggish reaction kinetics/large overpotential leading to incomplete oxidation at the cutoff voltage, and 2) the formation of electrochemically inactive NiO-like phases (Ni2+) during long-term cycling. |
Review
#886
Li1.2Ni0.13Co0.13Mn0.54O2 (LR-NCM)
Mn K-edge
▶
LLM Prompt
Sample Information
Material: Li1.2Ni0.13Co0.13Mn0.54O2 (LR-NCM)
Electrode Type: cathode
Charge Discharge: OCV
Sample-Specific Conditions
- cycle state: pristine
- Pristine cathode material before electrochemical cycling
Measurement
We plan to measure the Mn K-edge XANES spectrum of this sample.
Questions
Based on all the information above:
1. What is the dominant local structural environment and oxidation state of Mn in the pristine LR-NCM material, and what structural evidence from the X-ray absorption data supports this assignment?
Ground Truth
Material: Li1.2Ni0.13Co0.13Mn0.54O2 (LR-NCM)
Measurement: Mn K-edge ex-situ XANES (transmission mode) at Advanced Photon Source
Fit method: not discussed in this paper
Source evidence: Page 5, 'Electronic and local structure characterized by X-ray absorption spectroscopy' section
Key reasoning: The absorption of pristine LR-NCM at the Mn K-edge along the white line is similar to that of Li2MnO3, indicating a valence close to 4+. EXAFS analysis shows the second shell has a decreased coordination number of Mn-M from six to three, which is due to the substitution of Mn by Li in the Li2MnO3-like domains. Mn in the pristine state is electrochemically inactive but acts as a stabilizer in the solid, gradually becoming active via Mn3+/4+ redox during the first few cycles.
Reasoning source: Page 3 (Revealing the reaction homogeneity) and Page 5 (Electronic and local structure characterized by X-ray absorption spectroscopy)
Scoring Rubric (total: 100 pts)
| Q | Type | Max | Question | Reference Answer | Scoring Criteria |
|---|---|---|---|---|---|
| q1 | identification | 100 | What is the dominant local structural environment and oxidation state of Mn in the pristine LR-NCM material, and what structural evidence from the X-ray absorption data supports this assignment? | In the pristine LR-NCM cathode material, the dominant local structural environment for Mn consists of Li2MnO3-like domains with an oxidation state close to 4+. This assignment is supported by the Mn K-edge XANES data, where the absorption profile along the white line closely matches that of a Li2MnO3 reference, and by EXAFS analysis showing a decreased coordination number in the second shell (Mn-M) from six to three. These specific structural and electronic features arise because the sample is in its pristine, uncycled state at open-circuit voltage, meaning the Mn remains electrochemically inactive and acts primarily as a structural stabilizer. Furthermore, the sample's specific Li-rich composition (Li1.2Ni0.13Co0.13Mn0.54O2) dictates the substitution of Mn by Li within these Li2MnO3-like domains, which directly causes the observed reduction in the Mn-M coordination number. | The answer must identify the presence of Li2MnO3-like domains and an oxidation state close to 4+. It must mention that the absorption along the white line is similar to Li2MnO3 and note the decreased Mn-M coordination number (from 6 to 3) due to Li substitution in the domains. |
Review
Reversing sintering effect of Ni particles on γ-Mo2N via strong metal support interaction
APS
Catalyst
Lili Lin et al.
DOI: 10.1038/s41467-021-27116-8
2 scenarios
▶
#887
Ni/γ-Mo2N
Ni K-edge
▶
LLM Prompt
Sample Information
Material: Ni/γ-Mo2N
Support: γ-Mo2N
Reaction Conditions: N2/H2 mixture (1:3 v/v), 480 °C
Sample-Specific Conditions
- Temperature: 480 °C
- 4%Ni-4nm/γ-Mo2N catalyst during temperature-programmed reduction
Measurement
We plan to measure the Ni K-edge XANES spectrum of this sample.
Questions
Based on all the information above:
1. Based on the reaction conditions (N2/H2 mixture at 480 °C), what is the expected dominant phase of the supported Ni species, and why?
2. What reference spectra should be used to evaluate the XANES spectrum of this sample to confirm its reduction state?
3. Describe the expected spectral shape of the Ni K-edge XANES for this sample at 480 °C and explain how it distinguishes itself from the state that emerges at higher temperatures (e.g., 590 °C).
Ground Truth
Material: Ni/γ-Mo2N
Measurement: Ni K-edge in-situ QXANES at ISS beamline of BNL
Fit method: qualitative comparison to standards
Phase fractions: (±10%)
| Phase | Fraction |
|---|---|
| metallic_nickel | 1.0 |
Fit basis (paper's reference spectra):
- Ni foil
- NiO
Source evidence: Page 3, right column; Figure 3a
Key reasoning: During temperature-programmed heating in a N2-H2 mixture, gradual reduction of the supported Ni species started at ~360 °C. By 480 °C, the sample was fully reduced to the Ni (0) state, as judged from the edge position and white-line profiles matching metallic standards.
Reasoning source: Page 3, right column, 'Observation of reverse sintering on Ni/γ-Mo2N model catalyst' section
Scoring Rubric (total: 100 pts)
| Q | Type | Max | Question | Reference Answer | Scoring Criteria |
|---|---|---|---|---|---|
| q1 | reasoning | 35 | Based on the reaction conditions (N2/H2 mixture at 480 °C), what is the expected dominant phase of the supported Ni species, and why? | The expected dominant phase of the supported Ni species is fully reduced metallic Ni (oxidation state 0), comprising 100% of the sample. This complete reduction is driven by the temperature-programmed heating of the 4%Ni-4nm/γ-Mo2N catalyst in a reducing N2/H2 (1:3 v/v) mixture. Under these specific conditions, the gradual reduction of the supported Ni species begins at approximately 360 °C. By the time the temperature reaches 480 °C, the reduction process is complete, resulting in a pure metallic Ni phase before any higher-temperature structural changes occur. | Full points for identifying fully reduced metallic Ni (Ni(0)) and explaining that the reductive N2/H2 atmosphere at 480 °C is sufficient to completely reduce the initial oxidized Ni species. |
| q2 | identification | 30 | What reference spectra should be used to evaluate the XANES spectrum of this sample to confirm its reduction state? | To evaluate the XANES spectrum and confirm the reduction state of this sample, Ni foil and NiO should be used as reference spectra. These specific standards are required because the 4%Ni-4nm/γ-Mo2N catalyst undergoes temperature-programmed reduction in a N2/H2 (1:3 v/v) mixture. The NiO standard accounts for any initial oxidized Ni species, while the Ni foil serves as the benchmark for the fully reduced metallic Ni(0) state. Given that the reducing conditions at 480 °C cause complete reduction of the Ni species (a process starting at ~360 °C), comparing the sample against these references confirms the expected 100% metallic nickel fraction. | Full points for mentioning Ni foil (or metallic Ni) and NiO as the primary standards for comparison. |
| q3 | spectral | 35 | Describe the expected spectral shape of the Ni K-edge XANES for this sample at 480 °C and explain how it distinguishes itself from the state that emerges at higher temperatures (e.g., 590 °C). | At 480 °C, the Ni K-edge XANES spectrum exhibits an edge position and white-line profile characteristic of fully reduced Ni(0), closely resembling the Ni foil standard. This spectral shape arises because the temperature-programmed reduction in the N2/H2 (1:3 v/v) mixture completely reduces the supported Ni species by 480 °C, yielding a standard metallic electronic structure. This spectrum distinguishes itself from the state that emerges at 590 °C, which displays an unusual increase in white-line intensity. The spectral difference occurs because heating to the higher temperature of 590 °C induces significant reverse sintering and electron synergistic effects, specifically causing charge transfer from the Ni to the γ-Mo2N support. | Full points for stating the spectrum resembles standard metallic Ni (Ni foil) with a typical Ni(0) edge position and white-line, and distinguishing it from the 590 °C state which exhibits an unusual white-line intensity increase due to strong metal-support interactions/electron synergistic effects. |
Review
#888
Ni/γ-Mo2N
Ni K-edge
▶
LLM Prompt
Sample Information
Material: Ni/γ-Mo2N
Support: γ-Mo2N
Reaction Conditions: N2/H2 mixture (1:3 v/v), 590 °C
Sample-Specific Conditions
- Temperature: 590 °C
- 2%Ni-4nm/γ-Mo2N catalyst after thermal treatment at 590 °C
Measurement
We plan to measure the Ni K-edge XANES spectrum of this sample.
Questions
Based on all the information above:
1. Based on the reaction conditions (590 °C in N2/H2), what is the dominant phase or structural state of the Ni species, and what physical process drives its formation?
2. Describe the expected spectral shape of this sample, specifically comparing its pre-edge, white-line, and post-edge oscillations to standard metallic Ni and NiO.
3. What is the physical origin of the unusually high white-line intensity observed in this sample compared to a metallic Ni foil?
Ground Truth
Material: Ni/γ-Mo2N
Measurement: Ni K-edge in-situ QXANES/XAFS in fluorescence mode
Fit method: qualitative comparison to standards
Phase fractions: (±10%)
| Phase | Fraction |
|---|---|
| under-coordinated raft-like Ni clusters on γ-Mo2N | 1.0 |
Fit basis (paper's reference spectra):
- Ni foil
- NiO
Source evidence: Fig 3a, Fig 4a, Pages 3-5
Key reasoning: The sample is fully reduced to a Ni(0) state by 480 °C. Upon further thermal treatment to 590 °C, the Ni particles undergo reverse sintering into under-coordinated raft-like clusters. This forms a special electronic and coordination structure with direct Ni-Mo-N interaction, completely different from metallic and oxide standards.
Reasoning source: Results section, Observation of reverse sintering on Ni/γ-Mo2N model catalyst, Pages 3-5
Scoring Rubric (total: 100 pts)
| Q | Type | Max | Question | Reference Answer | Scoring Criteria |
|---|---|---|---|---|---|
| q1 | reasoning | 35 | Based on the reaction conditions (590 °C in N2/H2), what is the dominant phase or structural state of the Ni species, and what physical process drives its formation? | The dominant structural state of the Ni species is 100% under-coordinated raft-like Ni clusters on the γ-Mo2N support. This specific state arises because the 2%Ni-4nm/γ-Mo2N catalyst is first fully reduced to a Ni(0) state by 480 °C in the N2/H2 mixture. Upon further thermal treatment to the final condition of 590 °C, the physical process of reverse sintering is driven to occur. This high-temperature treatment causes the Ni particles to disperse into these raft-like clusters, creating a special electronic and coordination structure characterized by direct Ni-Mo-N interactions. | Full credit for identifying under-coordinated raft-like Ni clusters (or a special Ni-Mo-N interaction phase) and explaining that it forms via a reverse sintering process driven by strong metal-support interactions at high temperatures. |
| q2 | spectral | 35 | Describe the expected spectral shape of this sample, specifically comparing its pre-edge, white-line, and post-edge oscillations to standard metallic Ni and NiO. | The expected Ni K-edge XANES spectrum exhibits a pre-edge feature that is slightly weaker than that of a metallic Ni standard, alongside an unusually high white-line intensity compared to Ni foil. Additionally, it displays distinct XANES oscillations at 8365 eV and higher energies that cannot be described by either bulk Ni(0) or NiO standards. These unique spectral features arise because the thermal treatment at 590 °C in N2/H2 induces reverse sintering, transforming the Ni particles into under-coordinated raft-like clusters. This structural evolution creates a special electronic and coordination environment with direct Ni-Mo-N interactions, resulting in a spectral shape completely distinct from conventional metallic and oxide references. | Full credit for mentioning a slightly weaker pre-edge than metallic Ni, a higher white-line intensity than Ni foil, and unique oscillations at 8365 eV and above that do not match Ni or NiO. |
| q3 | reasoning | 30 | What is the physical origin of the unusually high white-line intensity observed in this sample compared to a metallic Ni foil? | The unusually high white-line intensity compared to metallic Ni foil originates from an electron synergistic effect involving charge redistribution from the Ni species to the γ-Mo2N support. This electronic state is a direct result of the specific sample conditions, where thermal treatment at 590 °C in an N2/H2 mixture drives the reverse sintering of Ni particles. Consequently, the Ni forms under-coordinated raft-like clusters with direct Ni-Mo-N interactions. This unique coordination environment weakens the electron density on the Ni(0) atoms, which manifests spectroscopically as an enhanced white-line intensity distinct from bulk metallic Ni. | Full credit for explaining that the higher white-line intensity indicates weakened electron density at the Ni sites due to charge redistribution (or electron synergistic effect) from Ni to the molybdenum nitride support. |
Review
Coordination environment tuning of nickel sites by oxyanions to optimize methanol electro-oxidation activity
APS
Catalyst
Shanlin Li et al.
DOI: 10.1038/s41467-022-30670-4
2 scenarios
▶
#889
NiPx
Ni K
▶
LLM Prompt
Sample Information
Material: NiPx
Support: nickel foam
Sample-Specific Conditions
- state: as-prepared
- Ni-metalloid prepared by anionization of nickel foam
Measurement
We plan to measure the Ni K XANES spectrum of this sample.
Questions
Based on all the information above:
1. Based on the preparation method (anionization of nickel foam with sodium hypophosphite at 400 °C), what is the expected dominant compound/phase for the as-prepared NiPx sample?
2. How does the Ni K-edge XANES absorption threshold of this as-prepared NiPx sample compare to its electrochemically reconstructed counterpart (NiPx-R), and what does this indicate about its oxidation state?
3. What specific structural feature in the Fourier-transformed EXAFS (FT-EXAFS) spectrum would confirm the local coordination environment of this as-prepared NiPx sample?
Ground Truth
Material: NiPx
Measurement: Ni K-edge, X-ray fluorescence mode, APS beamline 9-BM
Fit method: not reported
Phase fractions:
| Phase | Fraction |
|---|---|
| Ni2P | 1.0 |
Source evidence: Page 2, Figure 2d; Page 3, Figure 3a-b
Key reasoning: The as-prepared NiPx sample was synthesized by anionization of nickel foam with sodium hypophosphite at 400 °C. XRD patterns confirm the high crystallinity of the as-obtained NiPx, with all peaks well assigned to the Ni foam substrate and Ni2P (PDF: 01-074-1385). FT-EXAFS spectra show a single peak around 1.8 Å assigned to Ni-P bonds in Ni2P.
Reasoning source: Results section, Preparation and structural characterizations of NiTx-R, Page 2; Electronic structures and chemical environments of NiTx and NiTx-R, Page 3
Scoring Rubric (total: 100 pts)
| Q | Type | Max | Question | Reference Answer | Scoring Criteria |
|---|---|---|---|---|---|
| q1 | identification | 30 | Based on the preparation method (anionization of nickel foam with sodium hypophosphite at 400 °C), what is the expected dominant compound/phase for the as-prepared NiPx sample? | The expected dominant phase for the as-prepared NiPx sample is Ni2P, which accounts for a 1.0 fraction of the active material. This specific phase arises because the sample is synthesized via the anionization of a nickel foam substrate using sodium hypophosphite at 400 °C. Under these thermal conditions, the phosphorus source reacts with the metallic nickel to form a highly crystalline Ni2P structure. This structural assignment is confirmed by XRD patterns matching the Ni2P reference (PDF: 01-074-1385) alongside the underlying Ni foam substrate. | Award 30 points for correctly identifying Ni2P as the dominant phase. |
| q2 | spectral | 40 | How does the Ni K-edge XANES absorption threshold of this as-prepared NiPx sample compare to its electrochemically reconstructed counterpart (NiPx-R), and what does this indicate about its oxidation state? | The Ni K-edge XANES absorption threshold of the as-prepared NiPx sample occurs at a lower energy (< 8340 eV) compared to its electrochemically reconstructed counterpart, NiPx-R, which has a threshold at approximately 8340 eV. This lower edge position indicates a more metallic, lower oxidation state (metallic Ni-P) in the as-prepared material. This electronic state is a direct result of the initial anionization synthesis on the nickel foam, which forms the pristine Ni2P phase. Once the sample undergoes electrochemical reconstruction to form NiPx-R, the surface oxidizes, which consequently shifts the absorption threshold to higher energies. | Award 20 points for stating the absorption threshold is at a lower energy (< 8340 eV) than the reconstructed sample. Award 20 points for indicating it possesses a more metallic (Ni-P) oxidation state. |
| q3 | spectral | 30 | What specific structural feature in the Fourier-transformed EXAFS (FT-EXAFS) spectrum would confirm the local coordination environment of this as-prepared NiPx sample? | The FT-EXAFS spectrum of the as-prepared NiPx sample is characterized by a dominant single peak located at approximately 1.8 Å. This specific spectral feature corresponds to the Ni-P bonds characteristic of the highly crystalline Ni2P phase. This local coordination environment is expected because the sample was prepared by the thermal anionization of nickel foam with sodium hypophosphite at 400 °C, which drives the formation of pure Ni-P bonds. Furthermore, because it is in the as-prepared state, it distinctly lacks the Ni-O/P or Ni-Ni coordination peaks that only emerge after the material undergoes electrochemical surface reconstruction. | Award 30 points for mentioning a single dominant peak around 1.8 Å assigned to Ni-P bonds. |
Review
#890
NiOOH-POx
Ni K
▶
LLM Prompt
Sample Information
Material: NiOOH-POx
Support: nickel foam
Sample-Specific Conditions
- state: reconstructed
- Electrochemically reconstructed NiPx
Measurement
We plan to measure the Ni K XANES spectrum of this sample.
Questions
Based on all the information above:
1. What is the expected dominant phase for the electrochemically reconstructed NiPx sample, and what is the physical reasoning for its formation?
2. Describe the expected changes in the Ni K-edge XANES spectral shape and edge position for this reconstructed sample compared to the pristine NiPx precursor.
3. What does the shift in the XANES absorption threshold indicate about the oxidation state of Ni in the reconstructed sample?
Ground Truth
Material: NiOOH-POx
Measurement: Ni K-edge X-ray fluorescence mode at APS beamline 9-BM
Fit method: not reported for XANES
Phase fractions:
| Phase | Fraction |
|---|---|
| NiOOH-POx | 1.0 |
Source evidence: Figure 3a and Page 3 text
Key reasoning: Electrochemical oxidation (surface reconstruction) of NiPx leads to a shift of the Ni K-edge absorption threshold to higher energy (~8340 eV). This indicates the surface depletion of the metalloid phosphide and transformation into an amorphous nickel oxyhydroxide coordinated with residual phosphate oxyanions (NiOOH-POx).
Reasoning source: Page 3, 'Electronic structures and chemical environments of NiTx and NiTx-R'
Scoring Rubric (total: 100 pts)
| Q | Type | Max | Question | Reference Answer | Scoring Criteria |
|---|---|---|---|---|---|
| q1 | reasoning | 35 | What is the expected dominant phase for the electrochemically reconstructed NiPx sample, and what is the physical reasoning for its formation? | The expected dominant phase for the electrochemically reconstructed NiPx sample is NiOOH-POx, which accounts for a fraction of 1.0. This phase forms because the electrochemical reconstruction process induces surface oxidation of the pristine NiPx precursor. Specifically, this electrochemical oxidation leads to the surface depletion of the metalloid phosphide. Consequently, the material transforms into an amorphous nickel oxyhydroxide that remains coordinated with residual phosphate oxyanions, resulting in the final NiOOH-POx phase. | Full points if the answer identifies NiOOH-POx (or phosphate-coordinated nickel oxyhydroxide) and explains that electrochemical oxidation causes surface reconstruction/depletion of the phosphide into an oxyhydroxide. |
| q2 | spectral | 35 | Describe the expected changes in the Ni K-edge XANES spectral shape and edge position for this reconstructed sample compared to the pristine NiPx precursor. | The Ni K-edge XANES spectrum for the reconstructed sample will exhibit an absorption threshold shifted to a higher energy of approximately 8340 eV compared to the pristine NiPx precursor. This spectral shift occurs because the sample undergoes electrochemical reconstruction, which oxidizes the material to a Ni2+/Ni3+ state. The electrochemical oxidation causes the surface depletion of the metalloid phosphide and its transformation into an amorphous nickel oxyhydroxide coordinated with residual phosphate oxyanions (NiOOH-POx). The higher oxidation state of the newly formed NiOOH-POx phase directly produces the observed shift of the absorption edge to higher energies. | Full points if the answer mentions a shift of the absorption threshold to higher energy (specifically around ~8340 eV) compared to the pristine precursor. |
| q3 | reasoning | 30 | What does the shift in the XANES absorption threshold indicate about the oxidation state of Ni in the reconstructed sample? | The shift of the XANES absorption threshold to a higher energy (~8340 eV) indicates that the nickel in the reconstructed sample is in an oxidized state, specifically Ni2+/Ni3+. This oxidized state arises because the pristine NiPx precursor undergoes electrochemical oxidation during the reconstruction process. Under these electrochemical conditions, the metalloid phosphide is depleted from the surface, transforming the material into an amorphous nickel oxyhydroxide coordinated with residual phosphate oxyanions (NiOOH-POx). Therefore, the higher energy absorption threshold directly reflects the increased oxidation state resulting from this structural and chemical transformation. | Full points if the answer correctly states that the shift to higher energy indicates an oxidized state (Ni2+/Ni3+) due to the transformation from metalloid phosphide to oxyhydroxide. |
Review
Enhanced oxygen evolution over dual corner-shared cobalt tetrahedra
APS
Catalyst
Yubo Chen et al.
DOI: 10.1038/s41467-022-33000-w
2 scenarios
▶
#891
YBaCo4O7
Co K-edge
▶
LLM Prompt
Sample Information
Material: YBaCo4O7
Sample-Specific Conditions
- pristine state: as-prepared
- As-prepared YBaCo4O7 catalyst powder
Measurement
We plan to measure the Co K-edge XANES spectrum of this sample.
Questions
Based on all the information above:
1. What is the dominant local coordination geometry and the expected average oxidation state of Cobalt in the as-prepared YBaCo4O7 sample?
2. How does the Co K-edge XANES edge position of the as-prepared YBaCo4O7 compare to the sample after electrochemical oxidation, and what physical change does this reflect?
Ground Truth
Material: YBaCo4O7
Measurement: Co K-edge XANES, ex-situ, 9BM of Advanced Photon Source and Singapore Synchrotron Light Source XAFCA beamline
Fit method: Not applicable (direct spectral comparison)
Phase fractions:
| Phase | Fraction |
|---|---|
| YBaCo4O7 | 1.0 |
Source evidence: Figure 3e (Co K-edge XANES), Page 2 and Page 4 text
Key reasoning: The as-prepared YBaCo4O7 shows high phase purity with dominant corner-shared CoO4 tetrahedra and an expected average Co valence state of +2.25. Because of slight oxygen nonstoichiometry (δ ≈ 0.18) in the as-prepared state, a small fraction of Co atoms (~4%) are in an octahedral geometry. The Co K-edge XANES spectrum of this pristine state serves as a baseline, which exhibits a lower edge energy compared to electrochemically oxidized samples.
Reasoning source: Results and discussion (Cobalt tetrahedra over YBC4 surface, Page 2; Enhanced stability by the flexible structure, Page 4; OER mechanism over cobalt tetrahedra, Page 4)
Scoring Rubric (total: 100 pts)
| Q | Type | Max | Question | Reference Answer | Scoring Criteria |
|---|---|---|---|---|---|
| q1 | reasoning | 43 | What is the dominant local coordination geometry and the expected average oxidation state of Cobalt in the as-prepared YBaCo4O7 sample? | In the pristine, as-prepared YBaCo4O7 catalyst powder, the dominant local coordination geometry of Cobalt is corner-shared CoO4 tetrahedra, with an expected average oxidation state of +2.25. This specific geometry and valence arise directly from the high phase purity of the as-prepared material prior to any electrochemical testing. Furthermore, due to a slight oxygen nonstoichiometry (δ ≈ 0.18) inherent to this pristine state, a minor fraction of Co atoms (~4%) adopt an octahedral geometry. Consequently, the sample consists entirely of the YBaCo4O7 phase (fraction 1.0) reflecting this predominantly tetrahedral baseline structure. | The answer must identify that the dominant geometry is tetrahedral (corner-shared CoO4) and state the expected average oxidation state is +2.25. |
| q2 | spectral | 57 | How does the Co K-edge XANES edge position of the as-prepared YBaCo4O7 compare to the sample after electrochemical oxidation, and what physical change does this reflect? | The Co K-edge XANES edge position of the as-prepared YBaCo4O7 is located at a lower energy (shifted left) compared to samples that have undergone electrochemical oxidation. This spectral feature arises because the pristine catalyst powder serves as a less-oxidized baseline, possessing an initial average Co valence state of +2.25 within a dominant tetrahedral geometry. When the material is subjected to electrochemical oxidation (such as at 1.6 V, 1.75 V, and 2.0 V during the oxygen evolution reaction), the Co oxidation state increases, which drives the absorption edge to higher energies (a right shift). Thus, the lower edge energy of the as-prepared sample directly reflects its lower initial oxidation state prior to any electrochemical testing. | The answer must state that the as-prepared sample has a lower edge energy (or is shifted to the left) compared to the oxidized samples, which reflects a lower initial oxidation state of Co prior to the oxygen evolution reaction. |
Review
#892
YBaCo4O7+d
Co K-edge
▶
LLM Prompt
Sample Information
Material: YBaCo4O7+d
Support: graphite paper
Reaction Conditions: 0.1 M KOH
Sample-Specific Conditions
- oxidation potential: 1.6 V
- YBaCo4O7 catalyst after electrochemical oxidation
Measurement
We plan to measure the Co K-edge XANES spectrum of this sample.
Questions
Based on all the information above:
1. What is the expected change in the Co K-edge XANES spectrum of the YBaCo4O7 catalyst after electrochemical oxidation at 1.6 V compared to the as-prepared sample?
2. Based on the electrochemical oxidation conditions (1.6 V for 500 mins), explain the structural and chemical reasoning for the observed changes in the Co K-edge XANES spectrum.
3. Does the electrochemical oxidation at 1.6 V cause the YBaCo4O7 catalyst to undergo surface amorphization or phase transformation into a different crystal structure? Justify your answer based on the expected phase composition.
Ground Truth
Material: YBaCo4O7+d
Measurement: Co K-edge XANES, transmission at Advanced Photon Source 9BM / Singapore Synchrotron Light Source XAFCA
Fit method: Not reported (qualitative comparison of edge shifts)
Phase fractions:
| Phase | Fraction |
|---|---|
| YBaCo4O7+d | 1.0 |
Source evidence: Figure 3e and Page 4 text
Key reasoning: The XANES spectra of the Co K-edge show a right shift for the electrochemically oxidized samples, indicating the oxidation of Co during OER. The material remains highly crystallized but undergoes lattice contraction and increased distortion of CoO4 tetrahedra to accommodate oxygen intercalation, avoiding the structural amorphization seen in other catalysts.
Reasoning source: Page 4, 'Enhanced stability by the flexible structure' section
Scoring Rubric (total: 100 pts)
| Q | Type | Max | Question | Reference Answer | Scoring Criteria |
|---|---|---|---|---|---|
| q1 | prediction | 30 | What is the expected change in the Co K-edge XANES spectrum of the YBaCo4O7 catalyst after electrochemical oxidation at 1.6 V compared to the as-prepared sample? | The Co K-edge XANES spectrum is expected to exhibit a distinct shift to higher energy (a right shift) compared to the as-prepared sample, while maintaining its overall spectral shape. This right shift occurs because the applied electrochemical oxidation potential of 1.6 V in 0.1 M KOH drives the oxidation of Co to a higher valence state (greater than the initial +2.25) during the oxygen evolution reaction. The preservation of the overall spectral shape indicates that the material accommodates oxygen intercalation through lattice contraction and CoO4 tetrahedral distortion rather than undergoing structural amorphization. Therefore, the spectrum reflects an oxidized Co state within an intact, highly crystalline YBaCo4O7+d framework. | The answer must state that the absorption edge shifts to higher energy (a right shift) due to the oxidation of Co during the oxygen evolution reaction. |
| q2 | reasoning | 40 | Based on the electrochemical oxidation conditions (1.6 V for 500 mins), explain the structural and chemical reasoning for the observed changes in the Co K-edge XANES spectrum. | The observed right shift in the Co K-edge XANES spectrum is chemically driven by the oxidation of Co species during the oxygen evolution reaction at the applied 1.6 V potential in 0.1 M KOH. Structurally, the YBaCo4O7+d catalyst accommodates this electrochemical oxidation through oxygen intercalation, which causes lattice contraction and increased distortion of the CoO4 tetrahedra. Because of this flexible structure, the material avoids the structural amorphization typically seen in other catalysts under similar OER conditions. Consequently, the XANES spectrum reflects a higher Co oxidation state while retaining the characteristic spectral shape of the original highly crystallized framework. | The answer must explain that Co oxidizes during OER, which induces structural evolution including lattice contraction, oxygen intercalation, and increased distortion of the CoO4 tetrahedra. |
| q3 | identification | 30 | Does the electrochemical oxidation at 1.6 V cause the YBaCo4O7 catalyst to undergo surface amorphization or phase transformation into a different crystal structure? Justify your answer based on the expected phase composition. | No, the electrochemical oxidation at 1.6 V does not cause the YBaCo4O7 catalyst to undergo surface amorphization or phase transformation into a different crystal structure. The expected phase composition remains 100% (fraction of 1.0) highly crystallized YBaCo4O7+d. Under the applied 1.6 V potential in 0.1 M KOH, the catalyst's flexible structure accommodates oxygen intercalation through lattice contraction and increased distortion of the CoO4 tetrahedra. This structural flexibility prevents the amorphization seen in other OER catalysts, allowing the material to maintain its original crystalline framework while supporting the oxidation of Co. | The answer must state that the material does NOT amorphize or transform into a new phase; it remains a highly crystallized pure phase (YBaCo4O7+d) that accommodates stress through flexible structural rearrangement (lattice contraction). |
Review
In situ X-ray spectroscopies beyond conventional X-ray absorption spectroscopy on deciphering dynamic configuration of electrocatalysts
BNL-NSLS-II-8-ID
Synthesis
Jiali Wang et al.
DOI: 10.1038/s41467-023-42370-8
4 scenarios
▶
#893
Cu-based mixture
Cu Multiple
▶
LLM Prompt
Sample Information
Material: Cu-based mixture
Sample-Specific Conditions
- Demonstration sample: N/A
- A generic Cu-based mixture sample used to demonstrate linear combination fitting methodology.
Measurement
We plan to measure the Cu Multiple XANES spectrum of this sample.
Questions
Based on all the information above:
1. Identify the candidate reference spectra needed to perform a linear combination fitting (LCF) analysis on this generic Cu-based mixture.
2. Estimate the relative phase fractions of the components in this Cu-based mixture.
3. Explain the analytical reasoning for why linear combination fitting (LCF) is preferred over simple edge-position extraction methods (such as first derivative or half-height intensity) for determining the oxidation state of this specific sample.
Ground Truth
Material: Cu-based mixture
Measurement: Cu K-edge XANES
Fit method: Linear combination fitting (LCF)
Phase fractions:
| Phase | Fraction |
|---|---|
| CuO | 0.458 |
| Cu2O | 0.336 |
| Cu foil | 0.206 |
Fit basis (paper's reference spectra):
- CuO
- Cu2O
- Cu foil
Source evidence: Figure 1e, page 3
Key reasoning: For a non-uniform system that includes several components, simple edge-position methods (like first derivative or half-height intensity) may fail to precisely determine the oxidation state. By fitting the experimental XANES spectrum with a linear combination of spectra corresponding to known reference components, the relative amount of each specific component can be quantitatively determined, and multiple scattering contributions are well considered.
Reasoning source: Section 'Data analysis on XAS spectra', page 3
Scoring Rubric (total: 100 pts)
| Q | Type | Max | Question | Reference Answer | Scoring Criteria |
|---|---|---|---|---|---|
| q1 | identification | 30 | Identify the candidate reference spectra needed to perform a linear combination fitting (LCF) analysis on this generic Cu-based mixture. | The candidate reference spectra required to perform the linear combination fitting (LCF) analysis are CuO, Cu2O, and Cu foil. These specific phases are expected because the sample is a generic Cu-based mixture designed to demonstrate LCF methodology on a non-uniform system containing multiple oxidation states. For such non-uniform systems, simple edge-position methods fail to precisely determine the oxidation state. By using these known reference components, the experimental Cu K-edge XANES spectrum can be accurately fitted to quantitatively determine the relative amount of each specific component while properly considering multiple scattering contributions. | Award full points for correctly identifying the three necessary reference spectra: CuO (Cu2+), Cu2O (Cu+), and Cu foil / metallic Cu (Cu0). |
| q2 | quantification | 30 | Estimate the relative phase fractions of the components in this Cu-based mixture. | The relative phase fractions for this Cu-based mixture are 0.458 for CuO, 0.336 for Cu2O, and 0.206 for Cu foil. These specific values are obtained because the sample is a generic mixture used to demonstrate linear combination fitting (LCF) methodology on non-uniform systems. In such non-uniform systems with several components, simple edge-position methods fail to precisely determine the oxidation state. Therefore, fitting the experimental Cu K-edge XANES spectrum with a linear combination of known reference spectra allows these exact relative amounts to be quantitatively determined while properly accounting for multiple scattering contributions. | Award full points if the predicted fractions are within ±10% of the ground truth values: CuO (~45.8%), Cu2O (~33.6%), and metallic Cu (~20.6%). Partial credit for identifying the correct dominant phase (CuO). |
| q3 | reasoning | 40 | Explain the analytical reasoning for why linear combination fitting (LCF) is preferred over simple edge-position extraction methods (such as first derivative or half-height intensity) for determining the oxidation state of this specific sample. | Linear combination fitting (LCF) is preferred because this sample is a generic, non-uniform Cu-based mixture containing several distinct components. For a non-uniform system of this nature, simple edge-position methods, such as the first derivative or half-height intensity, may fail to precisely determine the oxidation state. By fitting the experimental Cu K-edge XANES spectrum with a linear combination of spectra corresponding to known reference components (CuO, Cu2O, and Cu foil), the relative amount of each specific component can be quantitatively determined. Additionally, this approach is necessary because it ensures that multiple scattering contributions within the complex mixture are well considered. | Award full points for explaining that the sample is a non-uniform, multi-component system where simple edge methods fail to precisely determine the oxidation state. The answer should mention that LCF allows for the quantitative determination of relative amounts of each component by using known reference spectra. |
Review
#894
Electro-redeposited Cu
Cu Multiple
▶
LLM Prompt
Sample Information
Material: Electro-redeposited Cu
Method: in situ electrochemical reduction
Precursors: sol-gel copper oxychloride (Cu2(OH)3Cl)
Duration Hours: 0.033
Atmosphere: CO2
Post Treatment: In situ CO2RR electrocatalysis at -1.2 V vs RHE for 2 min
Sample-Specific Conditions
- Electrolysis time: 2 min
- Electro-redeposited Cu catalyst measured in situ during CO2 electroreduction after 2 minutes.
Preparation
- The sol-gel copper oxychloride (Cu2(OH)3Cl) precursor was drop-casted onto a silicon nitride window coated with Ti (10 nm) and Au (30 nm) which served as the working electrode. The active electro-redeposited (ERD) Cu catalyst was formed in situ by applying a constant potential of -1.2 V vs RHE in CO2-saturated 0.1 M KHCO3 electrolyte. The in situ XAS measurement was taken after 2 minutes of CO2 electroreduction.
Measurement
We plan to measure the Cu Multiple XANES spectrum of this sample.
Questions
Based on all the information above:
1. What candidate reference spectra or oxidation states are required as a basis to fit the in situ Cu L3-edge XAS spectra of this electro-redeposited Cu catalyst during CO2RR?
2. Estimate the phase fractions of the surface Cu species after 2 minutes of CO2 electroreduction at -1.2 V vs RHE.
3. Explain the physical significance of the observed Cu+ fraction during the CO2 electroreduction process and why soft X-ray XAS is particularly suited for this observation.
Ground Truth
Material: Electro-redeposited Cu catalyst
Measurement: in situ soft X-ray XAS at the Cu L3-edge
Fit method: Linear combination analysis (LCF)
Phase fractions:
| Phase | Fraction |
|---|---|
| Cu(I) | 0.84 |
| Cu(0) | 0.16 |
| Cu(II) | 0.0 |
Fit basis (paper's reference spectra):
- Cu(0)
- Cu(I)
- Cu(II)
Source evidence: Page 15 (Figure 8g, h) and Page 16 (text)
Key reasoning: Soft X-ray XAS is highly surface-sensitive, allowing it to probe the dynamic surface oxidation state of the electro-redeposited Cu oxides during CO2RR. Linear combination analysis of the in situ Cu L-edge XAS spectra reveals that the surface Cu species consist of 84% Cu+ in the initial 2 minutes of electrocatalysis at -1.2 V versus RHE. This Cu+ fraction is suggested to be responsible for the efficient selective conversion of CO2 to ethylene.
Reasoning source: Page 16, Section 'Complementary soft X-ray spectroscopy'
Scoring Rubric (total: 100 pts)
| Q | Type | Max | Question | Reference Answer | Scoring Criteria |
|---|---|---|---|---|---|
| q1 | identification | 20 | What candidate reference spectra or oxidation states are required as a basis to fit the in situ Cu L3-edge XAS spectra of this electro-redeposited Cu catalyst during CO2RR? | The required basis spectra for linear combination fitting are Cu(0), Cu(I), and Cu(II). These specific reference states are necessary because the sample originates from a Cu(II)-containing precursor (sol-gel copper oxychloride) that undergoes in situ electrochemical reduction. As a constant potential of -1.2 V vs RHE is applied in the CO2-saturated electrolyte, the precursor dynamically reduces to form the active electro-redeposited Cu catalyst. Consequently, a mixture of the initial Cu(II), intermediate Cu(I), and fully reduced Cu(0) states is expected at the surface, requiring all three references to accurately model the dynamic surface oxidation state during CO2RR. | Full points for identifying Cu+ (cuprite) and Cu0 (metallic copper) as the necessary reference states. |
| q2 | quantification | 40 | Estimate the phase fractions of the surface Cu species after 2 minutes of CO2 electroreduction at -1.2 V vs RHE. | After 2 minutes of CO2 electroreduction at -1.2 V vs RHE, the surface Cu species consist of 84% Cu(I), 16% Cu(0), and 0% Cu(II). These specific values result from the rapid electrochemical reduction of the copper oxychloride precursor, which completely consumes the initial Cu(II) phase within the brief 2-minute timeframe. Despite the strongly reducing potential, the highly surface-sensitive soft X-ray measurement shows that the surface does not fully convert to metallic Cu(0). Instead, a dominant 84% fraction of Cu(I) is dynamically stabilized at the surface under these in situ conditions, which is suggested to drive the selective conversion of CO2 to ethylene. | Full points for estimating approximately 84% Cu+ and 16% Cu0. Deduct points proportionally for deviations greater than 10%. |
| q3 | reasoning | 40 | Explain the physical significance of the observed Cu+ fraction during the CO2 electroreduction process and why soft X-ray XAS is particularly suited for this observation. | The observed 84% Cu+ fraction is physically significant because it is suggested to be responsible for the efficient, selective conversion of CO2 to ethylene during electrocatalysis. This high concentration of Cu+ arises dynamically from the in situ electrochemical reduction of the copper oxychloride precursor at -1.2 V vs RHE over the initial 2 minutes. Soft X-ray XAS at the Cu L3-edge is uniquely suited for this observation due to its high surface sensitivity. This allows the technique to accurately probe the dynamic surface oxidation states of the electro-redeposited Cu oxides directly at the active interface, successfully capturing the critical Cu+ intermediate during the CO2RR process. | Full points for explaining that the Cu+ species is responsible for efficient CO2-to-ethylene conversion, and noting that soft X-ray XAS is used because it is highly surface-sensitive, allowing the detection of dynamic surface oxidation states. |
Review
#895
Electro-redeposited Cu
Cu Multiple
▶
LLM Prompt
Sample Information
Material: Electro-redeposited Cu
Method: Electro-redeposition
Precursors: sol-gel copper oxychloride (Cu2(OH)3Cl)
Temperature C: 25
Duration Hours: 0.2
Atmosphere: CO2
Post Treatment: In situ CO2RR electrocatalysis at -1.2 V vs RHE for 12 min
Sample-Specific Conditions
- Electrolysis time: 12 min
- Electro-redeposited Cu catalyst measured in situ during CO2 electroreduction after 12 minutes.
Preparation
- The sol-gel precursor Cu2(OH)3Cl was prepared using an epoxide gelation synthesis. For in situ XAS, 20 μL of catalyst ink was drop-casted onto silicon nitride membrane windows coated with Ti (10 nm) and Au (30 nm) which served as the working electrode. The active electro-redeposited (ERD) Cu catalyst was formed in situ by reducing the sol-gel at -1.2 V vs RHE in CO2-saturated 0.1 M KHCO3 electrolyte.
Measurement
We plan to measure the Cu Multiple XANES spectrum of this sample.
Questions
Based on all the information above:
1. What candidate reference spectra are required as a basis for linear combination analysis of the Cu L3-edge XAS data for this electro-redeposited catalyst under CO2RR conditions?
2. Estimate the phase fractions of the Cu species present on the catalyst surface after 12 minutes of in situ CO2 electroreduction at -1.2 V vs RHE.
3. Explain the dynamic evolution of the catalyst's surface oxidation state leading up to this 12-minute mark, and describe the proposed catalytic significance of this specific phase composition.
Ground Truth
Material: Electro-redeposited Cu
Measurement: in situ soft X-ray XAS at the Cu L3-edge
Fit method: Linear combination analysis
Phase fractions:
| Phase | Fraction |
|---|---|
| Cu(I) | 0.77 |
| Cu(0) | 0.23 |
| Cu(II) | 0.0 |
Fit basis (paper's reference spectra):
- Cu(0)
- Cu(I)
- Cu(II)
Source evidence: Page 16, text and Figure 8g, 8h
Key reasoning: During in situ CO2 electroreduction at -1.2 V vs RHE, the electro-redeposited Cu catalyst undergoes dynamic surface reduction. Linear combination analysis of the Cu L-edge XAS spectra reveals that the initial 84% Cu+ fraction at 2 minutes decreases to 77% after an additional 10 minutes (12 minutes total). This indicates a gradual reduction process where a significant portion of Cu+ species remains stable alongside metallic Cu0, a coexisting state that is suggested to be responsible for efficient CO2-to-ethylene conversion.
Reasoning source: Page 16, section 'Complementary soft X-ray spectroscopy'
Scoring Rubric (total: 100 pts)
| Q | Type | Max | Question | Reference Answer | Scoring Criteria |
|---|---|---|---|---|---|
| q1 | identification | 20 | What candidate reference spectra are required as a basis for linear combination analysis of the Cu L3-edge XAS data for this electro-redeposited catalyst under CO2RR conditions? | The required reference spectra for linear combination analysis of the Cu L3-edge XAS data are Cu(0), Cu(I), and Cu(II). These specific references are necessary because the catalyst is formed by reducing a Cu(II)-containing sol-gel precursor (copper oxychloride) in situ at -1.2 V vs RHE in a CO2-saturated electrolyte. Under these electrocatalytic conditions at 25 °C, the precursor undergoes a dynamic surface reduction process. Consequently, the basis set must account for the initial Cu(II) state, the intermediate Cu(I) species, and the fully reduced metallic Cu(0) state that evolve during the 12-minute CO2RR reaction. | Full points for identifying Cu+ (cuprite/Cu2O) and Cu0 (metallic copper) as the necessary reference spectra. |
| q2 | quantification | 40 | Estimate the phase fractions of the Cu species present on the catalyst surface after 12 minutes of in situ CO2 electroreduction at -1.2 V vs RHE. | After 12 minutes of in situ CO2 electroreduction, the catalyst surface consists of 77% Cu(I), 23% Cu(0), and 0% Cu(II). These specific fractions arise because the electro-redeposited Cu catalyst undergoes a gradual, dynamic surface reduction when held at -1.2 V vs RHE in the CO2-saturated 0.1 M KHCO3 electrolyte. While the initial Cu(II) from the copper oxychloride precursor is fully reduced, the reduction from Cu(I) to Cu(0) is incomplete over the 12-minute duration at 25 °C. As a result, a significant portion of Cu(I) remains stable and coexists with the newly formed metallic Cu(0) under these specific operating conditions. | Full points for estimating approximately 77% Cu+ (cuprite) and 23% Cu0 (metallic copper). Deduct points proportionally for estimates deviating by more than 10%. |
| q3 | reasoning | 40 | Explain the dynamic evolution of the catalyst's surface oxidation state leading up to this 12-minute mark, and describe the proposed catalytic significance of this specific phase composition. | During the in situ CO2 electroreduction at -1.2 V vs RHE, the electro-redeposited Cu catalyst undergoes a gradual surface reduction from its initial state. Specifically, the Cu(I) fraction decreases from an initial 84% at the 2-minute mark to 77% after a total of 12 minutes, with the remainder converting to metallic Cu(0). This dynamic evolution occurs because the applied cathodic potential in the CO2-saturated electrolyte continuously drives the reduction of the copper oxychloride-derived precursor at 25 °C. The resulting stable coexistence of 77% Cu(I) and 23% Cu(0) is highly significant, as this specific mixed-valence state is suggested to be responsible for the catalyst's efficient conversion of CO2 to ethylene. | Full points for explaining the gradual reduction from an initial higher Cu+ state (e.g., 84% at 2 min) down to 77% at 12 min, and noting that the coexisting Cu+/Cu0 species are responsible for efficient CO2-to-ethylene conversion. |
Review
#896
Electro-redeposited Cu
Cu Multiple
▶
LLM Prompt
Sample Information
Material: Electro-redeposited Cu
Method: electro-redeposition
Precursors: sol-gel copper oxychloride (Cu2(OH)3Cl)
Temperature C: 25
Duration Hours: 1.0
Atmosphere: CO2
Post Treatment: In situ CO2RR electrocatalysis at -1.2 V vs RHE for 60 min
Sample-Specific Conditions
- Electrolysis time: 60 min
- Electro-redeposited Cu catalyst measured in situ during CO2 electroreduction after 60 minutes.
Preparation
- Sol-gel copper oxychloride (Cu2(OH)3Cl) precursor ink was drop-casted onto a substrate and dried in air. The active electro-redeposited (ERD) Cu catalyst was formed and measured in situ by applying a constant potential of -1.2 V vs RHE in CO2-saturated 0.1 M KHCO3 electrolyte for 60 minutes.
Measurement
We plan to measure the Cu Multiple XANES spectrum of this sample.
Questions
Based on all the information above:
1. What candidate reference spectra are needed to perform a linear combination analysis of the surface species on this electro-redeposited Cu catalyst during CO2RR?
2. Based on the sample conditions (in situ CO2RR at -1.2 V vs RHE for 60 minutes), estimate the phase fractions of the surface Cu species.
3. Explain the physical and catalytic significance of the phase composition present after 1 hour of CO2RR at -1.2 V vs RHE. Why is this specific surface composition important?
Ground Truth
Material: Electro-redeposited Cu catalyst
Measurement: in situ soft X-ray XAS at the Cu L3-edge
Fit method: Linear combination analysis
Phase fractions:
| Phase | Fraction |
|---|---|
| Cu(I) | 0.23 |
| Cu(0) | 0.77 |
Fit basis (paper's reference spectra):
- Cu(0)
- Cu(I)
- Cu(II)
Source evidence: Page 16 text and Figure 8h
Key reasoning: Linear combination analysis on in situ Cu L-edge XAS spectra shows that the surface Cu species initially consist of 84% Cu+ at 2 min, decreasing to 77% after 10 min. After 1 h of CO2RR electrocatalysis at -1.2 V versus RHE, 23% of Cu+ species still remain, with the balance being Cu(0). This residual surface Cu+ is suggested to be responsible for the efficient CO2-to-ethylene conversion. The use of soft X-ray L-edge XAS is critical here as it is surface-sensitive compared to hard X-rays, allowing the dynamic surface oxidation state to be accurately probed.
Reasoning source: Page 16, section 'Complementary soft X-ray spectroscopy'
Scoring Rubric (total: 100 pts)
| Q | Type | Max | Question | Reference Answer | Scoring Criteria |
|---|---|---|---|---|---|
| q1 | identification | 20 | What candidate reference spectra are needed to perform a linear combination analysis of the surface species on this electro-redeposited Cu catalyst during CO2RR? | The candidate reference spectra needed for linear combination analysis are Cu(0), Cu(I), and Cu(II). These references are required because the electro-redeposited Cu catalyst is formed from a Cu(II)-containing copper oxychloride precursor and undergoes dynamic reduction during in situ CO2RR electrocatalysis at -1.2 V vs RHE. As the applied potential drives the reduction of the precursor over the 60-minute duration, the surface transitions through intermediate oxidation states. Therefore, a basis set of Cu(0), Cu(I), and Cu(II) is necessary to accurately capture the initial state, the transient Cu+ intermediates, and the final metallic Cu(0) products formed under these specific electrochemical conditions. | Full credit for identifying Cu(0), Cu(I), and Cu(II) as the necessary reference states for the LCF basis. |
| q2 | quantification | 40 | Based on the sample conditions (in situ CO2RR at -1.2 V vs RHE for 60 minutes), estimate the phase fractions of the surface Cu species. | After 60 minutes of in situ CO2RR at -1.2 V vs RHE, the surface phase fractions are estimated to be 77% Cu(0) and 23% Cu(I). These specific values result from the dynamic surface reduction of the copper oxychloride precursor under the applied cathodic potential over the 1-hour duration. Initially, the surface consists of 84% Cu+ at 2 minutes, which steadily decreases as the electro-redeposition and reduction progress. By 60 minutes, the continuous applied potential of -1.2 V vs RHE has reduced the majority of the material to metallic Cu(0) (77%), while the specific electrochemical environment stabilizes a residual 23% fraction of Cu+ species on the surface. | Full credit for estimating approximately 23% Cu(I) and 77% Cu(0). Partial credit for identifying that it is a mixture dominated by Cu(0) but with a significant minority fraction of Cu(I) remaining. |
| q3 | reasoning | 40 | Explain the physical and catalytic significance of the phase composition present after 1 hour of CO2RR at -1.2 V vs RHE. Why is this specific surface composition important? | The phase composition of 77% Cu(0) and 23% Cu(I) present after 1 hour of CO2RR is highly significant because this residual surface Cu+ is suggested to be responsible for efficient CO2-to-ethylene conversion. Under the applied potential of -1.2 V vs RHE in a CO2-saturated electrolyte, the copper oxychloride precursor does not fully reduce to metallic copper, but instead maintains a stable mixed-valence surface. This specific surface composition is important because the persistent 23% Cu(I) fraction acts as the active site for the targeted electrocatalytic pathway. The use of surface-sensitive soft X-ray L-edge XAS is critical to observing this phenomenon, as it accurately probes the dynamic surface oxidation states that drive the catalytic mechanism under these exact operating conditions. | Full credit for explaining that a fraction of Cu+ (23%) remains stable on the surface even after 1 hour at reducing potentials, and that this residual Cu+ is suggested to be responsible for efficient CO2-to-ethylene conversion. |
Review
Low-temperature hydroformylation of ethylene by phosphorous stabilized Rh sites in a one-pot synthesized Rh-(O)-P-MFI zeolite
APS
Catalyst
Minjie Zhao et al.
DOI: 10.1038/s41467-023-42938-4
2 scenarios
▶
#897
Rh-MFI
Rh K-edge
▶
LLM Prompt
Sample Information
Material: Rh-MFI
Support: MFI zeolite
Sample-Specific Conditions
- Pre-treatment: Calcined
- Calcined Rh-MFI zeolite containing sub-nanometric Rh clusters
Measurement
We plan to measure the Rh K-edge XANES spectrum of this sample.
Questions
Based on all the information above:
1. What phase dominates the Rh K-edge XANES spectrum of the calcined Rh-MFI sample, and what reference spectra would be needed to confirm this?
2. Based on the sample preparation (calcination in air at 550 °C), explain why this specific phase is formed and what its expected oxidation state is.
3. Describe the expected spectral shape of this sample at the Rh K-edge, specifically mentioning the position of the white line and how the rising edge compares to standard references.
4. What distinguishes the XANES spectrum of this calcined sample from that of a fully reduced Rh0 sample?
Ground Truth
Material: Rh-MFI
Measurement: Rh K-edge XANES
Fit method: Qualitative comparison of rising edge and white line
Phase fractions:
| Phase | Fraction |
|---|---|
| Rh2O3 | 1.0 |
Fit basis (paper's reference spectra):
- Rh2O3
- Rh0
Source evidence: Page 2, Figure 1c
Key reasoning: The sample XANES spectrum at the Rh K-edge shows the rising edge overlapping that of Rh2O3, indicating a 3+ average oxidation state for the Rh centers. The EXAFS data also shows Rh-O and Rh-Rh scattering contributions compatible with the Rh2O3 system, but with reduced intensity corresponding to smaller, more disordered clustering. Globally, the data are compatible with the formation of small sub-nanometric Rh2O3 clusters.
Reasoning source: Page 2, Results section (Rh clusters stabilized in a one-pot synthesized MFI zeolite)
Scoring Rubric (total: 100 pts)
| Q | Type | Max | Question | Reference Answer | Scoring Criteria |
|---|---|---|---|---|---|
| q1 | identification | 25 | What phase dominates the Rh K-edge XANES spectrum of the calcined Rh-MFI sample, and what reference spectra would be needed to confirm this? | The Rh K-edge XANES spectrum of the calcined Rh-MFI sample is entirely dominated by the Rh2O3 phase, with a fraction of 1.0. To confirm this, reference spectra for Rh2O3 and Rh0 are needed for qualitative comparison of the rising edge and white line. This specific oxidized phase dominates because the sample was subjected to a calcination pre-treatment, which oxidizes the sub-nanometric Rh clusters supported on the MFI zeolite. Consequently, the Rh centers reach a 3+ average oxidation state, forming small sub-nanometric Rh2O3 clusters. | Full points for identifying Rh2O3 as the dominant phase and mentioning Rh2O3 (and optionally Rh0) as reference spectra. |
| q2 | reasoning | 25 | Based on the sample preparation (calcination in air at 550 °C), explain why this specific phase is formed and what its expected oxidation state is. | The expected oxidation state of the Rh centers in this sample is 3+, corresponding to the formation of small sub-nanometric Rh2O3 clusters. This specific phase forms because the Rh-MFI zeolite sample undergoes a calcination pre-treatment, which fully oxidizes the supported sub-nanometric Rh clusters. The formation of this oxidized phase is confirmed by the XANES rising edge overlapping with that of bulk Rh2O3, while EXAFS data indicates these clusters are smaller and more disordered than the bulk material. Therefore, the calcination conditions directly drive the sample to a 1.0 fraction of Rh2O3. | Full points for stating the oxidation state is 3+ and explaining that calcination in air leads to the formation of oxidized Rh species, specifically sub-nanometric Rh2O3 clusters. |
| q3 | spectral | 25 | Describe the expected spectral shape of this sample at the Rh K-edge, specifically mentioning the position of the white line and how the rising edge compares to standard references. | The expected spectral shape of the calcined Rh-MFI sample features a rising edge that overlaps with the Rh2O3 reference spectrum and a prominent white line located at 23240 eV. These specific spectral features arise because the calcination pre-treatment fully oxidizes the sub-nanometric Rh clusters on the MFI zeolite support to a 3+ average oxidation state. The overlap of the rising edge with the Rh2O3 standard directly reflects this 3+ electronic state. Furthermore, the structural nature of these sub-nanometric Rh2O3 clusters produces these distinct oxidized features, which are evaluated through qualitative comparison of the rising edge and white line. | Full points for mentioning that the rising edge overlaps with the Rh2O3 reference and identifying the prominent white line at 23240 eV. |
| q4 | spectral | 25 | What distinguishes the XANES spectrum of this calcined sample from that of a fully reduced Rh0 sample? | The XANES spectrum of this calcined sample is distinguished from a fully reduced Rh0 sample by its rising edge position and the presence of a prominent white line at 23240 eV, both of which match the Rh2O3 reference. These distinguishing features occur because the calcination pre-treatment oxidizes the sub-nanometric Rh clusters on the MFI zeolite, resulting in a 3+ average oxidation state rather than a metallic state. While a fully reduced Rh0 sample would exhibit features characteristic of metallic rhodium, the calcined sample's spectrum is entirely dominated by the oxidized Rh2O3 phase. The electronic properties of these small, oxidized sub-nanometric clusters dictate this distinct spectral signature, preventing any overlap with Rh0 features. | Full points for noting that the calcined sample has a rising edge and white line at 23240 eV matching Rh2O3, which distinguishes it from Rh0. |
Review
#898
Rh-MFI
Rh K-edge
▶
LLM Prompt
Sample Information
Material: Rh-MFI
Support: MFI zeolite
Sample-Specific Conditions
- Pre-treatment: Reduced
- Calcined and subsequently reduced Rh-MFI zeolite
Measurement
We plan to measure the Rh K-edge XANES spectrum of this sample.
Questions
Based on all the information above:
1. Based on the sample conditions (Rh-MFI zeolite reduced in H2 at 600 °C), what is the expected dominant Rh phase and its oxidation state? What reference spectra would be appropriate to use as a basis for analyzing this sample?
2. Explain the physical reasoning for the formation of this dominant phase. What is the nature (e.g., size, morphology) of the Rh species formed after this specific reduction treatment?
3. Describe the expected distinguishing features in the Rh K-edge XANES spectrum for this reduced sample compared to an oxidized Rh2O3 phase. Mention any specific energy values (in eV) associated with these features.
Ground Truth
Material: Rh-MFI
Measurement: Rh K-edge XANES, in situ, CLÆSS beamline of the ALBA synchrotron
Fit method: not reported
Phase fractions:
| Phase | Fraction |
|---|---|
| Rh(0) | 1.0 |
Fit basis (paper's reference spectra):
- Rh(0)
- Rh2O3
Source evidence: Page 5, Results section; Supplementary Fig. S40a
Key reasoning: The Rh-MFI-cal sample is reduced in H2 flow at 600 °C, which reduces the initial Rh2O3 clusters. This treatment results in the formation of Rh(0) clusters with particle sizes of 0.8–1.8 nm located inside the sinusoidal channel of the MFI framework. The XAS spectra confirm this result, with the spectrum of the Rh-MFI sample under H2 reduction approaching that of Rh(0).
Reasoning source: Page 5, Results section
Scoring Rubric (total: 100 pts)
| Q | Type | Max | Question | Reference Answer | Scoring Criteria |
|---|---|---|---|---|---|
| q1 | identification | 30 | Based on the sample conditions (Rh-MFI zeolite reduced in H2 at 600 °C), what is the expected dominant Rh phase and its oxidation state? What reference spectra would be appropriate to use as a basis for analyzing this sample? | The expected dominant Rh phase is Rh(0) clusters with an oxidation state of 0, representing a fraction of 1.0. The appropriate reference spectra to use as a fit basis for analyzing this sample are Rh(0) and Rh2O3. This specific phase composition arises because the calcined Rh-MFI sample is subjected to a reduction treatment in H2 flow at 600 °C. This high-temperature hydrogen environment completely reduces the initial oxidized Rh2O3 clusters into metallic Rh(0). | Full points for identifying Rh(0) clusters / metallic Rh with oxidation state 0, and mentioning Rh(0) and Rh2O3 as reference spectra. |
| q2 | reasoning | 35 | Explain the physical reasoning for the formation of this dominant phase. What is the nature (e.g., size, morphology) of the Rh species formed after this specific reduction treatment? | The formation of the dominant Rh(0) phase occurs because the initial calcined Rh-MFI sample, which contains Rh2O3 clusters, is exposed to H2 flow at 600 °C. This strong reducing environment drives the complete reduction of the oxidized rhodium species into a metallic state. As a result of this treatment, the rhodium forms metallic Rh(0) clusters with particle sizes ranging from 0.8 to 1.8 nm. These newly formed nanoclusters are specifically located inside the sinusoidal channels of the MFI zeolite framework. | Full points for explaining that reduction in H2 at 600 °C reduces the initial Rh2O3 clusters to form Rh(0) clusters with particle sizes of 0.8-1.8 nm located inside the zeolite channels. |
| q3 | spectral | 35 | Describe the expected distinguishing features in the Rh K-edge XANES spectrum for this reduced sample compared to an oxidized Rh2O3 phase. Mention any specific energy values (in eV) associated with these features. | The Rh K-edge XANES spectrum for this reduced sample closely approaches that of a metallic Rh(0) reference. A key distinguishing feature is the presence of a characteristic Rh(0) peak at 23221 eV. Furthermore, the spectrum lacks the strong white line intensity at 23240 eV, which is characteristic of the oxidized Rh2O3 phase. These spectral features directly result from the sample conditions, as the H2 reduction at 600 °C completely converts the initial Rh2O3 into metallic Rh(0) clusters, thereby eliminating the oxidized electronic signature and replacing it with a metallic one. | Full points for mentioning the spectrum approaches that of Rh(0), exhibits a characteristic feature at 23221 eV, and lacks the strong white line intensity at 23240 eV seen in Rh2O3. |
Review
Rapid-charging aluminium-sulfur batteries operated at 85 °C with a quaternary molten salt electrolyte
APS
Electrochemistry
Jiashen Meng et al.
DOI: 10.1038/s41467-024-44691-8
2 scenarios
▶
#899
S/NCF
S K-edge
▶
LLM Prompt
Sample Information
Material: S/NCF
Electrode Type: cathode
Electrolyte: quaternary alkali chloroaluminate melt (AlCl3-NaCl-LiCl-KCl)
Cell Type: 2032 coin cell
Charge Discharge: OCV
State Of Charge: 0% SOD
Cycle Number: 1
Sample-Specific Conditions
- state_of_charge: 0% SOD
- Pristine state of the sulfur cathode before discharge
Measurement
We plan to measure the S K-edge XANES spectrum of this sample.
Questions
Based on all the information above:
1. Based on the sample conditions (0% SOD, pristine state), identify the dominant phase present in the cathode and explain the physical reasoning for its presence.
2. What is the characteristic peak energy and its corresponding electronic transition for the S K-edge XANES spectrum of this pristine sample?
Ground Truth
Material: S/NCF
Measurement: S K-edge operando XANES in fluorescence mode at sector 9-BM-B, Advanced Photon Source
Fit method: Multivariate curve resolution-alternating least-squares (MCR-ALS) followed by linear combination fitting
Phase fractions: (±10%)
| Phase | Fraction |
|---|---|
| S0 | 1.0 |
Fit basis (paper's reference spectra):
- S0
- Al2(Sn)3
- Al2S3
Source evidence: Page 6, text and Figure 4d, 4f
Key reasoning: At 0% state of discharge (pristine state), the sulfur cathode has not yet undergone any electrochemical reduction. The active material remains entirely in its initial unreacted state as elemental sulfur.
Reasoning source: Page 6, 'Revealing the asymmetric reaction mechanism' section
Scoring Rubric (total: 100 pts)
| Q | Type | Max | Question | Reference Answer | Scoring Criteria |
|---|---|---|---|---|---|
| q1 | identification | 43 | Based on the sample conditions (0% SOD, pristine state), identify the dominant phase present in the cathode and explain the physical reasoning for its presence. | The dominant phase present in the S/NCF cathode is S0 (elemental sulfur), which accounts for a fraction of 1.0. This phase is expected because the sample is at 0% state of discharge (SOD) and in its pristine state under open-circuit voltage (OCV) conditions. At this initial stage of the first cycle, the sulfur cathode has not yet undergone any electrochemical reduction in the quaternary alkali chloroaluminate melt electrolyte. Consequently, the active material remains entirely in its initial, unreacted state as elemental sulfur with an oxidation state of 0. | Award 10 points for identifying elemental sulfur (S0) as the dominant phase. Award 20 points for reasoning that at 0% SOD, no electrochemical reduction has occurred yet, leaving the sulfur in its initial unreacted state. |
| q2 | spectral | 57 | What is the characteristic peak energy and its corresponding electronic transition for the S K-edge XANES spectrum of this pristine sample? | The S K-edge XANES spectrum of this pristine sample features a prominent white line peak at 2470.5 eV, which originates from the S 1s to S-S π* state electronic transition. These specific spectral features arise because the sample is at 0% state of discharge, meaning the active material has not undergone electrochemical reduction and remains entirely as unreacted elemental sulfur (S0). The presence of this 2470.5 eV peak directly reflects the unreacted S-S bonds present in the pristine state. Furthermore, this peak distinguishes the pristine elemental sulfur from subsequent discharge products like Al2S3, which would appear at higher binding energies (2472.2 and 2473.5 eV) due to S 1s to σ* transitions and strong electron binding ability. | Award 20 points for identifying the peak energy at 2470.5 eV. Award 20 points for attributing this peak to the S 1s to S-S π* state transition. |
Review
#900
S/NCF
S K-edge
▶
LLM Prompt
Sample Information
Material: S/NCF
Electrode Type: cathode
Electrolyte: quaternary alkali chloroaluminate melt (AlCl3-NaCl-LiCl-KCl)
Cell Type: 2032 coin cell
Charge Discharge: discharged
State Of Charge: 100% SOD
Cycle Number: 1
Sample-Specific Conditions
- state_of_charge: 100% SOD
- End of the first discharge process
Measurement
We plan to measure the S K-edge XANES spectrum of this sample.
Questions
Based on all the information above:
1. Based on the sample conditions (100% SOD, fully discharged), what is the dominant phase present in the cathode, and what reaction pathway leads to its formation during the discharge process?
2. Describe the expected spectral shape and specific peak positions for this fully discharged sample at the S K-edge.
3. What electronic transitions are responsible for the signature peaks observed in the S K-edge XANES spectrum of this fully discharged sample, and why do they appear at higher binding energies compared to elemental sulfur?
Ground Truth
Material: S/NCF
Measurement: operando S K-edge XANES in fluorescence mode at sector 9-BM-B, Advanced Photon Source
Fit method: Multivariate curve resolution-alternating least-squares (MCR-ALS) followed by linear combination fitting (LCF)
Phase fractions: (±15%)
| Phase | Fraction |
|---|---|
| Al2S3 | 1.0 |
Fit basis (paper's reference spectra):
- S0
- Al2(Sn)3
- Al2S3
Source evidence: Page 6 (Fig 4d, 4f, 4g) and Page 7 (text)
Key reasoning: During discharge, sulfur undergoes a multi-phase conversion process. Initially (0-50% SOD), S0 directly converts to Al2S3. Upon further discharge, an Al2(Sn)3 intermediate forms, implying the residual S0 undergoes a three-phase stepwise conversion (S0–Al2(Sn)3–Al2S3). At 100% SOD, the conversion is complete, yielding Al2S3 as the terminal discharge product.
Reasoning source: Page 7, 'Revealing the asymmetric reaction mechanism' section
Scoring Rubric (total: 101 pts)
| Q | Type | Max | Question | Reference Answer | Scoring Criteria |
|---|---|---|---|---|---|
| q1 | reasoning | 38 | Based on the sample conditions (100% SOD, fully discharged), what is the dominant phase present in the cathode, and what reaction pathway leads to its formation during the discharge process? | Based on the sample conditions at 100% state of discharge (SOD), the dominant phase present in the cathode is Al2S3, which accounts for a fraction of 1.0 (100%). This terminal product arises because the S/NCF cathode undergoes a multi-phase conversion process in the chloroaluminate melt during the first discharge. Initially (0-50% SOD), elemental sulfur (S0) directly converts to Al2S3. As discharge progresses toward 100% SOD, an Al2(Sn)3 intermediate forms, causing the residual S0 to undergo a three-phase stepwise conversion (S0 to Al2(Sn)3 to Al2S3) until the reaction is fully complete. | Full points for identifying Al2S3 as the terminal product (fraction 1.0) and describing the multi-phase conversion pathway (initial direct conversion of S0 to Al2S3, followed by a three-phase stepwise conversion involving an Al2(Sn)3 intermediate). |
| q2 | spectral | 38 | Describe the expected spectral shape and specific peak positions for this fully discharged sample at the S K-edge. | The expected S K-edge XANES spectrum for this fully discharged sample exhibits two distinct signature peaks located at 2472.2 eV and 2473.5 eV. These specific spectral features arise because the sample is at 100% state of discharge (SOD), meaning the elemental sulfur has completely converted into the terminal discharge product, Al2S3. The structural and electronic properties of this pure Al2S3 phase produce these peaks at an increased binding energy compared to elemental sulfur (2470.5 eV) and the Al2(Sn)3 intermediate (2471.6 eV), which is directly attributed to the strong electron binding ability inherent to Al2S3. | Full points for stating the spectrum exhibits two signature peaks located at 2472.2 eV and 2473.5 eV. |
| q3 | reasoning | 25 | What electronic transitions are responsible for the signature peaks observed in the S K-edge XANES spectrum of this fully discharged sample, and why do they appear at higher binding energies compared to elemental sulfur? | The signature peaks observed at 2472.2 eV and 2473.5 eV in the S K-edge XANES spectrum originate from S 1s to σ* electronic transitions. These transitions appear at higher binding energies compared to elemental sulfur (2470.5 eV) because the sample has reached 100% state of discharge (SOD), where all initial sulfur has been fully converted into Al2S3. In this terminal Al2S3 phase, the strong electron binding ability of the compound shifts the absorption edge to higher energies, reflecting the complete electrochemical conversion of the S/NCF cathode in the chloroaluminate melt. | Full points for identifying the origin as the S 1s to σ* transition and explaining that the increased binding energy is due to the strong electron binding ability in Al2S3. |
Review
A general flame aerosol route to kinetically stabilized metal-organic frameworks
BNL-NSLS-II-8-ID
Catalyst
Shuo Liu et al.
DOI: 10.1038/s41467-024-53678-4
2 scenarios
▶
#901
Pt/Zr UiO-66-NH2
Pt L3
▶
LLM Prompt
Sample Information
Material: Pt/Zr UiO-66-NH2
Support: amorphous Zr UiO-66-NH2
Sample-Specific Conditions
- state: as-synthesized
- As-synthesized single-atom Pt in amorphous MOF
Measurement
We plan to measure the Pt L3 XANES spectrum of this sample.
Questions
Based on all the information above:
1. Based on the sample description (as-synthesized single-atom Pt in amorphous MOF), what is the expected dominant oxidation state and local coordination environment of the Pt species, and what XAS evidence supports this?
2. Describe the expected relative intensity of the Pt L3-edge white line for this sample compared to a metallic Pt foil reference, and explain the physical origin of this spectral feature based on electronic transitions.
Ground Truth
Material: 4.3 wt.% Pt in amorphous Zr UiO-66-NH2
Measurement: Pt L3-edge, ex-situ fluorescence mode, 8-ID beamline at NSLS II
Fit method: Qualitative comparison of white line intensity
Phase fractions: (±10%)
| Phase | Fraction |
|---|---|
| Pt2+ (single atoms) | 1.0 |
Fit basis (paper's reference spectra):
- Pt foil
Source evidence: Page 6, Figure 5h, Figure 5i
Key reasoning: The XANES white line intensity for the as-synthesized Pt in amorphous UiO-66-NH2 is significantly higher than that of Pt foil, indicating an oxidized Pt state. This is supported by EXAFS showing only Pt-O bonds from coordination with carboxyl groups and no Pt-Pt bonds, confirming atomically dispersed Pt2+.
Reasoning source: Page 6, Results section (In-situ dispersion of single atoms/bimetallic MOFs)
Scoring Rubric (total: 100 pts)
| Q | Type | Max | Question | Reference Answer | Scoring Criteria |
|---|---|---|---|---|---|
| q1 | reasoning | 47 | Based on the sample description (as-synthesized single-atom Pt in amorphous MOF), what is the expected dominant oxidation state and local coordination environment of the Pt species, and what XAS evidence supports this? | The expected dominant oxidation state of the Pt species is Pt2+ (100% fraction), existing as single atoms coordinated to carboxyl groups within the amorphous Zr UiO-66-NH2 support. This specific state arises because the as-synthesized conditions facilitate the atomic dispersion of Pt within the amorphous MOF structure, allowing it to bond exclusively with oxygen from the support's carboxyl groups. The XAS evidence supporting this includes a significantly higher XANES white line intensity compared to Pt foil, which indicates an oxidized state. Furthermore, EXAFS data confirms this local coordination environment by showing only Pt-O bonds and a complete lack of Pt-Pt bonds, verifying the atomically dispersed nature of the Pt2+ species. | The answer must identify the dominant state as oxidized Pt (Pt2+) coordinated to oxygen (specifically carboxyl groups of the MOF linkers). It must cite the high white line intensity in XANES and the presence of only Pt-O bonds (no Pt-Pt bonds) in EXAFS as the supporting evidence. |
| q2 | spectral | 53 | Describe the expected relative intensity of the Pt L3-edge white line for this sample compared to a metallic Pt foil reference, and explain the physical origin of this spectral feature based on electronic transitions. | The Pt L3-edge white line intensity for this sample is expected to be significantly higher than that of a metallic Pt foil reference, reaching a normalized absorption of approximately 1.5. This intense spectral feature originates from the 2p3/2 to 5d electron transition. Because the sample consists of as-synthesized single-atom Pt coordinated to carboxyl groups in the amorphous MOF, the Pt exists in an oxidized Pt2+ state rather than a metallic state. This oxidized coordination environment results in a lower occupancy of the Pt 5d electronic state compared to metallic Pt, which directly causes the observed increase in the white line intensity. | The answer must state that the white line will be significantly more intense than that of Pt foil. It must correctly attribute the white line to the 2p3/2 -> 5d electron transition, explaining that the oxidized state has lower 5d occupancy, which results in the higher white line intensity. |
Review
#902
Pt/Zr UiO-66-NH2
Pt L3
▶
LLM Prompt
Sample Information
Material: Pt/Zr UiO-66-NH2
Support: amorphous Zr UiO-66-NH2
Sample-Specific Conditions
- state: reduced
- Reduced Pt nanoclusters on amorphous MOF
Measurement
We plan to measure the Pt L3 XANES spectrum of this sample.
Questions
Based on all the information above:
1. Based on the sample preparation conditions (NaBH4 reduction at 60 °C for 4 hours), what is the expected dominant Pt phase and oxidation state in this material, and what physical process leads to its formation?
2. If you were to perform Linear Combination Fitting (LCF) on the XANES spectrum of this reduced sample to verify its complete reduction, what primary reference spectrum would be essential to include as your basis?
Ground Truth
Material: Pt/Zr UiO-66-NH2
Measurement: Pt L3-edge, ex-situ fluorescence mode, 8-ID beamline (ISS) at NSLS-II
Fit method: EXAFS fitting (XANES LCF not explicitly performed for this sample)
Phase fractions: (±10%)
| Phase | Fraction |
|---|---|
| metallic_platinum | 1.0 |
Fit basis (paper's reference spectra):
- Pt foil (used as reference for Pt-Pt bonding and Pt0 state)
Source evidence: Page 7, Figure 6c (EXAFS), Supplementary Fig. 34 (XPS)
Key reasoning: Reduction of the single-atom Pt-doped MOF with NaBH4 drives the exsolution of Pt out of the UiO-66-NH2 matrix to form metallic Pt nanoclusters anchored to the MOF. EXAFS analysis shows the complete disappearance of Pt-O bonds and the emergence of only Pt-Pt bonds, confirming complete reduction to metallic Pt (Pt0), which is also corroborated by XPS.
Reasoning source: Page 6-7, Section: Exsolution of active nanoclusters and application in CO oxidation
Scoring Rubric (total: 100 pts)
| Q | Type | Max | Question | Reference Answer | Scoring Criteria |
|---|---|---|---|---|---|
| q1 | reasoning | 57 | Based on the sample preparation conditions (NaBH4 reduction at 60 °C for 4 hours), what is the expected dominant Pt phase and oxidation state in this material, and what physical process leads to its formation? | The expected dominant phase in this material is metallic Pt nanoclusters with an oxidation state of 0. The reduction of the single-atom Pt-doped MOF using NaBH4 drives the exsolution of Pt out of the amorphous Zr UiO-66-NH2 matrix. This chemical process causes the Pt atoms to aggregate and form metallic nanoclusters anchored to the MOF support. EXAFS and XPS analyses confirm this complete reduction, showing the total disappearance of Pt-O bonds and the exclusive emergence of Pt-Pt bonds characteristic of a fully reduced Pt0 state. | Full credit requires identifying metallic Pt (Pt0) as the dominant phase and explaining that NaBH4 drives the exsolution of Pt from the MOF matrix to form anchored nanoclusters. |
| q3 | identification | 43 | If you were to perform Linear Combination Fitting (LCF) on the XANES spectrum of this reduced sample to verify its complete reduction, what primary reference spectrum would be essential to include as your basis? | If performing Linear Combination Fitting (LCF), the essential primary reference spectrum to include in your basis is Pt foil. The NaBH4 reduction conditions drive the exsolution of Pt from the amorphous Zr UiO-66-NH2 matrix, resulting in the formation of fully reduced metallic Pt nanoclusters. Because this process completely eliminates Pt-O bonds and yields a 100% fraction of Pt0 with exclusively Pt-Pt bonding, the Pt foil reference is necessary to accurately model the metallic state and Pt-Pt scattering of the sample. | Full credit requires identifying Pt foil or a metallic Pt0 reference spectrum. |
Review
Bilayer electrified-membrane with pair-atom tin catalysts for near-complete conversion of low concentration nitrate to dinitrogen
BNL-NSLS-II-8-ID
Catalyst
Xuanhao Wu et al.
DOI: 10.1038/s41467-025-56102-7
2 scenarios
▶
#903
Sn2/NCB
Sn K-edge
▶
LLM Prompt
Sample Information
Material: Sn2/NCB
Support: N-doped carbon black (NCB)
Sample-Specific Conditions
- Sn loading (pair-atom dominant): 5 wt%
- Sn pair-atom catalysts on N-doped carbon black
Measurement
We plan to measure the Sn K-edge XANES spectrum of this sample.
Questions
Based on all the information above:
1. Based on the sample conditions (Sn pair-atoms on N-doped carbon black), what is the expected oxidation state of the Sn species, and why does it differ from that of fully isolated Sn single atoms (Sn1/NCB)?
2. Describe the expected relative position of the Sn K-edge for the Sn2/NCB catalyst compared to Sn foil, Sn(IV) phthalocyanine (SnPc), and Sn1/NCB. What structural feature does this relative edge position confirm?
Ground Truth
Material: Sn2/NCB
Measurement: Sn K-edge XANES, ex-situ, ISS beamline at National Synchrotron Light Source II
Fit method: Linear correlation analysis between edge energy and oxidation state
Phase fractions:
| Phase | Fraction |
|---|---|
| Sn pair-atoms (oxidation state +2.8) | 1.0 |
Fit basis (paper's reference spectra):
- Sn foil
- Sn(IV) phthalocyanine (SnPc)
Source evidence: Page 3, Figure 3a-c
Key reasoning: The edge energy of Sn2/NCB was located between Sn foil and Sn(IV) phthalocyanine (SnPc) standards, indicating an oxidation state between 0 and +4. A shift towards lower edge energy compared to fully isolated Sn single atoms (Sn1/NCB) suggests that Sn pair-atoms are in a more reduced state due to electronic interactions between short-distanced atoms. Linear correlation analysis between edge energy and oxidation state determined the value to be +2.8.
Reasoning source: Page 3, Results: Synthesis and characterization of Sn single-atom catalysts
Scoring Rubric (total: 100 pts)
| Q | Type | Max | Question | Reference Answer | Scoring Criteria |
|---|---|---|---|---|---|
| q1 | reasoning | 50 | Based on the sample conditions (Sn pair-atoms on N-doped carbon black), what is the expected oxidation state of the Sn species, and why does it differ from that of fully isolated Sn single atoms (Sn1/NCB)? | The expected oxidation state of the Sn species in the Sn2/NCB catalyst is +2.8, comprising 1.0 (100%) of the fraction. This specific oxidation state arises because the sample consists of 5 wt% Sn pair-atoms coordinated with nitrogen (Sn-N4 structure) on the N-doped carbon black support. Compared to fully isolated Sn single atoms (Sn1/NCB, which have an oxidation state of +3.6), the Sn pair-atoms are in a more reduced state. This difference occurs because the short-distanced atoms in the pair-atom configuration experience electronic interactions between neighboring single atom sites, which lowers their overall oxidation state. | Award 15 points for identifying the oxidation state as +2.8 (or an intermediate state between 0 and +4, more reduced than Sn1/NCB). Award 25 points for explaining that the more reduced state is caused by electronic interactions between short-distanced atoms in the pair-atom configuration. |
| q2 | spectral | 50 | Describe the expected relative position of the Sn K-edge for the Sn2/NCB catalyst compared to Sn foil, Sn(IV) phthalocyanine (SnPc), and Sn1/NCB. What structural feature does this relative edge position confirm? | The Sn K-edge absorption position for the Sn2/NCB catalyst is expected to be located between the Sn foil (Sn0) and Sn(IV) phthalocyanine (SnPc, Sn4+) standards, at approximately 29199.8 eV. Furthermore, the edge energy is shifted to a lower value compared to the fully isolated single-atom Sn1/NCB catalyst. This relative edge position confirms the structural presence of short-distanced Sn pair-atoms on the N-doped carbon black support. Specifically, the shift to a lower edge energy demonstrates that electronic interactions between these neighboring single atom sites result in a more reduced oxidation state (+2.8) compared to isolated single atoms (+3.6). | Award 20 points for stating the edge position is between Sn foil and SnPc, and at a lower energy than Sn1/NCB. Award 20 points for noting this confirms the presence of interacting pair-atoms (which shifts the electron distribution and lowers the edge energy compared to isolated single atoms). |
Review
#904
Sn1/NCB
Sn K-edge
▶
LLM Prompt
Sample Information
Material: Sn1/NCB
Support: N-doped carbon black (NCB)
Sample-Specific Conditions
- Sn loading (single-atom dominant): 1 wt%
- Sn single-atom catalysts on N-doped carbon black
Measurement
We plan to measure the Sn K-edge XANES spectrum of this sample.
Questions
Based on all the information above:
1. Based on the sample conditions (1 wt% Sn loading, fully isolated single atoms), what is the expected oxidation state of Sn in Sn1/NCB, and what is the physical reasoning for this state compared to higher loading pair-atom catalysts?
2. How does the Sn K-edge position of Sn1/NCB compare to that of the Sn pair-atom catalyst (Sn2/NCB), and what does this indicate about the electronic structure?
Ground Truth
Material: Sn1/NCB
Measurement: Sn K-edge, fluorescence mode, ISS beamline (8-ID) at National Synchrotron Light Source II
Fit method: Linear correlation analysis (edge energy vs oxidation state)
Phase fractions:
| Phase | Fraction |
|---|---|
| Sn single atoms (oxidation state +3.6) | 1.0 |
Fit basis (paper's reference spectra):
- Sn foil
- Sn(IV) phthalocyanine (SnPc)
Source evidence: Page 3, Fig. 3b, 3c
Key reasoning: At 1 wt% Sn loading, fully-isolated Sn single-atom sites are dominant. The oxidation state of Sn in Sn1/NCB was determined to be +3.6 based on a linear correlation between the edge energy and the oxidation state of Sn standards. This higher oxidation state compared to Sn pair-atoms (Sn2/NCB, +2.8) suggests that fully isolated single atoms are in a less reduced state, as they lack the electronic interactions between short-distanced atoms that shift electron distribution towards clustered single atoms.
Reasoning source: Page 3, Results (Synthesis and characterization of Sn single-atom catalysts)
Scoring Rubric (total: 100 pts)
| Q | Type | Max | Question | Reference Answer | Scoring Criteria |
|---|---|---|---|---|---|
| q1 | reasoning | 57 | Based on the sample conditions (1 wt% Sn loading, fully isolated single atoms), what is the expected oxidation state of Sn in Sn1/NCB, and what is the physical reasoning for this state compared to higher loading pair-atom catalysts? | The expected oxidation state of Sn in the Sn1/NCB sample is +3.6. At the specific sample condition of 1 wt% Sn loading, the catalyst is dominated by fully isolated Sn single-atom sites coordinated to nitrogen on the carbon support. This +3.6 oxidation state is higher, or less reduced, than the +2.8 state observed in Sn pair-atom catalysts (Sn2/NCB). The physical reasoning for this is that fully isolated single atoms lack the electronic interactions present between short-distanced atoms in clustered or pair-atom configurations. Without these neighboring Sn atoms to shift the electron distribution towards the metal centers, the isolated Sn sites remain in a higher oxidation state. | Full points for stating an oxidation state of +3.6 and explaining that fully isolated single atoms lack the electronic interactions present in short-distanced pair-atoms, which would otherwise shift the electron distribution and lead to a more reduced state. |
| q3 | spectral | 43 | How does the Sn K-edge position of Sn1/NCB compare to that of the Sn pair-atom catalyst (Sn2/NCB), and what does this indicate about the electronic structure? | The Sn K-edge position of Sn1/NCB is located at approximately 29200.4 eV, which is shifted to a higher energy compared to the Sn pair-atom catalyst (Sn2/NCB). This positive energy shift indicates that the Sn1/NCB sample possesses a higher oxidation state (+3.6) compared to the pair-atom catalyst (+2.8). This electronic structure arises directly from the sample conditions of 1 wt% Sn loading, which yields fully isolated Sn single atoms on the N-doped carbon black support. Because these atoms are fully isolated, they lack the short-distance electronic interactions from neighboring Sn atoms that would otherwise shift electron density toward the metal. Consequently, the absence of these electron distribution effects leaves the isolated Sn atoms in a less reduced state, producing the higher energy position of the XANES absorption edge. | Full points for stating the edge position is shifted to higher energy compared to Sn2/NCB, indicating a more oxidized state (less electron density on the Sn atom). |
Review
Six-electron-conversion selenium cathodes stabilized by dead-selenium revitalizer for aqueous zinc batteries
ESRF-BM23
Electrochemistry
Jingwei Du et al.
DOI: 10.1038/s41467-025-58859-3
5 scenarios
▶
#905
Se-AC composite
Se K-edge
▶
LLM Prompt
Sample Information
Material: Se-AC composite
Electrode Type: cathode
Electrolyte: 30 m ZnCl2 hydrogel electrolyte (ZCE)
Cell Type: coin cell
Charge Discharge: OCV
State Of Charge: pristine
Sample-Specific Conditions
- state of charge: pristine
- Pristine Se electrode before cycling
Measurement
We plan to measure the Se K-edge XANES spectrum of this sample.
Questions
Based on all the information above:
1. Based on the sample conditions (pristine Se-AC composite before cycling), what is the dominant phase and oxidation state of Se, and what specific local coordination feature is expected in the EXAFS wavelet transform analysis?
2. How does the primary scattering feature of this pristine Se electrode distinguish it from the fully charged and fully discharged states in the ZnCl2 electrolyte?
Ground Truth
Material: Se-AC composite
Measurement: Se K-edge XAS in transmission mode at beamline BM23 (ESRF) or P65 (DESY)
Fit method: not reported
Phase fractions: (±10%)
| Phase | Fraction |
|---|---|
| Se | 1.0 |
Fit basis (paper's reference spectra):
- not reported
Source evidence: Figure 2e and text on Page 4
Key reasoning: The pristine Se electrode consists of elemental Se0. Wavelet transform analysis of the k3-weighted EXAFS data shows a WT maximum at R = 2.05 Å, which corresponds to Se-Se scattering. XPS also confirms elemental Se0 with some interfacial Se-C bonds formed during the melt-diffusion process into the activated carbon host at 600 °C.
Reasoning source: Results section, 'Mechanism elucidation of six-electron Se conversion', Page 4
Scoring Rubric (total: 100 pts)
| Q | Type | Max | Question | Reference Answer | Scoring Criteria |
|---|---|---|---|---|---|
| q1 | identification | 57 | Based on the sample conditions (pristine Se-AC composite before cycling), what is the dominant phase and oxidation state of Se, and what specific local coordination feature is expected in the EXAFS wavelet transform analysis? | Based on the pristine, uncycled state of the Se-AC composite, the dominant phase is elemental Se with an oxidation state of 0. In the EXAFS wavelet transform analysis, this phase is expected to show a maximum at R = 2.05 Å, which corresponds to Se-Se scattering. This specific composition and coordination arise because the electrode is at open circuit voltage and has not yet undergone any electrochemical reactions in the ZnCl2 electrolyte. The initial material is formed via a melt-diffusion process into the activated carbon host at 600 °C, which preserves the elemental Se0 state while forming some interfacial Se-C bonds. Consequently, the unreacted pristine sample exhibits purely Se-Se local coordination. | Full points for identifying elemental Se (Se0) and mentioning Se-Se scattering with a WT maximum at R = 2.05 Å. |
| q3 | spectral | 43 | How does the primary scattering feature of this pristine Se electrode distinguish it from the fully charged and fully discharged states in the ZnCl2 electrolyte? | The pristine Se electrode is distinguished by a primary EXAFS wavelet transform maximum at R = 2.05 Å, corresponding to Se-Se scattering. In contrast, the fully charged state exhibits Se-Cl scattering at 1.27 Å and 1.85 Å, while the fully discharged state shows Se-Zn scattering at 2.10 Å. These distinct spectral features arise directly from the sample's pristine, uncycled condition at open circuit voltage. Because the Se-AC composite has not yet reacted with the 30 m ZnCl2 hydrogel electrolyte, it retains the elemental Se0 structure formed during the initial 600 °C melt-diffusion process. Upon cycling, electrochemical conversion alters the local coordination to form Se-Cl or Se-Zn bonds, replacing the initial Se-Se scattering. | Full points for contrasting the pristine Se-Se scattering (R = 2.05 Å) with the fully charged state (Se-Cl scattering at 1.27 Å and 1.85 Å) and the fully discharged state (Se-Zn scattering at 2.10 Å). |
Review
#906
Se-AC composite
Se K-edge
▶
LLM Prompt
Sample Information
Material: Se-AC composite
Electrode Type: cathode
Electrolyte: 30 m ZnCl2 hydrogel electrolyte (ZCE)
Cell Type: coin cell
Charge Discharge: charged
Voltage V: 1.9
State Of Charge: fully charged
Cycle Number: 1
Sample-Specific Conditions
- state of charge: fully charged
- Se electrode fully charged to 1.9 V
Measurement
We plan to measure the Se K-edge XANES spectrum of this sample.
Questions
Based on all the information above:
1. Given the sample conditions (Se cathode fully charged to 1.9 V in a 30 m ZnCl2 aqueous electrolyte), what is the expected dominant phase, and what is the electrochemical reasoning for its formation?
2. What reference spectrum or structural model is essential to include when analyzing the X-ray absorption data of this fully charged electrode?
3. How does the local coordination environment of Se change upon full charge, and what specific EXAFS scattering features distinguish this state from the pristine electrode?
Ground Truth
Material: Se-AC composite
Measurement: Se K-edge XAS in transmission mode at beamline BM23 (ESRF) or P65 (DESY)
Fit method: not reported
Phase fractions: (±10%)
| Phase | Fraction |
|---|---|
| SeCl4 | 1.0 |
Fit basis (paper's reference spectra):
- SeCl4
Source evidence: Page 3, Figure 2f; Page 4, text
Key reasoning: During the charge process to 1.9 V, elemental Se undergoes a six-electron conversion to Se4+. In the ZnCl2-based hydrogel electrolyte, the Cl- anions act as charge carriers, bonding with the oxidized Se to form SeCl4 as the predominant fully charged product.
Reasoning source: Page 3-4, Results: Mechanism elucidation of six-electron Se conversion
Scoring Rubric (total: 100 pts)
| Q | Type | Max | Question | Reference Answer | Scoring Criteria |
|---|---|---|---|---|---|
| q1 | identification | reasoning | 40 | Given the sample conditions (Se cathode fully charged to 1.9 V in a 30 m ZnCl2 aqueous electrolyte), what is the expected dominant phase, and what is the electrochemical reasoning for its formation? | The expected dominant phase for the Se-AC composite cathode fully charged to 1.9 V is SeCl4, which accounts for a 1.0 fraction of the sample. This phase forms because, during the charging process to 1.9 V, the elemental Se undergoes a six-electron conversion reaction to an Se4+ oxidation state. Within the 30 m ZnCl2 hydrogel electrolyte, the abundant Cl- anions act as charge carriers. These Cl- ions bond directly with the newly oxidized Se4+ to form SeCl4 as the predominant product in the fully charged state. | Full points for identifying SeCl4 (or a Se4+ chloride species) and explaining that Se undergoes a six-electron oxidation to Se4+, which coordinates with Cl- anions from the electrolyte. |
| q2 | identification | 20 | What reference spectrum or structural model is essential to include when analyzing the X-ray absorption data of this fully charged electrode? | When analyzing the X-ray absorption data of this fully charged electrode, it is essential to include a SeCl4 reference spectrum or structural model. This requirement arises because the Se-AC composite cathode is fully charged to 1.9 V in a 30 m ZnCl2 hydrogel electrolyte, which drives a six-electron conversion of elemental Se to Se4+. The Cl- anions from the electrolyte act as charge carriers and bond with the oxidized Se, making SeCl4 the sole expected phase (1.0 fraction) at this state of charge. Therefore, the SeCl4 basis is strictly required to accurately fit and interpret the structural transformation of the sample. | Full points for stating SeCl4. |
| q3 | spectral | 40 | How does the local coordination environment of Se change upon full charge, and what specific EXAFS scattering features distinguish this state from the pristine electrode? | Upon full charge to 1.9 V, the local coordination environment of Se changes from Se-Se bonds to Se-Cl bonds. This structural transformation occurs because the elemental Se undergoes a six-electron oxidation to Se4+, which then bonds with Cl- anions from the 30 m ZnCl2 hydrogel electrolyte to form SeCl4. Spectroscopically, this fully charged state is distinguished by the emergence of Se-Cl scattering signals at R = 1.27 Å and R = 1.85 Å in the EXAFS wavelet transform. These new features completely replace the initial Se-Se scattering signal at R = 2.05 Å that is characteristic of the pristine elemental Se state. | Full points for mentioning the emergence of Se-Cl scattering (specifically at R = 1.27 Å and R = 1.85 Å) and the disappearance of Se-Se scattering (R = 2.05 Å) characteristic of the pristine state. |
Review
#907
Se-AC composite
Se K-edge
▶
LLM Prompt
Sample Information
Material: Se-AC composite
Electrode Type: cathode
Electrolyte: 30 m ZnCl2 hydrogel electrolyte (ZCE)
Cell Type: coin cell
Charge Discharge: discharged
Voltage V: 0.1
State Of Charge: fully discharged
Cycle Number: 1
Sample-Specific Conditions
- state of charge: fully discharged
- Se electrode fully discharged to 0.1 V
Measurement
We plan to measure the Se K-edge XANES spectrum of this sample.
Questions
Based on all the information above:
1. Based on the electrochemical conditions (fully discharged to 0.1 V in a ZnCl2 hydrogel electrolyte), what is the expected dominant phase in the Se electrode, and what is the physical reasoning for its formation?
2. If one were to perform structural modeling or Linear Combination Fitting (LCF) on the XAS data of this fully discharged sample, what reference spectrum or scattering path is essential to include?
3. What specific local coordination environment and oxidation state are expected for the Se atoms in this fully discharged state, and what specific XAS feature (e.g., in EXAFS) would indicate this?
Ground Truth
Material: Se-AC composite
Measurement: Se K-edge XAS in transmission mode at beamline BM23 (ESRF) or P65 (DESY)
Fit method: not reported
Phase fractions: (±10%)
| Phase | Fraction |
|---|---|
| ZnSe | 1.0 |
Fit basis (paper's reference spectra):
- ZnSe
Source evidence: Page 4, Figure 2g and text
Key reasoning: At the fully discharged state (0.1 V), the Se electrode undergoes a complete six-electron conversion to form ZnSe. This is evidenced by the wavelet-transformed EXAFS maxima at R = 2.10 Å, which corresponds to Se-Zn scattering. Complementary XPS and Raman spectroscopy further confirm the presence of Se2- and characteristic ZnSe peaks, respectively.
Reasoning source: Page 4, Results section (Mechanism elucidation of six-electron Se conversion)
Scoring Rubric (total: 100 pts)
| Q | Type | Max | Question | Reference Answer | Scoring Criteria |
|---|---|---|---|---|---|
| q1 | identification | 40 | Based on the electrochemical conditions (fully discharged to 0.1 V in a ZnCl2 hydrogel electrolyte), what is the expected dominant phase in the Se electrode, and what is the physical reasoning for its formation? | The expected dominant phase in the Se electrode is ZnSe, which accounts for 100% (fraction of 1.0) of the composition. This phase forms because, at the fully discharged state of 0.1 V in the 30 m ZnCl2 hydrogel electrolyte, the Se-AC composite cathode undergoes a complete six-electron conversion reaction. During this deep discharge process, the active selenium is fully reduced to the Se2- oxidation state, reacting with zinc ions from the electrolyte to form the final ZnSe product. | The answer must identify ZnSe as the dominant (pure) phase, explaining that it results from the full six-electron reduction of the Se cathode to the Se2- state. |
| q2 | reasoning | 30 | If one were to perform structural modeling or Linear Combination Fitting (LCF) on the XAS data of this fully discharged sample, what reference spectrum or scattering path is essential to include? | For structural modeling or Linear Combination Fitting (LCF) of this sample, it is essential to include a ZnSe reference spectrum and a Se-Zn scattering path. The inclusion of this reference is necessary because the Se-AC composite cathode is fully discharged to 0.1 V in the ZnCl2 electrolyte, which triggers a complete six-electron conversion mechanism. As a result of this specific electrochemical condition, the selenium is entirely converted into ZnSe (fraction of 1.0). Therefore, the Se-Zn scattering path is the sole structural feature required to accurately model the local environment of the fully reduced Se2- species. | The answer must state that a ZnSe reference spectrum or a Se-Zn scattering path is required. |
| q3 | spectral | 30 | What specific local coordination environment and oxidation state are expected for the Se atoms in this fully discharged state, and what specific XAS feature (e.g., in EXAFS) would indicate this? | In this fully discharged state, the Se atoms are expected to be in a Se2- oxidation state with a local coordination environment dominated by Se-Zn bonds. This specific electronic and structural state arises because discharging the Se-AC composite cathode to 0.1 V in the ZnCl2 electrolyte drives a complete six-electron conversion reaction, fully reducing the selenium to form ZnSe. Spectroscopically, this environment is indicated by a distinct maximum at R = 2.10 Å in the wavelet-transformed EXAFS data. This specific spectral feature directly corresponds to the Se-Zn scattering path characteristic of the newly formed ZnSe phase. | The answer must identify the Se2- oxidation state and mention Se-Zn scattering, specifically noting a wavelet-transformed EXAFS maximum at approximately R = 2.10 Å. |
Review
#908
Se-AC composite
Br K-edge
▶
LLM Prompt
Sample Information
Material: Se-AC composite
Electrode Type: cathode
Electrolyte: 0.1 m Et4NBr-added a-ZCE (a-ZCE-Br)
Cell Type: coin cell
Charge Discharge: OCV
State Of Charge: pristine
Sample-Specific Conditions
- state of charge: pristine
- Pristine Zn||Se cell with Br additive
Measurement
We plan to measure the Br K-edge XANES spectrum of this sample.
Questions
Based on all the information above:
1. Based on the sample conditions, what is the expected dominant Br species in the pristine Zn||Se cell, and what is its oxidation state?
2. Describe the expected distinguishing spectral features of the Br K-edge XANES spectrum for this pristine sample compared to a fully charged sample. Specifically, address the relative edge position and the presence or absence of any pre-edge peaks.
3. If a pronounced peak at 13473 eV were to appear in the Br K-edge spectrum, what specific electronic transition and chemical species would it indicate, and why is it absent in this pristine sample?
Ground Truth
Material: Se-AC composite with 0.1 m Et4NBr-added a-ZCE electrolyte
Measurement: Br K-edge XANES, transmission mode, beamline BM23 at ESRF or P65 at DESY
Fit method: not reported
Phase fractions:
| Phase | Fraction |
|---|---|
| Br- | 1.0 |
Source evidence: Figure 4b and page 5 text
Key reasoning: In the pristine (as-fabricated) state, the Br additive exists entirely as Br- anions from the Et4NBr salt dissolved in the electrolyte. No electrochemical oxidation has occurred yet, so the Br-/Brn- redox couple remains fully in the reduced Br- state.
Reasoning source: Page 5, section 'The Br-/Brn- redox couple as the dead-Se revitalizer'
Scoring Rubric (total: 100 pts)
| Q | Type | Max | Question | Reference Answer | Scoring Criteria |
|---|---|---|---|---|---|
| q1 | identification | 30 | Based on the sample conditions, what is the expected dominant Br species in the pristine Zn||Se cell, and what is its oxidation state? | The expected dominant Br species in the pristine Zn||Se cell is Br- with an oxidation state of -1, accounting for a fraction of 1.0 (100%). This occurs because the cell is in its pristine, as-fabricated state at open circuit voltage (OCV). Under these specific conditions, the bromine originates entirely from the Et4NBr salt dissolved in the 0.1 m Et4NBr-added a-ZCE electrolyte. Since no electrochemical oxidation has occurred yet, the Br-/Brn- redox couple remains fully in the reduced Br- state. | Full credit for identifying Br- (bromide anion) as the dominant species with an oxidation state of -1, originating from the Et4NBr additive before any electrochemical cycling. |
| q2 | spectral | 40 | Describe the expected distinguishing spectral features of the Br K-edge XANES spectrum for this pristine sample compared to a fully charged sample. Specifically, address the relative edge position and the presence or absence of any pre-edge peaks. | The Br K-edge XANES spectrum for this pristine sample exhibits a standard absorption edge profile for Br- anions that is positively shifted (relatively higher) compared to the fully charged state. Additionally, the spectrum completely lacks any pronounced pre-edge features, specifically missing the peak at 13473 eV seen in charged samples. These spectral features arise because the cell is in a pristine, uncharged state where the bromine additive exists solely as reduced Br- anions from the Et4NBr electrolyte salt. Because no electrochemical oxidation has taken place, the oxidized Brn- species responsible for the pre-edge features are entirely absent. | Full credit for stating that the pristine spectrum has a positively shifted absorption edge relative to the charged state and lacks the pronounced peak at 13473 eV. |
| q3 | reasoning | 30 | If a pronounced peak at 13473 eV were to appear in the Br K-edge spectrum, what specific electronic transition and chemical species would it indicate, and why is it absent in this pristine sample? | A pronounced peak at 13473 eV would indicate a 1s to 4p electron transition corresponding to oxidized Brn- species. This peak is completely absent in the current sample because the Zn||Se cell is in a pristine, as-fabricated state at open circuit voltage. Under these initial conditions, the bromine additive exists entirely as reduced Br- anions (-1 oxidation state) originating from the dissolved Et4NBr salt in the electrolyte. Since no electrochemical charging has occurred to drive the Br-/Brn- redox couple toward oxidation, the oxidized Brn- species and its associated 1s to 4p transition cannot form. | Full credit for explaining that a peak at 13473 eV corresponds to a 1s to 4p electron transition indicating the generation of holes in Br 4p orbitals (oxidized Brn- species), which is absent in the pristine sample because no electrochemical oxidation of the Br- anions has occurred yet. |
Review
#909
Se-AC composite
Br K-edge
▶
LLM Prompt
Sample Information
Material: Se-AC composite
Electrode Type: cathode
Electrolyte: 0.1 m Et4NBr-added a-ZCE (a-ZCE-Br)
Cell Type: coin cell
Charge Discharge: charged
State Of Charge: fully charged
Cycle Number: 1
Sample-Specific Conditions
- state of charge: fully charged
- Fully charged Zn||Se cell with Br additive
Measurement
We plan to measure the Br K-edge XANES spectrum of this sample.
Questions
Based on all the information above:
1. What Br species is expected to dominate in the fully charged state of the Zn||Se cell with Et4NBr additive, and what is the physical reasoning based on the electrochemical process?
2. Describe the expected spectral features of the Br K-edge XANES for this fully charged sample, specifically regarding the edge position and any prominent peaks.
3. What is the electronic origin of the pronounced peak expected at 13473 eV in the Br K-edge XANES spectrum of the fully charged cell?
Ground Truth
Material: Zn||Se cell with a-ZCE-Br electrolyte
Measurement: Br K-edge XANES, transmission mode
Fit method: not reported
Phase fractions: (±10%)
| Phase | Fraction |
|---|---|
| Brn- | 1.0 |
Source evidence: Figure 4b, page 5
Key reasoning: At the fully charged state, the Br K-edge XANES spectrum shows a negatively shifted adsorption edge compared to the pristine cell, evidencing the oxidation of Br- anions. A pronounced peak at 13473 eV emerges, corresponding to the 1s to 4p electron transition. This signifies the generation of holes in Br 4p orbitals, indicative of the formation of Brn- species.
Reasoning source: Page 5, Results section 'The Br-/Brn- redox couple as the dead-Se revitalizer'
Scoring Rubric (total: 99 pts)
| Q | Type | Max | Question | Reference Answer | Scoring Criteria |
|---|---|---|---|---|---|
| q1 | reasoning | 33 | What Br species is expected to dominate in the fully charged state of the Zn||Se cell with Et4NBr additive, and what is the physical reasoning based on the electrochemical process? | The dominant species expected is Brn- (where 3 ≤ n ≤ 7), which accounts for a fraction of 1.0. In the fully charged state of the Zn||Se cell with the Et4NBr additive, the initial Br- anions in the electrolyte undergo an electrochemical oxidation process. This oxidation generates holes in the Br 4p orbitals, leading to the formation of polybromide Brn- species. Consequently, because the cell has been fully charged, the sample is entirely composed of these oxidized Brn- species rather than the pristine Br- anions. | Full points if the answer identifies Brn- species and explains that it forms due to the oxidation of Br- anions during the charging process. |
| q2 | spectral | 33 | Describe the expected spectral features of the Br K-edge XANES for this fully charged sample, specifically regarding the edge position and any prominent peaks. | The Br K-edge XANES spectrum is expected to exhibit a negatively shifted adsorption edge compared to the pristine Br- state, along with a pronounced peak at 13473 eV. These spectral features arise directly from the fully charged state of the Zn||Se cell, where the Br- additive has been electrochemically oxidized into Brn- species. This oxidation process generates holes in the Br 4p orbitals, which electronically manifests as the emergence of the 13473 eV peak corresponding to a 1s to 4p electron transition. Therefore, this distinct peak and edge shift serve to distinguish the newly formed Brn- species in the charged state from the original pristine Br- anions. | Full points if the answer mentions a negatively shifted adsorption edge (compared to pristine Br-) and a pronounced peak at 13473 eV. |
| q3 | spectral | 33 | What is the electronic origin of the pronounced peak expected at 13473 eV in the Br K-edge XANES spectrum of the fully charged cell? | The pronounced peak at 13473 eV originates from the electron transition from the 1s core level to the 4p orbitals. Because the Zn||Se cell is in a fully charged state, the Br- anions from the Et4NBr additive are electrochemically oxidized into Brn- species. This oxidation process removes electrons and generates holes in the Br 4p orbitals, creating available unoccupied states for the 1s to 4p transition to occur. As a result, the specific charging conditions of the cell directly produce this distinct 13473 eV spectral feature indicative of Brn- formation. | Full points if the answer correctly attributes the peak at 13473 eV to the electron transition from 1s to 4p. |
Review
Ampere-level co-electrosynthesis of formate from CO2 reduction paired with formaldehyde dehydrogenation reactions
BNL-NSLS-II-8-ID
Catalyst
Zhengyuan Li et al.
DOI: 10.1038/s41467-025-60008-9
2 scenarios
▶
#910
Rh/In2O3
In K-edge
▶
LLM Prompt
Sample Information
Material: Rh/In2O3
Support: In2O3
Sample-Specific Conditions
- absorption edge: In K-edge
- Rhodium-dispersed indium oxide catalyst
Measurement
We plan to measure the In K-edge XANES spectrum of this sample.
Questions
Based on all the information above:
1. What phase dominates the In K-edge XANES spectrum of this Rh-dispersed catalyst, and what reference spectrum is essential for its characterization?
2. Describe the expected spectral shape of the In K-edge XANES for the Rh/In2O3 sample, specifically in comparison to pristine In2O3.
3. Explain why the incorporation of 2.06 wt% Rh into the In2O3 matrix does not significantly alter the In K-edge XANES spectrum.
Ground Truth
Material: Rh/In2O3
Measurement: In K-edge XANES, Beamline 8-ID of NSLS II
Fit method: qualitative comparison
Phase fractions:
| Phase | Fraction |
|---|---|
| In2O3 | 1.0 |
Fit basis (paper's reference spectra):
- In2O3
Source evidence: Fig. 1e, page 7
Key reasoning: The In K-edge XANES spectrum of Rh/In2O3 closely resembles that of pristine In2O3, indicating that the coordination structures of the In2O3 matrix remain intact with Rh incorporation. The Rh species are highly dispersed without disrupting the bulk In2O3 lattice.
Reasoning source: Page 7, Results section
Scoring Rubric (total: 100 pts)
| Q | Type | Max | Question | Reference Answer | Scoring Criteria |
|---|---|---|---|---|---|
| q1 | identification | 30 | What phase dominates the In K-edge XANES spectrum of this Rh-dispersed catalyst, and what reference spectrum is essential for its characterization? | The In K-edge XANES spectrum of this catalyst is entirely dominated by the In2O3 phase, representing a fraction of 1.0, making pristine In2O3 the essential reference spectrum for its characterization. This phase dominance occurs because the sample is a rhodium-dispersed indium oxide catalyst where the Rh species are highly dispersed across the support. The incorporation of 2.06 wt% Rh does not disrupt the bulk In2O3 lattice. Consequently, the bulk oxidation state (+3) and the coordination environment of the indium atoms remain completely intact, yielding a spectrum identical to the pristine support. | Full credit for identifying In2O3 as the dominant phase and the necessary reference spectrum. |
| q2 | spectral | 35 | Describe the expected spectral shape of the In K-edge XANES for the Rh/In2O3 sample, specifically in comparison to pristine In2O3. | The expected spectral shape of the Rh/In2O3 sample is nearly identical to that of pristine In2O3, featuring an edge position at approximately 27940 eV. It exhibits a sharp white line peak around 27950 eV with a normalized intensity of ~1.3, along with identical post-edge oscillatory features. These spectral features arise because the sample consists of highly dispersed Rh on an In2O3 support, which leaves the bulk In2O3 lattice undisrupted. Because the incorporation of the Rh species does not alter the +3 bulk oxidation state or the coordination structures of the indium atoms, the electronic and structural properties of the In2O3 matrix remain intact, perfectly mirroring the pristine reference. | Full credit for stating that the spectrum closely resembles or is nearly identical to pristine In2O3, with a sharp white line peak. |
| q3 | reasoning | 35 | Explain why the incorporation of 2.06 wt% Rh into the In2O3 matrix does not significantly alter the In K-edge XANES spectrum. | The incorporation of 2.06 wt% Rh into the In2O3 matrix does not alter the In K-edge XANES spectrum because the Rh species are highly dispersed throughout the catalyst support. In this rhodium-dispersed indium oxide material, the specific loading and high dispersion of Rh ensure that the bulk In2O3 lattice is not disrupted. As a result, the coordination structures and the +3 bulk oxidation state of the indium atoms remain completely intact. Because XANES is highly sensitive to these local electronic and structural environments, the preservation of the In2O3 matrix yields a spectrum that perfectly resembles pristine In2O3. | Full credit for explaining that the Rh is highly dispersed and the bulk In2O3 coordination structure and In3+ oxidation state remain intact. |
Review
#911
Rh/In2O3
Rh K-edge
▶
LLM Prompt
Sample Information
Material: Rh/In2O3
Support: In2O3
Sample-Specific Conditions
- absorption edge: Rh K-edge
- Rhodium-dispersed indium oxide catalyst
Measurement
We plan to measure the Rh K-edge XANES spectrum of this sample.
Questions
Based on all the information above:
1. Based on the sample preparation (calcination in air at 300 °C), what is the expected oxidation state of Rh in the Rh/In2O3 catalyst, and what reference spectra would be most appropriate to verify this using Rh K-edge XANES?
2. Describe the expected spectral shape of the Rh K-edge XANES for this sample. How would it compare to metallic Rh?
3. Explain the physical reasoning for why Rh is expected to be in this specific state, given the synthesis conditions and the resulting XANES spectrum.
Ground Truth
Material: Rh/In2O3
Measurement: Rh K-edge XANES, Beamline 8-ID of NSLS II
Fit method: qualitative comparison
Phase fractions:
| Phase | Fraction |
|---|---|
| Rh3+ (Rh2O3-like) | 1.0 |
Fit basis (paper's reference spectra):
- Rh2O3
- Rh foil
Source evidence: Page 8, Figure 1f
Key reasoning: The Rh K-edge XANES spectrum of Rh/In2O3 indicates that the Rh oxidation state is very close to +3, as its white line intensity and shape closely resemble the Rh2O3 reference. The absence of metallic Rh features confirms it is fully oxidized.
Reasoning source: Page 8, Results section
Scoring Rubric (total: 100 pts)
| Q | Type | Max | Question | Reference Answer | Scoring Criteria |
|---|---|---|---|---|---|
| q1 | identification | 35 | Based on the sample preparation (calcination in air at 300 °C), what is the expected oxidation state of Rh in the Rh/In2O3 catalyst, and what reference spectra would be most appropriate to verify this using Rh K-edge XANES? | The expected oxidation state of Rh in the Rh/In2O3 catalyst is +3, corresponding to a 1.0 fraction of Rh3+ (Rh2O3-like) species. To verify this using Rh K-edge XANES, the most appropriate reference spectra are Rh2O3 and metallic Rh foil. This fully oxidized state arises because the rhodium-dispersed indium oxide catalyst is subjected to calcination in air at 300 °C, which provides a strong oxidizing environment that drives the complete conversion of Rh to its +3 oxidation state. Consequently, the sample consists entirely of Rh3+ species without any metallic Rh contributions. | Full points for identifying the +3 oxidation state and suggesting Rh2O3 and Rh foil as appropriate references for comparison. |
| q2 | spectral | 35 | Describe the expected spectral shape of the Rh K-edge XANES for this sample. How would it compare to metallic Rh? | The Rh K-edge XANES spectrum for the Rh/In2O3 sample exhibits a prominent white line peak that is characteristic of oxidized Rh3+. Its spectral shape and intensity closely match the Rh2O3 reference spectrum while completely lacking the features associated with metallic Rh foil. These spectral features arise because the rhodium-dispersed indium oxide catalyst exists in a fully oxidized +3 state, driven by the sample's oxidizing preparation conditions. The absence of metallic Rh features in the spectrum confirms that the Rh species are entirely oxidized to Rh3+ rather than remaining in a reduced metallic state. | Full points for mentioning a prominent white line peak characteristic of Rh3+ and stating it would closely resemble Rh2O3 while lacking features of metallic Rh foil. |
| q3 | reasoning | 30 | Explain the physical reasoning for why Rh is expected to be in this specific state, given the synthesis conditions and the resulting XANES spectrum. | The Rh in the Rh/In2O3 catalyst is expected to be in a fully oxidized +3 state, existing entirely as a Rh2O3-like species. This specific state results from the synthesis conditions, specifically the calcination in air at 300 °C, which provides a sufficiently oxidizing environment to completely oxidize the dispersed rhodium on the indium oxide support. The resulting Rh K-edge XANES spectrum confirms this physical state by displaying a prominent white line intensity and shape that closely resemble the Rh2O3 reference. Furthermore, the complete absence of metallic Rh spectral features verifies that the oxidation to Rh3+ is complete, with no residual metallic Rh remaining in the catalyst. | Full points for explaining that calcination in air leads to fully oxidized Rh3+ species, and the XANES spectrum confirms this by matching the Rh2O3 reference and showing no metallic character. |
Review
Overcoming activity/stability tradeoffs in CO oxidation catalysis by Pt/CeO2
ESRF-BM23
Catalyst
Benjamin Bohigues et al.
DOI: 10.1038/s41467-025-62726-6
6 scenarios
▶
#912
Pt/CeO2
Pt L3-edge
▶
LLM Prompt
Sample Information
Material: Pt/CeO2
Support: CeO2-HS
Sample-Specific Conditions
- Support type and treatment: High surface area CeO2, Calcined
- Conventional high surface area CeO2 supported Pt catalyst after calcination
Measurement
We plan to measure the Pt L3-edge XANES spectrum of this sample.
Questions
Based on all the information above:
1. If this calcined sample is measured by both ex-situ XANES (at ambient pressure) and XPS (under ultra-high vacuum), how might the observed oxidation states differ and what physical phenomenon explains this discrepancy?
Ground Truth
Material: Pt/CeO2-HS
Measurement: Pt L3-edge XANES, fluorescence mode, BM23 beamline at ESRF
Fit method: XPS peak fitting (XANES was analyzed qualitatively by comparison to references)
Phase fractions: (±15%)
| Phase | Fraction |
|---|---|
| Pt4+ | 0.15 |
| Pt2+ | 0.85 |
Fit basis (paper's reference spectra):
- PtO2
- Pt foil
Source evidence: Figure 1b (XANES), Figure 1d (XPS), Page 2 text
Key reasoning: Calcination in air at 450 °C stabilizes quasi atomically dispersed PtOx species. The Pt L3-edge XANES spectrum shows a white-line intensity similar to bulk PtO2, indicating an average oxidation state of ~+4 under ambient conditions. However, XPS measurements show a mixture of 15% Pt4+ and 85% Pt2+. The authors attribute this discrepancy between XAS (4+) and XPS (2+) to the notable differences in O2 partial pressures during the experiments (ambient for XAS vs ultra-high vacuum for XPS), which causes partial reduction of the cationic Pt species during XPS analysis.
Reasoning source: Page 2, Section 'Pt on conventional CeO2 supports (control experiments)'
Scoring Rubric (total: 100 pts)
| Q | Type | Max | Question | Reference Answer | Scoring Criteria |
|---|---|---|---|---|---|
| q2 | reasoning | 100 | If this calcined sample is measured by both ex-situ XANES (at ambient pressure) and XPS (under ultra-high vacuum), how might the observed oxidation states differ and what physical phenomenon explains this discrepancy? | When measuring the calcined Pt/CeO2-HS sample, ex-situ XANES at ambient pressure indicates an average oxidation state of ~+4 (similar to bulk PtO2), whereas XPS under ultra-high vacuum reveals a more reduced state consisting of 15% Pt4+ and 85% Pt2+. This discrepancy occurs because the initial calcination treatment stabilizes quasi-atomically dispersed PtOx species on the high surface area CeO2 support. These highly dispersed cationic Pt species are sensitive to the surrounding oxygen partial pressure. Consequently, the ultra-high vacuum environment required for XPS induces a partial reduction of the Pt species, while the ambient pressure during XANES preserves the fully oxidized Pt4+ state. | Full credit for explaining that XANES will show a higher oxidation state (~+4) while XPS will show a lower/reduced oxidation state (predominantly +2), and attributing this to the difference in O2 partial pressures (ambient vs. ultra-high vacuum) causing partial reduction of the Pt species. |
Review
#913
Pt/CeO2
Pt L3-edge
▶
LLM Prompt
Sample Information
Material: Pt/CeO2
Support: CeO2-HS
Sample-Specific Conditions
- Support type and treatment: High surface area CeO2, CO-treated
- Conventional high surface area CeO2 supported Pt catalyst after CO reduction
Measurement
We plan to measure the Pt L3-edge XANES spectrum of this sample.
Questions
Based on all the information above:
1. What reference spectra are appropriate to evaluate the oxidation state changes of this Pt/CeO2 catalyst during XANES analysis?
2. Based on the sample conditions (conventional high surface area CeO2 support, reduced in CO at 300 °C), estimate the phase fractions of the Pt species present.
3. Explain why the CO treatment at 300 °C results in this specific mixture of Pt phases rather than a fully reduced state.
Ground Truth
Material: Pt/CeO2-HS
Measurement: Pt L3-edge XANES, fluorescence mode, BM23 beamline at ESRF
Fit method: XPS peak fitting (for quantitative fractions) and qualitative XANES white-line comparison
Phase fractions: (±10%)
| Phase | Fraction |
|---|---|
| Pt2+ | 0.21 |
| Pt0 | 0.79 |
Fit basis (paper's reference spectra):
- Pt foil
- PtO2
Source evidence: Figure 1b (XANES) and Figure 1d (XPS), page 2
Key reasoning: Treatment of the calcined Pt/CeO2-HS sample with CO at 300 °C leads to the reduction of atomically dispersed oxidized Pt species into metallic Pt clusters (nanoparticles). However, the reduction is not complete, and metallic Pt co-exists with oxidized Pt centers. This partial reduction is evidenced by a drop in the XANES white-line intensity relative to the calcined sample, and the appearance of a dominant Pt0 component alongside residual Pt2+ in the XPS spectra.
Reasoning source: Results section, 'Pt on conventional CeO2 supports (control experiments)', page 2
Scoring Rubric (total: 101 pts)
| Q | Type | Max | Question | Reference Answer | Scoring Criteria |
|---|---|---|---|---|---|
| q1 | identification | 25 | What reference spectra are appropriate to evaluate the oxidation state changes of this Pt/CeO2 catalyst during XANES analysis? | The appropriate reference spectra for evaluating the oxidation state changes in this sample are Pt foil (representing Pt0) and PtO2 (representing oxidized Pt). These specific references are required because treating the calcined Pt/CeO2-HS catalyst with CO at 300 °C drives the reduction of atomically dispersed oxidized Pt species into metallic Pt clusters. However, because this reduction is incomplete under these conditions, metallic Pt co-exists with residual oxidized Pt centers. Using both references allows for the accurate evaluation of this partial reduction, which manifests as a drop in the XANES white-line intensity relative to the fully calcined sample. | Full credit for identifying metallic Pt (Pt foil) and a fully oxidized Pt reference (such as PtO2) as the necessary basis standards. |
| q2 | quantification | 38 | Based on the sample conditions (conventional high surface area CeO2 support, reduced in CO at 300 °C), estimate the phase fractions of the Pt species present. | The estimated phase fractions for this catalyst are 0.79 (79%) Pt0 and 0.21 (21%) Pt2+, with an uncertainty of 10%. These specific values arise because the CO treatment at 300 °C on the conventional high surface area CeO2 support triggers the reduction of atomically dispersed oxidized Pt species into metallic Pt nanoparticles, forming the dominant 79% Pt0 phase. However, the reduction conditions are not sufficient to fully reduce the metal. Consequently, an incomplete reduction occurs, leaving a residual 21% fraction of oxidized Pt2+ centers that co-exist with the metallic clusters. | Full credit for estimating a predominantly metallic Pt0 phase (~75-85%) with a minor co-existing oxidized Pt2+ phase (~15-25%). |
| q3 | reasoning | 38 | Explain why the CO treatment at 300 °C results in this specific mixture of Pt phases rather than a fully reduced state. | The CO treatment at 300 °C results in a mixed phase of 79% Pt0 and 21% Pt2+ because the reduction process on the conventional high surface area CeO2 support is incomplete. Under these specific conditions, the initially atomically dispersed oxidized Pt species are largely, but not entirely, converted into metallic Pt clusters (nanoparticles). The conditions are insufficient to achieve a fully reduced state, forcing the newly formed metallic Pt to co-exist with residual oxidized Pt centers. This partial reduction mechanism is directly evidenced by a drop in the XANES white-line intensity relative to the calcined sample, rather than a complete elimination of the oxidized features. | Full credit for explaining that while CO at 300 °C reduces atomically dispersed oxidized Pt into metallic Pt nanoparticles, the reduction is incomplete due to strong metal-support interactions with the CeO2 support, leading to the co-existence of metallic Pt clusters and residual oxidized Pt centers. |
Review
#914
Pt/CeO2
Pt L3-edge
▶
LLM Prompt
Sample Information
Material: Pt/CeO2
Support: CeO2-HS
Sample-Specific Conditions
- Support type and treatment: High surface area CeO2, Reacted at 500 °C
- Conventional high surface area CeO2 supported Pt catalyst after reaction in O2-rich conditions
Measurement
We plan to measure the Pt L3-edge XANES spectrum of this sample.
Questions
Based on all the information above:
1. What candidate reference spectra are needed to evaluate the oxidation state of this Pt/CeO2-HS sample using XANES?
2. Explain the physical and chemical reasoning for why this specific phase composition is observed after the 500 °C O2-rich reaction, especially compared to a previously reduced state.
Ground Truth
Material: Pt/CeO2-HS
Measurement: Pt L3-edge XANES, fluorescence mode, BM23 beamline at ESRF
Fit method: XPS peak fitting (for explicit fractions) and qualitative XANES white-line comparison
Phase fractions: (±15%)
| Phase | Fraction |
|---|---|
| Pt4+ | 0.1 |
| Pt2+ | 0.9 |
| Pt0 | 0.0 |
Fit basis (paper's reference spectra):
- Pt foil
- PtO2
Source evidence: Figure 1b (XANES), Figure 1d (XPS), Page 3 text
Key reasoning: Exposure of the CO-treated Pt/CeO2-HS catalyst to O2-rich conditions at 500 °C causes severe deactivation. This is due to the reversible transformation of partially reduced metallic Pt nanoparticles back into oxidized Pt species (PtOx and atomically dispersed Pt). This re-oxidation and oxidative fragmentation are evidenced by the recovery of a high white-line intensity in the XANES spectrum and the predominance of oxidized species (90% Pt2+ and 10% Pt4+) with no metallic Pt remaining.
Reasoning source: Page 3, 'Pt on conventional CeO2 supports (control experiments)' section
Scoring Rubric (total: 100 pts)
| Q | Type | Max | Question | Reference Answer | Scoring Criteria |
|---|---|---|---|---|---|
| q1 | identification | 40 | What candidate reference spectra are needed to evaluate the oxidation state of this Pt/CeO2-HS sample using XANES? | To evaluate the oxidation state of this Pt/CeO2-HS sample, the required candidate reference spectra are Pt foil (for Pt0) and PtO2 (for Pt4+). These references are necessary because reacting the high surface area CeO2-supported Pt catalyst at 500 °C in O2-rich conditions drives the reversible transformation of any previously reduced metallic Pt nanoparticles back into oxidized Pt species. Specifically, this high-temperature oxidative treatment causes re-oxidation and oxidative fragmentation of the platinum into PtOx and atomically dispersed Pt. Consequently, the sample is expected to contain a mixture of oxidized species with no remaining metallic Pt, requiring these specific metallic and fully oxidized references to bound and evaluate the spectral features. | Full credit for identifying metallic Pt (Pt foil) and fully oxidized Pt (PtO2) as the necessary reference spectra. |
| q3 | reasoning | 60 | Explain the physical and chemical reasoning for why this specific phase composition is observed after the 500 °C O2-rich reaction, especially compared to a previously reduced state. | The observed phase composition of 90% Pt2+, 10% Pt4+, and 0% Pt0 results directly from the severe deactivation of the catalyst under the specific reaction conditions. When the previously reduced (CO-treated) Pt/CeO2-HS catalyst is exposed to O2-rich conditions at 500 °C, the metallic Pt nanoparticles undergo a reversible transformation. This high-temperature oxygen exposure drives both re-oxidation and oxidative fragmentation of the platinum into PtOx and atomically dispersed Pt species. As a result, the metallic Pt is completely consumed, leading to a predominantly oxidized state that is evidenced by the recovery of a high white-line intensity in the XANES spectrum. | Full credit for explaining that the high-temperature O2-rich conditions drive a reversible transformation (re-oxidation and oxidative fragmentation) of metallic Pt nanoparticles into oxidized Pt species (PtOx and atomically dispersed Pt cations), leading to catalyst deactivation. |
Review
#915
Pt/CeO2
Pt L3-edge
▶
LLM Prompt
Sample Information
Material: Pt/CeO2
Support: CeO2-Derived (from UiO-66 MOF)
Sample-Specific Conditions
- Support type and treatment: MOF-derived CeO2, Calcined
- MOF-derived CeO2 supported Pt catalyst after calcination
Measurement
We plan to measure the Pt L3-edge XANES spectrum of this sample.
Questions
Based on all the information above:
1. What candidate phases or reference spectra should be considered to model the Pt speciation in this MOF-derived Pt/CeO2 catalyst after calcination in O2 at 450 °C?
2. Based on the specific support (MOF-derived CeO2) and treatment (calcination in O2 at 450 °C), estimate the phase fractions of the Pt species present in the sample.
Ground Truth
Material: Pt/CeO2-Derived
Measurement: Pt L3-edge XANES, fluorescence mode, BM23 beamline at ESRF
Fit method: XPS peak fitting (XANES was analyzed qualitatively by white-line intensity comparison)
Phase fractions: (±15%)
| Phase | Fraction |
|---|---|
| Pt4+ | 0.19 |
| Pt2+ | 0.73 |
| Pt0 | 0.08 |
Fit basis (paper's reference spectra):
- Pt foil (Pt0)
- PtO2 (Pt4+)
- Pt2+ species
Source evidence: Figure 3b (XANES) and Figure 3d (XPS), page 4
Key reasoning: The calcined Pt/CeO2-Derived sample comprises a mixture of oxidized PtOx species (single atoms and small clusters) and metallic Pt nanoparticles when calcined in air at 450 °C. The Pt L3-edge XANES white-line is less intense than that of conventional high-surface-area Pt/CeO2 (Pt/CeO2-HS), denoting less oxidized Pt species on average. XPS confirms this by showing a mixture of Pt4+ (19%), Pt2+ (73%), and a non-negligible amount of metallic Pt0 (8%). This indicates that the MOF-derived CeO2 support stabilizes some metallic Pt that is resilient to deactivating oxidation even after high-temperature calcination.
Reasoning source: Page 4, 'Highly active, highly stable Pt/CeO2 catalysts' section
Scoring Rubric (total: 100 pts)
| Q | Type | Max | Question | Reference Answer | Scoring Criteria |
|---|---|---|---|---|---|
| q1 | identification | 40 | What candidate phases or reference spectra should be considered to model the Pt speciation in this MOF-derived Pt/CeO2 catalyst after calcination in O2 at 450 °C? | The candidate phases to consider for modeling the Pt speciation are Pt foil (Pt0), PtO2 (Pt4+), and Pt2+ species. These specific references are required because calcination of the MOF-derived Pt/CeO2 sample at 450 °C produces a mixture of oxidized PtOx species (single atoms and small clusters) alongside metallic Pt nanoparticles. The MOF-derived CeO2 support uniquely stabilizes some metallic Pt, making it resilient to complete deactivating oxidation despite the high-temperature treatment. As a result, the sample exhibits a less intense XANES white-line compared to conventional Pt/CeO2, necessitating a basis set that accounts for this specific mixture of Pt0, Pt2+, and Pt4+ oxidation states. | Full credit for identifying a mixture of metallic Pt (Pt0) and oxidized Pt species (Pt2+ and Pt4+ or PtO2). Partial credit for missing one of the oxidation states. |
| q2 | quantification | 60 | Based on the specific support (MOF-derived CeO2) and treatment (calcination in O2 at 450 °C), estimate the phase fractions of the Pt species present in the sample. | The estimated phase fractions for the Pt species in this sample are 73% Pt2+, 19% Pt4+, and 8% Pt0, with an uncertainty of 15%. These specific values arise because the calcination at 450 °C primarily oxidizes the platinum into PtOx single atoms and small clusters, generating the dominant Pt2+ and Pt4+ fractions. However, the MOF-derived CeO2 support uniquely stabilizes a non-negligible amount of metallic Pt nanoparticles, preventing their complete deactivating oxidation during the high-temperature treatment. Consequently, the sample retains an 8% Pt0 fraction, reflecting an overall less oxidized state on average compared to conventional high-surface-area Pt/CeO2 catalysts. | Full credit if the estimated fractions are within ±15% of the ground truth (Pt4+: ~19%, Pt2+: ~73%, Pt0: ~8%). Partial credit if the dominant phase is correctly identified as Pt2+ with minor Pt4+ and Pt0 contributions. |
Review
#916
Pt/CeO2
Pt L3-edge
▶
LLM Prompt
Sample Information
Material: Pt/CeO2
Support: CeO2-Derived (from UiO-66 MOF)
Sample-Specific Conditions
- Support type and treatment: MOF-derived CeO2, CO-treated
- MOF-derived CeO2 supported Pt catalyst after CO reduction
Measurement
We plan to measure the Pt L3-edge XANES spectrum of this sample.
Questions
Based on all the information above:
1. What candidate phases or reference spectra should be considered to model the Pt speciation in the MOF-derived Pt/CeO2 sample after CO reduction at 300 °C?
2. Explain the physical reasoning for why this specific CO treatment on the MOF-derived support results in this phase composition and what structural changes occur to the Pt species.
Ground Truth
Material: Pt/CeO2-Derived
Measurement: Pt L3-edge XANES, fluorescence mode, BM23 beamline at ESRF
Fit method: XPS peak fitting (used to quantify fractions; XANES used qualitatively)
Phase fractions: (±15%)
| Phase | Fraction |
|---|---|
| Pt2+ | 0.33 |
| Pt0 | 0.67 |
Fit basis (paper's reference spectra):
- Pt foil
- PtO2
Source evidence: Figure 3b (XANES) and Figure 3d (XPS), page 5
Key reasoning: Treatment of the calcined MOF-derived Pt/CeO2 sample with CO at 300 °C reduces a significant portion of the oxidized Pt species to metallic Pt nanoparticles. This reduction is evidenced by a decreased white-line intensity in the XANES spectrum relative to the calcined counterpart, and the appearance of a dominant Pt0 component (67%) alongside residual Pt2+ (33%) in the XPS data. The CO treatment is necessary to reduce the metal and mobilize it into the V-shaped pockets of the CeO2 support, resulting in a mixture of reduced and oxidized Pt species.
Reasoning source: Page 5 (Results section) and Page 8 (Mechanistic considerations)
Scoring Rubric (total: 100 pts)
| Q | Type | Max | Question | Reference Answer | Scoring Criteria |
|---|---|---|---|---|---|
| q1 | identification | 45 | What candidate phases or reference spectra should be considered to model the Pt speciation in the MOF-derived Pt/CeO2 sample after CO reduction at 300 °C? | To model the Pt speciation in the MOF-derived Pt/CeO2 sample after CO reduction, the candidate reference spectra to consider are Pt foil (representing Pt0) and PtO2 (representing Pt2+). These specific phases are expected because treating the calcined MOF-derived Pt/CeO2 sample with CO at 300 °C reduces a significant portion of the oxidized Pt species into metallic Pt nanoparticles. However, the reduction is not complete, leaving a mixture of reduced and oxidized Pt species. This mixed speciation occurs because the CO treatment mobilizes the metal into the V-shaped pockets of the CeO2 support, which stabilizes both the newly formed metallic Pt and the residual oxidized Pt2+. | Full credit for identifying a mixture of metallic Pt (Pt0) and partially oxidized Pt (Pt2+). |
| q4 | reasoning | 55 | Explain the physical reasoning for why this specific CO treatment on the MOF-derived support results in this phase composition and what structural changes occur to the Pt species. | The CO treatment of the calcined MOF-derived Pt/CeO2 sample at 300 °C acts as a reducing agent that converts a significant portion of the initially oxidized Pt species into metallic Pt nanoparticles. This specific treatment is necessary to not only reduce the metal but also to mobilize it into the V-shaped pockets of the MOF-derived CeO2 support. As a result of this mobilization and stabilization by the support's unique structure, the reduction is incomplete, yielding a mixed-phase composition of 67% Pt0 and 33% Pt2+. Structurally, this transformation is evidenced by a decreased white-line intensity in the XANES spectrum compared to the calcined sample, reflecting the transition from oxidized Pt to metallic nanoparticles. | Full credit for explaining that CO treatment partially reduces the oxidized Pt to metallic Pt nanoparticles and mobilizes them into V-shaped pockets/stepped sites on the CeO2 support, leaving a mixture of Pt0 and residual oxidized Pt. |
Review
#917
Pt/CeO2
Pt L3-edge
▶
LLM Prompt
Sample Information
Material: Pt/CeO2
Support: CeO2-Derived (from UiO-66 MOF)
Sample-Specific Conditions
- Support type and treatment: MOF-derived CeO2, Reacted at 500 °C
- MOF-derived CeO2 supported Pt catalyst after reaction in O2-rich conditions
Measurement
We plan to measure the Pt L3-edge XANES spectrum of this sample.
Questions
Based on all the information above:
1. What reference spectra or candidate phases should be considered when analyzing the Pt L3-edge XANES spectrum of this sample to account for its mixed oxidation states?
2. Based on the sample history (reaction in O2-rich conditions at 500 °C) and the unique MOF-derived CeO2 support, estimate the phase fractions of the Pt species present.
Ground Truth
Material: Pt/CeO2-Derived
Measurement: Pt L3-edge XANES, fluorescence mode, BM23 beamline at ESRF
Fit method: Phase fractions determined via XPS fitting (XANES LCF not performed in paper)
Phase fractions: (±15%)
| Phase | Fraction |
|---|---|
| Pt2+ | 0.52 |
| Pt0 | 0.48 |
Fit basis (paper's reference spectra):
- Pt foil
- PtO2
Source evidence: Figure 3b (XANES) and Figure 3d (XPS), page 5
Key reasoning: After reaction in an O2-rich mixture at 500 °C, the Pt/CeO2-Derived sample undergoes partial re-oxidation. However, unlike conventional Pt/CeO2 catalysts that fully oxidize and deactivate under these harsh conditions, this MOF-derived sample retains a significant fraction of metallic Pt (48% Pt0). This stability is attributed to the trapping of Pt nanoparticles within V-shaped pockets and stepped sites of the CeO2 support, which inhibit the re-oxidation paths.
Reasoning source: Page 5 (Results: Highly active, highly stable Pt/CeO2 catalysts) and Page 8 (Mechanistic considerations)
Scoring Rubric (total: 100 pts)
| Q | Type | Max | Question | Reference Answer | Scoring Criteria |
|---|---|---|---|---|---|
| q1 | identification | 40 | What reference spectra or candidate phases should be considered when analyzing the Pt L3-edge XANES spectrum of this sample to account for its mixed oxidation states? | When analyzing the Pt L3-edge XANES spectrum of this sample, the reference spectra that should be considered are Pt foil (metallic Pt0) and PtO2 (oxidized Pt). These specific phases are expected because the Pt/CeO2-Derived catalyst undergoes partial re-oxidation after reacting in an O2-rich mixture at 500 °C. While conventional catalysts would fully oxidize under these harsh conditions, the unique MOF-derived CeO2 support traps the Pt nanoparticles within V-shaped pockets and stepped sites. This structural trapping inhibits complete re-oxidation pathways, resulting in the coexistence of both metallic and oxidized platinum phases. | Full credit for identifying metallic Pt (Pt foil) and oxidized Pt (PtO2 or Pt2+ species) as necessary references. |
| q2 | quantification | 60 | Based on the sample history (reaction in O2-rich conditions at 500 °C) and the unique MOF-derived CeO2 support, estimate the phase fractions of the Pt species present. | The estimated phase fractions for this sample are 52% Pt2+ (oxidized) and 48% Pt0 (metallic), with an uncertainty of 15%. These specific values result from the sample's exposure to an O2-rich reaction mixture at 500 °C, which drives the partial re-oxidation of the platinum. However, unlike conventional Pt/CeO2 catalysts that fully oxidize and deactivate under such harsh conditions, this sample retains nearly half of its metallic Pt0 fraction. This remarkable stability occurs because the MOF-derived CeO2 support traps the Pt nanoparticles in V-shaped pockets and stepped sites, effectively inhibiting the complete re-oxidation pathways. | Full credit for estimating a roughly equal mixture of Pt0 (~48%) and oxidized Pt (Pt2+, ~52%). Partial credit for identifying that it is a mixed phase with a significant metallic component remaining. |
Review
Dynamics and control of active sites in cobalt diselenide catalysts for overall water electrolysis
ESRF-BM23
Catalyst
Yonggui Zhao et al.
DOI: 10.1038/s41467-025-65210-3
6 scenarios
▶
#918
o-CoSe2
Co K-edge
▶
LLM Prompt
Sample Information
Material: o-CoSe2
Reaction Conditions: 0.5 M H2SO4, operando HER, cathodic polarization
Sample-Specific Conditions
- electrolyte pH: 0.5 M H2SO4 (pH ~0)
- orthorhombic cobalt diselenide under acidic HER conditions
Measurement
We plan to measure the Co K-edge XANES spectrum of this sample.
Questions
Based on all the information above:
1. Describe the expected behavior of the Co K-edge white line feature (~7725 eV) for o-CoSe2 upon immersion and subsequent cathodic polarization under acidic HER conditions.
2. Based on the operando XANES data, what physical transformation explains the initial spectral changes of o-CoSe2 upon immersion in the acidic electrolyte, and what is the resulting active structural motif?
3. What is the stabilized Co oxidation state for o-CoSe2 during the acidic HER at -125 mV vs. RHE, and what electronic transition is responsible for the main white line feature?
4. How does the initial operando XANES spectral response (prior to cathodic polarization) of o-CoSe2 in acidic media distinguish it from its behavior in alkaline media?
Ground Truth
Material: o-CoSe2
Measurement: Operando Co K-edge XANES in fluorescence mode at KMC-2 beamline
Fit method: Linear combination fitting (LCF)
Phase fractions: (±10%)
| Phase | Fraction |
|---|---|
| disordered Co-Se-Co moieties | 1.0 |
Fit basis (paper's reference spectra):
- pristine o-CoSe2
- oxidized surface species
Source evidence: Figure 3a, Figure 3b, Page 5
Key reasoning: Under acidic conditions, o-CoSe2 experiences surface corrosion/etching upon immersion, which dissolves surface oxyanionic species into the electrolyte and leads to structural distortions of the [CoSe6] motifs. Subsequent cathodic polarization drives the reduction of the Co valence state, forming highly disordered Co-Se-Co moieties that act as the active sites for the acidic HER, while the bulk structural integrity is maintained.
Reasoning source: Page 5, 'HER monitoring and kinetics at pH 0 and 14' section
Scoring Rubric (total: 100 pts)
| Q | Type | Max | Question | Reference Answer | Scoring Criteria |
|---|---|---|---|---|---|
| q1 | spectral | 25 | Describe the expected behavior of the Co K-edge white line feature (~7725 eV) for o-CoSe2 upon immersion and subsequent cathodic polarization under acidic HER conditions. | The Co K-edge white line feature at ~7725 eV will exhibit an immediate decrease in peak intensity upon immersion in the acidic electrolyte, followed by remaining almost identical and stable throughout the subsequent cathodic polarization. Additionally, the absorption edge shifts to a lower energy. This spectral behavior occurs because the highly acidic 0.5 M H2SO4 environment causes immediate surface corrosion and etching upon immersion, dissolving surface oxyanionic species. The subsequent stability of the white line and the shift to lower energy during cathodic polarization reflect the reduction of the Co valence state to +0.86 and the formation of highly disordered Co-Se-Co moieties, all while the overall bulk structural integrity of the o-CoSe2 is maintained. | Full points if the answer states that the white line intensity decreases upon immersion (prior to polarization) and then remains almost identical/stable throughout the cathodic polarization. |
| q2 | reasoning | 30 | Based on the operando XANES data, what physical transformation explains the initial spectral changes of o-CoSe2 upon immersion in the acidic electrolyte, and what is the resulting active structural motif? | The initial spectral changes upon immersion are explained by surface corrosion and etching of the o-CoSe2 material. The resulting active structural motif consists of highly disordered Co-Se-Co moieties (reconstructed o-CoSe2) with a fraction of 1.0. In the highly acidic 0.5 M H2SO4 environment, the sample undergoes immediate etching that dissolves surface oxyanionic species into the electrolyte, leading to structural distortions of the initial [CoSe6] motifs. As cathodic polarization is applied for the HER, the Co valence state reduces, driving the complete transformation of the active surface into these disordered Co-Se-Co moieties which serve as the active sites for the acidic HER. | Full points if the answer explains that surface corrosion/etching removes oxidized surface species, leading to structural distortions and the formation of highly disordered Co-Se-Co moieties as the active sites. |
| q3 | identification | 20 | What is the stabilized Co oxidation state for o-CoSe2 during the acidic HER at -125 mV vs. RHE, and what electronic transition is responsible for the main white line feature? | The stabilized Co oxidation state for o-CoSe2 during the acidic HER at -125 mV vs. RHE is +0.86. The main white line feature at ~7725 eV originates from dipolar transitions from the Co 1s core level to 4p hybridized orbitals. This specific oxidation state and spectral signature arise because the acidic 0.5 M H2SO4 conditions and cathodic polarization drive the reduction of the Co valence state from the pristine material. The acidic environment initially etches away surface oxyanionic species, and the applied cathodic potential further reduces the Co sites to form highly disordered Co-Se-Co moieties, which stabilizes the Co valence at +0.86 while maintaining bulk structural integrity. | Full points if the answer identifies the stabilized valence state as +0.86 and attributes the white line to dipolar transitions from Co 1s to 4p hybridized orbitals. |
| q4 | reasoning | 25 | How does the initial operando XANES spectral response (prior to cathodic polarization) of o-CoSe2 in acidic media distinguish it from its behavior in alkaline media? | In acidic media, the Co K-edge white line intensity of o-CoSe2 drops immediately upon immersion and then remains stable, whereas in alkaline conditions, the white line intensity initially increases upon immersion before gradually decreasing. This distinct difference is dictated by the pH of the electrolyte and its specific chemical effect on the material's surface. In the 0.5 M H2SO4 (pH ~0) acidic environment, the sample experiences immediate surface corrosion and etching that dissolves surface oxyanionic species, causing the intensity drop and preserving bulk structural integrity. Conversely, the initial intensity increase in alkaline media is due to surface oxidation upon immersion, a process that is superseded by corrosive etching in the highly acidic conditions. | Full points if the answer contrasts the decrease in white line intensity in acidic media (due to surface etching) with the increase in white line intensity in alkaline media (due to surface oxidation/exchange). |
Review
#919
o-CoSe2
Co K-edge
▶
LLM Prompt
Sample Information
Material: o-CoSe2
Reaction Conditions: 1 M KOH, operando HER, cathodic polarization
Sample-Specific Conditions
- electrolyte pH: 1 M KOH (pH 14)
- orthorhombic cobalt diselenide under alkaline HER conditions
Measurement
We plan to measure the Co K-edge XANES spectrum of this sample.
Questions
Based on all the information above:
1. What is the dominant active phase of o-CoSe2 under alkaline HER conditions (cathodic polarization), and what is the physical mechanism for its formation?
2. Describe the expected changes in the Co K-edge XANES white line feature and the Co oxidation state for o-CoSe2 during cathodic polarization in 1 M KOH.
3. How does the operando XANES spectral evolution of o-CoSe2 under alkaline HER conditions distinguish it from its behavior under acidic HER conditions?
4. If performing Linear Combination Fitting (LCF) on the operando Co K-edge XANES spectra of this sample to track its restructuring, what reference spectra should be included in the fit basis?
Ground Truth
Material: o-CoSe2
Measurement: Operando Co K-edge XANES at Swiss-Norwegian Beamline BM31 (ESRF)
Fit method: Linear combination fitting (LCF)
Phase fractions: (±10%)
| Phase | Fraction |
|---|---|
| metallic Co species (low-valent Se-Co-Co-Se moieties) | 1.0 |
Fit basis (paper's reference spectra):
- o-CoSe2
- Co foil (metallic Co)
- Comm. Co(OH)2
- Comm. Co3O4
- CoOOH
Source evidence: Page 5, Figure 3d (Operando Co K-edge XANES) and inset (Co valence states)
Key reasoning: Under alkaline conditions, o-CoSe2 undergoes a multi-step surface restructuring. Upon immersion, it initially transforms into CoSeOx species, followed by surface interactions with OH- ions to form Co(OH)x-like species. Subsequent cathodic polarization drives the reduction of these species into low-valent metallic Co species (Se-Co-Co-Se moieties), which act as the true catalytically active sites for the HER.
Reasoning source: Page 5, section 'HER monitoring and kinetics at pH 0 and 14'
Scoring Rubric (total: 100 pts)
| Q | Type | Max | Question | Reference Answer | Scoring Criteria |
|---|---|---|---|---|---|
| q1 | reasoning | 30 | What is the dominant active phase of o-CoSe2 under alkaline HER conditions (cathodic polarization), and what is the physical mechanism for its formation? | The dominant active phase is low-valent metallic Co species, specifically Se-Co-Co-Se moieties, which constitute a 1.0 fraction of the active sites. Under the specific sample conditions of 1 M KOH (pH 14), the o-CoSe2 undergoes a multi-step surface restructuring. Upon immersion in the alkaline electrolyte, it initially transforms into CoSeOx species and interacts with OH- ions to form Co(OH)x-like species. The subsequent application of cathodic polarization drives the reduction of these oxidized species into the low-valent metallic Co species, which act as the true catalytically active sites for the hydrogen evolution reaction. | Award full points for identifying metallic Co species (or low-valent Se-Co-Co-Se moieties) and explaining the multi-step restructuring: initial formation of CoSeOx/Co(OH)x-like species followed by potential-driven reduction during cathodic polarization. |
| q2 | spectral | 30 | Describe the expected changes in the Co K-edge XANES white line feature and the Co oxidation state for o-CoSe2 during cathodic polarization in 1 M KOH. | During cathodic polarization, the Co K-edge XANES white line feature at ~7725 eV gradually decreases in intensity, and the rising absorption edge shifts to lower energy. This shift corresponds to a reduction in the Co oxidation state to a minimum of +0.81 at HER-relevant potentials. These spectral changes occur because the alkaline conditions (1 M KOH) and cathodic polarization drive a multi-step surface restructuring of the o-CoSe2. The initial Co(OH)x-like species formed upon immersion in the alkaline electrolyte are reduced by the cathodic potential into low-valent metallic Co species (Se-Co-Co-Se moieties), directly causing the observed decrease in white line intensity and the shift of the absorption edge to lower energies. | Award full points for stating that the white line intensity (~7725 eV, 1s to 4p transition) gradually decreases, and the Co oxidation state reduces to a minimum of approximately +0.81. |
| q3 | prediction | 20 | How does the operando XANES spectral evolution of o-CoSe2 under alkaline HER conditions distinguish it from its behavior under acidic HER conditions? | Under alkaline HER conditions, the Co K-edge XANES spectra show a gradual, potential-dependent decrease in the white line intensity during cathodic polarization, followed by a reversible recovery after the applied potential is removed. In contrast, under acidic HER conditions, the white line remains almost identical after an initial drop. This distinct behavior in 1 M KOH arises because the alkaline environment promotes a specific multi-step surface restructuring mechanism. The o-CoSe2 first interacts with abundant OH- ions to form Co(OH)x-like species, which are then dynamically reduced under cathodic polarization to low-valent metallic Co species (Se-Co-Co-Se moieties) with an oxidation state of +0.81, and re-oxidize when the potential is removed. | Award full points for noting that under alkaline conditions, the white line shows a gradual, potential-dependent decrease and reversible recovery, whereas under acidic conditions, it remains almost identical after an initial drop (structural integrity is maintained). |
| q4 | methodology | 20 | If performing Linear Combination Fitting (LCF) on the operando Co K-edge XANES spectra of this sample to track its restructuring, what reference spectra should be included in the fit basis? | The Linear Combination Fitting (LCF) basis should include o-CoSe2, Co foil (metallic Co), commercial Co(OH)2, commercial Co3O4, and CoOOH. These specific references are required because of the multi-step restructuring mechanism o-CoSe2 undergoes in the 1 M KOH electrolyte. Upon immersion in the alkaline environment, the surface interacts with OH- ions to form oxidized species like Co(OH)x, necessitating the inclusion of Co(OH)2, Co3O4, and CoOOH references. Subsequent cathodic polarization reduces these species into low-valent metallic Co species (Se-Co-Co-Se moieties), requiring the metallic Co foil reference to accurately quantify the 1.0 fraction of this final active phase. | Award full points for listing the pristine material (o-CoSe2), oxidized intermediates (Co(OH)2, CoOOH, Co3O4), and the fully reduced active state (Co foil / metallic Co). |
Review
#920
o-CoSe2
Co K-edge
▶
LLM Prompt
Sample Information
Material: o-CoSe2
Reaction Conditions: 1 M KOH, operando OER, anodic polarization
Sample-Specific Conditions
- reaction type: OER
- orthorhombic cobalt diselenide under alkaline OER conditions
Measurement
We plan to measure the Co K-edge XANES spectrum of this sample.
Questions
Based on all the information above:
1. What phase dominates the o-CoSe2 catalyst under operando alkaline OER conditions, and what drives this transformation?
2. Describe the expected changes in the Co K-edge XANES spectral shape, specifically the white line, during the OER process compared to the pristine catalyst.
3. What electronic transition gives rise to the white line feature in the Co K-edge XANES spectrum of this sample?
4. What is the expected oxidation state of Co at OER-relevant potentials (e.g., 1.5 V vs. RHE), and how is this determined from the XANES spectrum?
Ground Truth
Material: o-CoSe2
Measurement: Co K-edge operando XANES (BM31 at ESRF)
Fit method: linear exploration of rising absorption edge position (for valence state)
Phase fractions: (±10%)
| Phase | Fraction |
|---|---|
| disordered CoO2 | 1.0 |
Fit basis (paper's reference spectra):
- CoOOH
- Co(OH)2
- Co foil
- Comm. Co3O4
Source evidence: Page 6, Fig. 4a, 4b
Key reasoning: Under alkaline OER conditions, o-CoSe2 undergoes potential-driven restructuring into disordered CoO2 species. The white line signatures shift toward higher energy positions with enhanced signal intensities, inferring oxidation of Co centers. The Co valence state reaches a maximum of ca. +2.70 at 1.5 V vs. RHE, indicating the formation of high-valent Co(IV) species which act as the true catalytically active species for the OER.
Reasoning source: Page 6, 'OER monitoring and kinetics at pH 14' section
Scoring Rubric (total: 100 pts)
| Q | Type | Max | Question | Reference Answer | Scoring Criteria |
|---|---|---|---|---|---|
| q1 | reasoning | 30 | What phase dominates the o-CoSe2 catalyst under operando alkaline OER conditions, and what drives this transformation? | Under operando alkaline OER conditions, the o-CoSe2 catalyst is completely dominated by a disordered CoO2 phase, representing a fraction of 1.0. This transformation occurs because the specific conditions of 1 M KOH and anodic polarization drive a potential-induced restructuring of the pristine orthorhombic cobalt diselenide. The alkaline OER environment forces the oxidation of the Co centers, converting the initial material into high-valent Co(IV) species (disordered CoO2) which act as the true catalytically active species for the reaction. | 15 points for identifying disordered CoO2 (or high-valent Co(IV) species) as the dominant phase. 15 points for explaining that it undergoes potential-driven restructuring/oxidation to form the catalytically active species. |
| q2 | spectral | 25 | Describe the expected changes in the Co K-edge XANES spectral shape, specifically the white line, during the OER process compared to the pristine catalyst. | During the OER process, the Co K-edge XANES spectrum exhibits a shift of the rising absorption edge and the white line signature toward higher energy positions. Furthermore, the white line displays enhanced signal intensities compared to the pristine o-CoSe2 catalyst. These spectral changes arise because the anodic polarization in 1 M KOH drives the structural restructuring of o-CoSe2 into disordered CoO2. The higher energy position and increased intensity directly reflect the oxidation of the Co centers to form the high-valent Co(IV) active species required for alkaline OER. | 15 points for mentioning the shift toward higher energy positions. 10 points for mentioning enhanced signal intensities. |
| q3 | spectral | 20 | What electronic transition gives rise to the white line feature in the Co K-edge XANES spectrum of this sample? | The white line feature in the Co K-edge XANES spectrum of this sample originates from dipolar transitions from the Co 1s core level to 4p hybridized orbitals. Under the operando alkaline OER conditions (1 M KOH, anodic polarization), the pristine o-CoSe2 undergoes a potential-driven restructuring into a disordered CoO2 phase. The enhanced intensity and higher energy position of this specific 1s to 4p transition directly reflect the altered electronic structure as the Co centers are oxidized to the high-valent Co(IV) state necessary to catalyze the OER. | 20 points for identifying the origin as dipolar transitions from Co 1s to 4p hybridized orbitals. |
| q4 | reasoning | 25 | What is the expected oxidation state of Co at OER-relevant potentials (e.g., 1.5 V vs. RHE), and how is this determined from the XANES spectrum? | At OER-relevant potentials such as 1.5 V vs. RHE, the expected oxidation state of Co reaches a maximum of approximately +2.70, indicating the presence of high-valent Co(IV) species. This valence state is determined through a linear exploration of the rising absorption edge position in the XANES spectrum. These values result from the anodic polarization in 1 M KOH, which forces the pristine o-CoSe2 to undergo potential-driven restructuring into disordered CoO2. The resulting shift of the absorption edge to higher energies confirms that the alkaline OER conditions successfully drive the oxidation of Co centers to form the true catalytically active species. | 15 points for stating the oxidation state reaches ca. +2.70 or high-valent Co(IV). 10 points for explaining it is determined by the shift of the rising absorption edge position to higher energy. |
Review
#921
c-CoSe2
Co K-edge
▶
LLM Prompt
Sample Information
Material: c-CoSe2
Reaction Conditions: 0.5 M H2SO4, operando HER
Sample-Specific Conditions
- crystal phase: cubic
- cubic cobalt diselenide under acidic HER conditions
Measurement
We plan to measure the Co K-edge XANES spectrum of this sample.
Questions
Based on all the information above:
1. Under operando acidic HER conditions, what is the dominant phase of the c-CoSe2 catalyst, and why does its structural evolution differ from that of o-CoSe2?
2. Describe the expected Co K-edge XANES spectral features for this sample during the acidic HER, specifically focusing on the white line feature at ~7725 eV and its electronic origin.
3. How does the white line intensity of c-CoSe2 compare to that of pristine o-CoSe2, and what does this difference indicate about the surface properties of the material?
Ground Truth
Material: c-CoSe2
Measurement: Operando Co K-edge XANES at KMC-2 beamline (fluorescence mode)
Fit method: Direct spectral comparison / structural integrity analysis
Phase fractions: (±5%)
| Phase | Fraction |
|---|---|
| c-CoSe2 | 1.0 |
Fit basis (paper's reference spectra):
- c-CoSe2
Source evidence: Page 7, 'Decisive factors for restructuring during the HER'; Page 8, 'Discussion'
Key reasoning: Operando time-resolved XAS characterizations demonstrate that c-CoSe2 maintains its structural integrity well throughout the entire operando monitoring under acidic HER conditions. Unlike the orthorhombic phase (o-CoSe2) which undergoes electrochemically driven restructuring and surface corrosion, the cubic phase (c-CoSe2) is thermodynamically more stable and remains intact as the stable catalyst throughout the entire acidic HER.
Reasoning source: Page 7, 'Decisive factors for restructuring during the HER' and Page 8, 'Discussion'
Scoring Rubric (total: 100 pts)
| Q | Type | Max | Question | Reference Answer | Scoring Criteria |
|---|---|---|---|---|---|
| q1 | reasoning | 35 | Under operando acidic HER conditions, what is the dominant phase of the c-CoSe2 catalyst, and why does its structural evolution differ from that of o-CoSe2? | Under the operando acidic HER conditions (0.5 M H2SO4), the dominant phase of the catalyst is 100% c-CoSe2. The cubic cobalt diselenide maintains its structural integrity completely throughout the reaction because it is thermodynamically more stable than the orthorhombic phase (o-CoSe2). Unlike o-CoSe2, which suffers from electrochemically driven restructuring and surface corrosion in this acidic environment, the robust thermodynamic stability of c-CoSe2 ensures it remains intact as the stable catalyst. | The answer must identify that c-CoSe2 remains the sole phase (maintains structural integrity / 100% fraction) and explain that the cubic phase is thermodynamically more stable, preventing the electrochemically driven restructuring and surface corrosion observed in the orthorhombic (o-CoSe2) phase. |
| q2 | spectral | 35 | Describe the expected Co K-edge XANES spectral features for this sample during the acidic HER, specifically focusing on the white line feature at ~7725 eV and its electronic origin. | During the acidic HER in 0.5 M H2SO4, the operando Co K-edge XANES spectrum maintains the pristine spectral shape of c-CoSe2, characterized by a prominent white line at ~7725 eV. This white line feature originates from dipolar transitions from the Co 1s core level to 4p hybridized orbitals. The preservation of these spectral features occurs because the cubic phase is thermodynamically stable under these specific electrochemical conditions, preventing any restructuring. Thus, the unchanging spectral profile directly reflects the preservation of the bulk crystal structure and local coordination environment of the c-CoSe2 catalyst. | The answer must mention the white line feature at ~7725 eV, state that its origin is the dipolar transition from Co 1s to 4p hybridized orbitals, and note that the overall spectral shape remains unchanged from the pristine state due to the material's structural integrity. |
| q3 | identification | 30 | How does the white line intensity of c-CoSe2 compare to that of pristine o-CoSe2, and what does this difference indicate about the surface properties of the material? | The white line feature of c-CoSe2 at ~7725 eV displays a distinctly lower peak intensity when compared to as-prepared o-CoSe2. This lower intensity indicates that surface oxidation is significantly less accessible for the cubic phase than for the orthorhombic phase. Under the specified 0.5 M H2SO4 operando HER conditions, the cubic crystal structure is thermodynamically more stable and resists the electrochemically driven surface corrosion that afflicts o-CoSe2. Consequently, the reduced white line intensity is a direct spectral manifestation of the material's robust structural integrity and resistance to oxidation in the acidic environment. | The answer must state that c-CoSe2 has a lower white line intensity compared to o-CoSe2, which indicates that surface oxidation is less accessible or less prevalent in the cubic phase. |
Review
#922
c-CoSe2
Co K-edge
▶
LLM Prompt
Sample Information
Material: c-CoSe2
Reaction Conditions: 1 M KOH, operando OER
Sample-Specific Conditions
- reaction type: OER
- cubic cobalt diselenide under alkaline OER conditions
Measurement
We plan to measure the Co K-edge XANES spectrum of this sample.
Questions
Based on all the information above:
1. What is the dominant active phase that forms on the c-CoSe2 catalyst under alkaline OER conditions, and what drives this transformation?
2. Describe the expected changes in the Co K-edge XANES spectral shape (edge position and white line intensity) for c-CoSe2 as it undergoes the oxygen evolution reaction in alkaline media.
3. What happens to the surface oxidized anionic components (such as SeOx) of c-CoSe2 during the OER process, and do they contribute to the catalytic activity?
4. Which reference spectra would be most appropriate to include in a basis set for modeling the Co K-edge XANES of this sample under OER conditions?
Ground Truth
Material: c-CoSe2
Measurement: operando Co K-edge XAS, transmission mode, BM31 at ESRF
Fit method: not explicitly reported for c-CoSe2 XANES in main text
Phase fractions: (±10%)
| Phase | Fraction |
|---|---|
| high-valent Co(IV) species (CoO2) | 1.0 |
Fit basis (paper's reference spectra):
- CoO2
- CoOOH
- c-CoSe2
Source evidence: Page 7, 'Role of oxidized anionic residuals in the OER' section; Page 8, 'Discussion' section
Key reasoning: Under alkaline OER conditions, c-CoSe2 undergoes a significant structural transformation into disordered, high-valent Co(IV) species (CoO2). This in situ generated CoO2 serves as the true catalytically active species for the OER. The surface oxidized anionic species (e.g., SeOx) are completely leached into the electrolyte prior to the OER and do not play a catalytic role.
Reasoning source: Page 7, 'Role of oxidized anionic residuals in the OER' section; Page 8, 'Discussion' section
Scoring Rubric (total: 100 pts)
| Q | Type | Max | Question | Reference Answer | Scoring Criteria |
|---|---|---|---|---|---|
| q1 | reasoning | 30 | What is the dominant active phase that forms on the c-CoSe2 catalyst under alkaline OER conditions, and what drives this transformation? | The dominant active phase that forms on the c-CoSe2 catalyst is a disordered, high-valent Co(IV) species, specifically CoO2, which accounts for a 1.0 fraction of the active state. This transformation is driven by the harsh alkaline OER conditions (1 M KOH, operando OER), which cause the pristine cubic cobalt diselenide to undergo a significant structural restructuring. During this process, the surface oxidized anionic species (like SeOx) are completely leached into the electrolyte prior to the reaction. Consequently, the in situ generated CoO2 remains as the true catalytically active species responsible for driving the oxygen evolution reaction. | Full points for identifying disordered high-valent Co(IV) species (or CoO2) as the dominant phase, and explaining that it forms via a significant structural transformation/restructuring driven by the OER conditions. |
| q2 | spectral | 25 | Describe the expected changes in the Co K-edge XANES spectral shape (edge position and white line intensity) for c-CoSe2 as it undergoes the oxygen evolution reaction in alkaline media. | During the oxygen evolution reaction in alkaline media, the Co K-edge XANES spectrum of c-CoSe2 is expected to exhibit a shift toward higher energy positions and enhanced white line signal intensities compared to the pristine material. These spectral changes occur because the alkaline OER conditions (1 M KOH) drive a complete surface restructuring of the cubic cobalt diselenide. This restructuring leads to the oxidation of the Co centers and the formation of Co-based oxides/hydroxides, ultimately generating high-valent Co(IV) species (CoO2). Therefore, the shift to higher energy and increased white line intensity directly reflect the transition from the initial selenide to the highly oxidized, catalytically active CoO2 phase. | Full points for stating that the edge position shifts to higher energy and the white line intensity is enhanced, reflecting the oxidation of Co to a high-valent state. |
| q3 | reasoning | 25 | What happens to the surface oxidized anionic components (such as SeOx) of c-CoSe2 during the OER process, and do they contribute to the catalytic activity? | During the OER process in 1 M KOH, the surface oxidized anionic components, such as SeOx, are completely leached into the alkaline electrolyte prior to the reaction. Because they are entirely removed from the catalyst surface, these anionic residuals do not play any catalytic role in the oxygen evolution reaction. This leaching occurs due to the severe structural transformation of the cubic cobalt diselenide under the applied operando OER conditions. As a result of this complete surface restructuring, only the remaining in situ generated high-valent Co(IV) species (CoO2) serve as the true catalytically active sites. | Full points for explaining that the surface oxidized anionic species are completely leached/dissolved into the electrolyte prior to the OER and do not play a catalytic role. |
| q4 | identification | 20 | Which reference spectra would be most appropriate to include in a basis set for modeling the Co K-edge XANES of this sample under OER conditions? | The most appropriate reference spectra to include in a basis set for modeling this sample are CoO2, CoOOH, and pristine c-CoSe2. These specific phases are expected because the initial material is cubic cobalt diselenide (c-CoSe2), which undergoes a significant structural transformation under alkaline OER conditions (1 M KOH). The applied operando OER conditions drive the oxidation of Co centers to form Co-based oxides and hydroxides (CoOOH), ultimately resulting in a complete surface restructuring into a disordered, high-valent Co(IV) species (CoO2). Therefore, this basis set perfectly captures the initial state, intermediate oxidized species, and the final 100% fraction of the true catalytically active CoO2 phase. | Full points for listing high-valent Co oxides/hydroxides such as CoO2 and CoOOH, alongside the pristine c-CoSe2. |
Review
#923
c-S-CoSe2
Co K-edge
▶
LLM Prompt
Sample Information
Material: c-S-CoSe2
Reaction Conditions: 0.5 M H2SO4, operando HER
Sample-Specific Conditions
- heteroatom substitution: S-substituted
- S-substituted cubic cobalt diselenide under acidic HER conditions
Measurement
We plan to measure the Co K-edge XANES spectrum of this sample.
Questions
Based on all the information above:
1. What is the dominant bulk phase of the c-S-CoSe2 catalyst during the operando acidic HER, and what physical reasoning explains its structural behavior compared to o-CoSe2?
2. Describe the expected white line feature in the Co K-edge XANES spectrum of c-S-CoSe2. What electronic transition is responsible for this feature, and how does its intensity compare to that of o-CoSe2?
3. If performing Linear Combination Fitting (LCF) on the operando Co K-edge XANES data for this sample under acidic HER conditions, what primary reference spectrum is needed and why?
Ground Truth
Material: c-S-CoSe2
Measurement: Operando Co K-edge XANES in fluorescence mode at KMC-2 beamline
Fit method: Linear combination fitting (LCF)
Phase fractions: (±10%)
| Phase | Fraction |
|---|---|
| c-S-CoSe2 | 1.0 |
Fit basis (paper's reference spectra):
- c-S-CoSe2
Source evidence: Page 7, 'Decisive factors for restructuring during the HER' section; Page 8, 'Discussion' section
Key reasoning: Operando time-resolved XAS characterizations demonstrate that c-S-CoSe2 maintains its structural integrity well throughout the entire acidic HER. Unlike o-CoSe2 which undergoes surface corrosion, the cubic phase of c-S-CoSe2 is thermodynamically stable under these conditions. Partial sulfur substitution promotes the formation of catalytically active, disordered S-Co-Se moieties to facilitate the HER, while the bulk cubic structure remains intact.
Reasoning source: Page 7 (Decisive factors for restructuring during the HER) and Page 8 (Discussion)
Scoring Rubric (total: 100 pts)
| Q | Type | Max | Question | Reference Answer | Scoring Criteria |
|---|---|---|---|---|---|
| q1 | reasoning | 35 | What is the dominant bulk phase of the c-S-CoSe2 catalyst during the operando acidic HER, and what physical reasoning explains its structural behavior compared to o-CoSe2? | The dominant bulk phase of the catalyst during the operando acidic HER in 0.5 M H2SO4 is c-S-CoSe2, which accounts for 100% of the material. This structural integrity is maintained because the cubic phase of c-S-CoSe2 is thermodynamically stable under these specific acidic conditions. Unlike o-CoSe2, which is susceptible to surface corrosion, the partial sulfur substitution in c-S-CoSe2 promotes the formation of catalytically active, disordered S-Co-Se moieties. These moieties effectively facilitate the hydrogen evolution reaction while allowing the bulk cubic structure to remain completely intact. | Full points for identifying that c-S-CoSe2 maintains its structural integrity (fraction ~1.0) and explaining that the cubic phase is stable under acidic conditions, forming active disordered S-Co-Se moieties without bulk restructuring, unlike o-CoSe2 which undergoes surface corrosion. |
| q2 | spectral | 40 | Describe the expected white line feature in the Co K-edge XANES spectrum of c-S-CoSe2. What electronic transition is responsible for this feature, and how does its intensity compare to that of o-CoSe2? | The Co K-edge XANES spectrum of c-S-CoSe2 is expected to exhibit a white line feature at approximately 7725 eV. This feature originates from dipolar electronic transitions from the Co 1s core level to 4p hybridized orbitals. The intensity of this white line is less prominent compared to that of the o-CoSe2 phase. This reduced intensity arises because surface oxidation is less accessible for the thermodynamically stable, S-substituted cubic c-S-CoSe2 under acidic HER conditions (0.5 M H2SO4) than it is for the corrosion-prone o-CoSe2. | Full points for identifying the white line at ~7725 eV, attributing it to dipolar transitions from Co 1s to 4p hybridized orbitals, and noting that it is less prominent than in o-CoSe2 (indicating less surface oxidation). |
| q3 | identification | 25 | If performing Linear Combination Fitting (LCF) on the operando Co K-edge XANES data for this sample under acidic HER conditions, what primary reference spectrum is needed and why? | When performing Linear Combination Fitting (LCF) on the operando Co K-edge XANES data, the only required primary reference spectrum is c-S-CoSe2, which yields a fit fraction of 1.0. This single-phase requirement arises because the S-substituted cubic cobalt diselenide maintains its complete structural integrity throughout the acidic HER process in 0.5 M H2SO4. The partial sulfur substitution creates active, disordered S-Co-Se moieties that drive the reaction without causing the surface corrosion observed in o-CoSe2. Consequently, the bulk cubic structure is thermodynamically stable under these operando conditions, meaning no secondary degradation phases are formed or needed for the fit. | Full points for stating that the c-S-CoSe2 reference spectrum is primarily needed because the catalyst maintains its structural integrity throughout the entire acidic HER. |
Review
Operando X-ray imaging reveals size-dependent evolution of cobalt oxide thermochemical material during thermal redox cycles
BNL-NSLS-II-8-ID
Synthesis
Yuxiang Peng et al.
DOI: 10.1038/s41467-025-66174-0
2 scenarios
▶
#924
Co3O4 microparticles
Co K
▶
LLM Prompt
Sample Information
Material: Co3O4 microparticles
Method: thermal redox cycling
Temperature C: 900
Duration Hours: 0.417
Atmosphere: air
Sample-Specific Conditions
- Cycle number and particle size: Cycle 1, microparticles
- Co3O4 microparticles during the first thermal reduction cycle at 900 °C
Preparation
- Commercial Co3O4 microparticles (<10 μm, Sigma-Aldrich) were loaded into an open-ended quartz capillary and thermally cycled.
Measurement
We plan to measure the Co K XANES spectrum of this sample.
Questions
Based on all the information above:
1. Based on the sample conditions (Co3O4 microparticles heated to 900 °C in air), what candidate reference spectra are required to model the Co K-edge XANES spectrum using Linear Combination Fitting?
2. Estimate the phase fractions of the cobalt species present in the microparticles after approximately 25 minutes (0.417 hours) at 900 °C during the first thermal reduction cycle.
3. Explain the physical reasoning for the high degree of conversion to the reduced phase observed in the first cycle for these microparticles, and discuss why this conversion rate might differ in subsequent cycles.
Ground Truth
Material: Co3O4 microparticles
Measurement: Co K-edge 2D XANES imaging at FXI beamline
Fit method: Linear combination fitting
Phase fractions: (±10%)
| Phase | Fraction |
|---|---|
| CoO | 0.95 |
| Co3O4 | 0.05 |
Fit basis (paper's reference spectra):
- CoO
- Co3O4
Source evidence: Figure 3A and text on page 6: 'conversion rate of Co3O4 microparticles to CoO at 900 °C is faster in the first cycle (reaching > 95.0% in ~25 min after the temperature reaching 900 °C)'
Key reasoning: During the first thermal cycle at 900 °C, Co3O4 microparticles undergo a rapid reduction to CoO, driven by the thermodynamic instability of Co3O4 at this temperature in air. The conversion reaches over 95% within approximately 25 minutes. At this initial stage, the microparticles have not yet developed the extensive internal and isolated porosity that traps evolved O2. Therefore, the reduction proceeds rapidly and nearly to completion, unlike in subsequent cycles where trapped oxygen hinders the reaction.
Reasoning source: Page 6, Section 'Chemical evolution analyzed by in-situ 2D XANES imaging' and Page 12, Section 'Summary of findings and future perspectives on TCMs'
Scoring Rubric (total: 100 pts)
| Q | Type | Max | Question | Reference Answer | Scoring Criteria |
|---|---|---|---|---|---|
| q1 | identification | 30 | Based on the sample conditions (Co3O4 microparticles heated to 900 °C in air), what candidate reference spectra are required to model the Co K-edge XANES spectrum using Linear Combination Fitting? | To model the Co K-edge XANES spectrum of this sample using linear combination fitting, the required reference spectra are CoO and Co3O4. These specific phases are expected because heating the initial Co3O4 microparticles to 900 °C in air makes the material thermodynamically unstable, driving a thermal reduction reaction. During this first cycle, the Co3O4 phase rapidly reduces to form the CoO phase. Because the measurement occurs after 0.417 hours (~25 minutes) of heating, the spectrum will capture a mixture of the dominant newly formed CoO product and a small amount of residual Co3O4 reactant. | Full credit for identifying CoO and Co3O4 as the necessary reference spectra for the reduction process. |
| q2 | quantification | 30 | Estimate the phase fractions of the cobalt species present in the microparticles after approximately 25 minutes (0.417 hours) at 900 °C during the first thermal reduction cycle. | After approximately 25 minutes (0.417 hours) at 900 °C during the first cycle, the estimated phase fractions are 0.95 (95%) CoO and 0.05 (5%) Co3O4, with an uncertainty of 10%. These specific values result from the rapid thermal reduction of the Co3O4 microparticles, which are thermodynamically unstable at 900 °C in air. The conversion to CoO reaches over 95% in this short timeframe because, during the first cycle, the microparticles have not yet developed extensive internal and isolated porosity. Without trapped evolved O2 gas to hinder the reaction, the reduction proceeds rapidly and nearly to completion. | Full credit for estimating approximately 95% CoO and 5% Co3O4. Partial credit for identifying CoO as the overwhelmingly dominant phase (>90%). |
| q3 | reasoning | 40 | Explain the physical reasoning for the high degree of conversion to the reduced phase observed in the first cycle for these microparticles, and discuss why this conversion rate might differ in subsequent cycles. | The high degree of conversion (>95% CoO) observed during the first thermal cycle is driven by the thermodynamic instability of Co3O4 at 900 °C in air, which forces a rapid reduction to CoO. At this initial stage, the fresh Co3O4 microparticles have not yet developed extensive internal and isolated porosity. Consequently, the O2 gas evolved during the reduction process can easily escape rather than being trapped within the particle structure. In subsequent cycles, the conversion rate is hindered because the material develops isolated pores that trap the evolved oxygen, which suppresses the forward reduction reaction and prevents it from reaching the same rapid completion. | Full credit for explaining that Co3O4 thermodynamically reduces to CoO at 900 °C, and that during the first cycle, the lack of extensive internal/isolated pores allows for rapid and nearly complete conversion. Must mention that in later cycles, trapped O2 in newly formed internal pores would hinder the reduction. |
Review
#925
Co3O4 microparticles
Co K
▶
LLM Prompt
Sample Information
Material: Co3O4 microparticles
Method: thermal redox cycling
Temperature C: 900
Duration Hours: 0.417
Atmosphere: air
Sample-Specific Conditions
- Cycle number and particle size: Cycle 2, microparticles
- Co3O4 microparticles during the second thermal reduction cycle at 900 °C
Preparation
- Commercial Co3O4 microparticles (<10 μm, Sigma-Aldrich) were loaded into an open-ended quartz capillary and thermally cycled.
Measurement
We plan to measure the Co K XANES spectrum of this sample.
Questions
Based on all the information above:
1. Based on the sample conditions (Co3O4 microparticles, 2nd thermal reduction cycle at 900 °C in air for ~25 min), what are the expected phases present and their approximate fractions?
2. What reference spectra would be required to perform a Linear Combination Fitting (LCF) analysis of the XANES spectrum for this sample?
Ground Truth
Material: Co3O4 microparticles
Measurement: Co K-edge 2D XANES imaging (transmission) at FXI (18-ID) beamline
Fit method: Linear combination fitting (LCF)
Phase fractions: (±10%)
| Phase | Fraction |
|---|---|
| CoO | 0.6 |
| Co3O4 | 0.4 |
Fit basis (paper's reference spectra):
- CoO
- Co3O4
Source evidence: Figure 3A and text on page 6
Key reasoning: During the first thermal cycle, internal and isolated pores form within the microparticles due to O2 evolution, vacancy diffusion, and subsequent sintering/coarsening. Upon cooling and re-oxidation, these pores persist. In the second reduction cycle at 900 °C, these internal pores trap the newly evolved O2 gas, creating a localized high oxygen concentration environment. This thermodynamically inhibits the further reduction of Co3O4 to CoO, limiting the conversion to approximately 60% after 25 minutes, which is significantly lower than the >95% conversion observed in the first cycle.
Reasoning source: Section 'Morphological evolution analyzed by in-situ X-ray nano-tomography' and 'Summary of findings and future perspectives on TCMs', pages 7-12
Scoring Rubric (total: 100 pts)
| Q | Type | Max | Question | Reference Answer | Scoring Criteria |
|---|---|---|---|---|---|
| q1 | quantification | 60 | Based on the sample conditions (Co3O4 microparticles, 2nd thermal reduction cycle at 900 °C in air for ~25 min), what are the expected phases present and their approximate fractions? | The expected phases present in the sample are CoO and Co3O4, with approximate fractions of 60% CoO and 40% Co3O4 (with a 10% uncertainty). These specific fractions arise because, during the first thermal cycle, internal and isolated pores form within the microparticles due to O2 evolution and vacancy diffusion. During this second reduction cycle at 900 °C, these persistent internal pores trap the newly evolved O2 gas, creating a localized high oxygen concentration environment. This trapped oxygen thermodynamically inhibits the further reduction of Co3O4 to CoO, limiting the conversion to approximately 60% after 25 minutes. | Correctly identifies CoO and Co3O4 as the phases present. Estimates the CoO fraction to be approximately 60% and the Co3O4 fraction to be approximately 40%. |
| q2 | identification | 40 | What reference spectra would be required to perform a Linear Combination Fitting (LCF) analysis of the XANES spectrum for this sample? | To perform a Linear Combination Fitting (LCF) analysis on this sample, reference spectra for CoO and Co3O4 are required. These specific references are needed because the Co3O4 microparticles are undergoing a second thermal reduction cycle at 900 °C, where persistent internal pores formed during the first cycle trap newly evolved O2 gas. This localized high oxygen concentration thermodynamically inhibits the complete reduction of the material, preventing full conversion. Consequently, both the partially reduced product (CoO) and the unreacted starting material (Co3O4) remain present in the sample and must be included in the fit basis to accurately model the spectrum. | Correctly identifies that standard spectra of CoO and Co3O4 are required as the basis for LCF. |
Review
Dynamic behavior of molecular Pd-acetate trimers and dimers in heterogeneous vinyl acetate synthesis
BNL-NSLS-II-8-ID
Catalyst
Hunter P. Jacobs et al.
DOI: 10.1038/s41467-025-66820-7
3 scenarios
▶
#926
PdOAc/SiO2
Pd K
▶
LLM Prompt
Sample Information
Material: PdOAc/SiO2
Support: SiO2
Reaction Conditions: fresh
Sample-Specific Conditions
- KOAc promoter: absent
- Fresh KOAc-free Pd-acetate catalyst
Measurement
We plan to measure the Pd K XANES spectrum of this sample.
Questions
Based on all the information above:
1. Based on the sample conditions (fresh KOAc-free Pd-acetate on SiO2), what is the expected oxidation state of Pd, and what standard reference materials would be most appropriate to compare its XANES spectrum against to confirm this state?
2. Although the XANES edge energy of this sample indicates a Pd2+ state similar to bulk PdO, the sample is not bulk PdO. Explain how the local coordination environment differs from bulk PdO and how this is reflected in the X-ray absorption fine structure.
3. Describe the expected XANES edge position for this fresh catalyst relative to metallic Pd and bulk PdO.
Ground Truth
Material: PdOAc/SiO2
Measurement: Pd K edge in fluorescence mode at the 8-ID Inner Shell Spectroscopy (ISS) beamline
Fit method: qualitative comparison
Phase fractions: (±10%)
| Phase | Fraction |
|---|---|
| Pd-acetate | 1.0 |
Fit basis (paper's reference spectra):
- Pd foil
- PdO
- Pd(acac)2
Source evidence: Page 2, 'Characterization of Fresh Catalysts' section and Fig. 1a
Key reasoning: The XANES energies at the Pd K-edge for the fresh catalyst are similar to palladium oxide (PdO) and palladium acetylacetonate (Pd(acac)2) references, indicating Pd is in the oxidized Pd2+ state. The EXAFS oscillations are phase-shifted compared to the PdO reference and lack peaks near 3 Å characteristic of higher shell Pd-Pd scattering paths in PdO. This indicates that the Pd2+ species are organic Pd-acetate species rather than bulk PdO.
Reasoning source: Page 2, 'Characterization of Fresh Catalysts' section
Scoring Rubric (total: 100 pts)
| Q | Type | Max | Question | Reference Answer | Scoring Criteria |
|---|---|---|---|---|---|
| q1 | identification | 30 | Based on the sample conditions (fresh KOAc-free Pd-acetate on SiO2), what is the expected oxidation state of Pd, and what standard reference materials would be most appropriate to compare its XANES spectrum against to confirm this state? | The expected oxidation state of Pd in this fresh KOAc-free Pd-acetate catalyst is Pd2+. The most appropriate standard reference materials for comparison are Pd foil, palladium oxide (PdO), and palladium acetylacetonate (Pd(acac)2). These specific references and the Pd2+ state are expected because the sample is a fresh, unreacted Pd-acetate material supported on SiO2, meaning the palladium remains entirely in its initial oxidized organic form (1.0 fraction Pd-acetate). Comparing the sample against PdO and Pd(acac)2 confirms the Pd2+ state, while the Pd foil serves as a baseline to demonstrate the shift to higher edge energies characteristic of this oxidized state. | Full credit for identifying the Pd2+ oxidation state and suggesting appropriate references such as PdO and an organic Pd2+ reference like Pd(acac)2. Partial credit for only identifying the oxidation state or only suggesting references. |
| q2 | reasoning | 40 | Although the XANES edge energy of this sample indicates a Pd2+ state similar to bulk PdO, the sample is not bulk PdO. Explain how the local coordination environment differs from bulk PdO and how this is reflected in the X-ray absorption fine structure. | The local coordination environment of this sample consists of organic Pd-acetate species rather than a bulk PdO lattice. Because the sample is a fresh Pd-acetate catalyst dispersed on a SiO2 support, it exists as an isolated or molecular-like organic Pd2+ species rather than forming the extended Pd-O-Pd networks found in bulk oxides. This structural difference is directly reflected in the EXAFS oscillations, which are phase-shifted compared to a PdO reference. Specifically, while the sample shows a Pd-O scattering path below 2 Å, it completely lacks the peaks near 3 Å that are characteristic of higher shell Pd-Pd scattering paths found in bulk PdO. | Full credit for explaining that the sample is an organic Pd2+ species (Pd-acetate) and that it lacks the higher shell Pd-Pd scattering paths (near 3 Å) characteristic of bulk PdO, while retaining the Pd-O scattering path. |
| q3 | spectral | 30 | Describe the expected XANES edge position for this fresh catalyst relative to metallic Pd and bulk PdO. | The XANES edge position for this fresh catalyst is expected to be shifted to a higher energy compared to metallic Pd foil, and it will be similar to the edge energy of bulk PdO and Pd(acac)2 references. These spectral features arise directly from the sample conditions, as the fresh, unreacted PdOAc/SiO2 material consists entirely of organic Pd2+ species (Pd-acetate). Because the palladium is in an oxidized 2+ state rather than a metallic state, it exhibits an edge energy characteristic of oxidized Pd2+, causing the observed shift to higher energies relative to Pd foil. The close match with the Pd(acac)2 reference spectrum further confirms that the fresh catalyst maintains this fully oxidized, organic Pd2+ structure prior to any reaction. | Full credit for stating that the edge position will be shifted to higher energy compared to metallic Pd (Pd foil) and will be similar to the edge position of bulk PdO. |
Review
#927
PdOAc/SiO2
Pd K
▶
LLM Prompt
Sample Information
Material: PdOAc/SiO2
Support: SiO2
Reaction Conditions: 150 °C, 15:5:2 vol% C2H4/AcOH/O2 (bal. He), 180 min
Sample-Specific Conditions
- KOAc promoter: absent
- KOAc-free Pd-acetate catalyst after VAM reaction
Measurement
We plan to measure the Pd K XANES spectrum of this sample.
Questions
Based on all the information above:
1. Based on the reaction conditions (KOAc-free, 150 °C, C2H4/AcOH/O2), what is the expected dominant Pd phase in the spent catalyst, and what reference spectra should be included in the analysis to confirm its oxidation state?
2. Explain the physical reasoning for why the Pd species in this KOAc-free catalyst are completely reduced under VAM reaction conditions, in contrast to KOAc-promoted catalysts.
3. Describe the expected Pd K-edge XANES and EXAFS spectral features of this spent catalyst. How does it compare to a metallic Pd foil reference?
Ground Truth
Material: PdOAc/SiO2
Measurement: Pd K edge XANES and EXAFS in fluorescence mode at 8-ID ISS beamline (NSLS-II)
Fit method: EXAFS coordination number analysis
Phase fractions: (±10%)
| Phase | Fraction |
|---|---|
| Pd/PdCx | 1.0 |
Fit basis (paper's reference spectra):
- Pd foil
- PdO
- Pd(acac)2
Source evidence: Table 1, Figure 3c-d, and page 4
Key reasoning: Under VAM reaction conditions, the Pd-acetate trimers and dimers on the KOAc-free catalyst are completely reduced to monometallic Pd and PdCx nanoparticles. Without the KOAc promoter to assist in re-oxidizing the Pd/PdCx nanoparticles back to molecular Pd-acetate species, the catalyst remains fully reduced, which correlates with its low catalytic activity.
Reasoning source: Discussion section, pages 6 and 8
Scoring Rubric (total: 100 pts)
| Q | Type | Max | Question | Reference Answer | Scoring Criteria |
|---|---|---|---|---|---|
| q1 | prediction | 30 | Based on the reaction conditions (KOAc-free, 150 °C, C2H4/AcOH/O2), what is the expected dominant Pd phase in the spent catalyst, and what reference spectra should be included in the analysis to confirm its oxidation state? | The expected dominant Pd phase in the spent catalyst is fully reduced Pd/PdCx nanoparticles, comprising a fraction of 1.0 (100%). To confirm its oxidation state, the analysis should include reference spectra for Pd foil, PdO, and Pd(acac)2. This complete reduction occurs because, under the VAM reaction conditions (150 °C, C2H4/AcOH/O2), the initial Pd-acetate species are reduced to monometallic Pd and PdCx. Because the sample lacks the KOAc promoter necessary to re-oxidize the Pd/PdCx nanoparticles back into molecular Pd-acetate species, the catalyst remains trapped in this fully reduced state. | Full points for identifying Pd/PdCx (or metallic Pd0) as the dominant phase (100%) and suggesting Pd foil (and optionally PdO or Pd(acac)2 to rule out oxidized species) as references. |
| q2 | reasoning | 40 | Explain the physical reasoning for why the Pd species in this KOAc-free catalyst are completely reduced under VAM reaction conditions, in contrast to KOAc-promoted catalysts. | Under the VAM reaction conditions (150 °C, C2H4/AcOH/O2 for 180 min), the initial Pd-acetate trimers and dimers are completely reduced to monometallic Pd and PdCx nanoparticles. The catalyst remains in this fully reduced state (100% Pd/PdCx) specifically because it lacks the KOAc promoter. The KOAc promoter is required to assist in re-oxidizing the reduced Pd/PdCx nanoparticles back into active molecular Pd-acetate species. Without KOAc present during the reaction, this re-oxidation step cannot occur, leaving the catalyst fully reduced and resulting in low catalytic activity. | Full points for explaining that without the KOAc promoter, there is no mechanism to re-oxidize the formed Pd/PdCx nanoparticles back into Pd-acetate species, leading to complete reduction and accumulation of monometallic Pd/PdCx. |
| q3 | spectral | 30 | Describe the expected Pd K-edge XANES and EXAFS spectral features of this spent catalyst. How does it compare to a metallic Pd foil reference? | The Pd K-edge XANES spectrum of this spent catalyst is expected to be nearly identical to that of a metallic Pd foil reference, with an edge position around 24.35 keV. In the EXAFS region, no Pd-O scattering will be observed, but there is a distinguishing slight shift in the Pd-Pd peak to higher R values (2.77 Å compared to 2.73 Å for Pd foil). These spectral features arise because the VAM reaction conditions without a KOAc promoter cause the complete reduction of Pd-acetate to a Pd0 state. Furthermore, the elongated Pd-Pd bond observed in EXAFS occurs because interstitial carbon from the reaction environment incorporates into the metal lattice, forming a PdCx (carbide) phase. | Full points for stating the XANES is nearly identical to Pd foil (Pd0), but noting that EXAFS would show an elongated Pd-Pd bond distance (or shift to higher R) due to the formation of the PdCx (carbide) phase. |
Review
#928
PdOAc/KOAc/SiO2
Pd K
▶
LLM Prompt
Sample Information
Material: PdOAc/KOAc/SiO2
Support: SiO2
Reaction Conditions: 150 °C, 15:5:2 vol% C2H4/AcOH/O2 (bal. He), 180 min
Sample-Specific Conditions
- KOAc promoter: present
- KOAc-promoted Pd-acetate catalyst after VAM reaction
Measurement
We plan to measure the Pd K XANES spectrum of this sample.
Questions
Based on all the information above:
1. Based on the reaction conditions (150 °C, C2H4/AcOH/O2) and the presence of the KOAc promoter, what are the expected Pd phases in the spent catalyst, and what are their approximate fractions?
2. What reference spectra or structural models would be necessary to analyze and quantify the phase composition of this spent catalyst using XAS?
3. Explain the physical reasoning for why a significant fraction of oxidized Pd species remains in this KOAc-promoted catalyst after 180 minutes of reaction, whereas an unpromoted catalyst would be fully reduced.
Ground Truth
Material: PdOAc/KOAc/SiO2
Measurement: Pd K edge, fluorescence mode, 8-ID Inner Shell Spectroscopy (ISS) beamline at NSLS-II
Fit method: EXAFS shell fitting (coordination number analysis of NPd-O)
Phase fractions: (±15%)
| Phase | Fraction |
|---|---|
| Pd/PdCx | 0.73 |
| Pd-acetate | 0.27 |
Fit basis (paper's reference spectra):
- Pd foil
- PdO
- Pd(acac)2
Source evidence: Table 1 and Figure 3c,d, page 5
Key reasoning: During the VAM reaction, the KOAc-promoted catalyst undergoes partial reduction to form Pd and PdCx nanoparticles. However, unlike the unpromoted catalyst which fully reduces, approximately 27% of the Pd atoms remain as organic Pd2+ species (Pd-acetate trimers and dimers). This occurs because KOAc assists in re-oxidizing the formed Pd and PdCx nanoparticles, establishing a redox cycle that maintains a steady-state fraction of oxidized Pd species and prevents complete reduction.
Reasoning source: Results section (Dynamics of Pd-acetate species during the VAM reaction, page 4) and Discussion section (Mechanisms Involving Pd-acetate Trimers and Dimers on Heterogeneous VAM Catalysts, page 6)
Scoring Rubric (total: 100 pts)
| Q | Type | Max | Question | Reference Answer | Scoring Criteria |
|---|---|---|---|---|---|
| q1 | quantification | 40 | Based on the reaction conditions (150 °C, C2H4/AcOH/O2) and the presence of the KOAc promoter, what are the expected Pd phases in the spent catalyst, and what are their approximate fractions? | The expected Pd phases in the spent catalyst are Pd/PdCx nanoparticles and organic Pd2+ species (Pd-acetate trimers and dimers). The approximate fractions are 73% Pd/PdCx and 27% Pd-acetate, with an uncertainty of 15%. These specific fractions result from the reaction conditions (150 °C, C2H4/AcOH/O2) and the presence of the KOAc promoter, which induces a partial reduction of the catalyst. Specifically, the KOAc promoter assists in re-oxidizing the formed Pd and PdCx nanoparticles during the 180-minute VAM reaction. This establishes a redox cycle that prevents complete reduction and maintains a steady-state fraction of 27% oxidized Pd species. | Full points for identifying both metallic Pd/PdCx (~73%) and unreduced Pd-acetate/organic Pd2+ (~27%). Partial points for identifying the correct phases without the correct fractions. |
| q2 | identification | 20 | What reference spectra or structural models would be necessary to analyze and quantify the phase composition of this spent catalyst using XAS? | To analyze and quantify the phase composition of this spent catalyst using XAS, the necessary reference spectra or structural models are Pd foil, PdO, and Pd(acac)2. These references are required to perform EXAFS shell fitting, specifically for the coordination number analysis of the Pd-O bonds. These specific references are needed because the sample conditions (150 °C, C2H4/AcOH/O2 with KOAc promoter) lead to a steady-state mixture of metallic/carbide and oxidized Pd species. The KOAc promoter establishes a redox cycle that re-oxidizes the formed Pd/PdCx nanoparticles, preventing complete reduction during the 180-minute reaction. Consequently, references for both metallic Pd (Pd foil) and oxidized Pd2+ species (PdO, Pd(acac)2) are essential to accurately model the resulting mixture of Pd/PdCx and Pd-acetate trimers/dimers. | Must mention a metallic Pd reference (e.g., Pd foil) and an oxidized Pd2+ reference with oxygen coordination (e.g., PdO, Pd(acac)2, or Pd-acetate). |
| q3 | reasoning | 40 | Explain the physical reasoning for why a significant fraction of oxidized Pd species remains in this KOAc-promoted catalyst after 180 minutes of reaction, whereas an unpromoted catalyst would be fully reduced. | After 180 minutes of the VAM reaction at 150 °C in a C2H4/AcOH/O2 mixture, the KOAc-promoted catalyst retains approximately 27% of its Pd atoms as organic Pd2+ species (Pd-acetate trimers and dimers). This occurs because the KOAc promoter actively assists in re-oxidizing the Pd and PdCx nanoparticles that form during the initial partial reduction. By facilitating this re-oxidation, the KOAc establishes a continuous redox cycle under the reaction conditions. This cycle maintains a steady-state fraction of oxidized Pd species, directly preventing the complete reduction that would otherwise occur in an unpromoted catalyst. | Must explain that KOAc participates in a redox cycle by assisting in the re-oxidation of Pd/PdCx nanoparticles back to Pd-acetate species (such as KnPd2(OAc)n+4 dimers), thereby preventing complete reduction and maintaining a steady-state fraction of oxidized Pd. |
Review
Small PdCx interstitial compound for efficient acidic CO2 electroreduction to formic acid
APS
Catalyst
Yaodong Yu et al.
DOI: 10.1038/s41467-025-67949-1
1 scenario
▶
#929
PdC0.13
Pd K
▶
LLM Prompt
Sample Information
Material: PdC0.13
Support: CNT
Sample-Specific Conditions
- interstitial carbon content: x=0.13
- Synthesized PdC0.13 interstitial compound on carbon nanotubes
Measurement
We plan to measure the Pd K XANES spectrum of this sample.
Questions
Based on all the information above:
1. Based on the synthesis of the PdC0.13 interstitial compound on carbon nanotubes, what is the expected dominant oxidation state of Pd in this sample, and what physical reasoning explains this state despite the infusion of carbon?
2. Describe the expected overall shape of the Pd K-edge XANES spectrum for this sample. What specific reference materials would it most closely resemble, and which would it distinctly differ from?
3. If you were to perform a linear combination fitting (LCF) or direct spectral comparison to confirm the phase of this sample, what candidate reference spectra are essential to include?
Ground Truth
Material: PdC0.13/CNT
Measurement: Pd K-edge XANES at 9-BM beamline of Advanced Photon Source
Fit method: Direct spectral comparison
Phase fractions: (±10%)
| Phase | Fraction |
|---|---|
| metallic_palladium (Pd) | 1.0 |
Fit basis (paper's reference spectra):
- Pd foil
- PdO
Source evidence: Page 7, Figure 3b
Key reasoning: The k-edge XANES spectrum of PdC0.13 exhibits a valence state that is tightly bound to the Pd foil, confirming that the major valence state of Pd in PdC0.13 is the zero valence state. This is consistent with XPS results, which also show a zero-valence state despite slight binding energy shifts due to electron transfer from Pd to the interstitial C.
Reasoning source: Page 7, Results and Discussion
Scoring Rubric (total: 100 pts)
| Q | Type | Max | Question | Reference Answer | Scoring Criteria |
|---|---|---|---|---|---|
| q1 | reasoning | 40 | Based on the synthesis of the PdC0.13 interstitial compound on carbon nanotubes, what is the expected dominant oxidation state of Pd in this sample, and what physical reasoning explains this state despite the infusion of carbon? | The expected dominant oxidation state of Pd in the PdC0.13/CNT sample is 0 (zero valence). This state is maintained despite the synthesis of the interstitial compound with a carbon content of x=0.13. The physical reasoning is that while there is a slight electron transfer from the Pd atoms to the interstitial carbon, it does not fully oxidize the metal. Therefore, the palladium retains its zero-valence state, as confirmed by its tight binding to metallic Pd foil in XANES and consistent XPS results. | Full points for identifying the zero valence state (metallic Pd) and explaining that while interstitial carbon causes lattice expansion and slight electron transfer, the bulk major valence state remains zero. |
| q2 | spectral | 40 | Describe the expected overall shape of the Pd K-edge XANES spectrum for this sample. What specific reference materials would it most closely resemble, and which would it distinctly differ from? | The Pd K-edge XANES spectrum for the PdC0.13/CNT sample will exhibit the characteristic shape of metallic zero-valence palladium. It will closely overlap with and resemble a metallic Pd foil reference spectrum, while distinctly differing from an oxidized PdO reference spectrum. These spectral features arise because the synthesis of the PdC0.13 interstitial compound on carbon nanotubes leaves the palladium in a zero-valence state. Specifically, the slight electron transfer to the interstitial carbon (x=0.13) causes minor binding energy shifts but does not change the fundamentally metallic electronic structure of the Pd. | Full points for stating the spectrum will closely overlap/match a Pd foil (metallic Pd) reference and distinctly differ from a PdO (oxidized Pd) reference. |
| q3 | identification | 20 | If you were to perform a linear combination fitting (LCF) or direct spectral comparison to confirm the phase of this sample, what candidate reference spectra are essential to include? | For a direct spectral comparison of this sample, the essential candidate reference spectra to include are Pd foil and PdO. The Pd foil is required to confirm the 1.0 fraction of metallic palladium, while PdO is needed to contrast with and rule out an oxidized state. These specific references are chosen because the synthesis of the PdC0.13 interstitial compound on carbon nanotubes produces a material where Pd remains in a zero-valence state. Despite the infusion of interstitial carbon (x=0.13) and slight electron transfer from Pd to C, the material remains metallic, making pure metal and pure oxide the necessary bounding references to confirm this phase. | Full points for identifying Pd foil (or metallic Pd) and PdO as the necessary reference spectra. |
Review
Bioadaptive Ni single atoms unlock high rate microbial electrosynthesis of isopropanol from CO2
BNL-NSLS-II-8-ID
Catalyst
Guangye Zhou et al.
DOI: 10.1038/s41467-026-68358-8
1 scenario
▶
#930
Ni-N-C
Ni K
▶
LLM Prompt
Sample Information
Material: Ni-N-C
Support: N-doped carbon
Reaction Conditions: ex-situ
Sample-Specific Conditions
- measurement condition: ex-situ
- Atomically dispersed Ni single-atom catalyst on N-doped carbon
Measurement
We plan to measure the Ni K XANES spectrum of this sample.
Questions
Based on all the information above:
1. Based on the sample conditions, what is the expected oxidation state and local coordination geometry of the Ni single atoms, and what reference material does its XANES spectrum most closely resemble?
2. Describe the three primary molecular orbital transitions expected in the Ni K-edge XANES spectrum for this Ni-N-C single-atom catalyst.
3. How does the structural distortion in the synthesized Ni SAC manifest in its XANES spectral features compared to a highly symmetric D4h reference like NiPc?
Ground Truth
Material: Ni-N-C
Measurement: Ni K-edge ex-situ XANES at 8-ID at NSLS-II
Fit method: not reported
Phase fractions: (±10%)
| Phase | Fraction |
|---|---|
| Ni-N4 (planar) | 1.0 |
Source evidence: Page 5 Figure 3c, Page 6 text
Key reasoning: The Ni K-edge absorption energy of the Ni SAC shifted to higher energy compared to Ni foil, resembling NiPc. This suggests a square planar-like structure with a valence state just below +2. The spectrum shows intensified 1s → 3d and attenuated 1s → 4pz transitions compared to NiPc, indicating structural distortion that facilitates hybridization between Ni 3d and 4p orbitals.
Reasoning source: Page 6, Results section (Atomic structure dynamics of Ni SAC)
Scoring Rubric (total: 100 pts)
| Q | Type | Max | Question | Reference Answer | Scoring Criteria |
|---|---|---|---|---|---|
| q1 | reasoning | 30 | Based on the sample conditions, what is the expected oxidation state and local coordination geometry of the Ni single atoms, and what reference material does its XANES spectrum most closely resemble? | The expected oxidation state of the Ni single atoms is just below +2, and the local coordination geometry is a square planar-like Ni-N4 configuration. The XANES spectrum of this material most closely resembles that of Nickel Phthalocyanine (NiPc). These properties arise because the sample is synthesized as an atomically dispersed Ni single-atom catalyst on an N-doped carbon support, which drives the Ni atoms to coordinate with nitrogen to form a 100% Ni-N4 planar structure. This specific coordination environment causes the Ni K-edge absorption energy to shift to a higher energy compared to Ni foil, resulting in the observed +2-like valence state and a spectral shape highly analogous to the square planar NiPc reference. | Full points for stating an oxidation state just below +2, a square planar-like (Ni-N4) geometry, and resembling NiPc. |
| q2 | spectral | 35 | Describe the three primary molecular orbital transitions expected in the Ni K-edge XANES spectrum for this Ni-N-C single-atom catalyst. | The Ni K-edge XANES spectrum for this catalyst exhibits three primary transitions: a pre-edge feature originating from a 1s → 3d (3dz2 back-bonding/3dx2-y2) transition, a shoulder/first white line feature from a 1s → 4pz transition, and a second white line/post-edge feature from a 1s → 4pxy/continuum transition. These specific spectral features arise because the sample consists of atomically dispersed Ni single atoms coordinated in a square planar-like Ni-N4 configuration on the N-doped carbon support. In this specific geometry, the local electronic structure dictates these distinct transitions, while the structural distortion inherent to the carbon support environment facilitates hybridization between the Ni 3d and 4p orbitals. This hybridization directly modifies the transition probabilities, intensifying the 1s → 3d transition and attenuating the 1s → 4pz transition compared to highly symmetric reference materials. | Full points for identifying the 1s → 3d (3dz2 back-bonding/3dx2-y2), 1s → 4pz, and 1s → 4pxy/continuum transitions. |
| q3 | spectral | 35 | How does the structural distortion in the synthesized Ni SAC manifest in its XANES spectral features compared to a highly symmetric D4h reference like NiPc? | Compared to a highly symmetric D4h reference like NiPc, the structural distortion in the Ni SAC manifests as an intensified pre-edge 1s → 3d transition and an attenuated shoulder 1s → 4pz transition. This occurs because the Ni atoms are atomically dispersed on an N-doped carbon support, which imposes a distorted square planar-like Ni-N4 coordination environment rather than a perfectly symmetric one. This specific structural distortion induced by the carbon support facilitates increased hybridization between the Ni 3d and 4p orbitals. Consequently, this altered electronic structure directly modifies the transition probabilities during the ex-situ measurement, leading to the observed intensification of the 3d feature and attenuation of the 4pz feature. | Full points for explaining that structural distortion facilitates 3d-4p hybridization, leading to an intensified 1s → 3d transition and an attenuated 1s → 4pz transition compared to NiPc. |
Review
Non-equilibrium reducing flame aerosol process to create supported high-entropy alloy nanoparticles
BNL-NSLS-II-8-ID
Catalyst
Shuo Liu et al.
DOI: 10.1038/s41467-026-72958-9
3 scenarios
▶
#931
RuRhPdIrPtFeCoNiCuW
Ni K-edge
▶
LLM Prompt
Sample Information
Material: RuRhPdIrPtFeCoNiCuW
Support: carbon
Sample-Specific Conditions
- element edge: Ni K-edge
- 10-element high-entropy alloy nanoparticles on carbon support
Measurement
We plan to measure the Ni K-edge XANES spectrum of this sample.
Questions
Based on all the information above:
1. Based on the synthesis method and the 10-element composition, what is the expected dominant oxidation state of Ni in the RuRhPdIrPtFeCoNiCuW nanoparticles, and what thermodynamic mechanism drives the stabilization of this state?
2. To verify the chemical state of Ni in this high-entropy alloy using XANES, what specific reference spectra should be measured for comparison?
3. Describe the expected key difference in the spectral shape of the Ni K-edge XANES for this 10-element HEA compared to a nickel oxide reference.
Ground Truth
Material: RuRhPdIrPtFeCoNiCuW on carbon
Measurement: Ni K-edge XANES, ex-situ, 8-ID beamline (Inner Shell Spectroscopy) of Brookhaven Lab’s National Synchrotron Light Source II
Fit method: qualitative comparison of white-line intensity
Phase fractions:
| Phase | Fraction |
|---|---|
| metallic_nickel_alloy | 1.0 |
Fit basis (paper's reference spectra):
- Ni foil
- NiO
Source evidence: Page 21-22 text; Figure 5h (EXAFS)
Key reasoning: The non-equilibrium flame aerosol process combined with an entropy-induced reduction mechanism allows for the incorporation of elements with moderate oxidation potentials into a single-phase metallic FCC structure. The high configurational entropy decreases the system's free energy, facilitating the mixing of multiple elements and stabilizing them in the metallic state rather than as oxides.
Reasoning source: Page 21-22, 'Reduction of high oxidation potential elements' section
Scoring Rubric (total: 100 pts)
| Q | Type | Max | Question | Reference Answer | Scoring Criteria |
|---|---|---|---|---|---|
| q1 | reasoning | 40 | Based on the synthesis method and the 10-element composition, what is the expected dominant oxidation state of Ni in the RuRhPdIrPtFeCoNiCuW nanoparticles, and what thermodynamic mechanism drives the stabilization of this state? | The expected dominant oxidation state of Ni in the 10-element RuRhPdIrPtFeCoNiCuW nanoparticles is 0, existing entirely as a metallic alloy (fraction of 1.0). This state is stabilized by a non-equilibrium flame aerosol process combined with an entropy-induced reduction mechanism. Specifically, the high configurational entropy generated by mixing 10 different elements decreases the system's overall free energy. This thermodynamic driving force facilitates the incorporation of elements with moderate oxidation potentials, such as Ni, into a single-phase metallic FCC structure rather than allowing them to form oxides. | Award 20 points for identifying the metallic state (oxidation state 0) or alloy phase. Award 20 points for explaining that the entropy-induced reduction mechanism (or high configurational entropy) stabilizes the mixed metallic state over phase-separated oxides. |
| q2 | identification | 30 | To verify the chemical state of Ni in this high-entropy alloy using XANES, what specific reference spectra should be measured for comparison? | To verify the chemical state of Ni in this high-entropy alloy, the specific reference spectra that should be measured are Ni foil and NiO. These references are required to perform a qualitative comparison of the white-line intensity to determine the extent of metallic versus oxidized nickel. This comparison is necessary because the 10-element RuRhPdIrPtFeCoNiCuW composition on carbon is subjected to a non-equilibrium flame aerosol process, where high configurational entropy decreases the system's free energy. This entropy-induced reduction mechanism is expected to stabilize the elements in a metallic state (oxidation state 0) rather than as oxides, which can be directly validated against the Ni foil and NiO standards. | Award 15 points for mentioning a metallic Ni reference (e.g., Ni foil). Award 15 points for mentioning a Ni oxide reference (e.g., NiO) to demonstrate the absence of oxidation. |
| q3 | spectral | 30 | Describe the expected key difference in the spectral shape of the Ni K-edge XANES for this 10-element HEA compared to a nickel oxide reference. | The expected key difference in the Ni K-edge XANES spectral shape for this 10-element high-entropy alloy is a significantly lower white-line intensity compared to a nickel oxide (NiO) reference. This suppressed white-line intensity confirms a high occupancy of d orbitals, which is characteristic of a metallic state (oxidation state 0). This spectral feature directly results from the sample's composition and synthesis, where a non-equilibrium flame aerosol process and the high configurational entropy of the 10-element RuRhPdIrPtFeCoNiCuW mixture decrease the system's free energy. This entropy-induced reduction mechanism prevents oxidation and stabilizes the Ni atoms within a single-phase metallic FCC structure, producing the observed metallic spectral signature. | Award 30 points for stating that the HEA spectrum will exhibit a significantly lower white-line intensity compared to the oxide, which indicates higher d-orbital occupancy. |
Review
#932
RuRhPdIrPtFeCoNiCuW
Pd K-edge
▶
LLM Prompt
Sample Information
Material: RuRhPdIrPtFeCoNiCuW
Support: carbon
Sample-Specific Conditions
- element edge: Pd K-edge
- 10-element high-entropy alloy nanoparticles on carbon support
Measurement
We plan to measure the Pd K-edge XANES spectrum of this sample.
Questions
Based on all the information above:
1. What is the dominant phase and oxidation state of Pd in the 10-element RuRhPdIrPtFeCoNiCuW/carbon sample synthesized via the flame aerosol process, and what thermodynamic mechanism enables the formation of this phase?
2. What reference spectra are necessary to confirm the oxidation state of Pd in this sample, and what key spectral feature in the XANES region distinguishes the HEA from the oxidized state?
3. Based on the paper's analysis, what electronic property is confirmed by the lower white-line intensity of the Pd XANES spectrum for the HEA compared to its corresponding oxide?
Ground Truth
Material: RuRhPdIrPtFeCoNiCuW on carbon support
Measurement: ex-situ XAS at 8-ID beamline (Inner Shell Spectroscopy) of Brookhaven Lab's National Synchrotron Light Source II
Fit method: qualitative comparison (no quantitative LCF or fitting method reported for XANES)
Phase fractions:
| Phase | Fraction |
|---|---|
| metallic_palladium_alloy | 1.0 |
Fit basis (paper's reference spectra):
- Pd foil
- PdO
Source evidence: Page 21-22, lines 475-492; Figure 5i
Key reasoning: The entropy-induced reduction mechanism enables the incorporation of multiple elements into a single metallic phase. The XANES spectra show significantly lower white-line intensity compared to oxides, confirming high d-orbital occupancy and a metallic state. The EXAFS spectra further indicate metallic bonding with a uniform alloy structure, lacking oxide features.
Reasoning source: Page 21-22, lines 475-486
Scoring Rubric (total: 99 pts)
| Q | Type | Max | Question | Reference Answer | Scoring Criteria |
|---|---|---|---|---|---|
| q1 | identification | 33 | What is the dominant phase and oxidation state of Pd in the 10-element RuRhPdIrPtFeCoNiCuW/carbon sample synthesized via the flame aerosol process, and what thermodynamic mechanism enables the formation of this phase? | The dominant phase of Pd in the 10-element RuRhPdIrPtFeCoNiCuW nanoparticles on carbon support is a metallic palladium alloy with a fraction of 1.0. The oxidation state of Pd in this sample is 0 (metallic). This specific metallic phase arises because an entropy-induced reduction mechanism enables the incorporation of these multiple elements into a single, uniform metallic phase. Consequently, the high-entropy alloy maintains metallic bonding and avoids oxidation, resulting in the observed pure metallic state. | Full credit for identifying the metallic (0) state in a high-entropy alloy and attributing its formation to the entropy-induced reduction mechanism. |
| q2 | spectral | 33 | What reference spectra are necessary to confirm the oxidation state of Pd in this sample, and what key spectral feature in the XANES region distinguishes the HEA from the oxidized state? | To confirm the oxidation state of Pd in the 10-element RuRhPdIrPtFeCoNiCuW high-entropy alloy, Pd foil and PdO reference spectra are used as a fit basis. The key distinguishing spectral feature in the XANES region is a significantly lower white-line intensity for the sample compared to the PdO reference. This feature arises because the entropy-induced reduction mechanism incorporates the multiple elements into a single metallic phase on the carbon support. As a result, the Pd atoms maintain a metallic state (oxidation state 0) with high d-orbital occupancy, which directly suppresses the white-line intensity relative to the oxidized state. | Full credit for identifying Pd foil and PdO as necessary references, and stating that the HEA exhibits a significantly lower white-line intensity compared to the oxide. |
| q3 | reasoning | 33 | Based on the paper's analysis, what electronic property is confirmed by the lower white-line intensity of the Pd XANES spectrum for the HEA compared to its corresponding oxide? | The lower white-line intensity of the Pd XANES spectrum for the 10-element RuRhPdIrPtFeCoNiCuW high-entropy alloy confirms a high d-orbital occupancy. This electronic property is a direct result of the entropy-induced reduction mechanism, which drives the multiple elements to form a single metallic phase on the carbon support. Because of this mechanism, the Pd atoms exist in a purely metallic state (oxidation state 0) rather than forming oxides. The resulting high d-orbital occupancy in this uniform alloy structure fundamentally causes the suppressed white-line intensity observed in the XANES spectrum compared to the PdO reference. | Full credit for stating that the lower white-line intensity confirms the high occupancy of the d orbitals (indicating a metallic state). |
Review
#933
RuRhPdIrPtFeCoNiCuW
Pt L3-edge
▶
LLM Prompt
Sample Information
Material: RuRhPdIrPtFeCoNiCuW
Support: carbon
Sample-Specific Conditions
- element edge: Pt L3-edge
- 10-element high-entropy alloy nanoparticles on carbon support
Measurement
We plan to measure the Pt L3-edge XANES spectrum of this sample.
Questions
Based on all the information above:
1. Based on the synthesis of the 10-element high-entropy alloy (RuRhPdIrPtFeCoNiCuW) on carbon via the flame aerosol process, what is the expected oxidation state of Pt, and what physical mechanism drives the formation of this state?
2. Describe the expected spectral shape of the Pt L3-edge XANES for this high-entropy alloy sample, specifically comparing its white-line intensity to that of Pt oxides.
Ground Truth
Material: RuRhPdIrPtFeCoNiCuW/carbon
Measurement: Pt L3-edge XAS, ex-situ, 8-ID beamline (Inner Shell Spectroscopy) of Brookhaven Lab’s National Synchrotron Light Source II
Fit method: qualitative comparison of XANES white-line intensity and EXAFS
Phase fractions:
| Phase | Fraction |
|---|---|
| metallic_platinum | 1.0 |
Fit basis (paper's reference spectra):
- Pt foil
- PtO2
Source evidence: Page 21-22, lines 479-484; Figure 5j
Key reasoning: The non-equilibrium flame aerosol process combined with the entropy-induced reduction mechanism allows the direct reduction and incorporation of multiple elements into a single FCC metallic phase. The XANES spectra show a significantly lower white-line intensity compared to oxides, confirming the high occupancy of d orbitals characteristic of the metallic state.
Reasoning source: Page 21-22, lines 475-484
Scoring Rubric (total: 100 pts)
| Q | Type | Max | Question | Reference Answer | Scoring Criteria |
|---|---|---|---|---|---|
| q1 | reasoning | 57 | Based on the synthesis of the 10-element high-entropy alloy (RuRhPdIrPtFeCoNiCuW) on carbon via the flame aerosol process, what is the expected oxidation state of Pt, and what physical mechanism drives the formation of this state? | The expected oxidation state of Pt in the 10-element high-entropy alloy (RuRhPdIrPtFeCoNiCuW) on carbon is 0, corresponding to a fully metallic state with a fraction of 1.0. This zero-valent state arises because the non-equilibrium flame aerosol process, combined with an entropy-induced reduction mechanism, drives the direct reduction of the precursors. These specific synthesis conditions allow all ten elements to be successfully incorporated into a single FCC metallic phase rather than forming oxides. Ultimately, this mechanism results in a high occupancy of the Pt 5d orbitals, characteristic of the pure metallic state. | Award 20 points for identifying the metallic state (oxidation state 0). Award 20 points for explaining that the entropy-induced reduction mechanism and non-equilibrium flame process facilitate the reduction and incorporation of the elements into a single metallic phase. |
| q2 | spectral | 43 | Describe the expected spectral shape of the Pt L3-edge XANES for this high-entropy alloy sample, specifically comparing its white-line intensity to that of Pt oxides. | The Pt L3-edge XANES spectrum for this 10-element high-entropy alloy sample is expected to exhibit a significantly lower white-line intensity compared to Pt oxides such as PtO2. This distinct spectral feature arises because the non-equilibrium flame aerosol process and entropy-induced reduction mechanism convert the precursors entirely into a single FCC metallic phase. Because these conditions yield a fully metallic state (oxidation state 0), there is a high occupancy of the Pt 5d orbitals. It is this high 5d orbital occupancy, characteristic of the metallic alloy, that directly produces the suppressed white-line intensity observed in the XANES spectrum. | Award 15 points for stating that the white-line intensity is significantly lower than that of Pt oxides. Award 15 points for connecting this lower intensity to the high occupancy of Pt 5d orbitals, which is characteristic of the metallic state. |
Review
Understanding X-ray absorption spectra by means of descriptors and machine learning algorithms
ESRF-BM23
Pure Phase
A. A. Guda et al.
DOI: 10.1038/s41524-021-00664-9
7 scenarios
▶
#934
Cu
Cu K
▶
LLM Prompt
Sample Information
Material: Cu
Crystal Structure: fcc
Oxidation State: 0
- Metallic copper reference
Measurement
We plan to measure the Cu K XANES spectrum of this sample.
Questions
Based on all the information above:
1. Describe the expected spectral shape and key features of the Cu K-edge XANES for fcc Cu metal.
2. How do the post-edge features (M2, M3, M4) in the Cu K-edge XANES of fcc Cu metal relate to its local structure, and how can they be used to probe nanosized effects?
3. What specific spectral features distinguish the Cu K-edge XANES of fcc Cu metal from other copper compounds?
Ground Truth
Compound: Cu metal (fcc)
Oxidation state: 0
Measurement: Cu K-edge XANES
Edge position: not reported
Spectral shape: Characterized by a shoulder on the rising edge and the splitting of the main peak into M1 and M2 features.
Labeled peaks:
| Label | Energy (eV) | Intensity | Origin | Source |
|---|---|---|---|---|
| B | not reported | moderate | shoulder on rising edge | paper_data |
| M1 | not reported | strong | split main peak | paper_data |
| M2 | not reported | strong | split main peak, sensitive to scattering from second coordination shell | paper_data |
| M3 | not reported | moderate | sensitive to scattering from second coordination shell | paper_data |
| M4 | not reported | weak | high-energy maxima relating to interatomic distances via Natoli's rule | paper_data |
Distinguishing features: Splitting of the main peak (M1/M2) and specific post-edge oscillations (M3, M4).
Key reasoning: The Cu K-edge XANES of fcc Cu metal is characterized by a shoulder on the rising edge and the splitting of the main peak into M1 and M2 features. The intensities of M2 and M3 are sensitive to scattering from the second coordination shell, and their reduction can probe nanosized effects. Positions of M4 and higher-energy maxima relate to interatomic distances via Natoli's rule.
Reasoning source: Introduction, page 1
Scoring Rubric (total: 100 pts)
| Q | Type | Max | Question | Reference Answer | Scoring Criteria |
|---|---|---|---|---|---|
| q1 | spectral | 35 | Describe the expected spectral shape and key features of the Cu K-edge XANES for fcc Cu metal. | The expected Cu K-edge XANES spectrum for this sample is characterized by a shoulder on the rising edge (labeled B) and a main peak that is split into two distinct features, M1 and M2. Additionally, the spectrum exhibits specific post-edge oscillations, including a moderate intensity M3 peak and a weak intensity M4 peak. These specific spectral features arise directly from the sample being a pure metallic copper reference with an fcc crystal structure and an oxidation state of 0. Because the sample is a fully metallic fcc lattice, the specific photoelectron scattering paths from its well-defined coordination shells produce this characteristic peak splitting and the distinct post-edge maxima. | Must mention the presence of a shoulder on the rising edge (feature B) and the characteristic splitting of the main peak into two features (M1 and M2). |
| q2 | reasoning | 35 | How do the post-edge features (M2, M3, M4) in the Cu K-edge XANES of fcc Cu metal relate to its local structure, and how can they be used to probe nanosized effects? | In the Cu K-edge XANES of this fcc Cu metal sample, the intensities of the M2 and M3 post-edge features are highly sensitive to photoelectron scattering from the second coordination shell. Consequently, a reduction in the intensities of these specific peaks can be used to probe nanosized effects, as nanomaterials often have altered or truncated higher-order coordination shells. Furthermore, the energy positions of the M4 peak and higher-energy maxima directly relate to interatomic distances in the lattice via Natoli's rule. These structural relationships manifest precisely because the sample is a pure fcc metallic copper reference with an oxidation state of 0, where the extended periodic crystal structure dictates the specific multiple scattering resonances observed in the post-edge region. | Must state that M2 and M3 intensities are sensitive to scattering from the second coordination shell (and their reduction indicates nanosized effects), and that M4/higher maxima positions relate to interatomic distances via Natoli's rule. |
| q3 | identification | 30 | What specific spectral features distinguish the Cu K-edge XANES of fcc Cu metal from other copper compounds? | The Cu K-edge XANES of fcc Cu metal is primarily distinguished by the splitting of the main absorption peak into two distinct features, M1 and M2, along with a characteristic shoulder (B) on the rising edge. It is further distinguished by specific post-edge oscillations, namely the M3 and M4 peaks. These distinguishing features are expected because the sample is a pure metallic copper reference with an oxidation state of 0 and an fcc crystal structure. Unlike oxidized copper compounds or different crystal lattices, the unique local geometry and metallic bonding of the fcc Cu(0) lattice produce specific scattering from the second coordination shell and distinct interatomic distances, resulting in this unique spectral signature. | Must identify the splitting of the main peak (M1/M2) and the specific post-edge oscillations (M3, M4) as the distinguishing features for fcc Cu metal. |
Review
#935
Cu2O
Cu K
▶
LLM Prompt
Sample Information
Material: Cu2O
Oxidation State: +1
- Copper(I) oxide reference
Measurement
We plan to measure the Cu K XANES spectrum of this sample.
Questions
Based on all the information above:
1. Describe the expected spectral shape and the key distinguishing feature of the Cu K-edge XANES spectrum for Cu2O.
2. What is the specific electronic transition or origin responsible for the prominent sharp shoulder on the rising edge of the Cu2O spectrum?
3. How does the local coordination geometry of copper in Cu2O relate to the presence of its distinguishing XANES feature?
Ground Truth
Compound: Cu2O
Oxidation state: +1
Measurement: Cu K-edge XANES
Edge position: not reported
Spectral shape: Dominated by a very sharp and intense shoulder B on the rising edge.
Labeled peaks:
| Label | Energy (eV) | Intensity | Origin | Source |
|---|---|---|---|---|
| B | not reported | sharp and intense | transition to empty 4p orbitals perpendicular to the chemical bonds | Figure 1 and Page 1 text |
Distinguishing features: Intense sharp shoulder B on the rising edge indicative of linear geometry.
Key reasoning: Cu2O is presented as a reference compound for Cu(I) in a linear coordination environment. Its spectrum is characterized by a sharp shoulder on the rising edge, which originates from transitions to empty 4p orbitals perpendicular to the chemical bonds.
Reasoning source: Introduction, Page 1
Scoring Rubric (total: 100 pts)
| Q | Type | Max | Question | Reference Answer | Scoring Criteria |
|---|---|---|---|---|---|
| q1 | spectral | 30 | Describe the expected spectral shape and the key distinguishing feature of the Cu K-edge XANES spectrum for Cu2O. | The expected spectral shape of the Cu K-edge XANES for Cu2O is dominated by a very sharp and intense shoulder (labeled B) on the rising edge. This intense sharp shoulder serves as the key distinguishing feature of the spectrum. Because the sample is a pure Copper(I) oxide reference, it consists entirely of copper in a +1 oxidation state with a linear coordination environment. This specific linear geometry dictates the electronic structure, producing the prominent shoulder feature due to transitions to empty 4p orbitals oriented perpendicular to the chemical bonds. | Full credit if the answer identifies the sharp, intense shoulder on the rising edge as the dominant and distinguishing feature. |
| q2 | reasoning | 35 | What is the specific electronic transition or origin responsible for the prominent sharp shoulder on the rising edge of the Cu2O spectrum? | The prominent sharp shoulder (labeled B) on the rising edge of the Cu2O spectrum originates from electronic transitions to empty 4p orbitals. As a pure Copper(I) oxide reference, the sample contains Cu in a +1 oxidation state situated in a linear coordination environment. Because of this linear geometry, the empty 4p orbitals are oriented perpendicular to the chemical bonds. The specific structural and electronic configuration of this Cu(I) state facilitates the intense transition to these perpendicular 4p orbitals, producing the characteristic sharp shoulder observed in the XANES spectrum. | Full credit if the answer correctly attributes the feature to a transition to empty 4p orbitals perpendicular to the chemical bonds. |
| q3 | reasoning | 35 | How does the local coordination geometry of copper in Cu2O relate to the presence of its distinguishing XANES feature? | The local coordination geometry of copper in Cu2O is linear, which is directly responsible for its distinguishing XANES feature—an intense, sharp shoulder (labeled B) on the rising edge. In this Copper(I) oxide reference sample, the Cu is in a +1 oxidation state and adopts this linear coordination environment. This specific geometry leaves empty 4p orbitals oriented perpendicular to the chemical bonds. Consequently, the XANES spectrum exhibits a sharp and intense peak due to the highly favored electronic transitions into these perpendicular 4p orbitals, making the linear geometry the fundamental cause of the spectral shape. | Full credit if the answer explicitly connects the linear coordination geometry of Cu(I) in Cu2O to the appearance of the sharp shoulder on the rising edge. |
Review
#936
CuO
Cu K
▶
LLM Prompt
Sample Information
Material: CuO
Oxidation State: +2
- Copper(II) oxide reference
Measurement
We plan to measure the Cu K XANES spectrum of this sample.
Questions
Based on all the information above:
1. Describe the expected overall spectral shape and the key distinguishing features in the Cu K-edge XANES spectrum of CuO.
2. What are the electronic transitions or physical origins responsible for the pre-edge feature and the prominent shoulder on the rising edge in the CuO spectrum?
3. How does the white line feature in the Cu K-edge XANES spectrum of CuO reflect its specific local coordination geometry?
Ground Truth
Compound: CuO
Oxidation state: +2
Measurement: Cu K-edge XANES
Edge position: not reported
Spectral shape: Shows a pre-edge feature A, a shoulder B on the rising edge, and a split white line C.
Labeled peaks:
| Label | Energy (eV) | Intensity | Origin | Source |
|---|---|---|---|---|
| A | not reported | weak | transition to spatially localized 3d states | paper_data |
| B | not reported | moderate | transition to empty 4p orbitals perpendicular to chemical bonds | paper_data |
| C | not reported | strong | white line | paper_data |
Distinguishing features: Split white line and presence of shoulder B.
Key reasoning: The Cu K-edge XANES spectrum of CuO exhibits specific features characteristic of its square planar geometry and +2 oxidation state. The pre-edge feature A originates from transitions to localized 3d states, with intensity proportional to 3d-4p hybridization. The sharp shoulder B on the rising edge indicates a square planar geometry with lower energy of empty 4p orbitals perpendicular to the chemical bonds. The white line C shows energy splitting, which is characteristic of planar complexes.
Reasoning source: Introduction section, discussion of Figure 1
Scoring Rubric (total: 100 pts)
| Q | Type | Max | Question | Reference Answer | Scoring Criteria |
|---|---|---|---|---|---|
| q1 | spectral | 30 | Describe the expected overall spectral shape and the key distinguishing features in the Cu K-edge XANES spectrum of CuO. | The expected overall spectral shape of the Cu K-edge XANES spectrum for the CuO reference sample includes a weak pre-edge feature A, a moderate shoulder B on the rising edge, and a strong, split white line C. The key distinguishing features of this spectrum are the split white line and the distinct presence of shoulder B. These specific spectral features arise directly from the sample's +2 oxidation state and its square planar geometry. Because the Cu(II) ions are in a square planar coordination, the empty 4p orbitals perpendicular to the chemical bonds have lower energy, producing the distinct shoulder B, while the planar complex nature causes the characteristic energy splitting of the white line. | Full credit for mentioning the pre-edge feature, the shoulder on the rising edge, and the split white line as distinguishing features. |
| q2 | reasoning | 40 | What are the electronic transitions or physical origins responsible for the pre-edge feature and the prominent shoulder on the rising edge in the CuO spectrum? | In the Cu K-edge XANES spectrum of the CuO sample, the weak pre-edge feature A originates from electronic transitions to spatially localized 3d states. The intensity of this pre-edge feature is proportional to the degree of 3d-4p hybridization in the material. The moderate, sharp shoulder B on the rising edge originates from transitions to empty 4p orbitals that are oriented perpendicular to the chemical bonds. These specific transitions occur because the CuO sample features Cu in a +2 oxidation state with a square planar geometry, which lowers the energy of these perpendicular 4p orbitals and makes the shoulder B a distinct characteristic of this coordination environment. | Full credit for stating the pre-edge originates from transitions to spatially localized 3d states (with intensity proportional to 3d-4p hybridization) and the shoulder originates from transitions to empty 4p orbitals perpendicular to the chemical bonds. |
| q3 | reasoning | 30 | How does the white line feature in the Cu K-edge XANES spectrum of CuO reflect its specific local coordination geometry? | The strong white line feature (labeled C) in the Cu K-edge XANES spectrum of CuO exhibits a distinct energy splitting. This splitting directly reflects the specific local coordination geometry of the copper ions in the sample, which exist in a square planar arrangement. Because the CuO reference material contains copper in a +2 oxidation state within a planar complex, the electronic structure is modified compared to other geometries. Consequently, this planar coordination environment induces the characteristic energy splitting observed in the white line, serving as a direct spectral signature of the square planar geometry. | Full credit for explaining that the white line exhibits energy splitting, which is a characteristic structural sensitivity of planar (square planar) complexes. |
Review
#937
[Cu(H2O)6]2+
Cu K
▶
LLM Prompt
Sample Information
Material: [Cu(H2O)6]2+
Oxidation State: +2
- Pseudo-octahedral Cu(II) complex
Measurement
We plan to measure the Cu K XANES spectrum of this sample.
Questions
Based on all the information above:
1. Describe the expected pre-edge and white line features for this pseudo-octahedral Cu(II) complex, including the physical origin of the pre-edge feature.
2. What distinguishes the white line of this pseudo-octahedral complex from that of planar metal complexes?
3. What structural information can be inferred from the post-edge feature 'D' in such molecular complexes?
Ground Truth
Compound: [Cu(H2O)6]2+
Oxidation state: +2
Measurement: Cu K-edge XANES
Edge position: not reported exactly
Spectral shape: The spectrum features a weak pre-edge A, a very intense and sharp (unsplit) white line C, and post-edge features including D.
Labeled peaks:
| Label | Energy (eV) | Intensity | Origin | Source |
|---|---|---|---|---|
| A | not reported exactly | weak | transition to spatially localized 3d states | paper_data |
| C | not reported exactly | high | white line | paper_data |
| D | not reported exactly | moderate | sensitive to scattering from the second coordination shell | paper_data |
Distinguishing features: Higher intensity of the white line C compared to other geometries, and lack of energy splitting in the white line (which is characteristic of planar complexes).
Key reasoning: The spectrum of [Cu(H2O)6]2+ serves as a reference for pseudo-octahedral Cu(II) coordination. It exhibits a weak pre-edge feature A due to transitions to spatially localized 3d states, and a high-intensity white line C characteristic of octahedral coordination.
Reasoning source: Introduction, Page 1
Scoring Rubric (total: 100 pts)
| Q | Type | Max | Question | Reference Answer | Scoring Criteria |
|---|---|---|---|---|---|
| q1 | spectral | 35 | Describe the expected pre-edge and white line features for this pseudo-octahedral Cu(II) complex, including the physical origin of the pre-edge feature. | The Cu K-edge XANES spectrum for this sample is expected to exhibit a weak pre-edge feature (labeled A) and a high-intensity, sharp, unsplit white line (labeled C). Because the sample is a pseudo-octahedral Cu(II) complex, the weak pre-edge feature A arises from electronic transitions to spatially localized 3d states. Furthermore, the high-intensity white line C is a direct characteristic of this pseudo-octahedral coordination geometry. As a pure reference compound of [Cu(H2O)6]2+, these distinct spectral features perfectly reflect its specific +2 oxidation state and pseudo-octahedral structural environment. | Full points if the answer mentions a weak pre-edge originating from transitions to spatially localized 3d states, and a high-intensity white line. |
| q2 | reasoning | 35 | What distinguishes the white line of this pseudo-octahedral complex from that of planar metal complexes? | The white line (feature C) of this pseudo-octahedral complex is distinguished by its higher intensity compared to other geometries and its lack of energy splitting. Because the sample is a pseudo-octahedral [Cu(H2O)6]2+ complex, it produces a very intense and sharp, unsplit white line characteristic of octahedral coordination. In contrast, planar complexes typically exhibit energy splitting in their white line features. Therefore, the specific pseudo-octahedral geometry of this Cu(II) complex dictates this unsplit, high-intensity spectral signature, distinguishing it from planar structures. | Full points if the answer notes that the pseudo-octahedral complex has a higher intensity white line and lacks the energy splitting of the white line that characterizes planar complexes. |
| q3 | reasoning | 30 | What structural information can be inferred from the post-edge feature 'D' in such molecular complexes? | The post-edge feature 'D' provides structural information regarding the second coordination shell of the complex. In this pseudo-octahedral [Cu(H2O)6]2+ sample, feature D appears as a moderate-intensity peak following the main edge. Because XANES features in this region are sensitive to the spatial arrangement of surrounding atoms, feature D specifically originates from scattering events involving the second coordination shell. Thus, the presence and characteristics of this post-edge feature directly reflect the extended structural environment beyond the immediate pseudo-octahedral Cu(II) coordination sphere. | Full points if the answer states that feature D is sensitive to scattering from the second coordination shell. |
Review
#938
Fe2O3
Cu K
▶
LLM Prompt
Sample Information
Material: Fe2O3
Crystal Structure: hematite
Oxidation State: +3
- Hematite reference for ML validation
Measurement
We plan to measure the Cu K XANES spectrum of this sample.
Questions
Based on all the information above:
1. Based on the provided conditions, what are the expected oxidation state and coordination number for iron in alpha-Fe2O3?
2. How does the local coordination environment of alpha-Fe2O3 distinguish its expected spectral shape from other iron oxides like gamma-Fe2O3 and Fe3O4?
Ground Truth
Compound: alpha-Fe2O3
Oxidation state: +3
Measurement: Fe K-edge XANES
Edge position: not reported
Spectral shape: The spectrum is characterized by specific values of the white line energy (WLE), pit energy (PitE), and white line curvature (WLcurv) that map to a purely 6-coordinated Fe3+ environment.
Distinguishing features: Distinguished from gamma-Fe2O3 and Fe3O4 by the complete absence of tetrahedral (4-coordinated) Fe sites, which shifts the projection of its spectral descriptors compared to those mixed-coordination oxides.
Key reasoning: alpha-Fe2O3 is used as a known experimental reference compound with an oxidation state of +3, a coordination number of 6, and an average Fe-O distance of approximately 2.0 Å. Its spectral descriptors (such as PitE, WLE, WLcurv) properly project it into the region of 6-coordinated Fe3+ species, distinguishing it from gamma-Fe2O3 and Fe3O4 which contain tetrahedral sites.
Reasoning source: Page 7, Results and Discussion (Fitting a multi-component system)
Scoring Rubric (total: 100 pts)
| Q | Type | Max | Question | Reference Answer | Scoring Criteria |
|---|---|---|---|---|---|
| q1 | prediction | 43 | Based on the provided conditions, what are the expected oxidation state and coordination number for iron in alpha-Fe2O3? | The expected oxidation state for iron in alpha-Fe2O3 is +3, and its coordination number is 6. These properties arise because the sample is provided as a pure hematite (Fe2O3) reference material specifically intended for machine learning validation. As a known experimental reference compound, it consists entirely of a purely 6-coordinated Fe3+ environment with an average Fe-O distance of approximately 2.0 Å. This specific structural configuration is expected because the material is utilized as a standard to map spectral descriptors into the precise region of 6-coordinated Fe3+ species. | Full points for correctly identifying the oxidation state as +3 and the coordination number as 6. |
| q2 | reasoning | 57 | How does the local coordination environment of alpha-Fe2O3 distinguish its expected spectral shape from other iron oxides like gamma-Fe2O3 and Fe3O4? | The expected spectral shape of alpha-Fe2O3 is characterized by specific values of white line energy (WLE), pit energy (PitE), and white line curvature (WLcurv) that map exclusively to a 6-coordinated Fe3+ environment. This distinct spectral profile arises because the sample is a pure hematite reference material, which completely lacks tetrahedral (4-coordinated) Fe sites. In contrast, other iron oxides like gamma-Fe2O3 and Fe3O4 contain these tetrahedral sites, creating a mixed-coordination environment. Because the sample conditions dictate a pure +3 hematite standard, its spectral descriptors project strictly into the 6-coordinated Fe3+ region, clearly distinguishing its spectral shape from those of mixed-coordination oxides. | Full points for explaining that alpha-Fe2O3 is purely 6-coordinated, whereas gamma-Fe2O3 and Fe3O4 contain tetrahedral (4-coordinated) Fe sites, which alters the spectral shape and corresponding descriptors. |
Review
#939
Fe3O4
Cu K
▶
LLM Prompt
Sample Information
Material: Fe3O4
Crystal Structure: magnetite
Oxidation State: mixed (+2/+3)
- Magnetite reference for ML validation
Measurement
We plan to measure the Cu K XANES spectrum of this sample.
Questions
Based on all the information above:
1. Based on the structural composition of Fe3O4, why do its XANES spectral features (such as edge position and white line) indicate intermediate average valence and coordination when compared to pure references like a-Fe2O3 or Fe2SiO4?
2. What specific mixture of oxidation states and coordination environments characterizes the Fe sites in the Fe3O4 reference phase?
3. How does the presence of tetrahedral Fe sites in Fe3O4 affect its classification in a structural analysis compared to a purely octahedral compound?
Ground Truth
Compound: Fe3O4
Oxidation state: mixed (+2/+3)
Measurement: Fe K-edge XANES
Edge position: not reported
Spectral shape: Projects to intermediate regions in descriptor space (e.g., edge energy, white line, pit energy) due to its mixed valence and mixed coordination, overlapping with intermediate classes.
Distinguishing features: Contains one-third of Fe ions in tetrahedral positions and a mixture of Fe2+ and Fe3+ sites, distinguishing it from pure octahedral or single-valence references like a-Fe2O3 or Fe2SiO4.
Key reasoning: Fe3O4 contains a mixture of Fe2+ and Fe3+ sites, and one-third of its Fe ions are located in tetrahedral positions. Because of this mixed valence and mixed coordination environment, its spectral descriptors project into the intermediate average valence region and the region where 4-, 5-, and 6-coordinated points overlap in the descriptor scatter plots.
Reasoning source: Page 7, discussion of Figure 8
Scoring Rubric (total: 100 pts)
| Q | Type | Max | Question | Reference Answer | Scoring Criteria |
|---|---|---|---|---|---|
| q1 | reasoning | 40 | Based on the structural composition of Fe3O4, why do its XANES spectral features (such as edge position and white line) indicate intermediate average valence and coordination when compared to pure references like a-Fe2O3 or Fe2SiO4? | The XANES spectral features of Fe3O4 project into intermediate regions for descriptors like edge energy, white line, and pit energy due to its specific structural composition. Specifically, the magnetite sample contains a mixture of Fe2+ and Fe3+ oxidation states, unlike single-valence references such as a-Fe2O3 or Fe2SiO4. Additionally, one-third of the Fe ions in Fe3O4 are located in tetrahedral positions, creating a mixed coordination environment. Consequently, this intrinsic combination of mixed valence and mixed coordination causes its spectral descriptors to overlap with intermediate classes in the descriptor scatter plots, rather than aligning with pure octahedral or single-valence extremes. | Full credit requires mentioning that Fe3O4 contains a mixture of Fe2+ and Fe3+ sites (mixed valence) and that one-third of the Fe ions are in tetrahedral positions (mixed coordination), causing it to exhibit intermediate spectral characteristics. |
| q2 | identification | 30 | What specific mixture of oxidation states and coordination environments characterizes the Fe sites in the Fe3O4 reference phase? | The Fe3O4 reference phase is characterized by a mixed oxidation state consisting of both Fe2+ and Fe3+ sites. Structurally, it features a mixed coordination environment where exactly one-third of its Fe ions are located in tetrahedral positions. These specific oxidation and coordination states arise directly from the intrinsic crystal structure of the magnetite sample. Because of this unique combination of mixed valence and mixed coordination, the sample's spectral descriptors project into the intermediate average valence region and overlap with 4-, 5-, and 6-coordinated points in descriptor space. | Must identify the oxidation states as a mixture of +2 and +3, and the coordination environments as a mix of tetrahedral (one-third) and octahedral sites. |
| q3 | prediction | 30 | How does the presence of tetrahedral Fe sites in Fe3O4 affect its classification in a structural analysis compared to a purely octahedral compound? | The presence of tetrahedral Fe sites in Fe3O4 causes its spectral descriptors to project into regions where 4-, 5-, and 6-coordinated points overlap in descriptor scatter plots. This occurs because exactly one-third of the Fe ions in the magnetite crystal structure are located in these tetrahedral positions, creating a mixed coordination environment. Unlike purely octahedral or single-valence references such as a-Fe2O3 or Fe2SiO4, this mixed coordination, combined with its mixed (+2/+3) oxidation state, prevents it from being classified at the structural extremes. Therefore, the sample is classified within the intermediate average valence and coordination regions during structural analysis. | Must state that the tetrahedral sites cause the spectrum to project into an overlapping region for 4-, 5-, and 6-coordinated points, rather than a distinct 6-coordinated region. |
Review
#940
Fe2SiO4
Cu K
▶
LLM Prompt
Sample Information
Material: Fe2SiO4
Crystal Structure: fayalite
Oxidation State: +2
- Fayalite reference for ML validation
Measurement
We plan to measure the Cu K XANES spectrum of this sample.
Questions
Based on all the information above:
1. Based on the structural parameters of Fe2SiO4 (fayalite), what oxidation state and relative Fe-O bond distance characteristics would you expect to dominate its XANES spectrum compared to other iron oxides like gamma-Fe2O3?
2. If you were to analyze the Fe K-edge XANES spectrum of Fe2SiO4 using a descriptor-based approach, what specific structural features would the spectral shape (edge position, white line, etc.) indicate?
3. In a multi-component system containing various iron oxides and silicates, what specific structural parameter makes the Fe2SiO4 phase stand out when analyzing its XANES spectral descriptors?
Ground Truth
Compound: Fe2SiO4
Oxidation state: +2
Measurement: Fe K-edge XANES
Edge position: not reported
Spectral shape: Used as a reference spectrum for 6-coordinated Fe2+ with long Fe-O distances. Its spectral descriptors (such as edge position, white line intensity, and pit energy) map it to the corresponding structural regions in the ML model's scatter plots.
Distinguishing features: Has the longest Fe-O distances (equal to 2.2 Å) among the studied reference compounds, which distinguishes its projection on the descriptor scatter plots from compounds like gamma-Fe2O3 which have the shortest.
Key reasoning: Fe2SiO4 is used as a pure crystalline reference compound to validate the descriptor-based machine learning algorithm. The model correctly projects Fe2SiO4 to the Fe2+ oxidation state region and identifies it as having the longest average Fe-O distance (2.2 Å) among the references. This confirms the relationship between the XANES spectral shape and the local atomic structure.
Reasoning source: Page 7, Section 'Fitting a multi-component system'
Scoring Rubric (total: 100 pts)
| Q | Type | Max | Question | Reference Answer | Scoring Criteria |
|---|---|---|---|---|---|
| q1 | reasoning | 35 | Based on the structural parameters of Fe2SiO4 (fayalite), what oxidation state and relative Fe-O bond distance characteristics would you expect to dominate its XANES spectrum compared to other iron oxides like gamma-Fe2O3? | The XANES spectrum of Fe2SiO4 (fayalite) is dominated by an Fe2+ oxidation state and the longest average Fe-O bond distances among the studied reference compounds. Because the sample is a pure crystalline fayalite reference, its local atomic structure consists of 6-coordinated Fe2+ with an average Fe-O distance of 2.2 Å. This specific structural configuration dictates its spectral shape, causing its spectral descriptors to project into the Fe2+ region on machine learning scatter plots. Consequently, its long Fe-O bond distance of 2.2 Å distinctly separates its spectral features from compounds like gamma-Fe2O3, which possess the shortest Fe-O distances. | The answer must identify the Fe2+ oxidation state and state that it has longer Fe-O distances (2.2 Å) compared to gamma-Fe2O3. |
| q2 | prediction | 35 | If you were to analyze the Fe K-edge XANES spectrum of Fe2SiO4 using a descriptor-based approach, what specific structural features would the spectral shape (edge position, white line, etc.) indicate? | Analyzing the Fe K-edge XANES spectrum of Fe2SiO4 using a descriptor-based approach would indicate a 6-coordinated Fe2+ local structure with an average Fe-O distance of 2.2 Å. Because the sample is pure crystalline fayalite with an Fe2+ oxidation state, its specific atomic arrangement directly governs the XANES spectral shape. Descriptors extracted from the spectrum, such as edge position, white line intensity, and pit energy, map directly to these structural properties in the machine learning model's scatter plots. Therefore, the spectral shape confirms the relationship between the XANES features and the local atomic structure, correctly projecting the sample into the Fe2+ region with the longest Fe-O distances among the reference compounds. | The answer must mention that the spectral shape indicates an Fe2+ state, a coordination number of 6, and long Fe-O distances (~2.2 Å). |
| q3 | identification | 30 | In a multi-component system containing various iron oxides and silicates, what specific structural parameter makes the Fe2SiO4 phase stand out when analyzing its XANES spectral descriptors? | The Fe2SiO4 phase stands out due to having the longest average Fe-O bond distance, specifically 2.2 Å, among the studied reference compounds. Given that the sample is pure crystalline fayalite with a 6-coordinated Fe2+ structure, this specific atomic configuration produces distinct spectral descriptors such as edge position, white line intensity, and pit energy. When these descriptors are analyzed via a machine learning algorithm, they project the Fe2SiO4 phase into a unique region of the scatter plots corresponding to the Fe2+ oxidation state. This long 2.2 Å Fe-O distance serves as the primary distinguishing feature that separates its spectral signature from other iron oxides, such as gamma-Fe2O3, which have much shorter Fe-O distances. | The answer must identify that Fe2SiO4 has the longest Fe-O distances (2.2 Å) among the typical reference compounds. |
Review
A robust fuel cell operated on nearly dry methane at 500 °C enabled by synergistic thermal catalysis and electrocatalysis
BNL-NSLS-II-8-ID
Catalyst
Yu Chen et al.
DOI: 10.1038/s41560-018-0262-5
2 scenarios
▶
#941
Ce0.90Ni0.05Ru0.05O2
Ni K-edge
▶
LLM Prompt
Sample Information
Material: Ce0.90Ni0.05Ru0.05O2
Support: CeO2
Reaction Conditions: mixture of ~96.5% CH4 and ~3.5% H2O at 200 °C immediately after catalysis at 500 °C
Sample-Specific Conditions
- element edge: Ni K-edge
- Ce0.90Ni0.05Ru0.05O2 catalyst evaluated after steam reforming of methane
Measurement
We plan to measure the Ni K-edge XANES spectrum of this sample.
Questions
Based on all the information above:
1. Based on the provided sample conditions (evaluated after steam reforming of methane), what is the dominant chemical state and structural form of Ni in the Ce0.90Ni0.05Ru0.05O2 catalyst, and what physical reasoning supports this structural assignment?
2. What reference spectra are necessary to evaluate the oxidation state and rule out the formation of nanoclusters for the Ni species in this sample?
3. Describe the expected spectral shape of the Ni K-edge for this catalyst and explain what distinguishing features in the X-ray absorption data differentiate it from bulk NiO and metallic Ni nanoparticles.
Ground Truth
Material: Ce0.90Ni0.05Ru0.05O2
Measurement: Ni K-edge in situ/operando fluorescence mode at beamline 2-2 in Stanford Synchrotron Radiation Lab (SSRL)
Fit method: Qualitative XANES comparison and EXAFS r-space fitting
Phase fractions:
| Phase | Fraction |
|---|---|
| singly dispersed Ni cations | 1.0 |
Fit basis (paper's reference spectra):
- Ni metal foil
- NiO
Source evidence: Figure 3b, Figure 3d, Table 1, Pages 9-10
Key reasoning: According to XANES analysis, the Ni species are at an oxidized state, with edge features quite similar to those of NiO and definitely different from metallic Ni. EXAFS r-space fitting shows Ni cations binding to oxygen ions (Ni-O bond length 1.90 Å) and Ce (Ni-O-Ce distance 3.11 Å). The absence of a peak for Ni-Ni bonds at ~2.30 Å shows no metallic Ni nanoclusters formed, and the lack of a peak at 2.96 Å confirms no NiO nanoclusters were formed. Thus, Ni species are singly dispersed cations on CeO2.
Reasoning source: Pages 9-10, Section: Catalytic activity and microanalysis of catalysts
Scoring Rubric (total: 100 pts)
| Q | Type | Max | Question | Reference Answer | Scoring Criteria |
|---|---|---|---|---|---|
| q1 | reasoning | 35 | Based on the provided sample conditions (evaluated after steam reforming of methane), what is the dominant chemical state and structural form of Ni in the Ce0.90Ni0.05Ru0.05O2 catalyst, and what physical reasoning supports this structural assignment? | The dominant chemical state of Ni in the Ce0.90Ni0.05Ru0.05O2 catalyst evaluated after steam reforming of methane is an oxidized, cationic state (fraction 1.0). Structurally, the Ni exists entirely as singly dispersed cations on the CeO2 support. This structural assignment is supported by the fact that despite exposure to a potentially reducing mixture of ~96.5% CH4 and ~3.5% H2O at elevated temperatures (500 °C), XANES analysis shows edge features similar to NiO and distinct from metallic Ni. Furthermore, EXAFS fitting reveals Ni-O and Ni-O-Ce bonds but completely lacks Ni-Ni bonding peaks at ~2.30 Å or 2.96 Å, proving that neither metallic Ni nor NiO nanoclusters formed during the reaction. | Full points if the answer identifies Ni as singly dispersed cations in an oxidized state and explains that this is supported by the presence of Ni-O and Ni-O-Ce bonds alongside the complete absence of Ni-Ni bonds (which rules out metallic or NiO nanoclusters). |
| q2 | identification | 25 | What reference spectra are necessary to evaluate the oxidation state and rule out the formation of nanoclusters for the Ni species in this sample? | To evaluate the Ni species in the Ce0.90Ni0.05Ru0.05O2 catalyst, Ni metal foil and NiO reference spectra are necessary. These references are required because the sample is exposed to a CH4 and H2O mixture at elevated temperatures (up to 500 °C), which could potentially reduce the Ni or cause it to aggregate into metallic or oxide clusters. By comparing the sample's XANES spectrum to these references, it is evident that the Ni resists reduction and remains in an oxidized state similar to NiO. Additionally, these references help confirm the absence of Ni-Ni bonding peaks in the EXAFS data (at ~2.30 Å for metal and 2.96 Å for NiO), proving that the Ni remains as singly dispersed cations on the CeO2 support rather than forming nanoclusters. | Full points if the answer identifies Ni metal foil and NiO as the required reference spectra. |
| q3 | spectral | 40 | Describe the expected spectral shape of the Ni K-edge for this catalyst and explain what distinguishing features in the X-ray absorption data differentiate it from bulk NiO and metallic Ni nanoparticles. | The expected spectral shape of the Ni K-edge for this Ce0.90Ni0.05Ru0.05O2 catalyst exhibits edge features that are quite similar to those of NiO and definitely different from metallic Ni. These features arise because, despite being evaluated in a CH4 and H2O mixture after catalysis at 500 °C, the Ni species resist reduction and maintain an oxidized, cationic state. The distinguishing features that differentiate this sample from bulk NiO and metallic Ni nanoparticles are found in the extended X-ray absorption fine structure (EXAFS) region. Specifically, the data lacks any Ni-Ni bonding peaks at ~2.30 Å (characteristic of metallic Ni nanoclusters) and at 2.96 Å (characteristic of NiO nanoclusters), confirming that the Ni exists exclusively as singly dispersed cations bound to oxygen and Ce on the CeO2 support. | Full points if the answer notes that the XANES edge features are similar to NiO (and different from metallic Ni) indicating an oxidized state, but distinguishes it from bulk NiO/metallic Ni by noting the absence of Ni-Ni scattering paths in the EXAFS region (no peaks at ~2.30 Å or 2.96 Å). |
Review
#942
Ce0.90Ni0.05Ru0.05O2
Ru K-edge
▶
LLM Prompt
Sample Information
Material: Ce0.90Ni0.05Ru0.05O2
Support: CeO2
Reaction Conditions: mixture of ~96.5% CH4 and ~3.5% H2O at 200 °C immediately after catalysis at 500 °C
Sample-Specific Conditions
- element edge: Ru K-edge
- Ce0.90Ni0.05Ru0.05O2 catalyst evaluated after steam reforming of methane
Measurement
We plan to measure the Ru K-edge XANES spectrum of this sample.
Questions
Based on all the information above:
1. What is the expected dominant Ru phase and its oxidation state in the Ce0.90Ni0.05Ru0.05O2 catalyst under these reaction conditions?
2. Describe the expected overall spectral shape of the Ru K-edge XANES for this sample compared to standard reference materials.
Ground Truth
Material: Ce0.90Ni0.05Ru0.05O2
Measurement: Ru K-edge in situ/operando XANES in fluorescence mode at SSRL beamline 2-2
Fit method: qualitative comparison
Phase fractions:
| Phase | Fraction |
|---|---|
| singly dispersed Ru cations | 1.0 |
Fit basis (paper's reference spectra):
- Ru metal foil
- RuOx
Source evidence: Page 9, Figure 3a and text
Key reasoning: The edge features of the Ru K-edge of Ce0.90Ni0.05Ru0.05O2 are definitely different from metallic Ru and similar to RuOx, indicating an oxidized state. EXAFS fitting shows Ru bonds with oxygen but lacks Ru-O-Ru or Ru-Ru second shell peaks, confirming Ru species are singly dispersed cations on CeO2 rather than oxide or metallic nanoclusters.
Reasoning source: Page 9-10, Results section (Catalytic activity and microanalysis of catalysts)
Scoring Rubric (total: 100 pts)
| Q | Type | Max | Question | Reference Answer | Scoring Criteria |
|---|---|---|---|---|---|
| q1 | identification | 50 | What is the expected dominant Ru phase and its oxidation state in the Ce0.90Ni0.05Ru0.05O2 catalyst under these reaction conditions? | The expected dominant Ru phase is 100% singly dispersed Ru cations on the CeO2 support, existing in an oxidized (cationic) state. This phase occurs because, despite being exposed to a reducing reaction mixture of ~96.5% CH4 and ~3.5% H2O at 200 °C after steam reforming catalysis at 500 °C, the Ru species in the Ce0.90Ni0.05Ru0.05O2 catalyst resist reduction to metallic clusters. The XANES edge features remain similar to RuOx, indicating a preserved oxidized state, while the lack of Ru-O-Ru or Ru-Ru second-shell peaks confirms the Ru remains atomically dispersed rather than forming oxide nanoclusters. | Full points for identifying singly dispersed Ru cations in an oxidized (cationic) state. Deduct points if metallic Ru or RuOx nanoclusters are proposed as the dominant phase. |
| q2 | spectral | 50 | Describe the expected overall spectral shape of the Ru K-edge XANES for this sample compared to standard reference materials. | The Ru K-edge XANES spectrum for this sample will exhibit an overall shape and edge features that are distinctly different from a metallic Ru foil reference, instead closely resembling a RuOx standard. This spectral shape arises because the Ru in the Ce0.90Ni0.05Ru0.05O2 catalyst remains in an oxidized, cationic state even after exposure to a CH4 and H2O mixture at 200 °C following steam reforming at 500 °C. The complete absence of metallic Ru spectral characteristics reflects the lack of Ru-Ru metallic bonds under these conditions. Although the XANES profile mimics RuOx due to Ru-O bonding, the underlying structural property producing these features is the stabilization of singly dispersed Ru cations on the CeO2 support, which prevents the formation of bulk oxide or metallic nanoclusters. | Full points for stating that the edge features are distinctly different from metallic Ru foil and are similar to those of RuOx. |
Review
Chemical vapour deposition of Fe–N–C oxygen reduction catalysts with full utilization of dense Fe–N4 sites
BNL-NSLS-II-8-ID
Catalyst
Li Jiao et al.
DOI: 10.1038/s41563-021-01030-2
2 scenarios
▶
#943
Zn-N-C
Zn K-edge
▶
LLM Prompt
Sample Information
Material: Zn-N-C
Support: N-doped carbon
Sample-Specific Conditions
- synthesis step: substrate
- ZIF-8 derived Zn-N-C substrate
Measurement
We plan to measure the Zn K-edge XANES spectrum of this sample.
Questions
Based on all the information above:
1. Based on the synthesis method (pyrolysis of ZIF-8 and 1,10-phenanthroline at 1050 °C), what is the dominant Zn coordination environment expected in this sample, and why does it form instead of metallic Zn clusters?
2. To properly analyze the Zn K-edge XAS data and confirm the formation of the expected active sites while ruling out unreacted precursors, what specific reference materials should be measured alongside this sample?
Ground Truth
Material: Zn-N-C
Measurement: Zn K-edge ex situ XAS in transmission mode at APS beamline 10-ID (MRCAT)
Fit method: EXAFS fitting
Phase fractions:
| Phase | Fraction |
|---|---|
| Zn-N4 | 1.0 |
Fit basis (paper's reference spectra):
- Zn(II)Pc
- ZIF-8
Source evidence: Figure 1c; Page 6, Lines 117-119; Page 29, Lines 622-623
Key reasoning: Pyrolysis of ZIF-8 and 1,10-phenanthroline at 1050 °C yields a highly porous N-doped carbon matrix. During this high-temperature process, residual Zn atoms are stabilized as single atoms coordinated by nitrogen. EXAFS analysis confirms that all residual Zn atoms possess a tetrahedral Zn-N4 structure, with no evidence of metallic Zn clusters.
Reasoning source: Page 5, Lines 101-102 and Page 6, Lines 114-119
Scoring Rubric (total: 100 pts)
| Q | Type | Max | Question | Reference Answer | Scoring Criteria |
|---|---|---|---|---|---|
| q1 | reasoning | 57 | Based on the synthesis method (pyrolysis of ZIF-8 and 1,10-phenanthroline at 1050 °C), what is the dominant Zn coordination environment expected in this sample, and why does it form instead of metallic Zn clusters? | The dominant Zn coordination environment expected in this sample is a tetrahedral Zn-N4 structure, which accounts for 100% of the zinc species. This specific environment forms because the pyrolysis of ZIF-8 and 1,10-phenanthroline at 1050 °C creates a highly porous N-doped carbon matrix. During this high-temperature process, the residual Zn atoms are stabilized as single atoms coordinated by nitrogen rather than aggregating into metallic Zn clusters. Consequently, EXAFS analysis confirms that all residual Zn atoms are isolated in this Zn-N4 configuration with no evidence of metallic clustering. | Must identify Zn-N4 (or single-atom Zn coordinated to N) as the sole/dominant phase (100%). Must explain that the ZIF-8 precursor provides a highly microporous N-rich carbon matrix that stabilizes isolated Zn atoms during pyrolysis, preventing the formation of metallic clusters. |
| q2 | identification | 43 | To properly analyze the Zn K-edge XAS data and confirm the formation of the expected active sites while ruling out unreacted precursors, what specific reference materials should be measured alongside this sample? | To properly analyze the Zn K-edge XAS data, Zn(II)Pc and ZIF-8 should be measured as reference materials. These specific references are necessary because the sample is a ZIF-8 derived Zn-N-C substrate synthesized via high-temperature pyrolysis. ZIF-8 serves as the precursor reference to rule out unreacted starting materials, while Zn(II)Pc provides a standard for the expected Zn-N4 coordination environment. Using these references allows for the confirmation that the pyrolysis process successfully stabilized all residual Zn atoms as single atoms in a tetrahedral Zn-N4 structure within the N-doped carbon matrix. | Must identify a well-defined Zn-N4 reference compound (such as Zn(II)Pc or zinc phthalocyanine) and the unpyrolyzed precursor (ZIF-8) as necessary reference spectra. |
Review
#944
Fe-N-C
Fe K-edge
▶
LLM Prompt
Sample Information
Material: Fe-N-C
Support: N-doped carbon
Sample-Specific Conditions
- synthesis step: final catalyst
- Fe-N-C catalyst synthesized via CVD
Measurement
We plan to measure the Fe K-edge XANES spectrum of this sample.
Questions
Based on all the information above:
1. Based on the synthesis method (CVD of FeCl3 over Zn-N-C at 750 °C), what are the expected Fe phases in the final FeNC-CVD-750 catalyst, and what are their approximate fractions?
2. If performing Linear Combination Fitting (LCF) on the XANES spectrum of this sample, what reference spectra would be most appropriate to include based on the expected speciation?
Ground Truth
Material: Fe-N-C
Measurement: Fe K-edge ex situ fluorescence mode at NSLS-II (beamlines ISS 6-BM and 8-ID)
Fit method: Mössbauer spectroscopy and EXAFS fitting
Phase fractions:
| Phase | Fraction |
|---|---|
| O2-Fe(III)-N4 | 0.89 |
| FeCl2·4H2O | 0.11 |
Fit basis (paper's reference spectra):
- O2-Fe(III)Pc
- Fe(II)Pc
- O2-Fe(III)-N4 model
Source evidence: Page 9, Figure 3h and Page 10, lines 194-216
Key reasoning: Mössbauer spectroscopy identified two doublets: D1 (89%) assigned to an O2-Fe(III)-N4-C12 moiety, and D3 (11%) assigned to a high-spin Fe2+ species (FeCl2·4H2O). This quantitatively agrees with XPS results showing ~90% Fe(III) and ~10% Fe(II). The residual FeCl2 is expected as a byproduct of the high-temperature trans-metalation reaction between FeCl3 and Zn-N4 sites.
Reasoning source: Page 10, lines 194-216
Scoring Rubric (total: 100 pts)
| Q | Type | Max | Question | Reference Answer | Scoring Criteria |
|---|---|---|---|---|---|
| q1 | quantification | 54 | Based on the synthesis method (CVD of FeCl3 over Zn-N-C at 750 °C), what are the expected Fe phases in the final FeNC-CVD-750 catalyst, and what are their approximate fractions? | The expected Fe phases in the final Fe-N-C catalyst are an O2-Fe(III)-N4 moiety at a fraction of 0.89 (89%) and a high-spin Fe2+ species (FeCl2·4H2O) at a fraction of 0.11 (11%). These specific fractions arise because the CVD synthesis involves a high-temperature trans-metalation reaction between the FeCl3 precursor and Zn-N4 sites on the N-doped carbon support. This process successfully converts the vast majority of the iron into the active O2-Fe(III)-N4-C12 sites, which is consistent with XPS results showing ~90% Fe(III). The remaining 11% fraction of FeCl2·4H2O is expected as a residual byproduct of this specific trans-metalation reaction. | Full credit for identifying O2-Fe(III)-N4 (or Fe-N4) as the dominant phase (~89-90%) and a minor Fe2+ chloride phase like FeCl2 (~10-11%). Partial credit for identifying only the Fe-N4 phase. |
| q3 | identification | 46 | If performing Linear Combination Fitting (LCF) on the XANES spectrum of this sample, what reference spectra would be most appropriate to include based on the expected speciation? | For fitting the XANES spectrum of this Fe-N-C catalyst, the most appropriate reference spectra to include are an O2-Fe(III)-N4 model, O2-Fe(III)Pc, and Fe(II)Pc. These specific references are necessary because the CVD synthesis method drives a high-temperature trans-metalation reaction between FeCl3 and Zn-N4 sites on the N-doped carbon support. This reaction predominantly forms O2-Fe(III)-N4-C12 moieties alongside a minor high-spin Fe2+ byproduct (FeCl2·4H2O). The chosen references accurately represent the resulting ~90% Fe(III) and ~10% Fe(II) oxidation states generated by these specific synthesis conditions. | Full credit for suggesting an Fe(III)-N4 reference (like O2-Fe(III)Pc) and an Fe(II) reference (like Fe(II)Pc or FeCl2). |
Review
Rational design of high-performance low-loading oxygen reduction catalysts for alkaline fuel cells
BNL-NSLS-II-8-ID
Electrochemistry
Huiqi Li et al.
DOI: 10.1038/s41563-025-02422-4
2 scenarios
▶
#945
PdHx@Pt NS
Pt L3-edge
▶
LLM Prompt
Sample Information
Material: PdHx@Pt NS
Sample-Specific Conditions
- material: PdHx@Pt NS
- As-synthesized core-shell nanosheets
Measurement
We plan to measure the Pt L3-edge XANES spectrum of this sample.
Questions
Based on all the information above:
1. What is the expected oxidation state of Pt in the as-synthesized PdHx@Pt NS, and what reference spectrum would be most appropriate to confirm this?
2. Describe the expected spectral shape of the Pt L3-edge XANES for the as-synthesized PdHx@Pt NS. What is the primary peak, its approximate energy, and the electronic transition it represents?
3. Based on the XANES analysis, why does the Pt shell in the as-synthesized PdHx@Pt NS exhibit a predominantly metallic character?
Ground Truth
Material: PdHx@Pt NS
Measurement: Pt L3-edge XANES, beamline ISS 8-ID of NSLS-II
Fit method: qualitative comparison
Fit basis (paper's reference spectra):
- Pt foil
- Pt/C
Source evidence: Fig. 2f, page 8
Key reasoning: The XANES spectra at the Pt L3-edge demonstrated that the Pt features in PdHx@Pt NS resemble those of Pt foil, indicating a predominantly metallic character.
Reasoning source: Page 8, Results and Discussions
Scoring Rubric (total: 100 pts)
| Q | Type | Max | Question | Reference Answer | Scoring Criteria |
|---|---|---|---|---|---|
| q1 | identification | 30 | What is the expected oxidation state of Pt in the as-synthesized PdHx@Pt NS, and what reference spectrum would be most appropriate to confirm this? | The expected oxidation state of Pt in the as-synthesized PdHx@Pt NS is 0. The most appropriate reference spectrum to confirm this is Pt foil, though Pt/C can also be used as a basis for qualitative comparison. This metallic state is expected because the as-prepared core-shell nanosheets lack significant oxide features following synthesis. Consequently, the Pt features in the PdHx@Pt NS closely resemble those of Pt foil, demonstrating that the Pt shell maintains a predominantly metallic character. | Full points for identifying oxidation state 0 (metallic) and suggesting Pt foil as a reference. |
| q2 | spectral | 40 | Describe the expected spectral shape of the Pt L3-edge XANES for the as-synthesized PdHx@Pt NS. What is the primary peak, its approximate energy, and the electronic transition it represents? | The expected spectral shape of the Pt L3-edge XANES for the as-synthesized PdHx@Pt NS closely resembles that of Pt foil, lacking any significant oxide features. The primary peak is the white line located at approximately 11566 eV, which originates from the electronic transition from 2p to 5d orbitals. These specific spectral features arise because the as-prepared core-shell nanosheets possess a predominantly metallic Pt shell (oxidation state 0). The white line intensity remains similar to Pt foil, confirming that the Pt shell does not undergo significant oxidation during the synthesis of the material. | Full points for stating it resembles Pt foil, identifying the white line at ~11566 eV, and attributing it to the 2p to 5d transition. |
| q3 | reasoning | 30 | Based on the XANES analysis, why does the Pt shell in the as-synthesized PdHx@Pt NS exhibit a predominantly metallic character? | The Pt shell in the as-synthesized PdHx@Pt NS exhibits a predominantly metallic character (oxidation state 0) because its Pt L3-edge XANES spectrum closely matches that of a metallic Pt foil reference. In the as-prepared state, the core-shell nanosheets lack significant oxide features that would indicate a higher oxidation state. Specifically, the white line peak at ~11566 eV, corresponding to the 2p to 5d orbital transition, shows an intensity similar to Pt foil. This qualitative comparison demonstrates that the synthesis conditions of the PdHx@Pt nanosheets yield a stable, unoxidized Pt shell that retains its metallic nature. | Full points for explaining that the Pt features resemble Pt foil, indicating it is in a metallic state as a shell on the PdHx core. |
Review
#946
PdHx@Pt NS
Pd K-edge
▶
LLM Prompt
Sample Information
Material: PdHx@Pt NS
Sample-Specific Conditions
- material: PdHx@Pt NS
- As-synthesized core-shell nanosheets
Measurement
We plan to measure the Pd K-edge XANES spectrum of this sample.
Questions
Based on all the information above:
1. Describe the expected spectral shape of the Pd K-edge XANES for the as-synthesized PdHx@Pt NS. What specific distinguishing feature differentiates it from metallic Pd foil?
2. Based on the distinguishing spectral features at the Pd K-edge, what specific phase or chemical state of palladium is present in the core of the nanosheets, and what is the reasoning?
3. What reference spectra would be appropriate to compare against this sample to confirm its chemical state?
Ground Truth
Material: PdHx@Pt NS
Measurement: Pd K-edge XANES, beamline ISS 8-ID at NSLS-II
Fit method: not reported
Fit basis (paper's reference spectra):
- Pd foil
- PdHx NS
Source evidence: Fig. 2d and page 8
Key reasoning: By comparing the Pd K-edge XANES spectra of PdHx@Pt NS with those of Pd foil, a reduced energy difference between the first and second peaks is observed. This specific spectral change is a signature indicating the formation of Pd hydride in the PdHx@Pt NS core. The incorporation of hydrogen is further supported by EXAFS data showing a larger Pd-Pd/Pt radial distance.
Reasoning source: Page 8, first paragraph
Scoring Rubric (total: 100 pts)
| Q | Type | Max | Question | Reference Answer | Scoring Criteria |
|---|---|---|---|---|---|
| q1 | spectral | 40 | Describe the expected spectral shape of the Pd K-edge XANES for the as-synthesized PdHx@Pt NS. What specific distinguishing feature differentiates it from metallic Pd foil? | The expected Pd K-edge XANES spectrum for the as-synthesized PdHx@Pt NS exhibits a double-peak structure just above the absorption edge. The specific distinguishing feature that differentiates it from metallic Pd foil is a reduced energy difference between the first and second peaks. This spectral feature arises directly from the sample conditions of the as-synthesized core-shell nanosheets, specifically the incorporation of hydrogen into the palladium core to form a Pd hydride (PdHx) phase. The formation of this hydride phase alters the structural and electronic properties of the Pd core, which manifests as this reduced peak separation in the XANES spectrum. | Award 20 points for mentioning the double-peak structure above the edge. Award 20 points for identifying the reduced energy difference between the first and second peaks compared to Pd foil. |
| q2 | reasoning | 40 | Based on the distinguishing spectral features at the Pd K-edge, what specific phase or chemical state of palladium is present in the core of the nanosheets, and what is the reasoning? | Based on the Pd K-edge XANES, the specific phase present in the core of the as-synthesized PdHx@Pt nanosheets is palladium hydride (PdHx). The reasoning stems from the observation of a reduced energy difference between the first and second peaks just above the absorption edge when compared to metallic Pd foil. This specific spectral change is a signature indicating the formation of Pd hydride within the core-shell structure. Given the sample composition of PdHx@Pt NS, the incorporation of hydrogen into the Pd core alters the local structure—further supported by a larger Pd-Pd/Pt radial distance in EXAFS—resulting in this distinct chemical state. | Award 20 points for identifying palladium hydride (PdHx). Award 20 points for explaining that this is indicated by the reduced energy difference between the first and second peaks in the XANES spectrum. |
| q3 | identification | 20 | What reference spectra would be appropriate to compare against this sample to confirm its chemical state? | To confirm the chemical state of the as-synthesized PdHx@Pt NS sample, appropriate reference spectra for comparison are Pd foil and PdHx NS. These references are necessary because the sample consists of a core-shell nanosheet structure where the core is composed of palladium that has incorporated hydrogen. Comparing the sample to metallic Pd foil highlights the structural and electronic deviations caused by hydrogen, specifically the reduced energy difference between the first and second absorption peaks. Meanwhile, the PdHx NS reference directly represents the expected palladium hydride phase in the core, confirming the successful formation of the PdHx compound under these synthesis conditions. | Award 10 points for Pd foil and 10 points for PdHx NS. |
Review
A high-performance hydroxide exchange membrane enabled by Cu2+-crosslinked chitosan
APS
Synthesis
Meiling Wu et al.
DOI: 10.1038/s41565-022-01112-5
1 scenario
▶
#947
Chitosan-Cu
Cu K
▶
LLM Prompt
Sample Information
Material: Chitosan-Cu
Method: solution casting and immersion
Precursors: chitosan, Na2Cu(OH)4
Temperature C: 25
Duration Hours: 96
Atmosphere: air
Post Treatment: rinsed with water and dried in air
Sample-Specific Conditions
- crosslinking agent: Cu2+
- Cu2+-crosslinked chitosan membrane
Preparation
- Chitosan flakes were dissolved in 4 wt% acetic acid aqueous solution at room temperature. The solution was cast and dried in air to obtain a chitosan membrane. The membrane was then immersed in a blue Cu2+-saturated NaOH solution (Na2Cu(OH)4, prepared by immersing Cu wires in 20 wt% NaOH for 1 week) for 4 days until the blue color no longer changed. The membrane was rinsed with excess water and dried in air.
Measurement
We plan to measure the Cu K XANES spectrum of this sample.
Questions
Based on all the information above:
1. Based on the synthesis conditions, what is the expected oxidation state of copper in the final chitosan-Cu membrane, and what reference standard spectrum would be most appropriate to compare it against to confirm its local coordination environment?
2. Describe the expected spectral shape of the Cu K-edge XANES for this sample, specifically detailing the energy positions of the pre-edge, shoulder, and main absorption features.
3. Explain why the Cu K-edge XANES spectrum of the synthesized chitosan-Cu membrane closely resembles that of CuO, based on the chemical interactions occurring between the Cu ions and the polymer matrix.
Ground Truth
Material: Chitosan-Cu membrane
Measurement: Cu K-edge, fluorescence mode, bending-magnet beamline 9-BM-C at Advanced Photon Source
Fit method: qualitative comparison
Phase fractions: (±10%)
| Phase | Fraction |
|---|---|
| Cu2+-crosslinked chitosan | 1.0 |
Fit basis (paper's reference spectra):
- CuO standard
Source evidence: Figure 2e and page 4 text
Key reasoning: The Cu K-edge XANES spectrum shows characteristic absorption peaks of Cu2+, confirming the Cu in chitosan-Cu is in a +2 state. The pre-edge, shoulder, and main absorption features are very similar to the XANES of CuO, indicating a similar local coordination environment where Cu2+ coordinates with O and N atoms from the amino and hydroxyl groups of chitosan.
Reasoning source: Page 4, Material synthesis and characterization section, and Figure 2e caption
Scoring Rubric (total: 100 pts)
| Q | Type | Max | Question | Reference Answer | Scoring Criteria |
|---|---|---|---|---|---|
| q1 | identification | 30 | Based on the synthesis conditions, what is the expected oxidation state of copper in the final chitosan-Cu membrane, and what reference standard spectrum would be most appropriate to compare it against to confirm its local coordination environment? | The expected oxidation state of copper in the final chitosan-Cu membrane is +2, and the most appropriate reference standard for comparison is a CuO standard. This oxidation state is expected because the chitosan membrane was immersed in a Cu2+-saturated NaOH solution (Na2Cu(OH)4) at 25 °C in air for 96 hours, where the Cu2+ ions act as the sole crosslinking agent. Because the precursor exclusively provides Cu2+ ions, the final material consists entirely of Cu2+-crosslinked chitosan (fraction 1.0). The CuO standard is ideal because the resulting local coordination environment, where Cu2+ coordinates with O and N atoms from the chitosan matrix, is structurally very similar to CuO. | Full credit for identifying the +2 oxidation state and stating that a CuO standard is the appropriate reference for comparison. |
| q2 | spectral | 40 | Describe the expected spectral shape of the Cu K-edge XANES for this sample, specifically detailing the energy positions of the pre-edge, shoulder, and main absorption features. | The expected Cu K-edge XANES spectrum exhibits a characteristic low-intensity pre-edge absorption at 8,978.1 eV, a medium-intensity shoulder absorption at 8,985.8 eV, and a high-intensity main absorption peak at ~8,995 eV. The overall spectral shape is highly similar to that of a CuO standard. These specific features arise because the room-temperature immersion of the chitosan membrane in Na2Cu(OH)4 solution produces a fully Cu2+-crosslinked structure. In this state, the Cu2+ ions coordinate directly with the oxygen and nitrogen atoms from the hydroxyl and amino groups of the chitosan, creating a local electronic and structural environment that mirrors CuO and generates these distinct Cu2+ absorption peaks. | Full credit for identifying the pre-edge absorption at 8,978.1 eV, the shoulder absorption at 8,985.8 eV, and the main absorption at ~8,995 eV. |
| q3 | reasoning | 30 | Explain why the Cu K-edge XANES spectrum of the synthesized chitosan-Cu membrane closely resembles that of CuO, based on the chemical interactions occurring between the Cu ions and the polymer matrix. | The Cu K-edge XANES spectrum of the synthesized chitosan-Cu membrane closely resembles that of CuO because the copper in the sample exists entirely in a +2 oxidation state with a highly analogous local coordination environment. During the 96-hour immersion of the chitosan membrane in the Na2Cu(OH)4 solution at 25 °C, the Cu2+ ions act as a crosslinking agent within the polymer matrix. These Cu2+ ions chemically interact by coordinating with the oxygen and nitrogen atoms from the hydroxyl and amino groups of the chitosan. This specific O and N coordination geometry around the Cu2+ centers structurally and electronically mimics the local environment found in CuO, resulting in nearly identical pre-edge, shoulder, and main absorption features. | Full credit for explaining that Cu2+ coordinates with the O and N atoms from the hydroxyl and amino groups of the chitosan chains, resulting in a local coordination environment similar to that of CuO. |
Review
Gas-mediated defect engineering in earth-abundant Mn-rich layered oxides for non-aqueous sodium-based batteries
BNL-NSLS-II-8-ID
Synthesis
Wenhua Zuo et al.
DOI: 10.1038/s41565-025-01998-x
2 scenarios
▶
#948
Ni0.25Mn0.75CO3
Mn K, L3
▶
LLM Prompt
Sample Information
Material: Ni0.25Mn0.75CO3
Method: co-precipitation
Precursors: NiSO4·6H2O, MnSO4·H2O, Na2CO3, NH3·H2O
Temperature C: 52
Duration Hours: 24
Atmosphere: vacuum (during drying)
Sample-Specific Conditions
- Synthesis stage: Precursor
- Transition metal carbonate precursor
Preparation
- Synthesized by a continuous stirred tank reactor-based co-precipitation method. Transition metal solution (Mn/Ni atomic ratio of 3:1) and an alkaline solution containing sodium carbonate and ammonium hydroxide were continuously fed into the reactor while maintaining the pH at ~8.3 and the temperature at 52 °C. The product slurry was collected under steady-state conditions, thoroughly washed with hot deionized water, filtered, and dried under vacuum at 100 °C for 24 h.
Measurement
We plan to measure the Mn K, L3 XANES spectrum of this sample.
Questions
Based on all the information above:
1. Based on the synthesis method (co-precipitation of transition metal sulfates with sodium carbonate), what is the expected oxidation state of Mn in the uncalcined Ni0.25Mn0.75CO3 precursor, and what reference compound would be most suitable to confirm this state via XANES?
2. How would the Mn K-edge position of this uncalcined carbonate precursor compare to that of the final calcined layered oxide product (which is oxidized to a predominantly Mn4+ state)?
Ground Truth
Material: Ni0.25Mn0.75CO3
Measurement: Mn K-edge (transmission, APS 12-BM or NSLS-II 8-ID) and Mn L3-edge (TFY, SSRL 8-2)
Fit method: qualitative comparison
Phase fractions:
| Phase | Fraction |
|---|---|
| Ni0.25Mn0.75CO3 (Mn2+) | 1.0 |
Fit basis (paper's reference spectra):
- MnO (Mn2+)
Source evidence: Fig. 4h (Mn K-edge) and Fig. 4i (Mn L3-edge), page 21
Key reasoning: The precursor is a transition metal carbonate synthesized via co-precipitation. Both Mn K-edge and L3-edge XAS spectra confirm that Mn is in the +2 oxidation state in the precursor, matching the Mn2+ reference (MnO), before undergoing oxidation during the subsequent high-temperature calcination step.
Reasoning source: Page 21, Figure 4 caption (h, i)
Scoring Rubric (total: 100 pts)
| Q | Type | Max | Question | Reference Answer | Scoring Criteria |
|---|---|---|---|---|---|
| q1 | identification | 46 | Based on the synthesis method (co-precipitation of transition metal sulfates with sodium carbonate), what is the expected oxidation state of Mn in the uncalcined Ni0.25Mn0.75CO3 precursor, and what reference compound would be most suitable to confirm this state via XANES? | The expected oxidation state of Mn in the uncalcined Ni0.25Mn0.75CO3 precursor is +2, and the most suitable reference compound to confirm this state via XANES is MnO (Mn2+). This oxidation state is expected because the material is synthesized via a co-precipitation method using MnSO4·H2O and Na2CO3 at 52 °C, which forms a transition metal carbonate precursor. Since the sample is only dried under vacuum at 100 °C and has not yet undergone the subsequent high-temperature calcination step, the manganese retains its initial +2 oxidation state. Consequently, the XANES spectra will reflect a 1.0 fraction of the Mn2+ state, making MnO the ideal reference for qualitative comparison. | Full points for identifying Mn2+ as the oxidation state and suggesting MnO (or a similar Mn2+ standard) as the appropriate reference. |
| q2 | spectral | 54 | How would the Mn K-edge position of this uncalcined carbonate precursor compare to that of the final calcined layered oxide product (which is oxidized to a predominantly Mn4+ state)? | The Mn K-edge position of the uncalcined carbonate precursor will be shifted to a significantly lower energy compared to the final calcined layered oxide product. Additionally, the Mn L3-edge spectrum will exhibit distinct multiplet features characteristic of a Mn2+ state, similar to an MnO reference. These spectral features arise because the precursor is formed via co-precipitation at 52 °C and dried under vacuum, which preserves the manganese entirely in a +2 oxidation state. Because the sample has not yet been subjected to the high-temperature calcination step required to oxidize the material to a predominantly Mn4+ state, the lower effective nuclear charge of the Mn2+ ions directly results in the observed lower energy edge position. | Full points for stating the precursor's Mn K-edge will be at a significantly lower energy compared to the final product due to its lower oxidation state (Mn2+ vs. approaching Mn4+). |
Review
#949
P2-Na0.67Ni0.25Mn0.75O2
Mn K, L3
▶
LLM Prompt
Sample Information
Material: P2-Na0.67Ni0.25Mn0.75O2
Method: solid-state
Precursors: Ni0.25Mn0.75CO3, NaOH
Temperature C: 950
Duration Hours: 20
Atmosphere: O2
Cooling Method: cooled to 300 °C in the laboratory room without using any refrigeration system
Sample-Specific Conditions
- Synthesis stage: Final product
- Final layered oxide positive electrode material calcined at 950 °C
Preparation
- Ni0.25Mn0.75CO3 precursor mixed with stoichiometric amounts (Na:Tm = 0.67:1.0) of NaOH using a high-speed resonant acoustic mixer. The homogeneous powder mixture was transferred into an alumina crucible and calcined in a tube furnace at 950 °C for 20 h under continuous O2 flow.
Measurement
We plan to measure the Mn K, L3 XANES spectrum of this sample.
Questions
Based on all the information above:
1. Based on the synthesis conditions (calcination at 950 °C in O2), what is the expected dominant oxidation state of Mn in the final P2-Na0.67Ni0.25Mn0.75O2 product, and what physical process drives this?
2. What reference compounds would be most appropriate to use as a basis for benchmarking the Mn valence state in this sample?
Ground Truth
Material: P2-Na0.67Ni0.25Mn0.75O2
Measurement: Mn K-edge (transmission, APS 12-BM or NSLS-II 8-ID) and Mn L3-edge (TFY, SSRL 8-2)
Fit method: qualitative comparison
Phase fractions:
| Phase | Fraction |
|---|---|
| P2-Na0.67Ni0.25Mn0.75O2 | 1.0 |
Fit basis (paper's reference spectra):
- MnO2
- MnO
Source evidence: Page 12, Page 21 (Fig. 4h, 4i)
Key reasoning: Mn undergoes significant oxidation during calcination in O2 at 950 °C. The final L-edge spectrum matches predominantly MnO2, indicating an average valence state approaching +4, with minor contributions from Mn3+ states. The K-edge shows a significant edge shift from the precursor (Mn2+) to the final product (approaching Mn4+).
Reasoning source: Page 12, Page 21 (Fig. 4 caption)
Scoring Rubric (total: 100 pts)
| Q | Type | Max | Question | Reference Answer | Scoring Criteria |
|---|---|---|---|---|---|
| q1 | reasoning | 54 | Based on the synthesis conditions (calcination at 950 °C in O2), what is the expected dominant oxidation state of Mn in the final P2-Na0.67Ni0.25Mn0.75O2 product, and what physical process drives this? | The expected dominant oxidation state of Mn in the final P2-Na0.67Ni0.25Mn0.75O2 product is predominantly +4, with minor contributions from +3 states. This high oxidation state is driven by the significant oxidation of the initial Mn2+ precursor (Ni0.25Mn0.75CO3) during the solid-state calcination process. Specifically, heating the precursor and NaOH mixture at a high temperature of 950 °C for 20 hours under a continuous O2 flow provides a strong oxidizing environment that drives the transition from Mn2+ toward Mn4+. Spectroscopically, this physical process results in a significant shift of the Mn K-edge to higher energy and an L3-edge spectrum that predominantly matches the shape of MnO2. | Full points for identifying predominantly Mn4+ (with possible minor Mn3+) and explaining that significant oxidation occurs during the high-temperature calcination in an O2 atmosphere. |
| q2 | identification | 46 | What reference compounds would be most appropriate to use as a basis for benchmarking the Mn valence state in this sample? | The most appropriate reference compounds for benchmarking the Mn valence state in this sample are MnO2 and MnO. These specific references are chosen because the synthesis process drives a massive oxidation from an initial Mn2+ state in the Ni0.25Mn0.75CO3 precursor to a highly oxidized state in the final P2-Na0.67Ni0.25Mn0.75O2 product. The 950 °C calcination under continuous O2 flow for 20 hours causes this significant oxidation, making MnO an ideal reference for the starting Mn2+ state and MnO2 an ideal reference for the target Mn4+ state. Comparing the sample against these bases allows for qualitative confirmation that the final product's K-edge has shifted significantly toward Mn4+ and its L3-edge predominantly matches MnO2. | Full points for suggesting MnO2 (Mn4+) and MnO (Mn2+) or similar standard references to bracket the oxidation states. |
Review
A disordered rock salt anode for fast-charging lithium-ion batteries
APS
Electrochemistry
Haodong Liu et al.
DOI: 10.1038/s41586-020-2637-6
2 scenarios
▶
#950
DRS-Li3V2O5
V K-edge
▶
LLM Prompt
Sample Information
Material: DRS-Li3V2O5
Electrode Type: anode
Electrolyte: 1.2 M LiPF6 in 3:7 v/v EC:EMC with 2 vol. % VC
Cell Type: half-cell
Charge Discharge: OCV
State Of Charge: x=0
Sample-Specific Conditions
- state of charge: pristine
- Pristine disordered rock salt anode material before electrochemical cycling
Measurement
We plan to measure the V K-edge XANES spectrum of this sample.
Questions
Based on all the information above:
1. Based on the sample conditions for pristine DRS-Li3V2O5, what are the expected key spectral features (specifically the pre-edge and main peak energy ranges) in the V K-edge XANES spectrum?
2. What is the expected oxidation state of vanadium in this pristine material, and how does the pre-edge to main peak intensity ratio (P/M) in the XANES spectrum justify this assignment relative to standard reference oxides?
3. If you were to compare the V K-edge XANES spectrum of pristine DRS-Li3V2O5 to a V2O5 standard, what specific difference in the spectral shape would you expect to observe?
Ground Truth
Material: DRS-Li3V2O5
Measurement: ex-situ V K-edge XAS in total fluorescence yield mode at beamline 5.3.1 (ALS)
Fit method: Peak intensity ratio (P/M) comparison
Phase fractions:
| Phase | Fraction |
|---|---|
| Li3V2O5 | 1.0 |
Fit basis (paper's reference spectra):
- V2O5
- VO2
- V2O3
Source evidence: Page 10, Extended Data Fig. 5a
Key reasoning: The oxidation state of V is sensitive to the intensity ratio between the pre-edge and main peaks (P/M). The pre-edge peak of pristine DRS-Li3V2O5 is located between that of VO2 and V2O3 standards, indicating that the material predominantly consists of V4+ and V3+.
Reasoning source: Page 10, first paragraph
Scoring Rubric (total: 100 pts)
| Q | Type | Max | Question | Reference Answer | Scoring Criteria |
|---|---|---|---|---|---|
| q1 | spectral | 30 | Based on the sample conditions for pristine DRS-Li3V2O5, what are the expected key spectral features (specifically the pre-edge and main peak energy ranges) in the V K-edge XANES spectrum? | The V K-edge XANES spectrum for this sample is expected to exhibit a distinct pre-edge peak in the 5465-5470 eV range and a main peak at approximately 5484 eV. Because the sample is a pristine, uncycled DRS-Li3V2O5 anode at a state of charge of x=0 (OCV), its inherent stoichiometry dictates a mixed +3.5 oxidation state. This specific pristine composition results in a pre-edge intensity that is lower than that of V2O5 and VO2, but higher than V2O3. Consequently, the pre-edge to main peak intensity ratio (P/M) falls intermediate between the VO2 (V4+) and V2O3 (V3+) reference standards, reflecting the uncycled material's mixed V3+/V4+ electronic structure. | Award full points if the response identifies the pre-edge peak in the 5465-5470 eV range and the main peak at ~5484 eV. |
| q2 | reasoning | 40 | What is the expected oxidation state of vanadium in this pristine material, and how does the pre-edge to main peak intensity ratio (P/M) in the XANES spectrum justify this assignment relative to standard reference oxides? | The expected oxidation state of vanadium in the pristine DRS-Li3V2O5 material is +3.5, representing a mixture of V3+ and V4+. Because the sample is in its pristine state before any electrochemical cycling (x=0 at OCV), its baseline stoichiometry inherently produces this mixed valence. The oxidation state of vanadium is highly sensitive to the intensity ratio between the pre-edge and main peaks (P/M). In the XANES spectrum, the pre-edge peak of this pristine material is located exactly between that of the VO2 (V4+) and V2O3 (V3+) standards, which directly justifies the assignment and confirms the material predominantly consists of V4+ and V3+. | Award full points if the response states the oxidation state is mixed V3+/V4+ (or +3.5) and explains that the P/M intensity ratio lies between the reference standards VO2 (V4+) and V2O3 (V3+). |
| q3 | prediction | 30 | If you were to compare the V K-edge XANES spectrum of pristine DRS-Li3V2O5 to a V2O5 standard, what specific difference in the spectral shape would you expect to observe? | When comparing the pristine DRS-Li3V2O5 spectrum to a V2O5 standard, you would expect to observe a significantly lower pre-edge peak intensity in the DRS-Li3V2O5 sample. This difference arises because the pristine DRS-Li3V2O5 anode at OCV (x=0) possesses an inherent mixed vanadium oxidation state of +3.5 (V3+ and V4+), whereas the V2O5 standard represents fully oxidized V5+. The pre-edge to main peak intensity ratio (P/M) is highly sensitive to the vanadium oxidation state. Therefore, the lower oxidation state dictated by the uncycled DRS-Li3V2O5 composition inherently produces a pre-edge intensity that is lower than V2O5, instead falling intermediate between VO2 and V2O3. | Award full points if the response correctly predicts that the pristine DRS-Li3V2O5 will have a significantly lower pre-edge to main peak intensity ratio (P/M) compared to the V2O5 standard. |
Review
#951
DRS-Li3+xV2O5
V K-edge
▶
LLM Prompt
Sample Information
Material: DRS-Li3+xV2O5
Electrode Type: anode
Electrolyte: 1.2 M LiPF6 in 3:7 v/v EC:EMC with 2 vol. % VC
Cell Type: half-cell
Charge Discharge: discharged
C Rate: 0.1 A g-1
Voltage V: 0.01
State Of Charge: x=2
Cycle Number: 1
Sample-Specific Conditions
- state of charge: discharged to 0.01 V
- Electrode fully discharged to 0.01 V in the first cycle
Measurement
We plan to measure the V K-edge XANES spectrum of this sample.
Questions
Based on all the information above:
1. What is the expected dominant phase and the average oxidation state of vanadium when the DRS-Li3V2O5 electrode is fully discharged to 0.01 V?
2. Describe the expected changes in the V K-edge XANES spectral features (specifically the pre-edge and main peak) for the electrode discharged to 0.01 V compared to the pristine material.
3. Based on the physical and electrochemical processes occurring during discharge to 0.01 V, explain why the V K-edge XANES spectrum exhibits a shift to lower energy and a reduced pre-edge intensity.
4. What reference standard spectra would be appropriate to compare against this sample to evaluate the vanadium oxidation state, and how would the sample's pre-edge intensity compare to the V3+ standard?
Ground Truth
Material: DRS-Li3+xV2O5
Measurement: ex-situ V K-edge XAS in total fluorescence yield mode at beamline 5.3.1, ALS
Fit method: not reported
Phase fractions:
| Phase | Fraction |
|---|---|
| Li5V2O5 | 1.0 |
Fit basis (paper's reference spectra):
- V2O5
- VO2
- V2O3
Source evidence: Page 10, Extended Data Fig. 5a
Key reasoning: Discharging the DRS-Li3V2O5 electrode to 0.01 V results in the insertion of approximately two additional lithium ions, forming Li5V2O5 (experimentally measured as Li4.86V2O5). This deep lithiation reduces the vanadium oxidation state to an average of +2.5, which is lower than V3+. The structural framework accommodates this via a redistributive lithium intercalation mechanism into tetrahedral sites.
Reasoning source: Page 7, Page 10, Extended Data Fig. 5 caption
Scoring Rubric (total: 100 pts)
| Q | Type | Max | Question | Reference Answer | Scoring Criteria |
|---|---|---|---|---|---|
| q1 | prediction | 25 | What is the expected dominant phase and the average oxidation state of vanadium when the DRS-Li3V2O5 electrode is fully discharged to 0.01 V? | The expected dominant phase is Li5V2O5 (fraction 1.0), and the average oxidation state of vanadium is +2.5. This phase and oxidation state arise because discharging the DRS-Li3V2O5 anode to a deep potential of 0.01 V at 0.1 A g-1 drives the insertion of approximately two additional lithium ions (state of charge x=2). This deep lithiation process forces a redistributive lithium intercalation into tetrahedral sites within the structural framework. Consequently, the insertion of these additional lithium ions reduces the vanadium oxidation state to an average of +2.5, which is lower than V3+. | Full points for identifying the phase as Li5V2O5 (or Li~4.86V2O5) and the average vanadium oxidation state as +2.5 (or lower than +3). |
| q2 | spectral | 25 | Describe the expected changes in the V K-edge XANES spectral features (specifically the pre-edge and main peak) for the electrode discharged to 0.01 V compared to the pristine material. | The V K-edge XANES spectrum will show a reduced pre-edge peak intensity (5465 - 5470 eV) and a main peak shifted approximately 2 eV to a lower energy region (~5482 eV from ~5484 eV) compared to the pristine state. These spectral changes occur because fully discharging the electrode to 0.01 V in the first cycle inserts two additional lithium ions, forming Li5V2O5. This deep lithiation reduces the average vanadium oxidation state to +2.5, which directly causes the main absorption edge to shift to lower energy. Additionally, the structural accommodation of lithium into tetrahedral sites alters the local symmetry, resulting in the significantly reduced pre-edge intensity. | Full points for stating that the pre-edge intensity is reduced and the main peak shifts by approximately 2 eV to a lower energy region. |
| q3 | reasoning | 25 | Based on the physical and electrochemical processes occurring during discharge to 0.01 V, explain why the V K-edge XANES spectrum exhibits a shift to lower energy and a reduced pre-edge intensity. | The shift to lower energy and reduced pre-edge intensity are direct results of the deep lithiation that occurs when the half-cell is discharged to 0.01 V. At this state of charge (x=2), approximately two additional lithium ions are inserted into the DRS-Li3V2O5 framework to form Li5V2O5. This electrochemical reduction lowers the average vanadium oxidation state to +2.5, which shifts the main peak 2 eV lower to ~5482 eV. Furthermore, the structural framework accommodates this deep lithiation via a redistributive lithium intercalation mechanism into tetrahedral sites, which alters the local coordination environment and reduces the pre-edge intensity to a level even lower than that of a V3+ standard. | Full points for explaining that deep lithiation inserts additional Li ions (forming Li5V2O5), which reduces the vanadium oxidation state to an average of +2.5 (lower than V3+), causing the absorption edge to shift to lower energy and the pre-edge intensity to drop. |
| q4 | reasoning | 25 | What reference standard spectra would be appropriate to compare against this sample to evaluate the vanadium oxidation state, and how would the sample's pre-edge intensity compare to the V3+ standard? | Appropriate reference standards for evaluating the vanadium oxidation state of this sample include V2O5, VO2, and V2O3. These standards provide a basis to track the reduction of vanadium from higher oxidation states down to the deeply lithiated state. When compared to the V2O3 (V3+) standard, the sample discharged to 0.01 V will exhibit a lower pre-edge intensity. This occurs because discharging the electrode to 0.01 V (x=2) inserts two additional lithium ions, forming Li5V2O5 and reducing the average vanadium oxidation state to +2.5, which is lower than V3+ and thus produces a correspondingly weaker pre-edge feature. | Full points for mentioning vanadium oxide standards (V2O5, VO2, V2O3) and noting that the sample's pre-edge intensity would be lower than that of the V2O3 (V3+) standard. |
Review
Operando Multi-modal Synchrotron Investigation for Structural and Chemical Evolution of Cupric Sulfide (CuS) Additive in Li-S battery
BNL-NSLS-II-8-ID
Electrochemistry
Ke Sun et al.
DOI: 10.1038/s41598-017-12738-0
2 scenarios
▶
#952
Sulfur-CuS hybrid
Cu K-edge
▶
LLM Prompt
Sample Information
Material: Sulfur-CuS hybrid
Electrode Type: cathode
Electrolyte: 1.0M LiTFSI in DME:DOL (1:1) with 1wt% LiNO3
Cell Type: custom operando cell
Charge Discharge: discharging
C Rate: C/20
State Of Charge: points a-e
Cycle Number: 1
Sample-Specific Conditions
- discharge state: points a-e
- Operando XAS during discharge before the final CuS reduction step
Measurement
We plan to measure the Cu K-edge XANES spectrum of this sample.
Questions
Based on all the information above:
1. Based on the sample conditions (operando discharge before the final CuS reduction step, points a-e), what is the dominant copper-containing phase, and why does its phase fraction remain at 1.0 during this specific period of the discharge?
2. Describe the expected Cu K-edge XANES spectral shape for this sample during points a-e. What specific spectral feature distinguishes it from the fully discharged state?
3. To properly model the full operando XANES dataset (including these initial points and the later discharge points) using linear combination fitting or principal component analysis, what standard reference spectra are required according to the study?
Ground Truth
Material: Sulfur-CuS hybrid
Measurement: Operando Cu K-edge XANES in fluorescence mode at ISS (8-ID) beamline
Fit method: Direct comparison of operando spectra to standards
Phase fractions:
| Phase | Fraction |
|---|---|
| CuS | 1.0 |
Fit basis (paper's reference spectra):
- CuS standard
- Cu2S standard
Source evidence: Page 9, Figure 3A, Figure 3C
Key reasoning: During the initial stages of discharge (points a-e), which correspond to the sulfur reduction plateaus, no spectral changes are observed in the Cu K-edge XANES region. The spectra remain identical to the pristine CuS. This indicates that the lithiation of CuS does not occur during this period and only happens at the very end of the discharge process.
Reasoning source: Page 9, 'Structural and chemical evolution by operando synchrotron x-ray absorption spectroscopy' section
Scoring Rubric (total: 100 pts)
| Q | Type | Max | Question | Reference Answer | Scoring Criteria |
|---|---|---|---|---|---|
| q1 | reasoning | 35 | Based on the sample conditions (operando discharge before the final CuS reduction step, points a-e), what is the dominant copper-containing phase, and why does its phase fraction remain at 1.0 during this specific period of the discharge? | The dominant copper-containing phase during points a-e of the discharge is CuS, maintaining a phase fraction of 1.0. This occurs because these initial stages of the C/20 discharge process correspond exclusively to the sulfur reduction plateaus within the Sulfur-CuS hybrid cathode. Because the electrochemical driving force is entirely consumed by sulfur reduction during this period, the lithiation of CuS does not yet occur. The reduction of the CuS phase is delayed until the very end of the discharge process, which is why the pristine CuS fraction remains completely unchanged at 1.0 during points a-e. | Full points for identifying CuS as the sole phase (fraction 1.0) and explaining that lithiation of CuS does not occur during the initial sulfur reduction plateaus (points a-e), only happening at the very end of discharge. |
| q2 | spectral | 40 | Describe the expected Cu K-edge XANES spectral shape for this sample during points a-e. What specific spectral feature distinguishes it from the fully discharged state? | The expected Cu K-edge XANES spectrum for this sample exhibits a main edge jump around 8980 eV and features a prominent shoulder on the rising edge, designated as 'feature I'. These specific spectral features are observed because the applied discharge conditions during points a-e drive sulfur reduction rather than CuS lithiation, leaving the pristine CuS electronic and structural state intact. The presence of this prominent 'feature I' on the rising edge is the key characteristic that distinguishes it from the fully discharged state. Once the CuS is eventually reduced at the end of discharge, this shoulder becomes less prominent and the edge jump shifts to lower energies (labeled as 'feature II'). | Full points for mentioning the prominent shoulder on the rising edge ('feature I') characteristic of CuS, and noting that this feature distinguishes it from the discharged state where the feature becomes less prominent and the edge shifts to lower energies. |
| q3 | identification | 25 | To properly model the full operando XANES dataset (including these initial points and the later discharge points) using linear combination fitting or principal component analysis, what standard reference spectra are required according to the study? | To properly model the full operando XANES dataset, standard reference spectra for CuS and Cu2S are required. These specific reference phases are necessary because the Sulfur-CuS hybrid cathode undergoes a sequential reaction mechanism during the C/20 discharge process. During the initial discharge points (a-e), the sample remains entirely as unreacted CuS while sulfur reduction occurs, requiring the CuS standard to fit the initial 1.0 phase fraction. As the discharge reaches its final step, the CuS is eventually lithiated and reduced, necessitating the Cu2S standard to accurately capture the structural and electronic evolution of the copper phase. | Full points for identifying CuS and Cu2S standards as the necessary reference spectra for the analysis. |
Review
#953
Sulfur-CuS hybrid
Cu K-edge
▶
LLM Prompt
Sample Information
Material: Sulfur-CuS hybrid
Electrode Type: cathode
Electrolyte: 1.0M LiTFSI in DME:DOL (1:1) with 1wt% LiNO3
Cell Type: custom operando cell
Charge Discharge: discharged
C Rate: C/20
State Of Charge: point f
Cycle Number: 1
Sample-Specific Conditions
- discharge state: point f
- Operando XAS at the end of discharge
Measurement
We plan to measure the Cu K-edge XANES spectrum of this sample.
Questions
Based on all the information above:
1. Based on the operando conditions at the end of discharge (point f) for the Sulfur-CuS hybrid cathode, what is the expected dominant copper sulfide phase, and what physical/chemical reasoning justifies this specific stoichiometry over a physical mixture of phases?
2. Describe the expected changes in the Cu K-edge XANES spectral shape for this fully discharged sample compared to pristine CuS. Specifically, mention the behavior of the edge position and any characteristic pre-edge/shoulder features.
3. To properly model and interpret the phase evolution of this sample during the operando XANES experiment, what standard reference spectra should be included in the basis set?
Ground Truth
Material: Sulfur-CuS hybrid
Measurement: Operando Cu K-edge XANES in fluorescence mode at Inner-Shell Spectroscopy (ISS, 8-ID) beamline
Fit method: Principal component analysis using Gaussian shapes
Phase fractions:
| Phase | Fraction |
|---|---|
| Cu1.3S | 1.0 |
Fit basis (paper's reference spectra):
- CuS standard
- Cu2S standard
Source evidence: Page 9-10, Figure 3A, Figure 3D, Table 1
Key reasoning: During discharge, the Cu-S coordination number reduces from 2.5 to 2.1, and the average bond length elongates. Assuming a direct correlation with stoichiometry, this corresponds to an average composition of approximately Cu1.3S. Principal component analysis of the XANES spectra suggests that the discharged material is a single chemical compound (an amorphous Cu1+xS phase) rather than a physical mixture of CuS and Cu2S.
Reasoning source: Page 10, Results and Discussion (Structural and chemical evolution by operando synchrotron x-ray absorption spectroscopy)
Scoring Rubric (total: 100 pts)
| Q | Type | Max | Question | Reference Answer | Scoring Criteria |
|---|---|---|---|---|---|
| q1 | reasoning | 35 | Based on the operando conditions at the end of discharge (point f) for the Sulfur-CuS hybrid cathode, what is the expected dominant copper sulfide phase, and what physical/chemical reasoning justifies this specific stoichiometry over a physical mixture of phases? | At the end of discharge (point f) for the Sulfur-CuS hybrid cathode, the dominant phase is a single amorphous Cu1.3S compound with a fraction of 1.0. This specific stoichiometry arises because, during the slow C/20 discharge process, the Cu-S coordination number reduces from 2.5 to 2.1 and the average bond length elongates. Assuming a direct correlation between these structural changes and stoichiometry, the material reaches an average composition of approximately Cu1.3S. Principal component analysis of the operando XANES spectra confirms that this discharged state forms a single chemical compound (an amorphous Cu1+xS phase) rather than a physical mixture of CuS and Cu2S. | Full points if the answer identifies Cu1.3S (or a single amorphous Cu1+xS phase) and explains that the reduction in Cu-S coordination number (to ~2.1) correlates with this stoichiometry, and that spectral analysis indicates a single compound rather than a mixture of CuS and Cu2S. |
| q2 | spectral | 40 | Describe the expected changes in the Cu K-edge XANES spectral shape for this fully discharged sample compared to pristine CuS. Specifically, mention the behavior of the edge position and any characteristic pre-edge/shoulder features. | For the fully discharged Sulfur-CuS hybrid cathode at point f, the Cu K-edge XANES spectrum will exhibit an edge jump (feature II) that shifts to lower energies compared to pristine CuS. Additionally, feature I, which is a shoulder characteristic of pristine CuS, becomes significantly less prominent. These spectral changes occur because the electrochemical discharge process reduces the Cu-S coordination number from 2.5 to 2.1 and elongates the Cu-S bonds, forming an amorphous Cu1.3S phase. The depletion of the CuS shoulder and the lower energy shift of the edge jump directly reflect this structural and electronic transition from the initial CuS state to the discharged Cu1+xS stoichiometry. | Full points if the answer notes that the characteristic CuS shoulder (feature I) becomes less prominent/depleted and that the main edge jump (feature II) shifts to lower energies. |
| q3 | identification | 25 | To properly model and interpret the phase evolution of this sample during the operando XANES experiment, what standard reference spectra should be included in the basis set? | To properly model the phase evolution of the Sulfur-CuS hybrid cathode during the operando XANES experiment, the basis set should include CuS and Cu2S standard reference spectra. These specific references are required because the material undergoes a structural and chemical evolution during the C/20 discharge process, transitioning from the initial CuS state toward a more copper-rich sulfide stoichiometry. By using these standards in a principal component analysis, it can be determined that the end-of-discharge state (point f) is not a physical mixture of CuS and Cu2S, but rather a single amorphous Cu1.3S phase. This intermediate phase forms due to the reduction of the Cu-S coordination number from 2.5 to 2.1 and the elongation of the average bond length during the discharge cycle. | Full points if the answer identifies CuS and Cu2S standards as the necessary reference spectra for the basis set. |
Review
Dispersion and stability mechanism of Pt nanoparticles on transition-metal oxides
APS
Catalyst
Eun-Suk Jeong, In-Hui Hwang, Sang-Wook Han
DOI: 10.1038/s41598-022-17638-6
3 scenarios
▶
#954
Pt/Ti-FS
Pt L3-edge
▶
LLM Prompt
Sample Information
Material: Pt/Ti-FS
Support: Ti-FS
Reaction Conditions: H2 environment, RT
Sample-Specific Conditions
- temperature: RT
- Pt nanoparticles on titania-incorporated fumed silica at room temperature
Measurement
We plan to measure the Pt L3-edge XANES spectrum of this sample.
Questions
Based on all the information above:
1. Describe the expected spectral shape of the Pt L3-edge XANES for the Pt/Ti-FS sample at room temperature, specifically focusing on the white line and edge position compared to a metallic Pt reference.
2. What is the physical/electronic origin of the strong white line intensity observed in this sample at room temperature?
3. Based on the reaction conditions (RT, before heating in H2), what is the dominant chemical state/phase of the Pt species on the support?
Ground Truth
Material: Pt/Ti-FS
Measurement: Pt L3-edge in-situ XANES in transmission mode at 9BM (APS) and 8C (PLS II)
Fit method: Qualitative comparison of white line intensity and edge position
Phase fractions: (±10%)
| Phase | Fraction |
|---|---|
| PtOx | 1.0 |
Fit basis (paper's reference spectra):
- Pt foil
Source evidence: Page 2, Figure 3a, Results section (Temperature-dependent XANES spectra)
Key reasoning: At room temperature, before any high-temperature reduction occurs, the Pt L3-edge XANES spectrum of Pt/Ti-FS exhibits a strong white line intensity and a slight shift toward higher energy compared to a Pt foil reference. This indicates that the Pt atoms are highly oxidized. The white line features strongly suggest that the Pt atoms on the Ti-FS supports at RT are oxidized to PtOx.
Reasoning source: Page 2, Results: Temperature-dependent XANES spectra
Scoring Rubric (total: 101 pts)
| Q | Type | Max | Question | Reference Answer | Scoring Criteria |
|---|---|---|---|---|---|
| q1 | spectral | 38 | Describe the expected spectral shape of the Pt L3-edge XANES for the Pt/Ti-FS sample at room temperature, specifically focusing on the white line and edge position compared to a metallic Pt reference. | The expected spectral shape of the Pt L3-edge XANES features a strong white line intensity at the absorption edge and an edge position that is slightly shifted toward higher energy compared to a metallic Pt foil reference. These spectral features arise directly from the sample conditions, specifically because the Pt nanoparticles on the Ti-FS support are at room temperature and have not yet undergone high-temperature reduction in the H2 environment. As a result, the platinum remains highly oxidized (PtOx), causing electrons to transfer from the Pt 5d orbitals to oxygen atoms. This increases the empty state density of the Pt 5d orbitals, which manifests as the strong white line and higher energy edge shift. | Full credit if the answer mentions a strong white line intensity (higher than Pt foil) and a slight shift of the absorption edge toward higher energy. |
| q2 | reasoning | 38 | What is the physical/electronic origin of the strong white line intensity observed in this sample at room temperature? | The physical and electronic origin of the strong white line intensity is an increase in the empty state density of the Pt 5d orbitals. This occurs because, at room temperature and prior to any high-temperature reduction in the H2 environment, the Pt nanoparticles on the titania-incorporated fumed silica (Ti-FS) support exist in a highly oxidized state (PtOx). Due to this oxidized state, electrons from the Pt 5d orbitals transfer to the surrounding oxygen atoms. This electron depletion in the 5d orbitals directly produces the strong white line absorption feature observed in the XANES spectrum. | Full credit if the answer explains that the empty state density of the Pt 5d orbitals increases because electrons in the Pt 5d orbitals transfer to the bonding oxygen atoms. |
| q4 | identification | 25 | Based on the reaction conditions (RT, before heating in H2), what is the dominant chemical state/phase of the Pt species on the support? | Based on the reaction conditions, the dominant chemical state of the Pt species is highly oxidized platinum, specifically identified as PtOx with a fraction of 1.0. This phase is expected because the sample is maintained at room temperature (RT), meaning the H2 environment has not yet provided the thermal energy required to initiate the reduction of the Pt nanoparticles on the Ti-FS support. Consequently, the initial oxidized state of the catalyst is fully preserved. This is confirmed by the XANES spectrum, which exhibits a strong white line intensity and a shift to higher energy compared to a Pt foil reference, characteristic of oxidized Pt atoms. | Full credit if the answer identifies the dominant phase as highly oxidized Pt or PtOx. |
Review
#955
Pt/Ti-FS
Pt L3-edge
▶
LLM Prompt
Sample Information
Material: Pt/Ti-FS
Support: Ti-FS
Reaction Conditions: H2 environment, 250 °C
Sample-Specific Conditions
- temperature: 250 °C
- Pt nanoparticles on titania-incorporated fumed silica heated to 250 °C
Measurement
We plan to measure the Pt L3-edge XANES spectrum of this sample.
Questions
Based on all the information above:
1. Based on the reaction conditions (H2 environment, 250 °C), what is the dominant phase of the Pt nanoparticles, and what physical process explains this state?
2. Describe the expected changes in the white line intensity and edge position for this sample at 250 °C compared to its initial room temperature state. What electronic state density change is responsible for this white line behavior?
3. What specific XANES feature distinguishes this sample at 250 °C from the same material measured at room temperature before heating?
Ground Truth
Material: Pt/Ti-FS
Measurement: Pt L3-edge in-situ XANES in transmission mode
Fit method: EXAFS theoretical calculations / structural modeling (used for phase identification alongside XANES)
Phase fractions: (±10%)
| Phase | Fraction |
|---|---|
| metallic_platinum | 1.0 |
Fit basis (paper's reference spectra):
- Pt foil
- PtOx
Source evidence: Figure 3a, Figure 4a, Table 1, Page 3 and 5
Key reasoning: During heating in an H2 environment up to 250 °C, the Pt atoms are rapidly reduced. The white line intensity decreases dramatically and the absorption edge shifts to a lower energy, matching that of a Pt foil. EXAFS data confirms the virtual disappearance of the Pt-O peak at 250 °C, indicating most oxygen atoms have dissociated and the Pt is fully reduced to metallic nanoparticles.
Reasoning source: Results section, Temperature-dependent XANES spectra (Page 3) and Temperature-dependent local structural properties (Page 5)
Scoring Rubric (total: 100 pts)
| Q | Type | Max | Question | Reference Answer | Scoring Criteria |
|---|---|---|---|---|---|
| q1 | reasoning | 31 | Based on the reaction conditions (H2 environment, 250 °C), what is the dominant phase of the Pt nanoparticles, and what physical process explains this state? | The dominant phase of the Pt nanoparticles is fully reduced metallic platinum, representing a fraction of 1.0. This state arises because heating the Pt/Ti-FS sample to 250 °C in an H2 environment causes the rapid reduction of the Pt atoms. During this process, the oxygen atoms dissociate, leading to the virtual disappearance of Pt-O bonds. Consequently, the platinum is completely reduced to metallic nanoparticles with an oxidation state of 0. | Full points for identifying metallic Pt (or fully reduced Pt nanoparticles) and explaining that the H2 environment at 250 °C causes rapid reduction and dissociation of oxygen atoms. |
| q2 | spectral | 38 | Describe the expected changes in the white line intensity and edge position for this sample at 250 °C compared to its initial room temperature state. What electronic state density change is responsible for this white line behavior? | At 250 °C, the XANES spectrum will exhibit a dramatically decreased white line intensity and an absorption edge shifted to a lower energy compared to the initial room temperature state. These spectral features closely resemble those of a reference Pt foil. This behavior occurs because heating the sample in an H2 environment to 250 °C fully reduces the Pt atoms, dissociating the oxygen atoms and eliminating Pt-O bonds. The decrease in the white line intensity specifically reflects a reduction in the empty state density of the Pt 5d orbitals as the platinum transitions to a metallic state. | Full points for stating the white line intensity decreases dramatically, the edge shifts to lower energy (resembling Pt foil), and attributing the white line change to a decrease in the empty state density of the Pt 5d orbitals (due to reduction). |
| q4 | spectral | 31 | What specific XANES feature distinguishes this sample at 250 °C from the same material measured at room temperature before heating? | The distinguishing XANES feature of this sample at 250 °C is the lack of a strong white line compared to the oxidized Pt/Ti-FS measured at room temperature. Additionally, the absorption edge shifts to a lower energy, nearly matching that of a Pt foil. These spectral changes occur because the H2 environment and 250 °C temperature drive a rapid reduction process that dissociates oxygen atoms from the platinum. As a result, the Pt-O bonds are eliminated, and the sample is completely reduced to metallic Pt nanoparticles, which alters the empty state density of the Pt 5d orbitals. | Full points for noting the lack of a strong white line (or significantly decreased white line) at 250 °C, which distinguishes it from the highly oxidized state at room temperature. |
Review
#956
Ti-FS
Ti K-edge
▶
LLM Prompt
Sample Information
Material: Ti-FS
Support: fumed silica
Reaction Conditions: H2 environment, RT
Sample-Specific Conditions
- material: Ti-FS
- Titania-incorporated fumed silica at room temperature
Measurement
We plan to measure the Ti K-edge XANES spectrum of this sample.
Questions
Based on all the information above:
1. Based on the Ti K-edge XANES spectrum, what is the expected oxidation state and main edge energy for the Ti atoms in the Ti-FS sample at room temperature, and what reference compound does this closely resemble?
2. If one were to analyze the XANES spectrum of this sample, what primary reference spectrum would be necessary for comparison, and why might the sample's spectrum not perfectly match this reference?
Ground Truth
Material: Ti-FS (Titania-incorporated fumed silica)
Measurement: Ti K-edge, transmission mode, 9BM beamline of APS and 8C beamline of PLS II
Fit method: Not reported (EXAFS fitting used instead of XANES LCF)
Phase fractions: (±10%)
| Phase | Fraction |
|---|---|
| anatase TiO2 (distorted TiOx complexes) | 1.0 |
Fit basis (paper's reference spectra):
- anatase TiO2
Source evidence: Page 4, Figure 3c (Spectrum A), text under 'Temperature-dependent XANES spectra'
Key reasoning: The main edge energy of the Ti-FS specimen is approximately 4982 eV, which is similar to that of anatase TiO2, implying that most Ti atoms have a 4+ chemical valence state. However, differences in the pre-edge peaks and main edges compared to crystalline anatase indicate slight variations in structural properties, forming unstable-distorted TiOx complexes rather than a stable crystalline structure.
Reasoning source: Page 4, Results section (Temperature-dependent XANES spectra)
Scoring Rubric (total: 100 pts)
| Q | Type | Max | Question | Reference Answer | Scoring Criteria |
|---|---|---|---|---|---|
| q1 | identification | 50 | Based on the Ti K-edge XANES spectrum, what is the expected oxidation state and main edge energy for the Ti atoms in the Ti-FS sample at room temperature, and what reference compound does this closely resemble? | The expected oxidation state for the Ti atoms in the Ti-FS sample at room temperature is 4+, with a main edge energy of approximately 4982 eV. This closely resembles the reference compound anatase TiO2. These properties arise because the titania incorporated into the fumed silica support at room temperature forms TiOx complexes that maintain the 4+ chemical valence state typical of titania. However, the specific room temperature conditions and the interaction with the fumed silica support cause slight structural variations, resulting in unstable-distorted TiOx complexes rather than a fully stable crystalline anatase structure. | Full credit for identifying the 4+ oxidation state, an edge position of ~4982 eV, and anatase TiO2 as the reference compound. |
| q3 | prediction | 50 | If one were to analyze the XANES spectrum of this sample, what primary reference spectrum would be necessary for comparison, and why might the sample's spectrum not perfectly match this reference? | To analyze the XANES spectrum of this sample, anatase TiO2 would be the primary reference spectrum necessary for comparison. The sample's spectrum will not perfectly match this reference because the titania incorporated into the fumed silica support at room temperature does not form a stable crystalline structure. Instead, the interaction with the fumed silica support under these room temperature conditions results in unstable, distorted TiOx complexes. Consequently, the spectrum will exhibit slight variations in the pre-edge peaks and main edge features compared to fully crystalline anatase TiO2. | Full credit for identifying anatase TiO2 as the necessary reference spectrum and noting that the match will be imperfect because the Ti-FS sample consists of distorted, unstable TiOx complexes rather than a fully crystalline anatase phase. |
Review
Imaging and speciation of intracellular metallic implant debris using synchrotron-based X-ray fluorescence micro-spectroscopy: a study of two cases
APS
Environmental
Songyun Liu et al.
DOI: 10.1038/s41598-025-94231-7
5 scenarios
▶
#957
periprosthetic tissue
Cr K-edge
▶
LLM Prompt
Sample Information
Material: periprosthetic tissue
Sample Origin: retrieved THA (Case 1)
Sample-Specific Conditions
- Cr/Co ratio: highest
- Particle with highest Cr/Co ratio in macrophage
Measurement
We plan to measure the Cr K-edge XANES spectrum of this sample.
Questions
Based on all the information above:
1. Given that this intracellular particle exhibits the highest Cr/Co ratio among the observed debris, what is the expected dominant chromium phase, and what biological/chemical mechanism explains its formation in the macrophage?
2. What reference spectra should be included in the basis set to properly identify the phase and oxidation state of chromium in this periprosthetic tissue sample?
3. What is the expected oxidation state of the chromium in this high Cr/Co ratio particle, and what key spectral feature would be notably absent compared to highly oxidized, toxic chromium species?
Ground Truth
Material: periprosthetic tissue
Measurement: Cr K-edge XANES in fluorescence mode at beamlines 2-ID-D and 9-ID-B (Bionanoprobe)
Fit method: Comparison to reference standards
Phase fractions:
| Phase | Fraction |
|---|---|
| CrPO4 | 1.0 |
Fit basis (paper's reference spectra):
- CoCrMo alloy
- CrPO4
- Cr2O3
- Cr(VI)
Source evidence: Page 5, Results section; Page 8, Discussion
Key reasoning: Particles with the highest Cr/Co ratio were found to be mostly chromium-phosphate (CrPO4). This phase is considered a by-product of the phagocytosis process of cobalt-containing debris. During oxidation of small CoCrMo particles, cobalt ions are released, bind to proteins, and diffuse away, leaving behind chromium which forms phosphates within the intracellular environment.
Reasoning source: Page 5 (Results) and Page 8 (Discussion)
Scoring Rubric (total: 100 pts)
| Q | Type | Max | Question | Reference Answer | Scoring Criteria |
|---|---|---|---|---|---|
| q1 | reasoning | 40 | Given that this intracellular particle exhibits the highest Cr/Co ratio among the observed debris, what is the expected dominant chromium phase, and what biological/chemical mechanism explains its formation in the macrophage? | The expected dominant chromium phase is chromium-phosphate (CrPO4), which accounts for a fraction of 1.0 in this sample. This specific phase arises because the particle is located within a macrophage and exhibits the highest Cr/Co ratio among the debris. During the biological process of phagocytosis, small CoCrMo alloy particles undergo oxidation, causing cobalt ions to be released, bind to proteins, and diffuse away. This mechanism leaves behind chromium, which subsequently reacts to form solid phosphates within the intracellular environment. | Full credit requires identifying CrPO4 (chromium phosphate) as the dominant phase and explaining that it forms as a by-product of phagocytosis, where cobalt ions are released/diffuse away from the original alloy debris, leaving chromium to form phosphates. |
| q2 | identification | 30 | What reference spectra should be included in the basis set to properly identify the phase and oxidation state of chromium in this periprosthetic tissue sample? | The basis set for fitting the XANES spectrum should include reference standards for CoCrMo alloy, CrPO4, Cr2O3, and Cr(VI). These specific references are required because the sample consists of periprosthetic tissue containing debris from a retrieved THA implant that is undergoing biological degradation. Given that the targeted macrophage particle has a high Cr/Co ratio due to phagocytosis, it is necessary to distinguish the original CoCrMo alloy from expected degradation products like Cr2O3 and the dominant intracellular phase, CrPO4. Additionally, the Cr(VI) reference must be included to explicitly test for and rule out the formation of highly oxidized, toxic chromium species in the tissue. | Full credit requires listing the key reference standards used for comparison: CoCrMo alloy, CrPO4, Cr2O3, and Cr(VI). |
| q3 | spectral | 30 | What is the expected oxidation state of the chromium in this high Cr/Co ratio particle, and what key spectral feature would be notably absent compared to highly oxidized, toxic chromium species? | The expected oxidation state of the chromium in this particle is Cr(III), which produces a CrPO4-like spectral profile. This Cr(III) state is expected because the particle, characterized by its high Cr/Co ratio inside a macrophage, forms as a by-product of phagocytosis where degrading CoCrMo debris leaves behind chromium to form intracellular phosphates. Because the chromium stabilizes as Cr(III) in the form of CrPO4, the spectrum will completely lack the distinct pre-edge peak feature. The absence of this pre-edge signature confirms that the material has not oxidized into toxic Cr(VI) species within the biological environment. | Full credit requires identifying the oxidation state as Cr(III) and noting the absence of a distinct pre-edge peak (or Cr(VI) signature) that would indicate hexavalent chromium. |
Review
#958
periprosthetic tissue
Cr K-edge
▶
LLM Prompt
Sample Information
Material: periprosthetic tissue
Sample Origin: retrieved THA (Case 1)
Sample-Specific Conditions
- Cr/Co ratio: intermediate
- Particle with intermediate Cr/Co ratio in macrophage
Measurement
We plan to measure the Cr K-edge XANES spectrum of this sample.
Questions
Based on all the information above:
1. Based on the sample conditions (an intracellular particle with an intermediate Cr/Co ratio from a MoM THA), what is the dominant chromium phase expected, and what is the physical/biological reasoning for its presence in this specific chemical state?
2. To properly evaluate the speciation of this intermediate Cr/Co ratio particle using XANES, what specific reference spectra should be included in the analysis basis set to distinguish it from other common implant debris products?
3. What oxidation state of chromium is expected for this particle, and what highly toxic oxidation state must be explicitly ruled out based on the XANES spectral features?
Ground Truth
Material: periprosthetic tissue (macrophage)
Measurement: Cr K-edge XANES, fluorescence mode, APS beamlines 2-ID-D and 9-ID-B (Bionanoprobe)
Fit method: Comparison to reference standards
Phase fractions:
| Phase | Fraction |
|---|---|
| Cr2O3 | 1.0 |
Fit basis (paper's reference spectra):
- CoCrMo alloy
- Cr2O3
- CrPO4
Source evidence: Page 5 (text), Page 6 (text), Figures 5-7
Key reasoning: Particles with an intermediate Cr/Co ratio were identified as Cr2O3. These particles are likely generated directly at the tribological interface of the implant under mild sliding wear conditions, where the alloy is partially oxidized. They are then ingested by macrophages in this state without undergoing further chemical alteration during the phagocytosis process. This contrasts with CrPO4, which is proposed to be a secondary by-product formed during the intracellular phagocytosis of cobalt-containing debris.
Reasoning source: Page 5, Page 6, Page 8
Scoring Rubric (total: 100 pts)
| Q | Type | Max | Question | Reference Answer | Scoring Criteria |
|---|---|---|---|---|---|
| q1 | reasoning | 40 | Based on the sample conditions (an intracellular particle with an intermediate Cr/Co ratio from a MoM THA), what is the dominant chromium phase expected, and what is the physical/biological reasoning for its presence in this specific chemical state? | The dominant chromium phase expected for this intracellular particle with an intermediate Cr/Co ratio is Cr2O3, which accounts for a 1.0 (100%) fraction of the speciation. This specific phase arises because these particles are generated directly at the tribological interface of the retrieved THA implant under mild sliding wear conditions, resulting in partial oxidation of the base alloy. Once generated, these Cr2O3 particles are ingested by macrophages in the periprosthetic tissue. Unlike other by-products, they do not undergo further chemical alteration during the intracellular phagocytosis process, thereby preserving their original Cr2O3 state. | Full credit for identifying Cr2O3 as the dominant phase and explaining that it is generated at the tribological interface via partial oxidation during wear, and is subsequently ingested by macrophages without further chemical alteration. |
| q2 | identification | 27 | To properly evaluate the speciation of this intermediate Cr/Co ratio particle using XANES, what specific reference spectra should be included in the analysis basis set to distinguish it from other common implant debris products? | To properly evaluate the speciation of this sample, the XANES analysis basis set must include reference spectra for CoCrMo alloy, Cr2O3, and CrPO4. These specific references are required because the sample is a wear particle from a retrieved THA implant found within a macrophage, necessitating the differentiation between the original implant material, primary wear products, and secondary biological by-products. The intermediate Cr/Co ratio particle is expected to be Cr2O3, which forms via partial oxidation at the tribological interface under mild sliding wear. Including CrPO4 and CoCrMo alloy in the fit basis is essential to prove the particle did not undergo further chemical alteration into a secondary by-product during phagocytosis and is distinct from the unoxidized base metal. | Full credit for listing CoCrMo alloy, Cr2O3, and CrPO4 as the necessary reference standards. |
| q3 | spectral | 33 | What oxidation state of chromium is expected for this particle, and what highly toxic oxidation state must be explicitly ruled out based on the XANES spectral features? | The expected oxidation state for this intermediate Cr/Co ratio particle is Cr(III), with the XANES spectral shape closely matching the Cr2O3 reference standard at an edge position of ~6.00-6.01 keV. Based on the spectral features, the highly toxic Cr(VI) oxidation state must be explicitly ruled out, as its distinct spectral signature was searched for but completely absent from the profile. This stable Cr(III) state is observed because the particle is generated via partial oxidation of the alloy at the implant's tribological interface under mild sliding wear conditions. After being ingested by the macrophage in the periprosthetic tissue, the particle undergoes no further chemical alteration, maintaining its Cr(III) valency rather than oxidizing to the toxic Cr(VI) state or forming secondary by-products like CrPO4. | Full credit for stating the expected oxidation state is Cr(III) and noting that the spectrum lacks features indicative of Cr(VI). |
Review
#959
periprosthetic tissue
Cr K-edge
▶
LLM Prompt
Sample Information
Material: periprosthetic tissue
Sample Origin: retrieved THA (Case 1)
Sample-Specific Conditions
- Cr/Co ratio: lowest
- Particle with lowest Cr/Co ratio in macrophage
Measurement
We plan to measure the Cr K-edge XANES spectrum of this sample.
Questions
Based on all the information above:
1. Based on the sample conditions (intracellular debris with the lowest Cr/Co ratio), what is the dominant phase of this particle, and how does its size generally compare to other Cr-containing particles in the tissue?
2. How does the Cr K-edge XANES spectral shape of this low Cr/Co ratio particle distinguish it from other common wear products like chromium oxides, phosphates, or Cr(VI)?
3. What reference spectra should be included in the basis set to properly evaluate the speciation of Cr in these intracellular particles?
Ground Truth
Material: periprosthetic tissue
Measurement: Cr K-edge XANES at 2-ID-D and 9-ID-B (Bionanoprobe) beamlines
Fit method: qualitative comparison to reference standards using Athena software
Phase fractions:
| Phase | Fraction |
|---|---|
| CoCrMo alloy | 1.0 |
Fit basis (paper's reference spectra):
- CoCrMo alloy
- Cr2O3
- CrPO4
- Cr(VI)
Source evidence: Page 5 (text), Figure 5B, Figure 6B
Key reasoning: Particles with the lowest Cr/Co ratio were most consistent with CoCrMo alloy controls. These particles were larger compared to the other Cr-containing particles. This aligns with previous studies reporting that under normal wearing conditions, mainly Cr2O3 particles and some larger Co-containing particles are generated. The designation is based on Cr-specific XANES spectra compared to alloy control, although some chromium oxide or phosphate could be present.
Reasoning source: Results (Page 5) and Discussion (Page 6)
Scoring Rubric (total: 101 pts)
| Q | Type | Max | Question | Reference Answer | Scoring Criteria |
|---|---|---|---|---|---|
| q1 | identification | 38 | Based on the sample conditions (intracellular debris with the lowest Cr/Co ratio), what is the dominant phase of this particle, and how does its size generally compare to other Cr-containing particles in the tissue? | The dominant phase of this particle is CoCrMo alloy, which accounts for a fraction of 1.0. These particles are generally larger compared to other Cr-containing particles found in the periprosthetic tissue. This specific phase and size distribution arise because, under normal wearing conditions of retrieved THA implants, mechanical wear generates some larger Co-containing metallic particles alongside mainly Cr2O3 particles. Consequently, the intracellular macrophage debris exhibiting the lowest Cr/Co ratio is most consistent with the unoxidized CoCrMo alloy control, reflecting its origin as a primary metallic wear particle. | Full credit for identifying CoCrMo alloy as the dominant phase and stating that these particles are larger compared to other Cr-containing particles. |
| q2 | spectral | 38 | How does the Cr K-edge XANES spectral shape of this low Cr/Co ratio particle distinguish it from other common wear products like chromium oxides, phosphates, or Cr(VI)? | The Cr K-edge XANES spectrum of this particle exhibits a metallic profile that matches the CoCrMo alloy reference. It is distinguished by lacking the distinct white line features characteristic of oxidized Cr(III) species like Cr2O3 and CrPO4, and it also lacks the pre-edge peak characteristic of Cr(VI). These spectral features occur because the particle with the lowest Cr/Co ratio in the macrophage consists of unoxidized CoCrMo alloy generated under normal wearing conditions. Since the chromium remains in a metallic alloy status rather than an oxidized state, the spectrum naturally lacks the strong electronic transitions associated with oxidized chromium compounds. | Full credit for noting it matches the metallic alloy profile and explicitly mentioning the lack of distinct white line features (seen in Cr2O3/CrPO4) and the lack of a pre-edge peak (seen in Cr(VI)). |
| q3 | methodology | 25 | What reference spectra should be included in the basis set to properly evaluate the speciation of Cr in these intracellular particles? | The basis set for evaluating the speciation of Cr in these particles should include CoCrMo alloy, Cr2O3, CrPO4, and Cr(VI). These specific references are required because the periprosthetic tissue from retrieved THA contains a mixture of primary wear debris and subsequent corrosion products. While the larger particles with the lowest Cr/Co ratio are predominantly metallic CoCrMo alloy generated from normal wear, other Cr-containing particles in the tissue can be oxidized. Therefore, standards for the metallic alloy, Cr(III) oxides and phosphates, and highly oxidized Cr(VI) are necessary to qualitatively compare and fully capture the range of potential chromium speciation in the macrophage debris. | Full credit for listing CoCrMo alloy, Cr2O3, CrPO4, and Cr(VI). |
Review
#960
periprosthetic tissue
Ti K-edge
▶
LLM Prompt
Sample Information
Material: periprosthetic tissue
Sample Origin: retrieved THA (Case 1)
Sample-Specific Conditions
- particle type: Ti-rich
- Typical Ti-rich particle in macrophage
Measurement
We plan to measure the Ti K-edge XANES spectrum of this sample.
Questions
Based on all the information above:
1. Based on the sample conditions (intracellular Ti-rich debris from a retrieved THA), what is the dominant chemical phase of the titanium debris, and what reasoning explains this state compared to the original implant material?
2. Describe the expected Ti K-edge XANES spectral shape for these typical intracellular Ti-rich particles.
3. What candidate reference spectra should be included in the basis set to properly evaluate the speciation of this Ti-rich debris?
Ground Truth
Material: periprosthetic tissue
Measurement: Ti K-edge XANES at Bionanoprobe (BNP) Beamline 9-ID-B
Fit method: Qualitative comparison to reference standards
Phase fractions:
| Phase | Fraction |
|---|---|
| TiO2 (rutile/anatase) | 1.0 |
Fit basis (paper's reference spectra):
- Ti6Al4V alloy
- TiO2 (rutile)
- TiO2 (anatase)
- TiO2 (brookite)
Source evidence: Figures 5B, 6B, 7B and text on pages 5, 9, 10
Key reasoning: The majority of Ti-rich particles no longer had the elemental composition of the native Ti6Al4V alloy, as confirmed by vanadium reference levels. The particles appeared to be mainly Ti-oxide, specifically a mostly crystalline, mixed type of TiO2 (rutile-anatase phase). It remains unclear whether this oxidized state results from tribochemical processes at the implant surface or from intracellular chemical interactions after phagocytosis.
Reasoning source: Results (page 5) and Discussion (pages 9-10)
Scoring Rubric (total: 101 pts)
| Q | Type | Max | Question | Reference Answer | Scoring Criteria |
|---|---|---|---|---|---|
| q1 | identification | 38 | Based on the sample conditions (intracellular Ti-rich debris from a retrieved THA), what is the dominant chemical phase of the titanium debris, and what reasoning explains this state compared to the original implant material? | The dominant chemical phase of the typical Ti-rich particle found in the macrophage of the periprosthetic tissue is a mostly crystalline, mixed type of TiO2 (rutile-anatase phase), which accounts for a fraction of 1.0. This oxidized state is expected because the debris no longer retains the elemental composition of the native Ti6Al4V alloy, as confirmed by the loss of vanadium reference levels. The transformation from the original metallic implant material to this TiO2 phase occurs either due to tribochemical processes at the implant surface during wear or through intracellular chemical interactions after phagocytosis by the macrophage. | Full points if the answer identifies TiO2 (specifically a mixed rutile/anatase phase) as the dominant phase and explains that the particles no longer have the elemental composition of the native Ti6Al4V alloy (using vanadium as a reference), though it is unclear if the oxidation occurred tribochemically at the surface or intracellularly. |
| q2 | spectral | 38 | Describe the expected Ti K-edge XANES spectral shape for these typical intracellular Ti-rich particles. | The expected Ti K-edge XANES spectrum for these intracellular Ti-rich particles exhibits an overall spectral shape that closely resembles TiO2 in the rutile phase or a mixed rutile and anatase phase. Additionally, the spectrum displays a distinguishing distorted pre-edge structure compared to pure reference standards. These specific spectral features arise because the particles in the periprosthetic tissue have undergone oxidation—either via tribochemical wear at the THA implant surface or intracellular chemical interactions after phagocytosis. Consequently, the structural and electronic environment reflects a mixed crystalline TiO2 state rather than the native Ti6Al4V alloy, producing the observed pre-edge distortion and rutile/anatase-like shape. | Full points if the answer mentions a distorted pre-edge structure and an overall spectral shape that closely resembles TiO2 in the rutile phase or a mixed rutile + anatase phase. |
| q3 | identification | 25 | What candidate reference spectra should be included in the basis set to properly evaluate the speciation of this Ti-rich debris? | The candidate reference spectra that should be included in the basis set are the native Ti6Al4V alloy, TiO2 (rutile), TiO2 (anatase), and TiO2 (brookite). These specific references are required because the Ti-rich debris originates from a retrieved THA implant initially composed of the Ti6Al4V alloy, making it the necessary baseline material. The various TiO2 polymorphs must be included to account for the subsequent oxidation of the particles, which is driven by either tribochemical processes at the implant surface or intracellular chemical interactions after macrophage phagocytosis. Utilizing this basis set enables the qualitative comparison needed to confirm that the debris has transformed from the native alloy into a mixed rutile-anatase TiO2 phase. | Full points if the answer lists the reference standards used: Ti6Al4V alloy, and TiO2 polymorphs (rutile, anatase, brookite). |
Review
#961
periprosthetic tissue
Ti K-edge
▶
LLM Prompt
Sample Information
Material: periprosthetic tissue
Sample Origin: retrieved THA (Case 1)
Sample-Specific Conditions
- co-localization: with CoCrMo
- Ti particle co-localized with CoCrMo particle
Measurement
We plan to measure the Ti K-edge XANES spectrum of this sample.
Questions
Based on all the information above:
1. Based on the sample conditions (a Ti particle co-localized with a CoCrMo particle in periprosthetic tissue), what is the expected chemical phase of this specific titanium particle, and how does this contrast with the majority of other titanium debris found in the tissue?
2. To properly evaluate the chemical state of titanium debris in this periprosthetic tissue environment, what specific reference spectra should be included in the XANES analysis basis set?
3. Describe how the Ti K-edge XANES spectral shape of this specific co-localized particle would differ from the spectra of the other, more typical titanium particles found in the surrounding tissue.
Ground Truth
Material: periprosthetic tissue
Measurement: Ti K-edge XANES at Bionanoprobe (BNP) and 2-ID-D beamlines
Fit method: direct spectral comparison to reference standards
Phase fractions:
| Phase | Fraction |
|---|---|
| Ti6Al4V alloy | 1.0 |
Fit basis (paper's reference spectra):
- Ti6Al4V alloy
- TiO2 (anatase)
- TiO2 (rutile)
- TiO2 (brookite)
Source evidence: Page 5, paragraph 1
Key reasoning: While the majority of titanium alloy implant debris particles oxidized into a mixed rutile-anatase phase in vivo, one specific particle co-localized with a CoCrMo particle was found to retain its original Ti6Al4V alloy state. This indicates that under certain conditions, such as agglomeration with other metal particles, the metallic state can be preserved.
Reasoning source: Page 5, Results section (sXFM imaging and XANES spectroscopy)
Scoring Rubric (total: 100 pts)
| Q | Type | Max | Question | Reference Answer | Scoring Criteria |
|---|---|---|---|---|---|
| q1 | identification | 40 | Based on the sample conditions (a Ti particle co-localized with a CoCrMo particle in periprosthetic tissue), what is the expected chemical phase of this specific titanium particle, and how does this contrast with the majority of other titanium debris found in the tissue? | The expected chemical phase of this specific titanium particle is 100% metallic Ti6Al4V alloy (Ti 0). This contrasts with the majority of titanium alloy implant debris in the tissue, which typically oxidizes into a mixed rutile-anatase TiO2 phase in vivo. This specific metallic phase is expected because the Ti particle is co-localized and agglomerated with a CoCrMo particle. Under these specific conditions, agglomeration with other metal particles preserves the original metallic state of the titanium debris, preventing the typical in vivo oxidation. | Full credit for identifying the phase as Ti6Al4V alloy and noting that it contrasts with the majority of other Ti particles which oxidize into a mixed rutile-anatase (TiO2) phase. |
| q2 | methodology | 30 | To properly evaluate the chemical state of titanium debris in this periprosthetic tissue environment, what specific reference spectra should be included in the XANES analysis basis set? | The XANES analysis basis set should include reference spectra for Ti6Al4V alloy, TiO2 (anatase), TiO2 (rutile), and TiO2 (brookite). These specific references are necessary because the majority of titanium implant debris in periprosthetic tissue oxidizes into mixed rutile-anatase phases in vivo. However, the Ti6Al4V alloy reference is crucial because specific sample conditions, such as the co-localization of a Ti particle with a CoCrMo particle, can preserve the original metallic state (Ti 0). Including both the metallic alloy and the TiO2 polymorphs allows for direct spectral comparison to accurately distinguish between typical oxidized debris and uniquely preserved metallic particles. | Full credit for listing Ti6Al4V alloy and various TiO2 polymorphs (anatase, rutile, brookite) as the necessary reference standards. |
| q3 | spectral | 30 | Describe how the Ti K-edge XANES spectral shape of this specific co-localized particle would differ from the spectra of the other, more typical titanium particles found in the surrounding tissue. | The XANES spectrum of this specific co-localized particle will match the Ti6Al4V alloy reference spectrum, lacking the strong oxide pre-edge and sharp white line features characteristic of rutile or anatase TiO2. This spectral shape occurs because the particle's co-localization and agglomeration with a CoCrMo particle preserves its original metallic (Ti 0) state. In contrast, the more typical titanium particles in the surrounding tissue exhibit distorted pre-edge and sharp white line features. These distinct oxide features arise because the majority of the debris undergoes in vivo oxidation into mixed rutile-anatase phases when not agglomerated with other metals. | Full credit for explaining that the spectrum would match the Ti6Al4V alloy reference, lacking the distorted pre-edge and sharp white line features characteristic of the oxidized TiO2 (rutile/anatase) particles. |
Review
Two-dimensional copper nanosheets for electrochemical reduction of carbon monoxide to acetate
BNL-NSLS-II-8-ID
Catalyst
Wesley Luc et al.
DOI: 10.1038/s41929-019-0269-8
1 scenario
▶
#962
Cu
Cu K
▶
LLM Prompt
Sample Information
Material: Cu
Reaction Conditions: CO electroreduction in flow-cell electrolyzer
Sample-Specific Conditions
- reaction state: operando CO reduction
- Two-dimensional copper nanosheets during CO electroreduction
Measurement
We plan to measure the Cu K XANES spectrum of this sample.
Questions
Based on all the information above:
1. Based on the operando XANES measurements during CO electroreduction, what is the dominant phase and oxidation state of the Cu nanosheets?
2. What reference spectrum is essential to include as a basis to confirm the state of the Cu nanosheets during the operando XANES measurement?
3. Explain how the operando XANES data supports the conclusion that the Cu nanosheets are structurally stable during the CO electroreduction reaction.
Ground Truth
Material: Cu nanosheets
Measurement: Operando XAS at the 8-ID Beamline of the National Synchrotron Light Source II
Fit method: Qualitative spectral comparison
Phase fractions:
| Phase | Fraction |
|---|---|
| metallic_copper | 1.0 |
Fit basis (paper's reference spectra):
- metallic Cu0
Source evidence: Page 6, lines 150-155
Key reasoning: Operando XANES and EXAFS spectra show that the catalyst remains entirely in its metallic Cu0 state and appears similar throughout the reaction. This confirms the structural stability of the catalyst under CO electroreduction conditions.
Reasoning source: Page 6, lines 150-155
Scoring Rubric (total: 100 pts)
| Q | Type | Max | Question | Reference Answer | Scoring Criteria |
|---|---|---|---|---|---|
| q1 | identification | 30 | Based on the operando XANES measurements during CO electroreduction, what is the dominant phase and oxidation state of the Cu nanosheets? | Based on the operando XANES measurements, the dominant phase of the Cu nanosheets is metallic copper with an oxidation state of 0, comprising a fraction of 1.0 of the sample. This phase is expected because the two-dimensional copper nanosheets are subjected to reducing conditions during operando CO electroreduction in the flow-cell electrolyzer. The spectra show that the catalyst remains entirely in its metallic Cu0 state and appears similar throughout the reaction. Consequently, this complete retention of the metallic phase confirms the structural stability of the catalyst under these specific electrocatalytic conditions. | The answer must correctly identify the dominant phase as metallic copper and the oxidation state as 0 (or Cu0). |
| q2 | identification | 30 | What reference spectrum is essential to include as a basis to confirm the state of the Cu nanosheets during the operando XANES measurement? | A metallic Cu0 reference spectrum is essential to include as a basis for qualitative spectral comparison. This reference is necessary because the two-dimensional copper nanosheets are evaluated during operando CO electroreduction in a flow-cell electrolyzer, which provides a reducing environment where the metal is expected to resist oxidation. By comparing the operando data to the metallic Cu0 reference, it is evident that the catalyst remains entirely in its metallic state (fraction of 1.0) throughout the reaction. This comparison directly confirms the structural stability of the catalyst under the applied electroreduction conditions. | The answer must state that a metallic Cu0 reference spectrum is needed. |
| q3 | reasoning | 40 | Explain how the operando XANES data supports the conclusion that the Cu nanosheets are structurally stable during the CO electroreduction reaction. | The operando XANES data supports the conclusion of structural stability by demonstrating that the spectral shape remains similar to the metallic Cu0 state throughout the entire reaction. The sample consists of two-dimensional copper nanosheets actively undergoing CO electroreduction in a flow-cell electrolyzer. Under these operando conditions, the spectra show that the catalyst remains entirely in its metallic Cu0 state (fraction of 1.0) without oxidizing or changing phase. This constant retention of the metallic phase under active reaction conditions directly confirms the robust structural stability of the catalyst. | The answer must explain that the XANES spectra show the catalyst remains in its metallic Cu0 state and the spectral shape appears similar/unchanged throughout the entire reaction. |
Review
Zeolites as equilibrium-shifting agents in shuttle catalysis
ESRF-BM23
Catalyst
Jesse Dallenes et al.
DOI: 10.1038/s41929-023-00967-8
3 scenarios
▶
#963
Pd/H-ZSM-5
Pd K-edge
▶
LLM Prompt
Sample Information
Material: Pd/H-ZSM-5
Support: H-ZSM-5
Sample-Specific Conditions
- state: preloaded
- ZSM-5 zeolite preloaded with Pd(OAc)2 in toluene
Measurement
We plan to measure the Pd K-edge XANES spectrum of this sample.
Questions
Based on all the information above:
1. What is the expected dominant Pd phase and its oxidation state when H-ZSM-5 is preloaded with Pd(OAc)2 in toluene?
2. Describe the specific coordination environment of the Pd center in this preloaded state as determined by the XAS analysis.
3. How does the expected XANES spectral shape of this preloaded sample reflect its chemical state, and how does it distinguish the sample from the catalyst state after reaction?
Ground Truth
Material: Pd/H-ZSM-5 (ZSM-5 preloaded with Pd(OAc)2)
Measurement: Pd K-edge, ex situ transmission mode, BM23 beamline at ESRF
Fit method: EXAFS fitting in Demeter package (XANES fit method not explicitly reported)
Phase fractions: (±10%)
| Phase | Fraction |
|---|---|
| Pd(II)-zeolite | 1.0 |
Fit basis (paper's reference spectra):
- Not reported
Source evidence: Page 7, Figure 4e
Key reasoning: Ex situ XANES and EXAFS spectra of zeolites preloaded with Pd(OAc)2 in toluene are consistent with a mononuclear square planar Pd(II)-zeolite species coordinated with 4 oxygen atoms; 2 from acetate and 2 from the zeolite.
Reasoning source: Page 7, Section: In-depth study of the propionitrile/H-ZSM-5 system
Scoring Rubric (total: 100 pts)
| Q | Type | Max | Question | Reference Answer | Scoring Criteria |
|---|---|---|---|---|---|
| q1 | identification | 30 | What is the expected dominant Pd phase and its oxidation state when H-ZSM-5 is preloaded with Pd(OAc)2 in toluene? | The expected dominant phase is a mononuclear square planar Pd(II)-zeolite species, which accounts for 100% of the palladium present, with an oxidation state of Pd(II). This specific phase and oxidation state arise directly from the sample preparation conditions, where H-ZSM-5 zeolite is preloaded with a Pd(OAc)2 precursor in toluene. Under these preloading conditions, the palladium retains its +2 oxidation state and interacts with the support to form a stable complex coordinated by two oxygen atoms from the acetate ligands and two oxygen atoms from the zeolite framework. | Full credit for identifying a Pd(II)-zeolite species and stating the Pd(II) oxidation state. |
| q2 | reasoning | 35 | Describe the specific coordination environment of the Pd center in this preloaded state as determined by the XAS analysis. | The Pd center in the preloaded state exists as a mononuclear square planar Pd(II)-zeolite species coordinated by a total of four oxygen atoms. This specific coordination environment forms because the sample is prepared by preloading H-ZSM-5 zeolite with Pd(OAc)2 in a toluene solvent. During this preloading step, the palladium precursor interacts directly with the support, resulting in the Pd(II) center binding to two oxygen atoms from the remaining acetate ligands and two oxygen atoms provided by the zeolite framework. This interaction stabilizes the mononuclear square planar geometry prior to any further reaction steps. | Full credit for specifying a mononuclear square planar geometry coordinated with 4 oxygen atoms (specifically noting 2 from acetate and 2 from the zeolite). |
| q3 | spectral | 35 | How does the expected XANES spectral shape of this preloaded sample reflect its chemical state, and how does it distinguish the sample from the catalyst state after reaction? | The expected XANES spectrum exhibits a prominent white line that is characteristic of an oxidized Pd(II) species. This spectral feature arises because, under the preloading conditions of Pd(OAc)2 in toluene, the palladium forms a mononuclear square planar Pd(II) species coordinated to four highly electronegative oxygen atoms (two from acetate and two from the zeolite). This prominent white line distinguishes the preloaded, fully oxidized Pd(II) state from the reduced Pd(0) species that subsequently form after the addition of Xphos or after the catalytic reaction. The specific electronic structure of the oxygen-coordinated Pd(II) center is directly responsible for this distinct oxidized spectral signature. | Full credit for mentioning a prominent white line characteristic of an oxidized Pd(II) species, which distinguishes it from the reduced Pd(0) species that appear after reaction. |
Review
#964
Pd/H-ZSM-5
Pd K-edge
▶
LLM Prompt
Sample Information
Material: Pd/H-ZSM-5
Support: H-ZSM-5
Reaction Conditions: HCN-transfer reaction
Sample-Specific Conditions
- state: recovered
- Zeolite recovered after an HCN-transfer reaction
Measurement
We plan to measure the Pd K-edge XANES spectrum of this sample.
Questions
Based on all the information above:
1. What is the dominant Pd phase expected in the H-ZSM-5 zeolite recovered after the HCN-transfer reaction, and what reference spectrum would be appropriate to model it?
2. How does the XANES spectral shape of the recovered zeolite distinguish it from the initial preloaded catalyst state and the homogeneous resting state?
Ground Truth
Material: Pd/H-ZSM-5
Measurement: Pd K-edge ex-situ transmission at BM23 beamline (ESRF)
Fit method: qualitative comparison / EXAFS fitting (detailed in supplementary)
Phase fractions: (±10%)
| Phase | Fraction |
|---|---|
| Pd(0)-carbide | 1.0 |
Fit basis (paper's reference spectra):
- Pd(0)-carbide
Source evidence: Page 7, text and Figure 4e
Key reasoning: Zeolites recovered after an HCN-transfer reaction show strikingly similar spectra to those recovered after an ethylene dimerization reaction. These spectra can be assigned to subnanometric Pd(0)-carbide species, indicating the state of the Pd catalyst after the reaction.
Reasoning source: Page 7, Results section 'In-depth study of the propionitrile/H-ZSM-5 system'
Scoring Rubric (total: 100 pts)
| Q | Type | Max | Question | Reference Answer | Scoring Criteria |
|---|---|---|---|---|---|
| q1 | identification | 50 | What is the dominant Pd phase expected in the H-ZSM-5 zeolite recovered after the HCN-transfer reaction, and what reference spectrum would be appropriate to model it? | The dominant Pd phase expected in the H-ZSM-5 zeolite recovered after the HCN-transfer reaction is Pd(0)-carbide, which accounts for 100% of the fitted fraction. An appropriate reference spectrum to model this state would be subnanometric Pd(0)-carbide, which is strikingly similar to the spectrum of a zeolite recovered after an ethylene dimerization reaction. This specific phase arises because the HCN-transfer reaction conditions cause the initial Pd catalyst to transform into subnanometric Pd(0)-carbide species. Consequently, this carbide phase represents the final resting state of the Pd catalyst after participating in the reaction. | Full credit for identifying Pd(0)-carbide as the dominant phase and the appropriate reference. |
| q3 | spectral | 50 | How does the XANES spectral shape of the recovered zeolite distinguish it from the initial preloaded catalyst state and the homogeneous resting state? | The XANES spectrum of the recovered zeolite exhibits features that are entirely distinct from both the initial Pd(II) precursor and the homogeneous Pd(0)(Xphos)2 complex. Instead, the spectral shape is consistent with subnanometric Pd(0)-carbide and is strikingly similar to the spectrum of a zeolite recovered after an ethylene dimerization reaction. These distinct spectral features arise because the HCN-transfer reaction conditions chemically transform the initial catalyst into a new subnanometric Pd(0)-carbide resting state. The unique structural and electronic properties of this newly formed carbide phase dictate the final spectral shape, reflecting the altered state of the Pd catalyst after the reaction. | Full credit for stating that the spectrum is distinct from both the initial Pd(II) precursor and the homogeneous Pd(0)(Xphos)2 complex, being consistent with subnanometric Pd(0)-carbide. |
Review
#965
Pd(0)(Xphos)2
Pd K-edge
▶
LLM Prompt
Sample Information
Material: Pd(0)(Xphos)2
Sample-Specific Conditions
- state: homogeneous resting state
- Pd(OAc)2 dissolved in propionitrile in presence of XPhos
Measurement
We plan to measure the Pd K-edge XANES spectrum of this sample.
Questions
Based on all the information above:
1. Based on the sample conditions (Pd(OAc)2 dissolved in propionitrile in the presence of XPhos), what is the expected dominant Pd phase and its oxidation state, and what physical reasoning explains its formation?
2. Describe the expected distinguishing features in the XANES and EXAFS spectra for this homogeneous resting state compared to the initial Pd(OAc)2 precursor.
3. If you were to model the EXAFS/XANES data of this sample, what specific structural motif or reference spectrum would be necessary as the primary basis function?
Ground Truth
Material: Pd(0)(Xphos)2
Measurement: Pd K-edge in situ transmission at BM23 beamline of ESRF
Fit method: Multivariate curve resolution (MCR) and EXAFS fitting
Phase fractions: (±10%)
| Phase | Fraction |
|---|---|
| Pd(0)(Xphos)2 | 1.0 |
Fit basis (paper's reference spectra):
- Pd(0)(Xphos)2
Source evidence: Page 7, Figure 4e (XANES) and 4f (EXAFS); Page 13 (Methods)
Key reasoning: In the homogeneous solution, Pd(OAc)2 reacts with the reducing phosphine ligand XPhos to form the catalyst complex Pd(0)(Xphos)2. This complex acts as the resting state for the transfer hydrocyanation reaction, as evidenced by in situ XAS measurements showing dominant Pd-P contributions.
Reasoning source: Page 7, main text and Figure 4 caption
Scoring Rubric (total: 100 pts)
| Q | Type | Max | Question | Reference Answer | Scoring Criteria |
|---|---|---|---|---|---|
| q1 | reasoning | 35 | Based on the sample conditions (Pd(OAc)2 dissolved in propionitrile in the presence of XPhos), what is the expected dominant Pd phase and its oxidation state, and what physical reasoning explains its formation? | The expected dominant phase is Pd(0)(Xphos)2 with an oxidation state of 0, which accounts for a fraction of 1.0 (100%) of the sample. This specific phase arises because when the Pd(OAc)2 precursor is dissolved in propionitrile in the presence of XPhos, the XPhos acts as a reducing phosphine ligand. This chemical reaction reduces the palladium and coordinates the XPhos ligands to form the Pd(0)(Xphos)2 complex. Consequently, this newly formed complex acts as the stable, homogeneous resting state for the transfer hydrocyanation reaction under these solution conditions. | Full credit requires identifying Pd(0)(Xphos)2 as the dominant phase with an oxidation state of 0, and explaining that XPhos acts as a reducing phosphine ligand to form this homogeneous resting state catalyst complex. |
| q2 | spectral | 35 | Describe the expected distinguishing features in the XANES and EXAFS spectra for this homogeneous resting state compared to the initial Pd(OAc)2 precursor. | The XANES spectrum for this sample will exhibit an absorption edge near 24350 eV and will notably lack the intense white line that is characteristic of the initial Pd(II) acetate precursor. Additionally, the EXAFS spectrum will be dominated by Pd-P scattering contributions, distinguishing it from Pd-O coordinated species. These spectral features directly result from the sample conditions, where dissolving Pd(OAc)2 in propionitrile with XPhos causes a reduction and ligand exchange. The reducing phosphine ligand replaces the oxygen-coordinated acetates with phosphorus-coordinated XPhos ligands, forming the Pd(0)(Xphos)2 resting state and fundamentally altering the electronic and local structural environment of the palladium centers. | Full credit requires mentioning the lack of an intense white line in the XANES (compared to Pd(II)) and stating that the EXAFS is dominated by Pd-P contributions rather than Pd-O. |
| q3 | identification | 30 | If you were to model the EXAFS/XANES data of this sample, what specific structural motif or reference spectrum would be necessary as the primary basis function? | To model the EXAFS/XANES data for this sample, the specific reference spectrum necessary as the primary basis function is the Pd(0)(Xphos)2 complex, which represents a fraction of 1.0. This basis is required because the sample conditions—dissolving Pd(OAc)2 in propionitrile in the presence of XPhos—drive a chemical reaction where the reducing phosphine ligand fully converts the precursor into the homogeneous catalyst complex. As a result of this reaction, the structural motif shifts entirely from the initial Pd-O coordination to one dominated by Pd-P contributions. Therefore, using Pd(0)(Xphos)2 as the sole basis accurately captures the complete reduction and ligand substitution dictated by the solution environment. | Full credit requires identifying the Pd(0)(Xphos)2 complex (or a Pd-P coordinated structural motif) as the necessary basis for fitting the data. |
Review
CO2 fixation into carbon nanofibres using electrochemical–thermochemical tandem catalysis
BNL-NSLS-II-8-ID
Catalyst
Zhenhua Xie et al.
DOI: 10.1038/s41929-023-01085-1
2 scenarios
▶
#966
Fe3Co6/CeO2
Fe K
▶
LLM Prompt
Sample Information
Material: Fe3Co6/CeO2
Support: CeO2
Sample-Specific Conditions
- State: Fresh
- Fresh FeCo bimetallic catalyst supported on CeO2
Measurement
We plan to measure the Fe K XANES spectrum of this sample.
Questions
Based on all the information above:
1. Based on the sample conditions (fresh, exposed to N2 at 25 °C), what is the expected dominant iron phase in the Fe3Co6/CeO2 catalyst, and what physical reasoning justifies this state?
2. What reference spectra should be included in a basis set to properly evaluate the Fe K-edge XANES of this fresh catalyst, and what general spectral shape is expected?
Ground Truth
Material: Fe3Co6/CeO2
Measurement: Fe K-edge in situ XANES at beamline 8-ID (ISS), NSLS-II
Fit method: qualitative comparison to reference standards
Phase fractions:
| Phase | Fraction |
|---|---|
| Fe2O3 | 1.0 |
Fit basis (paper's reference spectra):
- bcc Fe foil
- FeO
- Fe3O4
- Fe2O3
Source evidence: Figure 2b and page 7 text
Key reasoning: The catalyst was synthesized via calcination in air at 400 °C, resulting in fully oxidized metal species. The Fe K-edge XANES spectrum of the fresh sample matches the Fe2O3 reference standard, indicating iron is present as Fe3+ prior to reduction.
Reasoning source: Page 7, paragraph 2 and Methods (Catalysts Preparation)
Scoring Rubric (total: 100 pts)
| Q | Type | Max | Question | Reference Answer | Scoring Criteria |
|---|---|---|---|---|---|
| q1 | reasoning | 50 | Based on the sample conditions (fresh, exposed to N2 at 25 °C), what is the expected dominant iron phase in the Fe3Co6/CeO2 catalyst, and what physical reasoning justifies this state? | The expected dominant iron phase in the fresh Fe3Co6/CeO2 catalyst is Fe2O3, which accounts for a fraction of 1.0. This fully oxidized state arises because the catalyst was synthesized via calcination in air at 400 °C, which fully oxidizes the metal species. Since the sample is in its fresh state prior to any reduction treatment, the iron remains present entirely as Fe3+. Consequently, the Fe K-edge XANES spectrum perfectly matches the Fe2O3 reference standard. | Score based on identifying Fe2O3 (or Fe3+ oxide) as the dominant phase (15 pts) and explaining that the fresh state retains the fully oxidized form from the air calcination step during synthesis (20 pts). |
| q2 | spectral | 50 | What reference spectra should be included in a basis set to properly evaluate the Fe K-edge XANES of this fresh catalyst, and what general spectral shape is expected? | To properly evaluate the Fe K-edge XANES of this catalyst, the reference basis set should include bcc Fe foil, FeO, Fe3O4, and Fe2O3. The expected spectral shape closely resembles the α-Fe2O3 reference standard, exhibiting a low-intensity pre-edge peak and a high-intensity white line. These specific spectral features arise because the fresh sample was synthesized via calcination in air at 400 °C, leaving the iron in a fully oxidized Fe3+ state prior to any reduction. Including the full range of oxidation state references is necessary to confirm this state, as the fresh sample's spectrum is distinctly different from the reduced bcc Fe foil and intermediate oxides like FeO or Fe3O4. | Score based on listing relevant standards (Fe2O3, Fe3O4, FeO, Fe foil) (15 pts) and describing the shape as matching α-Fe2O3 with a characteristic pre-edge and white line (20 pts). |
Review
#967
Fe3Co6/CeO2
Fe K
▶
LLM Prompt
Sample Information
Material: Fe3Co6/CeO2
Support: CeO2
Sample-Specific Conditions
- State: Reduced
- Reduced FeCo bimetallic catalyst supported on CeO2
Measurement
We plan to measure the Fe K XANES spectrum of this sample.
Questions
Based on all the information above:
1. Given the sample is a Fe3Co6/CeO2 bimetallic catalyst reduced in 50 vol% H2 at 500 °C, what is the expected dominant Fe-containing phase, and what physical reasoning justifies this assignment?
2. Describe the expected spectral shape of the Fe K-edge XANES for this reduced sample. What distinguishing features would confirm the success of the reduction treatment compared to the fresh catalyst?
3. To properly evaluate the reduction state of this catalyst using qualitative comparison or linear combination fitting, what specific reference spectra should be measured and included in the analysis?
Ground Truth
Material: Fe3Co6/CeO2
Measurement: Fe K-edge in situ XANES at beamline 8-ID (ISS) at NSLS-II
Fit method: Qualitative comparison to reference standards (EXAFS fitting used for structural parameters)
Phase fractions:
| Phase | Fraction |
|---|---|
| bcc FeCo alloy | 1.0 |
Fit basis (paper's reference spectra):
- bcc Fe foil
- FeO
- Fe3O4
- Fe2O3
Source evidence: Page 7, Figure 2b-d
Key reasoning: In situ Fe K-edge XANES indicates that the initial iron oxides over Fe3Co6/CeO2 are fully reduced to a metallic state at 500 °C. The Fe-Co alloy formation is further validated by the Fe K-edge EXAFS features in both k-space and R space, which resemble those of a bcc Fe foil, consistent with in situ XRD results showing a bcc Fe-Co alloy phase.
Reasoning source: Page 7, Section 'Structural properties of catalysts responsible for CNF formation'
Scoring Rubric (total: 100 pts)
| Q | Type | Max | Question | Reference Answer | Scoring Criteria |
|---|---|---|---|---|---|
| q1 | reasoning | 35 | Given the sample is a Fe3Co6/CeO2 bimetallic catalyst reduced in 50 vol% H2 at 500 °C, what is the expected dominant Fe-containing phase, and what physical reasoning justifies this assignment? | The expected dominant Fe-containing phase is a bcc FeCo alloy, representing a fraction of 1.0 (100%) of the iron species. This phase arises because the reduction treatment at 500 °C is sufficient to fully reduce the initial iron oxides present on the Fe3Co6/CeO2 catalyst to a metallic state (oxidation state 0). The specific formation of a bcc Fe-Co alloy is driven by the bimetallic composition of the sample and the high-temperature reducing conditions. This structural assignment is further validated by EXAFS features in both k-space and R-space that resemble a bcc Fe foil, which is consistent with in situ XRD results. | Full credit for identifying the bcc FeCo alloy (or metallic Fe-Co state) and explaining that the reduction conditions fully reduce the initial iron oxides to a metallic state, which alloys with Co in a bcc structure. |
| q2 | spectral | 35 | Describe the expected spectral shape of the Fe K-edge XANES for this reduced sample. What distinguishing features would confirm the success of the reduction treatment compared to the fresh catalyst? | The expected spectral shape of the Fe K-edge XANES for the reduced sample closely resembles that of a bcc Fe foil reference standard. A successful reduction treatment is confirmed by the absence of the intense white line and distinct pre-edge features that are characteristic of iron oxide standards (FeO, Fe3O4, Fe2O3). These spectral changes occur because the 500 °C reduction conditions fully convert the initial iron oxides on the Fe3Co6/CeO2 catalyst into a metallic state (oxidation state 0). Additionally, the EXAFS oscillations match those of a bcc Fe foil rather than an fcc Co foil, structurally reflecting the formation of the bcc Fe-Co alloy. | Full credit for stating the spectrum will resemble a metallic bcc Fe foil and noting the absence/disappearance of oxide features (such as the intense white line or distinct pre-edge peaks seen in FeO, Fe3O4, or Fe2O3). |
| q3 | identification | 30 | To properly evaluate the reduction state of this catalyst using qualitative comparison or linear combination fitting, what specific reference spectra should be measured and included in the analysis? | To properly evaluate the reduction state of the Fe3Co6/CeO2 catalyst, the analysis should include reference spectra for a bcc Fe foil, FeO, Fe3O4, and Fe2O3. These specific references are necessary because the sample undergoes a transition from initial iron oxides to a fully reduced metallic state at 500 °C. The iron oxide standards (FeO, Fe3O4, Fe2O3) are required to track the disappearance of oxidized species and their characteristic intense white lines. Conversely, the bcc Fe foil reference is essential to identify and confirm the final formation of the bcc FeCo alloy (oxidation state 0) that arises from the bimetallic composition under these reducing conditions. | Full credit for listing metallic bcc Fe foil and relevant iron oxide standards (FeO, Fe3O4, and Fe2O3) to bound the oxidation states. |
Review
Atomically dispersed ruthenium hydride on beta zeolite as catalysts for the isomerization of muconates
ESRF-BM23
Catalyst
Ibrahim Khalil et al.
DOI: 10.1038/s41929-024-01205-5
2 scenarios
▶
#968
Ru(NH3)6Cl3
Ru K-edge
▶
LLM Prompt
Sample Information
Material: Ru(NH3)6Cl3
Sample-Specific Conditions
- state: precursor
- Ruthenium precursor salt
Measurement
We plan to measure the Ru K-edge XANES spectrum of this sample.
Questions
Based on all the information above:
1. What is the expected oxidation state of Ru in this precursor sample, and what is its chemical formula?
2. Describe the expected spectral shape of the Ru K-edge XANES for this sample, specifically focusing on the white line peak and its edge position relative to the activated Ru-zeolite catalyst.
3. What electronic effect is attributed to the difference in edge position between this Ru(NH3)6Cl3 precursor and the activated Ru-zeolite catalyst?
Ground Truth
Material: Ru(NH3)6Cl3
Measurement: Ru K-edge XANES, transmission mode, BM23 beamline of ESRF
Fit method: ab initio simulation (FDMNES)
Phase fractions:
| Phase | Fraction |
|---|---|
| Ru(NH3)6Cl3 | 1.0 |
Fit basis (paper's reference spectra):
- Ru(NH3)6Cl3 theoretical model
Source evidence: Fig. 3d, page 19; Methods, page 26
Key reasoning: The sample is the pure commercial Ru(NH3)6Cl3 salt used as a precursor for catalyst preparation. It is measured as a reference to understand the initial state of the Ru species before thermal activation in the zeolite.
Reasoning source: Section 'Catalyst preparation and investigation of Ru active species', page 7
Scoring Rubric (total: 100 pts)
| Q | Type | Max | Question | Reference Answer | Scoring Criteria |
|---|---|---|---|---|---|
| q1 | identification | 30 | What is the expected oxidation state of Ru in this precursor sample, and what is its chemical formula? | The expected oxidation state of Ru in this sample is Ru(III), and its chemical formula is Ru(NH3)6Cl3. Because the sample is the pure commercial ruthenium precursor salt measured prior to any thermal activation in the zeolite, it remains entirely in its initial state. Therefore, it consists of a 1.0 fraction of Ru(NH3)6Cl3, preserving the +3 oxidation state of the central ruthenium atom coordinated by six ammonia ligands. | Full points for identifying the formula as Ru(NH3)6Cl3 and the oxidation state as Ru(III). |
| q2 | spectral | 35 | Describe the expected spectral shape of the Ru K-edge XANES for this sample, specifically focusing on the white line peak and its edge position relative to the activated Ru-zeolite catalyst. | The Ru K-edge XANES spectrum features a prominent, high-intensity white line peak around 22135 eV. The edge position is located at approximately 22120-22125 eV, which is slightly lower in energy compared to the activated Ru-zeolite catalyst. This spectral shape arises because the sample is the pure Ru(NH3)6Cl3 precursor salt, measured as a reference to understand the initial state of the Ru species before thermal activation. The lower edge energy relative to the activated catalyst is structurally driven by the greater ligand-to-metal electron transfer from the six NH3 ligands in this precursor state compared to the oxygen-containing ligands present after activation. | Full points for mentioning a prominent white line peak around 22135 eV and stating that the edge position is at a slightly lower energy compared to the activated catalyst. |
| q3 | reasoning | 35 | What electronic effect is attributed to the difference in edge position between this Ru(NH3)6Cl3 precursor and the activated Ru-zeolite catalyst? | The difference in edge position is attributed to greater ligand-to-metal electron transfer in the precursor compared to the activated catalyst. Because the sample is the pure Ru(NH3)6Cl3 precursor salt prior to thermal activation, the ruthenium center is coordinated by six ammonia (NH3) ligands. These NH3 ligands donate more electron density to the metal center than the oxygen-containing ligands that coordinate the Ru species in the activated zeolite state. This increased electron transfer in the precursor state effectively increases the electron density on the Ru(III) center, shifting its XANES edge position to slightly lower energies (~22120-22125 eV) relative to the activated catalyst. | Full points for explaining that the lower edge energy in the precursor (or higher edge energy in the activated catalyst) is due to differences in ligand-to-metal electron transfer (greater in the precursor with 6 NH3 ligands). |
Review
#969
Ru/Beta zeolite
Ru K-edge
▶
LLM Prompt
Sample Information
Material: Ru/Beta zeolite
Support: Beta zeolite (Si/Al = 150)
Sample-Specific Conditions
- state: activated catalyst
- Ru loaded on Beta zeolite and activated under N2
Measurement
We plan to measure the Ru K-edge XANES spectrum of this sample.
Questions
Based on all the information above:
1. Based on the sample conditions (Ru(NH3)6Cl3 loaded on Beta zeolite and activated under N2 at 350°C), what is the expected dominant Ru phase and its oxidation state?
2. Describe the expected Ru K-edge XANES spectral features of this activated catalyst, specifically comparing its edge position and white line to the Ru(NH3)6Cl3 precursor.
3. What structural and chemical changes occur during the N2 activation that explain the observed Ru K-edge XANES edge shift?
Ground Truth
Material: Ru/Beta zeolite
Measurement: Ru K-edge transmission mode at BM23 beamline of ESRF
Fit method: Ab initio simulation (FDMNES)
Phase fractions:
| Phase | Fraction |
|---|---|
| Atomically dispersed Ru(III) complex | 1.0 |
Fit basis (paper's reference spectra):
- 3D atomic models pre-optimized at DFT level of theory
Source evidence: Page 7, Fig 3d
Key reasoning: Upon activation under N2 flow at 350°C, the Ru(NH3)6Cl3 precursor loses 5 of its NH3 ligands but remains hexacoordinated by gaining oxygen-containing ligands (H2O and framework oxygens). The average oxidation state remains Ru(III). The slight edge shift towards higher energies compared to the precursor indicates a lesser ligand-to-metal electron transfer.
Reasoning source: Page 7, Section 'Catalyst preparation and investigation of Ru active species'
Scoring Rubric (total: 100 pts)
| Q | Type | Max | Question | Reference Answer | Scoring Criteria |
|---|---|---|---|---|---|
| q1 | identification | 30 | Based on the sample conditions (Ru(NH3)6Cl3 loaded on Beta zeolite and activated under N2 at 350°C), what is the expected dominant Ru phase and its oxidation state? | The expected dominant phase is an atomically dispersed Ru(III) complex, which accounts for a fraction of 1.0 (100%) of the ruthenium species. The oxidation state of the ruthenium remains Ru(III). This specific phase arises because, during activation under N2 flow at 350°C, the Ru(NH3)6Cl3 precursor loses five of its NH3 ligands. Despite this loss, the ruthenium center remains hexacoordinated by gaining oxygen-containing ligands, specifically H2O and framework oxygens from the Beta zeolite support, which stabilizes the atomically dispersed Ru(III) state. | 15 points for identifying an atomically dispersed Ru complex coordinated to oxygen/framework and remaining nitrogen ligands; 15 points for stating the Ru(III) oxidation state. |
| q2 | spectral | 40 | Describe the expected Ru K-edge XANES spectral features of this activated catalyst, specifically comparing its edge position and white line to the Ru(NH3)6Cl3 precursor. | The Ru K-edge XANES spectrum of the activated catalyst exhibits an edge position (around 22120 eV) that is slightly shifted towards higher energies compared to the Ru(NH3)6Cl3 precursor. Furthermore, the white line peak at approximately 22130 eV is broader and has a lower intensity than that of the precursor. These spectral features arise from the structural changes during N2 activation, where the precursor loses five NH3 ligands and coordinates with H2O and zeolite framework oxygens. The resulting shift to higher edge energies specifically reflects a lesser ligand-to-metal electron transfer in this newly formed hexacoordinated Ru(III) complex compared to the original precursor. | 20 points for mentioning the edge shift to higher energies; 20 points for noting the broader and/or lower intensity white line compared to the precursor. |
| q3 | reasoning | 30 | What structural and chemical changes occur during the N2 activation that explain the observed Ru K-edge XANES edge shift? | During activation under N2 flow at 350°C, the Ru(NH3)6Cl3 precursor undergoes significant ligand exchange while maintaining its average Ru(III) oxidation state. The primary structural change is that the precursor loses five of its original NH3 ligands but remains hexacoordinated by bonding with new oxygen-containing ligands, namely H2O and framework oxygens from the Beta zeolite. This chemical transformation alters the electronic environment of the ruthenium center. As a result, the XANES edge position shifts slightly towards higher energies because the new oxygen-based coordination environment induces a lesser ligand-to-metal electron transfer compared to the original ammonia ligands. | 15 points for mentioning the loss of most NH3 ligands and replacement by oxygen-containing ligands (H2O/framework O); 15 points for explaining that the edge shift to higher energies indicates lesser ligand-to-metal electron transfer despite remaining Ru(III). |
Review
Enhancing catalytic performance of dilute metal alloy nanomaterials
BNL-NSLS-II-8-ID
Catalyst
Mathilde Luneau et al.
DOI: 10.1038/s42004-020-0293-2
2 scenarios
▶
#970
Pd0.04Au0.96
Pd K-edge
▶
LLM Prompt
Sample Information
Material: Pd0.04Au0.96
Support: SiO2
Reaction Conditions: Measured at 298 K in He after treatment
Sample-Specific Conditions
- Pretreatment gas: O2
- Dilute Pd-Au alloy nanoparticles embedded in porous silica after high-temperature oxidation
Measurement
We plan to measure the Pd K-edge XANES spectrum of this sample.
Questions
Based on all the information above:
1. Based on the sample conditions, what are the expected Pd phases or structural motifs in this dilute Pd-Au alloy after high-temperature O2 treatment, and what are their estimated fractions?
2. Explain the physical and thermodynamic reasons why this specific pretreatment (O2 at 673 K) results in this specific distribution of Pd, given that Pd typically prefers the bulk in pristine Pd-Au alloys.
3. To properly model the Pd K-edge XAS data for this sample, what types of reference materials or scattering paths would be necessary to include in the fit?
Ground Truth
Material: Pd0.04Au0.96 RCT-SiO2
Measurement: Pd K-edge, fluorescence mode, in situ (ISS beamline, NSLS II)
Fit method: EXAFS fitting (coordination number analysis)
Phase fractions: (±50%)
| Phase | Fraction |
|---|---|
| Surface Pd (chemisorbed O) | 0.2 |
| Bulk Pd (alloyed in Au) | 0.8 |
Fit basis (paper's reference spectra):
- Pd foil (for amplitude reduction factor)
- Pd-Au scattering paths
- Pd-Pd scattering paths
- Pd-O scattering paths
Source evidence: Page 6 text ('up to 20% of the total Pd is drawn to the surface') and Table 1
Key reasoning: In pristine dilute Pd-Au alloys, Pd atoms are thermodynamically favored to reside in the bulk of the Au host due to the higher surface energy of Pd. Treatment in O2 provides a thermodynamic driving force for Pd to segregate to the surface via the formation of Pd-O bonds. The high temperature (673 K) is required to overcome kinetic barriers, allowing Pd atoms to migrate to the surface by random walk to react with the oxygen. Despite this driving force, the surface concentration remains low, with only about 20% of the total Pd drawn to the surface as chemisorbed oxide, while the remaining 80% stays in the bulk.
Reasoning source: Results and discussion section: 'Pd is stable in the bulk in the absence of adsorbates' (Page 4) and 'Oxidation at high temperature stabilizes Pd at the surface' (Pages 4-6)
Scoring Rubric (total: 100 pts)
| Q | Type | Max | Question | Reference Answer | Scoring Criteria |
|---|---|---|---|---|---|
| q1 | quantification | 30 | Based on the sample conditions, what are the expected Pd phases or structural motifs in this dilute Pd-Au alloy after high-temperature O2 treatment, and what are their estimated fractions? | After high-temperature O2 treatment, the Pd0.04Au0.96 sample is expected to consist of 20% surface Pd (as chemisorbed O) and 80% bulk Pd (alloyed in Au). These specific fractions arise because, in pristine dilute Pd-Au alloys, Pd atoms thermodynamically prefer to reside in the bulk of the Au host due to their higher surface energy. The O2 pretreatment provides a thermodynamic driving force for Pd to segregate to the surface by forming Pd-O bonds, while the high temperature overcomes the kinetic barriers for migration. However, despite this driving force, the surface concentration remains relatively low, resulting in only about 20% of the total Pd being drawn to the surface while the remaining 80% stays in the bulk. | Full credit for identifying two main states: surface Pd interacting with oxygen (chemisorbed O) and bulk Pd alloyed within the Au matrix, and correctly estimating the fractions at approximately 20% surface Pd and 80% bulk Pd. |
| q2 | reasoning | 40 | Explain the physical and thermodynamic reasons why this specific pretreatment (O2 at 673 K) results in this specific distribution of Pd, given that Pd typically prefers the bulk in pristine Pd-Au alloys. | In pristine dilute Pd-Au alloys, Pd atoms are thermodynamically favored to reside in the bulk of the Au host because Pd has a higher surface energy than Au. Introducing O2 during pretreatment alters this balance by providing a thermodynamic driving force for Pd to segregate to the surface through the formation of stable Pd-O bonds. Furthermore, the high temperature (673 K) is necessary to overcome kinetic barriers, allowing the Pd atoms to migrate to the surface via a random walk process to react with the oxygen. Ultimately, this combination of thermodynamic pull and kinetic mobility results in the observed distribution where a minor fraction (20%) of Pd segregates to the surface as chemisorbed oxide, while the majority (80%) remains stable in the bulk. | Full credit requires mentioning two key points: 1) O2 provides a thermodynamic driving force for surface segregation due to Pd-O bond formation, overcoming Pd's natural preference for the bulk. 2) The high temperature (673 K) is necessary to overcome kinetic barriers, allowing Pd atoms to diffuse/migrate to the surface to react. |
| q3 | identification | 30 | To properly model the Pd K-edge XAS data for this sample, what types of reference materials or scattering paths would be necessary to include in the fit? | To properly model the Pd K-edge XAS data, the fit basis must include a Pd foil reference (for the amplitude reduction factor), alongside Pd-Au, Pd-Pd, and Pd-O scattering paths. These specific paths are necessary because the sample conditions dictate a dual-environment structure for the Pd atoms after the high-temperature O2 treatment. The Pd-Au and Pd-Pd paths account for the 80% of Pd atoms that remain alloyed in the bulk of the Au host, which is their thermodynamically preferred state due to surface energy differences. Meanwhile, the Pd-O paths are required to model the 20% of Pd atoms that migrate to the surface to form chemisorbed oxides, driven by the thermodynamic pull of the O2 pretreatment overcoming kinetic barriers. | Full credit for stating that the fit must include components for both metallic Pd-Au bonding (to capture the bulk alloyed Pd) and Pd-O bonding (to capture the surface oxidized/chemisorbed Pd). |
Review
#971
Pd0.04Au0.96
Pd K-edge
▶
LLM Prompt
Sample Information
Material: Pd0.04Au0.96
Support: SiO2
Reaction Conditions: Measured at 298 K in He after treatment
Sample-Specific Conditions
- Pretreatment gas: H2
- Dilute Pd-Au alloy nanoparticles embedded in porous silica after high-temperature reduction
Measurement
We plan to measure the Pd K-edge XANES spectrum of this sample.
Questions
Based on all the information above:
1. Under the specified H2 pretreatment at 673 K, what is the dominant structural state and location of the Pd atoms within the Pd0.04Au0.96 nanoparticles, and what is the physical reasoning for this distribution?
2. If one were to perform Linear Combination Fitting (LCF) on the XANES spectrum of this H2-treated sample, what reference spectra would be most appropriate to capture the dominant phase, and which common reference would be expected to have a near-zero contribution?
Ground Truth
Material: Pd0.04Au0.96 RCT-SiO2
Measurement: Pd K-edge XANES and EXAFS, in situ fluorescence mode, ISS beamline (8-ID) NSLS II
Fit method: EXAFS fitting and qualitative XANES comparison
Phase fractions: (±5%)
| Phase | Fraction |
|---|---|
| Bulk Pd (alloyed in Au) | 1.0 |
Fit basis (paper's reference spectra):
- Theoretical Pd-Au paths
- Theoretical Pd-Pd paths
- Pd foil (for amplitude reduction factor)
Source evidence: Table 1 (Page 6); Page 6 text ('Adsorbed hydrogen does not stabilize Pd at the surface'); Supplementary Fig. 5 (referenced on Page 7)
Key reasoning: Pretreatment in hydrogen at high temperature (673 K) causes Pd to dissolve into the bulk of the Au nanoparticle, leaving it fully reduced. Adsorbed hydrogen does not provide sufficient thermodynamic stabilization to keep Pd at the surface; DFT calculations show that repositioning a Pd atom from the subsurface to the surface adjacent to an H atom is endothermic by 0.27 eV. Consequently, the Pd remains alloyed within the Au bulk, as evidenced by the lack of Pd-O bonds and a high Pd-Au coordination number (11.6) in EXAFS, with no detectable changes in Pd oxidation state in XANES.
Reasoning source: Page 6, Section 'Adsorbed hydrogen does not stabilize Pd at the surface'; Table 1; Page 7 text
Scoring Rubric (total: 100 pts)
| Q | Type | Max | Question | Reference Answer | Scoring Criteria |
|---|---|---|---|---|---|
| q1 | reasoning | 57 | Under the specified H2 pretreatment at 673 K, what is the dominant structural state and location of the Pd atoms within the Pd0.04Au0.96 nanoparticles, and what is the physical reasoning for this distribution? | Under the specified H2 pretreatment at 673 K, the dominant structural state of the Pd atoms is fully reduced bulk Pd alloyed within the Au nanoparticles, representing a fraction of 1.0. This distribution occurs because the high-temperature reduction causes the dilute Pd atoms to dissolve into the bulk of the Au nanoparticle. Adsorbed hydrogen from the pretreatment does not provide sufficient thermodynamic stabilization to keep Pd at the surface, as repositioning a Pd atom from the subsurface to the surface adjacent to an H atom is endothermic by 0.27 eV. Consequently, the Pd remains fully alloyed within the Au bulk, which is supported by the lack of Pd-O bonds, a high Pd-Au coordination number of 11.6, and no detectable changes in the Pd oxidation state in the XANES spectrum. | The answer must identify that Pd is fully reduced and dissolved into the bulk/subsurface of the Au nanoparticle (20 points). It must also explain that adsorbed hydrogen does not thermodynamically stabilize surface Pd at this temperature, making the migration of Pd to the surface endothermic (20 points). |
| q2 | identification | 43 | If one were to perform Linear Combination Fitting (LCF) on the XANES spectrum of this H2-treated sample, what reference spectra would be most appropriate to capture the dominant phase, and which common reference would be expected to have a near-zero contribution? | To capture the dominant phase in this H2-treated sample, the most appropriate reference would be a fully reduced Pd-Au alloy (represented by theoretical Pd-Au and Pd-Pd paths), while a Pd oxide reference would have a near-zero contribution. This specific phase composition arises because the high-temperature H2 pretreatment fully reduces the sample and causes the dilute Pd atoms to dissolve entirely into the bulk of the Au nanoparticles. Adsorbed hydrogen does not provide sufficient thermodynamic stabilization to keep Pd at the surface, making the repositioning of Pd to the surface endothermic by 0.27 eV. As a result, the sample consists entirely of bulk Pd alloyed in Au (fraction of 1.0) with no detectable changes in oxidation state, explaining the necessity of alloy references and the complete absence of Pd-O bonds. | The answer must suggest a metallic Pd-Au alloy or bulk metallic Pd reference to capture the dominant phase (15 points) and state that an oxidized Pd reference (e.g., PdO) would have a near-zero contribution due to the reducing conditions (15 points). |
Review
Directing CO2 electroreduction pathways for selective C2 product formation using single-site doped copper catalysts
BNL-NSLS-II-8-ID
Catalyst
Zhengyuan Li et al.
DOI: 10.1038/s44286-023-00018-w
3 scenarios
▶
#972
Rh-doped CuO
Rh K-edge
▶
LLM Prompt
Sample Information
Material: Rh-doped CuO
Sample-Specific Conditions
- State: Pre-catalyst
- Pre-catalyst before electrochemical reduction
Measurement
We plan to measure the Rh K-edge XANES spectrum of this sample.
Questions
Based on all the information above:
1. Based on the preparation method (cation exchange followed by calcination), what is the expected dominant chemical state of Rh in the Rh-doped CuO pre-catalyst, and what physical reasoning supports this?
2. What reference spectrum would be most critical to include as a basis for analyzing the Rh K-edge XANES of this pre-catalyst to confirm its initial chemical state?
3. Describe the expected distinguishing features of the Rh K-edge XANES spectrum for this pre-catalyst compared to a metallic Rh reference.
Ground Truth
Material: Rh-doped CuO
Measurement: Rh K-edge ex-situ XANES at NSLS II
Fit method: qualitative comparison
Phase fractions: (±10%)
| Phase | Fraction |
|---|---|
| Rh2O3-like (Rh3+) | 1.0 |
Fit basis (paper's reference spectra):
- Rh2O3
- Rh foil
Source evidence: Fig. 2g, Page 10
Key reasoning: The normalized XANES spectra at the Rh K-edge indicate that the chemical state of the Rh-CuO pre-catalyst resembles that of Rh2O3. EXAFS analysis further supports this by showing only a first shell Rh-O scattering path, confirming the fully oxidized state of the dopant before electrochemical reduction.
Reasoning source: Page 10, Results section
Scoring Rubric (total: 100 pts)
| Q | Type | Max | Question | Reference Answer | Scoring Criteria |
|---|---|---|---|---|---|
| q1 | reasoning | 40 | Based on the preparation method (cation exchange followed by calcination), what is the expected dominant chemical state of Rh in the Rh-doped CuO pre-catalyst, and what physical reasoning supports this? | The expected dominant chemical state of Rh in the Rh-doped CuO pre-catalyst is a fully oxidized +3 state, specifically a Rh3+ oxide species resembling Rh2O3. This fully oxidized state is expected because the sample is in its initial pre-catalyst form prior to any electrochemical reduction. Because it has not yet been subjected to reducing electrochemical conditions, the Rh dopant remains entirely oxidized, accounting for a 1.0 fraction of the species. This physical reasoning is further supported by EXAFS analysis, which shows only a first-shell Rh-O scattering path and confirms the complete absence of metallic reduction in this initial state. | Award 20 points for identifying the Rh3+ / Rh2O3-like state. Award 20 points for reasoning that the calcination process results in an oxidized state with Rh-O coordination, matching the Rh2O3 reference. |
| q2 | identification | 30 | What reference spectrum would be most critical to include as a basis for analyzing the Rh K-edge XANES of this pre-catalyst to confirm its initial chemical state? | The most critical reference spectra to include as a basis for analyzing this pre-catalyst are Rh2O3 and metallic Rh foil. These references are necessary because the sample is being measured in its pre-catalyst state before electrochemical reduction, meaning the Rh dopant is expected to be fully oxidized rather than metallic. Comparing the sample to Rh2O3 confirms the 1.0 fraction of Rh3+ oxide species, while the Rh foil serves to prove the absence of metallic character. This is physically justified by the unreduced nature of the sample, where only first-shell Rh-O scattering paths are present prior to the electrochemical reaction. | Award 30 points for identifying Rh2O3 (or a similar Rh3+ oxide) as the primary necessary reference. |
| q3 | spectral | 30 | Describe the expected distinguishing features of the Rh K-edge XANES spectrum for this pre-catalyst compared to a metallic Rh reference. | The Rh K-edge XANES spectrum for this pre-catalyst is expected to exhibit a strong white line characteristic of oxidized Rh3+ species, closely matching the Rh2O3 reference. Furthermore, the spectrum will be distinctly different from a metallic Rh foil reference by completely lacking any metallic features. These spectral features arise directly from the sample conditions, as the material is a pre-catalyst that has not yet undergone electrochemical reduction. Because the Rh dopant remains in a fully oxidized state with only Rh-O bonds present, the spectrum reflects a pure oxide environment rather than a reduced metallic structure. | Award 15 points for mentioning the presence of a strong white line. Award 15 points for stating it will closely resemble the Rh2O3 reference and lack the features of metallic Rh. |
Review
#973
Rh-doped Cu
Rh K-edge
▶
LLM Prompt
Sample Information
Material: Rh-doped Cu
Sample-Specific Conditions
- State: Reduced catalyst
- Catalyst after electrochemical reduction
Measurement
We plan to measure the Rh K-edge XANES spectrum of this sample.
Questions
Based on all the information above:
1. Based on the sample conditions (Rh-doped Cu, reduced at -0.35 V vs RHE), what is the expected dominant chemical state of Rh, and what physical reasoning justifies this state despite potential ex situ measurement artifacts?
2. Describe the expected spectral shape of the Rh K-edge XANES for this reduced Rh-Cu catalyst. What distinguishing feature would confirm its successful reduction compared to an oxidized reference like Rh2O3?
3. If you were to perform a linear combination fitting (LCF) analysis to quantify the chemical state of Rh in this sample, what standard reference spectra should be included in your fit basis?
Ground Truth
Material: Rh-doped Cu
Measurement: Rh K-edge ex situ XANES at Beamline 7-BM and 8-ID, NSLS II
Fit method: qualitative comparison
Phase fractions: (±10%)
| Phase | Fraction |
|---|---|
| metallic Rh | 1.0 |
Fit basis (paper's reference spectra):
- Rh foil
- Rh2O3
Source evidence: Page 10, text; Fig. 2g
Key reasoning: The normalized XANES spectrum at the Rh K-edge for the Rh-Cu catalyst resembles that of Rh foil, indicating a metallic state. High-resolution XPS also confirms the metallic state, although minor oxidation occurs during ex situ sample transfer.
Reasoning source: Page 8, first paragraph; Page 10, first paragraph
Scoring Rubric (total: 100 pts)
| Q | Type | Max | Question | Reference Answer | Scoring Criteria |
|---|---|---|---|---|---|
| q1 | reasoning | 35 | Based on the sample conditions (Rh-doped Cu, reduced at -0.35 V vs RHE), what is the expected dominant chemical state of Rh, and what physical reasoning justifies this state despite potential ex situ measurement artifacts? | The expected dominant chemical state of Rh in the Rh-doped Cu catalyst is metallic Rh (Rh0) with a fraction of 1.0. This metallic state arises directly from the sample conditions, specifically the electrochemical reduction process which reduces the initial oxidized species. Although minor oxidation can occur during ex situ sample transfer, the bulk of the material remains metallic. This is justified because the applied reducing conditions successfully stabilize the Rh0 state, leading to a XANES spectrum that closely resembles a metallic Rh foil reference. | Full points for identifying metallic Rh (Rh0) as the dominant state and explaining that the applied cathodic potential reduces the Rh species, even if minor oxidation occurs during ex situ transfer. |
| q2 | spectral | 40 | Describe the expected spectral shape of the Rh K-edge XANES for this reduced Rh-Cu catalyst. What distinguishing feature would confirm its successful reduction compared to an oxidized reference like Rh2O3? | The expected spectral shape of the Rh K-edge XANES for the reduced Rh-Cu catalyst closely resembles that of metallic Rh foil, with an edge position visually around 23,220 eV. The primary distinguishing feature confirming successful reduction is the absence of a strong, intense white line peak, which is typically seen in oxidized references like Rh2O3. These spectral features directly result from the electrochemical reduction conditions applied to the sample. Because the reduction process converts the Rh species to a metallic Rh0 state, the electronic structure lacks the unoccupied density of states that would otherwise produce a strong white line in oxidized materials. | Full points for stating the spectrum resembles metallic Rh foil and explicitly mentioning the absence of a strong white line peak that would otherwise be present in oxidized Rh species. |
| q3 | identification | 25 | If you were to perform a linear combination fitting (LCF) analysis to quantify the chemical state of Rh in this sample, what standard reference spectra should be included in your fit basis? | To quantify the chemical state of Rh in this sample, the standard reference spectra included in the fit basis should be Rh foil and Rh2O3. These specific references are required because of the sample's history as an electrochemically reduced catalyst measured under ex situ conditions. The Rh foil reference accounts for the dominant metallic Rh (Rh0) phase that is expected to form as a direct result of the electrochemical reduction process. The Rh2O3 reference must also be included because minor oxidation of the metallic catalyst can occur during ex situ sample transfer, necessitating an oxidized standard to accurately capture any resulting surface oxidation. | Full points for identifying Rh foil (metallic Rh) and Rh2O3 (or a similar Rh3+ oxide) as the necessary reference spectra. |
Review
#974
Rh-doped Cu
Cu K-edge
▶
LLM Prompt
Sample Information
Material: Rh-doped Cu
Reaction Conditions: CO2RR, -0.4 to -0.7 V vs RHE in 1 M KOH
Sample-Specific Conditions
- Applied potential: -0.4 to -0.7 V vs RHE
- Catalyst under CO2 electroreduction conditions
Measurement
We plan to measure the Cu K-edge XANES spectrum of this sample.
Questions
Based on all the information above:
1. Based on the applied reaction conditions (-0.4 to -0.7 V vs RHE during CO2RR), what is the dominant copper phase present in the Rh-doped Cu catalyst, and what is the physical reasoning for this state?
2. Describe the expected spectral shape of the in situ Cu K-edge XANES for this sample. What specific spectral features distinguish the active catalyst from potential oxidized precursor states?
3. To verify the phase purity of the copper matrix under these operando conditions, what standard reference spectra should be included as a basis set for comparison or linear combination fitting?
Ground Truth
Material: Rh-doped Cu
Measurement: In situ Cu K-edge XANES
Fit method: Qualitative comparison
Phase fractions: (±10%)
| Phase | Fraction |
|---|---|
| metallic_copper | 1.0 |
Fit basis (paper's reference spectra):
- Cu foil
- Cu2O
- CuO
Source evidence: Page 10, Figure 2i
Key reasoning: Under the applied cathodic potentials (-0.4 to -0.7 V vs RHE) during CO2RR, the copper matrix is fully reduced and maintains a metallic nature. This is supported by the in situ XANES spectra perfectly matching the metallic Cu reference and lacking any oxide features.
Reasoning source: Page 10, text and Figure 2i
Scoring Rubric (total: 100 pts)
| Q | Type | Max | Question | Reference Answer | Scoring Criteria |
|---|---|---|---|---|---|
| q1 | reasoning | 35 | Based on the applied reaction conditions (-0.4 to -0.7 V vs RHE during CO2RR), what is the dominant copper phase present in the Rh-doped Cu catalyst, and what is the physical reasoning for this state? | The dominant copper phase present in the Rh-doped Cu catalyst is metallic copper (Cu0) with a fraction of 1.0. This state arises because the applied cathodic potentials of -0.4 to -0.7 V vs RHE during the CO2 electroreduction reaction (CO2RR) in 1 M KOH provide a highly reducing environment. Under these specific electrochemical conditions, the copper matrix is fully reduced and maintains a purely metallic nature. As a result, the in situ XANES spectra perfectly match the metallic Cu reference and completely lack any oxide features. | Full points for identifying metallic copper (Cu0) as the sole/dominant phase and explaining that the highly reducing cathodic potentials maintain the copper matrix in a fully reduced, metallic state. |
| q2 | spectral | 40 | Describe the expected spectral shape of the in situ Cu K-edge XANES for this sample. What specific spectral features distinguish the active catalyst from potential oxidized precursor states? | The expected spectral shape of the in situ Cu K-edge XANES for this sample closely resembles the spectrum of metallic Cu foil, exhibiting characteristic metallic edge shape and post-edge oscillations. The active catalyst is distinguished from potential oxidized precursor states by the complete absence of the intense white line peaks typically seen in Cu2O or CuO. These specific spectral features emerge because the applied cathodic potentials (-0.4 to -0.7 V vs RHE) during CO2RR fully reduce the copper matrix to an oxidation state of 0. This continuous reducing environment ensures the catalyst maintains a metallic nature, thereby preventing the formation of any oxide-related spectral features. | Full points for stating the spectrum will closely resemble metallic Cu foil (characteristic edge and post-edge oscillations) and explicitly noting the absence of intense white line peaks that would indicate Cu2O or CuO. |
| q3 | identification | 25 | To verify the phase purity of the copper matrix under these operando conditions, what standard reference spectra should be included as a basis set for comparison or linear combination fitting? | To verify the phase purity of the copper matrix, the standard reference spectra that should be included as a basis set are Cu foil, Cu2O, and CuO. These specific references are required to accurately differentiate between metallic copper and potential oxidized states (Cu1+ and Cu2+). The necessity of this basis set is directly tied to the sample conditions, as the Rh-doped Cu catalyst is subjected to cathodic potentials (-0.4 to -0.7 V vs RHE) during CO2RR. By comparing the operando spectra against these references, it can be confirmed that these reducing conditions successfully maintain the copper matrix as 100% metallic copper, completely eliminating any Cu2O or CuO phases. | Full points for listing metallic Cu foil, Cu2O, and CuO as the necessary reference spectra to rule out the presence of copper oxides. |
Review
Biogas sequestration to carbon nanofibers via tandem catalytic strategies
BNL-NSLS-II-8-ID
Catalyst
Zhenhua Xie et al.
DOI: 10.1038/s44286-025-00182-1
2 scenarios
▶
#975
Co12Kx/CeO2
Co K-edge
▶
LLM Prompt
Sample Information
Material: Co12Kx/CeO2
Support: CeO2
Reaction Conditions: Room temperature
Sample-Specific Conditions
- Catalyst state: Fresh
- Fresh potassium-promoted cobalt catalyst on ceria support
Measurement
We plan to measure the Co K-edge XANES spectrum of this sample.
Questions
Based on all the information above:
1. What is the expected dominant cobalt phase in the fresh Co12Kx/CeO2 catalyst at room temperature prior to any treatment, and what reference spectrum would be most appropriate to confirm this?
2. Explain the physical reasoning for why this specific cobalt phase is present in the fresh catalyst prior to any reaction or reduction.
3. If you were to analyze the XANES spectrum of this fresh sample, what overall spectral shape or feature would you expect to observe based on the paper's findings?
Ground Truth
Material: Co12Kx/CeO2
Measurement: in situ Co K-edge XAS at beamline 7-BM (QAS) at NSLS-II
Fit method: Qualitative comparison
Phase fractions:
| Phase | Fraction |
|---|---|
| Co3O4 | 1.0 |
Fit basis (paper's reference spectra):
- Co foil
- CoO
- Co3O4
Source evidence: Page 8, Figure 3a; Page 15-16, Methods
Key reasoning: The fresh Co12Kx/CeO2 samples initially display a Co3O4 feature in the Co K-edge XANES spectra prior to any reduction treatment, consistent with the calcination step in air during synthesis.
Reasoning source: Page 8, Section 'Structural insights into active sites for enhanced CNF formation'
Scoring Rubric (total: 100 pts)
| Q | Type | Max | Question | Reference Answer | Scoring Criteria |
|---|---|---|---|---|---|
| q1 | identification | 40 | What is the expected dominant cobalt phase in the fresh Co12Kx/CeO2 catalyst at room temperature prior to any treatment, and what reference spectrum would be most appropriate to confirm this? | The expected dominant cobalt phase in the fresh Co12Kx/CeO2 catalyst at room temperature is Co3O4, which accounts for a fraction of 1.0. To confirm this, a Co3O4 reference spectrum is the most appropriate standard, though Co foil and CoO references are also included in the fit basis for comparison. This specific oxidized phase is expected because the catalyst is in its fresh state at room temperature, prior to any reduction treatment. The presence of this Co3O4 phase is a direct result of the calcination step in air during the synthesis of the potassium-promoted cobalt catalyst on the ceria support. | Full points for identifying Co3O4 as the dominant phase (fraction 1.0) and suggesting Co3O4 as the necessary reference spectrum. |
| q2 | reasoning | 40 | Explain the physical reasoning for why this specific cobalt phase is present in the fresh catalyst prior to any reaction or reduction. | The presence of Co3O4 as the sole cobalt phase (fraction of 1.0) in the fresh Co12Kx/CeO2 catalyst is a direct result of the material's synthesis history. Because the sample is measured at room temperature prior to any reduction treatment or reaction, the cobalt remains in its initial oxidized state. This fully oxidized state is consistent with the calcination step in air performed during the preparation of the potassium-promoted catalyst on the ceria support. Therefore, without exposure to a reducing environment to alter its oxidation state, the cobalt naturally persists entirely as the Co3O4 phase. | Full points for explaining that the catalyst is in its as-synthesized state (calcined in air), which naturally results in the oxidized Co3O4 phase before any reduction treatment occurs. |
| q3 | spectral | 20 | If you were to analyze the XANES spectrum of this fresh sample, what overall spectral shape or feature would you expect to observe based on the paper's findings? | When analyzing the Co K-edge XANES spectrum of this fresh sample, you would expect to observe a characteristic Co3O4 spectral feature. The overall spectral shape will qualitatively match that of a Co3O4 reference standard, representing a Co3O4 fraction of 1.0. These specific spectral features arise because the sample is in a fresh, unreduced state at room temperature following a calcination step in air during synthesis. Consequently, the electronic and structural properties of the sample reflect a fully oxidized Co3O4 phase, lacking any spectral signatures of reduced species like CoO or metallic Co foil. | Full points for stating that the spectrum displays a characteristic Co3O4 feature. |
Review
#976
Co12Kx/CeO2
Co K-edge
▶
LLM Prompt
Sample Information
Material: Co12Kx/CeO2
Support: CeO2
Reaction Conditions: 500 °C in H2
Sample-Specific Conditions
- Catalyst state: Reduced
- Reduced potassium-promoted cobalt catalyst on ceria support
Measurement
We plan to measure the Co K-edge XANES spectrum of this sample.
Questions
Based on all the information above:
1. What is the expected dominant cobalt phase for the Co12Kx/CeO2 catalyst after reduction in H2 at 500 °C, and what is the physical reasoning for this state based on the reduction pathway?
2. To verify the phase composition of this reduced sample using XANES, what candidate reference spectra should be included in the basis set to confirm complete reduction and rule out intermediate states?
3. How would the Co K-edge XANES spectrum of this sample reduced at 500 °C visually compare to the initial unreduced catalyst, and what distinguishing features indicate complete reduction?
Ground Truth
Material: Co12Kx/CeO2
Measurement: in situ Co K-edge XANES
Fit method: Qualitative comparison to reference standards
Phase fractions:
| Phase | Fraction |
|---|---|
| metallic Co | 1.0 |
Fit basis (paper's reference spectra):
- Co foil
- CoO
- Co3O4
Source evidence: Page 11, text: 'The Co K-edge XANES spectra reveal the complete reduction of Co at 500 °C (Fig. 3d)'
Key reasoning: Under H2 atmosphere, the initial Co3O4 phase undergoes sequential reduction to CoO and eventually to metallic Co. The full-reduction temperature varies with K loading (ranging from 265 °C to 345 °C), but by 500 °C, all Co12Kx/CeO2 samples are completely reduced to metallic Co.
Reasoning source: Page 10, Section 'Structural insights into active sites for enhanced CNF formation'
Scoring Rubric (total: 100 pts)
| Q | Type | Max | Question | Reference Answer | Scoring Criteria |
|---|---|---|---|---|---|
| q1 | reasoning | 40 | What is the expected dominant cobalt phase for the Co12Kx/CeO2 catalyst after reduction in H2 at 500 °C, and what is the physical reasoning for this state based on the reduction pathway? | The expected dominant cobalt phase for the Co12Kx/CeO2 catalyst after reduction at 500 °C in H2 is 100% metallic Co, consisting of coexisting fcc and hcp phases. This final state arises because, under the H2 atmosphere, the initial Co3O4 phase undergoes a sequential reduction pathway first to CoO and eventually to metallic Co. While the exact temperature required for full reduction varies between 265 °C and 345 °C depending on the potassium (K) loading, the applied condition of 500 °C is well above this threshold. Therefore, the thermal energy and reducing environment at 500 °C ensure that all intermediate oxides are completely reduced to metallic cobalt. | Full credit for identifying metallic Co (100% or complete reduction) and explaining the sequential reduction from Co3O4 to CoO to metallic Co under H2, which completes well below 500 °C. |
| q2 | identification | 30 | To verify the phase composition of this reduced sample using XANES, what candidate reference spectra should be included in the basis set to confirm complete reduction and rule out intermediate states? | To verify the phase composition of the reduced Co12Kx/CeO2 sample, the XANES basis set should include Co foil, CoO, and Co3O4 reference spectra. These specific references are required because the catalyst undergoes a sequential reduction in H2 from an initial Co3O4 phase, through a CoO intermediate, and finally to metallic Co. By including these three standards, one can qualitatively compare the sample spectrum to confirm the complete absence of oxide features (Co3O4 and CoO). Since the sample is reduced at 500 °C—a temperature well above the full-reduction threshold of 265–345 °C for all K loadings—using this basis set will confirm that the final state is entirely metallic Co. | Full credit for listing metallic Co (Co foil), CoO, and Co3O4 as the necessary reference standards. |
| q3 | spectral | 30 | How would the Co K-edge XANES spectrum of this sample reduced at 500 °C visually compare to the initial unreduced catalyst, and what distinguishing features indicate complete reduction? | The Co K-edge XANES spectrum of the sample reduced at 500 °C will completely match the metallic Co reference spectrum, aligning with the Co K-edge at 7709 eV. Visually, it will be distinguished from the initial unreduced catalyst by the complete absence of oxide features associated with Co3O4 and CoO. These spectral features result directly from the sample conditions, as the H2 atmosphere at 500 °C drives a complete sequential reduction from Co3O4 to CoO and finally to metallic Co. Because 500 °C exceeds the maximum full-reduction temperature (345 °C) regardless of the potassium loading, the spectrum reflects a fully reduced metallic Co state with no remaining oxidized species. | Full credit for stating the spectrum will match metallic Co (Co foil) and noting the complete absence of oxide features (such as the initial Co3O4 features) that were present in the unreduced state. |
Review
High-throughput computational X-ray absorption spectroscopy
BNL-NSLS-II-8-ID
Pure Phase
Kiran Mathew et al.
DOI: 10.1038/sdata.2018.151
6 scenarios
▶
#977
LiCoO2
Co K-edge
▶
LLM Prompt
Sample Information
Material: LiCoO2
Crystal Structure: R-3m
- Experimental and FEFF9 computed Co K-edge XANES spectrum of LiCoO2
Measurement
We plan to measure the Co K-edge XANES spectrum of this sample.
Questions
Based on all the information above:
1. Describe the expected spectral shape and the approximate energy positions of the main features for the Co K-edge XANES spectrum of LiCoO2.
2. What specific crystal structure of LiCoO2 is associated with this Co K-edge XANES spectrum?
3. Based on the spectral profile of this compound, at approximately what energy does the main absorption edge begin its steep rise?
Ground Truth
Compound: LiCoO2
Oxidation state: not reported
Measurement: Co K-edge XANES
Edge position: ~7720 eV
Spectral shape: The spectrum exhibits a sharp absorption edge rising steeply around 7720 eV, leading to a prominent and sharp main peak near 7730 eV. This is followed by a broader, lower-intensity secondary peak/feature centered around 7740-7745 eV.
Labeled peaks:
| Label | Energy (eV) | Intensity | Origin | Source |
|---|---|---|---|---|
| Main peak | ~7730 eV | ~1.0 (unshifted experimental) | not discussed in this paper | paper_data |
| Secondary broad peak | ~7740-7745 eV | ~0.7 (unshifted experimental) | not discussed in this paper | paper_data |
Distinguishing features: not discussed in this paper
Key reasoning: The sample is a pure phase of LiCoO2 with an R-3m crystal structure. The Co K-edge XANES spectrum exhibits a sharp main absorption peak near 7730 eV and a broader secondary feature around 7740-7745 eV, which are characteristic of this specific structural phase.
Reasoning source: Figure 4a and Technical Validation section
Scoring Rubric (total: 100 pts)
| Q | Type | Max | Question | Reference Answer | Scoring Criteria |
|---|---|---|---|---|---|
| q1 | spectral | 40 | Describe the expected spectral shape and the approximate energy positions of the main features for the Co K-edge XANES spectrum of LiCoO2. | The expected Co K-edge XANES spectrum of LiCoO2 exhibits a sharp absorption edge rising steeply around 7720 eV. This rise leads to a prominent, sharp main absorption peak near 7730 eV with an intensity of ~1.0, followed by a broader, lower-intensity secondary feature centered around 7740-7745 eV with an intensity of ~0.7. These specific spectral features arise because the sample is a pure phase of LiCoO2 crystallizing in the R-3m crystal structure, which dictates the local electronic and structural environment that produces these characteristic peaks. | Full points if the response identifies the sharp main peak near 7730 eV and the broader secondary feature around 7740-7745 eV. |
| q2 | identification | 30 | What specific crystal structure of LiCoO2 is associated with this Co K-edge XANES spectrum? | This Co K-edge XANES spectrum is associated with the R-3m crystal structure of LiCoO2. This specific phase is expected because the sample conditions dictate a pure phase of LiCoO2 (fraction 1.0) with this exact R-3m symmetry. Consequently, the measured spectrum exclusively reflects this structural phase, producing its characteristic sharp main absorption peak near 7730 eV and a broader secondary feature around 7740-7745 eV. | Full points if the response correctly identifies the R-3m crystal structure. |
| q3 | spectral | 30 | Based on the spectral profile of this compound, at approximately what energy does the main absorption edge begin its steep rise? | Based on the spectral profile of this compound, the main absorption edge begins its steep rise at approximately 7720 eV. This specific edge position occurs because the sample consists of a pure phase of LiCoO2 in the R-3m crystal structure. The unique local coordination and electronic environment of this R-3m phase dictate the energy required for core electron excitation, resulting in this steep onset at ~7720 eV before reaching the characteristic main peak near 7730 eV. | Full points if the response states the edge rises steeply around 7720 eV. |
Review
#978
LiNiO2
Ni K-edge
▶
LLM Prompt
Sample Information
Material: LiNiO2
Crystal Structure: R-3m
- Experimental and FEFF9 computed Ni K-edge XANES spectrum of LiNiO2
Measurement
We plan to measure the Ni K-edge XANES spectrum of this sample.
Questions
Based on all the information above:
1. Describe the expected spectral shape and main features of the experimental Ni K-edge XANES spectrum for LiNiO2 (R-3m).
2. When comparing theoretically computed XANES spectra to experimental data for compounds like LiNiO2, what systematic difference is typically observed regarding the energy axis?
3. What specific chemical and local structural properties of the absorbing atom can be identified using the XANES spectrum of a material like LiNiO2?
Ground Truth
Compound: LiNiO2
Oxidation state: not reported
Measurement: Ni K-edge XANES
Edge position: not reported
Spectral shape: The experimental Ni K-edge XANES spectrum of LiNiO2 (R-3m) exhibits a sharp main absorption peak near 8351 eV, followed by a minimum near 8360 eV and a broader secondary peak around 8368 eV. The computed spectrum reproduces this shape well but is shifted in energy.
Labeled peaks:
| Label | Energy (eV) | Intensity | Origin | Source |
|---|---|---|---|---|
| Main peak | ~8351 | ~1.0 (arb. units, experimental) | not discussed in this paper | paper_data |
| Post-edge peak | ~8368 | ~0.6 (arb. units, experimental) | not discussed in this paper | paper_data |
Distinguishing features: not discussed in this paper
Key reasoning: LiNiO2 was utilized as a benchmark compound to validate computed XANES spectra against experimental references. The computed spectra match the experimental ones up to a constant shift in energy. XANES provides structural fingerprints useful for identifying the oxidation state and coordination chemistry of the absorbing atom.
Reasoning source: Page 5 (Technical Validation) and Page 7 (Usage Notes)
Scoring Rubric (total: 100 pts)
| Q | Type | Max | Question | Reference Answer | Scoring Criteria |
|---|---|---|---|---|---|
| q1 | spectral | 40 | Describe the expected spectral shape and main features of the experimental Ni K-edge XANES spectrum for LiNiO2 (R-3m). | The experimental Ni K-edge XANES spectrum of LiNiO2 (R-3m) features a sharp main absorption peak near 8351 eV (intensity ~1.0) and a broader post-edge secondary peak around 8368 eV (intensity ~0.6), separated by a minimum near 8360 eV. These specific spectral features arise because the sample consists of a pure LiNiO2 phase (fraction 1.0) with an R-3m crystal structure. As a benchmark compound, this pure phase provides a distinct structural fingerprint that reflects the specific oxidation state and coordination chemistry of the absorbing Ni atom in this lattice. | Full credit for mentioning the sharp main absorption peak (white line) near 8351 eV and the broader secondary post-edge peak around 8368 eV. |
| q2 | reasoning | 30 | When comparing theoretically computed XANES spectra to experimental data for compounds like LiNiO2, what systematic difference is typically observed regarding the energy axis? | When comparing FEFF9 computed XANES spectra to experimental data for LiNiO2, the computed spectra match the experimental shape well but exhibit a constant shift in energy. This systematic difference is observed because LiNiO2 is utilized as a benchmark compound to validate theoretical calculations against experimental references. While the pure LiNiO2 (fraction 1.0) R-3m crystal structure dictates the overall spectral shape and structural fingerprint, the theoretical modeling inherently produces this constant energy offset relative to the true experimental energy axis. | Full credit for stating that the computed spectra match the experimental ones up to a constant shift in energy. |
| q3 | reasoning | 30 | What specific chemical and local structural properties of the absorbing atom can be identified using the XANES spectrum of a material like LiNiO2? | The XANES spectrum of a material like LiNiO2 can be used to identify the oxidation state and the coordination chemistry of the absorbing Ni atom. These properties can be extracted because the XANES spectrum acts as a highly specific structural fingerprint for the pure LiNiO2 (fraction 1.0) R-3m crystal structure. By serving as a benchmark compound, the distinct spectral shape—including the main peak at ~8351 eV and post-edge peak at ~8368 eV—directly reflects the local electronic and structural environment of the absorbing atom under these specific sample conditions. | Full credit for identifying that XANES provides structural fingerprints useful for identifying the oxidation state and coordination chemistry of the absorbing atom. |
Review
#979
NaCl
Na K-edge
▶
LLM Prompt
Sample Information
Material: NaCl
Crystal Structure: Fm-3m
- Experimental and FEFF9 computed Na K-edge XANES spectrum of NaCl
Measurement
We plan to measure the Na K-edge XANES spectrum of this sample.
Questions
Based on all the information above:
1. Describe the expected spectral shape and approximate peak positions for the experimental Na K-edge XANES spectrum of NaCl.
2. When comparing theoretically computed XANES spectra to experimental data for NaCl, what is the primary discrepancy typically observed in the spectral features?
3. What is the expected dominant phase and its crystal structure for this sample?
Ground Truth
Compound: NaCl
Oxidation state: not reported
Measurement: Na K-edge XANES
Edge position: not reported
Spectral shape: The Na K-edge XANES spectrum of NaCl features a sharp main peak around 1075 eV, a distinct second peak near 1080 eV, and broader post-edge oscillations at higher energies (e.g., ~1090 eV and ~1100 eV). Computed spectra match this shape but with a constant energy shift.
Labeled peaks:
| Label | Energy (eV) | Intensity | Origin | Source |
|---|---|---|---|---|
| Main peak | ~1075 | high (sharp) | not discussed in this paper | paper_data |
| Second peak | ~1080 | moderate | not discussed in this paper | paper_data |
| Post-edge oscillation | ~1090 | broad/low | not discussed in this paper | paper_data |
Distinguishing features: not discussed in this paper
Key reasoning: The sample is a pure phase of NaCl with an Fm-3m crystal structure. Comparison between experimental and computed Na K-edge XANES spectra shows that the spectral shape and features are well-reproduced, though there is a constant shift in energy between the theoretical and experimental data.
Reasoning source: Page 7, text referencing Figure 4
Scoring Rubric (total: 100 pts)
| Q | Type | Max | Question | Reference Answer | Scoring Criteria |
|---|---|---|---|---|---|
| q1 | spectral | 40 | Describe the expected spectral shape and approximate peak positions for the experimental Na K-edge XANES spectrum of NaCl. | The expected Na K-edge XANES spectrum for NaCl features a sharp main peak at approximately 1075 eV, a distinct second peak near 1080 eV, and broader post-edge oscillations at higher energies such as ~1090 eV and ~1100 eV. These specific spectral features arise directly from the sample conditions, which consist of a pure phase of NaCl crystallizing in the Fm-3m structure. The uniform local atomic environment of this Fm-3m crystal lattice dictates the specific electronic transitions and scattering events that produce this distinct sequence of sharp peaks and broad oscillations. Furthermore, FEFF9 computations based on this exact pure-phase structure successfully reproduce this overall spectral shape. | Full points if the answer mentions the sharp white line near 1075 eV, a second peak near 1080 eV, and broader post-edge oscillations (e.g., around 1090 eV). |
| q2 | reasoning | 30 | When comparing theoretically computed XANES spectra to experimental data for NaCl, what is the primary discrepancy typically observed in the spectral features? | When comparing the FEFF9 computed Na K-edge XANES spectrum to the experimental data for NaCl, the primary discrepancy observed is a constant shift in energy between the theoretical and experimental spectra. Despite this energy offset, the overall spectral shape and features are well-reproduced by the calculations. This occurs because the sample is a pure phase of NaCl with a well-defined Fm-3m crystal structure, allowing the theoretical model to accurately capture the structural scattering pathways. Therefore, the discrepancy is strictly a systematic energy offset inherent to the computational modeling of this specific Fm-3m lattice, rather than a failure to capture the fundamental structural features of the pure material. | Full points if the answer correctly identifies that the computed spectra match the experimental shape but exhibit a constant shift in energy. |
| q3 | identification | 30 | What is the expected dominant phase and its crystal structure for this sample? | The expected dominant phase for this sample is 100% pure NaCl, which possesses an Fm-3m crystal structure. This pure phase is expected because the provided sample conditions specify an unadulterated NaCl material without any secondary components, dopants, or complex treatments. Because the sample is a pure phase, the resulting Na K-edge XANES spectrum exclusively reflects the uniform Fm-3m crystal lattice of sodium chloride. The presence of this single, pure structural phase is further validated by the fact that FEFF9 computations based solely on the Fm-3m structure successfully reproduce the experimental spectral shape and features. | Full points if the answer identifies NaCl as the pure phase (fraction 1.0) and specifies the Fm-3m crystal structure. |
Review
#980
V2O5
V K-edge
▶
LLM Prompt
Sample Information
Material: V2O5
Crystal Structure: Pmmn
- Experimental and FEFF9 computed V K-edge XANES spectrum of V2O5
Measurement
We plan to measure the V K-edge XANES spectrum of this sample.
Questions
Based on all the information above:
1. Describe the expected spectral shape of the V K-edge XANES for pure phase V2O5, particularly focusing on the pre-edge region.
2. What distinguishing spectral feature in the V K-edge XANES spectrum can be used to differentiate V2O5 from other vanadium oxides like VO2 and V2O3?
3. Based on the provided data, at approximately what energy does the prominent first peak of the V2O5 K-edge XANES spectrum occur?
Ground Truth
Compound: V2O5
Oxidation state: not reported
Measurement: V K-edge XANES
Edge position: not reported
Spectral shape: The spectrum features a very strong, sharp first peak around 5470 eV, followed by a broader main absorption edge structure peaking around 5485-5490 eV. The computed spectrum matches the experimental one up to a constant energy shift.
Labeled peaks:
| Label | Energy (eV) | Intensity | Origin | Source |
|---|---|---|---|---|
| first peak | ~5470 eV | strong | not discussed in this paper | paper_data |
Distinguishing features: Shows a strong change in first peak intensity compared to other vanadium oxides (VO2, V2O3), with V2O5 having a highly prominent first peak.
Key reasoning: The experimental V K-edge XANES spectrum of V2O5 (Pmmn) is compared to the computed spectrum to validate the structural fingerprint. The spectrum exhibits a very strong first peak intensity, which is highlighted as a distinguishing feature that changes strongly among different vanadium oxides (V2O5, VO2, V2O3).
Reasoning source: Page 7, Technical Validation section and Figure 4d
Scoring Rubric (total: 100 pts)
| Q | Type | Max | Question | Reference Answer | Scoring Criteria |
|---|---|---|---|---|---|
| q1 | spectral | 40 | Describe the expected spectral shape of the V K-edge XANES for pure phase V2O5, particularly focusing on the pre-edge region. | The expected V K-edge XANES spectrum for pure phase V2O5 features a very strong, sharp first peak located at approximately 5470 eV. This initial peak is followed by a broader main absorption edge structure that reaches its maximum around 5485-5490 eV. These specific spectral features arise directly from the pure V2O5 composition and its Pmmn crystal structure, which dictate the material's unique structural fingerprint. The observed spectral shape is a direct consequence of this specific structural environment, as confirmed by FEFF9 computational modeling which matches the experimental data up to a constant energy shift. | Full credit for mentioning the strong, sharp first peak (pre-edge) around 5470 eV and the broader main edge structure peaking around 5485-5490 eV. |
| q2 | identification | 30 | What distinguishing spectral feature in the V K-edge XANES spectrum can be used to differentiate V2O5 from other vanadium oxides like VO2 and V2O3? | The primary distinguishing feature used to differentiate V2O5 from other vanadium oxides, such as VO2 and V2O3, is the intensity of its first peak. In the V K-edge XANES spectrum of pure V2O5, this first peak is highly prominent and exhibits a very strong intensity. This distinct spectral signature arises because the XANES spectrum acts as a structural fingerprint that is highly sensitive to the specific Pmmn crystal structure of the V2O5 sample. Consequently, the unique atomic arrangement of the pure V2O5 phase produces this strong first peak intensity, allowing it to be clearly distinguished from the structural fingerprints of other vanadium oxides. | Full credit for identifying the strong change/prominence in the first peak (pre-edge) intensity compared to the other vanadium oxides. |
| q3 | spectral | 30 | Based on the provided data, at approximately what energy does the prominent first peak of the V2O5 K-edge XANES spectrum occur? | Based on the provided data, the prominent first peak of the V2O5 K-edge XANES spectrum occurs at approximately 5470 eV. This specific energy position and the peak's strong intensity are direct manifestations of the pure V2O5 composition and its specific Pmmn crystal structure. Because the XANES spectrum serves as a structural fingerprint for the material, the unique atomic arrangement of this V2O5 phase dictates the exact energy and prominence of this spectral feature. The experimental observation of this peak at ~5470 eV is further validated by FEFF9 computational modeling of the V2O5 structure. | Full credit for stating approximately 5470 eV. |
Review
#981
VO2
V K-edge
▶
LLM Prompt
Sample Information
Material: VO2
Crystal Structure: P2_1/c
- Experimental and FEFF9 computed V K-edge XANES spectrum of VO2
Measurement
We plan to measure the V K-edge XANES spectrum of this sample.
Questions
Based on all the information above:
1. Describe the expected distinguishing spectral feature of the V K-edge XANES spectrum for VO2 when compared to other vanadium oxides.
2. What specific crystal structure of VO2 is associated with the described V K-edge XANES spectrum?
Ground Truth
Compound: VO2
Oxidation state: not reported
Measurement: V K-edge XANES
Edge position: not reported
Spectral shape: The spectrum features a distinct first peak and a main absorption edge. The overall shape of the computed spectrum matches the experimental data up to a constant shift in energy.
Distinguishing features: A strong change in the first peak intensity compared to other vanadium oxides (such as V2O5 and V2O3).
Key reasoning: The V K-edge XANES spectrum of VO2 (P2_1/c crystal structure) is evaluated as a pure phase. A key observation among the vanadium oxides (VO2, V2O3, V2O5) is a strong change in their first peak intensity, which serves as a distinguishing feature between these phases.
Reasoning source: Technical Validation section, pages 5 and 7
Scoring Rubric (total: 100 pts)
| Q | Type | Max | Question | Reference Answer | Scoring Criteria |
|---|---|---|---|---|---|
| q1 | spectral | 57 | Describe the expected distinguishing spectral feature of the V K-edge XANES spectrum for VO2 when compared to other vanadium oxides. | The expected distinguishing spectral feature of the V K-edge XANES spectrum for VO2 is a strong change in the intensity of its first peak when compared to other vanadium oxides like V2O3 and V2O5. Additionally, the spectrum exhibits a main absorption edge where the FEFF9 computed shape matches the experimental data up to a constant energy shift. These specific spectral features arise directly from the sample being a pure VO2 phase with a P2_1/c crystal structure. The unique local coordination and electronic environment of the P2_1/c structure dictate the specific transition probabilities, producing a first peak intensity that uniquely identifies it against the structural environments of other vanadium oxide phases. | The answer must identify the intensity of the first peak (pre-edge peak) as the key distinguishing feature that shows a strong change among the vanadium oxides. |
| q2 | identification | 43 | What specific crystal structure of VO2 is associated with the described V K-edge XANES spectrum? | The described V K-edge XANES spectrum is associated with the pure P2_1/c crystal structure of VO2. This specific phase identification is expected because the sample conditions explicitly define the material as a pure VO2 phase (1.0 fraction) crystallizing in the P2_1/c space group. Consequently, the experimental and FEFF9 computed XANES measurements exclusively probe the local atomic geometry and electronic environment of this specific lattice. It is this exact P2_1/c structural arrangement that governs the distinct first peak intensity, allowing the pure VO2 phase to be distinguished from other vanadium oxides like V2O3 and V2O5. | The answer must correctly identify the P2_1/c crystal structure. |
Review
#982
V2O3
V K-edge
▶
LLM Prompt
Sample Information
Material: V2O3
Crystal Structure: R-3c
- Experimental and FEFF9 computed V K-edge XANES spectrum of V2O3
Measurement
We plan to measure the V K-edge XANES spectrum of this sample.
Questions
Based on all the information above:
1. What is the expected crystal structure of the pure V2O3 phase analyzed at the V K-edge in this context?
2. Describe the distinguishing spectral feature of V2O3 at the V K-edge when compared to other vanadium oxides (e.g., V2O5 and VO2).
3. When comparing the experimental V K-edge XANES spectrum of V2O3 to theoretically computed spectra, what general spectral shape agreement and specific discrepancy is expected?
Ground Truth
Compound: V2O3
Oxidation state: not reported
Measurement: V K-edge XANES
Edge position: not reported
Spectral shape: The spectrum exhibits a first peak and a main absorption edge. Theoretical computations of this spectrum match the experimental shape reasonably well but exhibit a constant shift in energy.
Distinguishing features: Shows a strong change in the first peak intensity compared to other vanadium oxides (such as V2O5 and VO2).
Key reasoning: The paper evaluates the V K-edge XANES spectrum of the V2O3 phase with an R-3c crystal structure. When comparing the experimental spectrum to the computed one, there is reasonably good agreement, though the computed spectrum matches the experimental one only up to a constant shift in energy. Among the vanadium oxides evaluated (V2O5, VO2, V2O3), a strong change in their first peak intensity is observed.
Reasoning source: Technical Validation section, page 7
Scoring Rubric (total: 100 pts)
| Q | Type | Max | Question | Reference Answer | Scoring Criteria |
|---|---|---|---|---|---|
| q1 | identification | 30 | What is the expected crystal structure of the pure V2O3 phase analyzed at the V K-edge in this context? | The expected crystal structure of the pure V2O3 phase analyzed at the V K-edge is R-3c. This specific structure arises directly from the sample conditions, which consist of a pure V2O3 material with a phase fraction of 1.0. Because the sample is a pure phase, the resulting XANES spectrum exclusively reflects the local atomic environment and electronic properties inherent to this specific R-3c structural arrangement. | Full points for identifying the R-3c crystal structure. |
| q2 | spectral | 40 | Describe the distinguishing spectral feature of V2O3 at the V K-edge when compared to other vanadium oxides (e.g., V2O5 and VO2). | The distinguishing spectral feature of V2O3 at the V K-edge is a strong change in the intensity of its first peak when compared to other vanadium oxides such as V2O5 and VO2. This distinct feature arises directly from the sample conditions, specifically its pure V2O3 composition and R-3c crystal structure. The unique local atomic coordination and electronic environment of this R-3c phase dictate the specific transition probabilities at the absorption edge, thereby producing this characteristic first peak intensity. | Full points for mentioning the strong change or difference in the first peak intensity compared to the other vanadium oxides. |
| q3 | spectral | 30 | When comparing the experimental V K-edge XANES spectrum of V2O3 to theoretically computed spectra, what general spectral shape agreement and specific discrepancy is expected? | When comparing the experimental V K-edge XANES spectrum of V2O3 to theoretically computed FEFF9 spectra, there is reasonably good agreement in the overall spectral shape, including the first peak and main absorption edge. However, a specific discrepancy is expected where the computed spectrum matches the experimental one only up to a constant shift in energy. This occurs because the theoretical computations are based on the R-3c crystal structure of the V2O3 sample; while the structural model accurately captures the local atomic geometry to reproduce the spectral shape, inherent limitations in computationally modeling the electronic transitions for this specific phase cause the constant energy offset. | Full points for noting that the overall shape shows reasonably good agreement, but the computed spectrum exhibits a constant shift in energy relative to the experimental data. |
Review
Composition-driven Cu-speciation and reducibility in Cu-CHA zeolite catalysts: a multivariate XAS/FTIR approach to complexity
BNL-NSLS-II-8-ID
Catalyst
A. Martini et al.
DOI: 10.1039/C7SC02266B
3 scenarios
▶
#983
Cu-CHA
Cu K-edge
▶
LLM Prompt
Sample Information
Material: Cu-CHA
Support: CHA zeolite
Reaction Conditions: 25 °C, He flow
Sample-Specific Conditions
- Temperature: 25 °C
- Cu-CHA catalyst at the beginning of He-activation
Measurement
We plan to measure the Cu K-edge XANES spectrum of this sample.
Questions
Based on all the information above:
1. Based on the reaction conditions (25 °C, beginning of He-activation), what are the expected candidate phases for the Cu speciation in this Cu-CHA catalyst, and what are their estimated fractions?
2. Explain the physical reasoning for why mobile Cu(II)-aquo-complexes dominate the speciation over framework-interacting sites at this specific stage of the treatment.
3. What reference spectra or principal components (basis functions) would be necessary to accurately model the XANES spectrum of this sample using Linear Combination Fitting?
Ground Truth
Material: Cu-CHA
Measurement: Cu K-edge in-situ XANES
Fit method: Principal Component Analysis (PCA) / Linear Combination Fitting
Phase fractions: (±10%)
| Phase | Fraction |
|---|---|
| mobile Cu(II)-aquo-complexes (PC1) | 0.6 |
| framework-interacting Cu(II) and Cu(I) sites | 0.05 |
Fit basis (paper's reference spectra):
- mobile Cu(II)-aquo-complexes (PC1)
- framework-interacting Cu(II) sites
- framework-interacting Cu(I) sites
Source evidence: Sample conditions and phase fractions provided in the text
Key reasoning: At 25 °C at the beginning of He-activation, the Cu-CHA catalyst is predominantly hydrated. The majority of copper exists as mobile Cu(II)-aquo-complexes (PC1) within the zeolite pores, accounting for 60% of the species. Only a very small fraction (5%) consists of framework-interacting Cu(II) and Cu(I) sites, indicating that most Cu ions have not yet dehydrated and anchored to the zeolite framework.
Reasoning source: Sample description and phase fractions context
Scoring Rubric (total: 100 pts)
| Q | Type | Max | Question | Reference Answer | Scoring Criteria |
|---|---|---|---|---|---|
| q1 | quantification | 40 | Based on the reaction conditions (25 °C, beginning of He-activation), what are the expected candidate phases for the Cu speciation in this Cu-CHA catalyst, and what are their estimated fractions? | The expected candidate phases for the Cu speciation in this Cu-CHA catalyst are mobile Cu(II)-aquo-complexes (PC1) and framework-interacting Cu(II) and Cu(I) sites. The estimated fractions are 60% for the mobile Cu(II)-aquo-complexes and 5% for the combined framework-interacting sites, with an uncertainty of 10%. These specific fractions arise because, at 25 °C at the beginning of He-activation, the catalyst is predominantly hydrated. The low temperature means the Cu ions have not yet dehydrated and anchored to the zeolite framework, leaving the majority of copper as mobile complexes within the pores. | Award 20 points for identifying mobile Cu(II)-aquo-complexes as the dominant phase and framework-interacting Cu sites as a minor phase. Award 20 points for estimating the fractions at approximately 60% for the aquo-complexes and ~5% for the framework-interacting sites. |
| q2 | reasoning | 30 | Explain the physical reasoning for why mobile Cu(II)-aquo-complexes dominate the speciation over framework-interacting sites at this specific stage of the treatment. | At 25 °C at the beginning of He-activation, the Cu-CHA catalyst is predominantly hydrated. Because the sample has not yet been subjected to higher temperatures to drive off water, the copper ions have not dehydrated. As a result, the copper cannot anchor to the zeolite framework, restricting framework-interacting Cu(II) and Cu(I) sites to a mere 5%. Instead, this hydrated state dictates that the majority of the copper (60%) exists as mobile Cu(II)-aquo-complexes (PC1) moving within the zeolite pores. | Award full points for explaining that at ambient temperature (25 °C) before significant dehydration has occurred (beginning of He-activation), the Cu ions remain fully hydrated and mobile within the zeolite pores rather than anchoring to the framework. |
| q3 | identification | 30 | What reference spectra or principal components (basis functions) would be necessary to accurately model the XANES spectrum of this sample using Linear Combination Fitting? | To accurately model the XANES spectrum of this sample using Linear Combination Fitting, the necessary basis functions are mobile Cu(II)-aquo-complexes (PC1), framework-interacting Cu(II) sites, and framework-interacting Cu(I) sites. These specific principal components are expected because the sample conditions (25 °C, beginning of He-activation) dictate a predominantly hydrated state. Due to the low temperature, most Cu ions have not yet dehydrated and anchored to the zeolite framework, making the mobile Cu(II)-aquo-complexes the dominant structural feature. The framework-interacting Cu(II) and Cu(I) references are required to account for the small 5% fraction of copper that has managed to interact with the support. | Award full points for listing mobile Cu(II)-aquo-complexes (or fully hydrated Cu(II) species) and framework-interacting Cu(II)/Cu(I) sites as the necessary basis functions. |
Review
#984
Cu-CHA
Cu K-edge
▶
LLM Prompt
Sample Information
Material: Cu-CHA
Support: CHA zeolite
Reaction Conditions: 400 °C, He flow
Sample-Specific Conditions
- Si/Al ratio: 5
- Cu-CHA catalyst after He-activation
Measurement
We plan to measure the Cu K-edge XANES spectrum of this sample.
Questions
Based on all the information above:
1. Based on the sample conditions (Cu-CHA, Si/Al = 5, He-activation at 400 °C), what is the estimated fraction of bare Z2Cu(II) sites remaining in the catalyst?
2. Explain the physical reasoning for why a significant fraction of Cu remains as Cu(II) in this specific sample at 400 °C in He, rather than fully auto-reducing to Cu(I). How does the Si/Al ratio influence this?
3. If you were to model the in-situ XANES data for this sample during the full He-activation process using Linear Combination Fitting or MCR-ALS, what distinct pure components (basis spectra) would be necessary to capture the structural transformations?
Ground Truth
Material: Cu-CHA
Measurement: Cu K-edge in-situ XANES
Fit method: MCR-ALS (Multivariate Curve Resolution - Alternating Least Squares) / LCF
Phase fractions: (±10%)
| Phase | Fraction |
|---|---|
| 2Al Z2Cu(II) sites (PC4) | 0.5 |
Fit basis (paper's reference spectra):
- Hydrated Cu(II) (PC1)
- Bare Cu(I) (PC2)
- ZCu(II)OH (PC3)
- 2Al Z2Cu(II) sites (PC4)
- CuOx clusters (PC5)
Source evidence: Text and MCR-ALS concentration profiles for Si/Al=5 during He-activation
Key reasoning: At a low Si/Al ratio of 5, the zeolite framework contains a high density of paired Al sites, which strongly favors the formation of Z2Cu(II) species located in the 6-membered rings. During He-activation up to 400 °C, ZCu(II)OH species (associated with single Al sites) undergo auto-reduction to Cu(I). In contrast, the Z2Cu(II) sites are highly stable and resist auto-reduction, leaving approximately 50% of the copper as bare Cu(II) at 400 °C.
Reasoning source: Results and Discussion - Cu speciation and reducibility during He-activation
Scoring Rubric (total: 100 pts)
| Q | Type | Max | Question | Reference Answer | Scoring Criteria |
|---|---|---|---|---|---|
| q1 | quantification | 30 | Based on the sample conditions (Cu-CHA, Si/Al = 5, He-activation at 400 °C), what is the estimated fraction of bare Z2Cu(II) sites remaining in the catalyst? | The estimated fraction of bare 2Al Z2Cu(II) sites remaining in the catalyst is 0.5 (or 50%), with an uncertainty of 10%. This specific value results from the sample's low Si/Al ratio of 5, which provides a high density of paired Al sites in the zeolite framework that strongly favor the formation of Z2Cu(II) species. During the He-activation process up to 400 °C, these Z2Cu(II) sites located in the 6-membered rings are highly stable and resist auto-reduction. Consequently, while other species auto-reduce, approximately half of the copper remains stabilized as bare Cu(II) at this temperature. | Full credit for estimating the fraction of Z2Cu(II) sites (or bare Cu(II) in 6-membered rings) at approximately 0.5 (or 50%). |
| q2 | reasoning | 40 | Explain the physical reasoning for why a significant fraction of Cu remains as Cu(II) in this specific sample at 400 °C in He, rather than fully auto-reducing to Cu(I). How does the Si/Al ratio influence this? | A significant fraction of copper remains as Cu(II) at 400 °C in He because the Z2Cu(II) sites are highly stable and resist the auto-reduction process. The Si/Al ratio directly dictates this behavior; at a low Si/Al ratio of 5, the zeolite framework contains a high density of paired Al sites. These paired sites strongly favor the formation of Z2Cu(II) species located in the 6-membered rings. In contrast, ZCu(II)OH species associated with single Al sites undergo auto-reduction to Cu(I) under these same thermal conditions. Therefore, the high concentration of paired Al sites at this specific Si/Al ratio prevents complete auto-reduction, leaving about 50% of the copper as bare Cu(II). | Full credit for explaining that the low Si/Al ratio (5) provides a high density of paired framework Al sites, which stabilize Z2Cu(II) species in the 6-membered rings. These specific sites are highly resistant to auto-reduction compared to ZCu(II)OH sites. |
| q3 | identification | 30 | If you were to model the in-situ XANES data for this sample during the full He-activation process using Linear Combination Fitting or MCR-ALS, what distinct pure components (basis spectra) would be necessary to capture the structural transformations? | To model the in-situ XANES data during the full He-activation process using MCR-ALS or LCF, five distinct pure components are necessary: Hydrated Cu(II), Bare Cu(I), ZCu(II)OH, 2Al Z2Cu(II) sites, and CuOx clusters. These specific phases are expected because the sample starts as a hydrated Cu-CHA catalyst and undergoes dehydration and structural transformations during heating to 400 °C in He. The low Si/Al ratio of 5 creates both single and paired Al sites, leading to the initial presence of ZCu(II)OH and Z2Cu(II) species, respectively, alongside potential CuOx clusters. As the temperature increases to 400 °C, the ZCu(II)OH species undergo auto-reduction to form the Bare Cu(I) component, while the highly stable Z2Cu(II) sites resist reduction and persist as bare Cu(II). | Full credit for identifying the need for components representing hydrated Cu(II), bare Cu(I) (auto-reduced), ZCu(II)OH (single Al sites), and bare Z2Cu(II) (paired Al sites). |
Review
#985
Cu-CHA
Cu K-edge
▶
LLM Prompt
Sample Information
Material: Cu-CHA
Support: CHA zeolite
Reaction Conditions: 400 °C, He flow
Sample-Specific Conditions
- Si/Al ratio: 14-15
- Cu-CHA catalyst after He-activation
Measurement
We plan to measure the Cu K-edge XANES spectrum of this sample.
Questions
Based on all the information above:
1. Based on the sample conditions (Cu-CHA with Si/Al = 14-15, after He-activation at 400 °C), estimate the fraction of copper present as bare Cu(II) at paired aluminum sites (Z2Cu(II) / PC4).
2. What specific structural motif or principal component reference is required to model the bare Cu(II) species located at paired aluminum sites in the LCF/PCA analysis of this catalyst?
3. Explain the physical reasoning for why the fraction of 2Al Z2Cu(II) sites is relatively low (around 0.1) in this specific sample under these activation conditions.
Ground Truth
Material: Cu-CHA
Measurement: Cu K-edge in-situ
Fit method: Linear Combination Fitting / Principal Component Analysis
Phase fractions: (±10%)
| Phase | Fraction |
|---|---|
| 2Al Z2Cu(II) sites (PC4) | 0.1 |
Fit basis (paper's reference spectra):
- 2Al Z2Cu(II) sites (PC4)
Source evidence: Text (Data source: text, Sample: Cu-CHA Si/Al = 14-15 at 400 °C)
Key reasoning: In this Cu-CHA sample, the key variable dictating the copper speciation is the high Si/Al ratio of 14-15. This high ratio statistically limits the density of paired aluminum sites (2Al) in the chabazite framework. Consequently, after He-activation at 400 °C, only a minor fraction (0.1) of the copper is stabilized as bare Cu(II) ions at these paired sites (Z2Cu(II), denoted as PC4). The limited availability of 2Al sites prevents a higher population of this specific Cu(II) motif under these conditions.
Reasoning source: Text discussion on the effect of Si/Al ratio on Cu speciation
Scoring Rubric (total: 100 pts)
| Q | Type | Max | Question | Reference Answer | Scoring Criteria |
|---|---|---|---|---|---|
| q1 | quantification | 30 | Based on the sample conditions (Cu-CHA with Si/Al = 14-15, after He-activation at 400 °C), estimate the fraction of copper present as bare Cu(II) at paired aluminum sites (Z2Cu(II) / PC4). | The fraction of copper present as bare Cu(II) at paired aluminum sites (Z2Cu(II) / PC4) is estimated to be 0.1, with an uncertainty of 10%. This specific value results directly from the high Si/Al ratio of 14-15 in the Cu-CHA catalyst. This high ratio statistically limits the density of paired aluminum (2Al) sites within the chabazite framework. Consequently, after He-activation at 400 °C, the limited availability of these 2Al sites restricts the stabilization of bare Cu(II) ions, resulting in only a minor fraction of the copper occupying this specific motif. | Full credit for estimating a fraction of approximately 0.1 (or 10%) for the 2Al Z2Cu(II) sites. |
| q2 | identification | 30 | What specific structural motif or principal component reference is required to model the bare Cu(II) species located at paired aluminum sites in the LCF/PCA analysis of this catalyst? | The specific structural motif required to model this species in the LCF/PCA analysis is the "2Al Z2Cu(II) sites", which corresponds to principal component 4 (PC4). This reference is necessary because the Cu-CHA catalyst undergoes He-activation at 400 °C, a process that stabilizes a portion of the copper as bare Cu(II) ions at paired aluminum sites. However, because the sample possesses a high Si/Al ratio of 14-15, the density of these 2Al sites is statistically limited in the framework. Therefore, while the Z2Cu(II) (PC4) motif is essential for accurately fitting the XANES data, it is expected to represent only a minor fraction of the overall copper speciation due to the restricted availability of these paired sites. | Full credit for identifying '2Al Z2Cu(II) sites' or 'PC4' as the required basis component. |
| q3 | reasoning | 40 | Explain the physical reasoning for why the fraction of 2Al Z2Cu(II) sites is relatively low (around 0.1) in this specific sample under these activation conditions. | The fraction of 2Al Z2Cu(II) sites is low (0.1) primarily due to the high Si/Al ratio of 14-15 in this specific Cu-CHA sample. In the chabazite framework, a high Si/Al ratio statistically limits the density and availability of paired aluminum sites (2Al). When the catalyst is subjected to He-activation at 400 °C, copper is driven to stabilize at available framework sites. Because the 2Al sites are scarce, they can only accommodate a minor fraction of the copper as bare Cu(II) ions (Z2Cu(II) / PC4), preventing a higher population of this specific Cu(II) motif under these conditions. | Full credit for connecting the high Si/Al ratio (14-15) to a statistically low density of paired Al (2Al) sites in the zeolite framework, which inherently limits the amount of Cu(II) that can be stabilized in the Z2Cu(II) configuration. |
Review
Stabilizing atomic Pt with trapped interstitial F in alloyed PtCo nanosheets for high-performance zinc-air batteries
APS
Catalyst
Zhao Li et al.
DOI: 10.1039/C9EE02657F
2 scenarios
▶
#986
PtCoF
Co K-edge
▶
LLM Prompt
Sample Information
Material: PtCoF
Support: nickel foam
Sample-Specific Conditions
- material: SA-PtCoF
- Alloyed PtCo nanosheets with trapped interstitial F
Measurement
We plan to measure the Co K-edge XANES spectrum of this sample.
Questions
Based on all the information above:
1. What is the expected oxidation state of Co in the SA-PtCoF sample, and what is the reasoning for this assignment?
2. What reference spectrum is essential for confirming the oxidation state of Co in this sample?
3. Describe the expected overall spectral shape of the Co K-edge XANES for the SA-PtCoF sample and its distinguishing features.
Ground Truth
Material: SA-PtCoF
Measurement: Co K-edge XANES, transmission mode, Advanced Photon Source
Fit method: qualitative comparison
Phase fractions:
| Phase | Fraction |
|---|---|
| metallic_cobalt | 1.0 |
Fit basis (paper's reference spectra):
- Co foil
Source evidence: Page 11, Figure 3c, Figure S12a
Key reasoning: The comparison of Co K-edge XANES spectra of SA-PtCoF and PtCo with Co foil shows that Co is in the metallic state in both samples. This is further verified by the similarity in the first derivative of the normalized absorbance.
Reasoning source: Page 11, Results and Discussion
Scoring Rubric (total: 100 pts)
| Q | Type | Max | Question | Reference Answer | Scoring Criteria |
|---|---|---|---|---|---|
| q1 | reasoning | 40 | What is the expected oxidation state of Co in the SA-PtCoF sample, and what is the reasoning for this assignment? | The expected oxidation state of Co in the SA-PtCoF sample is 0 (metallic). This assignment is based on the qualitative comparison of the Co K-edge XANES spectrum of SA-PtCoF with a Co foil reference, which demonstrates that the Co remains in a fully metallic state. Despite the sample consisting of alloyed PtCo nanosheets with trapped interstitial F on a nickel foam support, the cobalt atoms do not undergo oxidation. This zero-valent state is further verified by the strong similarity in the first derivative of the normalized absorbance between the sample and the metallic Co foil. | Full credit for identifying Co as metallic (oxidation state 0) and explaining that it is determined by comparison with a Co foil reference, showing similarity in both the XANES spectrum and its first derivative. |
| q2 | identification | 30 | What reference spectrum is essential for confirming the oxidation state of Co in this sample? | The essential reference spectrum for confirming the oxidation state of Co in this sample is Co foil. A Co foil reference is required because it serves as the standard basis for metallic Co (oxidation state 0). By qualitatively comparing the Co K-edge XANES spectrum and its first derivative against this reference, it is confirmed that the Co in the SA-PtCoF sample is entirely metallic (fraction of 1.0). This comparison is critical to prove that the formation of alloyed PtCo nanosheets and the introduction of trapped interstitial F do not oxidize or alter the zero-valent nature of the cobalt. | Full credit for identifying Co foil (or metallic Co) as the necessary reference spectrum. |
| q3 | spectral | 30 | Describe the expected overall spectral shape of the Co K-edge XANES for the SA-PtCoF sample and its distinguishing features. | The overall spectral shape of the Co K-edge XANES for the SA-PtCoF sample is expected to be very similar to that of a standard Co foil. Its distinguishing feature is this strong resemblance to the Co foil spectrum and its first derivative, which indicates a purely metallic state. This specific spectral shape arises because the Co atoms remain in a zero-valent metallic state (fraction of 1.0) within the alloyed PtCo nanosheets. The presence of trapped interstitial F and the alloying with Pt in the SA-PtCoF sample do not significantly perturb the electronic structure or oxidize the cobalt, resulting in a spectrum that mirrors bulk metallic cobalt. | Full credit for stating that the spectrum and its first derivative are expected to be very similar to those of Co foil, indicating the metallic state is maintained. |
Review
#987
PtCoF
Pt L3-edge
▶
LLM Prompt
Sample Information
Material: PtCoF
Support: nickel foam
Sample-Specific Conditions
- material: SA-PtCoF
- Alloyed PtCo nanosheets with trapped interstitial F
Measurement
We plan to measure the Pt L3-edge XANES spectrum of this sample.
Questions
Based on all the information above:
1. Describe the expected overall spectral shape of the Pt L3-edge XANES for the SA-PtCoF sample. What reference material does it closely resemble?
Ground Truth
Material: SA-PtCoF
Measurement: Pt L3-edge XANES, fluorescence mode, Advanced Photon Source
Fit method: not reported
Phase fractions:
| Phase | Fraction |
|---|---|
| metallic_platinum | 1.0 |
Source evidence: Figure 3e (XANES), Figure 2c (XPS), Page 8, Page 11
Key reasoning: XPS Pt 4f peaks at 71.48 eV and 74.72 eV confirm the metallic state of Pt (Pt0). The Pt L3-edge XANES spectrum is similar to that of the PtCo alloy. EXAFS fitting shows Pt-Co coordination but no Pt-Pt coordination, confirming the ultralow loading and atomic dispersion of Pt.
Reasoning source: Results and Discussion, Pages 8 and 11
Scoring Rubric (total: 100 pts)
| Q | Type | Max | Question | Reference Answer | Scoring Criteria |
|---|---|---|---|---|---|
| q2 | spectral | 100 | Describe the expected overall spectral shape of the Pt L3-edge XANES for the SA-PtCoF sample. What reference material does it closely resemble? | The expected overall spectral shape of the Pt L3-edge XANES for the SA-PtCoF sample exhibits a characteristic white line peak and closely resembles the spectrum of a PtCo alloy reference. This spectral similarity arises because the sample consists of alloyed PtCo nanosheets with trapped interstitial F, where the Pt exists in a fully metallic state (Pt0). Although the Pt atoms are atomically dispersed with ultralow loading—evidenced by isolated single Pt atoms ejected from the alloy phase that show Pt-Co coordination but no Pt-Pt bonds—their local electronic environment remains fundamentally metallic. Therefore, the XANES profile reflects this metallic Pt0 oxidation state and Pt-Co interaction, producing a spectral shape that mirrors the bulk PtCo alloy. | Must state that the spectrum exhibits a characteristic white line peak and is overall very similar in shape to the PtCo alloy. |
Review
Optimizing PtFe intermetallics for oxygen reduction reaction: from DFT screening to in situ XAFS characterization
BNL-NSLS-II-8-ID
Catalyst
Mingxing Gong et al.
DOI: 10.1039/C9NR04975D
1 scenario
▶
#988
PtFe
Pt L3
▶
LLM Prompt
Sample Information
Material: PtFe
Support: Carbon
Reaction Conditions: in-situ during accelerated durability testing (ADT) in O2-saturated 0.1 M HClO4
Sample-Specific Conditions
- Structure: Ordered fct
- Ordered fct-phased PtFe intermetallic with ultrathin Pt shell
Measurement
We plan to measure the Pt L3 XANES spectrum of this sample.
Questions
Based on all the information above:
1. Under the specified in-situ ADT conditions, what is the dominant oxidation state of Pt in the O-PtFe sample, and how does alloying with Fe affect its electronic structure as observed in the XANES spectrum?
2. Describe the expected spectral shape and stability of the Pt L3-edge XANES spectrum for this O-PtFe catalyst during the 10,000 accelerated durability testing (ADT) cycles.
Ground Truth
Material: Carbon supported O-PtFe (Ordered fct-phased PtFe intermetallic with ultrathin Pt shell)
Measurement: Pt L3-edge in-situ XAFS at beamline 8-ID of the National Synchrotron Light Source II
Fit method: Not reported
Source evidence: Page 6, Figure 4b, 4e, and text in Results and discussion
Key reasoning: The initial normalized Pt L3-edge XANES spectra in O-PtFe are mainly in the metallic state (Pt0). A slightly negative shift is observed, demonstrating that the d-electron density of Pt is reduced due to the alloy with metallic Fe. During 10k ADT cycles, the spectra exhibit negligible changes in both intensity and peak position, indicating excellent structural stability.
Reasoning source: Page 6, Results and discussion
Scoring Rubric (total: 100 pts)
| Q | Type | Max | Question | Reference Answer | Scoring Criteria |
|---|---|---|---|---|---|
| q1 | reasoning | 43 | Under the specified in-situ ADT conditions, what is the dominant oxidation state of Pt in the O-PtFe sample, and how does alloying with Fe affect its electronic structure as observed in the XANES spectrum? | Under the specified in-situ conditions, the dominant oxidation state of Pt in the ordered fct-phased PtFe sample is metallic Pt0. This metallic state is expected because the catalyst consists of an ordered fct-PtFe intermetallic structure protected by an ultrathin Pt shell, which resists oxidation even during accelerated durability testing (ADT) in O2-saturated 0.1 M HClO4. Alloying the Pt with metallic Fe in this ordered configuration reduces the d-electron density of the Pt atoms. As a result of this electronic modification, the XANES spectrum exhibits a slightly negative shift compared to pure Pt. | The answer must identify Pt0 (metallic state) as the dominant oxidation state and mention that alloying with Fe causes a slightly negative shift in the spectrum due to reduced d-electron density of Pt. |
| q2 | spectral | 57 | Describe the expected spectral shape and stability of the Pt L3-edge XANES spectrum for this O-PtFe catalyst during the 10,000 accelerated durability testing (ADT) cycles. | The Pt L3-edge XANES spectrum is expected to display a mainly metallic (Pt0) profile with an edge position around 11560 eV and a slightly negative shift compared to pure Pt. This negative shift arises because alloying Pt with Fe in the ordered fct-PtFe intermetallic structure reduces the d-electron density of Pt. Throughout the 10,000 accelerated durability testing (ADT) cycles in O2-saturated 0.1 M HClO4, the white line intensity and peak position exhibit negligible changes. This highly stable spectral profile occurs because the ordered fct-phased intermetallic core and its ultrathin Pt shell provide excellent structural stability against the harsh in-situ electrochemical conditions. | The answer must state that the spectrum exhibits a metallic Pt0 profile and shows negligible changes in both intensity and peak position throughout the 10,000 ADT cycles, indicating high stability. |
Review
Hydrogen evolution activity tuning via two-dimensional electron accumulation at buried interfaces
BNL-NSLS-II-8-ID
Catalyst
Yudong Xue et al.
DOI: 10.1039/C9TA07123G
1 scenario
▶
#989
TiO2/NiFeS
Ti K
▶
LLM Prompt
Sample Information
Material: TiO2/NiFeS
Support: Ni foam
Sample-Specific Conditions
- catalyst state: as-prepared
- 5 nm ALD TiO2 grown on NiFeS nanosheets attached to Ni foam
Measurement
We plan to measure the Ti K XANES spectrum of this sample.
Questions
Based on all the information above:
1. Describe the expected pre-edge feature for this sample and explain what it confirms about the structural phase of the ALD TiO2 coating.
2. What specific XANES peak ratio is used to evaluate the electronic interaction between the TiO2 coating and the NiFeS substrate, and what does a higher ratio indicate physically?
3. How does the Ti absorption-edge energy of the TiO2/NiFeS sample compare to a standard amorphous TiO2/silica sample, and what does this imply about the Ti oxidation state in the coating?
Ground Truth
Material: TiO2/NiFeS
Measurement: Ti K-edge XANES, ex-situ, National Synchrotron Light Source II (NSLS II) beamline 8-ID ISS
Fit method: Peak position and intensity ratio analysis (no LCF reported)
Phase fractions:
| Phase | Fraction |
|---|---|
| amorphous TiO2 | 1.0 |
Fit basis (paper's reference spectra):
- TiO2/fused silica (TiO2/silica) as a reference for amorphous TiO2
Source evidence: Page 15, Figure 6 and text; Page 16 Acknowledgements (beamline)
Key reasoning: The sample exhibits a single pre-edge peak near 4966 eV, confirming the ALD TiO2 is amorphous. A slight decrease in the Ti absorption-edge energy and a larger D1/D2 peak ratio (1.099) compared to TiO2/silica indicates a stronger charge-transfer state contribution. This suggests electron exchange between NiFeS and the TiO2 coating, resulting in a more reduced electronic state (Ti3+) at the buried interface.
Reasoning source: Page 15, text discussing Figure 6
Scoring Rubric (total: 100 pts)
| Q | Type | Max | Question | Reference Answer | Scoring Criteria |
|---|---|---|---|---|---|
| q1 | spectral | 30 | Describe the expected pre-edge feature for this sample and explain what it confirms about the structural phase of the ALD TiO2 coating. | The expected pre-edge feature for the as-prepared TiO2/NiFeS sample is a single peak located near 4966 eV. This specific spectral feature confirms that the 5 nm ALD TiO2 coating grown on the NiFeS nanosheets consists entirely of amorphous TiO2. The amorphous phase arises directly from the as-prepared state of the atomic layer deposition (ALD) process, which yields a non-crystalline structure prior to any further treatment. Consequently, the lack of crystalline order in this as-deposited 5 nm layer manifests as this characteristic single pre-edge peak. | Full points if the answer identifies a single pre-edge peak near 4966 eV and states that this confirms the TiO2 is amorphous. |
| q2 | reasoning | 40 | What specific XANES peak ratio is used to evaluate the electronic interaction between the TiO2 coating and the NiFeS substrate, and what does a higher ratio indicate physically? | The electronic interaction between the 5 nm ALD TiO2 coating and the NiFeS substrate is evaluated using the D1/D2 post-edge peak ratio, where D1 is at 4985.8 eV and D2 is at 4999.0 eV. In this sample, a higher D1/D2 peak ratio of 1.099 is observed compared to a standard amorphous TiO2/silica reference. Physically, this higher ratio indicates a stronger charge-transfer state contribution resulting from electron exchange between the NiFeS nanosheets and the TiO2 coating. Because the 5 nm TiO2 layer is grown directly on the NiFeS support, interfacial electron accumulation occurs, leading to a more reduced electronic state (Ti3+) at the buried interface. | Full points if the answer identifies the D1/D2 ratio (peaks at 4985.8 eV and 4999.0 eV) and explains that a larger ratio indicates a stronger charge-transfer state contribution (or more electron exchange/accumulation at the interface). |
| q3 | identification | 30 | How does the Ti absorption-edge energy of the TiO2/NiFeS sample compare to a standard amorphous TiO2/silica sample, and what does this imply about the Ti oxidation state in the coating? | The Ti absorption-edge energy of the as-prepared TiO2/NiFeS sample exhibits a slight decrease compared to the standard amorphous TiO2/silica reference. This negative shift in edge energy implies that the Ti oxidation state in the coating is a mixture of Ti4+ and Ti3+, representing a more reduced overall electronic state. This reduced state arises directly from the sample architecture, where the 5 nm ALD TiO2 layer is in direct contact with the NiFeS nanosheets. This specific interface promotes electron exchange and accumulation from the NiFeS substrate into the TiO2 coating, generating reduced Ti cations at the buried interface. | Full points if the answer notes a slight decrease in the absorption-edge energy, which implies a reduction of Ti cations (presence of Ti3+ or a more reduced electronic state). |
Review
Understanding three-dimensionally interconnected porous oxide-derived copper electrocatalyst for selective carbon dioxide reduction
BNL-NSLS-II-8-ID
Catalyst
Thuy-Duong Nguyen-Phan et al.
DOI: 10.1039/C9TA10135G
2 scenarios
▶
#990
CuO
Cu K-edge
▶
LLM Prompt
Sample Information
Material: CuO
Reaction Conditions: Ex-situ, ambient conditions
Sample-Specific Conditions
- State: As-prepared
- Hierarchical CuO inverse opal catalyst
Measurement
We plan to measure the Cu K-edge XANES spectrum of this sample.
Questions
Based on all the information above:
1. Describe the expected key spectral features in the Cu K-edge XANES spectrum for this sample. Include specific energy positions and their corresponding electronic transitions where applicable.
2. What specific XANES features would distinguish this as-prepared sample from reduced copper species such as Cu2O or metallic Cu?
Ground Truth
Material: CuO
Measurement: Cu K-edge ex-situ fluorescence mode XANES at 8-ID (ISS) beamline of NSLS-II
Fit method: Direct comparison to standards
Phase fractions: (±5%)
| Phase | Fraction |
|---|---|
| CuO | 1.0 |
Fit basis (paper's reference spectra):
- bulk CuO
- bulk Cu2O
- Cu foil
Source evidence: Page 5 text, Figure 1D
Key reasoning: Synchrotron XRD confirmed the presence of only monoclinic CuO, with no cuprite Cu2O or metallic copper phases. The Cu K-edge XANES spectrum perfectly matched the bulk CuO standard, confirming the Cu2+ oxidation state and pure CuO phase.
Reasoning source: Page 5, Materials characterizations section
Scoring Rubric (total: 100 pts)
| Q | Type | Max | Question | Reference Answer | Scoring Criteria |
|---|---|---|---|---|---|
| q2 | spectral | 57 | Describe the expected key spectral features in the Cu K-edge XANES spectrum for this sample. Include specific energy positions and their corresponding electronic transitions where applicable. | The expected key spectral features for this sample include a distinct pre-edge at 8977 eV corresponding to the 1s -> 3d transition, a shakedown feature at 8986 eV corresponding to the 1s -> 4p transition, and a prominent white line at 8998 eV. The overall spectrum line shape will perfectly match the bulk CuO standard. These specific features arise because the sample is an as-prepared hierarchical CuO inverse opal catalyst measured ex-situ under ambient conditions, which stabilizes a pure monoclinic CuO phase. Consequently, the material consists entirely of copper in the Cu2+ oxidation state, directly producing these characteristic electronic transitions without any spectral contributions from reduced copper species. | Full points for mentioning the pre-edge at 8977 eV (1s -> 3d transition), the shakedown feature at 8986 eV (1s -> 4p transition), and the white line at 8998 eV. |
| q3 | reasoning | 43 | What specific XANES features would distinguish this as-prepared sample from reduced copper species such as Cu2O or metallic Cu? | The specific XANES features that distinguish this sample from reduced copper species are the presence of a pre-edge peak at 8977 eV and a shakedown feature at 8986 eV. These features are uniquely characteristic of the Cu2+ oxidation state and are absent in Cu+ (Cu2O) and Cu0 (metallic Cu). These distinguishing features are observed because the sample is an as-prepared hierarchical inverse opal catalyst measured under ex-situ ambient conditions, which maintains the copper entirely as pure monoclinic CuO. Because the material is fully oxidized to Cu2+ with no cuprite or metallic phases present, the spectrum perfectly matches the bulk CuO standard and clearly exhibits these signature Cu2+ electronic transitions. | Full points for explaining that the pre-edge (8977 eV) and shakedown features (8986 eV) are characteristic of Cu2+ and would be absent or significantly different in Cu+ or Cu0 species. |
Review
#991
Cu
Cu K-edge
▶
LLM Prompt
Sample Information
Material: Cu
Support: PTFE-coated carbon paper
Reaction Conditions: 0.1 M KHCO3 saturated with CO2, applied potential of -0.6 V vs RHE
Sample-Specific Conditions
- Applied potential: -0.6 V vs RHE
- Hierarchical CuO inverse opal catalyst under CO2 electroreduction conditions
Measurement
We plan to measure the Cu K-edge XANES spectrum of this sample.
Questions
Based on all the information above:
1. Based on the provided reaction conditions (-0.6 V vs RHE in CO2-saturated 0.1 M KHCO3), what is the expected dominant phase and oxidation state of the copper catalyst?
2. Explain the physical reasoning for the expected phase composition at -0.6 V vs RHE. How does the applied potential drive the transformation from the initial CuO state?
3. To properly model the in-situ XAS data and track the catalyst's evolution from open circuit to -0.6 V vs RHE, what reference spectra should be included in the fitting basis set?
Ground Truth
Material: Cu
Measurement: Cu K-edge in-situ fluorescence mode at 8-ID (ISS) beamline of NSLS-II
Fit method: Qualitative comparison to reference standards
Phase fractions: (±10%)
| Phase | Fraction |
|---|---|
| metallic_copper | 1.0 |
Fit basis (paper's reference spectra):
- Cu foil
- Cu2O
- CuO
Source evidence: Page 7, Figure 3B and text in 'In situ measurements' section
Key reasoning: The applied cathodic potential of -0.6 V vs. RHE drives the complete reduction of the initial CuO phase to metallic copper (Cu0). This is consistent with the Cu-H2O Pourbaix diagram, which predicts Cu0 formation at potentials more negative than -0.5 V. In situ EXAFS confirms this by showing the disappearance of Cu-O scattering and the emergence of a Cu-Cu shell matching bulk Cu foil.
Reasoning source: Page 7, 'In situ measurements' section
Scoring Rubric (total: 101 pts)
| Q | Type | Max | Question | Reference Answer | Scoring Criteria |
|---|---|---|---|---|---|
| q1 | identification | 29 | Based on the provided reaction conditions (-0.6 V vs RHE in CO2-saturated 0.1 M KHCO3), what is the expected dominant phase and oxidation state of the copper catalyst? | The expected dominant phase of the catalyst is metallic copper with an oxidation state of 0, comprising a fraction of 1.0 (100%). This phase arises because the initial hierarchical CuO inverse opal catalyst is subjected to a cathodic potential of -0.6 V vs RHE in CO2-saturated 0.1 M KHCO3. According to the Cu-H2O Pourbaix diagram, potentials more negative than -0.5 V provide the thermodynamic driving force for the complete reduction of CuO to metallic copper (Cu0). This structural transformation is confirmed by the disappearance of Cu-O scattering and the emergence of a Cu-Cu shell matching bulk Cu foil. | Award 20 points for correctly identifying metallic copper (Cu0) as the dominant/sole phase. |
| q2 | reasoning | 43 | Explain the physical reasoning for the expected phase composition at -0.6 V vs RHE. How does the applied potential drive the transformation from the initial CuO state? | At an applied potential of -0.6 V vs RHE in CO2-saturated 0.1 M KHCO3, the initial hierarchical CuO inverse opal catalyst undergoes complete reduction to a 100% metallic copper (Cu0) phase. The physical reasoning for this transformation is based on the Cu-H2O Pourbaix diagram, which predicts that Cu0 formation is thermodynamically favored at potentials more negative than -0.5 V. This applied cathodic potential drives the complete reduction of the initial CuO phase, resulting in the disappearance of the Cu-O (1.53 Å) and Cu-Cu (2.52 Å) scattering peaks of CuO. Consequently, a dominant Cu-Cu coordination shell at 2.21 Å emerges, perfectly matching the spectral features of bulk metallic Cu foil. | Award 15 points for explaining that the cathodic potential drives the reduction of the initial CuO phase. Award an additional 15 points for noting that this reduction to metallic Cu is consistent with thermodynamic expectations (e.g., the Cu-H2O Pourbaix diagram). |
| q4 | identification | 29 | To properly model the in-situ XAS data and track the catalyst's evolution from open circuit to -0.6 V vs RHE, what reference spectra should be included in the fitting basis set? | To properly model the in-situ XAS data, the fitting basis set should include reference spectra for Cu foil, Cu2O, and CuO. These specific references are required because the sample starts as a hierarchical CuO inverse opal catalyst and undergoes electroreduction in 0.1 M KHCO3. As the applied cathodic potential is lowered to -0.6 V vs RHE, the Cu-H2O Pourbaix diagram predicts the complete reduction of the initial CuO phase to metallic copper (Cu0). Including these three standards allows for a qualitative comparison to track the full transformation mechanism, specifically the disappearance of Cu-O scattering and the emergence of the metallic Cu-Cu shell. | Award 20 points for listing Cu foil (metallic Cu), Cu2O (Cu+), and CuO (Cu2+) as the necessary reference standards to capture the full reduction pathway. |
Review
Self-discharge of magnesium–sulfur batteries leads to active material loss and poor shelf life
APS
Electrochemistry
Hunter O. Ford et al.
DOI: 10.1039/D0EE01578D
2 scenarios
▶
#992
MgxSy
S K
▶
LLM Prompt
Sample Information
Material: MgxSy
Electrode Type: separator
Electrolyte: 0.25 M MgTFSI2 + 0.5 M MgCl2 in DME
Cell Type: coin cell
Charge Discharge: discharged
C Rate: 0.1C
State Of Charge: 200 mAh/g
Cycle Number: 1
Capacity Mah G: 200
Sample-Specific Conditions
- aging time: 168 h
- Solid deposit on separator from partially discharged and aged cell
Measurement
We plan to measure the S K XANES spectrum of this sample.
Questions
Based on all the information above:
1. Based on the sample conditions (partially discharged to 200 mAh/g and aged for 168 h), what specific solid magnesium polysulfide phase is expected to precipitate on the separator, and what spectral evidence supports this assignment?
2. Describe the expected S K-edge XANES spectral features for this solid deposit, specifically noting the energies of the pre-edge and main edge features.
3. What is the physical origin of the pre-edge feature observed at 2469.9 eV in the S K-edge XANES spectrum of this sample?
4. How does the main K-edge feature of this deposit distinguish it from other possible magnesium polysulfides, such as Mg3S8?
Ground Truth
Material: MgxSy (MgS6-8)
Measurement: S K-edge XAS, ex-situ, beamline 9-BM
Fit method: not reported
Phase fractions:
| Phase | Fraction |
|---|---|
| MgS6-8 | 1.0 |
Fit basis (paper's reference spectra):
- elemental sulfur (S8)
- Mg3S8 (literature comparison)
- MgS8 (literature comparison)
Source evidence: Figure 2C and text on page 4
Key reasoning: The deposit contains a pre-edge feature at 2469.9 eV, which is generally observed for ionic polysulfides due to the localization of the negative charge on the terminal S atoms. The main edge feature is at 2471.8 eV, indicating the environment of sulfur atoms is closer to MgS8 than Mg3S8. Combined with EXAFS data showing intermediate coordination, the solid is identified as a magnesium polysulfide with a likely chemical composition of MgS6-8.
Reasoning source: Page 4, Results and discussion section
Scoring Rubric (total: 100 pts)
| Q | Type | Max | Question | Reference Answer | Scoring Criteria |
|---|---|---|---|---|---|
| q1 | identification | 25 | Based on the sample conditions (partially discharged to 200 mAh/g and aged for 168 h), what specific solid magnesium polysulfide phase is expected to precipitate on the separator, and what spectral evidence supports this assignment? | The specific solid phase expected to precipitate on the separator is a magnesium polysulfide with a composition of MgS6-8, which accounts for 100% of the deposit. This phase arises because the cell was partially discharged to 200 mAh/g and aged for 168 hours, allowing soluble polysulfides to migrate and deposit as a solid on the separator. The spectral evidence supporting this assignment includes a pre-edge feature at 2469.9 eV, characteristic of ionic polysulfides, and a main edge feature at 2471.8 eV. The main edge position indicates a sulfur environment closer to MgS8 rather than Mg3S8, which, combined with intermediate coordination, confirms the MgS6-8 composition. | Full credit for identifying MgS6-8 and mentioning the pre-edge feature at 2469.9 eV and main edge at 2471.8 eV as the supporting evidence. |
| q2 | spectral | 25 | Describe the expected S K-edge XANES spectral features for this solid deposit, specifically noting the energies of the pre-edge and main edge features. | The expected S K-edge XANES spectrum for this solid deposit exhibits a distinct pre-edge feature at 2469.9 eV and a main K-edge feature at 2471.8 eV. These specific spectral features arise from the structural and electronic properties of the MgS6-8 phase that precipitates on the separator after the cell is partially discharged to 200 mAh/g and aged for 168 hours. The pre-edge feature at 2469.9 eV distinguishes the deposit from covalent elemental sulfur (S8) due to the localization of negative charge on the terminal sulfur atoms of the polysulfide chain. Meanwhile, the main edge at 2471.8 eV reflects a sulfur environment that is structurally closer to MgS8 than to other polysulfides like Mg3S8. | Full credit for stating a pre-edge feature at 2469.9 eV and a main edge feature at 2471.8 eV. |
| q3 | reasoning | 25 | What is the physical origin of the pre-edge feature observed at 2469.9 eV in the S K-edge XANES spectrum of this sample? | The physical origin of the pre-edge feature at 2469.9 eV is the localization of the negative charge of the polysulfide anion on the terminal sulfur atoms in the polysulfide chain. This feature is generally observed for ionic polysulfides like the MgS6-8 phase present in this sample. This specific phase and its corresponding electronic structure arise because the cell was partially discharged to 200 mAh/g and subjected to a 168-hour aging period, which promotes the formation and precipitation of this solid magnesium polysulfide on the separator. The presence of this pre-edge feature directly distinguishes the resulting ionic polysulfide deposit from covalent elemental sulfur (S8). | Full credit for explaining that it arises from the localization of the negative charge of the polysulfide anion on the terminal S atoms in the polysulfide chain. |
| q4 | reasoning | 25 | How does the main K-edge feature of this deposit distinguish it from other possible magnesium polysulfides, such as Mg3S8? | The main K-edge feature of this deposit is located at 2471.8 eV, which distinguishes it from Mg3S8 by indicating that the sulfur environment is structurally closer to that of MgS8. This specific spectral signature reflects the formation of a MgS6-8 phase, which precipitates as a solid deposit on the separator due to the cell being partially discharged to 200 mAh/g and aged for 168 hours. Under these specific electrochemical and aging conditions, the resulting magnesium polysulfide adopts an intermediate coordination environment rather than forming Mg3S8. Consequently, the 2471.8 eV main edge position serves as a key indicator of the MgS6-8 composition over other possible polysulfide phases. | Full credit for noting that the main edge feature is at 2471.8 eV, which indicates the sulfur environment is closer to MgS8 rather than Mg3S8. |
Review
#993
S8
S K
▶
LLM Prompt
Sample Information
Material: S8
Sample-Specific Conditions
- reference: reference
- Elemental sulfur reference
Measurement
We plan to measure the S K XANES spectrum of this sample.
Questions
Based on all the information above:
1. What key spectral feature distinguishes the S K-edge XANES spectrum of elemental sulfur (S8) from that of ionic polysulfides, and what is the physical origin of this feature in polysulfides?
2. Describe the expected spectral shape of elemental sulfur at the S K-edge in comparison to magnesium polysulfides.
3. Why is the spectrum of covalent S8 relevant when analyzing the solid deposits formed during the self-discharge of Mg-S batteries?
Ground Truth
Material: S8
Measurement: S K-edge XAS, ex-situ, beamline 9-BM of the Advanced Photon Source (APS)
Fit method: not reported
Phase fractions:
| Phase | Fraction |
|---|---|
| S8 | 1.0 |
Source evidence: Figure 2C, page 4
Key reasoning: Elemental sulfur (covalent S8) is used as a reference material to compare against the solid deposits found in the cells. Its spectrum is compared to the MgxSy deposit to demonstrate the absence of ionic polysulfide features in S8, confirming the chemical transformation of the active material.
Reasoning source: Page 4, Results and discussion
Scoring Rubric (total: 100 pts)
| Q | Type | Max | Question | Reference Answer | Scoring Criteria |
|---|---|---|---|---|---|
| q1 | spectral | 40 | What key spectral feature distinguishes the S K-edge XANES spectrum of elemental sulfur (S8) from that of ionic polysulfides, and what is the physical origin of this feature in polysulfides? | The key spectral feature that distinguishes elemental sulfur (S8) from ionic polysulfides is the complete absence of a pre-edge peak at 2469.9 eV. Because the sample is pure covalent elemental sulfur (S8) measured as a reference, it lacks the ionic character found in polysulfide species. In ionic polysulfides, this specific pre-edge feature arises from the localization of negative charge on the terminal sulfur atoms within the polysulfide chain. Consequently, the lack of this feature in the S8 reference spectrum confirms its purely covalent structure and provides a baseline to identify chemical transformations in active battery materials. | The answer must state that elemental sulfur lacks a pre-edge feature at 2469.9 eV, and explain that in polysulfides this feature arises from the localization of negative charge on the terminal S atoms. |
| q2 | spectral | 30 | Describe the expected spectral shape of elemental sulfur at the S K-edge in comparison to magnesium polysulfides. | The S K-edge XANES spectrum of elemental sulfur exhibits a main edge feature at a higher energy than the polysulfide pre-edge, while completely lacking the pre-edge feature at 2469.9 eV. This spectral shape is expected because the sample is a pure elemental sulfur (S8) reference consisting entirely of covalent bonds. Unlike magnesium polysulfides (MgxSy), which possess terminal sulfur atoms with localized negative charge that generate the distinct 2469.9 eV pre-edge peak, the covalent S8 ring has no such terminal atoms or ionic charges. Therefore, the S8 spectrum serves as a clear baseline to demonstrate the absence of ionic polysulfide features. | The answer should mention that the S8 spectrum lacks the low-energy pre-edge feature (around 2469.9 eV) seen in polysulfides and consists of a main edge feature at higher energy. |
| q3 | reasoning | 30 | Why is the spectrum of covalent S8 relevant when analyzing the solid deposits formed during the self-discharge of Mg-S batteries? | The spectrum of covalent S8 serves as a critical reference material to compare against the solid deposits, such as MgxSy, found in the cells. Because the sample is pure elemental sulfur, it provides a baseline spectrum of the unreacted, fully covalent active material. By comparing this S8 reference to the solid deposits, researchers can demonstrate the absence of ionic polysulfide features in the starting material. Ultimately, this comparison confirms the chemical transformation of the active material from covalent S8 into ionic polysulfide species during the battery's operation. | The answer should explain that S8 serves as a reference to determine whether the solid deposits are unreacted covalent sulfur or if they have been converted to ionic polysulfides (by checking for the presence or absence of specific spectral features). |
Review
Formation of Fe( iii )–As( v ) complexes: effect on the solubility of ferric hydroxide precipitates and molecular structural identification
APS
Environmental
Qiantao Shi et al.
DOI: 10.1039/D0EN00024H
4 scenarios
▶
#994
aqueous solution
Fe K-edge
▶
LLM Prompt
Sample Information
Material: aqueous solution
Sample Origin: laboratory prepared
Sample-Specific Conditions
- composition: Fe(III) only
- Single Fe(III) solution in 4% HCl
Measurement
We plan to measure the Fe K-edge XANES spectrum of this sample.
Questions
Based on all the information above:
1. What is the dominant Fe(III) species in a 0.02 M FeCl3 solution at pH 0.5 (4% HCl), and what structural evidence from the paper supports this?
2. Why is the fraction of coordinated Cl low in this sample despite being prepared in a 4% HCl matrix?
3. What specific EXAFS feature indicates that Fe(III) does not exist solely as isolated monomers in this highly acidic (pH 0.5) solution?
Ground Truth
Material: aqueous solution
Measurement: Fe K-edge EXAFS at beamline 9-BM at the Advanced Photon Source
Fit method: EXAFS shell fitting
Phase fractions: (±10%)
| Phase | Fraction |
|---|---|
| hydrated Fe(III) polymer | 1.0 |
Fit basis (paper's reference spectra):
- theoretical scattering paths
Source evidence: Section 3.2, Page 16; Figure 4
Key reasoning: EXAFS analysis of the 0.02 M Fe(III) solution in 4% HCl showed two shells surrounding the Fe atom: 5.2 ± 0.4 O atoms at 2.03 Å and 3.8 ± 0.7 Fe atoms at 3.64 Å. The low fraction of coordinated Cl (0.3 ± 0.1) suggests that hydration of Fe (Fe(OH2)6) dominated the Fe(III) species. The presence of a second Fe shell indicates that polymerization of Fe in FeCl3 solution occurs even at pH < 1.
Reasoning source: Section 3.2, Page 16
Scoring Rubric (total: 100 pts)
| Q | Type | Max | Question | Reference Answer | Scoring Criteria |
|---|---|---|---|---|---|
| q1 | reasoning | 40 | What is the dominant Fe(III) species in a 0.02 M FeCl3 solution at pH 0.5 (4% HCl), and what structural evidence from the paper supports this? | The dominant species in the 0.02 M Fe(III) solution prepared in 4% HCl is a hydrated Fe(III) polymer, which accounts for a fraction of 1.0. Despite the highly acidic matrix, EXAFS shell fitting reveals a first coordination shell dominated by 5.2 ± 0.4 O atoms at 2.03 Å and a very low fraction of coordinated Cl (0.3 ± 0.1), indicating that hydration (Fe(OH2)6) dominates the species. Furthermore, the structural evidence of a second shell containing 3.8 ± 0.7 Fe atoms at 3.64 Å demonstrates that polymerization of Fe occurs even at pH < 1. | Must identify hydrated Fe(III) polymer (or Fe(OH2)6 dominated species with polymerization) and mention the EXAFS evidence of Fe-O and Fe-Fe coordination shells with minimal Cl coordination. |
| q2 | reasoning | 30 | Why is the fraction of coordinated Cl low in this sample despite being prepared in a 4% HCl matrix? | The fraction of coordinated Cl is low (0.3 ± 0.1) because the hydration of Fe strongly outcompetes chloride complexation in this system. Even though the sample is a single Fe(III) solution prepared in a concentrated 4% HCl matrix, EXAFS analysis shows the first shell is dominated by 5.2 ± 0.4 O atoms at 2.03 Å. This indicates that the Fe(III) species is primarily present as a hydrated complex (Fe(OH2)6) that undergoes polymerization, which dictates the local structural environment rather than extensive chloride coordination. | Must state that the low FeCl3 concentration (0.02 M) leads to hydration dominating over Cl coordination. |
| q3 | spectral | 30 | What specific EXAFS feature indicates that Fe(III) does not exist solely as isolated monomers in this highly acidic (pH 0.5) solution? | The specific EXAFS feature indicating that Fe(III) does not exist solely as isolated monomers is the presence of a distinct second shell corresponding to Fe-Fe scattering. EXAFS shell fitting of this single Fe(III) solution in 4% HCl reveals this second shell contains 3.8 ± 0.7 Fe atoms at a distance of 3.64 Å. This spectral feature arises because the Fe(III) ions undergo polymerization to form a hydrated Fe(III) polymer, proving that polymerization occurs even under these highly acidic (pH < 1) sample conditions. | Must identify the presence of a second Fe shell (Fe-Fe scattering) at approximately 3.64 Å, which indicates polymerization. |
Review
#995
aqueous solution
Fe K-edge
▶
LLM Prompt
Sample Information
Material: aqueous solution
Sample Origin: laboratory prepared
Sample-Specific Conditions
- composition: Fe(III) + As(V)
- Binary Fe(III) and As(V) solution in 4% HCl
Measurement
We plan to measure the Fe K-edge XANES spectrum of this sample.
Questions
Based on all the information above:
1. Identify the dominant Fe species expected to form in a binary solution of 0.02 M Fe(III) and 0.02 M As(V) in 4% HCl (pH 0.5).
2. Explain the physical and thermodynamic reasoning for the formation of this specific Fe(III)-As(V) complex structure under these acidic, chloride-rich conditions.
3. What distinguishing structural feature would be observed in the extended X-ray absorption fine structure (EXAFS) region for this sample compared to a pure aqueous FeCl3 solution?
Ground Truth
Material: aqueous solution
Measurement: Fe K-edge EXAFS at beamline 9-BM at the Advanced Photon Source (APS)
Fit method: EXAFS shell fitting (ARTEMIS) and DFT geometry optimization
Phase fractions: (±10%)
| Phase | Fraction |
|---|---|
| Fe(III)-As(V) complex (monodentate, Cl-coordinated) | 1.0 |
Fit basis (paper's reference spectra):
- theoretical scattering paths from DFT optimized structures
Source evidence: Figure 4, Section 3.2 and 3.3, pages 16-20
Key reasoning: At highly acidic conditions (pH < 2), Fe(III) and As(V) form a soluble complex rather than a precipitate. EXAFS analysis revealed a second coordination shell of As around Fe at a distance of ~3.12 Å. DFT calculations confirmed that a monodentate Fe(III)-As(V) complex with one coordinated chloride atom best matches this interatomic distance and is thermodynamically favorable, as chloride coordination significantly improves its stability.
Reasoning source: Section 3.2 (Characterization of Fe(III)-As(V) complexes under acidic condition) and Section 3.3 (Theoretical calculation)
Scoring Rubric (total: 100 pts)
| Q | Type | Max | Question | Reference Answer | Scoring Criteria |
|---|---|---|---|---|---|
| q1 | identification | 30 | Identify the dominant Fe species expected to form in a binary solution of 0.02 M Fe(III) and 0.02 M As(V) in 4% HCl (pH 0.5). | The dominant Fe species expected in this sample is a soluble, monodentate, chloride-coordinated Fe(III)-As(V) complex (FeH8AsO8Cl), which accounts for 1.0 (100%) of the iron fraction. This specific complex forms because the highly acidic conditions (4% HCl, pH < 2) prevent the precipitation of solid phases, favoring a soluble complex instead. Furthermore, the high concentration of chloride from the HCl facilitates the formation of this specific structure, as chloride coordination significantly improves the thermodynamic stability of the monodentate Fe(III)-As(V) complex. | Full points for identifying the soluble Fe(III)-As(V) complex and noting its specific structural configuration (monodentate and Cl-coordinated). |
| q2 | reasoning | 40 | Explain the physical and thermodynamic reasoning for the formation of this specific Fe(III)-As(V) complex structure under these acidic, chloride-rich conditions. | Under highly acidic conditions (pH < 2) such as a 4% HCl solution, Fe(III) and As(V) remain soluble rather than forming a solid precipitate. In this chloride-rich environment, the system thermodynamically favors the formation of a monodentate Fe(III)-As(V) complex that includes one coordinated chloride atom. Density functional theory (DFT) calculations confirm that this chloride coordination significantly enhances the overall thermodynamic stability of the complex. Consequently, this stable Cl-Fe(III)-As(V) structure becomes the exclusive phase in the solution, effectively inhibiting typical Fe polymerization. | Full points for explaining that at pH < 2, soluble complexes form instead of precipitates, and that coordination with chloride significantly improves the thermodynamic stability of the monodentate Fe(III)-As(V) complex compared to uncoordinated or bidentate structures. |
| q3 | spectral | 30 | What distinguishing structural feature would be observed in the extended X-ray absorption fine structure (EXAFS) region for this sample compared to a pure aqueous FeCl3 solution? | The distinguishing EXAFS feature for this sample is the presence of a distinct second coordination shell of As atoms around Fe at an interatomic distance of approximately 3.12 Å, alongside a reduced Fe-Fe coordination number. These features arise directly from the sample conditions, where the binary mixture of Fe(III) and As(V) in 4% HCl leads to the formation of a stable monodentate Fe(III)-As(V) complex. The complexation with As(V) introduces the new Fe-As scattering path at 3.12 Å, while simultaneously inhibiting the typical polymerization of Fe that would otherwise produce strong Fe-Fe scattering in single-component solutions. | Full points for mentioning the appearance of a Fe-As second coordination shell at approximately 3.12 Å and/or the reduction in Fe-Fe coordination (indicating inhibited Fe polymerization). |
Review
#996
aqueous solution
Fe K-edge
▶
LLM Prompt
Sample Information
Material: aqueous solution
Sample Origin: laboratory prepared
Sample-Specific Conditions
- pH: 7
- Soluble fraction of binary Fe(III) and As(V) mixture at neutral pH
Measurement
We plan to measure the Fe K-edge XANES spectrum of this sample.
Questions
Based on all the information above:
1. What is the dominant soluble Fe species expected in this binary Fe(III) and As(V) mixture at pH 7, and what is its structural configuration?
2. Based on the physical chemistry of the system described, why is this specific complex considered the dominant soluble species at neutral pH compared to un-complexed mononuclear Fe(III)?
Ground Truth
Material: aqueous solution
Measurement: Fe K-edge EXAFS at beamline 6-BM at the National Synchrotron Light Sources II (NSLS-II)
Fit method: EXAFS shell fitting and Density Functional Theory (DFT) calculations
Phase fractions: (±5%)
| Phase | Fraction |
|---|---|
| As(V)-Fe(III)-As(V) complex (monodentate) | 1.0 |
Fit basis (paper's reference spectra):
- theoretical scattering paths
Source evidence: Section 3.5, lines 428-434; Section 3.6, lines 448-449
Key reasoning: At neutral pH, the soluble Fe concentration is significantly enhanced by the presence of As(V). The mononuclear Fe(III) (un-complexed) accounts for less than 5% of the total soluble Fe, meaning over 95% exists as the As(V)-Fe(III)-As(V) complex. EXAFS fitting and DFT calculations confirm this complex has a Fe:As ratio of 1:2 and exists in a monodentate configuration. This contrasts with highly acidic conditions (pH < 2), where a 1:1 Fe:As complex forms.
Reasoning source: Section 3.5 and 3.6
Scoring Rubric (total: 100 pts)
| Q | Type | Max | Question | Reference Answer | Scoring Criteria |
|---|---|---|---|---|---|
| q1 | identification | 57 | What is the dominant soluble Fe species expected in this binary Fe(III) and As(V) mixture at pH 7, and what is its structural configuration? | The dominant soluble Fe species expected in this sample is the As(V)-Fe(III)-As(V) complex, which exists in a monodentate structural configuration. This specific phase arises because, in an aqueous binary mixture at neutral pH (pH 7), the presence of As(V) significantly enhances the soluble Fe concentration. Under these neutral conditions, un-complexed mononuclear Fe(III) accounts for less than 5% of the total soluble iron. Consequently, over 95% of the iron forms this 1:2 Fe:As complex, contrasting with highly acidic conditions (pH < 2) that would instead favor a 1:1 Fe:As complex. | Must identify the As(V)-Fe(III)-As(V) complex and specify that it exists in a monodentate configuration with a Fe:As ratio of 1:2. |
| q2 | reasoning | 43 | Based on the physical chemistry of the system described, why is this specific complex considered the dominant soluble species at neutral pH compared to un-complexed mononuclear Fe(III)? | The As(V)-Fe(III)-As(V) complex is considered the dominant soluble species because the presence of As(V) in this aqueous mixture at pH 7 significantly enhances the solubility of Fe(III). Under these neutral conditions, un-complexed mononuclear Fe(III) is highly limited, accounting for less than 5% of the total soluble iron. This chemical environment drives over 95% of the soluble iron to form a complex with a 1:2 Fe:As ratio in a monodentate configuration. This behavior is highly dependent on the neutral pH, as shifting to highly acidic conditions (pH < 2) would alter the physical chemistry to favor a 1:1 Fe:As complex instead. | Must mention that un-complexed mononuclear Fe(III) accounts for less than 5% of the total soluble Fe, meaning over 95% of the soluble iron is driven into the As(V)-Fe(III)-As(V) complex form. |
Review
#997
aqueous solution
As K-edge
▶
LLM Prompt
Sample Information
Material: aqueous solution
Sample Origin: laboratory prepared
Sample-Specific Conditions
- composition: As(V) only
- Single As(V) solution in 4% HCl
Measurement
We plan to measure the As K-edge XANES spectrum of this sample.
Questions
Based on all the information above:
1. Identify the dominant As species in this solution and describe its local coordination environment.
2. Explain why this specific species is expected under these environmental conditions (pH 0.5, 4% HCl) in the absence of other metals.
Ground Truth
Material: aqueous solution
Measurement: As K-edge XAS at beamline 9-BM at the Advanced Photon Source (APS)
Fit method: EXAFS shell fitting
Phase fractions:
| Phase | Fraction |
|---|---|
| aqueous As(V) (H3AsO4) | 1.0 |
Fit basis (paper's reference spectra):
- theoretical scattering paths
Source evidence: Section 3.2, Figure 3
Key reasoning: In a single As(V) solution at pH 0.5 (4% HCl), As(V) exists as a mononuclear aqueous species, specifically H3AsO4. EXAFS analysis confirms a single coordination shell of four oxygen atoms surrounding the central arsenic atom with an average bond length of 1.70 Å.
Reasoning source: Section 3.2
Scoring Rubric (total: 100 pts)
| Q | Type | Max | Question | Reference Answer | Scoring Criteria |
|---|---|---|---|---|---|
| q1 | identification | 50 | Identify the dominant As species in this solution and describe its local coordination environment. | The dominant As species in this sample is aqueous As(V), specifically H3AsO4, which accounts for a fraction of 1.0. Its local coordination environment consists of a single coordination shell of four oxygen atoms surrounding the central arsenic atom with an average bond length of 1.70 Å. This specific mononuclear aqueous species is expected because the sample is a laboratory-prepared solution containing only As(V) in 4% HCl (pH 0.5). Under these specific acidic conditions, As(V) naturally exists as the mononuclear H3AsO4 species. | Full points for identifying aqueous As(V) / H3AsO4 and stating it is coordinated by 4 oxygen atoms at ~1.70 Å. |
| q2 | reasoning | 50 | Explain why this specific species is expected under these environmental conditions (pH 0.5, 4% HCl) in the absence of other metals. | In this laboratory-prepared sample, the arsenic is expected to exist entirely (fraction of 1.0) as the mononuclear aqueous species H3AsO4. This occurs because the sample is a single As(V) solution prepared in 4% HCl at pH 0.5. Under these highly acidic conditions and in the absence of other metals, As(V) exists solely as mononuclear H3AsO4. EXAFS shell fitting confirms this structural reasoning, showing a single coordination shell of four oxygen atoms at an average bond length of 1.70 Å around the central arsenic atom. | Full points for explaining that at highly acidic pH without Fe(III), As(V) remains uncomplexed as fully protonated arsenic acid (H3AsO4) with a simple AsO4 coordination. |
Review
Aerobic oxidation of arsenite to arsenate by Cu( ii )–chitosan/O 2 in Fenton-like reaction, a XANES investigation
APS
Catalyst
Lauren N. Pincus et al.
DOI: 10.1039/D0EW00326C
6 scenarios
▶
#998
Cu(II)-chitosan
As K
▶
LLM Prompt
Sample Information
Material: Cu(II)-chitosan
Support: chitosan
Reaction Conditions: As(V) dark oxic, pH 6
Sample-Specific Conditions
- system condition: As(V) dark oxic
- Cu(II)-chitosan complex incubated with As(V) in dark oxic conditions
Measurement
We plan to measure the As K XANES spectrum of this sample.
Questions
Based on all the information above:
1. Based on the reaction conditions (As(V) dark oxic), what is the expected oxidation state of arsenic adsorbed on the Cu(II)-chitosan complex, and why?
2. What reference spectra would be appropriate to use as a basis for Linear Combination Fitting (LCF) of this sample to confirm the oxidation state?
3. What is the expected position of the main absorption feature (white line) for this sample at the As K-edge?
4. How does the XANES spectrum of this sample distinguish it from a sample where arsenic is present as As(III)?
Ground Truth
Material: Cu(II)-chitosan
Measurement: As K-edge, fluorescence mode, beamline 8-ID at NSLS II and 9-BM at APS
Fit method: Linear combination fitting (LCF)
Phase fractions:
| Phase | Fraction |
|---|---|
| As(V) | 1.0 |
| As(III) | 0.0 |
Fit basis (paper's reference spectra):
- 100 mMol solutions of sodium arsenite
- 100 mMol solutions of sodium arsenate dibasic heptahydrate
Source evidence: Table 1, page 7
Key reasoning: As K-edge XANES indicate that As(V) does not undergo any redox reactions upon binding to Cu(II)-chitosan and is adsorbed as As(V).
Reasoning source: Section 3.1, page 6
Scoring Rubric (total: 100 pts)
| Q | Type | Max | Question | Reference Answer | Scoring Criteria |
|---|---|---|---|---|---|
| q1 | reasoning | 25 | Based on the reaction conditions (As(V) dark oxic), what is the expected oxidation state of arsenic adsorbed on the Cu(II)-chitosan complex, and why? | The expected oxidation state of arsenic adsorbed on the sample is As(V), representing a fraction of 1.0 (100%). This outcome is expected because the sample was prepared by incubating the Cu(II)-chitosan complex with As(V) under dark oxic conditions at pH 6. Under these specific reaction conditions, the As(V) does not undergo any redox reactions upon binding to the Cu(II)-chitosan material. Consequently, the arsenic is adsorbed entirely as As(V) without being reduced to As(III). | 10 points for identifying As(V) as the dominant/sole phase. 15 points for explaining that As(V) does not undergo redox reactions upon binding to Cu(II)-chitosan under these conditions. |
| q2 | identification | 25 | What reference spectra would be appropriate to use as a basis for Linear Combination Fitting (LCF) of this sample to confirm the oxidation state? | The appropriate reference spectra for Linear Combination Fitting (LCF) are 100 mMol solutions of sodium arsenite and 100 mMol solutions of sodium arsenate dibasic heptahydrate. These specific references are required to evaluate the oxidation states of arsenic in the sample, which was prepared by incubating a Cu(II)-chitosan complex with As(V) under dark oxic conditions at pH 6. By fitting against both As(III) and As(V) standards, it is possible to confirm that the arsenic does not undergo any redox reactions upon binding. This fitting yields a fraction of 1.0 for As(V) and 0.0 for As(III), proving the arsenic is adsorbed purely as As(V) under these conditions. | 25 points for identifying As(V) and As(III) standards (e.g., sodium arsenate and sodium arsenite). |
| q3 | spectral | 25 | What is the expected position of the main absorption feature (white line) for this sample at the As K-edge? | The expected position of the main absorption feature (white line) for this sample at the As K-edge is 11875.1 eV. This specific spectral feature is characteristic of the electronic structure of arsenic in the +5 oxidation state. Because the Cu(II)-chitosan complex was incubated with As(V) under dark oxic conditions at pH 6, the arsenic does not undergo any redox reactions upon binding. Therefore, the sample remains entirely as As(V), and its electronic properties produce the distinct 11875.1 eV white line associated with the unreduced species. | 25 points for stating the white line is at approximately 11875.1 eV. |
| q4 | spectral | 25 | How does the XANES spectrum of this sample distinguish it from a sample where arsenic is present as As(III)? | The XANES spectrum distinguishes this sample from an As(III) sample based on the energy position of the white line, which occurs at a higher energy of 11875.1 eV compared to 11871.7 eV for As(III). This shift to a higher edge energy reflects the higher oxidation state and distinct electronic structure of the arsenic atoms in this material. Because the Cu(II)-chitosan complex was incubated with As(V) under dark oxic conditions at pH 6, no redox reactions occur upon binding. As a result, the sample retains a pure As(V) electronic configuration, producing the characteristic 11875.1 eV white line rather than the lower energy feature of reduced As(III). | 25 points for mentioning the shift in the white line position (As(V) at ~11875.1 eV vs As(III) at ~11871.7 eV). |
Review
#999
Cu(II)-chitosan
As K
▶
LLM Prompt
Sample Information
Material: Cu(II)-chitosan
Support: chitosan
Reaction Conditions: As(III) dark anoxic (N2 atmosphere), pH 6
Sample-Specific Conditions
- system condition: As(III) dark anoxic
- Cu(II)-chitosan complex incubated with As(III) in dark anoxic conditions
Measurement
We plan to measure the As K XANES spectrum of this sample.
Questions
Based on all the information above:
1. Based on the reaction conditions (As(III) incubated with Cu(II)-chitosan in dark anoxic conditions), what arsenic species are expected to be present on the adsorbent surface, and what are their approximate relative fractions?
2. What reference spectra should be included in a linear combination fitting (LCF) analysis of the As K-edge XANES spectrum for this sample?
3. Explain the mechanistic role of dissolved oxygen in this system and why its absence (anoxic conditions) leads to the observed mixture of As oxidation states compared to oxic conditions.
Ground Truth
Material: Cu(II)-chitosan
Measurement: As K-edge fluorescence mode at beamline 8-ID (NSLS II) or 9-BM (APS)
Fit method: Linear combination fitting (LCF)
Phase fractions: (±1%)
| Phase | Fraction |
|---|---|
| As(V) | 0.602 |
| As(III) | 0.398 |
Fit basis (paper's reference spectra):
- As(III) (sodium arsenite)
- As(V) (sodium arsenate dibasic heptahydrate)
Source evidence: Table 1, page 7
Key reasoning: Upon removal of dissolved oxygen (anoxic conditions), As(III) is adsorbed to Cu(II)-chitosan as a mixture of As(V) (60.2%) and As(III) (39.8%), compared to oxic conditions where it is fully oxidized to As(V). The inhibitory effect of removing dissolved oxygen indicates that the oxidation of As(III) to As(V) occurs via a Cu(II)-chitosan Fenton-like reaction. In this mechanism, dissolved oxygen is required to produce hydrogen peroxide, which then forms reactive oxidants (hydroxyl radicals and Cu(III)) that oxidize As(III).
Reasoning source: Section 3.2 Oxidation of As(III) to As(V) via Fenton-like reaction mechanism, page 7
Scoring Rubric (total: 100 pts)
| Q | Type | Max | Question | Reference Answer | Scoring Criteria |
|---|---|---|---|---|---|
| q1 | quantification | 40 | Based on the reaction conditions (As(III) incubated with Cu(II)-chitosan in dark anoxic conditions), what arsenic species are expected to be present on the adsorbent surface, and what are their approximate relative fractions? | The expected arsenic species on the adsorbent surface are As(V) at approximately 60.2% and As(III) at approximately 39.8%. These specific fractions result from the dark anoxic (N2 atmosphere) conditions, which inhibit the complete oxidation of the initial As(III). In this system, As(III) oxidation occurs via a Cu(II)-chitosan Fenton-like reaction that requires dissolved oxygen to produce hydrogen peroxide and subsequent reactive oxidants (hydroxyl radicals and Cu(III)). Because dissolved oxygen is removed in these anoxic conditions, the oxidation mechanism is hindered, leaving a mixture of unoxidized As(III) and partially oxidized As(V) on the surface. | Full credit for identifying a mixture of As(V) and As(III) with fractions around 60% As(V) and 40% As(III). Partial credit for identifying both species but with incorrect proportions. |
| q2 | identification | 20 | What reference spectra should be included in a linear combination fitting (LCF) analysis of the As K-edge XANES spectrum for this sample? | The linear combination fitting (LCF) analysis of the As K-edge XANES spectrum should include reference spectra for As(III) (sodium arsenite) and As(V) (sodium arsenate dibasic heptahydrate). These specific reference phases are required because incubating the Cu(II)-chitosan complex with As(III) under dark anoxic conditions results in a mixed oxidation state on the adsorbent. The absence of dissolved oxygen inhibits the Cu(II)-chitosan Fenton-like reaction, which normally relies on oxygen to generate hydrogen peroxide and reactive oxidants (hydroxyl radicals and Cu(III)) for complete oxidation. Consequently, this incomplete oxidation yields a mixture of both As(III) and As(V) species, necessitating both references to accurately fit the spectrum. | Full credit for specifying As(III) (e.g., arsenite) and As(V) (e.g., arsenate) reference spectra. |
| q3 | reasoning | 40 | Explain the mechanistic role of dissolved oxygen in this system and why its absence (anoxic conditions) leads to the observed mixture of As oxidation states compared to oxic conditions. | In this Cu(II)-chitosan system, dissolved oxygen is mechanistically required to drive a Fenton-like reaction that oxidizes As(III) to As(V). Specifically, oxygen is needed to produce hydrogen peroxide, which subsequently forms reactive oxidants such as hydroxyl radicals and Cu(III) that carry out the oxidation. Under oxic conditions, this mechanism allows for the complete oxidation of As(III) to As(V). However, under the tested dark anoxic conditions (N2 atmosphere), the removal of dissolved oxygen inhibits the formation of these reactive oxidants. As a result, the oxidation process is incomplete, leading to the observed mixture of 60.2% As(V) and 39.8% As(III) adsorbed on the material. | Full credit for explaining that dissolved oxygen is required for the Fenton-like reaction to produce reactive oxidants (via H2O2) that oxidize As(III) to As(V), and that its absence inhibits this oxidation, leaving a significant portion of unoxidized As(III). |
Review
#1000
Cu(II)-chitosan
As K
▶
LLM Prompt
Sample Information
Material: Cu(II)-chitosan
Support: chitosan
Reaction Conditions: As(III) UV oxic (8 W, 365 nm UV lamp), pH 6
Sample-Specific Conditions
- system condition: As(III) UV oxic
- Cu(II)-chitosan complex incubated with As(III) in UV oxic conditions
Measurement
We plan to measure the As K XANES spectrum of this sample.
Questions
Based on all the information above:
1. What candidate reference spectra are needed to model the As K-edge XANES spectrum of this sample using Linear Combination Fitting?
Ground Truth
Material: Cu(II)-chitosan
Measurement: As K-edge, fluorescence mode, beamline 8-ID at NSLS II and 9-BM at APS
Fit method: Linear combination fitting (LCF)
Phase fractions: (±1%)
| Phase | Fraction |
|---|---|
| As(V) | 0.869 |
| As(III) | 0.131 |
Fit basis (paper's reference spectra):
- 100 mMol solution of sodium arsenite (As(III))
- 100 mMol solution of sodium arsenate dibasic heptahydrate (As(V))
Source evidence: Table 1 and Figure 2, page 7
Key reasoning: Incubation in UV light results in slight inhibition of As(III) oxidation compared to dark oxic conditions (where it is 100% oxidized). UV light affects the structure of chitosan by transforming hydroxyl groups into carboxyl groups. These structural changes to the chitosan backbone negatively impact the ability of the Cu(II)-chitosan complex to oxidize As(III) to As(V) via the Fenton-like reaction.
Reasoning source: Section 3.3: Inhibition of As(III) oxidation by UV light and phosphate, page 7
Scoring Rubric (total: 100 pts)
| Q | Type | Max | Question | Reference Answer | Scoring Criteria |
|---|---|---|---|---|---|
| q1 | identification | 100 | What candidate reference spectra are needed to model the As K-edge XANES spectrum of this sample using Linear Combination Fitting? | To model the As K-edge XANES spectrum of this sample using Linear Combination Fitting, the required candidate reference spectra are a 100 mMol solution of sodium arsenite (As(III)) and a 100 mMol solution of sodium arsenate dibasic heptahydrate (As(V)). These specific references are needed because the Cu(II)-chitosan complex partially oxidizes the initial As(III) to As(V) under the UV oxic conditions at pH 6. Specifically, the UV light transforms the hydroxyl groups of the chitosan support into carboxyl groups, which negatively impacts the complex's ability to fully oxidize As(III) via a Fenton-like reaction. Consequently, this slight inhibition of oxidation leaves a mixture of both unreacted As(III) and oxidized As(V) species in the final sample. | Full score if both As(III) (arsenite) and As(V) (arsenate) reference spectra are identified. |
Review
#1001
Cu(II)-chitosan
As K
▶
LLM Prompt
Sample Information
Material: Cu(II)-chitosan
Support: chitosan
Reaction Conditions: As(III) + P dark oxic, pH 6
Sample-Specific Conditions
- system condition: As(III) + P dark oxic
- Cu(II)-chitosan complex incubated with As(III) and phosphate in dark oxic conditions
Measurement
We plan to measure the As K XANES spectrum of this sample.
Questions
Based on all the information above:
1. What candidate reference spectra are needed to perform Linear Combination Fitting (LCF) on the As K-edge XANES spectrum of this sample?
2. Based on the reaction conditions (As(III) + P dark oxic), estimate the phase fractions of the arsenic species adsorbed on the Cu(II)-chitosan complex.
3. Explain the physical reasoning for why this specific phase composition is observed, particularly focusing on the effect of phosphate compared to a system without phosphate.
Ground Truth
Material: Cu(II)-chitosan
Measurement: As K-edge, fluorescence mode, NSLS II 8-ID / APS 9-BM
Fit method: Linear combination fitting (LCF)
Phase fractions: (±1%)
| Phase | Fraction |
|---|---|
| As(V) | 0.9 |
| As(III) | 0.1 |
Fit basis (paper's reference spectra):
- sodium arsenite (As(III))
- sodium arsenate dibasic heptahydrate (As(V))
Source evidence: Table 1, page 7
Key reasoning: The addition of phosphate has a slight inhibitory effect on the oxidation of As(III) to As(V) by the Cu(II)-chitosan complex in dark oxic conditions, decreasing the amount of As(III) oxidized from 100% (without phosphate) to 90.0%. This inhibitory effect is potentially due to the poisoning of the Cu(II) catalyst by phosphate, as phosphate is known to inhibit Cu(II)-catalysis.
Reasoning source: Section 3.3, page 8
Scoring Rubric (total: 100 pts)
| Q | Type | Max | Question | Reference Answer | Scoring Criteria |
|---|---|---|---|---|---|
| q1 | identification | 30 | What candidate reference spectra are needed to perform Linear Combination Fitting (LCF) on the As K-edge XANES spectrum of this sample? | To perform Linear Combination Fitting (LCF) on the As K-edge XANES spectrum of this sample, the required candidate reference spectra are sodium arsenite (As(III)) and sodium arsenate dibasic heptahydrate (As(V)). These specific reference phases are expected because the Cu(II)-chitosan complex catalyzes the oxidation of the initial As(III) into As(V) under dark oxic conditions at pH 6. However, the presence of phosphate in the reaction system partially inhibits this catalytic oxidation process. Consequently, the final sample contains a mixture of both the unreacted As(III) precursor and the newly formed As(V) product, necessitating both references to accurately fit the spectrum. | Full credit for identifying As(III) (e.g., sodium arsenite) and As(V) (e.g., sodium arsenate) as the necessary reference spectra. |
| q2 | quantification | 30 | Based on the reaction conditions (As(III) + P dark oxic), estimate the phase fractions of the arsenic species adsorbed on the Cu(II)-chitosan complex. | Based on the reaction conditions, the estimated phase fractions of the arsenic species adsorbed on the Cu(II)-chitosan complex are 90% As(V) and 10% As(III). These specific values result from the partial oxidation of the initial As(III) by the Cu(II)-chitosan complex under dark oxic conditions. While this catalytic system would normally oxidize 100% of the As(III) to As(V) in the absence of phosphate, the addition of phosphate introduces a slight inhibitory effect. This inhibition, which is potentially due to the poisoning of the Cu(II) catalyst by phosphate, restricts the oxidation process, leaving 10% of the arsenic as unreacted As(III) and yielding 90% As(V). | Full credit for estimating approximately 90% As(V) and 10% As(III). Partial credit for identifying that As(V) is the dominant phase but with a small, non-negligible amount of As(III) remaining. |
| q3 | reasoning | 40 | Explain the physical reasoning for why this specific phase composition is observed, particularly focusing on the effect of phosphate compared to a system without phosphate. | The observed phase composition of 90% As(V) and 10% As(III) arises from the catalytic behavior of the Cu(II)-chitosan complex under dark oxic conditions combined with the specific effects of the added phosphate. In a system without phosphate, the Cu(II) catalyst completely oxidizes 100% of the initial As(III) into As(V). However, the introduction of phosphate to the system creates a slight inhibitory effect on this oxidation reaction. This occurs because phosphate is known to inhibit Cu(II)-catalysis, potentially by poisoning the Cu(II) catalyst. As a result of this catalyst poisoning, the oxidation mechanism is hindered, decreasing the conversion rate and leaving a residual 10% of unoxidized As(III) alongside the 90% As(V) product. | Full credit for explaining that phosphate slightly inhibits the oxidation of As(III) to As(V) (which would otherwise be 100% in dark oxic conditions) due to the potential poisoning of the Cu(II) catalyst by phosphate. |
Review
#1002
Cu(II)-n-TiO2-chitosan
As K
▶
LLM Prompt
Sample Information
Material: Cu(II)-n-TiO2-chitosan
Support: chitosan
Reaction Conditions: As(III) dark oxic, pH 6
Sample-Specific Conditions
- system condition: As(III) dark oxic
- Cu(II)-n-TiO2-chitosan A complex incubated with As(III) in dark oxic conditions
Measurement
We plan to measure the As K XANES spectrum of this sample.
Questions
Based on all the information above:
1. What candidate reference spectra are needed to model the As K-edge XANES spectrum of this sample using linear combination fitting?
2. Based on the reaction conditions (As(III) dark oxic) and the material composition (Cu(II)-n-TiO2-chitosan A), estimate the phase fractions of the arsenic species present on the adsorbent surface.
3. Explain why the arsenic on the surface of Cu(II)-n-TiO2-chitosan A is present as a mixture of oxidation states in dark oxic conditions, and how the material's composition influences this ratio.
Ground Truth
Material: Cu(II)-n-TiO2-chitosan A
Measurement: As K-edge, fluorescence mode, beamline 8-ID at NSLS II or 9-BM at APS
Fit method: Linear combination fitting (LCF)
Phase fractions: (±1%)
| Phase | Fraction |
|---|---|
| As(V) | 0.507 |
| As(III) | 0.493 |
Fit basis (paper's reference spectra):
- 100 mMol solution of sodium arsenite (As(III))
- 100 mMol solution of sodium arsenate dibasic heptahydrate (As(V))
Source evidence: Table 2, page 8
Key reasoning: Following incubation in darkness under oxic conditions, As(III) is partially oxidized to As(V) on the surface of Cu(II)-n-TiO2-chitosan A, resulting in a mixture of As(III) and As(V). The extent of this dark oxidation correlates with the relative loading of Cu(II), which acts as a catalyst in a Fenton-like reaction. Because Cu(II)-n-TiO2-chitosan A has a higher Cu(II) loading relative to n-TiO2 compared to variant B, it exhibits a higher fraction of As(V) (50.7%) than variant B (17.3%), though it does not reach the 100% oxidation seen in pure Cu(II)-chitosan.
Reasoning source: Section 3.1, page 6 and Section 4, page 10
Scoring Rubric (total: 100 pts)
| Q | Type | Max | Question | Reference Answer | Scoring Criteria |
|---|---|---|---|---|---|
| q1 | identification | 20 | What candidate reference spectra are needed to model the As K-edge XANES spectrum of this sample using linear combination fitting? | To model the As K-edge XANES spectrum of this sample using linear combination fitting, the required reference spectra are a 100 mMol solution of sodium arsenite (As(III)) and a 100 mMol solution of sodium arsenate dibasic heptahydrate (As(V)). These specific references are needed because incubating the Cu(II)-n-TiO2-chitosan A complex with As(III) under dark oxic conditions at pH 6 leads to partial oxidation of the arsenic. Specifically, the Cu(II) in the material acts as a catalyst in a Fenton-like reaction, oxidizing a portion of the initial As(III) into As(V). Consequently, the sample surface contains a mixture of both As(III) and As(V) oxidation states, necessitating both reference spectra to accurately fit the data. | Full credit for identifying both As(III) (arsenite) and As(V) (arsenate) reference spectra. Deduct points if other unnecessary oxidation states are included or if one is missing. |
| q2 | quantification | 40 | Based on the reaction conditions (As(III) dark oxic) and the material composition (Cu(II)-n-TiO2-chitosan A), estimate the phase fractions of the arsenic species present on the adsorbent surface. | The estimated phase fractions on the adsorbent surface are 50.7% As(V) and 49.3% As(III), with an uncertainty of 1%. These specific values result from the partial oxidation of the initial As(III) during incubation in dark oxic conditions at pH 6. The extent of this oxidation is directly correlated with the relative loading of Cu(II) in the material, which catalyzes a Fenton-like reaction. Because the Cu(II)-n-TiO2-chitosan A variant has a relatively high Cu(II) loading compared to variant B, it achieves a substantial 50.7% conversion to As(V). However, the presence of n-TiO2 prevents it from reaching the 100% oxidation observed in pure Cu(II)-chitosan, resulting in this nearly equal mixture of As(III) and As(V). | Full credit for estimating a roughly equal mixture of As(V) and As(III) (e.g., ~50% As(V) and ~50% As(III)). Partial credit for identifying that both phases are present in significant amounts. |
| q3 | reasoning | 40 | Explain why the arsenic on the surface of Cu(II)-n-TiO2-chitosan A is present as a mixture of oxidation states in dark oxic conditions, and how the material's composition influences this ratio. | When the Cu(II)-n-TiO2-chitosan A complex is incubated with As(III) under dark oxic conditions at pH 6, the arsenic exists as a mixture of oxidation states due to partial oxidation. The Cu(II) present in the composite material acts as a catalyst in a Fenton-like reaction, driving the oxidation of As(III) to As(V) even in the absence of light. The final ratio of these oxidation states is heavily influenced by the material's specific composition, as the extent of dark oxidation correlates with the relative loading of Cu(II) to n-TiO2. Because variant A has a higher Cu(II) loading than variant B, it produces a higher fraction of As(V) (50.7%). However, the composite nature of the material prevents complete oxidation, keeping the As(V) yield below the 100% conversion seen in pure Cu(II)-chitosan. | Full credit requires mentioning the partial oxidation of As(III) to As(V) via a Cu(II)-catalyzed Fenton-like reaction in the dark, and explaining that the extent of oxidation (the fraction of As(V)) correlates with the relative loading of Cu(II) in the adsorbent. |
Review
#1003
Cu(II)-n-TiO2-chitosan
As K
▶
LLM Prompt
Sample Information
Material: Cu(II)-n-TiO2-chitosan
Support: chitosan
Reaction Conditions: As(III) dark oxic, pH 6
Sample-Specific Conditions
- system condition: As(III) dark oxic
- Cu(II)-n-TiO2-chitosan B complex incubated with As(III) in dark oxic conditions
Measurement
We plan to measure the As K XANES spectrum of this sample.
Questions
Based on all the information above:
1. What candidate reference spectra are needed to model the As K-edge XANES spectrum of this sample using linear combination fitting?
Ground Truth
Material: Cu(II)-n-TiO2-chitosan B
Measurement: As K-edge fluorescence mode at beamline 8-ID (NSLS II) and 9-BM (APS)
Fit method: Linear combination fitting (LCF)
Phase fractions: (±1%)
| Phase | Fraction |
|---|---|
| As(V) | 0.173 |
| As(III) | 0.827 |
Fit basis (paper's reference spectra):
- 100 mMol solution of sodium arsenite (As(III))
- 100 mMol solution of sodium arsenate dibasic heptahydrate (As(V))
Source evidence: Table 2, page 8
Key reasoning: Following incubation in dark oxic conditions, As(III) is partially oxidized to As(V) on the surface of the Cu(II)-n-TiO2-chitosan B adsorbent. The extent of this Fenton-like oxidation correlates with the relative loading of Cu(II) rather than n-TiO2. Because adsorbent B has a lower loading of Cu(II) (0.36 g per g chitosan) compared to adsorbent A (0.40 g per g chitosan), it exhibits significantly less oxidation of As(III) to As(V) in the dark, resulting in a surface composition dominated by unoxidized As(III).
Reasoning source: Section 3.1, page 6 and Section 4, page 10
Scoring Rubric (total: 100 pts)
| Q | Type | Max | Question | Reference Answer | Scoring Criteria |
|---|---|---|---|---|---|
| q1 | identification | 100 | What candidate reference spectra are needed to model the As K-edge XANES spectrum of this sample using linear combination fitting? | To model the As K-edge XANES spectrum of this sample using linear combination fitting, the required candidate reference spectra are a 100 mMol solution of sodium arsenite (As(III)) and a 100 mMol solution of sodium arsenate dibasic heptahydrate (As(V)). These specific references are necessary because incubating the Cu(II)-n-TiO2-chitosan B complex with As(III) under dark oxic conditions at pH 6 triggers a Fenton-like oxidation on the adsorbent surface. This mechanism partially oxidizes the initial As(III) into As(V), meaning both oxidation states will be present in the sample. The extent of this oxidation correlates with the Cu(II) loading; since adsorbent B has a lower Cu(II) loading (0.36 g per g chitosan), it exhibits limited oxidation, resulting in a surface composition containing both the newly formed As(V) and predominantly unoxidized As(III). | Full points for identifying both As(III) (arsenite) and As(V) (arsenate) reference spectra. |
Review
Structural trends in the dehydrogenation selectivity of palladium alloys
APS
Catalyst
Stephen C. Purdy et al.
DOI: 10.1039/D0SC00875C
6 scenarios
▶
#1004
Pd
Pd K
▶
LLM Prompt
Sample Information
Material: Pd
Support: SiO2
Reaction Conditions: measured at room temperature in He after reduction
Sample-Specific Conditions
- promoter: none
- Monometallic Pd catalyst
Measurement
We plan to measure the Pd K XANES spectrum of this sample.
Questions
Based on all the information above:
1. Based on the sample conditions (1 wt% Pd on SiO2, reduced at 550 °C in H2, measured in He), what is the expected oxidation state and dominant phase of the Pd catalyst, and what physical reasoning justifies this assignment?
Ground Truth
Material: Pd
Measurement: Pd K edge, transmission mode, MRCAT 10BM line of the Advanced Photon Source
Fit method: EXAFS fitting in R space
Phase fractions: (±10%)
| Phase | Fraction |
|---|---|
| metallic_palladium | 1.0 |
Fit basis (paper's reference spectra):
- Pd foil (for Pd-Pd scattering)
- Pd(OAc)2 (for Pd-O scattering)
Source evidence: Page 4, right column; Table 3; Figure 1a
Key reasoning: The Pd K edge EXAFS spectrum of the 1Pd catalyst shows an attenuated first shell scattering amplitude relative to Pd foil due to the large fraction of surface atoms in the 1.4 nm nanoparticles. No scattering from Pd-O is present, demonstrating that the catalyst is fully in the metallic state.
Reasoning source: Results - Structural characterization section, Page 4
Scoring Rubric (total: 100 pts)
| Q | Type | Max | Question | Reference Answer | Scoring Criteria |
|---|---|---|---|---|---|
| q1 | reasoning | 100 | Based on the sample conditions (1 wt% Pd on SiO2, reduced at 550 °C in H2, measured in He), what is the expected oxidation state and dominant phase of the Pd catalyst, and what physical reasoning justifies this assignment? | Based on the sample conditions of a monometallic Pd/SiO2 catalyst measured in He after reduction, the expected oxidation state is 0 (metallic) and the dominant phase is metallic Pd nanoparticles (1.0 fraction). Because the sample was reduced and kept in an inert environment, the palladium is fully converted to the metallic state, which is confirmed by the complete lack of Pd-O scattering in the spectrum. Additionally, the physical structure consists of small 1.4 nm nanoparticles rather than bulk metal. This specific morphology is justified by the attenuated first shell Pd-Pd scattering amplitude relative to bulk Pd foil, which results from the large fraction of surface atoms and a decreased average coordination number below 12. | Full points for identifying the metallic state (oxidation state 0) and explaining that the high-temperature reduction in H2 fully reduces the Pd, which is confirmed by the absence of Pd-O scattering. |
Review
#1005
Pd-Zn
Pd K
▶
LLM Prompt
Sample Information
Material: Pd-Zn
Support: SiO2
Reaction Conditions: measured at room temperature in He after reduction
Sample-Specific Conditions
- promoter: Zn
- Bimetallic Pd-Zn catalyst
Measurement
We plan to measure the Pd K XANES spectrum of this sample.
Questions
Based on all the information above:
1. Based on the synthesis conditions (2 wt% Pd, 3 wt% Zn, reduced at 550 °C), what is the dominant phase formed in this bimetallic catalyst, and what structural evidence supports this assignment?
2. What is the expected oxidation state of Pd in this catalyst after the 550 °C reduction treatment in H2?
3. How does the paper describe the expected Pd K-edge XANES features of this alloy compared to monometallic Pd?
Ground Truth
Material: Pd-Zn
Measurement: Pd K edge, transmission mode, MRCAT 10BM line
Fit method: EXAFS fitting in R space
Phase fractions: (±10%)
| Phase | Fraction |
|---|---|
| beta1-PdZn | 1.0 |
Fit basis (paper's reference spectra):
- Pd foil
- simulated beta1-PdZn
- simulated beta-PdZn
Source evidence: Fig 1b, Fig 4a, Table 3, pages 5-7
Key reasoning: The catalyst forms a 1:1 beta1-PdZn alloy phase. This is evidenced by EXAFS showing only Zn nearest neighbors (CN=4.1 at 2.54 Å) and a second nearest neighbor Pd at a long bond distance (CN=1.0 at 2.81 Å). In situ XRD confirms the tetragonal unit cell and body-centered symmetry characteristic of the beta1-PdZn phase, though a minor beta phase impurity may be present.
Reasoning source: Results section (Structural characterization), pages 5-7
Scoring Rubric (total: 100 pts)
| Q | Type | Max | Question | Reference Answer | Scoring Criteria |
|---|---|---|---|---|---|
| q1 | reasoning | 40 | Based on the synthesis conditions (2 wt% Pd, 3 wt% Zn, reduced at 550 °C), what is the dominant phase formed in this bimetallic catalyst, and what structural evidence supports this assignment? | The dominant phase formed in this bimetallic catalyst is a 1:1 beta1-PdZn alloy phase, which accounts for a fraction of 1.0. Because the sample is a bimetallic Pd-Zn catalyst promoted with Zn and subjected to reduction, the metals alloy to form this specific intermetallic structure. This assignment is supported by EXAFS data showing only Zn nearest neighbors (CN=4.1 at 2.54 Å) and a second nearest neighbor Pd at a long bond distance (CN=1.0 at 2.81 Å). Furthermore, in situ XRD confirms the tetragonal unit cell and body-centered symmetry characteristic of the beta1-PdZn phase, with only a minor beta phase impurity potentially present. | Must identify the 1:1 beta1-PdZn alloy phase and mention the specific coordination environment (Zn nearest neighbors, distant Pd second neighbors) or the tetragonal unit cell symmetry. |
| q2 | prediction | 30 | What is the expected oxidation state of Pd in this catalyst after the 550 °C reduction treatment in H2? | The expected oxidation state of Pd in this catalyst is Metallic (0). Because the bimetallic Pd-Zn catalyst is measured after a reduction treatment, the Pd species are fully reduced to their metallic state. Under these reducing conditions, the Pd and the Zn promoter alloy together to form the 1:1 beta1-PdZn phase, which consists entirely of zero-valent metals. | Must state metallic (0) or note the absence of Pd-O bonds. |
| q3 | spectral | 30 | How does the paper describe the expected Pd K-edge XANES features of this alloy compared to monometallic Pd? | The Pd K-edge XANES spectrum of this alloy shows small changes in the edge energy and white line shape relative to monometallic Pd. These spectral features arise because the sample is a bimetallic Pd-Zn catalyst that has been reduced to form a 1:1 beta1-PdZn alloy phase. The incorporation of the Zn promoter into the Pd lattice alters the local electronic and structural environment around the Pd absorbing atoms. This is structurally confirmed by EXAFS showing Pd is surrounded by Zn nearest neighbors (CN=4.1) rather than Pd nearest neighbors, leading to the observed modifications in the XANES profile. | Must mention small changes in the edge energy and white line shape relative to Pd. |
Review
#1006
Pd-Ga
Pd K
▶
LLM Prompt
Sample Information
Material: Pd-Ga
Support: SiO2
Reaction Conditions: measured at room temperature in He after reduction
Sample-Specific Conditions
- promoter: Ga
- Bimetallic Pd-Ga catalyst
Measurement
We plan to measure the Pd K XANES spectrum of this sample.
Questions
Based on all the information above:
1. Based on the sample conditions (2.5 wt% Pd, 2.5 wt% Ga on SiO2, reduced at 550 °C), what is the dominant Pd-containing phase formed, and what specific structural parameters (e.g., coordination numbers) justify this assignment?
2. What is the expected oxidation state of Pd in this sample after the reduction treatment, and what evidence confirms this?
3. Describe the expected qualitative differences in the Pd K-edge XANES spectrum of this bimetallic catalyst compared to monometallic Pd.
Ground Truth
Material: Pd-Ga
Measurement: Pd K edge, transmission mode, in situ, MRCAT 10BM line of the advanced photon source
Fit method: EXAFS fitting in R space
Phase fractions: (±10%)
| Phase | Fraction |
|---|---|
| Pd2Ga | 1.0 |
Fit basis (paper's reference spectra):
- Pd foil (for Pd-Pd scattering)
- FEFF simulated Pd-Ga scattering
Source evidence: Page 5 (EXAFS discussion), Page 6 (XRD discussion), Figure 1c, Figure 3
Key reasoning: The 2.5Pd-2.5Ga catalyst forms a pure Pd2Ga phase with an orthorhombic Co2Si structure. This is supported by in situ synchrotron XRD patterns that match bulk Pd2Ga and are inconsistent with monometallic Pd or other Pd-Ga alloy phases (like Pd5Ga3, PdGa, and Pd3Ga7). Furthermore, Pd K edge EXAFS fitting yielded a Pd-Ga to Pd-Pd coordination number ratio of 0.66 (2.7 Pd-Ga bonds and 4.1 Pd-Pd bonds), which closely matches the theoretical ratio of 0.63 for the local Pd environment in Pd2Ga (5 Ga neighbors and 8 Pd neighbors).
Reasoning source: Results: Structural characterization (Pages 5-6) and Discussion: Catalyst structure (Page 12)
Scoring Rubric (total: 100 pts)
| Q | Type | Max | Question | Reference Answer | Scoring Criteria |
|---|---|---|---|---|---|
| q1 | reasoning | 45 | Based on the sample conditions (2.5 wt% Pd, 2.5 wt% Ga on SiO2, reduced at 550 °C), what is the dominant Pd-containing phase formed, and what specific structural parameters (e.g., coordination numbers) justify this assignment? | The dominant Pd-containing phase formed in the 2.5Pd-2.5Ga catalyst after reduction is a pure Pd2Ga phase with an orthorhombic Co2Si structure (fraction = 1.0). This specific intermetallic phase arises because the reduction of the bimetallic Pd-Ga composition on the SiO2 support drives the formation of heteroatomic bonds over monometallic segregation. This assignment is justified by EXAFS fitting, which yields a Pd-Ga to Pd-Pd coordination number ratio of 0.66 (2.7 Pd-Ga bonds and 4.1 Pd-Pd bonds). This measured ratio closely matches the theoretical ratio of 0.63 expected for the local Pd environment in bulk Pd2Ga, which consists of 5 Ga neighbors and 8 Pd neighbors. Furthermore, in situ synchrotron XRD confirms the bulk Pd2Ga structure and rules out monometallic Pd or other Pd-Ga alloys like Pd5Ga3, PdGa, or Pd3Ga7. | Full credit requires identifying Pd2Ga as the dominant phase and mentioning the Pd-Ga to Pd-Pd coordination number ratio (~0.66) matching the theoretical environment of Pd2Ga, as well as the XRD pattern matching the orthorhombic Co2Si structure. |
| q2 | identification | 25 | What is the expected oxidation state of Pd in this sample after the reduction treatment, and what evidence confirms this? | The expected oxidation state of Pd in this sample after the reduction treatment is metallic (0). This fully reduced state occurs because the reduction conditions applied to the bimetallic Pd-Ga catalyst on the SiO2 support completely reduce the precursor species to form a pure Pd2Ga intermetallic alloy. The formation of this metallic alloy is confirmed by in situ synchrotron XRD patterns that match bulk Pd2Ga and are inconsistent with any oxidized or monometallic phases. Additionally, EXAFS fitting confirms the metallic environment by identifying specific metal-metal coordination numbers (2.7 Pd-Ga bonds and 4.1 Pd-Pd bonds) characteristic of the Pd2Ga crystal structure. | Full credit requires stating the metallic (0) oxidation state and noting the absence of Pd-O scattering/bonds. |
| q3 | spectral | 30 | Describe the expected qualitative differences in the Pd K-edge XANES spectrum of this bimetallic catalyst compared to monometallic Pd. | The Pd K-edge XANES spectrum of this bimetallic catalyst is expected to show small changes in the edge energy and white line shape relative to monometallic Pd. These spectral differences arise because the reduction of the Pd-Ga mixture on the SiO2 support forms a pure Pd2Ga intermetallic phase, fundamentally altering the local environment of the Pd atoms. Specifically, the introduction of heteroatomic Pd-Ga bonds in the alloy causes electronic modifications to the Pd atoms compared to a pure Pd-Pd metallic lattice. Consequently, this altered electronic structure and coordination environment directly manifest as the observed variations in the XANES edge energy and white line profile. | Full credit requires mentioning small changes in the edge energy and white line shape relative to monometallic Pd, which arise from electronic modifications due to heteroatomic bonding. |
Review
#1007
Pd-Mn
Pd K
▶
LLM Prompt
Sample Information
Material: Pd-Mn
Support: SiO2
Reaction Conditions: measured at room temperature in He after reduction
Sample-Specific Conditions
- promoter: Mn
- Bimetallic Pd-Mn catalyst
Measurement
We plan to measure the Pd K XANES spectrum of this sample.
Questions
Based on all the information above:
1. Based on the synthesis and reduction conditions, what is the expected dominant phase and structural architecture of the Pd-Mn nanoparticles, and what physical reasoning supports this assignment?
2. How does the Pd K-edge XANES spectral shape of this Pd-Mn catalyst compare to that of monometallic Pd foil, and what causes this difference?
3. What is the expected oxidation state of Pd in this catalyst during the in-situ measurement, and what spectral evidence confirms this?
Ground Truth
Material: 1Pd-5Mn (Pd-Mn bimetallic nanoparticle)
Measurement: Pd K edge XAS in transmission mode at the MRCAT 10BM line of the Advanced Photon Source
Fit method: EXAFS fitting in R space
Phase fractions: (±10%)
| Phase | Fraction |
|---|---|
| Pd3Mn/Pd core-shell | 1.0 |
Fit basis (paper's reference spectra):
- Pd foil (for Pd-Pd scattering)
- FEFF simulated Pd-Mn scattering
- Pd(OAc)2 (for Pd-O scattering)
Source evidence: Page 6 (Difference EXAFS discussion); Page 10 (XANES discussion); Page 12 (Catalyst structure)
Key reasoning: The catalyst forms a core-shell structure with a Pd core and a Mn-rich alloy shell. Difference EXAFS (reduction-oxidation) showed that the surface Pd-Mn to Pd-Pd ratio is significantly higher than the total nanoparticle ratio, indicating a Mn-rich surface. The Pd-Mn/Pd-Pd neighbor ratio in the nanoparticle matched that of Pd3Mn, which has an AuCu3 structure. The lack of Pd-O scattering in the reduced state confirms it is fully metallic.
Reasoning source: Results: Structural characterization (Page 6) and Discussion: Catalyst structure (Page 12)
Scoring Rubric (total: 100 pts)
| Q | Type | Max | Question | Reference Answer | Scoring Criteria |
|---|---|---|---|---|---|
| q1 | prediction | 40 | Based on the synthesis and reduction conditions, what is the expected dominant phase and structural architecture of the Pd-Mn nanoparticles, and what physical reasoning supports this assignment? | The expected dominant phase is a fully metallic Pd3Mn/Pd core-shell structure, representing 1.0 (100%) of the sample fraction. This specific architecture arises because the bimetallic Pd-Mn catalyst, after undergoing the reduction treatment, segregates to form a Pd core surrounded by a Mn-rich alloy shell. Difference EXAFS analysis of the reduced catalyst reveals that the surface Pd-Mn to Pd-Pd ratio is significantly higher than the total nanoparticle ratio, confirming this Mn-rich surface. Furthermore, the overall Pd-Mn to Pd-Pd neighbor ratio matches that of a Pd3Mn alloy with an AuCu3 structure. The complete absence of Pd-O scattering after the reduction treatment confirms the fully metallic nature of this core-shell architecture. | The answer must identify the Pd3Mn/Pd core-shell structure (Pd core, Pd3Mn shell) and explain that difference EXAFS indicates a Mn-rich shell matching the AuCu3 Pd3Mn structure. |
| q2 | spectral | 30 | How does the Pd K-edge XANES spectral shape of this Pd-Mn catalyst compare to that of monometallic Pd foil, and what causes this difference? | The Pd K-edge XANES spectrum of the reduced Pd-Mn catalyst exhibits small changes in both the edge energy and the white line shape relative to monometallic Pd foil. These spectral differences arise directly from the formation of the bimetallic Pd3Mn/Pd core-shell structure during the reduction process. Specifically, the presence of heteroatomic Pd-Mn bonds in the Mn-rich alloy shell modifies the local density of states of the Pd atoms. Because the sample is measured in He after reduction, it remains fully metallic, meaning the spectral changes are solely due to these Pd-Mn alloying effects rather than any oxidation. | The answer must mention small changes in the edge energy and white line shape, and attribute these changes to electronic modification of the Pd density of states caused by heteroatomic Pd-Mn bonds. |
| q3 | reasoning | 30 | What is the expected oxidation state of Pd in this catalyst during the in-situ measurement, and what spectral evidence confirms this? | The expected oxidation state of Pd in this catalyst during the measurement is fully metallic (0). This state is achieved because the bimetallic Pd-Mn sample was subjected to a reduction treatment prior to the measurement in an inert He atmosphere. The primary spectral evidence confirming this metallic state is the complete lack of Pd-O scattering in the EXAFS data. Instead, the data is entirely described by Pd-Pd and Pd-Mn scattering paths, confirming that the reduction process successfully converted the sample into a fully metallic Pd3Mn/Pd core-shell nanoparticle. | The answer must state that the oxidation state is metallic (0) and that this is supported by the lack of Pd-O scattering in the reduced state. |
Review
#1008
Pd-Fe
Pd K
▶
LLM Prompt
Sample Information
Material: Pd-Fe
Support: SiO2
Reaction Conditions: measured at room temperature in He after reduction
Sample-Specific Conditions
- promoter: Fe
- Bimetallic Pd-Fe catalyst
Measurement
We plan to measure the Pd K XANES spectrum of this sample.
Questions
Based on all the information above:
1. Based on the sample conditions (2 wt% Pd, 3 wt% Fe on SiO2, reduced at 550 °C), what is the expected dominant Pd-containing phase in this catalyst, and what structural evidence typically confirms this assignment?
2. Although the full Pd K-edge XANES spectrum is not explicitly plotted, what general spectral differences are expected for this bimetallic catalyst compared to monometallic Pd foil, and what is the physical origin of these differences?
Ground Truth
Material: Pd-Fe
Measurement: Pd K edge XAS in transmission mode at MRCAT 10BM line of the Advanced Photon Source
Fit method: not reported for XANES (phase identified via EXAFS and in situ synchrotron XRD in referenced prior work)
Phase fractions: (±5%)
| Phase | Fraction |
|---|---|
| Pd3Fe | 1.0 |
Fit basis (paper's reference spectra):
- not reported
Source evidence: Page 11, Discussion - Catalyst structure
Key reasoning: The 2Pd-3Fe catalyst forms a pure phase Pd3Fe alloy. This is supported by in situ synchrotron XRD patterns and matching atomic Pd environments measured by XAS detailed in prior work (ref 30). The formation of this specific intermetallic compound is expected as it is a known thermodynamic phase that is stable well below its order-disorder transition temperature.
Reasoning source: Page 11-12, Discussion - Catalyst structure
Scoring Rubric (total: 100 pts)
| Q | Type | Max | Question | Reference Answer | Scoring Criteria |
|---|---|---|---|---|---|
| q1 | identification | 57 | Based on the sample conditions (2 wt% Pd, 3 wt% Fe on SiO2, reduced at 550 °C), what is the expected dominant Pd-containing phase in this catalyst, and what structural evidence typically confirms this assignment? | The expected dominant Pd-containing phase in this bimetallic catalyst is a pure Pd3Fe alloy, representing a fraction of 1.0. Under the reducing conditions applied to the Pd-Fe sample, the formation of this specific intermetallic compound occurs because it is a known thermodynamic phase that remains stable well below its order-disorder transition temperature. This structural assignment is typically confirmed by in situ synchrotron XRD patterns and matching atomic Pd environments measured by EXAFS. | Full credit for identifying the pure phase Pd3Fe alloy. Partial credit for identifying a generic Pd-Fe alloy without specifying the Pd3Fe stoichiometry. |
| q2 | spectral | 43 | Although the full Pd K-edge XANES spectrum is not explicitly plotted, what general spectral differences are expected for this bimetallic catalyst compared to monometallic Pd foil, and what is the physical origin of these differences? | The Pd K-edge XANES spectrum of this bimetallic catalyst is expected to exhibit small changes in the edge energy and white line shape compared to a monometallic Pd foil reference. These spectral differences arise because the reduction of the Pd-Fe sample yields a pure Pd3Fe intermetallic alloy. The physical origin of these features is the electronic modification of the Pd density of states, which is directly caused by the formation of heteroatomic Pd-Fe bonds within the alloy structure. | Full credit for mentioning small changes in the edge energy and white line shape, and attributing these changes to the electronic modification of the Pd density of states caused by heteroatomic Pd-Fe bonds. |
Review
#1009
Pd-In
Pd K
▶
LLM Prompt
Sample Information
Material: Pd-In
Support: SiO2
Reaction Conditions: measured at room temperature in He after reduction
Sample-Specific Conditions
- promoter: In
- Bimetallic Pd-In catalyst
Measurement
We plan to measure the Pd K XANES spectrum of this sample.
Questions
Based on all the information above:
1. Based on the synthesis of the 2Pd-3In catalyst and its application in propane dehydrogenation, what specific structural phases and morphology are expected to form in this sample?
Ground Truth
Material: Pd-In
Measurement: Pd K edge XAS in transmission mode at the MRCAT 10BM line of the Advanced Photon Source
Fit method: not reported in this paper (detailed characterization is cited to ref. 29)
Phase fractions: (±50%)
| Phase | Fraction |
|---|---|
| Pd_core | 0.5 |
| PdIn_shell | 0.5 |
Source evidence: Page 10 (XANES description); Page 11-12, Discussion section (Catalyst structure)
Key reasoning: The paper states that the 2Pd-3In catalyst forms a core-shell structure consisting of a Pd core and an alloy shell of the cubic PdIn phase with a CsCl structure (exact phase fractions are not quantified in this text, hence the 0.5 placeholders, as detailed characterization is cited to ref. 29). The formation of this 1:1 site-isolated PdIn alloy shell is critical for catalytic performance, as it increases the C-C bond breaking barrier and suppresses unselective hydrogenolysis. Furthermore, the paper notes that the Pd K-edge XANES for these alloy catalysts exhibits small changes in the edge energy and white line shape compared to monometallic Pd, which provides direct evidence of electronic modification (changes in the Pd density of states) caused by the heteroatomic Pd-In bonds.
Reasoning source: Page 10 (Density functional theory / XANES); Page 11-12 (Discussion - Catalyst structure and Selectivity trends)
Scoring Rubric (total: 100 pts)
| Q | Type | Max | Question | Reference Answer | Scoring Criteria |
|---|---|---|---|---|---|
| q1 | identification | 100 | Based on the synthesis of the 2Pd-3In catalyst and its application in propane dehydrogenation, what specific structural phases and morphology are expected to form in this sample? | The sample is expected to form a core-shell morphology consisting of a metallic Pd core and an alloy shell of the cubic PdIn phase with a CsCl structure. Under the specified reduction conditions for this bimetallic Pd-In catalyst, the indium promoter interacts with palladium to form heteroatomic Pd-In bonds. This specific 1:1 site-isolated PdIn alloy shell forms because it electronically modifies the Pd density of states, which is critical for catalytic performance. Ultimately, this structural configuration arises to increase the C-C bond breaking barrier and suppress unselective hydrogenolysis during the reaction. | Full credit for identifying a core-shell morphology consisting of a monometallic Pd core and an intermetallic cubic PdIn (CsCl structure) alloy shell. |
Review
Operando structural and chemical evolutions of TiS 2 in Na-ion batteries
BNL-NSLS-II-8-ID
Electrochemistry
Cheng-Hung Lin et al.
DOI: 10.1039/D0TA00226G
5 scenarios
▶
#1010
TiS2
Ti K
▶
LLM Prompt
Sample Information
Material: TiS2
Electrode Type: cathode
Cell Type: operando tube cell
Charge Discharge: OCV
State Of Charge: 0% relative capacity
Cycle Number: 1
Sample-Specific Conditions
- state of charge: 0%
- Pristine state before electrochemical cycling
Measurement
We plan to measure the Ti K XANES spectrum of this sample.
Questions
Based on all the information above:
1. Identify the expected phase composition of this sample prior to electrochemical cycling. If analyzing this operando data series using a component-resolution method like MCR-ALS, what role does this specific state play in the basis set?
2. Describe the expected pre-edge spectral feature of pristine TiS2 at the Ti K-edge. What specific electronic transition and structural environment give rise to this feature according to the paper?
3. What distinguishes the pre-edge feature of this pristine TiS2 sample from its electrochemically reduced (lithiated/sodiated) states, and what is the physical reason for this spectral difference?
4. Based on the paper's analysis, what is the estimated average oxidation state of Ti in pristine TiS2, and what chemical bonding characteristic accounts for this value deviating from the formal 4+ state?
Ground Truth
Material: TiS2
Measurement: Ti K-edge XANES, operando fluorescence mode at ISS (8-ID) beamline
Fit method: MCR-ALS
Phase fractions: (±5%)
| Phase | Fraction |
|---|---|
| TiS2 | 1.0 |
Fit basis (paper's reference spectra):
- MCR-ALS derived pure component 1 (Pristine TiS2)
Source evidence: Figure 4C, 4D; Figure 3A, 3C
Key reasoning: At 0% relative capacity before any electrochemical cycling, the material is in its pristine state. MCR-ALS analysis identifies this starting state entirely as the first pure component, corresponding to unreacted TiS2.
Reasoning source: Section 3.2, Page 13; Figure 4
Scoring Rubric (total: 100 pts)
| Q | Type | Max | Question | Reference Answer | Scoring Criteria |
|---|---|---|---|---|---|
| q1 | identification | 20 | Identify the expected phase composition of this sample prior to electrochemical cycling. If analyzing this operando data series using a component-resolution method like MCR-ALS, what role does this specific state play in the basis set? | The expected phase composition of this sample is 100% pristine TiS2. Because the sample is at 0% state of charge and open-circuit voltage (OCV) prior to any electrochemical cycling, it remains entirely in its unreacted starting state. In an MCR-ALS analysis of the operando data series, this specific pristine state serves as the first pure component in the basis set. This occurs because the initial, uncycled condition provides the baseline spectral signature of pure TiS2 before any structural or chemical changes from ion insertion take place. | Full points for identifying it as 100% pristine TiS2 and noting that it serves as the first pure component (starting material) in the MCR-ALS basis. |
| q2 | spectral | 30 | Describe the expected pre-edge spectral feature of pristine TiS2 at the Ti K-edge. What specific electronic transition and structural environment give rise to this feature according to the paper? | The Ti K-edge XANES spectrum of pristine TiS2 exhibits a prominent pre-edge peak located at approximately 4970 eV. This feature arises from electronic transitions from the Ti-1s orbital to the Ti-3d/S-3p hybrid orbital. Because the sample is in its pristine, uncycled state at 0% state of charge, it maintains a partially distorted octahedral structure. It is this specific distorted structural environment in the unreacted material that allows for the orbital hybridization and produces the prominent pre-edge absorption feature. | Full points for mentioning a prominent pre-edge peak and correctly attributing it to transitions from the Ti-1s orbital to the Ti-3d/S-3p hybrid orbital in a partially distorted octahedral structure. |
| q3 | reasoning | 30 | What distinguishes the pre-edge feature of this pristine TiS2 sample from its electrochemically reduced (lithiated/sodiated) states, and what is the physical reason for this spectral difference? | The pristine TiS2 sample features a prominent pre-edge peak at ~4970 eV, which distinguishes it from electrochemically reduced states where this peak becomes suppressed or less prominent. This difference occurs because the pristine sample at 0% state of charge possesses a partially distorted octahedral structure. Upon alkali ion insertion during electrochemical cycling, this distorted octahedral environment undergoes symmetrization. Therefore, the prominent pre-edge feature is a direct spectral signature of the uncycled, distorted state before any structural symmetrization from ion insertion occurs. | Full points for stating the pre-edge peak is prominent in the pristine state but becomes suppressed/less prominent during intercalation, and explaining this is due to the symmetrization of the distorted octahedral environment of Ti atoms. |
| q4 | spectral | 20 | Based on the paper's analysis, what is the estimated average oxidation state of Ti in pristine TiS2, and what chemical bonding characteristic accounts for this value deviating from the formal 4+ state? | The estimated average oxidation state of Ti in this pristine TiS2 sample is ~2.5+, which deviates significantly from the formal 4+ state. This lower effective oxidation state is due to the strong iono-covalent character of the Ti-S bonding in the material. Because the sample is at 0% state of charge prior to any electrochemical cycling, this ~2.5+ value reflects the intrinsic electronic structure of the unreacted TiS2 cathode. The covalent sharing of electrons between titanium and sulfur in this pristine state naturally reduces the effective charge on the titanium atoms compared to a purely ionic model. | Full points for identifying the estimated oxidation state as ~2.5+ and attributing it to the iono-covalent character of the Ti-S bonding. |
Review
#1011
TiS2
Ti K
▶
LLM Prompt
Sample Information
Material: TiS2
Electrode Type: cathode
Electrolyte: 1.0 M NaClO4
Cell Type: operando tube cell
Charge Discharge: discharging
C Rate: C/12
State Of Charge: 40% relative capacity
Cycle Number: 1
Sample-Specific Conditions
- state of charge: 40%
- Partially discharged (sodiated) state
Measurement
We plan to measure the Ti K XANES spectrum of this sample.
Questions
Based on all the information above:
1. What candidate reference spectra or pure components are needed to model the Ti K-edge XANES spectrum of this sample at 40% sodiation?
2. Based on the provided state of charge (40% relative capacity during sodiation), estimate the phase fractions of the components present in the electrode.
3. Explain the physical and chemical reasoning for the presence of these specific phases at this state of charge, and contrast this structural evolution with the behavior of TiS2 during lithiation.
Ground Truth
Material: TiS2 cathode in Na-ion battery
Measurement: Ti K-edge XANES, operando fluorescence mode, ISS (8-ID) beamline
Fit method: MCR-ALS (Multivariate Curve Resolution - Alternating Least Squares)
Phase fractions: (±15%)
| Phase | Fraction |
|---|---|
| TiS2 | 0.29 |
| Na0.55TiS2 | 0.66 |
| NaTiS2 | 0.05 |
Fit basis (paper's reference spectra):
- TiS2
- Na0.55TiS2
- NaTiS2
Source evidence: Table S2, page 36
Key reasoning: During sodiation, TiS2 undergoes a complex multi-phase conversion process, unlike the single-phase solid-solution reaction seen in lithiation. At 40% relative capacity (State 1), MCR-ALS analysis of the operando XANES spectra reveals a three-component mixture. The pristine TiS2 is transforming into intermediate phases, making the intermediate Na0.55TiS2 the dominant component (66%). Some unreacted TiS2 (29%) remains, and a small amount of the fully sodiated NaTiS2 (5%) has begun to form.
Reasoning source: Section 3.2, Section 3.3, and Table S2
Scoring Rubric (total: 100 pts)
| Q | Type | Max | Question | Reference Answer | Scoring Criteria |
|---|---|---|---|---|---|
| q1 | identification | 20 | What candidate reference spectra or pure components are needed to model the Ti K-edge XANES spectrum of this sample at 40% sodiation? | To model the Ti K-edge XANES spectrum of this sample at 40% sodiation, the required reference components determined via MCR-ALS are pristine TiS2, the intermediate phase Na0.55TiS2, and the fully sodiated phase NaTiS2. These specific phases are expected because discharging TiS2 in a Na-ion battery proceeds via a complex multi-phase conversion process, unlike the solid-solution reaction seen in lithiation. At this partially discharged state of 40% relative capacity, the pristine TiS2 is actively transforming into intermediate phases. Consequently, the system exists as a three-component mixture containing unreacted starting material, a dominant intermediate sodiated phase, and a small amount of the final fully sodiated product. | Full points for identifying the three necessary components: pristine TiS2, an intermediate sodiated phase (Na0.55TiS2), and the fully sodiated phase (NaTiS2). |
| q2 | quantification | 40 | Based on the provided state of charge (40% relative capacity during sodiation), estimate the phase fractions of the components present in the electrode. | At 40% relative capacity during the first discharge cycle, the estimated phase fractions are 29% TiS2, 66% Na0.55TiS2, and 5% NaTiS2, with an uncertainty of 15%. These specific values result from the complex multi-phase conversion process that occurs during the sodiation of the TiS2 cathode. Because the cell is only partially discharged to 40%, the intermediate phase Na0.55TiS2 has become the dominant component as the pristine material transforms. Concurrently, a significant portion of unreacted TiS2 (29%) still remains, and only a minor fraction (5%) has progressed to the fully sodiated NaTiS2 state. | Full points if the estimated fractions are within ±15% of the ground truth: TiS2 (~29%), Na0.55TiS2 (~66%), and NaTiS2 (~5%). Partial credit for correctly identifying the intermediate phase as the dominant component. |
| q3 | reasoning | 40 | Explain the physical and chemical reasoning for the presence of these specific phases at this state of charge, and contrast this structural evolution with the behavior of TiS2 during lithiation. | The presence of a three-component mixture at 40% relative capacity arises from the specific electrochemical mechanism of the TiS2 cathode during sodium insertion. During discharge in the Na-ion cell, sodiation proceeds through a complex multi-phase conversion process, which strongly contrasts with the single-phase solid-solution reaction typically observed during lithiation. At this partially discharged state, the pristine TiS2 is actively transforming, leading to a state where the intermediate Na0.55TiS2 phase is dominant. The incomplete nature of the discharge at 40% capacity explains why a substantial amount of unreacted TiS2 persists, while only a small fraction of the material has reached the fully sodiated NaTiS2 end-state. | Full points for explaining that sodiation is a multi-phase conversion process involving a distinct intermediate phase (Na0.55TiS2) which dominates at 40% capacity, whereas lithiation proceeds via a single-phase solid-solution intercalation reaction without intermediate phase formation. |
Review
#1012
TiS2
Ti K
▶
LLM Prompt
Sample Information
Material: TiS2
Electrode Type: cathode
Electrolyte: 1.0 M NaClO4
Cell Type: operando tube cell
Charge Discharge: discharging
C Rate: C/12
State Of Charge: 82% relative capacity
Cycle Number: 1
Sample-Specific Conditions
- state of charge: 82%
- Deeply discharged (sodiated) state
Measurement
We plan to measure the Ti K XANES spectrum of this sample.
Questions
Based on all the information above:
1. Identify the candidate phases or pure components required to model the Ti K-edge XANES spectra for this TiS2 cathode during the sodiation process.
2. Estimate the relative phase fractions of the components in the TiS2 cathode at 82% relative capacity during sodiation.
3. Explain the structural evolution that leads to this specific phase composition at 82% sodiation. Why does sodiation involve an intermediate phase rather than proceeding via a simple single-phase intercalation?
Ground Truth
Material: TiS2 cathode (sodiated)
Measurement: Ti K-edge operando XANES in fluorescence mode
Fit method: MCR-ALS (Multivariate Curve Resolution - Alternating Least Squares)
Phase fractions: (±15%)
| Phase | Fraction |
|---|---|
| TiS2 | 0.08 |
| Na0.55TiS2 | 0.37 |
| NaTiS2 | 0.55 |
Fit basis (paper's reference spectra):
- Pristine TiS2 (1st component)
- Fully sodiated NaTiS2 (2nd component)
- Intermediate Na0.55TiS2 (3rd component)
Source evidence: Table S2, page 34
Key reasoning: The sodiation of TiS2 involves a three-component conversion process due to the large ionic radius of Na+, which causes complex structural changes including an a-b plane offset. At 82% relative capacity (State 2), the pristine TiS2 phase is nearly depleted. The intermediate phase Na0.55TiS2, which formed earlier in the discharge, is converting into the final fully sodiated product, NaTiS2, which is now the dominant phase.
Reasoning source: Section 3.2, Section 3.3, and Conclusion (Section 4)
Scoring Rubric (total: 100 pts)
| Q | Type | Max | Question | Reference Answer | Scoring Criteria |
|---|---|---|---|---|---|
| q1 | identification | 25 | Identify the candidate phases or pure components required to model the Ti K-edge XANES spectra for this TiS2 cathode during the sodiation process. | To model the Ti K-edge XANES spectra of this TiS2 cathode during discharge, three pure components are required: pristine TiS2, an intermediate Na0.55TiS2 phase, and fully sodiated NaTiS2. These specific phases arise during the C/12 discharge because the large ionic radius of the inserting Na+ ions causes complex structural changes in the host material. Specifically, the Na+ insertion induces an a-b plane offset, preventing simple intercalation and instead driving a three-component conversion process. Therefore, the spectral modeling must account for the initial material, the distinct intermediate state, and the final sodiated product. | Full points for identifying three components: pristine TiS2, a fully sodiated end-member (NaTiS2), and an intermediate sodiated phase (Na0.55TiS2). |
| q2 | quantification | 35 | Estimate the relative phase fractions of the components in the TiS2 cathode at 82% relative capacity during sodiation. | At 82% relative capacity during the first discharge cycle, the estimated phase fractions are 8% pristine TiS2, 37% intermediate Na0.55TiS2, and 55% fully sodiated NaTiS2, with an uncertainty of 15%. These specific values occur because the sample is in a deeply discharged state near the end of its sodiation process. Due to the three-component conversion mechanism necessitated by the large Na+ ions, the pristine TiS2 is nearly depleted at this 82% sodiation level. Consequently, the intermediate Na0.55TiS2 phase that formed earlier in the discharge is actively converting into the final fully sodiated product, making NaTiS2 the dominant phase. | Full points for estimating NaTiS2 as the dominant phase (~50-60%), Na0.55TiS2 as a significant minority (~30-40%), and TiS2 as nearly depleted (<10%). |
| q3 | reasoning | 40 | Explain the structural evolution that leads to this specific phase composition at 82% sodiation. Why does sodiation involve an intermediate phase rather than proceeding via a simple single-phase intercalation? | Sodiation of the TiS2 cathode cannot proceed via simple single-phase intercalation due to the large ionic radius of the Na+ ions from the NaClO4 electrolyte. The insertion of these large ions causes complex structural changes, notably an a-b plane offset, which forces the material to undergo a three-component conversion process involving a distinct intermediate phase. By the time the cell reaches 82% relative capacity (a deeply discharged state), the structural evolution reflects the near depletion of the initial pristine TiS2. The intermediate Na0.55TiS2 phase, which formed to accommodate the initial structural shifts, is now actively converting into the final NaTiS2 product, resulting in NaTiS2 becoming the dominant phase. | Full points for explaining that the larger ionic radius of Na+ (compared to Li+) causes complex structural changes (such as an a-b plane offset and c-axis variations) that stabilize an intermediate phase (Na0.55TiS2). At deep discharge (82%), this intermediate is actively converting into the final NaTiS2 phase. |
Review
#1013
TiS2
Ti K
▶
LLM Prompt
Sample Information
Material: TiS2
Electrode Type: cathode
Electrolyte: 1.0 M NaClO4
Cell Type: operando tube cell
Charge Discharge: discharged
C Rate: C/12
Voltage V: 1.1
State Of Charge: 100% relative capacity
Cycle Number: 1
Sample-Specific Conditions
- state of charge: 100%
- Fully discharged (sodiated) state
Measurement
We plan to measure the Ti K XANES spectrum of this sample.
Questions
Based on all the information above:
1. What is the expected dominant phase at the fully discharged (100% sodiated) state, and what physical changes in the Ti local environment explain the observed suppression of the pre-edge peak in its XANES spectrum?
2. Describe the expected shift in the Ti K-edge position for this fully sodiated sample compared to the pristine TiS2 cathode, and explain the chemical reason for this shift.
3. Based on the linear relationship between edge position and valence state established in the study, what is the estimated average oxidation state of Ti in this fully sodiated state, and at approximately what energy (eV) does the absorption edge occur?
Ground Truth
Material: TiS2 (fully sodiated)
Measurement: Operando Ti K-edge XANES in fluorescence mode at ISS (8-ID) beamline, NSLS-II
Fit method: MCR-ALS (Multivariate Curve Resolution - Alternating Least Squares)
Phase fractions: (±10%)
| Phase | Fraction |
|---|---|
| NaTiS2 | 1.0 |
Fit basis (paper's reference spectra):
- MCR-ALS derived pure components: pristine TiS2 (1st component)
- fully sodiated NaTiS2 (2nd component)
- intermediate phase (3rd component)
Source evidence: Figure 4B (pure component spectra), Figure 4D (concentration evolution), Figure S7 (oxidation state)
Key reasoning: During the sodiation process, the concentration of the 1st component (pristine TiS2) decreases, an intermediate 3rd component appears and peaks at ~50% capacity, and finally the 2nd component (fully sodiated NaTiS2) becomes the sole phase at 100% relative capacity. The Ti K-edge shifts to lower energy, indicating the reduction of Ti ions as they act as electron acceptors during Na insertion. The pre-edge peak intensity decreases because the insertion of Na ions symmetrizes the distorted octahedral environment of Ti atoms.
Reasoning source: Section 3.2 (Chemical Evolution by X-ray Absorption Spectroscopy at Ti and S K-edges)
Scoring Rubric (total: 101 pts)
| Q | Type | Max | Question | Reference Answer | Scoring Criteria |
|---|---|---|---|---|---|
| q1 | reasoning | 38 | What is the expected dominant phase at the fully discharged (100% sodiated) state, and what physical changes in the Ti local environment explain the observed suppression of the pre-edge peak in its XANES spectrum? | The expected dominant phase is fully sodiated NaTiS2, which accounts for 100% (fraction = 1.0) of the sample. Because the sample is at 100% relative capacity in a fully discharged state (1.1 V), the pristine TiS2 and intermediate phases have been completely consumed by the sodiation process. In this fully sodiated state, the pre-edge peak at ~4970 eV is significantly suppressed. This suppression occurs because the extensive insertion of Na ions symmetrizes the originally distorted octahedral environment of the Ti atoms, which reduces the probability of transitions from the Ti-1s orbital to the Ti-3d/S-3p hybrid orbital. | Full credit requires identifying NaTiS2 as the dominant phase and explaining that the pre-edge suppression is due to the symmetrization of the distorted octahedral environment of Ti atoms upon Na insertion. |
| q2 | spectral | 38 | Describe the expected shift in the Ti K-edge position for this fully sodiated sample compared to the pristine TiS2 cathode, and explain the chemical reason for this shift. | The Ti K-edge position for the fully sodiated sample is expected to shift to a lower energy (~4971 eV) compared to the pristine TiS2 cathode. This spectral shift is a direct result of the sample being in a fully discharged (100% sodiated) state at 1.1 V. During the electrochemical sodiation process, Na ions are inserted into the cathode structure, and the Ti ions act as electron acceptors. This electron acceptance causes the reduction of the Ti ions, lowering their oxidation state and consequently shifting the main X-ray absorption edge to a lower energy. | Full credit requires stating that the edge shifts to a lower energy and explaining that this is due to the reduction of Ti ions (acting as electron acceptors) during Na insertion. |
| q4 | prediction | 25 | Based on the linear relationship between edge position and valence state established in the study, what is the estimated average oxidation state of Ti in this fully sodiated state, and at approximately what energy (eV) does the absorption edge occur? | The estimated average oxidation state of Ti in this fully sodiated state is ~2.2, and the absorption edge occurs at approximately 4971 eV. Because the sample has been fully discharged to 100% relative capacity (1.1 V), maximum Na insertion has occurred, converting the material entirely to NaTiS2. As Na is inserted during this discharge cycle, Ti acts as an electron acceptor and is heavily reduced from its pristine state. This extensive reduction at the end of the discharge process directly dictates the lowered oxidation state of ~2.2 and the corresponding lower-energy edge position. | Full credit requires stating an oxidation state of ~2.0 and an edge position of ~4974 eV. |
Review
#1014
TiS2
Ti K
▶
LLM Prompt
Sample Information
Material: TiS2
Electrode Type: cathode
Electrolyte: 1.0 M LiTFSI in DME/DOL (1:1)
Cell Type: operando tube cell
Charge Discharge: discharged
C Rate: C/12
Voltage V: 1.8
State Of Charge: 100% relative capacity
Cycle Number: 1
Sample-Specific Conditions
- state of charge: 100%
- Fully discharged (lithiated) state for comparison
Measurement
We plan to measure the Ti K XANES spectrum of this sample.
Questions
Based on all the information above:
1. Based on the electrochemical conditions (fully discharged to 1.8 V, 100% relative capacity), what is the dominant phase present in the cathode, and what type of reaction mechanism leads to its formation?
2. If you were to model the operando XANES data for the entire lithiation process using a linear combination or multivariate curve resolution approach, what basis components would be required?
3. Describe the expected changes in the Ti K-edge XANES spectrum (specifically the main edge position and pre-edge intensity) for this fully lithiated sample compared to the pristine TiS2.
4. What is the physical origin of the pre-edge peak in this material, and what structural change during lithiation causes its intensity to decrease?
Ground Truth
Material: TiS2
Measurement: Ti K-edge operando fluorescence XANES
Fit method: MCR-ALS
Phase fractions: (±10%)
| Phase | Fraction |
|---|---|
| LiTiS2 | 1.0 |
Fit basis (paper's reference spectra):
- TiS2 (pristine)
- LiTiS2 (fully lithiated)
Source evidence: Figure 4(A) and 4(C), page 13
Key reasoning: The lithiation of TiS2 is a pure intercalation reaction without a change in the space group, proceeding as a simple A-to-B transformation. MCR-ALS analysis of the operando XANES spectra identifies two components, with the second component corresponding to the fully lithiated LiTiS2 phase. At 100% relative capacity (1.8 V), the concentration of this second component reaches 1.0.
Reasoning source: Section 3.2, pages 11-13
Scoring Rubric (total: 100 pts)
| Q | Type | Max | Question | Reference Answer | Scoring Criteria |
|---|---|---|---|---|---|
| q1 | reasoning | 25 | Based on the electrochemical conditions (fully discharged to 1.8 V, 100% relative capacity), what is the dominant phase present in the cathode, and what type of reaction mechanism leads to its formation? | The dominant phase present in the cathode is fully lithiated LiTiS2, which accounts for a fraction of 1.0. This phase forms because the cell has been fully discharged to 1.8 V, reaching 100% relative capacity. Under these specific electrochemical conditions, the lithiation of the pristine TiS2 cathode proceeds via a pure intercalation reaction mechanism. This mechanism is a simple A-to-B transformation that occurs without any change in the space group of the material. | Must identify LiTiS2 as the dominant phase and mention it forms via a pure intercalation reaction (simple A-to-B transformation without space group change). |
| q2 | identification | 20 | If you were to model the operando XANES data for the entire lithiation process using a linear combination or multivariate curve resolution approach, what basis components would be required? | To model the operando XANES data using a multivariate curve resolution (MCR-ALS) approach, two basis components are required: pristine TiS2 and fully lithiated LiTiS2. These specific basis components are necessary because the lithiation of the TiS2 cathode during discharge is a simple two-state, A-to-B intercalation reaction. As the cell discharges to 1.8 V (100% relative capacity), the pristine TiS2 phase directly transforms into the LiTiS2 phase without forming intermediate structures or changing its space group. The presence of clear isosbestic points in the spectra further confirms that only these two end-member phases are needed to describe the entire electrochemical process. | Must identify that two components are needed: pristine TiS2 and fully lithiated LiTiS2. |
| q3 | spectral | 25 | Describe the expected changes in the Ti K-edge XANES spectrum (specifically the main edge position and pre-edge intensity) for this fully lithiated sample compared to the pristine TiS2. | For this fully lithiated sample, the Ti K-edge XANES spectrum will exhibit a main edge shifted to a lower energy and a suppressed pre-edge peak at ~4970 eV compared to pristine TiS2. These spectral changes occur because discharging the cell to 1.8 V (100% relative capacity) drives the full intercalation of lithium, forming LiTiS2. The insertion of lithium reduces the oxidation state of titanium, which causes the main edge to shift to lower energies. Simultaneously, the lithium insertion symmetrizes the originally distorted octahedral environment of the Ti atoms, which decreases the intensity of the pre-edge peak. | Must state that the main edge shifts to lower energy (indicating Ti reduction) and the pre-edge peak intensity decreases/is suppressed. |
| q4 | reasoning | 30 | What is the physical origin of the pre-edge peak in this material, and what structural change during lithiation causes its intensity to decrease? | The pre-edge peak at ~4970 eV originates from transitions from the Ti-1s core orbital to the Ti-3d/S-3p hybrid orbital within a partially distorted octahedral structure. The intensity of this peak decreases during lithiation because the insertion of lithium ions symmetrizes the local coordination environment around the titanium atoms. Because the sample is fully discharged to 1.8 V (100% relative capacity), the pristine TiS2 has completely transformed into LiTiS2 via a pure intercalation mechanism. This complete lithium insertion removes the initial structural distortion, thereby suppressing the pre-edge transition in the fully lithiated state. | Must attribute the pre-edge peak to transitions from Ti-1s to Ti-3d/S-3p hybrid orbitals in a distorted octahedral structure, and explain that Li insertion symmetrizes the distorted octahedral environment, suppressing the peak. |
Review
Solving the structure of “single-atom” catalysts using machine learning – assisted XANES analysis
BNL-NSLS-II-8-ID
Catalyst
Shuting Xiang et al.
DOI: 10.1039/D1CP05513E
5 scenarios
▶
#1015
Co-cyclam/C3N4
Co K-edge
▶
LLM Prompt
Sample Information
Material: Co-cyclam/C3N4
Support: C3N4
Reaction Conditions: room temperature
Sample-Specific Conditions
- state: fresh
- Fresh Co SAC sample before any treatment
Measurement
We plan to measure the Co K-edge XANES spectrum of this sample.
Questions
Based on all the information above:
1. What is the dominant Co species in the fresh Co-cyclam/C3N4 sample before any treatment, and what chemical transformation during synthesis leads to this specific structure?
2. What is the oxidation state of the Co centers in this fresh, atomically isolated catalyst?
3. How does the XANES spectrum of the fresh sample structurally distinguish itself from the species formed during the photocatalytic reaction, and what does this imply about its phase purity?
Ground Truth
Material: Co-cyclam/C3N4
Measurement: Co K-edge, fluorescence mode, beamline 7-BM (QAS) of NSLS-II
Fit method: PCA and K-means clustering
Phase fractions:
| Phase | Fraction |
|---|---|
| Co-cyclam-OH | 1.0 |
Fit basis (paper's reference spectra):
- Fresh sample spectrum (unique species)
Source evidence: Fig 2, Fig 3, Fig 4, Fig 6(a), Pages 5-7
Key reasoning: PCA and K-means clustering of the XANES spectra demonstrate that the fresh sample stands out as an anomaly and does not cross the isosbestic points of the reaction series. This indicates it has a unique molecular structure compared to the species present during photocatalysis. During catalyst synthesis, the Cl ligands of the original Co-cyclam are substituted by hydroxyl groups in the presence of triethylamine, forming the Co-cyclam-OH species.
Reasoning source: Qualitative XANES Analysis (Page 5), Principal Component Analysis (PCA) of XANES (Pages 5-6), Structure Hypothesis (Pages 6-7)
Scoring Rubric (total: 101 pts)
| Q | Type | Max | Question | Reference Answer | Scoring Criteria |
|---|---|---|---|---|---|
| q1 | identification | 44 | What is the dominant Co species in the fresh Co-cyclam/C3N4 sample before any treatment, and what chemical transformation during synthesis leads to this specific structure? | The dominant Co species in the fresh Co-cyclam/C3N4 sample is Co-cyclam-OH, which accounts for a fraction of 1.0 (100%) of the composition. This specific phase is expected for the fresh, untreated sample at room temperature due to the chemical transformations that occur during catalyst synthesis. Specifically, the Cl ligands of the original Co-cyclam precursor are substituted by hydroxyl groups in the presence of triethylamine, resulting entirely in the unique Co-cyclam-OH structure before any photocatalytic treatment begins. | Full points for identifying the species as Co-cyclam-OH and explaining that the Cl ligands of the original Co-cyclam are substituted by hydroxyl groups in the presence of triethylamine. |
| q2 | identification | 19 | What is the oxidation state of the Co centers in this fresh, atomically isolated catalyst? | The oxidation state of the Co centers in the fresh Co-cyclam/C3N4 sample is Co(III). This specific oxidation state is expected because the fresh sample at room temperature exists entirely as the Co-cyclam-OH compound prior to any treatment. During the catalyst synthesis, the original Cl ligands of the Co-cyclam precursor are substituted by hydroxyl groups in the presence of triethylamine, which stabilizes the cobalt center in this +3 oxidation state before it undergoes CO2 adsorption or light irradiation. | Full points for correctly identifying the oxidation state as Co(III). |
| q3 | spectral | 38 | How does the XANES spectrum of the fresh sample structurally distinguish itself from the species formed during the photocatalytic reaction, and what does this imply about its phase purity? | The XANES spectrum of the fresh sample distinguishes itself by exhibiting unique features that do not cross the three isosbestic points shared by the rest of the samples in the reaction series, and it stands out as an anomaly in PCA projection. These distinct spectral features arise because the fresh, untreated sample at room temperature possesses a unique local geometry—specifically the Co-cyclam-OH structure—prior to CO2 adsorption and light irradiation. Because the spectrum is fit with a fraction of 1.0 for this single unique species, it implies that the fresh sample is phase-pure and structurally distinct from the intermediate species formed during photocatalysis. | Full points for noting that the fresh sample's spectrum does not cross the three isosbestic points shared by the reaction series, indicating it is a unique, distinct pure phase. |
Review
#1016
Co-cyclam/C3N4
Co K-edge
▶
LLM Prompt
Sample Information
Material: Co-cyclam/C3N4
Support: C3N4
Reaction Conditions: dark, room temperature
Sample-Specific Conditions
- reaction time: 0 min
- Co SAC with TEOA and CO2 purge before light irradiation
Measurement
We plan to measure the Co K-edge XANES spectrum of this sample.
Questions
Based on all the information above:
1. Based on the sample conditions (Co-cyclam/C3N4 with TEOA and CO2 purge before light irradiation), what is the dominant Co species present, and what is its expected oxidation state? Explain the physical reasoning for the formation of this species.
2. If this sample represents the initial state (t=0 min) of a time-resolved in-situ XANES study of photocatalytic CO2 reduction, what reference spectra (basis functions) would be appropriate to model the intermediate spectra during the reaction using Linear Combination Fitting (LCF)?
3. Describe the expected distinguishing spectral features of this initial state (before light) compared to the final product state formed after prolonged light irradiation.
Ground Truth
Material: Co-cyclam/C3N4
Measurement: Co K-edge in-situ fluorescence mode at beamline 7-BM (QAS) of NSLS-II
Fit method: LCF
Phase fractions:
| Phase | Fraction |
|---|---|
| Co-cyclam-OCO2 | 1.0 |
| Co-cyclam-CO | 0.0 |
Fit basis (paper's reference spectra):
- sample with TEOA and CO2 purge before light (Co-cyclam-OCO2)
- sample with light on for 143 min (Co-cyclam-CO)
Source evidence: Figure 5, Figure 6(b)
Key reasoning: Before light irradiation, the Co SAC with TEOA and CO2 purge forms the Co-cyclam-OCO2 species. CO2 adsorption occurs on the hydroxyl groups exposed on the catalyst surface. This state serves as the initial standard (t=0 min) for the linear combination fitting of the time-resolved photocatalysis data.
Reasoning source: Results and Discussion - Structure Hypothesis, Figure 5, Figure 6
Scoring Rubric (total: 100 pts)
| Q | Type | Max | Question | Reference Answer | Scoring Criteria |
|---|---|---|---|---|---|
| q1 | identification | 35 | Based on the sample conditions (Co-cyclam/C3N4 with TEOA and CO2 purge before light irradiation), what is the dominant Co species present, and what is its expected oxidation state? Explain the physical reasoning for the formation of this species. | The dominant Co species present is Co-cyclam-OCO2, which has an expected oxidation state of Co(III). This specific species forms because, under the initial sample conditions (0 min reaction time, dark, room temperature), the Co single-atom catalyst is exposed to a CO2 purge in the presence of TEOA. During this process, CO2 adsorption occurs on the hydroxyl groups exposed on the catalyst surface. As a result, before any light irradiation can drive the photocatalytic reaction, the catalyst exists entirely as this CO2-adsorbed initial state. | Full points for identifying Co-cyclam-OCO2 (or CO2 adsorbed on Co-cyclam-OH) as the dominant species, Co(III) oxidation state, and explaining that CO2 adsorbs on the hydroxyl groups before light irradiation initiates the reduction. |
| q2 | reasoning | 30 | If this sample represents the initial state (t=0 min) of a time-resolved in-situ XANES study of photocatalytic CO2 reduction, what reference spectra (basis functions) would be appropriate to model the intermediate spectra during the reaction using Linear Combination Fitting (LCF)? | The appropriate reference spectra for Linear Combination Fitting (LCF) are the initial state (the sample with TEOA and CO2 purge before light, representing Co-cyclam-OCO2) and the final product state (the sample with light on for 143 min, representing Co-cyclam-CO). These basis functions are required because the sample conditions at t=0 min (dark, CO2 purge) exclusively generate the Co-cyclam-OCO2 species, which serves as the starting point of the reaction. As light irradiation drives the photocatalytic CO2 reduction, this initial state converts into the final Co-cyclam-CO product. Therefore, intermediate spectra can be accurately modeled as a mixture of these two distinct structural endpoints. | Full points for identifying that the basis should include the spectrum of this initial state (Co-cyclam-OCO2 / before light) and the spectrum of the final steady-state product (Co-cyclam-CO / after long light irradiation). |
| q3 | spectral | 35 | Describe the expected distinguishing spectral features of this initial state (before light) compared to the final product state formed after prolonged light irradiation. | The XANES spectrum of this initial state features a white line peak at ~7724 eV that has a lower intensity compared to the final Co-cyclam-CO product. Furthermore, this initial spectrum intersects with the subsequent time-resolved spectra at three distinct isosbestic points. These distinguishing features arise because the sample conditions at t=0 min (dark, CO2 purge) result in the formation of a specific Co(III) Co-cyclam-OCO2 species via CO2 adsorption on surface hydroxyl groups. The lower white line intensity and the presence of isosbestic points directly reflect the unique electronic and structural configuration of this initial CO2-adsorbed state before light irradiation alters the catalyst. | Full points for mentioning that the initial state has a lower white line intensity (at ~7724 eV) compared to the final product, and that its spectrum will cross the product spectrum at specific isosbestic points. |
Review
#1017
Co-cyclam/C3N4
Co K-edge
▶
LLM Prompt
Sample Information
Material: Co-cyclam/C3N4
Support: C3N4
Reaction Conditions: light irradiation, room temperature
Sample-Specific Conditions
- reaction time: 56 min
- Co SAC during photocatalytic CO2 reduction
Measurement
We plan to measure the Co K-edge XANES spectrum of this sample.
Questions
Based on all the information above:
1. What reference spectra (basis functions) are appropriate for performing a Linear Combination Fitting (LCF) analysis of the XANES spectrum for this sample at 56 minutes of reaction?
2. Based on the reaction conditions (56 min of light irradiation), estimate the relative phase fractions of the components present in the sample.
3. Explain the physical reasoning for the coexistence of these specific phases and their relative proportions at this 56-minute stage of the photocatalytic CO2 reduction reaction.
Ground Truth
Material: Co-cyclam/C3N4
Measurement: Co K-edge in-situ fluorescence mode at beamline 7-BM (QAS) of NSLS-II
Fit method: Linear combination fitting (LCF)
Phase fractions:
| Phase | Fraction |
|---|---|
| Co-cyclam-OCO2 | 0.41 |
| Co-cyclam-CO | 0.59 |
Fit basis (paper's reference spectra):
- sample with TEOA and CO2 purge before light (Co-cyclam-OCO2)
- sample with light on for 143 min for reaction (Co-cyclam-CO)
Source evidence: Figure 5, page 7
Key reasoning: During the photocatalytic reaction, the initial state (Co-cyclam-OCO2, formed by CO2 adsorption before light) is converted to the final product state (Co-cyclam-CO) upon light irradiation. The reaction reaches a steady state at approximately 112 min, indicating saturation of the reaction sites. At 56 min, the reaction is ongoing, resulting in an intermediate mixture of the initial and final states, which can be quantified by linear combination fitting of the XANES spectra.
Reasoning source: Results and Discussion - Linear Combination Fitting, page 6; Structure Hypothesis, pages 6-7
Scoring Rubric (total: 100 pts)
| Q | Type | Max | Question | Reference Answer | Scoring Criteria |
|---|---|---|---|---|---|
| q1 | identification | 30 | What reference spectra (basis functions) are appropriate for performing a Linear Combination Fitting (LCF) analysis of the XANES spectrum for this sample at 56 minutes of reaction? | The appropriate reference spectra for LCF analysis are the sample with TEOA and CO2 purge before light (Co-cyclam-OCO2) and the sample with light on for 143 minutes (Co-cyclam-CO). These specific phases are expected because the Co-cyclam/C3N4 sample is undergoing photocatalytic CO2 reduction under light irradiation at room temperature. Before light irradiation, CO2 adsorbs to form the initial Co-cyclam-OCO2 state. As the reaction proceeds for 56 minutes, this initial state is partially converted into the final product state, Co-cyclam-CO, making these two states the necessary basis functions to model the intermediate mixture. | Award 15 points for identifying the initial state (sample with TEOA and CO2 purge before light, or Co-cyclam-OCO2) and 15 points for identifying the final steady-state product (sample after ~143 min of light irradiation, or Co-cyclam-CO). |
| q2 | quantification | 40 | Based on the reaction conditions (56 min of light irradiation), estimate the relative phase fractions of the components present in the sample. | At 56 minutes of light irradiation, the estimated relative phase fractions are 0.41 for Co-cyclam-OCO2 and 0.59 for Co-cyclam-CO. These specific values result from the ongoing kinetics of the photocatalytic CO2 reduction reaction at room temperature. The reaction converts the initial CO2-adsorbed state (Co-cyclam-OCO2) into the final product state (Co-cyclam-CO) and reaches a steady state indicating site saturation at approximately 112 minutes. Because 56 minutes is prior to this saturation point, the sample exists as an intermediate mixture where a majority (59%) of the initial state has been converted to the final product state. | Award 20 points for estimating approximately 41% of the initial state (Co-cyclam-OCO2) and 20 points for estimating approximately 59% of the final state (Co-cyclam-CO). Accept values within ±10% of the ground truth. |
| q3 | reasoning | 30 | Explain the physical reasoning for the coexistence of these specific phases and their relative proportions at this 56-minute stage of the photocatalytic CO2 reduction reaction. | The coexistence of Co-cyclam-OCO2 and Co-cyclam-CO at 56 minutes is driven by the progression of the photocatalytic CO2 reduction process on the Co-cyclam/C3N4 material. Prior to light irradiation, CO2 adsorption forms the initial Co-cyclam-OCO2 state. Upon introducing light at room temperature, this initial state progressively converts into the final Co-cyclam-CO product state. Because the reaction sites do not reach saturation (steady state) until approximately 112 minutes, the 56-minute mark represents an active, ongoing intermediate stage. Consequently, the sample contains a mixture of both phases, yielding a 0.41 fraction of the unreacted initial state and a 0.59 fraction of the newly formed product state. | Award 10 points for explaining the conversion from the initial CO2-adsorbed state to the CO-bound product state upon light irradiation. Award 10 points for noting that 56 min is an intermediate time point before the steady state is reached (at ~112 min). Award 10 points for concluding that this ongoing transformation results in a mixture of the two states. |
Review
#1018
Co-cyclam/C3N4
Co K-edge
▶
LLM Prompt
Sample Information
Material: Co-cyclam/C3N4
Support: C3N4
Reaction Conditions: light irradiation, room temperature
Sample-Specific Conditions
- reaction time: 82 min
- Co SAC during photocatalytic CO2 reduction
Measurement
We plan to measure the Co K-edge XANES spectrum of this sample.
Questions
Based on all the information above:
1. Based on the reaction conditions (photocatalytic CO2 reduction), what candidate phases or structural motifs are expected to coexist, and what reference spectra should be used as the basis for Linear Combination Fitting (LCF) of this sample?
2. Estimate the relative fractions of the coexisting phases in the sample after 82 minutes of light irradiation.
3. Explain the physical and chemical reasoning for why this specific phase composition is observed at 82 minutes of reaction time.
Ground Truth
Material: Co-cyclam/C3N4
Measurement: Co K-edge, fluorescence mode, beamline 7-BM (QAS) of NSLS-II
Fit method: Linear combination fitting (LCF)
Phase fractions:
| Phase | Fraction |
|---|---|
| Co-cyclam-OCO2 | 0.08 |
| Co-cyclam-CO | 0.92 |
Fit basis (paper's reference spectra):
- sample with TEOA and CO2 purge before light (Co-cyclam-OCO2)
- sample with light on for 143 min for reaction (Co-cyclam-CO)
Source evidence: Figure 5 inset, page 7
Key reasoning: During the photocatalytic reaction, photoexcited electrons from C3N4 are transferred to the Co atoms and react with adsorbed CO2. As the reaction progresses under light irradiation, the initial Co-cyclam-OCO2 species is gradually converted to the product Co-cyclam-CO species. At 82 minutes, the reaction is nearing its steady state (which is reached at approximately 112 min), resulting in a high fraction (92%) of the product Co-cyclam-CO and a small remaining fraction (8%) of the intermediate Co-cyclam-OCO2.
Reasoning source: Results and Discussion - Linear Combination Fitting (page 6) and Structure Hypothesis (page 6-7)
Scoring Rubric (total: 100 pts)
| Q | Type | Max | Question | Reference Answer | Scoring Criteria |
|---|---|---|---|---|---|
| q1 | identification | 30 | Based on the reaction conditions (photocatalytic CO2 reduction), what candidate phases or structural motifs are expected to coexist, and what reference spectra should be used as the basis for Linear Combination Fitting (LCF) of this sample? | The expected coexisting phases for this sample are the initial intermediate Co-cyclam-OCO2 and the product species Co-cyclam-CO. Therefore, the reference spectra used for Linear Combination Fitting (LCF) should be the sample with TEOA and CO2 purge before light (Co-cyclam-OCO2) and the sample with light on for 143 minutes (Co-cyclam-CO). These specific phases are expected because, during the photocatalytic CO2 reduction under light irradiation at room temperature, photoexcited electrons from the C3N4 support transfer to the Co single atoms. This electron transfer drives the reaction with adsorbed CO2, causing the initial Co-cyclam-OCO2 species to gradually convert into the Co-cyclam-CO product species over the 82-minute reaction time. | Full points for identifying the CO2-adsorbed intermediate (Co-cyclam-OCO2 or sample before light) and the CO-bound product (Co-cyclam-CO or sample at end of reaction) as the necessary basis spectra. |
| q2 | quantification | 30 | Estimate the relative fractions of the coexisting phases in the sample after 82 minutes of light irradiation. | After 82 minutes of light irradiation, the sample consists of 92% Co-cyclam-CO and 8% Co-cyclam-OCO2. These specific fractions result from the progression of the photocatalytic CO2 reduction reaction over this timeframe. Under light irradiation, photoexcited electrons from the C3N4 support continuously transfer to the Co atoms, driving the conversion of the initial Co-cyclam-OCO2 intermediate into the Co-cyclam-CO product. Because 82 minutes is nearing the reaction's steady state (which occurs at approximately 112 minutes), the vast majority of the initial species has already been converted, leaving a high fraction of the product and only a small residual amount of the intermediate. | Full points for estimating ~8% Co-cyclam-OCO2 (or initial/intermediate state) and ~92% Co-cyclam-CO (or final product state). Partial credit for identifying that the product state is highly dominant (>80%). |
| q3 | reasoning | 40 | Explain the physical and chemical reasoning for why this specific phase composition is observed at 82 minutes of reaction time. | The observed phase composition of 92% Co-cyclam-CO and 8% Co-cyclam-OCO2 at 82 minutes is driven by the kinetics of the photocatalytic CO2 reduction process. Under room temperature light irradiation, the C3N4 support generates photoexcited electrons that are transferred to the Co single-atom catalytic sites. These electrons react with the adsorbed CO2, causing a gradual chemical conversion from the initial Co-cyclam-OCO2 intermediate to the Co-cyclam-CO product. By 82 minutes, the reaction is approaching its steady state, which is fully reached at around 112 minutes. Consequently, the continuous light-driven electron transfer over this specific duration results in a highly converted state dominated by the product species, with only a minor fraction of the intermediate remaining. | Full points for explaining that photoexcited electrons drive the conversion of the CO2-adsorbed intermediate to the CO-bound product, and that at 82 minutes the reaction is nearing its steady state (which occurs at ~112 min), leading to a dominant product fraction. |
Review
#1019
Co-cyclam/C3N4
Co K-edge
▶
LLM Prompt
Sample Information
Material: Co-cyclam/C3N4
Support: C3N4
Reaction Conditions: light irradiation, room temperature
Sample-Specific Conditions
- reaction time: 112 min
- Co SAC during photocatalytic CO2 reduction
Measurement
We plan to measure the Co K-edge XANES spectrum of this sample.
Questions
Based on all the information above:
1. Under continuous light irradiation and CO2 purge for 112 minutes, what is the dominant Co structural motif expected in the Co-cyclam/C3N4 single-atom catalyst, and what physical process drives the conversion to this state?
2. If performing a Linear Combination Fitting (LCF) analysis to track the structural evolution of this catalyst during the in-situ photocatalytic reaction, what appropriate reference spectra (basis functions) should be utilized?
3. Describe the key distinguishing spectral feature in the Co K-edge XANES spectrum that indicates the catalyst has reached its steady-state structure at 112 minutes compared to the initial state before light irradiation.
4. Based on the proposed reaction mechanism and structural models for this single-atom catalyst system, what is the formal oxidation state of the Co center in the final steady-state complex?
Ground Truth
Material: Co-cyclam/C3N4
Measurement: Co K-edge, fluorescence mode, beamline 7-BM (QAS) of NSLS-II
Fit method: Linear combination fitting (LCF)
Phase fractions:
| Phase | Fraction |
|---|---|
| Co-cyclam-OCO2 | 0.0 |
| Co-cyclam-CO | 1.0 |
Fit basis (paper's reference spectra):
- sample with TEOA and CO2 purge before light (Co-cyclam-OCO2)
- sample with light on for 143 min (Co-cyclam-CO)
Source evidence: Figure 5, Page 7
Key reasoning: During the photocatalysis reaction, C3N4 absorbs light and generates photoexcited electrons that are transferred to the atomically dispersed cobalt atoms to sequentially react with CO2. The linear combination fitting of the XANES spectra shows that the reaction reaches a steady state at approximately 112 minutes. This indicates that the reaction sites on the single-atom catalysts are saturated and fully converted to the final product structure, Co-cyclam-CO.
Reasoning source: Page 6, Linear Combination Fitting and Structure Hypothesis sections
Scoring Rubric (total: 100 pts)
| Q | Type | Max | Question | Reference Answer | Scoring Criteria |
|---|---|---|---|---|---|
| q1 | reasoning | 30 | Under continuous light irradiation and CO2 purge for 112 minutes, what is the dominant Co structural motif expected in the Co-cyclam/C3N4 single-atom catalyst, and what physical process drives the conversion to this state? | The dominant Co structural motif expected is Co-cyclam-CO, which accounts for a 1.0 fraction (100%) of the sample at this stage. This conversion is driven by the C3N4 support absorbing light under the specified irradiation conditions and generating photoexcited electrons. These electrons are subsequently transferred to the atomically dispersed cobalt atoms to sequentially react with the purged CO2. By 112 minutes of reaction time, the single-atom catalyst sites become saturated and fully converted to this final steady-state product structure. | Full credit for identifying the Co-cyclam-CO product structure and explaining that photoexcited electrons from C3N4 transfer to the Co sites to reduce CO2, reaching saturation/steady-state at 112 minutes. |
| q2 | identification | 20 | If performing a Linear Combination Fitting (LCF) analysis to track the structural evolution of this catalyst during the in-situ photocatalytic reaction, what appropriate reference spectra (basis functions) should be utilized? | The appropriate reference spectra for the Linear Combination Fitting (LCF) analysis are the initial state "sample with TEOA and CO2 purge before light" (Co-cyclam-OCO2) and the final state "sample with light on for 143 min" (Co-cyclam-CO). These specific basis functions are necessary because they capture the complete structural evolution of the catalyst under the provided sample conditions. During the reaction, light irradiation causes the C3N4 support to generate photoexcited electrons that transfer to the Co atoms to react with CO2. Using these references reveals that by 112 minutes, the reaction sites are saturated and fully converted to the Co-cyclam-CO phase, yielding a fraction of 1.0 for the final state and 0.0 for the initial state. | Full credit for identifying the two end-member states: the initial state (sample with TEOA and CO2 purge before light, or Co-cyclam-OCO2) and the final steady-state product (sample after prolonged light exposure, or Co-cyclam-CO). |
| q3 | spectral | 30 | Describe the key distinguishing spectral feature in the Co K-edge XANES spectrum that indicates the catalyst has reached its steady-state structure at 112 minutes compared to the initial state before light irradiation. | The key distinguishing spectral feature is a prominent main peak at 7724 eV, which displays a significantly higher intensity compared to the initial state before light irradiation. This feature emerges because the C3N4 support absorbs light and transfers photoexcited electrons to the atomically dispersed Co atoms to react with CO2. As the photocatalytic reaction progresses under these conditions, the peak intensity continuously increases. By 112 minutes, the peak reaches a steady maximum and overlaps with subsequent spectra, indicating that the catalyst sites are saturated and fully converted to the final Co-cyclam-CO structure. | Full credit for mentioning the prominent peak at 7724 eV and noting that its intensity increases during the reaction, reaching a maximum/steady state at 112 minutes. |
| q4 | identification | 20 | Based on the proposed reaction mechanism and structural models for this single-atom catalyst system, what is the formal oxidation state of the Co center in the final steady-state complex? | The formal oxidation state of the Co center in the final steady-state complex is Co(III). This state arises directly from the photocatalytic reaction conditions, where light irradiation of the C3N4 support generates photoexcited electrons. These electrons are transferred to the atomically dispersed cobalt single atoms, driving a sequential reaction with CO2. After 112 minutes of reaction time, the catalyst sites become saturated and fully convert to the Co-cyclam-CO product structure, stabilizing the cobalt center in this specific Co(III) oxidation state. | Full credit for identifying the oxidation state as Co(III). |
Review
Coulombically-stabilized oxygen hole polarons enable fully reversible oxygen redox
BNL-NSLS-II-8-ID
Electrochemistry
Iwnetim I. Abate et al.
DOI: 10.1039/D1EE01037A
2 scenarios
▶
#1020
Na2Mn3O7
O K
▶
LLM Prompt
Sample Information
Material: Na2Mn3O7
Electrode Type: cathode
Charge Discharge: OCV
State Of Charge: x=0
Sample-Specific Conditions
- State of charge: Pristine
- Pristine uncycled electrode material
Measurement
We plan to measure the O K XANES spectrum of this sample.
Questions
Based on all the information above:
1. Describe the expected spectral shape and the position of the main absorption peak for the pristine Na2Mn3O7 sample at the O K-edge.
2. What specific electronic transition is responsible for the main absorption peak at 529.5 eV in the pristine material, and which oxygen sites contribute to it?
3. What specific spectral features are notably absent in this pristine sample that would otherwise indicate oxidized oxygen species (such as hole polarons or dimers) seen in charged states or other materials?
4. What structural feature in pristine Na2Mn3O7 creates the distinct oxygen environments (O1 and O2) that contribute to the main XAS peak?
Ground Truth
Material: Na2Mn3O7
Measurement: O K-edge XAS
Fit method: Not applicable (pure phase analysis and BSE simulation)
Phase fractions:
| Phase | Fraction |
|---|---|
| Na2Mn3O7 | 1.0 |
Source evidence: Figure 2B, Figure 4A, page 10
Key reasoning: The pristine material consists of a stable layered structure with ordered Mn vacancies, creating two unique oxygen environments: O1 (O-Mn2) and O2 (O-Mn3). In this uncharged state, oxygen exists as standard oxide anions without localized hole polarons or dimers. The XAS spectrum reflects transitions into unoccupied hybridized Mn3d-O2p* states.
Reasoning source: Results and discussion, pages 3, 10
Scoring Rubric (total: 100 pts)
| Q | Type | Max | Question | Reference Answer | Scoring Criteria |
|---|---|---|---|---|---|
| q1 | spectral | 25 | Describe the expected spectral shape and the position of the main absorption peak for the pristine Na2Mn3O7 sample at the O K-edge. | The expected O K-edge XANES spectrum for the pristine Na2Mn3O7 sample features a high-intensity main absorption peak located at 529.5 eV. The spectrum notably lacks any pre-edge features below 528 eV. These spectral characteristics arise because the sample is in its pristine, uncycled state (x=0 at OCV), meaning it consists of a stable layered structure with standard oxide anions. In this uncharged state, there are no localized hole polarons or O-O dimers to create additional pre-edge features, leaving only the main transitions into unoccupied hybridized Mn3d-O2p* states. | Full points if the answer identifies the main absorption peak at 529.5 eV and notes the lack of pre-edge features below 528 eV. |
| q2 | reasoning | 30 | What specific electronic transition is responsible for the main absorption peak at 529.5 eV in the pristine material, and which oxygen sites contribute to it? | The main absorption peak at 529.5 eV is caused by O1s to unoccupied hybridized Mn3d-O2p* electronic transitions. Both the O1 (O-Mn2) and O2 (O-Mn3) oxygen sites contribute to this high-intensity peak. This occurs because the pristine, uncycled Na2Mn3O7 cathode material possesses a stable layered structure with ordered Mn vacancies, which inherently creates these two unique oxygen environments. Because the sample is at a state of charge of x=0 (OCV), the oxygen exists purely as standard oxide anions, allowing these fundamental hybridized transitions to dominate the spectrum without interference from oxidized oxygen species. | Full points if the answer specifies the O1s -> (Mn3d-O2p*) transition and mentions that both O1 and O2 sites contribute equally. |
| q3 | prediction | 25 | What specific spectral features are notably absent in this pristine sample that would otherwise indicate oxidized oxygen species (such as hole polarons or dimers) seen in charged states or other materials? | The pristine sample's spectrum notably lacks a pre-edge peak at 527.5 eV and a feature at 531 eV. The absence of the 527.5 eV peak indicates a lack of oxygen hole polarons, while the absence of the 531 eV feature confirms there are no O-O dimers. These features are absent because the Na2Mn3O7 cathode is in a pristine, uncycled state at OCV (x=0). Under these specific uncharged conditions, the oxygen exists entirely as standard oxide anions within a stable layered structure, preventing the formation of the oxidized oxygen species that would otherwise generate those additional spectral peaks. | Full points if the answer identifies the absence of the 527.5 eV peak (hole polarons) and the 531 eV feature (O-O dimers). |
| q4 | reasoning | 20 | What structural feature in pristine Na2Mn3O7 creates the distinct oxygen environments (O1 and O2) that contribute to the main XAS peak? | The distinct O1 (O-Mn2) and O2 (O-Mn3) oxygen environments are created by the presence of ordered Mn vacancies within the stable layered structure of the material. Both of these unique sites contribute to the main O1s to Mn3d-O2p* transition peak at 529.5 eV. This structural configuration is characteristic of the pristine, uncycled Na2Mn3O7 cathode at a state of charge of x=0. Because the material is in this uncharged OCV state, the structural integrity of the ordered vacancies is maintained, and the oxygen remains as standard oxide anions rather than forming oxidized species like dimers or polarons. | Full points if the answer explains that ordered Mn vacancies in the layered structure create the two unique oxygen environments. |
Review
#1021
Na1Mn3O7
O K
▶
LLM Prompt
Sample Information
Material: Na1Mn3O7
Electrode Type: cathode
Charge Discharge: charged
C Rate: C/20
Voltage V: 4.7
State Of Charge: x=1.0
Cycle Number: 1
Sample-Specific Conditions
- Voltage: 4.7 V
- Electrode charged to 4.7 V, corresponding to 50% desodiation
Measurement
We plan to measure the O K XANES spectrum of this sample.
Questions
Based on all the information above:
1. Describe the expected O K-edge XANES spectral features for Na1Mn3O7 charged to 4.7 V. Specifically, identify the energy positions and electronic origins of the main edge and any new pre-edge features that emerge compared to the pristine state.
2. Based on the physical chemistry of this system, why does charging to 4.7 V (50% desodiation) produce localized oxygen hole polarons rather than the O-O dimers typically observed in other highly oxidized layered oxides?
3. If you were to perform a Linear Combination Fitting (LCF) to track the evolution of the oxygen redox species during the charge from the pristine state to 4.7 V, what reference spectra would be necessary to model the phase composition?
Ground Truth
Material: Na1Mn3O7
Measurement: O K-edge XAS (Total Electron Yield)
Fit method: Direct spectral observation and BSE simulation
Phase fractions:
| Phase | Fraction |
|---|---|
| Na1Mn3O7 | 1.0 |
Fit basis (paper's reference spectra):
- Pristine Na2Mn3O7
- Charged Na1Mn3O7 (localized O- hole polaron)
Source evidence: Figure 2D, Figure 4B, Page 10
Key reasoning: Charging to 4.7 V (50% desodiation) results in the oxidation of oxygen anions, forming localized oxygen hole polarons (O-) rather than O-O dimers. This state is stabilized by coulombic interactions between the oxygen hole polarons and the interlayer Na vacancies, which disfavor rehybridization. The hole polarons localize preferentially on the under-coordinated O1 sites that surround the structural Mn vacancy.
Reasoning source: Page 10 (Results and discussion), Page 13
Scoring Rubric (total: 101 pts)
| Q | Type | Max | Question | Reference Answer | Scoring Criteria |
|---|---|---|---|---|---|
| q1 | spectral | 38 | Describe the expected O K-edge XANES spectral features for Na1Mn3O7 charged to 4.7 V. Specifically, identify the energy positions and electronic origins of the main edge and any new pre-edge features that emerge compared to the pristine state. | The expected O K-edge XANES spectrum for Na1Mn3O7 charged to 4.7 V features a main absorption edge at 529.5 eV and a distinct new pre-edge peak at 527.5 eV. The main edge at 529.5 eV originates from O1s → (Mn3d–O2p*) transitions involving both O1 and O2 sites, while the prominent pre-edge feature at 527.5 eV arises from O- 1s → 2p (hole) transitions. These specific spectral features emerge because charging the electrode to 4.7 V (50% desodiation) oxidizes the oxygen anions to form localized oxygen hole polarons (O-) on under-coordinated O1 sites surrounding Mn vacancies. This localized hole polaron state completely lacks a feature at ~531 eV, distinguishing it from materials that form O-O dimers upon deep charging. | Award full points for identifying the pre-edge peak at ~527.5 eV originating from O- 1s -> 2p (hole) transitions (localized hole polarons) and the main edge at ~529.5 eV originating from O1s -> (Mn3d-O2p*) transitions. |
| q2 | reasoning | 38 | Based on the physical chemistry of this system, why does charging to 4.7 V (50% desodiation) produce localized oxygen hole polarons rather than the O-O dimers typically observed in other highly oxidized layered oxides? | Charging the Na1Mn3O7 cathode to 4.7 V, which corresponds to 50% desodiation, results in the oxidation of oxygen anions to form localized oxygen hole polarons (O-) rather than O-O dimers. This specific localized state is stabilized by strong coulombic interactions between the newly formed oxygen hole polarons and the interlayer Na vacancies generated during the deep desodiation process. These coulombic interactions actively disfavor the structural rehybridization that would be required to form O-O dimers. Consequently, the hole polarons preferentially localize on the under-coordinated O1 sites that surround the intrinsic structural Mn vacancies in the material. | Award full points for explaining that coulombic interactions between the oxidized oxygen anions (hole polarons) and the interlayer Na vacancies stabilize the localized holes and disfavor the rehybridization required to form O-O dimers. |
| q4 | identification | 25 | If you were to perform a Linear Combination Fitting (LCF) to track the evolution of the oxygen redox species during the charge from the pristine state to 4.7 V, what reference spectra would be necessary to model the phase composition? | To model the phase composition during the charge to 4.7 V, the necessary reference spectra would be Pristine Na2Mn3O7 and Charged Na1Mn3O7 (representing the localized O- hole polaron state). At the final 4.7 V state, the fraction of the Charged Na1Mn3O7 phase reaches 1.0. These specific reference phases are required because charging the material to 4.7 V (50% desodiation) drives the oxidation of oxygen anions to form localized hole polarons on under-coordinated O1 sites rather than forming O-O dimers. This complete phase conversion to Na1Mn3O7 is driven by the coulombic stabilization between the oxygen hole polarons and the newly created interlayer Na vacancies, which prevents further structural rehybridization. | Award full points for identifying the need for a pristine Na2Mn3O7 reference and a charged Na1Mn3O7 reference representing the localized O- hole polaron state. |
Review
Doping-modulated strain control of bifunctional electrocatalysis for rechargeable zinc–air batteries
APS
Catalyst
Zhao Li et al.
DOI: 10.1039/D1EE01271A
2 scenarios
▶
#1022
Cu-doped CoF2-CoS2
Cu K-edge
▶
LLM Prompt
Sample Information
Material: Cu-doped CoF2-CoS2
Sample-Specific Conditions
- Cu content: 4.42 at%
- Cu-doped cobalt fluoride-sulfide nanoporous film
Measurement
We plan to measure the Cu K-edge XANES spectrum of this sample.
Questions
Based on all the information above:
1. What reference spectra should be used to evaluate the oxidation state of Cu in the Cu4.42-CoFS sample, and what oxidation state is expected based on the XANES analysis?
2. Describe the expected position of the white line peak in the Cu K-edge XANES spectrum for this sample and explain what its intensity indicates according to the paper.
3. How does the intensity of the Cu white line peak for the Cu4.42-CoFS sample compare to that of the Cu6.81-CoFS sample, and what does this difference reflect about the electronic structure?
Ground Truth
Material: Cu-doped CoF2-CoS2 (Cu4.42-CoFS)
Measurement: Cu K-edge XANES, ex-situ, beamline 9-BM of Advanced Photon Source (APS)
Fit method: qualitative comparison
Fit basis (paper's reference spectra):
- Cu foil
- Cu2O
- CuO
Source evidence: Figure 2c, page 10
Key reasoning: The Cu K-edge XANES spectrum of Cu4.42-CoFS shows an edge position and spectral shape similar to the CuO reference, indicating that the Cu cations have an oxidation state similar to Cu2+. This is consistent with the XPS results.
Reasoning source: Page 10, Results and Discussion
Scoring Rubric (total: 100 pts)
| Q | Type | Max | Question | Reference Answer | Scoring Criteria |
|---|---|---|---|---|---|
| q1 | identification | 30 | What reference spectra should be used to evaluate the oxidation state of Cu in the Cu4.42-CoFS sample, and what oxidation state is expected based on the XANES analysis? | To evaluate the oxidation state of Cu in the Cu4.42-CoFS sample, the reference spectra that should be used are Cu foil, Cu2O, and CuO. Based on the XANES analysis, the expected oxidation state of the Cu dopants is 2+. For this Cu-doped cobalt fluoride-sulfide nanoporous film with 4.42 at% Cu, these specific references are chosen to provide a baseline for Cu0, Cu1+, and Cu2+ states. The sample's Cu K-edge XANES spectrum exhibits an edge position and spectral shape highly similar to the CuO reference, which mechanistically confirms that the Cu cations in this specific composition possess a Cu2+ oxidation state, consistent with XPS results. | Award full points for identifying Cu, Cu2O, and CuO as appropriate references and stating the expected oxidation state is 2+ (similar to CuO). |
| q2 | spectral | 35 | Describe the expected position of the white line peak in the Cu K-edge XANES spectrum for this sample and explain what its intensity indicates according to the paper. | The white line peak in the Cu K-edge XANES spectrum for the Cu4.42-CoFS sample is expected to be located at 9000 eV. According to the paper, the intensity of this peak directly reflects the presence and quantity of empty states in the material. In this Cu-doped cobalt fluoride-sulfide nanoporous film, the specific Cu dopant content (4.42 at%) dictates the electronic structure and the availability of these empty Cu states. Because the sample's overall spectral shape closely resembles the CuO reference (confirming a +2 oxidation state), the white line intensity at 9000 eV acts as a structural probe that varies with dopant concentration to reveal changes in the empty states. | Award full points for stating the white line peak is located at approximately 9000 eV and that its intensity corresponds to the amount of empty Cu states. |
| q3 | reasoning | 35 | How does the intensity of the Cu white line peak for the Cu4.42-CoFS sample compare to that of the Cu6.81-CoFS sample, and what does this difference reflect about the electronic structure? | The intensity of the Cu white line peak at 9000 eV for the Cu4.42-CoFS sample is higher than that of the Cu6.81-CoFS sample. This difference directly reflects variations in the empty states of the electronic structure driven by the specific Cu dopant content in the cobalt fluoride-sulfide nanoporous films. The Cu4.42-CoFS sample, with its lower 4.42 at% Cu concentration, maintains a higher number of empty Cu states compared to the Cu6.81-CoFS sample, which is noted to have the least empty Cu states. Consequently, because the white line peak intensity originates from transitions into empty states, the specific doping conditions of the 4.42 at% sample result in the observed higher peak intensity. | Award full points for noting that Cu4.42-CoFS has a higher white line intensity than Cu6.81-CoFS, reflecting that Cu6.81-CoFS has the least empty Cu states among the samples. |
Review
#1023
CoF2-CoS2
Co K-edge
▶
LLM Prompt
Sample Information
Material: CoF2-CoS2
Sample-Specific Conditions
- Cu content: 0 at%
- Cobalt fluoride-sulfide nanoporous film
Measurement
We plan to measure the Co K-edge XANES spectrum of this sample.
Questions
Based on all the information above:
1. Based on the material composition (CoF2-CoS2), what is the expected oxidation state of Co in the CoFS sample, and what general spectral characteristics would support this assignment?
Ground Truth
Material: CoF2-CoS2
Measurement: Co K-edge XANES, ex-situ, beamline 9-BM of Advanced Photon Source (APS)
Fit method: not reported
Source evidence: Figure 2d, page 10
Key reasoning: The Co K-edge XANES spectrum shows that Co cations in the CoFS heterostructure have an oxidation state similar to Co2+. The white line intensity of CoFS is intermediate between that of pure CoF2 (which has the highest intensity) and pure CoS2 (which has the lowest intensity), reflecting the presence of both Co-F and Co-S bonding in the material.
Reasoning source: Section 2. Results and Discussion, page 10
Scoring Rubric (total: 100 pts)
| Q | Type | Max | Question | Reference Answer | Scoring Criteria |
|---|---|---|---|---|---|
| q1 | spectral | 100 | Based on the material composition (CoF2-CoS2), what is the expected oxidation state of Co in the CoFS sample, and what general spectral characteristics would support this assignment? | The expected oxidation state of Co in the CoFS sample is Co2+. This assignment is supported by an absorption edge position consistent with Co2+ and a prominent white line peak at 7725 eV originating from empty Co states. Because the sample is a cobalt fluoride-sulfide (CoF2-CoS2) nanoporous film with 0 at% Cu, it forms a heterostructure containing both Co-F and Co-S bonds. Consequently, the white line intensity is intermediate between that of pure CoF2 (which has the highest intensity) and pure CoS2 (which has the lowest intensity), directly reflecting this mixed bonding environment. | Award 15 points for identifying the expected oxidation state as Co2+. Award 15 points for stating that the absorption edge position and shape should be consistent with Co2+ reference materials. |
Review
Elucidating a dissolution–deposition reaction mechanism by multimodal synchrotron X-ray characterization in aqueous Zn/MnO 2 batteries
BNL-NSLS-II-8-ID
Electrochemistry
Varun R. Kankanallu et al.
DOI: 10.1039/D2EE03731A
7 scenarios
▶
#1024
beta-MnO2
Zn K-edge
▶
LLM Prompt
Sample Information
Material: beta-MnO2
Electrode Type: cathode
Electrolyte: 2 M ZnSO4 + 0.1 M MnSO4
Cell Type: pouch cell
Charge Discharge: OCV
C Rate: 0.2 C
Sample-Specific Conditions
- cycle_state: Pristine
- Pristine state before cycling
Measurement
We plan to measure the Zn K-edge XANES spectrum of this sample.
Questions
Based on all the information above:
1. Identify the candidate reference spectra or pure components required to model the phase evolution of the Zn K-edge XANES data during the operando cycling of this battery system.
2. Estimate the relative fractions of the Zn-containing phases in the pristine state (OCV, before cycling).
3. Provide a physical justification for the dominant Zn species observed in the pristine state, and explain why the Zn K-edge signal does not represent the active cathode material itself.
Ground Truth
Material: beta-MnO2 cathode in 2 M ZnSO4 + 0.1 M MnSO4 electrolyte
Measurement: Zn K-edge operando XAS, ISS beamline (8-ID)
Fit method: MCR-ALS
Phase fractions: (±10%)
| Phase | Fraction |
|---|---|
| ZnSO4 (electrolyte) | 0.85 |
| Zinc Hydroxide Sulfate (ZHS) | 0.0 |
| Zn-Mn Complex | 0.15 |
Fit basis (paper's reference spectra):
- ZnSO4 electrolyte (in liquid state)
- 1st cycle discharge sample (corresponding to the ZHS phase)
- Zn-Mn complex (obtained from the electrodeposited sample)
Source evidence: Figure 7D, Page 28
Key reasoning: In the pristine state before any electrochemical cycling, the active cathode material is beta-MnO2, which does not contain zinc. Therefore, the Zn K-edge XAS signal originates almost entirely from the liquid ZnSO4 electrolyte permeating the cell and electrode pores. The MCR-ALS fitting reflects this physical reality by assigning the vast majority of the concentration profile at t=0 to the ZnSO4 component. The small initial fraction (~15%) of the Zn-Mn complex component is likely an artifact of the MCR-ALS fitting constraints or minor initial surface interactions, as no electrochemical deposition has yet occurred.
Reasoning source: Section 2.7, Page 27 and Figure 7D
Scoring Rubric (total: 100 pts)
| Q | Type | Max | Question | Reference Answer | Scoring Criteria |
|---|---|---|---|---|---|
| q1 | identification | 30 | Identify the candidate reference spectra or pure components required to model the phase evolution of the Zn K-edge XANES data during the operando cycling of this battery system. | To model the phase evolution of the Zn K-edge XANES data, the required pure components are liquid ZnSO4 electrolyte, a 1st cycle discharge sample corresponding to the Zinc Hydroxide Sulfate (ZHS) phase, and a Zn-Mn complex obtained from an electrodeposited sample. These specific phases are expected because the battery utilizes a 2 M ZnSO4 + 0.1 M MnSO4 electrolyte and a beta-MnO2 cathode. In the pristine state before cycling, the beta-MnO2 cathode contains no zinc, meaning the initial Zn signal must originate entirely from the liquid ZnSO4 electrolyte permeating the cell. The ZHS and Zn-Mn complex components are required as reference bases to capture the subsequent electrochemical deposition and phase transformations that will occur once the 0.2 C cycling begins. | Full credit for identifying the three necessary components: ZnSO4 (electrolyte), a ZHS phase (or 1st cycle discharge sample), and a Zn-Mn complex (or electrodeposited sample). |
| q2 | quantification | 35 | Estimate the relative fractions of the Zn-containing phases in the pristine state (OCV, before cycling). | In the pristine state at OCV before cycling, the relative fractions of the Zn-containing phases are 0.85 (85%) for the liquid ZnSO4 electrolyte, 0.0 (0%) for Zinc Hydroxide Sulfate (ZHS), and 0.15 (15%) for the Zn-Mn complex, with a 10% uncertainty. These specific values result directly from the initial cell conditions, as the active beta-MnO2 cathode material inherently contains no zinc before cycling. Consequently, the Zn K-edge XAS signal originates almost entirely from the 2 M ZnSO4 electrolyte permeating the electrode pores, explaining the dominant 85% fraction. The 0% ZHS and minor 15% Zn-Mn complex fractions reflect the lack of electrochemical cycling; the small Zn-Mn complex fraction is likely an artifact of the MCR-ALS fitting constraints or minor initial surface interactions prior to any actual electrodeposition. | Full credit for estimating ZnSO4 at ~85%, ZHS at ~0%, and Zn-Mn complex at ~15%. Partial credit if the student correctly identifies that ZnSO4 is the overwhelmingly dominant phase (>80%) with ZHS at 0%. |
| q3 | reasoning | 35 | Provide a physical justification for the dominant Zn species observed in the pristine state, and explain why the Zn K-edge signal does not represent the active cathode material itself. | The dominant Zn species observed in the pristine state is the liquid ZnSO4 electrolyte, which accounts for 85% of the measured signal. The Zn K-edge signal does not represent the active cathode material itself because the pristine cathode is composed of beta-MnO2, which inherently lacks zinc in its structure. Because the cell is at OCV and has not yet undergone its planned 0.2 C cycling, no electrochemical deposition of zinc-containing solid phases like ZHS has occurred. Therefore, the physical origin of the measured Zn XANES signal is simply the 2 M ZnSO4 + 0.1 M MnSO4 liquid electrolyte that permeates the pouch cell and the pores of the pristine electrode. | Full credit for explaining that the pristine cathode is beta-MnO2 (which contains no zinc), so the Zn K-edge X-ray beam primarily probes the liquid ZnSO4 electrolyte permeating the cell. Must note that any minor fitted fractions of other phases (like Zn-Mn complex) prior to cycling are likely fitting artifacts or minor surface interactions. |
Review
#1025
beta-MnO2
Zn K-edge
▶
LLM Prompt
Sample Information
Material: beta-MnO2
Electrode Type: cathode
Electrolyte: 2 M ZnSO4 + 0.1 M MnSO4
Cell Type: pouch cell
Charge Discharge: discharged
C Rate: 0.2 C
Voltage V: 1.0
Cycle Number: 1
Sample-Specific Conditions
- cycle_state: 1st Discharge
- End of 1st discharge
Measurement
We plan to measure the Zn K-edge XANES spectrum of this sample.
Questions
Based on all the information above:
1. Based on the electrochemical system (Zn/beta-MnO2 in aqueous ZnSO4/MnSO4), what candidate reference spectra or pure components should be included in a basis set to model the operando Zn K-edge XANES data during cycling?
2. Estimate the relative phase fractions of the Zn-containing components at the end of the 1st discharge (1.0 V, 0.2 C).
3. Explain the reaction mechanism that leads to the formation of the dominant solid Zn-containing phase at the end of the first discharge, and how this alters the local Zn speciation.
Ground Truth
Material: beta-MnO2
Measurement: operando Zn K-edge XANES in transmission and fluorescence modes at ISS (8-ID) beamline
Fit method: MCR-ALS
Phase fractions: (±15%)
| Phase | Fraction |
|---|---|
| Zinc Hydroxide Sulfate (ZHS) | 0.7 |
| ZnSO4 (electrolyte) | 0.2 |
| Zn-Mn Complex | 0.1 |
Fit basis (paper's reference spectra):
- ZnSO4 electrolyte (in liquid state)
- 1st cycle discharge sample (corresponding to the Zinc Hydroxide Sulfate / ZHS phase)
- Zn-Mn complex obtained from the electrodeposited sample
Source evidence: Figure 7D, page 28
Key reasoning: During the first discharge, the irreversible dissolution of beta-MnO2 consumes protons, leading to a local pH increase at the electrode-electrolyte interface. This pH change drives the precipitation of Zinc Hydroxide Sulfate (ZHS) on the electrode surface. Consequently, MCR-ALS analysis of the operando Zn K-edge data shows that the ZHS phase dominates the Zn speciation (~70%) at the end of the first discharge, while the relative concentration of the ZnSO4 electrolyte decreases. A minor fraction of a Zn-Mn complex is also resolved by the model.
Reasoning source: Section 2.7 (Phase evolution studied by the MCR-ALS analysis), page 27, and Section 2.8 (Proposed reaction mechanism), page 29
Scoring Rubric (total: 100 pts)
| Q | Type | Max | Question | Reference Answer | Scoring Criteria |
|---|---|---|---|---|---|
| q1 | identification | 30 | Based on the electrochemical system (Zn/beta-MnO2 in aqueous ZnSO4/MnSO4), what candidate reference spectra or pure components should be included in a basis set to model the operando Zn K-edge XANES data during cycling? | To model the operando Zn K-edge XANES data, the basis set should include liquid ZnSO4 electrolyte, Zinc Hydroxide Sulfate (ZHS) representing the 1st cycle discharge sample, and a Zn-Mn complex obtained from an electrodeposited sample. These specific components are required because, during the first discharge of the beta-MnO2 cathode in the aqueous ZnSO4/MnSO4 electrolyte, the irreversible dissolution of beta-MnO2 consumes protons. This proton consumption increases the local pH at the electrode-electrolyte interface, which drives the precipitation of the ZHS phase on the electrode surface alongside the remaining liquid electrolyte and a minor Zn-Mn complex. | Full points for identifying the three key components: the electrolyte (ZnSO4), the discharge precipitate (Zinc Hydroxide Sulfate / ZHS), and a Zn-Mn complex (or electrodeposited charged-state reference). |
| q2 | quantification | 30 | Estimate the relative phase fractions of the Zn-containing components at the end of the 1st discharge (1.0 V, 0.2 C). | At the end of the 1st discharge to 1.0 V at 0.2 C, the relative phase fractions are approximately 70% Zinc Hydroxide Sulfate (ZHS), 20% liquid ZnSO4 electrolyte, and 10% Zn-Mn complex, with an estimated uncertainty of 15%. These specific values result from the irreversible dissolution of the beta-MnO2 cathode during the initial discharge, which consumes protons and causes a local pH increase at the electrode-electrolyte interface. This pH change drives the extensive precipitation of ZHS, making it the dominant Zn speciation phase (70%) on the electrode surface, while consequently decreasing the relative concentration of the remaining ZnSO4 electrolyte (20%) and leaving a minor fraction of the Zn-Mn complex (10%). | Full points if Zinc Hydroxide Sulfate (ZHS) is identified as the dominant phase (~70%), with remaining contributions from the ZnSO4 electrolyte (~20%) and a minor Zn-Mn complex (~10%). |
| q3 | reasoning | 40 | Explain the reaction mechanism that leads to the formation of the dominant solid Zn-containing phase at the end of the first discharge, and how this alters the local Zn speciation. | During the first discharge of the beta-MnO2 cathode to 1.0 V, the dominant solid Zn-containing phase formed is Zinc Hydroxide Sulfate (ZHS). The formation mechanism is driven by the irreversible dissolution of beta-MnO2, which consumes protons and leads to a localized pH increase at the electrode-electrolyte interface. This elevated pH triggers the precipitation of ZHS directly onto the electrode surface from the aqueous ZnSO4/MnSO4 electrolyte. Consequently, the local Zn speciation is drastically altered, shifting from being primarily liquid ZnSO4 electrolyte to being dominated by the precipitated ZHS phase (~70%), alongside a reduced fraction of electrolyte and a minor Zn-Mn complex. | Must explain that the dissolution of MnO2 consumes protons, causing a local pH increase that triggers the precipitation of Zinc Hydroxide Sulfate (ZHS) as the dominant solid phase, thereby depleting the local ZnSO4 electrolyte concentration. |
Review
#1026
beta-MnO2
Zn K-edge
▶
LLM Prompt
Sample Information
Material: beta-MnO2
Electrode Type: cathode
Electrolyte: 2 M ZnSO4 + 0.1 M MnSO4
Cell Type: pouch cell
Charge Discharge: charged
C Rate: 0.2 C
Voltage V: 1.75
Cycle Number: 1
Sample-Specific Conditions
- cycle_state: 1st Charge
- End of 1st charge
Measurement
We plan to measure the Zn K-edge XANES spectrum of this sample.
Questions
Based on all the information above:
1. Identify the necessary reference spectra or basis components needed to accurately model the operando Zn K-edge XANES spectra for this battery system during its first charge cycle.
Ground Truth
Material: beta-MnO2
Measurement: Operando Zn K-edge XAS, ISS beamline (8-ID) at NSLS-II
Fit method: MCR-ALS
Phase fractions: (±10%)
| Phase | Fraction |
|---|---|
| ZnSO4 (electrolyte) | 0.7 |
| Zinc Hydroxide Sulfate (ZHS) | 0.0 |
| Zn-Mn Complex | 0.3 |
Fit basis (paper's reference spectra):
- ZnSO4 electrolyte (in liquid state)
- 1st cycle discharge sample (ZHS phase)
- Zn-Mn complex (from electrodeposited sample)
Source evidence: Figure 7D and Section 2.7 (Page 27)
Key reasoning: During the first discharge, Zinc Hydroxide Sulfate (ZHS) precipitates due to proton consumption and a local pH increase caused by MnO2 dissolution. Upon charging to 1.75 V, the ZHS phase reversibly dissolves back into the electrolyte, bringing its solid fraction to zero. Simultaneously, an amorphous Zn-Mn complex forms and deposits on the electrode, accounting for the new Zn-containing solid phase. The majority of the Zn signal remains from the ZnSO4 electrolyte present in the beam path.
Reasoning source: Section 2.7 (Page 27) and Section 2.8 (Page 29)
Scoring Rubric (total: 100 pts)
| Q | Type | Max | Question | Reference Answer | Scoring Criteria |
|---|---|---|---|---|---|
| q1 | identification | 100 | Identify the necessary reference spectra or basis components needed to accurately model the operando Zn K-edge XANES spectra for this battery system during its first charge cycle. | To accurately model the operando Zn K-edge XANES spectrum for this system, the necessary basis components are liquid ZnSO4 electrolyte, Zinc Hydroxide Sulfate (ZHS) representing the first cycle discharge phase, and an amorphous Zn-Mn complex. These specific references are required because of the phase evolution that occurs in the beta-MnO2 cathode and ZnSO4/MnSO4 electrolyte system during cycling. During the initial discharge, ZHS precipitates due to proton consumption and a local pH increase caused by MnO2 dissolution. By the end of the first charge at 1.75 V, the ZHS phase reversibly dissolves back into the electrolyte, while an amorphous Zn-Mn complex simultaneously forms and deposits on the electrode. Finally, the liquid ZnSO4 component is necessary to account for the bulk electrolyte that remains in the beam path during the operando pouch cell measurement. | Full points for identifying the three key components: ZnSO4 electrolyte (liquid state), Zinc Hydroxide Sulfate (ZHS), and a Zn-Mn complex phase. |
Review
#1027
beta-MnO2
Zn K-edge
▶
LLM Prompt
Sample Information
Material: beta-MnO2
Electrode Type: cathode
Electrolyte: 2 M ZnSO4 + 0.1 M MnSO4
Cell Type: pouch cell
Charge Discharge: discharged
C Rate: 0.2 C
Voltage V: 1.0
Cycle Number: 2
Sample-Specific Conditions
- cycle_state: 2nd Discharge
- End of 2nd discharge
Measurement
We plan to measure the Zn K-edge XANES spectrum of this sample.
Questions
Based on all the information above:
1. What candidate reference spectra or pure components are required to model the operando Zn K-edge XANES data for this battery system during cycling?
Ground Truth
Material: beta-MnO2
Measurement: operando Zn K-edge XANES, transmission and fluorescence modes, ISS beamline (8-ID)
Fit method: MCR-ALS
Phase fractions: (±15%)
| Phase | Fraction |
|---|---|
| ZnSO4 (electrolyte) | 0.2 |
| Zinc Hydroxide Sulfate (ZHS) | 0.65 |
| Zn-Mn Complex | 0.15 |
Fit basis (paper's reference spectra):
- ZnSO4 electrolyte (in liquid state)
- 1st cycle discharge sample (ZHS phase)
- Zn-Mn complex obtained from the electrodeposited sample
Source evidence: Figure 7D and Section 2.7 (Page 27)
Key reasoning: During the discharge half-cycle, the dissolution of beta-MnO2 consumes protons, leading to a local pH increase at the electrode-electrolyte interface. This pH change causes the precipitation of Zinc Hydroxide Sulfate (ZHS), which dominates the Zn solid phases during discharge. The MCR-ALS concentration profiles show the ZHS component peaking at the end of each discharge, while the relative concentration of the ZnSO4 electrolyte decreases as it is consumed to form ZHS. The Zn-Mn complex, which forms during the charge cycle, gradually increases in overall concentration with increasing cycles and is present as a minor component at the end of the 2nd discharge.
Reasoning source: Section 2.7 (Page 27) and Section 2.8 (Page 29)
Scoring Rubric (total: 100 pts)
| Q | Type | Max | Question | Reference Answer | Scoring Criteria |
|---|---|---|---|---|---|
| q1 | identification | 100 | What candidate reference spectra or pure components are required to model the operando Zn K-edge XANES data for this battery system during cycling? | To model the operando Zn K-edge XANES data for this system, the required reference components are liquid ZnSO4 electrolyte, Zinc Hydroxide Sulfate (ZHS) representing the 1st cycle discharge phase, and a Zn-Mn complex obtained from an electrodeposited sample. These specific phases are expected due to the electrochemical reactions occurring at the beta-MnO2 cathode by the end of the 2nd discharge at 1.0 V. Specifically, the discharge process consumes protons, which increases the local pH at the electrode-electrolyte interface and drives the precipitation of the ZnSO4 electrolyte into the dominant ZHS phase. Furthermore, the Zn-Mn complex forms during the preceding charge cycles and gradually increases in overall concentration, remaining present as a necessary minor component to model the system during this 2nd discharge state. | Full points for identifying the three main components: ZnSO4 (electrolyte), Zinc Hydroxide Sulfate (ZHS / 1st cycle discharge phase), and a Zn-Mn complex (electrodeposited phase). |
Review
#1028
beta-MnO2
Zn K-edge
▶
LLM Prompt
Sample Information
Material: beta-MnO2
Electrode Type: cathode
Electrolyte: 2 M ZnSO4 + 0.1 M MnSO4
Cell Type: pouch cell
Charge Discharge: charged
C Rate: 0.2 C
Voltage V: 1.75
Cycle Number: 2
Sample-Specific Conditions
- cycle_state: 2nd Charge
- End of 2nd charge
Measurement
We plan to measure the Zn K-edge XANES spectrum of this sample.
Questions
Based on all the information above:
1. What candidate reference spectra or pure components are needed to model the Zn K-edge XANES phase evolution of this cathode during operando cycling?
Ground Truth
Material: beta-MnO2
Measurement: Zn K-edge XANES, operando, ISS beamline (8-ID) at NSLS-II
Fit method: MCR-ALS
Phase fractions: (±10%)
| Phase | Fraction |
|---|---|
| ZnSO4 (electrolyte) | 0.6 |
| Zinc Hydroxide Sulfate (ZHS) | 0.0 |
| Zn-Mn Complex | 0.4 |
Fit basis (paper's reference spectra):
- ZnSO4 electrolyte (in liquid state)
- 1st cycle discharge sample (corresponding to the ZHS phase)
- Zn-Mn complex from the electrodeposited sample
Source evidence: Figure 7D, Page 28
Key reasoning: During the charge half-cycle, the Zinc Hydroxide Sulfate (ZHS) phase that precipitated during discharge reversibly dissolves, leading to its absence (0.0 fraction) at the end of the charge. Concurrently, an amorphous Zn-Mn complex phase forms on the electrode, which gradually increases in concentration with cycling. The relative concentration of the ZnSO4 electrolyte decreases correspondingly as the Zn-Mn complex forms, leaving a mixture of primarily electrolyte and the newly formed Zn-Mn complex at the end of the 2nd charge.
Reasoning source: Section 2.7 (Page 27) and Section 2.8 (Page 29)
Scoring Rubric (total: 100 pts)
| Q | Type | Max | Question | Reference Answer | Scoring Criteria |
|---|---|---|---|---|---|
| q1 | identification | 100 | What candidate reference spectra or pure components are needed to model the Zn K-edge XANES phase evolution of this cathode during operando cycling? | To model the Zn K-edge XANES phase evolution of this beta-MnO2 cathode during operando cycling, the necessary reference spectra are liquid ZnSO4 electrolyte, a 1st cycle discharge sample corresponding to the Zinc Hydroxide Sulfate (ZHS) phase, and a Zn-Mn complex from an electrodeposited sample. These specific components are required because they capture the dynamic chemical transformations occurring in the 2 M ZnSO4 + 0.1 M MnSO4 electrolyte system. During the charge half-cycle, the ZHS phase that precipitates during discharge reversibly dissolves. Concurrently, an amorphous Zn-Mn complex forms on the electrode and gradually increases in concentration with cycling. By the end of the 2nd charge at 1.75 V, the ZHS has completely dissolved, meaning the system is best modeled as a mixture of the remaining ZnSO4 electrolyte and the newly formed Zn-Mn complex. | Full points if the answer identifies the three key components: ZnSO4 (electrolyte), Zinc Hydroxide Sulfate (ZHS / 1st cycle discharge product), and a Zn-Mn complex (electrodeposited sample). |
Review
#1029
beta-MnO2
Zn K-edge
▶
LLM Prompt
Sample Information
Material: beta-MnO2
Electrode Type: cathode
Electrolyte: 2 M ZnSO4 + 0.1 M MnSO4
Cell Type: pouch cell
Charge Discharge: discharged
C Rate: 0.2 C
Voltage V: 1.0
Cycle Number: 3
Sample-Specific Conditions
- cycle_state: 3rd Discharge
- End of 3rd discharge
Measurement
We plan to measure the Zn K-edge XANES spectrum of this sample.
Questions
Based on all the information above:
1. Identify the candidate reference spectra or basis functions required to accurately model the operando Zn K-edge XANES spectrum of this sample.
2. Estimate the relative phase fractions of the Zn-containing species at the end of the 3rd discharge (1.0 V).
3. Provide the electrochemical reasoning for the phase composition at the end of the 3rd discharge. Specifically, explain the mechanism driving the formation of the dominant phase and the presence of the minor solid phase.
Ground Truth
Material: beta-MnO2
Measurement: operando Zn K-edge XANES at ISS beamline (8-ID)
Fit method: MCR-ALS
Phase fractions: (±15%)
| Phase | Fraction |
|---|---|
| ZnSO4 (electrolyte) | 0.1 |
| Zinc Hydroxide Sulfate (ZHS) | 0.7 |
| Zn-Mn Complex | 0.2 |
Fit basis (paper's reference spectra):
- ZnSO4 electrolyte (liquid state)
- 1st cycle discharge sample (ZHS phase)
- Zn-Mn complex (electrodeposited sample)
Source evidence: Figure 7D, page 28
Key reasoning: During the discharge half-cycle, the dissolution of beta-MnO2 consumes protons, which leads to a local pH increase at the electrode-electrolyte interface. This pH change causes the precipitation of Zinc Hydroxide Sulfate (ZHS), making it the dominant Zn-containing solid phase at the end of discharge. The relative concentration of the ZnSO4 electrolyte decreases as it is consumed to form ZHS. A small fraction of the Zn-Mn complex, which primarily forms during the charge half-cycle, is also present because it gradually accumulates as an irreversible phase over repeated cycling.
Reasoning source: Section 2.7 (Phase evolution studied by the MCR-ALS analysis) and Section 2.8 (Proposed reaction mechanism and reasons for rise in pH)
Scoring Rubric (total: 100 pts)
| Q | Type | Max | Question | Reference Answer | Scoring Criteria |
|---|---|---|---|---|---|
| q1 | identification | 20 | Identify the candidate reference spectra or basis functions required to accurately model the operando Zn K-edge XANES spectrum of this sample. | To accurately model the operando Zn K-edge XANES spectrum using MCR-ALS, the required basis functions are liquid state ZnSO4 electrolyte, a 1st cycle discharge sample representing the Zinc Hydroxide Sulfate (ZHS) phase, and an electrodeposited sample representing a Zn-Mn complex. These specific references are necessary due to the electrochemical reactions occurring at the beta-MnO2 cathode during the 3rd discharge to 1.0 V. Specifically, the dissolution of beta-MnO2 consumes protons and raises the local pH, which drives the precipitation of ZHS from the ZnSO4 electrolyte. Furthermore, the Zn-Mn complex reference is needed because this species irreversibly accumulates over repeated cycling, remaining present as a solid phase at the end of the 3rd discharge. | Full credit requires identifying three components: ZnSO4 (electrolyte), Zinc Hydroxide Sulfate (ZHS, or 1st cycle discharge phase), and a Zn-Mn complex. |
| q2 | quantification | 30 | Estimate the relative phase fractions of the Zn-containing species at the end of the 3rd discharge (1.0 V). | At the end of the 3rd discharge, the estimated relative phase fractions are 70% Zinc Hydroxide Sulfate (ZHS), 20% Zn-Mn complex, and 10% ZnSO4 electrolyte, with an uncertainty of 15%. These specific values result from the electrochemical conditions at 1.0 V during the discharge half-cycle. The ZHS fraction is dominant (70%) because the dissolution of the beta-MnO2 cathode consumes protons, causing a local pH increase that heavily drives ZHS precipitation. Consequently, the liquid ZnSO4 electrolyte fraction is depleted to just 10% as it is consumed to form the ZHS phase. Finally, the 20% fraction of the Zn-Mn complex is present because this phase, which primarily forms during charging, gradually accumulates as an irreversible byproduct over the three completed cycles. | Full credit requires estimating ZHS as the dominant phase (~70%), with minor contributions from the Zn-Mn complex (~20%) and ZnSO4 electrolyte (~10%). Estimates within ±15% of these values are acceptable. |
| q3 | reasoning | 50 | Provide the electrochemical reasoning for the phase composition at the end of the 3rd discharge. Specifically, explain the mechanism driving the formation of the dominant phase and the presence of the minor solid phase. | The phase composition at the end of the 3rd discharge to 1.0 V is driven by proton-coupled reactions at the beta-MnO2 cathode. During this discharge half-cycle, the dissolution of beta-MnO2 consumes protons, which leads to a significant local pH increase at the electrode-electrolyte interface. This elevated pH triggers the precipitation of Zinc Hydroxide Sulfate (ZHS) from the ZnSO4 electrolyte, making ZHS the dominant solid phase and correspondingly depleting the liquid electrolyte. The minor solid phase, a Zn-Mn complex, is present because it primarily forms during the charge half-cycles and gradually accumulates as an irreversible phase over the three cycles. | Full credit requires explaining two key points: 1) beta-MnO2 dissolution consumes protons, raising the local pH and causing ZHS to precipitate (making it the dominant phase). 2) The Zn-Mn complex, which forms during charging, gradually accumulates as an irreversible phase over multiple cycles, explaining its minor presence even at the end of discharge. |
Review
#1030
beta-MnO2
Zn K-edge
▶
LLM Prompt
Sample Information
Material: beta-MnO2
Electrode Type: cathode
Electrolyte: 2 M ZnSO4 + 0.1 M MnSO4
Cell Type: pouch cell
Charge Discharge: charged
C Rate: 0.2 C
Voltage V: 1.75
Cycle Number: 3
Sample-Specific Conditions
- cycle_state: 3rd Charge
- End of 3rd charge
Measurement
We plan to measure the Zn K-edge XANES spectrum of this sample.
Questions
Based on all the information above:
1. Identify the candidate phases and the corresponding reference spectra required to model the Zn K-edge XANES data for this operando battery system.
Ground Truth
Material: beta-MnO2
Measurement: Operando Zn K-edge XAS, transmission and fluorescence modes, ISS beamline (8-ID)
Fit method: MCR-ALS
Phase fractions: (±15%)
| Phase | Fraction |
|---|---|
| ZnSO4 (electrolyte) | 0.5 |
| Zinc Hydroxide Sulfate (ZHS) | 0.0 |
| Zn-Mn Complex | 0.5 |
Fit basis (paper's reference spectra):
- ZnSO4 electrolyte (in liquid state)
- 1st cycle discharge sample (corresponding to the ZHS phase)
- Zn-Mn complex (obtained from the electrodeposited sample)
Source evidence: Figure 7D and Section 2.7 (Page 27)
Key reasoning: During the charge half-cycle, the Zinc Hydroxide Sulfate (ZHS) phase that formed during discharge reversibly dissolves, returning its concentration to near zero. Simultaneously, an amorphous Zn-Mn complex phase forms and gradually increases in concentration with increasing cycles. The relative concentration of the ZnSO4 electrolyte decreases as it is consumed to form the irreversible/reversible Zn-Mn complex phases, resulting in a mixture dominated by the remaining electrolyte and the newly formed Zn-Mn complex at the end of the 3rd charge.
Reasoning source: Section 2.7 (Page 27) and Section 2.8 (Page 29)
Scoring Rubric (total: 100 pts)
| Q | Type | Max | Question | Reference Answer | Scoring Criteria |
|---|---|---|---|---|---|
| q1 | identification | 100 | Identify the candidate phases and the corresponding reference spectra required to model the Zn K-edge XANES data for this operando battery system. | To model the Zn K-edge XANES data for this system, the required reference spectra are liquid ZnSO4 electrolyte, Zinc Hydroxide Sulfate (ZHS) obtained from a 1st cycle discharge sample, and a Zn-Mn complex derived from an electrodeposited sample. These specific phases are necessary due to the electrochemical reactions occurring at the beta-MnO2 cathode in the ZnSO4/MnSO4 electrolyte by the end of the 3rd charge at 1.75 V. During the charge half-cycle, the ZHS phase that formed during discharge reversibly dissolves, while an amorphous Zn-Mn complex forms and accumulates over successive cycles. Consequently, the ZnSO4 electrolyte is partially consumed to form this complex, making these three reference phases essential to accurately capture the dynamic phase evolution and the resulting mixture of remaining electrolyte and Zn-Mn complex at this specific cycle state. | Full points if the answer identifies the three key components: ZnSO4 electrolyte (liquid), Zinc Hydroxide Sulfate (ZHS / 1st cycle discharge), and the Zn-Mn complex (electrodeposited sample). |
Review
Effect of pretreatment conditions on Fe-ZSM-5 properties and performance for Fischer–Tropsch synthesis
BNL-NSLS-II-8-ID
Catalyst
Jane N. Agwara et al.
DOI: 10.1039/D4CY00765D
4 scenarios
▶
#1031
Fe-Na-ZSM-5
Fe K
▶
LLM Prompt
Sample Information
Material: Fe-Na-ZSM-5
Support: Na-ZSM-5
Reaction Conditions: Ambient
Sample-Specific Conditions
- Pretreatment state: As-synthesized
- As-synthesized iron supported on Na-ZSM-5 zeolite before pretreatment
Measurement
We plan to measure the Fe K XANES spectrum of this sample.
Questions
Based on all the information above:
1. Identify the primary iron compound present in this as-synthesized sample and explain the reasoning based on its expected XANES spectral features.
2. What are the specific expected energy positions for the pre-edge feature and the white line in the Fe K-edge XANES spectrum of this as-synthesized sample?
Ground Truth
Material: Fe-Na-ZSM-5
Measurement: Fe K-edge in situ XANES at 8-ID (ISS) beamline
Fit method: MCR
Phase fractions: (±10%)
| Phase | Fraction |
|---|---|
| Fe-Na-ZSM-5 as is | 1.0 |
Fit basis (paper's reference spectra):
- Fe-Na-ZSM-5 as is
- FeO
- Fe
Source evidence: Figure 7, Figure 8, Page 17
Key reasoning: The as-synthesized Fe-Na-ZSM-5 catalyst contains iron primarily as Fe2O3 before any pretreatment. This is evidenced by the XANES spectrum which shows a pre-edge feature at 7115 eV and a white line at 7134.4 eV, consistent with the Fe2O3 reference spectrum.
Reasoning source: Page 17, Section 3.4
Scoring Rubric (total: 100 pts)
| Q | Type | Max | Question | Reference Answer | Scoring Criteria |
|---|---|---|---|---|---|
| q1 | identification | reasoning | 50 | Identify the primary iron compound present in this as-synthesized sample and explain the reasoning based on its expected XANES spectral features. | The primary iron compound present in the as-synthesized Fe-Na-ZSM-5 sample is Fe2O3, containing Fe3+. Because the sample is in its initial as-synthesized state under ambient conditions before any pretreatment, the iron has not undergone reduction or carburization and remains fully oxidized. This results in a 1.0 fraction of the 'Fe-Na-ZSM-5 as is' phase. The presence of this Fe2O3 phase is evidenced by its expected XANES spectral features, specifically a pre-edge feature at 7115 eV and a white line at 7134.4 eV, which are consistent with an Fe2O3 reference spectrum. | Award 15 points for correctly identifying Fe2O3 as the primary compound. Award 20 points for explaining that the identification is based on the XANES spectrum being consistent with an Fe2O3 reference, specifically mentioning the pre-edge and white line features. |
| q2 | spectral | 50 | What are the specific expected energy positions for the pre-edge feature and the white line in the Fe K-edge XANES spectrum of this as-synthesized sample? | In the Fe K-edge XANES spectrum of this sample, the expected energy position for the pre-edge feature is 7115 eV, and the white line is expected at 7134.4 eV. These specific spectral features emerge because the sample is measured in its as-synthesized state under ambient conditions, prior to any pretreatment. In this initial state, the iron exists entirely as fully oxidized Fe2O3 (Fe3+). The electronic and structural properties of this unreduced Fe2O3 phase produce these characteristic peak positions, which serve as distinguishing features that would shift to lower energies if the sample were subjected to reduction or carburization. | Award 17.5 points for stating the pre-edge feature is at 7115 eV. Award 17.5 points for stating the white line is at 7134.4 eV. |
Review
#1032
Fe-Na-ZSM-5
Fe K
▶
LLM Prompt
Sample Information
Material: Fe-Na-ZSM-5
Support: Na-ZSM-5
Reaction Conditions: In situ during pretreatment at 350 °C
Sample-Specific Conditions
- Pretreatment condition: H2 at 350 °C
- Fe-Na-ZSM-5 catalyst pretreated in hydrogen at 350 °C
Measurement
We plan to measure the Fe K XANES spectrum of this sample.
Questions
Based on all the information above:
1. What candidate reference spectra are appropriate to use as starting solutions for the Multivariate Curve Resolution (MCR) analysis of this catalyst during the H2 pretreatment?
2. What iron phase dominates at the end of the 350 °C H2 pretreatment, and why does it not reduce further to metallic iron?
3. Describe the expected energy positions of the pre-edge and white line features for this sample, and how they compare to the as-synthesized catalyst.
Ground Truth
Material: Fe-Na-ZSM-5
Measurement: Fe K-edge in situ XANES at 8-ID (ISS) beamline
Fit method: MCR (Multivariate Curve Resolution)
Phase fractions: (±10%)
| Phase | Fraction |
|---|---|
| FeO | 1.0 |
Fit basis (paper's reference spectra):
- Fe-Na-ZSM-5 as is
- FeO
- Fe
Source evidence: Figure 7(a), Figure 8(a), and Section 3.4 (pages 17-18)
Key reasoning: During H2 pretreatment at 350 °C, the initial Fe2O3 in the as-synthesized Fe-Na-ZSM-5 undergoes gradual reduction to form FeO. After about 0.8 hours, the proportion of FeO stabilizes and persists until the end of the pretreatment period. The temperature of 350 °C is sufficient to reduce Fe2O3 to FeO, but it is not high enough to induce further reduction to metallic Fe, which requires temperatures above 400 °C.
Reasoning source: Section 3.4, page 18
Scoring Rubric (total: 101 pts)
| Q | Type | Max | Question | Reference Answer | Scoring Criteria |
|---|---|---|---|---|---|
| q1 | identification | 25 | What candidate reference spectra are appropriate to use as starting solutions for the Multivariate Curve Resolution (MCR) analysis of this catalyst during the H2 pretreatment? | The appropriate candidate reference spectra to use as starting solutions for the MCR analysis are "Fe-Na-ZSM-5 as is", "FeO", and "Fe". These specific references are required because they capture the chemical transformations occurring during the H2 pretreatment at 350 °C. The "Fe-Na-ZSM-5 as is" spectrum accounts for the initial Fe2O3 state of the catalyst before the reaction begins. As the H2 pretreatment progresses, the initial Fe2O3 reduces to FeO, necessitating the FeO reference, while the metallic Fe reference is included to model the limits of the reduction pathway, even though 350 °C is ultimately insufficient to form metallic iron. | Full points for identifying as-is Fe-Na-ZSM-5, metallic Fe, and FeO. Partial points if only 1-2 are identified or if incorrect oxides (like Fe3O4, which was excluded) are included. |
| q2 | reasoning | 38 | What iron phase dominates at the end of the 350 °C H2 pretreatment, and why does it not reduce further to metallic iron? | At the end of the 350 °C H2 pretreatment, the dominant iron phase is FeO, which accounts for a fraction of 1.0. This occurs because the initial Fe2O3 in the as-synthesized Fe-Na-ZSM-5 undergoes gradual reduction under the H2 atmosphere, with the FeO proportion stabilizing after about 0.8 hours. The sample does not reduce further to metallic iron because the pretreatment temperature of 350 °C is only sufficient to reduce Fe2O3 to FeO. Temperatures above 400 °C would be required to induce further reduction to metallic Fe. | Full points for stating that FeO is the predominant phase (fraction ~1.0) and explaining that 350 °C is sufficient to reduce the initial Fe2O3 to FeO, but temperatures above 400 °C are required for further reduction to metallic Fe. |
| q3 | spectral | 38 | Describe the expected energy positions of the pre-edge and white line features for this sample, and how they compare to the as-synthesized catalyst. | For this sample, the expected energy position of the pre-edge is 7113.6 eV, and the white line is located at 7130.2 eV. These features appear at lower energies compared to the as-synthesized Fe-Na-ZSM-5 catalyst, indicating a higher degree of reduction. This spectral shift directly results from the H2 pretreatment at 350 °C, which successfully reduces the initial Fe2O3 to FeO. Furthermore, because the 350 °C temperature is not high enough to form metallic iron, the overall spectral intensity remains higher compared to samples pretreated at higher temperatures (e.g., 450 °C) that undergo further reduction to metallic Fe. | Full points for providing the specific values (pre-edge at 7113.6 eV, white line at 7130.2 eV) and noting that these are shifted to lower energies compared to the as-synthesized Fe-Na-ZSM-5 catalyst. |
Review
#1033
Fe-Na-ZSM-5
Fe K
▶
LLM Prompt
Sample Information
Material: Fe-Na-ZSM-5
Support: Na-ZSM-5
Reaction Conditions: In situ during pretreatment at 450 °C
Sample-Specific Conditions
- Pretreatment condition: H2 at 450 °C
- Fe-Na-ZSM-5 catalyst pretreated in hydrogen at 450 °C
Measurement
We plan to measure the Fe K XANES spectrum of this sample.
Questions
Based on all the information above:
1. What reference spectra or basis components are necessary to successfully model the in situ Fe K-edge XANES data during the H2 pretreatment of the Fe-Na-ZSM-5 catalyst at 450 °C?
2. Based on the pretreatment conditions (H2 at 450 °C), estimate the final phase fractions of the iron species present in the catalyst at the end of the pretreatment period.
Ground Truth
Material: Fe-Na-ZSM-5
Measurement: in situ Fe K-edge XANES at 8-ID (ISS) beamline, NSLS-II
Fit method: Multivariate Curve Resolution (MCR)
Phase fractions: (±10%)
| Phase | Fraction |
|---|---|
| Fe | 0.65 |
| FeO | 0.35 |
Fit basis (paper's reference spectra):
- Fe-Na-ZSM-5 as is
- FeO
- Fe
Source evidence: Figure 8(b), page 20
Key reasoning: During H2 pretreatment at 450 °C, the initial iron oxides in the as-synthesized Fe-Na-ZSM-5 gradually reduce to FeO. After about 0.7 hours, the generated FeO undergoes further reduction to form metallic Fe. The fractional contribution of metallic Fe gradually increases, ultimately becoming the predominant species post-pretreatment, which coincides with the higher pretreatment temperature (>400 °C) promoting deeper reduction.
Reasoning source: Section 3.4 Structure-Performance Relationships of the Pretreated catalysts, page 19
Scoring Rubric (total: 100 pts)
| Q | Type | Max | Question | Reference Answer | Scoring Criteria |
|---|---|---|---|---|---|
| q1 | identification | 46 | What reference spectra or basis components are necessary to successfully model the in situ Fe K-edge XANES data during the H2 pretreatment of the Fe-Na-ZSM-5 catalyst at 450 °C? | To successfully model the in situ Fe K-edge XANES data, the necessary basis components are "Fe-Na-ZSM-5 as is", "FeO", and metallic "Fe". These specific reference spectra are required because the sample undergoes a progressive reduction process under the H2 pretreatment conditions at 450 °C. Initially, the iron oxides present in the as-synthesized Fe-Na-ZSM-5 gradually reduce to form an intermediate FeO phase. After approximately 0.7 hours of exposure to hydrogen at this elevated temperature (>400 °C), the FeO undergoes further, deeper reduction to generate metallic Fe. Therefore, capturing the initial state, the intermediate FeO phase, and the final metallic Fe phase is essential to accurately model the structural evolution during the pretreatment. | Full points for identifying the as-synthesized catalyst (or initial Fe3O4-like oxide), FeO, and metallic Fe as the necessary components. Deduct points if other oxides like Fe2O3 or Fe3O4 are explicitly required as separate final components, as they converge to the initial state or non-physical spectra. |
| q2 | quantification | 54 | Based on the pretreatment conditions (H2 at 450 °C), estimate the final phase fractions of the iron species present in the catalyst at the end of the pretreatment period. | At the end of the H2 pretreatment period at 450 °C, the final phase fractions of the iron species are estimated to be 0.65 (65%) metallic Fe and 0.35 (35%) FeO, with an uncertainty of 10%. These specific values result from the progressive reduction of the initial iron oxides in the Fe-Na-ZSM-5 catalyst under the reducing hydrogen atmosphere. During the pretreatment, the initial oxides first reduce to FeO, which then undergoes further reduction to metallic Fe after about 0.7 hours. Because the pretreatment temperature of 450 °C is sufficiently high (>400 °C), it promotes deeper reduction of the iron species. Consequently, the fractional contribution of metallic Fe gradually increases until it becomes the predominant species (65%) over the remaining intermediate FeO (35%) post-pretreatment. | Full points for estimating approximately 65% metallic Fe and 35% FeO. Allow a +/- 10% margin of error for full credit. |
Review
#1034
Fe-Na-ZSM-5
Fe K
▶
LLM Prompt
Sample Information
Material: Fe-Na-ZSM-5
Support: Na-ZSM-5
Reaction Conditions: In situ during pretreatment at 490 °C
Sample-Specific Conditions
- Pretreatment condition: CO at 490 °C
- Fe-Na-ZSM-5 catalyst pretreated in carbon monoxide at 490 °C
Measurement
We plan to measure the Fe K XANES spectrum of this sample.
Questions
Based on all the information above:
1. What candidate reference spectra or components are needed to model the in situ Fe K-edge XANES data during the CO pretreatment at 490 °C?
2. Describe the sequence of phase transformations leading to the final state and explain why this final state forms under these specific conditions.
Ground Truth
Material: Fe-Na-ZSM-5
Measurement: Fe K-edge in situ XANES at 8-ID (ISS) beamline at NSLS-II
Fit method: MCR (Multivariate Curve Resolution)
Phase fractions: (±15%)
| Phase | Fraction |
|---|---|
| FeCx | 1.0 |
Fit basis (paper's reference spectra):
- Fe-Na-ZSM-5 as is
- FeO
- FeCx
Source evidence: Figure 8(d) and Section 3.4, page 19
Key reasoning: During CO pretreatment at 490 °C, the initial iron oxides in the as-synthesized Fe-Na-ZSM-5 gradually decrease, facilitating the formation of FeO. After about 0.7 hours, a new component emerges and becomes the sole component by the end of the pretreatment. This final component represents a mixed phase attributed to iron carbides and some iron oxides, which form due to the higher degree of carburization induced by the elevated CO pretreatment temperature.
Reasoning source: Section 3.4, page 19
Scoring Rubric (total: 100 pts)
| Q | Type | Max | Question | Reference Answer | Scoring Criteria |
|---|---|---|---|---|---|
| q1 | identification | 43 | What candidate reference spectra or components are needed to model the in situ Fe K-edge XANES data during the CO pretreatment at 490 °C? | To model the in situ Fe K-edge XANES data of the Fe-Na-ZSM-5 catalyst during CO pretreatment at 490 °C, the required MCR components are "Fe-Na-ZSM-5 as is", "FeO", and "FeCx". These specific components are necessary because the sample undergoes a distinct sequence of chemical transformations under the reducing CO environment at elevated temperatures. Initially, the iron oxides in the as-synthesized Fe-Na-ZSM-5 decrease to facilitate the formation of an intermediate FeO phase. Finally, the elevated 490 °C temperature induces a high degree of carburization from the CO gas, requiring the FeCx component to represent the final mixed phase of iron carbides and residual oxides that emerges and dominates the spectrum. | Full points for identifying the initial Fe-Na-ZSM-5, an FeO intermediate, and a final FeCx or mixed carbide/oxide phase. |
| q3 | reasoning | 57 | Describe the sequence of phase transformations leading to the final state and explain why this final state forms under these specific conditions. | During the in situ CO pretreatment of Fe-Na-ZSM-5 at 490 °C, the initial iron oxides in the as-synthesized catalyst gradually decrease to form an intermediate FeO phase. After approximately 0.7 hours of exposure to these conditions, a new component emerges and eventually becomes the sole component (fraction of 1.0) by the end of the pretreatment. This final state is a mixed phase consisting primarily of iron carbides (FeCx) along with some iron oxides. This specific final state forms because the elevated temperature of 490 °C combined with the reducing CO atmosphere induces a higher degree of carburization in the catalyst, driving the transformation of the initial and intermediate oxide phases into the carbide-dominated phase. | Full points for describing the initial reduction to FeO, followed by the emergence of the mixed carbide phase after ~0.7 h, and attributing this to the higher degree of carburization at 490 °C. |
Review
Snowflake relocated Cu 2 O electrocatalyst on an Ag backbone template for the production of liquid C 2+ chemicals from CO 2
BNL-NSLS-II-8-ID
Catalyst
Youjin Lee et al.
DOI: 10.1039/D4DT00199K
3 scenarios
▶
#1035
Cu2O-Ag
Cu K-edge
▶
LLM Prompt
Sample Information
Material: Cu2O-Ag
Support: carbon paper
Sample-Specific Conditions
- Reaction time: 0 min
- As-prepared Cu2O-Ag composite catalyst
Measurement
We plan to measure the Cu K-edge XANES spectrum of this sample.
Questions
Based on all the information above:
1. What is the expected dominant Cu phase in the as-prepared Cu2O-Ag composite catalyst before any electrochemical reaction, and what structural feature in the EXAFS data supports this?
2. How does the Cu speciation change when the catalyst is subjected to the CO2 reduction reaction conditions?
3. Based on the phase transformation that occurs during the reaction, what reference materials would be necessary to track the Cu speciation using XAS?
Ground Truth
Material: Cu2O-Ag
Measurement: Cu K-edge XAFS at 8C beamline of PAL
Fit method: not reported
Phase fractions: (±10%)
| Phase | Fraction |
|---|---|
| Cu2O | 1.0 |
Source evidence: Figure 6a and page 12
Key reasoning: The as-prepared catalyst consists of Cu2O electrodeposited on an Ag backbone. XRD and EXAFS confirm the initial state is Cu2O before any CO2 reduction reaction occurs. Upon applying a reducing potential for CO2RR, this initial Cu2O phase is rapidly reduced to metallic Cu (within 1 minute).
Reasoning source: Page 12, Section 3
Scoring Rubric (total: 0 pts)
Review
#1036
Cu-Ag
Cu K-edge
▶
LLM Prompt
Sample Information
Material: Cu-Ag
Support: carbon paper
Reaction Conditions: CO2RR at -1.3 VRHE
Sample-Specific Conditions
- Reaction time: 1 min
- Cu2O-Ag composite catalyst after 1 min CO2RR
Measurement
We plan to measure the Cu K-edge XANES spectrum of this sample.
Questions
Based on all the information above:
1. Under the specified CO2RR conditions (-1.3 VRHE for 1 min), what is the dominant copper phase present in the catalyst, and what structural or stability factors drive this rapid transformation?
2. Based on the structural analysis of this sample, describe the expected features in the Fourier-transformed Cu K-edge EXAFS spectrum compared to the as-prepared state.
Ground Truth
Material: Cu-Ag
Measurement: Cu K-edge XAFS at the 8C beamline of the Pohang Accelerator Laboratory (PAL)
Fit method: Qualitative EXAFS Fourier transform analysis
Phase fractions: (±10%)
| Phase | Fraction |
|---|---|
| metallic_copper (Cu) | 1.0 |
Fit basis (paper's reference spectra):
- Cu-Cu scattering path
- Cu-O scattering path
Source evidence: Page 12, text; Page 21, Figure 6a
Key reasoning: The Cu2O(110) electrodeposits on the spiky Ag backbone are reduced to the Cu metallic state in less than 1 minute of CO2RR. This rapid reduction occurs because the Cu2O(110) facet has weaker stability to maintain its oxidation state under the applied reduction potential (-1.3 VRHE) compared to other facets, causing it to quickly change its state and relocate along the Ag backbone.
Reasoning source: Pages 12-13, Section 3
Scoring Rubric (total: 100 pts)
| Q | Type | Max | Question | Reference Answer | Scoring Criteria |
|---|---|---|---|---|---|
| q1 | reasoning | 57 | Under the specified CO2RR conditions (-1.3 VRHE for 1 min), what is the dominant copper phase present in the catalyst, and what structural or stability factors drive this rapid transformation? | Under the specified CO2RR conditions at -1.3 VRHE for 1 minute, the dominant copper phase is 100% metallic copper (Cu). This rapid transformation from the initial Cu2O-Ag composite occurs because the Cu2O(110) electrodeposits on the spiky Ag backbone have weak stability to maintain their oxidation state under the applied reduction potential. Consequently, the Cu2O(110) facets are quickly reduced to the metallic state in less than one minute. This instability causes the copper to change its state and relocate along the Ag backbone, resulting in a fully metallic copper phase. | Full credit requires identifying metallic Cu as the sole/dominant phase and explaining that the initial Cu2O(110) facet has weak stability under the reduction potential, leading to rapid reduction. |
| q2 | spectral | 43 | Based on the structural analysis of this sample, describe the expected features in the Fourier-transformed Cu K-edge EXAFS spectrum compared to the as-prepared state. | The Fourier-transformed Cu K-edge EXAFS spectrum of this sample will exhibit a dominant Cu-Cu scattering peak and a complete absence of the Cu-O scattering peak that was present in the as-prepared state. These spectral features arise because the initial Cu2O(110) electrodeposits on the Ag backbone are completely reduced to metallic copper within 1 minute of CO2RR at -1.3 VRHE. The applied reduction potential overcomes the weak stability of the Cu2O(110) facets, driving a rapid state change and relocation along the Ag backbone. Therefore, the spectrum reflects a pure metallic state (oxidation state 0) with only Cu-Cu metallic scattering remaining. | Full credit requires mentioning the emergence/dominance of the Cu-Cu scattering peak and the complete disappearance of the Cu-O scattering peak. |
Review
#1037
Cu2O-Ag
Ag K-edge
▶
LLM Prompt
Sample Information
Material: Cu2O-Ag
Support: carbon paper
Sample-Specific Conditions
- Reaction time: 0 min
- As-prepared Cu2O-Ag composite catalyst
Measurement
We plan to measure the Ag K-edge XANES spectrum of this sample.
Questions
Based on all the information above:
1. Explain the structural role of Ag in this composite catalyst and why it is expected to be in this specific chemical state.
2. Describe the expected spectral shape of the Ag K-edge Fourier-transformed EXAFS for this sample and how it compares to the reference standard.
Ground Truth
Material: Cu2O-Ag
Measurement: Ag K-edge XAFS in fluorescence mode at ISS beamline at NSLS2
Fit method: qualitative comparison of FT-EXAFS
Phase fractions: (±5%)
| Phase | Fraction |
|---|---|
| metallic_silver (Ag) | 1.0 |
Fit basis (paper's reference spectra):
- Ag foil
Source evidence: Fig. 6b, page 12
Key reasoning: The FT-EXAFS spectra of the Ag K-edge for the as-prepared Cu2O-Ag catalyst perfectly match the Ag foil reference. The Ag backbone maintains its initial chemical state (metallic Ag) and acts as a stable template for the Cu species.
Reasoning source: Page 12, Section 3
Scoring Rubric (total: 100 pts)
| Q | Type | Max | Question | Reference Answer | Scoring Criteria |
|---|---|---|---|---|---|
| q2 | reasoning | 57 | Explain the structural role of Ag in this composite catalyst and why it is expected to be in this specific chemical state. | In the as-prepared Cu2O-Ag composite catalyst at 0 min reaction time, silver is present entirely as metallic Ag with an oxidation state of 0. The structural role of the Ag backbone is to act as a stable template for the Cu species. It is expected to be in this specific chemical state because the silver maintains its initial, fully reduced metallic state during the catalyst's preparation. Therefore, prior to any reaction, the Ag component does not undergo oxidation and remains a stable metallic support. | Full points for explaining that Ag acts as a stable backbone/template that maintains its initial metallic chemical state. |
| q3 | spectral | 43 | Describe the expected spectral shape of the Ag K-edge Fourier-transformed EXAFS for this sample and how it compares to the reference standard. | The expected Fourier-transformed EXAFS spectrum for this sample exhibits a dominant peak corresponding to Ag-Ag scattering. This spectral shape is identical to and aligns exactly with the metallic Ag foil reference standard. These specific features arise because, in the as-prepared Cu2O-Ag composite at 0 min reaction time, the silver exists entirely as a fully reduced metallic backbone. Since the Ag acts as a stable template that maintains its initial chemical state without any oxidation, its local structural environment perfectly mirrors that of bulk metallic silver. | Full points for stating that the FT-EXAFS spectrum will show a dominant Ag-Ag scattering peak that is identical to the metallic Ag foil reference. |
Review
Pulsed laser deposition of delafossite oxide thin films on YSZ (001) substrates as solar water splitting photocathodes
BNL-NSLS-II-8-ID
Thin Film
Chenyu Zhou et al.
DOI: 10.1039/D4EN00706A
2 scenarios
▶
#1038
CuAlO2
Cu K
▶
LLM Prompt
Sample Information
Material: CuAlO2
Deposition Method: PLD
Substrate: ITO/YSZ (001)
Deposition Temperature C: 700
Composition Variable: M cation
Composition Value: Al
Sample-Specific Conditions
- Material: CuAlO2
- PLD-grown CuAlO2 thin film on ITO/YSZ (001) after annealing
Measurement
We plan to measure the Cu K XANES spectrum of this sample.
Questions
Based on all the information above:
1. Describe the expected Cu K-edge XANES spectral shape for this sample. Specifically, what is the energy and physical origin of the prominent pre-edge feature?
2. How does the Cu K-edge XANES spectrum of this delafossite CuAlO2 film distinguish it from potential surface oxidation products like spinel CuAl2O4?
3. What specific local coordination environment of the Cu cation is confirmed by the sharp feature at 8981 eV, and what would happen to this feature if the coordination number increased (e.g., to trigonal or tetrahedral)?
Ground Truth
Material: CuAlO2
Measurement: Cu K-edge, fluorescence mode, ISS beamline (8-ID) of NSLS-II
Fit method: None (qualitative comparison with FDMNES simulation)
Phase fractions: (±5%)
| Phase | Fraction |
|---|---|
| CuAlO2 (delafossite) | 1.0 |
Fit basis (paper's reference spectra):
- Simulated CuAlO2
- Simulated CuAl2O4
Source evidence: Figure 4a, Figure 4b, Pages 8-9
Key reasoning: The bulk of the film is confirmed to be delafossite CuAlO2 by XANES, despite surface oxidation seen in XPS. Post-growth annealing at 900 °C in nitrogen was necessary to crystallize the amorphous as-grown film into the delafossite phase on the ITO/YSZ substrate, as the PLD chamber did not have a low enough O2 partial pressure to favor it directly. The linear coordination of Cu+ in the delafossite lattice produces a characteristic sharp shoulder at 8981 eV.
Reasoning source: Results and Discussion, Pages 7-9
Scoring Rubric (total: 100 pts)
| Q | Type | Max | Question | Reference Answer | Scoring Criteria |
|---|---|---|---|---|---|
| q2 | spectral | 38 | Describe the expected Cu K-edge XANES spectral shape for this sample. Specifically, what is the energy and physical origin of the prominent pre-edge feature? | The expected Cu K-edge XANES spectrum for this sample is characterized by a sharp pre-edge shoulder peaking at 8981 eV and a stronger white line peak at approximately 8994 eV. The prominent pre-edge feature at 8981 eV originates from an electric dipole-allowed 1s -> 4px,y transition. These specific spectral features arise because the PLD-grown film on the ITO/YSZ substrate was subjected to post-growth annealing at 900 °C in nitrogen, which crystallized the amorphous as-grown material into the bulk delafossite CuAlO2 phase. This annealing step was necessary to overcome the high O2 partial pressure in the PLD chamber, ultimately yielding a structure where Cu+ is in a linear coordination environment that produces this characteristic sharp shoulder. | Full credit for mentioning the sharp pre-edge shoulder at 8981 eV and the white line at ~8994 eV. Must correctly identify the origin of the 8981 eV feature as the electric dipole-allowed 1s -> 4px,y transition. |
| q3 | spectral | 31 | How does the Cu K-edge XANES spectrum of this delafossite CuAlO2 film distinguish it from potential surface oxidation products like spinel CuAl2O4? | The XANES spectrum distinguishes the bulk delafossite CuAlO2 film from surface oxidation products like spinel CuAl2O4 primarily through the sharp pre-edge shoulder at 8981 eV. In contrast, the Cu2+ species in spinel CuAl2O4 exhibits a much weaker shoulder that is shifted to 8982 eV. This distinction is clear because the PLD-grown film on ITO/YSZ, after being annealed at 900 °C in nitrogen to compensate for the PLD chamber's high O2 partial pressure, forms a bulk delafossite phase with linearly coordinated Cu+. Consequently, while surface oxidation may occur, the bulk XANES measurement confirms the sample is entirely delafossite CuAlO2 (fraction 1.0), as the characteristic 8981 eV feature of linearly coordinated Cu+ dominates the spectrum. | Full credit for explaining that spinel CuAl2O4 (Cu+2) would exhibit a much weaker pre-edge shoulder that is shifted to a higher energy (8982 eV) compared to the sharp 8981 eV feature of delafossite CuAlO2. |
| q4 | reasoning | 31 | What specific local coordination environment of the Cu cation is confirmed by the sharp feature at 8981 eV, and what would happen to this feature if the coordination number increased (e.g., to trigonal or tetrahedral)? | The sharp feature at 8981 eV confirms that the Cu+ cation is in a linear coordination environment with a coordination number of 2. If the coordination number were to increase to higher coordination sites, such as trigonal or tetrahedral, this characteristic sharp shoulder feature would disappear. This specific linear coordination is achieved because the PLD-grown film on the ITO/YSZ substrate was subjected to post-growth annealing at 900 °C in nitrogen. This annealing step was required to crystallize the amorphous as-grown film into the pure delafossite CuAlO2 phase, overcoming the lack of a sufficiently low O2 partial pressure during the initial 700 °C PLD deposition. | Full credit for stating that the feature confirms linear coordination (C.N. = 2) of Cu+ and noting that the sharp feature would disappear if the Cu+ cation were located at a higher coordination site (trigonal or tetrahedral). |
Review
#1039
CuFeO2
Cu K
▶
LLM Prompt
Sample Information
Material: CuFeO2
Deposition Method: PLD
Substrate: ITO/YSZ (001)
Deposition Temperature C: 700
Composition Variable: M cation
Composition Value: Fe
Sample-Specific Conditions
- Material: CuFeO2
- PLD-grown CuFeO2 thin film on ITO/YSZ (001) after annealing
Measurement
We plan to measure the Cu K XANES spectrum of this sample.
Questions
Based on all the information above:
1. Describe the expected spectral shape of the Cu K-edge XANES for this sample. Specifically, what is the energy and physical origin of the characteristic pre-edge feature?
2. If the Cu+ cations in the film were located at higher coordination sites (e.g., trigonal or tetrahedral) instead of linear sites, how would the characteristic pre-edge feature in the XANES spectrum change?
Ground Truth
Material: CuFeO2
Measurement: Cu K-edge, fluorescence yield mode, ISS beamline (8-ID) of NSLS-II
Fit method: Comparison with first-principles simulated spectra (FDMNES)
Phase fractions: (±10%)
| Phase | Fraction |
|---|---|
| CuFeO2 (delafossite) | 1.0 |
Fit basis (paper's reference spectra):
- Simulated delafossite CuFeO2
- Simulated spinel CuFe2O4
Source evidence: Figure 4a, Figure 4b, Page 8-9
Key reasoning: XANES, being a bulk-sensitive technique, confirmed that the bulk of the films remained the delafossite phase despite surface oxidation to Cu+2 detected by XPS. The experimental spectra exhibit a sharp shoulder feature at 8981 eV, which is consistent with the linear coordination of Cu+ cations (coordination number of 2) found in the delafossite lattice. Simulations of Cu+2 species (spinel CuFe2O4) showed little similarity to the experimental data, confirming the dominance of the delafossite phase in the bulk.
Reasoning source: Results and Discussion, Pages 8-9
Scoring Rubric (total: 100 pts)
| Q | Type | Max | Question | Reference Answer | Scoring Criteria |
|---|---|---|---|---|---|
| q2 | spectral | 55 | Describe the expected spectral shape of the Cu K-edge XANES for this sample. Specifically, what is the energy and physical origin of the characteristic pre-edge feature? | The expected spectral shape of the Cu K-edge XANES for this sample is characterized by a sharp pre-edge shoulder at 8981 eV and a stronger white line peak at approximately 8994 eV. The physical origin of the 8981 eV pre-edge shoulder is the electric dipole-allowed 1s → 4px,y transition. These features arise because the PLD-grown CuFeO2 thin film annealed at 700 °C maintains a bulk delafossite phase, where Cu+ cations exist in a strict linear coordination (coordination number of 2). Because XANES is bulk-sensitive, it captures this dominant linearly coordinated Cu+ environment rather than any surface-oxidized Cu+2 species (like spinel CuFe2O4), which would otherwise show a much weaker shoulder shifted to 8982 eV. | Full credit for mentioning the sharp pre-edge shoulder at 8981 eV and the white line peak at ~8994 eV. Must correctly identify the origin of the 8981 eV feature as the electric dipole-allowed 1s → 4px,y transition associated with linearly coordinated Cu+. |
| q4 | prediction | 45 | If the Cu+ cations in the film were located at higher coordination sites (e.g., trigonal or tetrahedral) instead of linear sites, how would the characteristic pre-edge feature in the XANES spectrum change? | If the Cu+ cations in the film were located at higher coordination sites, such as trigonal or tetrahedral geometries, the characteristic sharp pre-edge shoulder at 8981 eV would disappear. In the actual PLD-grown CuFeO2 film annealed at 700 °C, the bulk crystallizes in the delafossite phase where Cu+ has a linear coordination (coordination number of 2), which is structurally required to allow the intense 1s → 4px,y transition. Increasing the coordination number alters the local symmetry and electronic structure, suppressing this specific dipole-allowed transition and distinguishing it from the linear Cu+ environment successfully stabilized in this sample. | Full credit for stating that the sharp feature at 8981 eV would disappear if the Cu+ cation were located at a higher coordination number site. |
Review
MnFe 0.5 Ru 0.5 O 3 : an above-room-temperature antiferromagnetic semiconductor
BNL-NSLS-II-8-ID
Pure Phase
Xiaoyan Tan et al.
DOI: 10.1039/c8tc05059g
7 scenarios
▶
#1040
MnFe0.5Ru0.5O3
Fe K-edge
▶
LLM Prompt
Sample Information
Material: MnFe0.5Ru0.5O3
Crystal Structure: corundum (alpha-Fe2O3) type, space group R-3c
Oxidation State: ~3+
Sample Form: powder
- New transition-metal-only oxide
Measurement
We plan to measure the Fe K-edge XANES spectrum of this sample.
Questions
Based on all the information above:
1. Describe the expected spectral shape and key features of the Fe K-edge main edge for MnFe0.5Ru0.5O3.
2. How does the Fe K-edge XANES spectrum of MnFe0.5Ru0.5O3 support its assignment to the corundum structure rather than the LiNbO3 (LN) structure?
3. Based on the Fe K-edge XANES analysis, what is the formal oxidation state of Fe in this compound, and what reference compounds would be appropriate to use for qualitative comparison to confirm this state and its local coordination?
Ground Truth
Compound: MnFe0.5Ru0.5O3
Oxidation state: ~3+
Measurement: Fe K-edge XANES at APS 10-ID/11-ID and NSLS-II 8-ID ISS beamlines
Edge position: not reported
Spectral shape: The main edge corresponds to ~Fe3+ with somewhat broad features. It manifests an additional shoulder on the initial rising portion (1) and a prominent absolute-peak shifted to higher energy (2).
Labeled peaks:
| Label | Energy (eV) | Intensity | Origin | Source |
|---|---|---|---|---|
| 1 | not reported | shoulder on the initial rising portion of the main edge | not discussed in this paper | paper_data |
| 2 | not reported | prominent absolute-peak shifted to higher energy | not discussed in this paper | paper_data |
Distinguishing features: The presence of the shoulder (1) and the shifted absolute-peak (2) distinguishes the spectrum from LN structure standards (Mn2FeTaO6, Mn2FeNbO6) and shows similarity to the corundum (alpha-Fe2O3) standard.
Key reasoning: The Fe-K main-edge corresponds to ~Fe3+ with somewhat broad features. It manifests an additional shoulder on the initial rising portion (labeled '1') and a prominent absolute-peak shifted to higher energy (labeled '2'). These two features are present in the corundum (alpha-Fe2O3) standard spectrum but are absent or sharply different in the LiNbO3 (LN) structure standards (Mn2FeMO6, M = Ta and Nb). Thus, the Fe-K main-edge supports a corundum structure for MnFe0.5Ru0.5O3.
Reasoning source: Page 8, 'X-ray Absorption Near Edge Spectroscopy' section
Scoring Rubric (total: 100 pts)
| Q | Type | Max | Question | Reference Answer | Scoring Criteria |
|---|---|---|---|---|---|
| q1 | spectral | 30 | Describe the expected spectral shape and key features of the Fe K-edge main edge for MnFe0.5Ru0.5O3. | The Fe K-edge main edge of MnFe0.5Ru0.5O3 is expected to exhibit somewhat broad features corresponding to an Fe oxidation state of ~3+. Specifically, the spectrum will manifest an additional shoulder on the initial rising portion (labeled '1') and a prominent absolute-peak shifted to higher energy (labeled '2'). These specific spectral features arise because the sample crystallizes in a corundum (alpha-Fe2O3) type structure with space group R-3c. The local structural and electronic environment of the Fe3+ ions within this specific corundum lattice produces this distinct shoulder and shifted peak, which are characteristic fingerprints of the alpha-Fe2O3 structural family. | Full points if the answer mentions the broad main edge corresponding to ~Fe3+, the presence of an additional shoulder on the initial rising portion, and a prominent absolute-peak shifted to higher energy. |
| q2 | reasoning | 40 | How does the Fe K-edge XANES spectrum of MnFe0.5Ru0.5O3 support its assignment to the corundum structure rather than the LiNbO3 (LN) structure? | The Fe K-edge XANES spectrum supports the corundum assignment through the presence of two distinct features: a shoulder on the initial rising portion of the main edge and a prominent absolute-peak shifted to higher energy. Because the synthesized MnFe0.5Ru0.5O3 powder adopts the corundum (alpha-Fe2O3) type structure, its spectrum closely matches the alpha-Fe2O3 standard where these two features are naturally present. In contrast, these specific features are absent or sharply different in LiNbO3 (LN) structure standards like Mn2FeTaO6 and Mn2FeNbO6. Therefore, the qualitative comparison of these spectral fingerprints confirms the sample's R-3c corundum structural framework rather than an LN-type arrangement. | Full points if the answer explains that the specific spectral features (the shoulder on the rising edge and the shifted absolute peak) are present in the corundum (alpha-Fe2O3) standard but absent/different in the LN structure standards (like Mn2FeTaO6 or Mn2FeNbO6). |
| q3 | identification | 30 | Based on the Fe K-edge XANES analysis, what is the formal oxidation state of Fe in this compound, and what reference compounds would be appropriate to use for qualitative comparison to confirm this state and its local coordination? | The formal oxidation state of Fe in MnFe0.5Ru0.5O3 is ~3+. Appropriate reference compounds for qualitative comparison include alpha-Fe2O3, FeO, LiFePO4, La2FeVO6, Mn2FeTaO6, Mn2FeNbO6, and SrFeO3. This ~3+ oxidation state is expected because the sample is a transition-metal-only oxide formulated as MnFe0.5Ru0.5O3, which dictates the charge balance of the metal cations. The specific reference compounds are required because they provide a range of known oxidation states and local coordination environments; notably, alpha-Fe2O3 serves as the primary structural standard for the sample's corundum (R-3c) lattice, while Mn2FeTaO6 and Mn2FeNbO6 act as contrasting LiNbO3-type structural standards to validate the specific phase formation. | Full points if the answer identifies the oxidation state as ~3+ and lists appropriate reference standards mentioned in the text (e.g., alpha-Fe2O3, La2FeVO6, Mn2FeTaO6, Mn2FeNbO6, FeO, LiFePO4, SrFeO3). |
Review
#1041
alpha-Fe2O3
Fe K-edge
▶
LLM Prompt
Sample Information
Material: alpha-Fe2O3
Crystal Structure: corundum
Oxidation State: 3+
- ~3+ corundum standard
Measurement
We plan to measure the Fe K-edge XANES spectrum of this sample.
Questions
Based on all the information above:
1. Describe the expected spectral shape of the Fe K-edge main edge for the alpha-Fe2O3 standard, specifically focusing on the prominent features.
2. How do the main edge features of the alpha-Fe2O3 standard distinguish it from the synthesized MnFe0.5Ru0.5O3 compound discussed in the study?
3. Based on its use as a standard in this study, what is the formal oxidation state and local coordination environment of Fe in alpha-Fe2O3?
Ground Truth
Compound: alpha-Fe2O3
Oxidation state: ~3+
Measurement: Fe K-edge XANES at APS 10-ID/11-ID or NSLS-II 8-ID ISS
Edge position: not reported
Spectral shape: The main edge features a sharply defined shoulder on the initial rising portion (labeled '1') and a prominent absolute-peak shifted to higher energy (labeled '2').
Labeled peaks:
| Label | Energy (eV) | Intensity | Origin | Source |
|---|---|---|---|---|
| 1 | not reported | sharply defined shoulder | not discussed in this paper | paper_data |
| 2 | not reported | sharply defined prominent absolute-peak | not discussed in this paper | paper_data |
Distinguishing features: The main edge features (the initial rising shoulder and the prominent absolute-peak) are more sharply defined in the corundum alpha-Fe2O3 standard compared to the synthesized MnFe0.5Ru0.5O3 compound.
Key reasoning: The alpha-Fe2O3 spectrum is utilized as a ~3+ corundum standard with octahedral Fe-O coordination to compare against the synthesized MnFe0.5Ru0.5O3 sample. Its main edge exhibits a sharply defined shoulder on the initial rising portion (feature 1) and a prominent absolute-peak shifted to higher energy (feature 2).
Reasoning source: Results and Discussion, X-ray Absorption Near Edge Spectroscopy section, page 8 and Figure 4 caption
Scoring Rubric (total: 100 pts)
| Q | Type | Max | Question | Reference Answer | Scoring Criteria |
|---|---|---|---|---|---|
| q1 | spectral | 40 | Describe the expected spectral shape of the Fe K-edge main edge for the alpha-Fe2O3 standard, specifically focusing on the prominent features. | The Fe K-edge main edge of the alpha-Fe2O3 standard is characterized by two prominent features. Specifically, it exhibits a sharply defined shoulder on the initial rising portion (feature 1) and a prominent absolute-peak shifted to higher energy (feature 2). These distinct spectral features arise because the sample is a pure alpha-Fe2O3 reference material with a corundum crystal structure. In this structure, the Fe atoms possess a ~3+ oxidation state and an octahedral Fe-O coordination environment, which dictates the sharply defined electronic transitions observed in the spectrum. | Full credit if the answer mentions the sharply defined shoulder on the initial rising portion (feature 1) and the prominent absolute-peak shifted to higher energy (feature 2). |
| q2 | reasoning | 30 | How do the main edge features of the alpha-Fe2O3 standard distinguish it from the synthesized MnFe0.5Ru0.5O3 compound discussed in the study? | The alpha-Fe2O3 standard is distinguished from the synthesized MnFe0.5Ru0.5O3 compound by having much more sharply defined main edge features. Specifically, both the initial rising shoulder and the prominent absolute-peak are sharper in the standard's spectrum. This distinction occurs because the alpha-Fe2O3 sample is a pure reference material with a well-defined corundum crystal structure. The specific octahedral Fe-O coordination and ~3+ oxidation state inherent to this corundum standard produce these distinct, sharp spectral features, providing a clear baseline for comparison against the synthesized sample. | Full credit if the answer notes that the two main edge features (the shoulder and the absolute peak) are more sharply defined in the alpha-Fe2O3 standard than in the MnFe0.5Ru0.5O3 compound. |
| q3 | identification | 30 | Based on its use as a standard in this study, what is the formal oxidation state and local coordination environment of Fe in alpha-Fe2O3? | Based on its use as a standard, the formal oxidation state of Fe in alpha-Fe2O3 is ~3+. Additionally, its local coordination environment consists of octahedral Fe-O coordination. These properties are expected because the sample is composed entirely of pure alpha-Fe2O3 (a fraction of 1.0) crystallizing in a corundum structure. This specific corundum crystal structure inherently dictates the octahedral coordination of oxygen atoms around the Fe~3+ ions, making it an ideal reference standard for evaluating the synthesized MnFe0.5Ru0.5O3 sample. | Full credit if the answer correctly identifies the oxidation state as ~3+ and the coordination environment as octahedral. |
Review
#1042
Sr2YRuO6
Ru K, L2,3
▶
LLM Prompt
Sample Information
Material: Sr2YRuO6
Oxidation State: 5+ (d3)
- Ru5+ standard
Measurement
We plan to measure the Ru K, L2,3 XANES spectrum of this sample.
Questions
Based on all the information above:
1. Describe the expected shape of the white line features at the Ru L2,3-edge for the Sr2YRuO6 standard.
2. What specific electronic transitions give rise to the bimodal A and B features in the Ru L2,3-edge XANES of this octahedrally coordinated compound?
3. How does the relative intensity of the A-feature in this Ru5+ (d3) standard compare to that of a Ru4+ (d4) standard, and what is the physical basis for this difference?
Ground Truth
Compound: Sr2YRuO6
Oxidation state: 5+ (d3)
Measurement: Ru L2,3-edge XANES at NSLS-II TES, 8-BM beamline
Edge position: not reported
Spectral shape: Distinctly bimodal A/B white line feature structure with a very strong A-feature relative to the B-feature.
Labeled peaks:
| Label | Energy (eV) | Intensity | Origin | Source |
|---|---|---|---|---|
| A | ~2.842 keV (L3 edge) | strong (higher than B) | transitions into empty t2g d-states | paper_data |
| B | ~2.846 keV (L3 edge) | strong | transitions into empty eg d-states | paper_data |
Distinguishing features: Higher relative A-feature intensity compared to Ru4+ (d4) standards due to fewer d-electrons filling the t2g states.
Key reasoning: The Ru L2,3-edge spectra of Sr2YRuO6 exhibit a distinctly bimodal A/B white line feature structure due to transitions into empty t2g and eg d-states. As a Ru5+ (d3) standard, it has more empty t2g states compared to d4 compounds, resulting in a high relative A-feature intensity.
Reasoning source: Page 10, Results and Discussion (X-ray Absorption Near Edge Spectroscopy)
Scoring Rubric (total: 100 pts)
| Q | Type | Max | Question | Reference Answer | Scoring Criteria |
|---|---|---|---|---|---|
| q1 | spectral | 30 | Describe the expected shape of the white line features at the Ru L2,3-edge for the Sr2YRuO6 standard. | The Ru L2,3-edge XANES spectrum for the Sr2YRuO6 standard is expected to exhibit a distinctly bimodal white line structure consisting of two peaks, labeled A and B. Peak A occurs at approximately 2.842 keV (L3 edge) and Peak B occurs at ~2.846 keV. This specific spectral shape arises because the sample is a Ru5+ (d3) standard, which dictates transitions into crystal-field split empty t2g and eg d-states. Because the Ru5+ (d3) configuration has fewer d-electrons filling the t2g states, the resulting spectrum displays a very strong A-feature whose intensity is notably higher than that of the B-feature. | Full points for mentioning a distinctly bimodal A/B feature structure with a strong A-feature relative to the B-feature. |
| q2 | reasoning | 35 | What specific electronic transitions give rise to the bimodal A and B features in the Ru L2,3-edge XANES of this octahedrally coordinated compound? | The bimodal A and B features in the Ru L2,3-edge XANES spectrum originate from transitions into crystal-field split d-states. Specifically, the A-feature (at ~2.842 keV) is caused by transitions into empty t2g d-states, while the B-feature (at ~2.846 keV) arises from transitions into empty eg d-states. These features emerge directly from the sample's Ru5+ (d3) oxidation state, which leaves the d-orbitals only partially filled. This d3 configuration provides a large number of empty t2g states for excitation, producing the strong A-feature, while the remaining transitions into the higher-energy empty eg states generate the distinct B-feature. | Full points for correctly assigning the A-feature to transitions into empty t2g d-states and the B-feature to transitions into empty eg d-states. |
| q3 | reasoning | 35 | How does the relative intensity of the A-feature in this Ru5+ (d3) standard compare to that of a Ru4+ (d4) standard, and what is the physical basis for this difference? | The relative intensity of the A-feature in the Sr2YRuO6 Ru5+ (d3) standard is significantly higher than that of a Ru4+ (d4) standard. The physical basis for this difference lies directly in the sample's oxidation state and resulting electronic configuration. As a Ru5+ (d3) material, it has fewer d-electrons filling the t2g orbitals compared to a d4 compound. Consequently, there are more empty t2g states available for electronic transitions in this d3 system, which directly translates to the observed higher relative intensity for the A-feature. | Full points for stating that the A-feature intensity is higher in the Ru5+ (d3) standard, and explaining that this is due to having fewer d-electrons (more empty t2g states available for transitions) compared to the d4 configuration. |
Review
#1043
Y2CoRuO6
Ru K, L2,3
▶
LLM Prompt
Sample Information
Material: Y2CoRuO6
Oxidation State: 4+ (d4)
- Ru4+ standard
Measurement
We plan to measure the Ru K, L2,3 XANES spectrum of this sample.
Questions
Based on all the information above:
1. Describe the expected spectral shape of the Ru L2,3-edge white line for Y2CoRuO6 and identify the specific electronic transitions responsible for the bimodal A and B features.
2. What key spectral feature distinguishes the Ru L2,3-edge XANES spectrum of Y2CoRuO6 (Ru4+, d4) from that of a Ru5+ (d3) compound like Sr2YRuO6?
3. Explain the physical reason for the dramatic decrease in the relative A-feature intensity in the Y2CoRuO6 spectrum based on its electronic configuration.
Ground Truth
Compound: Y2CoRuO6
Oxidation state: 4+ (d4)
Measurement: Ru L2,3-edge XANES at NSLS-II TES, 8-BM beamline
Edge position: not reported
Spectral shape: Distinctly bimodal A/B white line feature structure at the L2,3 edges, with a dramatically decreased relative A-feature intensity.
Labeled peaks:
| Label | Energy (eV) | Intensity | Origin | Source |
|---|---|---|---|---|
| A | not reported | dramatically decreased relative to B-feature | transitions into empty t2g d-states | paper_data |
| B | not reported | intense | transitions into empty eg d-states | paper_data |
Distinguishing features: Dramatic decrease in relative A-feature intensity compared to Ru5+ (d3) standards like Sr2YRuO6.
Key reasoning: Y2CoRuO6 is used as a Ru4+ (d4) standard with octahedral O-ligand coordination. Its Ru L2,3-edge spectra exhibit a distinctly bimodal A/B white line feature due to transitions into empty t2g/eg d-states. The d4 configuration results in a dramatic decrease in the relative A-feature intensity compared to d3 standards, reflecting the filling of the t2g states.
Reasoning source: Results and Discussion, X-ray Absorption Near Edge Spectroscopy, page 10
Scoring Rubric (total: 100 pts)
| Q | Type | Max | Question | Reference Answer | Scoring Criteria |
|---|---|---|---|---|---|
| q1 | spectral | 40 | Describe the expected spectral shape of the Ru L2,3-edge white line for Y2CoRuO6 and identify the specific electronic transitions responsible for the bimodal A and B features. | The expected spectral shape of the Ru L2,3-edge white line for Y2CoRuO6 exhibits a distinctly bimodal structure consisting of A and B features. The A feature originates from electronic transitions into empty t2g d-states, while the B feature arises from transitions into empty eg d-states. These specific features arise because Y2CoRuO6 acts as a Ru4+ standard with octahedral O-ligand coordination, which splits the d-orbitals into t2g and eg levels. Furthermore, because the sample has a d4 electronic configuration, the relative intensity of the A-feature is dramatically decreased compared to the B-feature, reflecting the partial filling of the t2g states. | Full points if the answer mentions the bimodal A/B white line structure and correctly assigns feature A to transitions into empty t2g d-states and feature B to transitions into empty eg d-states. |
| q2 | reasoning | 30 | What key spectral feature distinguishes the Ru L2,3-edge XANES spectrum of Y2CoRuO6 (Ru4+, d4) from that of a Ru5+ (d3) compound like Sr2YRuO6? | The key distinguishing spectral feature of Y2CoRuO6 compared to a Ru5+ (d3) standard like Sr2YRuO6 is a dramatic decrease in the relative intensity of the A-feature in its bimodal white line. This difference arises directly from the sample's specific electronic configuration as a Ru4+ (d4) standard with octahedral O-ligand coordination. In this d4 state, the t2g d-states are more filled than in a d3 configuration. Consequently, there are fewer empty t2g states available for transitions, which physically causes the observed reduction in the A-feature intensity relative to the B-feature. | Full points if the answer identifies the dramatic decrease in the relative intensity of the A-feature (compared to the B-feature) in Y2CoRuO6 relative to Sr2YRuO6. |
| q3 | reasoning | 30 | Explain the physical reason for the dramatic decrease in the relative A-feature intensity in the Y2CoRuO6 spectrum based on its electronic configuration. | The dramatic decrease in the relative A-feature intensity in the Y2CoRuO6 spectrum is physically caused by the filling of the t2g d-states. Under the sample conditions, Y2CoRuO6 is a Ru4+ standard with an octahedral O-ligand coordination, giving it a d4 electronic configuration. The A-feature corresponds to electronic transitions into empty t2g d-states, whereas the B-feature corresponds to empty eg states. Because the d4 configuration has more electrons in the t2g level compared to d3 standards, there are fewer empty t2g states available to accept excited electrons, directly resulting in the dramatically decreased intensity of the A-feature. | Full points if the answer explains that the increased d-electron count (d4 configuration) results in the filling of the t2g states, which decreases the available empty states for the transition corresponding to the A-feature. |
Review
#1044
FeO
Fe K-edge
▶
LLM Prompt
Sample Information
Material: FeO
Oxidation State: 2+
- ~2+ standard
Measurement
We plan to measure the Fe K-edge XANES spectrum of this sample.
Questions
Based on all the information above:
1. Based on the paper, what is the expected oxidation state and local coordination environment of Fe in the FeO standard?
2. Describe the relative energy position of the Fe K-edge main edge and pre-edge features of FeO compared to Fe3+ and Fe4+ standards shown in the study.
Ground Truth
Compound: FeO
Oxidation state: 2+
Measurement: Fe K-edge XANES
Edge position: not explicitly reported as a number, but shown at lower energy than Fe3+ standards
Spectral shape: The main edge has a prominent peak at lower energy than Fe3+ and Fe4+ standards. The pre-edge shows a distinct peak also at lower energy.
Labeled peaks:
| Label | Energy (eV) | Intensity | Origin | Source |
|---|---|---|---|---|
| main edge peak (-2*) | ~7.125 keV (from Fig 4a) | ~1.2 (from Fig 4a) | not discussed in this paper | paper_data |
| pre-edge peak (-2*) | ~7.112 keV (from Fig 4b) | ~0.05 (from Fig 4b) | not discussed in this paper | paper_data |
Distinguishing features: Used as a ~2+ standard with octahedral Fe-O coordination. Its peak energy is 0.57397 keV higher than that of the MnO standard.
Key reasoning: FeO is used as a ~2+ standard with octahedral Fe-O coordination to compare with the Fe-K edge of the target compound. Its main edge and pre-edge positions are at lower energies compared to Fe3+ and Fe4+ standards, consistent with its 2+ oxidation state.
Reasoning source: Section: X-ray Absorption Near Edge Spectroscopy, page 8-9
Scoring Rubric (total: 100 pts)
| Q | Type | Max | Question | Reference Answer | Scoring Criteria |
|---|---|---|---|---|---|
| q1 | identification | 46 | Based on the paper, what is the expected oxidation state and local coordination environment of Fe in the FeO standard? | Based on the paper, the expected oxidation state of Fe in the FeO standard is 2+, and its local coordination environment is octahedral Fe-O. Because the sample is composed entirely of FeO, it inherently possesses this 2+ oxidation state and is therefore utilized as a ~2+ reference standard. The specific composition and structure of the FeO material directly provide this octahedral Fe-O coordination, allowing it to serve as a baseline for comparing the Fe K-edge of target compounds. | The answer must state that Fe is in a 2+ oxidation state and has octahedral Fe-O coordination. |
| q2 | spectral | 54 | Describe the relative energy position of the Fe K-edge main edge and pre-edge features of FeO compared to Fe3+ and Fe4+ standards shown in the study. | The Fe K-edge main edge and pre-edge features of the FeO standard are located at lower energies compared to those of Fe3+ and Fe4+ standards. Specifically, the main edge peak is observed at ~7.125 keV and the pre-edge peak at ~7.112 keV. These relative energy positions arise directly from the sample's composition as pure FeO, which dictates a 2+ oxidation state for iron; as noted in the text, this lower 2+ oxidation state is structurally and electronically consistent with the absorption features shifting to lower energies compared to the more oxidized Fe3+ and Fe4+ states. | The answer must indicate that both the main edge and pre-edge features of FeO are located at lower energies compared to the Fe3+ and Fe4+ standards. |
Review
#1045
MnO
Mn K-edge
▶
LLM Prompt
Sample Information
Material: MnO
Oxidation State: 2+
- ~2+ standard
Measurement
We plan to measure the Mn K-edge XANES spectrum of this sample.
Questions
Based on all the information above:
1. Based on the provided sample information, what is the expected oxidation state of Mn in this material, and how would its Mn K-edge position generally compare to compounds like LaMnO3 or CaMnO3?
2. Describe the expected spectral features (main edge and pre-edge) for this sample and explain its typical role in a XANES study of novel Mn-containing oxides.
3. If you were to plot the pre-edge region of this sample alongside LaMnO3 and CaMnO3, what relative energy ordering would you expect for their pre-edge features?
Ground Truth
Compound: MnO
Oxidation state: 2+
Measurement: Mn K-edge XANES at APS 10-ID/11-ID or NSLS-II 8-ID ISS
Edge position: not explicitly reported, but lower energy than 3+ and 4+ standards
Spectral shape: The spectrum exhibits a main edge peak and a pre-edge feature that are characteristic of the Mn2+ oxidation state, appearing at lower energies compared to higher oxidation state standards.
Labeled peaks:
| Label | Energy (eV) | Intensity | Origin | Source |
|---|---|---|---|---|
| 2* (main edge peak) | ~6.555 keV (estimated from Figure 5a) | not explicitly quantified | not discussed in this paper | paper_data |
| 2* (pre-edge peak) | ~6.540 keV (estimated from Figure 5b) | not explicitly quantified | not discussed in this paper | paper_data |
Distinguishing features: Its main edge and pre-edge positions are at lower energies compared to higher oxidation state standards like LaMnO3 (~3+) and CaMnO3 (~4+), making it a clear marker for the 2+ state.
Key reasoning: MnO is used as a ~2+ standard reference material to compare the chemical shift and pre-edge features of unknown samples (like MnFe0.5Ru0.5O3) to determine their Mn oxidation state. Its edge position serves as a baseline for the Mn2+ state.
Reasoning source: Page 8-9, X-ray Absorption Near Edge Spectroscopy section
Scoring Rubric (total: 100 pts)
| Q | Type | Max | Question | Reference Answer | Scoring Criteria |
|---|---|---|---|---|---|
| q1 | reasoning | 30 | Based on the provided sample information, what is the expected oxidation state of Mn in this material, and how would its Mn K-edge position generally compare to compounds like LaMnO3 or CaMnO3? | Based on the provided sample information, the expected oxidation state of Mn in this material is 2+. Because the sample is pure MnO, it consists entirely of a 1.0 fraction of the MnO phase, which serves as a standard reference material for the Mn2+ state. Consequently, its Mn K-edge position will appear at a lower energy compared to higher oxidation state standards like LaMnO3 (~3+) and CaMnO3 (~4+). This lower energy position arises directly from the lower 2+ oxidation state of the MnO sample, establishing a baseline chemical shift for evaluating unknown materials. | Full credit if the answer identifies the oxidation state as 2+ and states that its edge position will be at a lower energy compared to the 3+ (LaMnO3) and 4+ (CaMnO3) standards. |
| q2 | spectral | 40 | Describe the expected spectral features (main edge and pre-edge) for this sample and explain its typical role in a XANES study of novel Mn-containing oxides. | The expected spectral features for this MnO sample include a main edge peak at approximately 6.555 keV and a pre-edge peak at roughly 6.540 keV. Because the sample is a pure MnO standard (1.0 fraction) with a 2+ oxidation state, these features naturally appear at lower energies than those of higher oxidation state materials. In a XANES study, this sample typically serves as a baseline reference to determine the Mn oxidation state of unknown samples, such as MnFe0.5Ru0.5O3. By comparing the chemical shift and pre-edge features of the unknown to this Mn2+ standard, researchers can accurately identify the oxidation state of the novel material. | Full credit if the answer mentions the presence of characteristic main edge and pre-edge peaks for Mn2+ and explains that it is used as a standard reference material to determine the oxidation state of unknown samples via chemical shift comparison. |
| q3 | prediction | 30 | If you were to plot the pre-edge region of this sample alongside LaMnO3 and CaMnO3, what relative energy ordering would you expect for their pre-edge features? | When plotting the pre-edge region, the MnO sample's pre-edge feature (at ~6.540 keV) would appear at the lowest energy, followed by LaMnO3, and then CaMnO3 at the highest energy. This specific energy ordering results directly from the oxidation states of the materials, as the sample is a pure MnO standard representing the Mn2+ state. Because X-ray absorption edge and pre-edge energies shift to higher values as the oxidation state increases, the 2+ state of MnO naturally sits at a lower energy than the ~3+ state of LaMnO3 and the ~4+ state of CaMnO3. Therefore, the 1.0 fraction of MnO provides a clear, low-energy baseline marker for the 2+ state in comparative plots. | Full credit if the answer correctly predicts the energy ordering: MnO (2+) < LaMnO3 (3+) < CaMnO3 (4+). |
Review
#1046
RuO2
Ru K-edge
▶
LLM Prompt
Sample Information
Material: RuO2
Oxidation State: 4+
- Ru4+ standard
Measurement
We plan to measure the Ru K-edge XANES spectrum of this sample.
Questions
Based on all the information above:
1. What is the formal oxidation state of Ru in the RuO2 standard?
2. Describe the relative edge position of the RuO2 Ru K-edge spectrum compared to Ru metal.
3. What is the primary purpose of measuring the RuO2 standard in the context of characterizing new Ru-containing compounds?
Ground Truth
Compound: RuO2
Oxidation state: 4+
Measurement: Ru K-edge XANES at APS (10-ID/11-ID) or NSLS-II (8-ID ISS)
Edge position: ~22160 eV (peak position from Figure 6a)
Spectral shape: The Ru K-edge spectrum features a main absorption edge with a peak located around 22.16 keV.
Distinguishing features: The edge position is shifted to higher energy compared to Ru metal, serving as a benchmark for the Ru4+ oxidation state.
Key reasoning: RuO2 is used as a Ru4+ standard to determine the oxidation state of Ru in the synthesized MnFe0.5Ru0.5O3 sample by comparing the chemical shift of the Ru-K edge.
Reasoning source: Results and Discussion, X-ray Absorption Near Edge Spectroscopy section, page 10
Scoring Rubric (total: 100 pts)
| Q | Type | Max | Question | Reference Answer | Scoring Criteria |
|---|---|---|---|---|---|
| q1 | identification | 20 | What is the formal oxidation state of Ru in the RuO2 standard? | The formal oxidation state of Ru in the RuO2 standard is 4+. This specific oxidation state arises because the sample consists entirely of pure RuO2 (fraction 1.0), a compound where ruthenium inherently exists in the 4+ state. Given this well-defined composition, the material is utilized as a reliable Ru4+ standard. Consequently, it provides a benchmark to determine the oxidation state of Ru in synthesized samples, such as MnFe0.5Ru0.5O3, by comparing the chemical shift of the Ru K-edge. | Award full points for identifying the oxidation state as 4+. |
| q2 | spectral | 40 | Describe the relative edge position of the RuO2 Ru K-edge spectrum compared to Ru metal. | The Ru K-edge position of the RuO2 spectrum is shifted to a higher energy compared to Ru metal, featuring a main absorption peak located at approximately 22160 eV (22.16 keV). This higher-energy shift occurs because the sample is a pure RuO2 standard where ruthenium exists in a 4+ oxidation state. The 4+ oxidation state alters the electronic environment compared to the neutral metal, resulting in the observed shift to higher energies. As a result, these specific spectral features serve as a benchmark to determine the oxidation state of Ru in synthesized materials like MnFe0.5Ru0.5O3 via chemical shift comparison. | Award full points for stating that the RuO2 edge is shifted to higher energy compared to Ru metal, with a peak around 22.16 keV. |
| q3 | reasoning | 40 | What is the primary purpose of measuring the RuO2 standard in the context of characterizing new Ru-containing compounds? | The primary purpose of measuring the RuO2 standard is to establish a benchmark for the Ru4+ oxidation state. Because the sample is composed of 100% RuO2, it provides a reliable reference spectrum with a main absorption peak around 22160 eV. This distinct spectral profile and higher-energy chemical shift arise directly from the 4+ state of the ruthenium ions in the standard. By measuring this, researchers can determine the oxidation state of Ru in newly synthesized compounds, such as MnFe0.5Ru0.5O3, by comparing the chemical shift of the unknown sample's Ru K-edge to this standard. | Award full points for explaining that it serves as a Ru4+ reference standard to determine the oxidation state of Ru in unknown samples via comparison of the chemical shift. |
Review
Heterometal incorporation in NH 2 -MIL-125(Ti) and its participation in the photoinduced charge-separated excited state
BNL-NSLS-II-8-ID
Catalyst
Lauren Hanna et al.
DOI: 10.1039/d0cc05339b
1 scenario
▶
#1047
NH2-MIL-125(Ti,Fe)
Fe K-edge
▶
LLM Prompt
Sample Information
Material: NH2-MIL-125(Ti,Fe)
Reaction Conditions: steady state
Sample-Specific Conditions
- synthesis method: direct synthesis
- Fe-doped Ti-based metal organic framework
Measurement
We plan to measure the Fe K-edge XANES spectrum of this sample.
Questions
Based on all the information above:
1. Based on the direct synthesis method described for NH2-MIL-125(Ti,Fe), what is the expected oxidation state and local coordination environment of the Fe sites, and which reference material's spectrum best matches this state?
2. Describe the expected XANES spectral shape for this directly synthesized sample, specifically noting the presence and approximate energy positions of the pre-edge and main absorption edge features.
3. How does the XANES pre-edge feature of this directly synthesized NH2-MIL-125(Ti,Fe) distinguish it from a sample prepared via a transmetallation approach (soaking in FeCl3)?
Ground Truth
Material: NH2-MIL-125(Ti,Fe)
Measurement: Fe K-edge XANES, steady state
Fit method: Qualitative comparison
Phase fractions: (±10%)
| Phase | Fraction |
|---|---|
| Fe3+ octahedral (Fe2O3-like) | 1.0 |
Fit basis (paper's reference spectra):
- Fe-foil
- a-Fe2O3
- FeCl3
- FeCl3-soaked MOF
Source evidence: Figure 2a and Page 2 text
Key reasoning: The direct synthesis method successfully incorporates Fe into the metal-oxo nodes. The XANES pre-edge feature and main absorption edge are similar to those of Fe2O3, indicating comparable Fe3+ octahedral speciation within the MOF. The spectrum confirms the material is devoid of metallic Fe or residual FeCl3 impurities, which are instead observed when using a post-synthetic soaking method.
Reasoning source: Page 2, right column, first paragraph
Scoring Rubric (total: 100 pts)
| Q | Type | Max | Question | Reference Answer | Scoring Criteria |
|---|---|---|---|---|---|
| q1 | reasoning | 30 | Based on the direct synthesis method described for NH2-MIL-125(Ti,Fe), what is the expected oxidation state and local coordination environment of the Fe sites, and which reference material's spectrum best matches this state? | The expected oxidation state of the Fe sites is Fe3+ in an octahedral coordination environment, which best matches the spectrum of the alpha-Fe2O3 reference material. This specific speciation arises because the direct synthesis method successfully incorporates Fe directly into the metal-oxo nodes of the Ti-based MOF. By substituting into the Ti-oxo cluster during synthesis, the material achieves a 1.0 fraction of Fe3+ octahedral sites. This method ensures the sample is devoid of metallic Fe or residual FeCl3 impurities, resulting in a local environment that closely mimics Fe2O3. | Full credit requires identifying the oxidation state as Fe3+, the coordination as octahedral, and stating that the spectrum closely matches Fe2O3 (or alpha-Fe2O3). |
| q2 | spectral | 35 | Describe the expected XANES spectral shape for this directly synthesized sample, specifically noting the presence and approximate energy positions of the pre-edge and main absorption edge features. | The expected XANES spectrum exhibits a distinct pre-edge feature at approximately 7114 eV and a main absorption edge rising near 7120 eV, culminating in a high-intensity white line around 7132 eV. These specific spectral features closely match the overall shape and edge position of the alpha-Fe2O3 reference. This spectral profile arises because the direct synthesis method successfully incorporates Fe3+ directly into the octahedral metal-oxo nodes of the Ti-based MOF. The resulting high-symmetry octahedral coordination environment of the substituted Fe sites produces this distinct Fe2O3-like absorption signature. | Full credit requires mentioning a distinct pre-edge feature (around 7114 eV) and a main absorption edge/white line (edge rising near 7120 eV, peak near 7132 eV), noting the overall similarity to Fe2O3. |
| q3 | reasoning | 35 | How does the XANES pre-edge feature of this directly synthesized NH2-MIL-125(Ti,Fe) distinguish it from a sample prepared via a transmetallation approach (soaking in FeCl3)? | The XANES pre-edge feature of the directly synthesized sample indicates a higher symmetry Fe coordination environment compared to a sample prepared by soaking in FeCl3. This distinction arises because the direct synthesis method successfully incorporates Fe3+ directly into the octahedral metal-oxo nodes of the Ti-based MOF. In contrast, the post-synthetic soaking method fails to achieve complete substitution, leading to a lower symmetry pre-edge feature and the presence of residual FeCl3 impurities. Consequently, the direct synthesis conditions are responsible for the pure, Fe2O3-like octahedral speciation that is devoid of unreacted precursor artifacts. | Full credit requires explaining that the directly synthesized sample shows a pre-edge feature indicative of a higher symmetry coordination environment, whereas the post-synthetically soaked MOF shows a lower symmetry pre-edge feature and/or residual FeCl3 impurities. |
Review
Studies of CO 2 hydrogenation over cobalt/ceria catalysts with in situ characterization: the effect of cobalt loading and metal–support interactions on the catalytic activity
BNL-NSLS-II-8-ID
Catalyst
Kaixi Deng et al.
DOI: 10.1039/d0cy00962h
6 scenarios
▶
#1048
Co/CeO2
Co K-edge
▶
LLM Prompt
Sample Information
Material: Co/CeO2
Support: CeO2
Reaction Conditions: pristine
Sample-Specific Conditions
- Cobalt loading and state: 1 wt%, pristine
- 1wt% cobalt loaded on ceria support, pristine state
Measurement
We plan to measure the Co K-edge XANES spectrum of this sample.
Questions
Based on all the information above:
1. Based on the sample conditions (1wt% Co/CeO2, calcined at 400 °C in air, pristine state), what are the expected cobalt phases and their approximate fractions?
2. What reference spectra should be included in the basis set for Linear Combination Fitting (LCF) of the XANES spectrum for this sample?
3. Explain the physical reasoning for the high fraction of CoO in this pristine 1wt% Co/CeO2 sample, given that it was calcined at 400 °C in air where Co3O4 is typically the thermodynamically stable bulk phase.
Ground Truth
Material: Co/CeO2
Measurement: Co K-edge XANES, fluorescence-yield (FLY) mode, 8-ID Inner-Shell Spectroscopy (ISS) beamline
Fit method: linear combination fitting (LCF)
Phase fractions: (±10%)
| Phase | Fraction |
|---|---|
| CoO | 0.62 |
| Co3O4 | 0.38 |
Fit basis (paper's reference spectra):
- cobalt foil
- CoO
- Co3O4
Source evidence: Figure 3a, page 8
Key reasoning: According to the T-p(O2) phase diagram of the Co-O system, Co3O4 is the stable phase for bulk materials at the synthesis conditions (calcined at 400 °C in air). The presence of a significant amount of CoO suggests that part of the cobalt has a strong interaction with CeO2, which increases the stability of CoO. Because a stronger interaction is expected near the cobalt/ceria interface, and smaller cobalt particles (as in the 1wt% sample) have a larger interface fraction, the CoO concentration is inversely proportional to the cobalt particle size, making it the dominant phase in the 1wt% pristine sample.
Reasoning source: Page 8, text below Figure 3
Scoring Rubric (total: 100 pts)
| Q | Type | Max | Question | Reference Answer | Scoring Criteria |
|---|---|---|---|---|---|
| q1 | quantification | 40 | Based on the sample conditions (1wt% Co/CeO2, calcined at 400 °C in air, pristine state), what are the expected cobalt phases and their approximate fractions? | The expected cobalt phases for the pristine 1wt% Co/CeO2 sample are CoO and Co3O4, with approximate fractions of 0.62 (62%) and 0.38 (38%), respectively, with an uncertainty of about 10%. Although Co3O4 is the thermodynamically stable bulk phase at the synthesis conditions of 400 °C in air, a significant amount of CoO is present due to a strong interaction between the cobalt and the CeO2 support. This interaction stabilizes the CoO phase near the cobalt/ceria interface. Because the 1wt% cobalt loading results in smaller cobalt particles with a larger interface fraction, the CoO concentration is inversely proportional to particle size, making it the dominant phase in this specific sample. | Full points for identifying CoO and Co3O4 with fractions around 62% and 38% respectively. Partial points for identifying the correct phases without accurate fractions. |
| q2 | identification | 20 | What reference spectra should be included in the basis set for Linear Combination Fitting (LCF) of the XANES spectrum for this sample? | The basis set for Linear Combination Fitting (LCF) of this sample's XANES spectrum should include reference spectra for cobalt foil, CoO, and Co3O4. These specific references are required because the sample consists of cobalt loaded onto a CeO2 support and calcined at 400 °C in air, which typically forms bulk Co3O4. However, the strong interaction at the cobalt/ceria interface stabilizes the CoO phase, especially in a low-loading (1wt%) sample where small particles maximize this interfacial area. Therefore, including both oxide phases (CoO and Co3O4) along with metallic cobalt foil ensures all potential oxidation states and phases resulting from these synthesis conditions are accounted for in the fit. | Full points for listing CoO and Co3O4 (and optionally Co foil, as it is part of the general basis set used for these samples). |
| q3 | reasoning | 40 | Explain the physical reasoning for the high fraction of CoO in this pristine 1wt% Co/CeO2 sample, given that it was calcined at 400 °C in air where Co3O4 is typically the thermodynamically stable bulk phase. | While the bulk Co-O phase diagram indicates that Co3O4 is the stable phase when calcined at 400 °C in air, the high fraction of CoO (62%) arises from a strong interaction between the cobalt and the CeO2 support. This strong metal-support interaction locally increases the thermodynamic stability of the CoO phase. Because this stabilizing effect is strongest near the cobalt/ceria interface, the concentration of CoO is inversely proportional to the cobalt particle size. In the 1wt% pristine sample, the low cobalt loading leads to smaller particles with a much larger interface fraction, ultimately making CoO the dominant phase despite the oxidizing calcination conditions. | Full points for explaining that strong metal-support interactions at the cobalt/ceria interface stabilize CoO. Smaller cobalt particles in the 1wt% loading have a larger interface fraction, leading to a higher proportion of CoO compared to higher loadings. |
Review
#1049
Co/CeO2
Co K-edge
▶
LLM Prompt
Sample Information
Material: Co/CeO2
Support: CeO2
Reaction Conditions: pristine
Sample-Specific Conditions
- Cobalt loading and state: 2 wt%, pristine
- 2wt% cobalt loaded on ceria support, pristine state
Measurement
We plan to measure the Co K-edge XANES spectrum of this sample.
Questions
Based on all the information above:
1. What candidate reference spectra are needed to perform a Linear Combination Fitting (LCF) analysis of the Co K-edge XANES data for this pristine Co/CeO2 catalyst?
2. Given the sample conditions (2wt% Co loading, calcined at 400 °C in air), estimate the phase fractions of the cobalt species present in the pristine state.
3. Explain the physical reasoning for why a significant fraction of CoO is present in this pristine sample, despite Co3O4 being the thermodynamically stable bulk phase under the calcination conditions (400 °C in air).
Ground Truth
Material: Co/CeO2
Measurement: Co K-edge XANES, fluorescence-yield (FLY) mode, 8-ID (ISS) beamline at NSLS-II
Fit method: Linear combination fitting (LCF)
Phase fractions: (±10%)
| Phase | Fraction |
|---|---|
| CoO | 0.48 |
| Co3O4 | 0.52 |
Fit basis (paper's reference spectra):
- Co foil
- CoO
- Co3O4
Source evidence: Figure 3(a) and text on page 8
Key reasoning: At the synthesis conditions (calcination at 400 °C in air), Co3O4 is the thermodynamically stable phase for bulk materials. However, strong metal-support interactions at the cobalt/ceria interface increase the stability of CoO. Because smaller cobalt particles have a larger interface fraction, the CoO concentration in the pristine samples is inversely proportional to the cobalt particle size. The 2wt% Co/CeO2 sample has an intermediate particle size, resulting in a roughly equal mixture of CoO and Co3O4.
Reasoning source: Page 8, Results and discussion section (text below Figure 3)
Scoring Rubric (total: 100 pts)
| Q | Type | Max | Question | Reference Answer | Scoring Criteria |
|---|---|---|---|---|---|
| q1 | identification | 20 | What candidate reference spectra are needed to perform a Linear Combination Fitting (LCF) analysis of the Co K-edge XANES data for this pristine Co/CeO2 catalyst? | To perform the Linear Combination Fitting (LCF) analysis of the Co K-edge XANES data, the required candidate reference spectra are Co foil, CoO, and Co3O4. These specific references are needed because the pristine 2 wt% Co/CeO2 sample contains a mixture of cobalt oxide phases resulting from its synthesis conditions. While calcination at 400 °C in air typically produces thermodynamically stable bulk Co3O4, strong metal-support interactions at the cobalt/ceria interface stabilize the CoO phase. Consequently, both CoO and Co3O4 references, along with metallic Co foil, are necessary to accurately model the mixed-phase composition driven by the intermediate particle size at this 2 wt% loading. | Full credit for identifying CoO and Co3O4 as the primary oxide references needed. Partial credit if only one is mentioned or if metallic Co is included without the oxides. |
| q2 | quantification | 40 | Given the sample conditions (2wt% Co loading, calcined at 400 °C in air), estimate the phase fractions of the cobalt species present in the pristine state. | In the pristine state, the 2 wt% Co/CeO2 sample consists of approximately 48% CoO and 52% Co3O4, with an uncertainty of 10%. These specific fractions arise because the 2 wt% cobalt loading results in an intermediate cobalt particle size on the ceria support. Although bulk Co3O4 is the thermodynamically stable phase after calcination at 400 °C in air, strong metal-support interactions at the cobalt/ceria interface stabilize the CoO phase. Since the CoO concentration is inversely proportional to the particle size due to the interface fraction, this intermediate particle size yields a roughly equal mixture of the two oxide phases. | Full credit for estimating a roughly equal mixture of CoO (~48%) and Co3O4 (~52%). Partial credit for identifying that both CoO and Co3O4 are present in significant amounts, even if the exact percentages deviate slightly. |
| q3 | reasoning | 40 | Explain the physical reasoning for why a significant fraction of CoO is present in this pristine sample, despite Co3O4 being the thermodynamically stable bulk phase under the calcination conditions (400 °C in air). | A significant fraction of CoO (48%) is present in the pristine 2 wt% Co/CeO2 sample due to strong metal-support interactions at the cobalt/ceria interface. Under the synthesis conditions of calcination at 400 °C in air, Co3O4 is indeed the thermodynamically stable phase for bulk materials. However, the interaction with the CeO2 support increases the stability of the CoO phase at the interface. Because smaller cobalt particles possess a larger interface fraction, the concentration of stabilized CoO is inversely proportional to the cobalt particle size. At a 2 wt% loading, the intermediate particle size provides enough interfacial area to stabilize a roughly equal mixture of CoO and Co3O4. | Full credit for explaining that strong metal-support interactions at the cobalt/ceria interface stabilize the CoO phase, and that this effect is prominent due to the relatively small cobalt particle size (which provides a large interface fraction) at this 2wt% loading. |
Review
#1050
Co/CeO2
Co K-edge
▶
LLM Prompt
Sample Information
Material: Co/CeO2
Support: CeO2
Reaction Conditions: pristine
Sample-Specific Conditions
- Cobalt loading and state: 4 wt%, pristine
- 4wt% cobalt loaded on ceria support, pristine state
Measurement
We plan to measure the Co K-edge XANES spectrum of this sample.
Questions
Based on all the information above:
1. Based on the sample conditions (4wt% Co loaded on CeO2, calcined at 400 °C in air, pristine state), what are the expected cobalt phases and their approximate fractions?
2. What reference spectra should be included in a Linear Combination Fitting (LCF) analysis to accurately determine the speciation of this pristine catalyst?
3. Explain the physical reasoning behind the observed phase composition for the 4wt% Co/CeO2 pristine sample. Specifically, why are both Co3O4 and CoO present, and why does Co3O4 dominate in this 4wt% sample compared to lower loading samples?
Ground Truth
Material: Co/CeO2
Measurement: Co K-edge XANES in fluorescence-yield (FLY) mode at the 8-ID Inner-Shell Spectroscopy (ISS) beamline of NSLS-II
Fit method: Linear combination fitting (LCF)
Phase fractions: (±10%)
| Phase | Fraction |
|---|---|
| CoO | 0.22 |
| Co3O4 | 0.78 |
Fit basis (paper's reference spectra):
- metallic cobalt (Co foil)
- CoO
- Co3O4
Source evidence: Figure 3a and text on page 7-8
Key reasoning: According to the T-p(O2) phase diagram, Co3O4 is the stable phase for bulk materials at the synthesis conditions (calcined at 400 °C in air). The presence of CoO in the pristine samples is due to a strong interaction with the CeO2 support near the cobalt/ceria interface, which increases the stability of CoO. Because the 4wt% Co/CeO2 sample has the largest cobalt particle size, it has a smaller interface fraction compared to lower loading samples, resulting in Co3O4 dominating the composition and CoO being a minor phase.
Reasoning source: Results and discussion section, page 8
Scoring Rubric (total: 100 pts)
| Q | Type | Max | Question | Reference Answer | Scoring Criteria |
|---|---|---|---|---|---|
| q1 | quantification | 40 | Based on the sample conditions (4wt% Co loaded on CeO2, calcined at 400 °C in air, pristine state), what are the expected cobalt phases and their approximate fractions? | The expected cobalt phases for the pristine 4wt% Co/CeO2 sample are Co3O4 at a fraction of 0.78 and CoO at a fraction of 0.22, with an uncertainty of 10%. These specific values result from the synthesis conditions, where calcination at 400 °C in air makes Co3O4 the thermodynamically stable bulk phase. However, a strong interaction at the cobalt/ceria interface stabilizes the CoO phase. Because the 4wt% loading results in the largest cobalt particle size, the relative fraction of this interfacial CoO is small, allowing the bulk Co3O4 phase to dominate the overall composition. | Award 20 points for correctly identifying Co3O4 as the major phase and CoO as the minor phase. Award 20 points for estimating the fractions at approximately 78% Co3O4 and 22% CoO (allow a +/- 10% margin). |
| q2 | identification | 20 | What reference spectra should be included in a Linear Combination Fitting (LCF) analysis to accurately determine the speciation of this pristine catalyst? | To accurately determine the speciation of this pristine catalyst, the Linear Combination Fitting (LCF) analysis should include reference spectra for metallic cobalt (Co foil), CoO, and Co3O4. These specific references are required because the sample conditions and support interactions dictate a mixed-phase composition. Specifically, calcination at 400 °C in air drives the formation of bulk Co3O4 as the stable phase. Simultaneously, strong interactions between the cobalt and the CeO2 support at the interface stabilize the CoO phase, necessitating its inclusion in the fit. Metallic cobalt is also included in the basis set to fully capture the speciation boundaries and ensure a comprehensive fit of the pristine state. | Award 10 points for including Co3O4 and 10 points for including CoO as necessary reference spectra. Mentioning metallic Co is acceptable but not strictly required for scoring full points on the pristine sample. |
| q3 | reasoning | 40 | Explain the physical reasoning behind the observed phase composition for the 4wt% Co/CeO2 pristine sample. Specifically, why are both Co3O4 and CoO present, and why does Co3O4 dominate in this 4wt% sample compared to lower loading samples? | Both Co3O4 and CoO are present in the pristine 4wt% Co/CeO2 sample due to a competition between bulk thermodynamics and support interactions. According to the phase diagram, calcination at 400 °C in air makes Co3O4 the stable phase for bulk cobalt materials. However, a strong interaction with the CeO2 support near the cobalt/ceria interface increases the stability of the CoO phase, explaining its coexistence. Co3O4 dominates the composition (0.78 fraction) in this specific sample because the 4wt% cobalt loading produces the largest cobalt particle sizes. Larger particles have a smaller interfacial fraction interacting with the ceria support compared to lower loading samples, thereby minimizing the support-stabilized CoO phase. | Award 15 points for stating that Co3O4 is the thermodynamically stable bulk phase at the calcination conditions (400 °C in air). Award 15 points for explaining that CoO is stabilized by strong metal-support interactions at the Co/CeO2 interface. Award 10 points for connecting the higher loading (4wt%) to larger particle sizes, which results in a smaller interface fraction and thus a lower proportion of CoO compared to lower loading samples. |
Review
#1051
Co/CeO2
Co K-edge
▶
LLM Prompt
Sample Information
Material: Co/CeO2
Support: CeO2
Reaction Conditions: measured at 250 °C in H2 environment
Sample-Specific Conditions
- Cobalt loading and state: 1 wt%, reduced
- 1wt% cobalt loaded on ceria support, reduced state
Measurement
We plan to measure the Co K-edge XANES spectrum of this sample.
Questions
Based on all the information above:
1. What candidate reference spectra are needed to properly model the Co K-edge XANES of this reduced Co/CeO2 catalyst using linear combination fitting?
2. Given the low cobalt loading (1 wt%) and the reduction treatment at 450 °C in H2, estimate the phase fractions of the cobalt species present in the sample during the in-situ measurement.
3. Explain the physical reasoning for why a significant fraction of oxidized cobalt remains in this 1 wt% loaded sample after reduction at 450 °C, whereas higher loadings (e.g., 4 wt%) might reduce more fully.
Ground Truth
Material: Co/CeO2
Measurement: Co K-edge XANES, fluorescence-yield (FLY) mode, in-situ at 250 °C in H2, 8-ID (ISS) beamline at NSLS-II
Fit method: Linear combination fitting (LCF)
Phase fractions: (±10%)
| Phase | Fraction |
|---|---|
| CoO | 0.51 |
| metallic cobalt | 0.49 |
Fit basis (paper's reference spectra):
- metallic cobalt (Co foil)
- CoO
- Co3O4
Source evidence: Figure 3(b) and text in 'Results and discussion' section (pages 7-9)
Key reasoning: The 1wt% Co/CeO2 sample retains a significant fraction of CoO (~51%) after reduction at 450 °C due to strong metal-support interactions at the cobalt/ceria interface. Smaller cobalt particles in the 1wt% loading have a larger interface fraction, making the CoOx near this interface more difficult to convert into metallic cobalt. EXAFS analysis confirms a shorter, stronger Co-O bond in the 1wt% sample compared to standard CoO, which explains its stability during the reduction process.
Reasoning source: Results and discussion section (pages 8-9) and Conclusions (page 21)
Scoring Rubric (total: 100 pts)
| Q | Type | Max | Question | Reference Answer | Scoring Criteria |
|---|---|---|---|---|---|
| q1 | identification | 20 | What candidate reference spectra are needed to properly model the Co K-edge XANES of this reduced Co/CeO2 catalyst using linear combination fitting? | To properly model the Co K-edge XANES spectrum of this sample using linear combination fitting, the candidate reference spectra needed are metallic cobalt (Co foil), CoO, and Co3O4. These specific reference phases are required because the 1 wt% Co/CeO2 sample undergoes reduction in an H2 environment, which drives the conversion of initial cobalt oxides toward metallic cobalt. However, due to the low 1 wt% loading, the cobalt particles are small and have a large interface fraction with the CeO2 support. This results in strong metal-support interactions and shorter, stronger Co-O bonds that stabilize the oxidized species, meaning a mixture of metallic cobalt and unreduced oxides will be present under these measurement conditions. | Full credit for identifying metallic cobalt (or Co foil) and CoO as necessary references. Partial credit if Co3O4 is also mentioned as a potential starting phase reference, but metallic Co and CoO are the critical ones for the reduced state. |
| q2 | quantification | 40 | Given the low cobalt loading (1 wt%) and the reduction treatment at 450 °C in H2, estimate the phase fractions of the cobalt species present in the sample during the in-situ measurement. | During the in-situ measurement at 250 °C in H2, the estimated phase fractions for the 1 wt% Co/CeO2 sample are 0.51 (51%) CoO and 0.49 (49%) metallic cobalt, with an uncertainty of 10%. These specific values result from the low 1 wt% cobalt loading, which forms small cobalt particles with a high proportion of interfacial sites contacting the ceria support. At this interface, strong metal-support interactions create shorter, stronger Co-O bonds compared to standard bulk CoO. Consequently, this interfacial CoOx is highly stable and difficult to fully convert to metallic cobalt, leaving approximately half of the cobalt in an oxidized CoO state even after the reduction treatment. | Full credit for estimating approximately 50% CoO and 50% metallic cobalt (accepting ranges between 40-60% for each). Deduct points if the answer predicts complete reduction to metallic cobalt or assumes the presence of Co3O4. |
| q3 | reasoning | 40 | Explain the physical reasoning for why a significant fraction of oxidized cobalt remains in this 1 wt% loaded sample after reduction at 450 °C, whereas higher loadings (e.g., 4 wt%) might reduce more fully. | A significant fraction of oxidized cobalt (~51% CoO) remains in the 1 wt% Co/CeO2 sample after reduction in H2 due to strong metal-support interactions at the cobalt/ceria interface. Because of the low 1 wt% loading, the cobalt particles are smaller and possess a much larger interface fraction with the CeO2 support compared to higher loading samples. At this interface, the Co-O bonds are shorter and stronger than those in standard CoO, as confirmed by EXAFS analysis. This enhanced structural stability makes the interfacial CoOx highly resistant to reduction, preventing complete conversion to metallic cobalt and resulting in the observed mixed-phase state. | Full credit for explaining that the low loading (1 wt%) results in smaller cobalt particles with a larger fraction of atoms at the metal-support interface. Must mention the strong metal-support interaction between Co and CeO2 (or shorter/stronger Co-O bonds at the interface) that stabilizes the CoO phase and makes it difficult to reduce to metallic cobalt. |
Review
#1052
Co/CeO2
Co K-edge
▶
LLM Prompt
Sample Information
Material: Co/CeO2
Support: CeO2
Reaction Conditions: measured at 250 °C in H2 environment
Sample-Specific Conditions
- Cobalt loading and state: 2 wt%, reduced
- 2wt% cobalt loaded on ceria support, reduced state
Measurement
We plan to measure the Co K-edge XANES spectrum of this sample.
Questions
Based on all the information above:
1. What candidate reference spectra should be included in the basis set for Linear Combination Fitting (LCF) of this reduced cobalt-ceria catalyst?
2. Estimate the phase fractions of the cobalt species present in the 2wt% Co/CeO2 sample after reduction at 450 °C.
3. Explain the physical reasoning for why a significant fraction of oxidized cobalt (CoO) remains in this sample despite the high-temperature reduction in H2, and how the 2wt% loading dictates this specific fraction compared to other loadings.
Ground Truth
Material: 2wt% Co/CeO2
Measurement: Co K-edge XANES, fluorescence-yield (FLY) mode, in situ at 250 °C in H2, 8-ID ISS beamline at NSLS-II
Fit method: Linear combination fitting (LCF)
Phase fractions: (±15%)
| Phase | Fraction |
|---|---|
| metallic cobalt | 0.76 |
| CoO | 0.24 |
Fit basis (paper's reference spectra):
- metallic cobalt (cobalt foil)
- CoO
- Co3O4
Source evidence: Figure 3(b) and text on pages 7-9
Key reasoning: The remaining CoO in the reduced samples is due to strong metal-support interactions at the cobalt/ceria interface, which makes CoOx difficult to reduce to metallic cobalt. The amount of unreduced CoO is inversely proportional to the cobalt particle size, as smaller particles have a larger interface fraction. The 2wt% sample has an intermediate particle size compared to the 1wt% and 4wt% samples, resulting in an intermediate amount (24%) of stable CoO remaining after reduction at 450 °C.
Reasoning source: Pages 8-9, Results and discussion section
Scoring Rubric (total: 100 pts)
| Q | Type | Max | Question | Reference Answer | Scoring Criteria |
|---|---|---|---|---|---|
| q1 | identification | 20 | What candidate reference spectra should be included in the basis set for Linear Combination Fitting (LCF) of this reduced cobalt-ceria catalyst? | The basis set for Linear Combination Fitting (LCF) should include metallic cobalt (cobalt foil), CoO, and Co3O4 reference spectra. These specific phases are expected because the 2wt% Co/CeO2 catalyst is measured in a reduced state at 250 °C in an H2 environment, which drives the formation of metallic cobalt. However, strong metal-support interactions at the cobalt/ceria interface make some CoOx difficult to fully reduce. Therefore, both metallic and oxidized cobalt references must be included to accurately model the resulting mixture of reduced metal and stabilized oxide phases. | Full points for identifying metallic cobalt (or Co foil), CoO, and Co3O4 as the necessary reference spectra for the fitting basis. |
| q2 | quantification | 40 | Estimate the phase fractions of the cobalt species present in the 2wt% Co/CeO2 sample after reduction at 450 °C. | The estimated phase fractions for the reduced 2wt% Co/CeO2 sample are 0.76 (76%) metallic cobalt and 0.24 (24%) CoO, with a fitting uncertainty of 15%. These specific values arise because strong metal-support interactions at the cobalt/ceria interface prevent complete reduction of the cobalt, even in an H2 environment. The amount of unreduced CoO is inversely proportional to the cobalt particle size, as smaller particles have a larger fraction of their atoms at the support interface. The 2wt% loading produces an intermediate particle size compared to 1wt% and 4wt% loadings, which directly results in this intermediate 24% fraction of stable CoO remaining after reduction. | Full points for estimating approximately 76% metallic cobalt and 24% CoO. Partial credit if the values are within the 15% uncertainty range. |
| q3 | reasoning | 40 | Explain the physical reasoning for why a significant fraction of oxidized cobalt (CoO) remains in this sample despite the high-temperature reduction in H2, and how the 2wt% loading dictates this specific fraction compared to other loadings. | A significant fraction of oxidized cobalt (CoO) remains in the sample despite the reducing H2 environment due to strong metal-support interactions at the cobalt/ceria interface. This interaction stabilizes the CoO phase at the boundary with the CeO2 support, making it highly resistant to reduction into metallic cobalt. The proportion of unreduced CoO is inversely proportional to the cobalt particle size because smaller particles possess a larger relative interfacial area. The 2wt% cobalt loading yields an intermediate particle size compared to 1wt% and 4wt% samples. Consequently, this specific loading dictates an intermediate interfacial fraction, leading directly to the observed 24% of stable CoO remaining in the catalyst. | Full points for explaining that strong metal-support interactions at the cobalt/ceria interface stabilize CoO against reduction, and that the 2wt% loading yields an intermediate particle size (and thus an intermediate interface fraction) compared to 1wt% and 4wt% loadings, leading to its specific remaining CoO fraction. |
Review
#1053
Co/CeO2
Co K-edge
▶
LLM Prompt
Sample Information
Material: Co/CeO2
Support: CeO2
Reaction Conditions: measured at 250 °C in H2 environment
Sample-Specific Conditions
- Cobalt loading and state: 4 wt%, reduced
- 4wt% cobalt loaded on ceria support, reduced state
Measurement
We plan to measure the Co K-edge XANES spectrum of this sample.
Questions
Based on all the information above:
1. Based on the sample composition and treatment, what reference spectra should be included in the basis set for linear combination fitting (LCF) of the XANES data?
2. Estimate the phase fractions of the cobalt species in this 4wt% Co/CeO2 sample after reduction at 450 °C.
3. Explain why this specific sample (4wt% Co loading) achieves such a high degree of reduction compared to lower loading samples, in terms of particle size and metal-support interactions.
Ground Truth
Material: Co/CeO2
Measurement: Co K-edge XANES, in situ, fluorescence-yield (FLY) mode, 8-ID ISS beamline at NSLS-II
Fit method: linear combination fitting (LCF)
Phase fractions: (±10%)
| Phase | Fraction |
|---|---|
| CoO | 0.04 |
| metallic cobalt | 0.96 |
Fit basis (paper's reference spectra):
- metallic cobalt
- CoO
- Co3O4
Source evidence: Figure 3b, page 8
Key reasoning: The 4wt% Co/CeO2 sample has the largest cobalt particle size among the series. Larger particles have a smaller fraction of cobalt atoms at the metal-support interface. Since the strong interaction with CeO2 stabilizes CoO against reduction, the 4wt% sample, having less interfacial cobalt relative to its bulk, is almost completely reduced to metallic cobalt (96%) with only a very small amount of CoO (4%) remaining.
Reasoning source: Page 8, text below Figure 3
Scoring Rubric (total: 100 pts)
| Q | Type | Max | Question | Reference Answer | Scoring Criteria |
|---|---|---|---|---|---|
| q1 | identification | 20 | Based on the sample composition and treatment, what reference spectra should be included in the basis set for linear combination fitting (LCF) of the XANES data? | The basis set for linear combination fitting (LCF) of the XANES data should include metallic cobalt, CoO, and Co3O4 reference spectra. These references are necessary because the 4wt% Co/CeO2 sample is measured in a reduced state under an H2 environment, which drives the reduction of initial cobalt oxides toward metallic cobalt. The inclusion of both CoO and metallic cobalt accounts for the fact that strong metal-support interactions with the CeO2 support stabilize some CoO against complete reduction. Furthermore, the 4wt% loading results in larger cobalt particles with less interfacial area relative to the bulk, meaning the basis set must capture the dominant metallic phase alongside any residual oxide phases. | Full points for identifying metallic cobalt, CoO, and Co3O4 as the primary reference phases. |
| q2 | quantification | 40 | Estimate the phase fractions of the cobalt species in this 4wt% Co/CeO2 sample after reduction at 450 °C. | The estimated phase fractions for the reduced 4wt% Co/CeO2 sample are 96% metallic cobalt and 4% CoO, with an uncertainty of 10%. These specific values result from the 4wt% cobalt loading, which produces the largest cobalt particle size among the series. Because larger particles have a smaller fraction of cobalt atoms at the metal-support interface, less cobalt is subjected to the strong interaction with the CeO2 support that typically stabilizes CoO against reduction. Consequently, the bulk of the sample is almost completely reduced to metallic cobalt in the H2 environment, leaving only a very small 4% fraction of interfacial CoO. | Full points for estimating ~96% metallic cobalt and ~4% CoO. Partial credit for identifying metallic cobalt as the overwhelmingly dominant phase (>90%). |
| q3 | reasoning | 40 | Explain why this specific sample (4wt% Co loading) achieves such a high degree of reduction compared to lower loading samples, in terms of particle size and metal-support interactions. | The 4wt% Co/CeO2 sample achieves a high degree of reduction (96% metallic cobalt) because this higher loading leads to the largest cobalt particle size among the series. In this system, strong metal-support interactions with the CeO2 support stabilize the CoO phase and prevent it from fully reducing in the H2 environment. However, larger cobalt particles possess a significantly smaller fraction of cobalt atoms at this metal-support interface relative to their bulk volume. As a result, the vast majority of the cobalt in the 4wt% sample is not stabilized by the ceria support and can be readily reduced to metallic cobalt, leaving only 4% as CoO. | Full points for explaining that higher loading leads to larger particle sizes, which reduces the fraction of cobalt atoms at the metal-support interface. Since the interaction with CeO2 stabilizes CoO, having less interfacial cobalt allows the bulk of the particle to reduce to metallic cobalt. |
Review
Evolution of the active species of homogeneous Ru hydrodeoxygenation catalysts in ionic liquids
ESRF-BM23
Catalyst
K. Janssens et al.
DOI: 10.1039/d2sc02150a
10 scenarios
▶
#1054
RuBr3 in Bu4PBr
Ru K-edge
▶
LLM Prompt
Sample Information
Material: RuBr3 in Bu4PBr
Sample-Specific Conditions
- Pretreatment: CO
- RuBr3 dissolved in IL, pretreated with CO
Measurement
We plan to measure the Ru K-edge XANES spectrum of this sample.
Questions
Based on all the information above:
1. Based on the sample conditions (RuBr3 dissolved in Bu4PBr, pretreated with CO), what are the expected Ru phases and their approximate fractions?
2. What reference spectra should be used in a linear combination fitting (LCF) analysis to determine the relative ratio of Br vs CO in the Ru coordination sphere for this sample?
3. Explain the physical reasoning for the formation of these specific phases under CO pretreatment and discuss their catalytic significance.
Ground Truth
Material: RuBr3 in Bu4PBr
Measurement: Ru K-edge, transmission mode, BM23 (ESRF) and CLAESS (ALBA)
Fit method: Linear combination fitting (LCF)
Phase fractions: (±10%)
| Phase | Fraction |
|---|---|
| Ru3(CO)12 | 0.92 |
| RuBr3 | 0.08 |
Fit basis (paper's reference spectra):
- RuBr3
- Ru3(CO)12
Source evidence: Page 7, Figure 5 and text: 'in the presence of CO during the pretreatment step, this sample almost fully (ca. 92%) converts to [RuBr2(CO)3]2 (reference) species.'
Key reasoning: The presence of CO gas during the pretreatment transforms the RuBr3 salt dissolved in the ionic liquid into Ru carbonyl species. The XANES spectrum becomes highly similar to that of the crystalline [RuBr2(CO)3]2 reference compound. This CO pretreatment is crucial to convert dissolved RuBrx into the active complex, which is necessary for selective carbonyl hydrogenation.
Reasoning source: Page 6, Section 'The role of CO and reaction conditions' and Page 7, text describing Figure 5
Scoring Rubric (total: 100 pts)
| Q | Type | Max | Question | Reference Answer | Scoring Criteria |
|---|---|---|---|---|---|
| q1 | quantification | 40 | Based on the sample conditions (RuBr3 dissolved in Bu4PBr, pretreated with CO), what are the expected Ru phases and their approximate fractions? | The expected Ru phases are a Ru carbonyl species (modeled using a Ru3(CO)12 reference) at approximately 92% and unreacted RuBr3 at approximately 8%, with a 10% uncertainty. These specific fractions result from the CO gas pretreatment, which drives the almost complete transformation of the initial RuBr3 salt dissolved in the Bu4PBr ionic liquid. The CO reacts with the dissolved RuBrx to form a carbonyl complex whose XANES spectrum is highly similar to crystalline [RuBr2(CO)3]2. This nearly full conversion is expected under these conditions because it is necessary to generate the active complex required for selective carbonyl hydrogenation. | Full score if [RuBr2(CO)3]2 is identified as the dominant phase (~92%) and RuBrx as the minor phase (~8%). Partial credit for identifying the correct phases without accurate fractions. |
| q2 | identification | 30 | What reference spectra should be used in a linear combination fitting (LCF) analysis to determine the relative ratio of Br vs CO in the Ru coordination sphere for this sample? | For the linear combination fitting (LCF) analysis, the reference spectra of RuBr3 and Ru3(CO)12 should be used. These references are required because the sample conditions involve RuBr3 dissolved in a Bu4PBr ionic liquid that is subsequently pretreated with CO gas. The CO pretreatment chemically transforms the dissolved RuBr3 salt into Ru carbonyl species, resulting in a mixture of the initial bromide and the newly formed carbonyl complex. By using these specific references, the LCF can accurately capture the extent to which the initial RuBrx species have converted into the active [RuBr2(CO)3]2-like complex necessary for catalysis. | Full score for identifying RuBr3 and Ru3(CO)12 as the reference spectra used for the LCF analysis. |
| q3 | reasoning | 30 | Explain the physical reasoning for the formation of these specific phases under CO pretreatment and discuss their catalytic significance. | The formation of these specific phases occurs because the CO gas introduced during pretreatment directly reacts with the RuBr3 salt dissolved in the Bu4PBr ionic liquid. This interaction transforms the dissolved RuBrx species into Ru carbonyl species, yielding a final composition of 92% carbonyl complex and 8% unreacted RuBr3. The resulting major phase exhibits a XANES spectrum highly similar to the crystalline [RuBr2(CO)3]2 reference compound. The catalytic significance of this transformation is profound, as the CO pretreatment is absolutely crucial to convert the inactive dissolved salt into the active complex necessary for selective carbonyl hydrogenation. | Full score for explaining that CO gas transforms the dissolved RuBr3 into a Ru carbonyl species ([RuBr2(CO)3]2), and that this transformation is crucial for creating the active complex required for selective carbonyl hydrogenation. |
Review
#1055
RuBr3 in Bu4PBr
Ru K-edge
▶
LLM Prompt
Sample Information
Material: RuBr3 in Bu4PBr
Reaction Conditions: 1 bar CO, 20 bar H2, 180 °C
Sample-Specific Conditions
- Gas composition: 1 bar CO, 20 bar H2
- RuBr3 in Bu4PBr (Ru:Br = 1:35) under CO and H2
Measurement
We plan to measure the Ru K-edge XANES spectrum of this sample.
Questions
Based on all the information above:
1. Based on the provided reaction conditions (1 bar CO, 20 bar H2, 180 °C) for the highly concentrated RuBr3 in Bu4PBr catalyst, what are the expected Ru phases present in the system?
2. Estimate the relative phase fractions of the Ru species present under these specific conditions.
3. What reference spectra or basis components extracted from the data would be necessary to perform a linear combination fit or MCR-ALS analysis of the in-situ XANES data for this catalytic system over various conditions?
Ground Truth
Material: RuBr3 in Bu4PBr (high concentration, Ru:Br = 1:35)
Measurement: Ru K-edge in-situ fluorescence mode at SAMBA beamline
Fit method: MCR-ALS
Phase fractions: (±10%)
| Phase | Fraction |
|---|---|
| RuBrx | 0.8 |
| [RuBr2(CO)3]2 | 0.2 |
Fit basis (paper's reference spectra):
- RuBrx
- [RuBr2(CO)3]2
- Metallic Ru
Source evidence: Figure 7b (step 1) and text on page 10257
Key reasoning: Under 1 bar CO and 20 bar H2, a considerable fraction of the initial RuBrx species remains unchanged for the highly concentrated catalyst. The conversion to the active Ru bromide carbonyl complex is limited by the low CO/Ru ratio. Increasing the CO pressure or reducing the Ru loading is required to increase the fraction of the carbonyl species.
Reasoning source: Page 10257, Section 'In situ evolution of Ru-species under reaction conditions'
Scoring Rubric (total: 101 pts)
| Q | Type | Max | Question | Reference Answer | Scoring Criteria |
|---|---|---|---|---|---|
| q1 | identification | 36 | Based on the provided reaction conditions (1 bar CO, 20 bar H2, 180 °C) for the highly concentrated RuBr3 in Bu4PBr catalyst, what are the expected Ru phases present in the system? | The expected Ru phases present in the system are the initial RuBrx species and the active Ru bromide carbonyl complex, [RuBr2(CO)3]2. These specific phases arise because the sample is a highly concentrated RuBr3 in Bu4PBr catalyst (Ru:Br = 1:35) reacting under 1 bar CO and 20 bar H2 at 180 °C. Under these conditions, the conversion of the initial RuBrx to the active [RuBr2(CO)3]2 complex is severely limited by the low CO/Ru ratio. Consequently, a considerable fraction of the initial RuBrx species remains unchanged, while only a small portion successfully converts to the carbonyl complex. | Full points for identifying both RuBrx (or dissolved RuBr3) and a Ru carbonyl species (e.g., [RuBr2(CO)3]2). Partial points for identifying only one. |
| q2 | quantification | 36 | Estimate the relative phase fractions of the Ru species present under these specific conditions. | Under these specific conditions, the estimated relative phase fractions are 80% RuBrx (0.8) and 20% [RuBr2(CO)3]2 (0.2), with an uncertainty of 10%. These specific values result from the highly concentrated nature of the RuBr3 in Bu4PBr catalyst (Ru:Br = 1:35) combined with the gas composition of 1 bar CO and 20 bar H2 at 180 °C. Because the CO/Ru ratio is low under just 1 bar of CO, the conversion to the active Ru bromide carbonyl complex is heavily limited. Therefore, the vast majority of the initial RuBrx species remains unchanged, and increasing the CO pressure or reducing the Ru loading would be required to increase the fraction of the carbonyl species. | Full points for estimating ~80% RuBrx and ~20% Ru carbonyl species. Deduct points for estimates deviating by more than 15%. |
| q4 | identification | 29 | What reference spectra or basis components extracted from the data would be necessary to perform a linear combination fit or MCR-ALS analysis of the in-situ XANES data for this catalytic system over various conditions? | To perform an MCR-ALS analysis of the in-situ XANES data for this catalytic system, the necessary basis components are RuBrx, [RuBr2(CO)3]2, and Metallic Ru. These components are required because they represent the structural evolution of the highly concentrated RuBr3 in Bu4PBr catalyst (Ru:Br = 1:35) under the reaction conditions of CO and H2 at 180 °C. The RuBrx component is needed to fit the considerable fraction of initial species that remains unchanged due to the low CO/Ru ratio at 1 bar CO. The [RuBr2(CO)3]2 component accounts for the active Ru bromide carbonyl complex formed during the limited conversion, while Metallic Ru completes the basis set to capture any further reduction of the catalyst under the 20 bar H2 atmosphere. | Full points for listing the three main components: RuBrx (dissolved precursor), [RuBr2(CO)3]2 (carbonyl species), and metallic Ru (formed under reducing conditions without CO). |
Review
#1056
RuBr3 in Bu4PBr
Ru K-edge
▶
LLM Prompt
Sample Information
Material: RuBr3 in Bu4PBr
Reaction Conditions: 5 bar CO, 180 °C
Sample-Specific Conditions
- Gas composition: 5 bar CO
- RuBr3 in Bu4PBr (Ru:Br = 1:35) under CO
Measurement
We plan to measure the Ru K-edge XANES spectrum of this sample.
Questions
Based on all the information above:
1. Based on the reaction conditions (5 bar CO, 180 °C, no H2), identify the expected Ru phases and estimate their relative fractions in the ionic liquid.
2. What reference spectra or basis components are required to perform a linear combination or MCR-ALS fit of the in-situ XANES data for this catalytic system?
Ground Truth
Material: RuBr3 in Bu4PBr
Measurement: Ru K-edge in-situ fluorescence mode at SAMBA beamline
Fit method: MCR-ALS
Phase fractions: (±10%)
| Phase | Fraction |
|---|---|
| RuBrx | 0.4 |
| [RuBr2(CO)3]2 | 0.6 |
Fit basis (paper's reference spectra):
- RuBrx
- [RuBr2(CO)3]2
- Metallic Ru
Source evidence: Figure 7b, step 2
Key reasoning: The fraction of Ru bromide carbonyl increases by removing H2 and increasing CO pressure (from 1 bar to 5 bar). This demonstrates that higher CO pressure drives the conversion of the dissolved RuBrx precursor into the carbonylated [RuBr2(CO)3]2 species.
Reasoning source: Page 8, Section 'In situ evolution of Ru-species under reaction conditions'
Scoring Rubric (total: 100 pts)
| Q | Type | Max | Question | Reference Answer | Scoring Criteria |
|---|---|---|---|---|---|
| q1 | quantification | 57 | Based on the reaction conditions (5 bar CO, 180 °C, no H2), identify the expected Ru phases and estimate their relative fractions in the ionic liquid. | Under the reaction conditions of 5 bar CO and 180 °C, the expected Ru phases in the Bu4PBr ionic liquid are RuBrx and [RuBr2(CO)3]2. The estimated relative fractions are 40% RuBrx and 60% [RuBr2(CO)3]2, with an uncertainty of 10%. These specific values result from the applied gas composition, where the absence of H2 and the elevated CO pressure (5 bar) drive the conversion of the dissolved RuBrx precursor. Consequently, the higher CO pressure promotes carbonylation, yielding a majority (60%) of the [RuBr2(CO)3]2 species while 40% of the RuBrx precursor remains. | Full points for identifying RuBrx and [RuBr2(CO)3]2 with fractions around 0.4 and 0.6, respectively. Partial points for identifying the correct phases without accurate fractions. |
| q2 | identification | 43 | What reference spectra or basis components are required to perform a linear combination or MCR-ALS fit of the in-situ XANES data for this catalytic system? | To perform an MCR-ALS fit of the in-situ XANES data for this system, the required basis components are RuBrx, [RuBr2(CO)3]2, and Metallic Ru. These specific reference spectra are necessary to capture the chemical transformations occurring in the Bu4PBr ionic liquid at 180 °C under 5 bar CO. Specifically, the elevated CO pressure in the absence of H2 drives the conversion of the dissolved RuBrx precursor into the carbonylated [RuBr2(CO)3]2 species. Therefore, the fitting basis must include the unreacted RuBrx precursor, the [RuBr2(CO)3]2 product formed by the high CO pressure, and Metallic Ru to fully model the system's structural evolution. | Full points for listing the three main components identified in the study: dissolved RuBrx, [RuBr2(CO)3]2 (Ru carbonyl), and metallic Ru. |
Review
#1057
RuBr3 in Bu4PBr
Ru K-edge
▶
LLM Prompt
Sample Information
Material: RuBr3 in Bu4PBr
Reaction Conditions: 0 bar CO, 0 bar H2, 180 °C
Sample-Specific Conditions
- Gas composition: Inert
- RuBr3 in Bu4PBr (Ru:Br = 1:170) under inert
Measurement
We plan to measure the Ru K-edge XANES spectrum of this sample.
Questions
Based on all the information above:
1. Given the sample conditions (RuBr3 dissolved in Bu4PBr at 180 °C under an inert atmosphere with no CO or H2), identify the expected Ru phases and estimate their relative fractions.
2. What candidate reference spectra or basis components are necessary to accurately model the in-situ Ru K-edge XANES data for this catalytic system across various gas environments?
Ground Truth
Material: RuBr3 in Bu4PBr
Measurement: Ru K-edge, fluorescence mode, SAMBA beamline
Fit method: MCR-ALS
Phase fractions: (±10%)
| Phase | Fraction |
|---|---|
| RuBrx | 0.9 |
| [RuBr2(CO)3]2 | 0.1 |
Fit basis (paper's reference spectra):
- RuBrx
- [RuBr2(CO)3]2
- Metallic Ru
Source evidence: Figure 7b, step 4, page 10256
Key reasoning: Under an inert atmosphere in the absence of CO, the Ru carbonyl species gradually converts towards RuBrx species. The active [RuBr2(CO)3]2 complex partially degrades to RuBrx when CO is removed from the system, which is associated with catalyst deactivation.
Reasoning source: Page 10257, 'In situ evolution of Ru-species under reaction conditions' section
Scoring Rubric (total: 100 pts)
| Q | Type | Max | Question | Reference Answer | Scoring Criteria |
|---|---|---|---|---|---|
| q1 | quantification | 57 | Given the sample conditions (RuBr3 dissolved in Bu4PBr at 180 °C under an inert atmosphere with no CO or H2), identify the expected Ru phases and estimate their relative fractions. | Under the specified conditions of 180 °C and an inert atmosphere (0 bar CO, 0 bar H2), the expected Ru phases are RuBrx and [RuBr2(CO)3]2, with relative fractions of 0.9 and 0.1, respectively (with a 10% uncertainty). These specific fractions arise because the absence of CO gas in the environment causes the active [RuBr2(CO)3]2 complex to become unstable and partially degrade. Specifically, the Ru carbonyl species gradually converts back towards the RuBrx species when CO is removed from the system. This conversion mechanism under inert conditions is directly associated with catalyst deactivation, resulting in a system heavily dominated by the RuBrx phase (90%). | Full points for identifying RuBrx as the dominant phase (~90%) and a minor amount of Ru carbonyl / [RuBr2(CO)3]2 (~10%). |
| q2 | identification | 43 | What candidate reference spectra or basis components are necessary to accurately model the in-situ Ru K-edge XANES data for this catalytic system across various gas environments? | To accurately model the in-situ Ru K-edge XANES data for this catalytic system using MCR-ALS, the necessary basis components are RuBrx, [RuBr2(CO)3]2, and Metallic Ru. These specific reference spectra are required because they represent the key structural states the catalyst transitions between depending on the gas environment. For instance, under the current inert conditions (180 °C, 0 bar CO, 0 bar H2), the active [RuBr2(CO)3]2 complex degrades and gradually converts towards the RuBrx species due to the absence of CO. Therefore, utilizing this specific set of basis components is essential to track the evolution of the Ru-species and monitor the catalyst deactivation process as CO is removed from the system. | Full points for listing RuBrx (or RuBr3 in IL), a Ru carbonyl complex (like [RuBr2(CO)3]2), and metallic Ru as the necessary components. |
Review
#1058
RuBr3 in Bu4PBr
Ru K-edge
▶
LLM Prompt
Sample Information
Material: RuBr3 in Bu4PBr
Reaction Conditions: 15 bar H2, 180 °C
Sample-Specific Conditions
- Gas composition: 15 bar H2
- RuBr3 in Bu4PBr (Ru:Br = 1:170) under H2
Measurement
We plan to measure the Ru K-edge XANES spectrum of this sample.
Questions
Based on all the information above:
1. What candidate reference spectra or basis components are necessary to model the in-situ Ru K-edge XANES data for this catalytic system?
2. Based on the provided reaction conditions (15 bar H2, 180 °C, no CO), estimate the phase fractions of the ruthenium species present in the ionic liquid.
Ground Truth
Material: RuBr3 in Bu4PBr
Measurement: Ru K-edge in-situ fluorescence mode at SAMBA beamline
Fit method: MCR-ALS
Phase fractions: (±10%)
| Phase | Fraction |
|---|---|
| RuBrx | 0.95 |
| [RuBr2(CO)3]2 | 0.05 |
Fit basis (paper's reference spectra):
- RuBrx
- [RuBr2(CO)3]2
- Metallic Ru
Source evidence: Figure 7b and 7c (Step 5), Page 7-8
Key reasoning: In the absence of CO gas, under an H2 atmosphere (15 bar) and elevated temperature (180 °C), the ruthenium species gradually convert towards RuBrx species. The Ru carbonyl complex, which forms under CO pressure, is unstable without continuous CO and disintegrates back into the RuBrx form.
Reasoning source: Page 8, right column, 'In situ evolution of Ru-species under reaction conditions'
Scoring Rubric (total: 100 pts)
| Q | Type | Max | Question | Reference Answer | Scoring Criteria |
|---|---|---|---|---|---|
| q1 | identification | 33 | What candidate reference spectra or basis components are necessary to model the in-situ Ru K-edge XANES data for this catalytic system? | To model the in-situ Ru K-edge XANES data for this system, the necessary basis components are RuBrx, [RuBr2(CO)3]2, and Metallic Ru. These specific reference spectra are required because the sample consists of RuBr3 dissolved in a Bu4PBr ionic liquid under 15 bar H2 at 180 °C. Under these elevated temperature and H2-only conditions, the ruthenium species predominantly convert towards the RuBrx form. Any Ru carbonyl complex is unstable without continuous CO pressure and disintegrates back into RuBrx, while metallic Ru serves as a necessary reference for potential reduction under the H2 atmosphere. | Full points for identifying the three main components: a RuBrx species (or RuBr3 in IL), a Ru carbonyl species (or [RuBr2(CO)3]2), and metallic Ru. |
| q2 | quantification | 67 | Based on the provided reaction conditions (15 bar H2, 180 °C, no CO), estimate the phase fractions of the ruthenium species present in the ionic liquid. | Under the specified conditions of 15 bar H2 and 180 °C, the estimated phase fractions are 0.95 (95%) for RuBrx and 0.05 (5%) for [RuBr2(CO)3]2, with an uncertainty of 10%. These specific values result directly from the absence of CO gas in the reaction atmosphere. Without continuous CO pressure, the Ru carbonyl complex is unstable at this elevated temperature. Consequently, the ruthenium species almost completely disintegrate and convert back into the RuBrx form, leaving only a minor 5% residual fraction of the carbonyl complex. | Full points for estimating ~95% RuBrx and ~5% [RuBr2(CO)3]2 (or Ru carbonyl). Partial credit for identifying RuBrx as the overwhelmingly dominant phase (>90%). |
Review
#1059
RuBr3 in Bu4PBr
Ru K-edge
▶
LLM Prompt
Sample Information
Material: RuBr3 in Bu4PBr
Reaction Conditions: 15 bar H2, 220 °C
Sample-Specific Conditions
- Temperature: 220 °C
- RuBr3 in Bu4PBr (Ru:Br = 1:170) under H2 at higher temperature
Measurement
We plan to measure the Ru K-edge XANES spectrum of this sample.
Questions
Based on all the information above:
1. What candidate reference spectra or pure components are necessary to model the in-situ Ru K-edge XANES data for this catalytic system across its various activation and reaction conditions?
2. Based on the provided sample conditions (15 bar H2, 220 °C, no CO), what is the dominant Ru phase present in the ionic liquid?
Ground Truth
Material: RuBr3 in Bu4PBr
Measurement: Ru K-edge in-situ fluorescence mode at SAMBA beamline
Fit method: MCR-ALS
Phase fractions: (±15%)
| Phase | Fraction |
|---|---|
| RuBrx | 1.0 |
Fit basis (paper's reference spectra):
- RuBrx
- [RuBr2(CO)3]2
- Metallic Ru
Source evidence: Figure 7b, step 6 and page 10257
Key reasoning: In the absence of CO gas, the ruthenium species exists entirely as RuBrx in the ionic liquid. Even under 15 bar H2 and at an elevated temperature of 220 °C, the RuBrx species remains stable and does not convert to Ru carbonyl (which requires CO). Furthermore, it does not reduce to metallic Ru clusters, as that reduction pathway requires the presence of a propene precursor (like isopropanol) along with H2.
Reasoning source: Page 10257, 'In situ evolution of Ru-species under reaction conditions'
Scoring Rubric (total: 100 pts)
| Q | Type | Max | Question | Reference Answer | Scoring Criteria |
|---|---|---|---|---|---|
| q1 | identification | 50 | What candidate reference spectra or pure components are necessary to model the in-situ Ru K-edge XANES data for this catalytic system across its various activation and reaction conditions? | To model the in-situ Ru K-edge XANES data for this catalytic system, the necessary pure components are RuBrx, [RuBr2(CO)3]2, and Metallic Ru. These specific references are required because they represent the possible states of the ruthenium catalyst under different reaction environments. The RuBrx phase accounts for the initial and stable species in the Bu4PBr ionic liquid when no CO is present, even at 220 °C and 15 bar H2. The [RuBr2(CO)3]2 component is needed to model potential conversion to a Ru carbonyl species, which would occur if CO gas were introduced. Finally, the Metallic Ru reference is necessary to account for potential reduction to Ru clusters, a pathway that would require both H2 and a propene precursor like isopropanol. | Full points for identifying the three key components: RuBrx (or RuBr3 dissolved in IL), a Ru bromide carbonyl species, and metallic Ru. |
| q2 | prediction | 50 | Based on the provided sample conditions (15 bar H2, 220 °C, no CO), what is the dominant Ru phase present in the ionic liquid? | Under the specified conditions of 15 bar H2 and 220 °C with no CO, the dominant Ru phase is RuBrx, which accounts for a fraction of 1.0 (100%) of the species present. This occurs because, in the absence of CO gas, the ruthenium cannot convert into the [RuBr2(CO)3]2 carbonyl species. Furthermore, despite the elevated temperature and high H2 pressure, the RuBrx species remains entirely stable in the Bu4PBr ionic liquid. It does not reduce to metallic Ru clusters because that specific reduction pathway strictly requires the presence of a propene precursor, such as isopropanol, alongside the H2. | Full points for identifying RuBrx as the sole or overwhelmingly dominant phase (fraction ~1.0). |
Review
#1060
[RuBr2(CO)3]2 in Bu4PBr
Ru K-edge
▶
LLM Prompt
Sample Information
Material: [RuBr2(CO)3]2 in Bu4PBr
Reaction Conditions: 0 bar CO, 0 bar H2, 180 °C
Sample-Specific Conditions
- Precursor: [RuBr2(CO)3]2
- [RuBr2(CO)3]2 in Bu4PBr (1:170) under inert
Measurement
We plan to measure the Ru K-edge XANES spectrum of this sample.
Questions
Based on all the information above:
1. Based on the sample conditions ([RuBr2(CO)3]2 precursor dissolved in Bu4PBr at 180 °C under inert atmosphere), what candidate reference spectra or pure components should be included in a linear combination fitting or MCR-ALS analysis of the in-situ XANES data?
2. Estimate the relative phase fractions of the Ru species present in this sample after heating the [RuBr2(CO)3]2 precursor in the ionic liquid to 180 °C under 0 bar CO and 0 bar H2.
3. Explain the physical reasoning for why the initial [RuBr2(CO)3]2 precursor does not remain as a single pure phase under these specific conditions (dissolved in Bu4PBr, 180 °C, inert atmosphere).
Ground Truth
Material: [RuBr2(CO)3]2 in Bu4PBr
Measurement: Ru K-edge in-situ fluorescence mode at SAMBA beamline
Fit method: MCR-ALS
Phase fractions: (±10%)
| Phase | Fraction |
|---|---|
| RuBrx | 0.6 |
| [RuBr2(CO)3]2 | 0.4 |
Fit basis (paper's reference spectra):
- RuBrx
- [RuBr2(CO)3]2
- Metallic Ru
Source evidence: Figure 7b (step 7) and Figure 7c, page 10256
Key reasoning: When the isolated [RuBr2(CO)3]2 complex is dissolved in the Bu4PBr ionic liquid and heated to 180 °C under an inert atmosphere (0 bar CO, 0 bar H2), it undergoes partial decarbonylation. The ionic liquid environment alone is not sufficient to preserve the structure of the isolated complex without an external CO pressure. Consequently, the sample exists as a mixture of the intact Ru carbonyl species and a decarbonylated RuBrx species.
Reasoning source: Section 'In situ evolution of Ru-species under reaction conditions', page 10257, and 'Ru speciation in IL upon dissolution', page 10255
Scoring Rubric (total: 100 pts)
| Q | Type | Max | Question | Reference Answer | Scoring Criteria |
|---|---|---|---|---|---|
| q1 | identification | 30 | Based on the sample conditions ([RuBr2(CO)3]2 precursor dissolved in Bu4PBr at 180 °C under inert atmosphere), what candidate reference spectra or pure components should be included in a linear combination fitting or MCR-ALS analysis of the in-situ XANES data? | For the MCR-ALS analysis of this sample, the candidate reference spectra should include RuBrx, [RuBr2(CO)3]2, and Metallic Ru. These specific components are required because heating the [RuBr2(CO)3]2 precursor in the Bu4PBr ionic liquid to 180 °C under an inert atmosphere (0 bar CO, 0 bar H2) induces partial decarbonylation. The ionic liquid environment alone is insufficient to preserve the intact structure of the isolated complex without an external CO pressure. Consequently, the fitting basis must account for both the remaining intact Ru carbonyl species and the newly formed decarbonylated RuBrx species, alongside metallic Ru as a potential reduction product. | Full credit for identifying a Ru carbonyl species (or the intact precursor) and a decarbonylated Ru halide/RuBrx species. Partial credit for mentioning only one of these or including metallic Ru (which is a valid basis component for the broader study but not present in this specific step). |
| q2 | quantification | 35 | Estimate the relative phase fractions of the Ru species present in this sample after heating the [RuBr2(CO)3]2 precursor in the ionic liquid to 180 °C under 0 bar CO and 0 bar H2. | Under these conditions, the sample consists of approximately 60% RuBrx and 40% [RuBr2(CO)3]2, with an estimated uncertainty of 10%. These specific fractions result from the partial decarbonylation of the [RuBr2(CO)3]2 precursor when heated to 180 °C in the Bu4PBr ionic liquid under an inert atmosphere (0 bar CO, 0 bar H2). Because there is no external CO pressure applied, the ionic liquid environment alone cannot fully stabilize the precursor at this elevated temperature. This leads to a mixed state where a majority of the complex loses its carbonyl ligands to form the RuBrx species, while a significant minority remains intact. | Full credit for estimating approximately 60% RuBrx (decarbonylated species) and 40% intact [RuBr2(CO)3]2 (carbonyl species). Deduct points proportionally if the estimates deviate by more than 10-15% from these values. |
| q3 | reasoning | 35 | Explain the physical reasoning for why the initial [RuBr2(CO)3]2 precursor does not remain as a single pure phase under these specific conditions (dissolved in Bu4PBr, 180 °C, inert atmosphere). | The initial [RuBr2(CO)3]2 precursor does not remain as a single pure phase because it undergoes partial decarbonylation when heated to 180 °C under an inert atmosphere (0 bar CO, 0 bar H2). While dissolved in the Bu4PBr ionic liquid, the solvent environment alone is not sufficient to preserve the structure of the isolated complex. Without an external CO pressure to stabilize the carbonyl ligands at this elevated temperature, the complex degrades. As a result, the system evolves into a mixture containing both the intact Ru carbonyl species and a decarbonylated RuBrx species. | Full credit for explaining that the complex undergoes partial decarbonylation because the ionic liquid alone cannot stabilize the carbonyl ligands at elevated temperatures without an external CO atmosphere, leading to a mixture of the intact complex and a RuBrx species. |
Review
#1061
RuBr3 in Bu4PBr
Ru K-edge
▶
LLM Prompt
Sample Information
Material: RuBr3 in Bu4PBr
Reaction Conditions: IPA, 30 bar H2, 200 °C
Sample-Specific Conditions
- Gas composition: 30 bar H2
- RuBr3 in Bu4PBr (1:170) with isopropanol under H2
Measurement
We plan to measure the Ru K-edge XANES spectrum of this sample.
Questions
Based on all the information above:
1. Based on the reaction conditions (IPA, 30 bar H2, 200 °C), identify the expected Ru phases and estimate their relative fractions in the sample.
2. What reference spectra or pure components would be necessary to properly model the XANES data for this catalytic system using linear combination fitting or MCR-ALS?
3. Explain the physical reasoning for the formation of the observed phase composition under these specific conditions (IPA, 30 bar H2, 200 °C) compared to conditions where CO is present.
Ground Truth
Material: RuBr3 in Bu4PBr
Measurement: Ru K-edge, in situ fluorescence mode, SAMBA beamline
Fit method: MCR-ALS
Phase fractions: (±15%)
| Phase | Fraction |
|---|---|
| RuBrx | 0.4 |
| Metallic Ru | 0.6 |
Fit basis (paper's reference spectra):
- RuBrx
- [RuBr2(CO)3]2
- Metallic Ru
Source evidence: Figure 7b and 7c, step 14, page 10256
Key reasoning: In the presence of isopropanol (IPA, acting as a propene precursor) and H2 gas at 200 °C, the RuBrx species are reduced to small metallic Ru clusters. Without a CO source to stabilize the Ru carbonyl complex, the reducing environment drives the formation of Ru(0).
Reasoning source: Page 10257, Section: In situ evolution of Ru-species under reaction conditions
Scoring Rubric (total: 100 pts)
| Q | Type | Max | Question | Reference Answer | Scoring Criteria |
|---|---|---|---|---|---|
| q1 | quantification | 40 | Based on the reaction conditions (IPA, 30 bar H2, 200 °C), identify the expected Ru phases and estimate their relative fractions in the sample. | Under the specified reaction conditions of 200 °C and 30 bar H2 with isopropanol, the expected Ru phases are Metallic Ru and RuBrx. The estimated relative fractions are 0.6 (60%) Metallic Ru and 0.4 (40%) RuBrx, with an uncertainty of 15%. These specific fractions result from the highly reducing environment provided by the 30 bar H2 gas and isopropanol (acting as a propene precursor) at 200 °C. Because there is no CO source present to stabilize intermediate Ru carbonyl complexes, the initial RuBr3 is driven to reduce directly into small metallic Ru(0) clusters, leaving a 40% fraction of unreduced RuBrx. | Full points for identifying Metallic Ru (~60%) and RuBrx (~40%). Partial points for identifying the correct phases without accurate fractions, or if the fractions are within the 15% uncertainty margin. |
| q2 | identification | 30 | What reference spectra or pure components would be necessary to properly model the XANES data for this catalytic system using linear combination fitting or MCR-ALS? | To properly model the XANES data using MCR-ALS, the necessary pure components are RuBrx, [RuBr2(CO)3]2, and Metallic Ru. These specific reference spectra are required to capture the evolution of the RuBr3 precursor under the applied reaction conditions. Specifically, the 30 bar H2 and isopropanol at 200 °C create a reducing environment that drives the formation of metallic Ru(0) clusters from the RuBrx species. The [RuBr2(CO)3]2 reference must be included in the basis set to account for the system's behavior, as its absence in the final phase composition confirms that without a CO source, the Ru carbonyl complex cannot be stabilized. | Full points for listing the three key components: a RuBrx species (or dissolved RuBr3), a Ru carbonyl species (like [RuBr2(CO)3]2), and metallic Ru. |
| q3 | reasoning | 30 | Explain the physical reasoning for the formation of the observed phase composition under these specific conditions (IPA, 30 bar H2, 200 °C) compared to conditions where CO is present. | Under the conditions of 30 bar H2 and isopropanol at 200 °C, the sample forms a composition of 60% Metallic Ru and 40% RuBrx. This occurs because isopropanol acts as a propene precursor and, combined with the high-pressure H2 gas, creates a strongly reducing environment that reduces the RuBrx species into small metallic Ru clusters. If a CO source were present, it would stabilize the Ru carbonyl complex, such as [RuBr2(CO)3]2. However, without CO to stabilize these intermediates, the reducing environment strictly drives the formation of Ru(0), explaining the observed phase composition. | Full points for explaining that the combination of H2 gas and IPA at high temperature without CO leads to the reduction of RuBrx species into metallic Ru clusters, as there are no CO ligands to stabilize the active carbonyl complex. |
Review
#1062
RuBr3 in Bu4PBr
Ru K-edge
▶
LLM Prompt
Sample Information
Material: RuBr3 in Bu4PBr
Reaction Conditions: IPA, Formaldehyde, 30 bar H2, 200 °C
Sample-Specific Conditions
- Additive: Formaldehyde
- RuBr3 in Bu4PBr (1:170) with isopropanol and formaldehyde under H2
Measurement
We plan to measure the Ru K-edge XANES spectrum of this sample.
Questions
Based on all the information above:
1. Based on the reaction conditions (RuBr3 in Bu4PBr with isopropanol and formaldehyde under 30 bar H2 at 200 °C, following a step without formaldehyde), what are the expected Ru phases present in the sample, and what are their approximate fractions?
2. What reference spectra or basis components are required to properly fit the in-situ XANES data for this sample?
Ground Truth
Material: RuBr3 in Bu4PBr with isopropanol and formaldehyde
Measurement: Ru K-edge in-situ fluorescence mode at SAMBA beamline
Fit method: MCR-ALS
Phase fractions: (±15%)
| Phase | Fraction |
|---|---|
| RuBrx | 0.1 |
| [RuBr2(CO)3]2 | 0.3 |
| Metallic Ru | 0.6 |
Fit basis (paper's reference spectra):
- RuBrx
- [RuBr2(CO)3]2
- Metallic Ru
Source evidence: Figure 7b and 7c, step 15, page 10256-10257
Key reasoning: In the presence of isopropanol (as a propene precursor) and H2 gas, RuBrx species are partially reduced to small metallic Ru clusters. When formaldehyde is subsequently added as a CO source, the remaining RuBrx is converted back to a Ru carbonyl species ([RuBr2(CO)3]2). However, the metallic Ru(0) species formed in the previous step cannot be converted back, so its contribution remains constant.
Reasoning source: Section 'In situ evolution of Ru-species under reaction conditions', page 10257
Scoring Rubric (total: 100 pts)
| Q | Type | Max | Question | Reference Answer | Scoring Criteria |
|---|---|---|---|---|---|
| q1 | quantification | 67 | Based on the reaction conditions (RuBr3 in Bu4PBr with isopropanol and formaldehyde under 30 bar H2 at 200 °C, following a step without formaldehyde), what are the expected Ru phases present in the sample, and what are their approximate fractions? | The expected Ru phases in the sample are Metallic Ru (0.6), [RuBr2(CO)3]2 (0.3), and RuBrx (0.1), with an estimated uncertainty of 15%. These specific fractions result from the sequential reaction conditions applied to the RuBr3 in Bu4PBr mixture. Initially, the presence of isopropanol and 30 bar H2 at 200 °C partially reduces the RuBrx species into small metallic Ru clusters, accounting for the dominant 60% fraction. When formaldehyde is subsequently added as a CO source, it converts the remaining RuBrx into the Ru carbonyl species [RuBr2(CO)3]2. Because the metallic Ru(0) formed in the previous step cannot be converted back, its contribution remains constant, leaving the remaining 40% distributed between the newly formed carbonyl complex and residual RuBrx. | Full points for identifying Metallic Ru (~60%), [RuBr2(CO)3]2 (~30%), and RuBrx (~10%). Partial points for identifying the correct phases without accurate fractions, or missing one of the minor phases. |
| q2 | identification | 33 | What reference spectra or basis components are required to properly fit the in-situ XANES data for this sample? | To properly fit the in-situ Ru K-edge XANES data using MCR-ALS, the required basis components are RuBrx, [RuBr2(CO)3]2, and Metallic Ru. These specific reference spectra are necessary because the reaction conditions induce a multi-phase chemical transformation of the RuBr3 in Bu4PBr precursor. Under 30 bar H2 and 200 °C, isopropanol acts as a propene precursor and partially reduces the RuBrx species into small metallic Ru clusters. The subsequent addition of formaldehyde provides a CO source that converts the remaining RuBrx into the [RuBr2(CO)3]2 carbonyl complex. Since the metallic Ru(0) cannot be converted back by the formaldehyde, all three species coexist in the final mixture and must be included as basis components to accurately model the data. | Full points for listing RuBrx (or RuBr3 in IL), [RuBr2(CO)3]2 (Ru carbonyl), and Metallic Ru (Ru foil/clusters). |
Review
#1063
[RuBr2(CO)3]2 in Bu4PBr
Ru K-edge
▶
LLM Prompt
Sample Information
Material: [RuBr2(CO)3]2 in Bu4PBr
Reaction Conditions: IPA, 30 bar H2, 200 °C
Sample-Specific Conditions
- Precursor: [RuBr2(CO)3]2
- [RuBr2(CO)3]2 in Bu4PBr (1:170) with isopropanol under H2
Measurement
We plan to measure the Ru K-edge XANES spectrum of this sample.
Questions
Based on all the information above:
1. Based on the reaction conditions (IPA, 30 bar H2, 200 °C) and the use of [RuBr2(CO)3]2 as the precursor, what are the expected Ru phases present in the system and their approximate fractions?
2. What reference spectra or basis functions are necessary to model the in-situ XANES data for this catalytic system using linear combination fitting or MCR-ALS?
Ground Truth
Material: [RuBr2(CO)3]2 in Bu4PBr
Measurement: Ru K-edge, in-situ fluorescence mode, SAMBA beamline
Fit method: MCR-ALS
Phase fractions: (±15%)
| Phase | Fraction |
|---|---|
| RuBrx | 0.3 |
| [RuBr2(CO)3]2 | 0.7 |
Fit basis (paper's reference spectra):
- RuBrx
- [RuBr2(CO)3]2
- Metallic Ru
Source evidence: Figure 7b, step 16, page 10256
Key reasoning: When [RuBr2(CO)3]2 is used as a precursor in the presence of isopropanol (IPA) and 30 bar H2 at 200 °C, slight decarbonylation is observed over a large timeframe of ca. 2.5 h, leading to the formation of some RuBrx species. However, unlike the RuBr3 precursor which reduces to metallic Ru clusters under similar conditions, the pre-formed carbonyl complex is more stable against reduction to Ru(0).
Reasoning source: Page 10257, 'In situ evolution of Ru-species under reaction conditions' section
Scoring Rubric (total: 100 pts)
| Q | Type | Max | Question | Reference Answer | Scoring Criteria |
|---|---|---|---|---|---|
| q1 | quantification | 57 | Based on the reaction conditions (IPA, 30 bar H2, 200 °C) and the use of [RuBr2(CO)3]2 as the precursor, what are the expected Ru phases present in the system and their approximate fractions? | The expected Ru phases present in the system are the unreacted [RuBr2(CO)3]2 precursor at a fraction of 0.7 and a newly formed RuBrx species at a fraction of 0.3, with an uncertainty of 15%. These specific fractions result from the inherent stability of the pre-formed carbonyl complex under the reaction conditions of isopropanol, 30 bar H2, and 200 °C. Over a timeframe of approximately 2.5 hours, the [RuBr2(CO)3]2 precursor undergoes only slight decarbonylation to form the 30% RuBrx fraction. Unlike other precursors (such as RuBr3) that fully reduce to metallic Ru clusters under these conditions, the [RuBr2(CO)3]2 complex is highly stable against complete reduction to Ru(0), leaving 70% of the initial precursor intact. | Full points for identifying [RuBr2(CO)3]2 (or Ru carbonyl) as the major phase (~70%) and RuBrx as the minor phase (~30%). Deduct points if metallic Ru is predicted to be present in significant amounts. |
| q2 | identification | 43 | What reference spectra or basis functions are necessary to model the in-situ XANES data for this catalytic system using linear combination fitting or MCR-ALS? | To model the in-situ Ru K-edge XANES data using MCR-ALS, the necessary basis functions are [RuBr2(CO)3]2, RuBrx, and Metallic Ru. These specific reference phases are required because of how the [RuBr2(CO)3]2 precursor behaves in the presence of isopropanol and 30 bar H2 at 200 °C. Under these conditions, the pre-formed carbonyl complex undergoes slight decarbonylation over about 2.5 hours, necessitating the RuBrx basis to capture this newly formed species alongside the stable, unreacted [RuBr2(CO)3]2 precursor. Additionally, while the carbonyl complex is largely stable against reduction to Ru(0) compared to precursors like RuBr3, the Metallic Ru basis is included in the model to account for any potential reduction pathways to metallic Ru clusters under the high-pressure H2 environment. | Full points for listing RuBrx (or RuBr3 in IL), a Ru carbonyl complex (like [RuBr2(CO)3]2), and metallic Ru (Ru foil) as the necessary basis components. |
Review
Dual ligand approach increases functional group tolerance in the Pd-catalysed C–H arylation of N -heterocyclic pharmaceuticals
ESRF-BM23
Catalyst
Igor Beckers, Aram Bugaev, Dirk De Vos
DOI: 10.1039/d2sc04911b
3 scenarios
▶
#1064
Pd2dba3 + triphenylphosphine (L1) + 2-hydroxypyridine (L13)
Pd K-edge
▶
LLM Prompt
Sample Information
Material: Pd2dba3 + triphenylphosphine (L1) + 2-hydroxypyridine (L13)
Support: DMA solvent
Reaction Conditions: room temperature, DMA solvent
Sample-Specific Conditions
- Ligands: L1 + L13
- In situ EXAFS of Pd catalyst with triphenylphosphine and 2-hydroxypyridine ligands at room temperature
Measurement
We plan to measure the Pd K-edge XANES spectrum of this sample.
Questions
Based on all the information above:
1. Based on the provided sample conditions (Pd2dba3 mixed with triphenylphosphine and 2-hydroxypyridine at room temperature), what is the expected dominant Pd species in solution, and what structural features would confirm its formation?
2. What specific scattering paths or reference components are necessary to model the local coordination environment of this catalyst at room temperature?
Ground Truth
Material: Pd2dba3 + triphenylphosphine (L1) + 2-hydroxypyridine (L13)
Measurement: Pd K-edge in situ EXAFS at European Synchrotron Radiation Facility (ESRF)
Fit method: EXAFS fitting
Phase fractions: (±10%)
| Phase | Fraction |
|---|---|
| Pd(PPh3)(2-hydroxypyridine) complex | 1.0 |
Fit basis (paper's reference spectra):
- Pd-N scattering path
- Pd-P scattering path
Source evidence: Scheme 3, page 5
Key reasoning: In situ EXAFS monitoring at room temperature revealed the appearance of Pd-N and Pd-P contributions at distances of approximately 2.1 and 2.3 Å respectively. This confirms that the dual ligated species is formed at room temperature prior to oxidative addition.
Reasoning source: Page 4, 'Spectroscopic study of the catalyst speciation via XAS'
Scoring Rubric (total: 100 pts)
| Q | Type | Max | Question | Reference Answer | Scoring Criteria |
|---|---|---|---|---|---|
| q1 | reasoning | 57 | Based on the provided sample conditions (Pd2dba3 mixed with triphenylphosphine and 2-hydroxypyridine at room temperature), what is the expected dominant Pd species in solution, and what structural features would confirm its formation? | The expected dominant species in solution is a 100% fraction of the dual ligated Pd(PPh3)(2-hydroxypyridine) complex. Because the Pd2dba3 precursor is mixed with both triphenylphosphine (L1) and 2-hydroxypyridine (L13) ligands in DMA solvent at room temperature, the Pd center coordinates with both ligands to form this species prior to any oxidative addition. The formation of this complex is structurally confirmed by the appearance of distinct Pd-N and Pd-P scattering contributions at distances of approximately 2.1 Å and 2.3 Å, respectively, along with a complete absence of Pd-Br scattering at this temperature. | Full credit if the answer identifies the formation of a dual-ligated Pd complex with both phosphine and 2-hydroxypyridine ligands, and mentions the expected Pd-N and Pd-P coordination distances (approx. 2.1 and 2.3 Å). |
| q2 | identification | 43 | What specific scattering paths or reference components are necessary to model the local coordination environment of this catalyst at room temperature? | The local coordination environment of this catalyst must be modeled using Pd-N and Pd-P scattering paths. Because the sample is prepared by mixing Pd2dba3 with triphenylphosphine and 2-hydroxypyridine at room temperature, the Pd center coordinates with both ligands to form a dual ligated Pd(PPh3)(2-hydroxypyridine) complex. Therefore, the EXAFS fitting basis requires a Pd-N path (at ~2.1 Å) corresponding to the 2-hydroxypyridine ligand and a Pd-P path (at ~2.3 Å) corresponding to the triphenylphosphine ligand. A Pd-Br path is excluded from the model because oxidative addition with an aryl bromide only occurs upon heating, not at the specified room temperature conditions. | Full credit if the answer specifies Pd-N and Pd-P scattering paths. |
Review
#1065
Pd2dba3 + SPhos (L19) + 2-hydroxypyridine (L13)
Pd K-edge
▶
LLM Prompt
Sample Information
Material: Pd2dba3 + SPhos (L19) + 2-hydroxypyridine (L13)
Support: DMA solvent
Reaction Conditions: room temperature, DMA solvent
Sample-Specific Conditions
- Ligands: L19 + L13
- In situ EXAFS of Pd catalyst with SPhos and 2-hydroxypyridine ligands at room temperature
Measurement
We plan to measure the Pd K-edge XANES spectrum of this sample.
Questions
Based on all the information above:
1. Based on the provided sample conditions (Pd2dba3 mixed with SPhos and 2-hydroxypyridine at room temperature), what is the expected dominant Pd species in solution, and what key coordination features would be observed in its X-ray absorption spectrum?
2. What specific scattering paths and approximate bond distances would be required to model the local coordination environment of this Pd complex at room temperature?
Ground Truth
Material: Pd2dba3 + SPhos (L19) + 2-hydroxypyridine (L13)
Measurement: Pd K-edge EXAFS, in situ, European Synchrotron Radiation Facility
Fit method: EXAFS fitting
Phase fractions: (±10%)
| Phase | Fraction |
|---|---|
| Pd(SPhos)(2-hydroxypyridine) complex | 1.0 |
Fit basis (paper's reference spectra):
- Pd-N scattering path
- Pd-P scattering path
Source evidence: Scheme 3 and Page 4, 'Spectroscopic study of the catalyst speciation via XAS'
Key reasoning: In situ EXAFS at room temperature reveals the appearance of Pd-N and Pd-P contributions at distances of approximately 2.1 and 2.3 Å, respectively, confirming the formation of the dual ligated species. Upon heating to 90 °C with an aryl bromide, a Pd-Br contribution emerges due to oxidative addition, while Pd-P and Pd-N peaks remain, indicating the ligands are not displaced.
Reasoning source: Page 4, 'Spectroscopic study of the catalyst speciation via XAS'
Scoring Rubric (total: 100 pts)
| Q | Type | Max | Question | Reference Answer | Scoring Criteria |
|---|---|---|---|---|---|
| q1 | identification | 57 | Based on the provided sample conditions (Pd2dba3 mixed with SPhos and 2-hydroxypyridine at room temperature), what is the expected dominant Pd species in solution, and what key coordination features would be observed in its X-ray absorption spectrum? | The expected dominant species is a Pd(SPhos)(2-hydroxypyridine) complex, which accounts for a fraction of 1.0 (100%) of the Pd speciation. The X-ray absorption spectrum (specifically EXAFS in R-space) will exhibit distinct peaks corresponding to Pd-N and Pd-P coordination spheres. This dual-ligated species forms because mixing the Pd2dba3 precursor with both SPhos (L19) and 2-hydroxypyridine (L13) ligands in DMA solvent at room temperature leads to the successful coordination of both ligands to the Pd center. Consequently, the in situ EXAFS data reveals the simultaneous appearance of Pd-N and Pd-P scattering contributions, confirming the formation of this specific complex under these ambient conditions. | Must identify the formation of a dual-ligated Pd complex containing both SPhos and 2-hydroxypyridine. Must mention the presence of both Pd-P and Pd-N coordination (or scattering paths) at room temperature. |
| q2 | identification | 43 | What specific scattering paths and approximate bond distances would be required to model the local coordination environment of this Pd complex at room temperature? | To model the local coordination environment of this complex, the EXAFS fitting basis must include a Pd-N scattering path and a Pd-P scattering path. The approximate bond distances required for these paths are 2.1 Å for Pd-N and 2.3 Å for Pd-P. These specific scattering paths are required because the sample conditions involve reacting Pd2dba3 with both SPhos and 2-hydroxypyridine at room temperature. This mixture results in the formation of a dual-ligated Pd(SPhos)(2-hydroxypyridine) complex, directly placing both nitrogen and phosphorus atoms in the primary coordination sphere of the palladium center and producing these distinct structural features in the EXAFS spectrum. | Must identify Pd-N and Pd-P scattering paths and mention their approximate distances (2.1 Å and 2.3 Å, respectively). |
Review
#1066
Pd2dba3 + SPhos (L19) + 2-hydroxypyridine (L13) + 4-bromothioanisole
Pd K-edge
▶
LLM Prompt
Sample Information
Material: Pd2dba3 + SPhos (L19) + 2-hydroxypyridine (L13) + 4-bromothioanisole
Support: DMA solvent
Reaction Conditions: 90 °C, DMA solvent
Sample-Specific Conditions
- Reaction state: Oxidative addition
- In situ EXAFS of Pd catalyst with SPhos, 2-hydroxypyridine, and 4-bromothioanisole at 90 °C
Measurement
We plan to measure the Pd K-edge XANES spectrum of this sample.
Questions
Based on all the information above:
1. Based on the reaction conditions (90 °C, presence of 4-bromothioanisole), what is the dominant Pd species observed in the in situ XAS, and what physical reasoning explains its formation?
2. What specific scattering pathways (coordination environment) are expected to be present in the EXAFS region for this catalyst state, and what does their simultaneous presence indicate about the ligand stability?
Ground Truth
Material: Pd2dba3 + SPhos (L19) + 2-hydroxypyridine (L13) + 4-bromothioanisole
Measurement: Pd K-edge in situ EXAFS, European Synchrotron Radiation Facility
Fit method: EXAFS scattering pathway analysis
Phase fractions: (±10%)
| Phase | Fraction |
|---|---|
| Pd(SPhos)(2-hydroxypyridine)(Ar)(Br) oxidative addition complex | 1.0 |
Fit basis (paper's reference spectra):
- Theoretical EXAFS scattering paths (Pd-N, Pd-P, Pd-Br)
Source evidence: Page 4, 'Spectroscopic study of the catalyst speciation via XAS' and Page 5, Scheme 3(d)
Key reasoning: Upon heating the sample with SPhos, 2-hydroxypyridine, and 4-bromothioanisole to 90 °C, a Pd-Br contribution emerges in the EXAFS spectrum, showing that oxidative addition is occurring. Both the Pd-P and Pd-N peaks remain present under these conditions. This means that these ligands were not replaced by unwanted coordination of the reactant, confirming the formation of the dual-ligated oxidative addition complex.
Reasoning source: Page 4, 'Spectroscopic study of the catalyst speciation via XAS'
Scoring Rubric (total: 100 pts)
| Q | Type | Max | Question | Reference Answer | Scoring Criteria |
|---|---|---|---|---|---|
| q1 | reasoning | 57 | Based on the reaction conditions (90 °C, presence of 4-bromothioanisole), what is the dominant Pd species observed in the in situ XAS, and what physical reasoning explains its formation? | The dominant Pd species observed is the Pd(SPhos)(2-hydroxypyridine)(Ar)(Br) oxidative addition complex, which accounts for a fraction of 1.0. Upon heating the sample containing Pd2dba3, SPhos, 2-hydroxypyridine, and 4-bromothioanisole in DMA solvent to 90 °C, the catalyst undergoes oxidative addition with the aryl bromide reactant. This reaction mechanism is confirmed by the emergence of a Pd-Br contribution in the EXAFS spectrum. Furthermore, the retention of both Pd-P and Pd-N scattering paths indicates that the SPhos and 2-hydroxypyridine ligands are not displaced by unwanted reactant coordination, resulting in the stable dual-ligated oxidative addition complex. | Full credit for identifying the dual-ligated oxidative addition complex and explaining that heating to 90 °C triggers oxidative addition of the aryl bromide while the SPhos and 2-hydroxypyridine ligands remain coordinated. |
| q2 | spectral | 43 | What specific scattering pathways (coordination environment) are expected to be present in the EXAFS region for this catalyst state, and what does their simultaneous presence indicate about the ligand stability? | The EXAFS Fourier transform (R-space) is expected to show distinct scattering contributions for Pd-N at approximately 2.1 Å, Pd-P at approximately 2.3 Å, and an additional Pd-Br peak. These specific features arise because heating the mixture of Pd, SPhos, 2-hydroxypyridine, and 4-bromothioanisole to 90 °C triggers an oxidative addition reaction, introducing the Pd-Br bond. The simultaneous presence of the Pd-N and Pd-P paths alongside the new Pd-Br path demonstrates that the dual-ligand coordination sphere remains intact under these reaction conditions. This confirms excellent ligand stability, as it proves the SPhos and 2-hydroxypyridine ligands were not replaced by unwanted coordination from the reactant during the high-temperature oxidative addition step. | Full credit for mentioning Pd-N (~2.1 Å), Pd-P (~2.3 Å), and Pd-Br scattering paths, and noting that their simultaneous presence indicates the ligands were not replaced by unwanted reactant coordination. |
Review
EXAFS evidence for the spin–phonon coupling in the monoclinic PrNiO 3 nickelate perovskite
ESRF-BM23
Pure Phase
J. E. Rodrigues et al.
DOI: 10.1039/d2tc03063b
1 scenario
▶
#1067
PrNiO3
Ni K
▶
LLM Prompt
Sample Information
Material: PrNiO3
Crystal Structure: Monoclinic (P21/n) below ~130 K, Orthorhombic (Pbnm) above ~130 K
Oxidation State: Ni3+
Sample Form: pellet
Measurement Mode: transmission
- PrNiO3 nickelate perovskite measured across the insulator-metal and structural phase transition temperatures (10-300 K).
Measurement
We plan to measure the Ni K XANES spectrum of this sample.
Questions
Based on all the information above:
1. Based on the provided sample conditions (PrNiO3 measured across 10-300 K), what structural and electronic phenomena are expected to be observed in the local Ni environment at low temperatures (e.g., 10 K) and how does this manifest in the Ni-O bond distances?
2. Describe the expected features in the EXAFS Fourier transform modulus |χ(R)| for this PrNiO3 sample, specifically identifying the atomic pair-units responsible for the peaks up to ~5.5 Å.
3. What specific anomalous behavior in the EXAFS structural parameters is expected below the transition temperature (~130 K), and what physical phenomenon does this indicate?
Ground Truth
Compound: PrNiO3
Oxidation state: Ni3+
Measurement: Ni K-edge, transmission mode, beamline BM23 at ESRF
Edge position: 8333
Spectral shape: The EXAFS Fourier transform modulus |χ(R)| shows a main first peak at ~2 Å corresponding to Ni-O bonds, a broad peak at 3.2-3.4 Å ascribed to Ni-Pr pair-units, and peaks at 3.9 Å and 5.4 Å for Ni-Ni pair-units.
Distinguishing features: An anomalous departure of the Ni-O bond Debye-Waller factors (σ^2) from the expected Einstein model behavior below the structural/magnetic transition temperature at ~130 K.
Key reasoning: The EXAFS data at 10 K was modeled starting from the monoclinic phase (P21/n) to account for charge disproportionation between two Ni octahedra (Ni^(3+δ) and Ni^(3-δ)), yielding two sets of averaged Ni-O distances (1.911 Å and 1.962 Å). The anomalous temperature evolution of the Debye-Waller factors for the Ni-O bonds below ~130 K indicates strong spin-phonon coupling and softening of lattice vibrations.
Reasoning source: Results and discussion section, Evaluation of bond disorder and vibrational properties
Scoring Rubric (total: 100 pts)
| Q | Type | Max | Question | Reference Answer | Scoring Criteria |
|---|---|---|---|---|---|
| q1 | reasoning | 35 | Based on the provided sample conditions (PrNiO3 measured across 10-300 K), what structural and electronic phenomena are expected to be observed in the local Ni environment at low temperatures (e.g., 10 K) and how does this manifest in the Ni-O bond distances? | At low temperatures (e.g., 10 K), the PrNiO3 sample is in its monoclinic (P21/n) phase, which induces charge disproportionation between two distinct Ni octahedra. This electronic phenomenon results in the splitting of the nominal Ni3+ state into Ni^(3+δ) and Ni^(3-δ) sites. Consequently, this manifests structurally as two distinct sets of averaged Ni-O bond distances, specifically at 1.911 Å and 1.962 Å. These specific distances arise because the temperature-driven transition below ~130 K into the monoclinic structure forces the charge disproportionation, which directly alters the local ionic radii and bonding environment of the nickel atoms. | Full points for identifying the monoclinic phase (P21/n), the presence of charge disproportionation (Ni^(3+δ) and Ni^(3-δ)), and the resulting two distinct sets of averaged Ni-O distances (e.g., ~1.91 Å and ~1.96 Å). |
| q2 | spectral | 35 | Describe the expected features in the EXAFS Fourier transform modulus |χ(R)| for this PrNiO3 sample, specifically identifying the atomic pair-units responsible for the peaks up to ~5.5 Å. | The EXAFS Fourier transform modulus |χ(R)| for this sample is expected to exhibit a main first peak at ~2 Å corresponding to the nearest-neighbor Ni-O bonds. At higher distances, a broad peak between 3.2-3.4 Å is ascribed to Ni-Pr pair-units, while peaks at 3.9 Å and 5.4 Å correspond to Ni-Ni pair-units. These specific spectral features arise directly from the perovskite crystal structure of PrNiO3, where the central Ni absorbing atom is surrounded by an oxygen octahedron, followed by heavier Pr atoms and adjacent Ni atoms in the extended lattice. Furthermore, the structural phase transition from orthorhombic to monoclinic below 130 K dictates the exact distribution of these scattering paths, particularly the splitting of the first Ni-O coordination shell. | Full points for correctly identifying the main first peak at ~2 Å (Ni-O), the broad peak at 3.2-3.4 Å (Ni-Pr), and the longer-range peaks at 3.9 Å and 5.4 Å (Ni-Ni). |
| q3 | reasoning | 30 | What specific anomalous behavior in the EXAFS structural parameters is expected below the transition temperature (~130 K), and what physical phenomenon does this indicate? | Below the structural and insulator-metal transition temperature of ~130 K, the EXAFS data will show an anomalous departure of the Ni-O bond Debye-Waller factors (σ^2) from the expected Einstein model behavior. This anomalous temperature evolution indicates strong spin-phonon coupling and the softening of lattice vibrations within the material. This behavior occurs because cooling the PrNiO3 sample below 130 K triggers a transition into the monoclinic (P21/n) phase, which is accompanied by charge disproportionation and magnetic ordering. The interplay between these emerging electronic/magnetic states and the lattice structure in this low-temperature regime directly drives the observed vibrational softening and spin-phonon coupling. | Full points for mentioning the anomalous departure of the Debye-Waller factors (σ^2) for the Ni-O bonds from the Einstein model, and attributing this to strong spin-phonon coupling / softening of lattice vibrations. |
Review
Synergistic inhibition of green rust crystallization by co-existing arsenic and silica
ESRF-BM23
Synthesis
Jeffrey Paulo H. Perez, Dominique J. Tobler, Liane G. Benning
DOI: 10.1039/d3em00458a
2 scenarios
▶
#1068
As(III) and Si-bearing green rust sulfate
As K-edge
▶
LLM Prompt
Sample Information
Material: As(III) and Si-bearing green rust sulfate
Method: precipitation
Precursors: ferrihydrite, As(III), Si, FeIISO4
Duration Hours: 168
Atmosphere: 97% N2, 3% H2
Sample-Specific Conditions
- Initial As species: As(III)
- Solid collected after 168 h of Fe2+-induced transformation of As(III) and Si-bearing ferrihydrite
Preparation
- Two-line ferrihydrite (FHY) was synthesized by co-precipitation of 0.2 M Fe2(SO4)3 with 1 M NaOH at pH ~7. FHY was resuspended in 0.1 M NaCl, spiked with 0.1 mM As(III) and 1 mM Si, pH adjusted to 8, and stirred for 24 h. Transformation was initiated by adding FeIISO4 (Fe2+/Fe(III) ratio of 3) at pH 8.0 under anoxic conditions. The solid was collected after 168 h.
Measurement
We plan to measure the As K-edge XANES spectrum of this sample.
Questions
Based on all the information above:
1. Based on the synthesis conditions, what is the expected oxidation state of arsenic in the resulting solid, and what is the physical reasoning?
2. What is the expected energy position of the XANES absorption maximum for this sample?
3. What reference spectra would be most appropriate to compare with this sample's XANES spectrum to confirm the local bonding and oxidation state of As?
4. What spectral feature would distinguish this sample from one where the initial As(III) had been oxidized to As(V)?
Ground Truth
Material: As(III) and Si-bearing green rust sulfate
Measurement: As K-edge XAS, transmission and fluorescence mode, beamline BM23 at ESRF
Fit method: Peak position comparison (no LCF reported for XANES)
Phase fractions:
| Phase | Fraction |
|---|---|
| As(III) | 1.0 |
Fit basis (paper's reference spectra):
- As(III) adsorbed onto FHY
- As(III) adsorbed onto GRSO4
Source evidence: Section 3.3, Fig. 4a, page 12-13
Key reasoning: The XANES absorption maximum of the solid from the As(III)+Si-FHY system was centered around 11,871 eV, matching reference spectra for As(III) adsorbed onto freshly-precipitated GRSO4 and ferrihydrite. This demonstrates that no changes in As oxidation occurred during the probed reactions, as green rust cannot oxidize As(III) on its own under these conditions.
Reasoning source: Section 3.3, page 12
Scoring Rubric (total: 100 pts)
| Q | Type | Max | Question | Reference Answer | Scoring Criteria |
|---|---|---|---|---|---|
| q1 | reasoning | 30 | Based on the synthesis conditions, what is the expected oxidation state of arsenic in the resulting solid, and what is the physical reasoning? | The expected oxidation state of arsenic in the resulting solid is As(III), representing a fraction of 1.0. The synthesis begins with As(III) spiked into ferrihydrite, which is then transformed using FeIISO4 under strictly anoxic conditions (97% N2, 3% H2). Because green rust sulfate cannot oxidize As(III) on its own under these specific conditions, no changes in the arsenic oxidation state occur during the 168-hour reaction. Consequently, the arsenic remains entirely as As(III) adsorbed onto the resulting green rust sulfate and any remaining ferrihydrite. | Correctly identifies the oxidation state as As(III) and explains that green rust does not oxidize As(III) under these anoxic conditions, meaning no redox changes occur during the transformation. |
| q2 | spectral | 20 | What is the expected energy position of the XANES absorption maximum for this sample? | The expected energy position of the XANES absorption maximum (white line) for this sample is centered around 11,871 eV. This specific energy position is characteristic of As(III) species. Because the sample was prepared by reacting As(III)-bearing ferrihydrite with FeIISO4 under anoxic conditions, the green rust sulfate that forms cannot oxidize the As(III). As a result, the arsenic remains in the +3 oxidation state, producing the strong absorption maximum at 11,871 eV that matches reference spectra for As(III) adsorbed onto green rust sulfate. | Correctly states that the absorption maximum is centered around 11,871 eV. |
| q3 | identification | 25 | What reference spectra would be most appropriate to compare with this sample's XANES spectrum to confirm the local bonding and oxidation state of As? | The most appropriate reference spectra for comparison are As(III) adsorbed onto freshly-precipitated green rust sulfate (GRSO4) and As(III) adsorbed onto ferrihydrite (FHY). The sample was synthesized by spiking ferrihydrite with As(III) and Si, followed by a 168-hour Fe2+-induced transformation into green rust sulfate under anoxic conditions. Because green rust cannot oxidize As(III) under these conditions, the arsenic remains in its initial +3 oxidation state. Therefore, comparing the sample to these specific As(III)-adsorbed FHY and GRSO4 references will confirm that the absorption maximum at 11,871 eV matches the expected local bonding and unchanged oxidation state of the final solid. | Mentions As(III) adsorbed onto green rust sulfate (GRSO4) and/or As(III) adsorbed onto ferrihydrite (FHY). |
| q4 | spectral | 25 | What spectral feature would distinguish this sample from one where the initial As(III) had been oxidized to As(V)? | The distinguishing spectral feature is the energy position of the absorption maximum, which is located at 11,871 eV for this sample, whereas oxidized As(V) species would show an absorption maximum shifted to a higher energy of 11,875 eV. In this sample, the initial As(III) is reacted with FeIISO4 under anoxic conditions (97% N2, 3% H2) to form green rust sulfate. Because green rust cannot oxidize As(III) on its own under these conditions, the arsenic remains entirely as As(III), yielding the characteristic 11,871 eV peak. If oxidation to As(V) had occurred, the change in the electronic structure and oxidation state would shift the white line peak up by 4 eV to 11,875 eV. | Explains that the absorption maximum for As(III) is at 11,871 eV, whereas As(V) would show an absorption maximum shifted to a higher energy of approximately 11,875 eV. |
Review
#1069
As(V) and Si-bearing green rust sulfate
As K-edge
▶
LLM Prompt
Sample Information
Material: As(V) and Si-bearing green rust sulfate
Method: precipitation
Precursors: ferrihydrite, As(V), Si, FeIISO4
Duration Hours: 168
Atmosphere: 97% N2, 3% H2
Sample-Specific Conditions
- Initial As species: As(V)
- Solid collected after 168 h of Fe2+-induced transformation of As(V) and Si-bearing ferrihydrite
Preparation
- Two-line ferrihydrite (FHY) was synthesized by co-precipitation of 0.2 M Fe2(SO4)3 with 1 M NaOH at pH ~7. FHY was resuspended in 0.1 M NaCl, spiked with 0.1 mM As(V) and 1 mM Si, pH adjusted to 8, and stirred for 24 h. Transformation was initiated by adding FeIISO4 (Fe2+/Fe(III) ratio of 3) at pH 8.0 under anoxic conditions. The solid was collected after 168 h.
Measurement
We plan to measure the As K-edge XANES spectrum of this sample.
Questions
Based on all the information above:
1. What is the expected oxidation state of arsenic in this sample after 168 h of reaction, and what is the physical reasoning for this?
2. Describe the expected spectral shape and the position of the absorption maximum for the As K-edge XANES spectrum of this sample.
3. What distinguishing spectral feature in the XANES data would confirm that the arsenic in this sample has not been reduced to As(III)?
4. What reference spectra would be most appropriate to compare against the XANES spectrum of this sample to confirm the local bonding environment and oxidation state?
Ground Truth
Material: As(V) and Si-bearing green rust sulfate
Measurement: As K-edge XANES in transmission and fluorescence mode at beamline BM23 (ESRF)
Fit method: Peak position comparison
Phase fractions:
| Phase | Fraction |
|---|---|
| As(V) | 1.0 |
Fit basis (paper's reference spectra):
- As(V) adsorbed onto freshly-precipitated GRSO4
- As(V) adsorbed onto ferrihydrite
Source evidence: Section 3.3, Figure 4a, page 15
Key reasoning: The XANES absorption maximum of the solid from the As(V)+Si-FHY system was centered around 11,875 eV, matching the reference spectra for As(V) adsorbed onto freshly-precipitated GRSO4 and ferrihydrite. This demonstrates that no changes in As oxidation occurred during the probed reactions, indicating that green rust cannot reduce As(V) on its own under these conditions.
Reasoning source: Section 3.3 Speciation and bonding of arsenic and silica
Scoring Rubric (total: 100 pts)
| Q | Type | Max | Question | Reference Answer | Scoring Criteria |
|---|---|---|---|---|---|
| q1 | reasoning | 30 | What is the expected oxidation state of arsenic in this sample after 168 h of reaction, and what is the physical reasoning for this? | The expected oxidation state of arsenic in this sample is exclusively As(V), representing a fraction of 1.0. The sample was prepared by reacting As(V) and Si-bearing ferrihydrite with FeIISO4 under anoxic conditions for 168 hours to form green rust sulfate. Despite the presence of Fe(II) and the reducing anoxic environment, no changes in the initial As(V) oxidation state occurred during the probed reactions. This demonstrates that the newly formed green rust sulfate cannot reduce As(V) on its own under these specific pH 8.0 conditions. | 10 points for identifying that the oxidation state remains As(V) (fraction 1.0). 20 points for explaining that green rust does not reduce As(V) on its own under these conditions, so the oxidation state remains unchanged from the initial As(V) precursor. |
| q2 | spectral | 30 | Describe the expected spectral shape and the position of the absorption maximum for the As K-edge XANES spectrum of this sample. | The expected As K-edge XANES spectrum will exhibit a strong absorption maximum (white line) centered around 11,875 eV. This specific spectral shape and peak position are characteristic of fully oxidized As(V) species. Because the sample was prepared by transforming As(V)-bearing ferrihydrite with FeIISO4 into green rust sulfate under conditions where green rust cannot reduce As(V), the arsenic remains in its initial oxidation state. Consequently, the electronic properties of the sample reflect As(V) adsorbed onto the resulting green rust sulfate, producing the distinct 11,875 eV absorption maximum. | 15 points for mentioning a strong white line / absorption maximum. 15 points for stating the maximum is centered around 11,875 eV. |
| q3 | spectral | 20 | What distinguishing spectral feature in the XANES data would confirm that the arsenic in this sample has not been reduced to As(III)? | The distinguishing spectral feature is the position of the absorption maximum centered at 11,875 eV. If the initial As(V) had been reduced to As(III) during the 168-hour reaction with FeIISO4, the absorption maximum would shift to a lower energy of 11,871 eV. The retention of the peak at 11,875 eV confirms that the green rust sulfate formed during the Fe(II)-induced transformation of ferrihydrite cannot reduce As(V) under these anoxic, pH 8.0 conditions. Therefore, the electronic structure remains that of As(V), keeping the white line maximum at the higher energy position. | 20 points for stating that the absorption maximum at 11,875 eV distinguishes it from As(III), which would have a maximum at a lower energy (around 11,871 eV). |
| q4 | identification | 20 | What reference spectra would be most appropriate to compare against the XANES spectrum of this sample to confirm the local bonding environment and oxidation state? | The most appropriate reference spectra are As(V) adsorbed onto freshly-precipitated green rust sulfate (GRSO4) and As(V) adsorbed onto ferrihydrite. These references directly match the sample conditions, which involve the Fe(II)-induced transformation of As(V)-bearing ferrihydrite into green rust sulfate over 168 hours. Because the green rust cannot reduce As(V) on its own under these anoxic, pH 8.0 conditions, the arsenic remains in its initial +5 oxidation state throughout the reaction. Comparing the sample's 11,875 eV absorption maximum to these specific references confirms that the final phase consists entirely of unreduced As(V) adsorbed onto the newly formed GRSO4 and any residual ferrihydrite. | 20 points for identifying As(V) adsorbed onto green rust sulfate (GRSO4) and/or As(V) adsorbed onto ferrihydrite as the appropriate reference spectra. |
Review
Biomineralization of magnetic nanoparticles in stem cells
ESRF-BM23
Synthesis
Alexandre Fromain et al.
DOI: 10.1039/d3nr00863k
2 scenarios
▶
#1070
Biomineralized iron in stem cells
Fe K
▶
LLM Prompt
Sample Information
Material: Biomineralized iron in stem cells
Method: biological incubation
Precursors: ammonium iron(II) sulfate hexahydrate (34 uM), citrate (2 mM)
Temperature C: 37
Duration Hours: 864
Atmosphere: 5% CO2
Sample-Specific Conditions
- Iron source and incubation time: Mohr's salt, 36 days
- Mouse mesenchymal stem cells continuously incubated with Mohr's salt for 36 days
Preparation
- Cells were seeded in six-well plates and incubated with 34 uM Mohr's salt and 2 mM citrate at 37 °C and 5% CO2 for 36 days.
Measurement
We plan to measure the Fe K XANES spectrum of this sample.
Questions
Based on all the information above:
1. Mohr's salt contains iron in the Fe(II) oxidation state. What is the expected average oxidation state of iron in the cells after 36 days of incubation, and what does the XANES spectrum indicate about its final chemical form?
2. What reference spectra should be considered when performing a Linear Combination Fitting (LCF) analysis of the Fe K-edge XANES spectrum for this biomineralized sample?
3. What distinguishing feature in the XANES spectrum differentiates the cells incubated with Mohr's salt from those incubated with ferric quinate or ferrous ascorbate after 36 days?
Ground Truth
Material: Biomineralized iron in stem cells
Measurement: Fe K-edge XANES, fluorescence mode, BM23 (ESRF) and CLÆSS (ALBA)
Fit method: Linear combination fitting (LCF)
Phase fractions:
| Phase | Fraction |
|---|---|
| ferrihydrite | 1.0 |
Fit basis (paper's reference spectra):
- ferrihydrite
- maghemite
- Fe-based compounds combined with elements present in the cellular environment (P, S, Ca...)
Source evidence: Page 4, Section 'In situ EXAFS/XANES investigation of iron local atomic structure during biomineralization'; Figure 5C
Key reasoning: After 36 days of continuous incubation with Mohr's salt (Fe2+), the iron valence completely changes to Fe3+. The XANES signal for cells incubated with Mohr's salt almost perfectly fits the reference spectrum of ferrihydrite, indicating a complete transformation of the initial precursor into this non-magnetic storage phase. Unlike other salts (ferric quinate and ferrous ascorbate), it does not show a small proportion of magnetic iron oxides.
Reasoning source: Page 4, Section 'In situ EXAFS/XANES investigation of iron local atomic structure during biomineralization'
Scoring Rubric (total: 101 pts)
| Q | Type | Max | Question | Reference Answer | Scoring Criteria |
|---|---|---|---|---|---|
| q2 | reasoning | 43 | Mohr's salt contains iron in the Fe(II) oxidation state. What is the expected average oxidation state of iron in the cells after 36 days of incubation, and what does the XANES spectrum indicate about its final chemical form? | The expected average oxidation state of iron in the cells after 36 days is Fe3+, and its final chemical form is ferrihydrite. During the 864-hour biological incubation of mouse mesenchymal stem cells at 37 °C and 5% CO2, the initial Fe(II) from the 34 uM Mohr's salt precursor undergoes complete oxidation. The XANES spectrum exhibits an energy edge shift characteristic of an average 3+ oxidation state and almost perfectly fits the reference spectrum of ferrihydrite. This demonstrates that the cellular environment completely transforms the initial Fe(II) precursor into this non-magnetic Fe(III) storage phase over the extended incubation period. | Full points for stating the oxidation state changes to Fe3+ and explaining that the iron is completely transformed into ferrihydrite (a non-magnetic storage phase). |
| q3 | spectral | 29 | What reference spectra should be considered when performing a Linear Combination Fitting (LCF) analysis of the Fe K-edge XANES spectrum for this biomineralized sample? | The Linear Combination Fitting (LCF) analysis should consider reference spectra for ferrihydrite, maghemite, and Fe-based compounds combined with elements naturally present in the cellular environment, such as P, S, and Ca. These references are necessary because the sample consists of stem cells incubated with Mohr's salt and citrate for 36 days, allowing the iron to interact with biological elements and potentially form various biomineralized phases. Over the 864-hour incubation at 37 °C, the Fe(II) precursor oxidizes and biomineralizes into cellular storage forms. Ultimately, the LCF yields a fraction of 1.0 for ferrihydrite, proving that under these specific conditions, the precursor is completely converted into this non-magnetic Fe(III) phase rather than forming magnetic iron oxides like maghemite. | Full points for mentioning ferrihydrite, maghemite (or magnetic iron oxides), and Fe-based compounds combined with cellular elements (P, S, Ca). |
| q4 | spectral | 29 | What distinguishing feature in the XANES spectrum differentiates the cells incubated with Mohr's salt from those incubated with ferric quinate or ferrous ascorbate after 36 days? | The distinguishing feature is that the XANES spectrum for cells incubated with Mohr's salt can be fully fitted using only the ferrihydrite reference signal, representing a fraction of 1.0. In contrast, spectra from cells incubated with ferric quinate or ferrous ascorbate require a small proportion of magnetic iron oxides to achieve a proper fit. This difference arises because the specific 36-day biological incubation with 34 uM Mohr's salt and 2 mM citrate at 37 °C leads to the complete transformation of the Fe(II) precursor exclusively into the non-magnetic ferrihydrite storage phase. The cellular biomineralization pathway for Mohr's salt under these exact conditions entirely avoids the formation of the magnetic iron oxides that occur with the other precursors. | Full points for explaining that the Mohr's salt sample spectrum fully fits pure ferrihydrite, whereas the other salts show a spectrum matching ferrihydrite accompanied by a small proportion of magnetic iron oxides. |
Review
#1071
Internalized iron in stem cells
Fe K
▶
LLM Prompt
Sample Information
Material: Internalized iron in stem cells
Method: biological incubation
Precursors: ammonium iron(II) sulfate hexahydrate (4 mM), citrate (2 mM)
Temperature C: 37
Duration Hours: 5
Atmosphere: 5% CO2
Sample-Specific Conditions
- Iron source and incubation time: Mohr's salt, 5 hours
- Mouse mesenchymal stem cells incubated with Mohr's salt for 5 hours
Preparation
- Cells were seeded in six-well plates and incubated with 4 mM Mohr's salt and 2 mM citrate at 37 °C and 5% CO2 for 5 hours.
Measurement
We plan to measure the Fe K XANES spectrum of this sample.
Questions
Based on all the information above:
1. Given the incubation of stem cells with Mohr's salt (an Fe2+ precursor) for 5 hours, what is the expected dominant oxidation state of the internalized iron, and what does this indicate about the cellular processing timeline?
2. What reference spectra would be necessary to model the transformation of the iron species in this sample using Linear Combination Fitting (LCF)?
Ground Truth
Material: Internalized iron in stem cells
Measurement: Fe K-edge XANES, fluorescence mode, BM23 (ESRF) and CLÆSS (ALBA)
Fit method: Qualitative edge position analysis
Phase fractions:
| Phase | Fraction |
|---|---|
| Fe3+ species | 1.0 |
Fit basis (paper's reference spectra):
- ferrihydrite
- maghemite
- Mohr's salt solution
Source evidence: Page 4, right column; Figure 6F
Key reasoning: XANES spectra at the Fe K-edge show that the edge position for cells incubated with Mohr's salt for 5 hours has shifted to higher energy compared to the initial Fe2+ solution. This shift indicates a complete change of iron valence toward Fe3+ within 5 hours of cell internalization, matching the edge position of Fe3+ references.
Reasoning source: Page 4, right column, 'In situ EXAFS/XANES investigation of iron local atomic structure during biomineralization'
Scoring Rubric (total: 100 pts)
| Q | Type | Max | Question | Reference Answer | Scoring Criteria |
|---|---|---|---|---|---|
| q1 | reasoning | 57 | Given the incubation of stem cells with Mohr's salt (an Fe2+ precursor) for 5 hours, what is the expected dominant oxidation state of the internalized iron, and what does this indicate about the cellular processing timeline? | The expected dominant oxidation state of the internalized iron is Fe3+, representing a fraction of 1.0. The mouse mesenchymal stem cells were incubated with 4 mM Mohr's salt (an Fe2+ source) and 2 mM citrate at 37 °C and 5% CO2 for 5 hours. Despite starting with an Fe2+ precursor, the Fe K-edge XANES spectrum exhibits an edge position shifted to higher energy that matches Fe3+ references. This shift indicates that the cellular internalization and biomineralization mechanisms completely oxidize the iron from Fe2+ to Fe3+ within the 5-hour incubation timeline. | Full credit for stating the iron is fully oxidized to Fe3+ (fraction ~1.0) and explaining that this indicates rapid intracellular processing/oxidation occurring within the first 5 hours of internalization. |
| q2 | identification | 43 | What reference spectra would be necessary to model the transformation of the iron species in this sample using Linear Combination Fitting (LCF)? | The necessary reference spectra to model the transformation of the iron species are ferrihydrite, maghemite, and a Mohr's salt solution. These specific references are required based on the biological incubation conditions, where stem cells were exposed to 4 mM Mohr's salt and 2 mM citrate at 37 °C for 5 hours. The Mohr's salt solution reference represents the initial Fe2+ precursor state prior to cellular processing. Meanwhile, ferrihydrite and maghemite serve as the necessary Fe3+ references because the cellular internalization completely oxidizes the iron within 5 hours, causing the XANES edge position to shift to higher energies matching these Fe3+ phases. | Full credit for identifying the need for the initial Fe2+ precursor (Mohr's salt solution) and Fe3+ reference standards (such as ferrihydrite or maghemite). |
Review
Catalytic tandem dehydrochlorination–hydrogenation of PVC towards valorisation of chlorinated plastic waste
ESRF-BM23
Catalyst
Galahad O'Rourke et al.
DOI: 10.1039/d3sc00945a
2 scenarios
▶
#1072
H(CO)Rh(PPh3)3
Rh K-edge
▶
LLM Prompt
Sample Information
Material: H(CO)Rh(PPh3)3
Support: Bu4PCl
Sample-Specific Conditions
- reaction state: before reaction
- Rh precatalyst immobilized in Bu4PCl ionic liquid before reaction
Measurement
We plan to measure the Rh K-edge XANES spectrum of this sample.
Questions
Based on all the information above:
1. Based on the sample conditions, what reference spectrum is essential to confirm that the Rh precatalyst remains as a homogeneous, monometallic complex rather than forming metallic nanoparticles?
2. How is the oxidation state of the Rh catalyst expected to behave when comparing this 'before reaction' state to the 'after reaction' state, and what XANES feature supports this?
3. What distinguishing spectral features in the XANES region would indicate that the Rh species in this sample is ionic rather than metallic?
Ground Truth
Material: H(CO)Rh(PPh3)3 in Bu4PCl
Measurement: Rh K-edge transmission mode at BM23 beamline (ESRF)
Fit method: not reported
Phase fractions: (±10%)
| Phase | Fraction |
|---|---|
| H(CO)Rh(PPh3)3 | 1.0 |
Fit basis (paper's reference spectra):
- Rh foil
- RhCl3
Source evidence: Figure 10, page 4409-4410
Key reasoning: The precatalyst is immobilized in the ionic liquid before the reaction. XANES analysis shows that the catalyst maintains a similar oxidation state before and after reaction, as no shift in the edge jump is observed. Comparison with Rh foil confirms the catalyst is ionic and monometallic, with no Rh0 contributions.
Reasoning source: Section 'Characterization of the homogeneous Rhodium catalyst', pages 4409-4410
Scoring Rubric (total: 100 pts)
| Q | Type | Max | Question | Reference Answer | Scoring Criteria |
|---|---|---|---|---|---|
| q1 | identification | 30 | Based on the sample conditions, what reference spectrum is essential to confirm that the Rh precatalyst remains as a homogeneous, monometallic complex rather than forming metallic nanoparticles? | A Rh foil reference spectrum is essential to confirm the state of the catalyst. The sample consists of the H(CO)Rh(PPh3)3 precatalyst immobilized in a Bu4PCl ionic liquid before the reaction. Because it is critical to ensure the catalyst remains a homogeneous, monometallic complex in this environment, comparing the sample's spectrum to Rh foil allows researchers to check for any Rh0 contributions. The absence of Rh0 features compared to the foil confirms that the Rh species remains ionic and has not aggregated into metallic nanoparticles within the ionic liquid. | Award full points if the answer identifies Rh foil (or metallic Rh) as the necessary reference to rule out Rh0 contributions and confirm the monometallic/ionic nature. |
| q2 | reasoning | 40 | How is the oxidation state of the Rh catalyst expected to behave when comparing this 'before reaction' state to the 'after reaction' state, and what XANES feature supports this? | The oxidation state of the Rh catalyst is expected to remain similar when comparing the 'before reaction' state to the 'after reaction' state. The H(CO)Rh(PPh3)3 precatalyst is immobilized in the Bu4PCl ionic liquid, which stabilizes the complex during the catalytic process. This stability is evidenced by the XANES spectra, which show no shift in the edge jump position (located around 23220 eV) between the pre-reaction and post-reaction states. The lack of an edge shift demonstrates that the ionic, monometallic nature of the catalyst is preserved throughout the reaction without undergoing a net change in oxidation state. | Award full points if the answer states that the oxidation state is maintained (or remains similar) before and after the reaction, supported by the observation of no shift in the XANES edge jump. |
| q3 | spectral | 30 | What distinguishing spectral features in the XANES region would indicate that the Rh species in this sample is ionic rather than metallic? | The primary distinguishing spectral feature is the lack of Rh0 characteristics when compared to a metallic Rh foil reference, alongside an edge jump positioned around 23220 eV. In this sample, the H(CO)Rh(PPh3)3 precatalyst is immobilized in a Bu4PCl ionic liquid before the reaction. Because the complex is designed to act as a homogeneous catalyst, its overall spectral shape reflects an ionic Rh species rather than a metallic one. The complete absence of metallic Rh0 features confirms that the catalyst maintains its true homogeneous, ionic, and monometallic nature in the ionic liquid without forming nanoparticles. | Award full points if the answer mentions the absence of Rh0 spectral features (which would be present in metallic Rh foil) and the presence of an edge jump characteristic of an ionic species. |
Review
#1073
Rh complex
Rh K-edge
▶
LLM Prompt
Sample Information
Material: Rh complex
Support: Bu4PCl
Reaction Conditions: 180 °C, 20 bar H2, 2 h
Sample-Specific Conditions
- reaction state: after reaction
- Rh catalyst in Bu4PCl ionic liquid after tandem dehydrochlorination-hydrogenation of PVC
Measurement
We plan to measure the Rh K-edge XANES spectrum of this sample.
Questions
Based on all the information above:
1. Based on the reaction conditions (180 °C, 20 bar H2, in Bu4PCl), what is the expected dominant Rh phase or structural motif after the reaction, and what drives its formation?
2. What reference spectra are necessary to confirm the final state of the Rh catalyst, and what specific spectral features (or lack thereof) distinguish the active catalyst from deactivated metallic species?
3. Describe the expected changes in the XANES edge position (edge jump) for the Rh catalyst before and after the reaction in Bu4PCl.
Ground Truth
Material: Rh complex in Bu4PCl
Measurement: Rh K-edge in transmission mode at BM23 beamline (ESRF)
Fit method: qualitative comparison
Phase fractions: (±10%)
| Phase | Fraction |
|---|---|
| Rh-Cl species (similar to RhCl3) | 1.0 |
Fit basis (paper's reference spectra):
- RhCl3
- Rh foil
Source evidence: Figure 10 and text on page 4409-4410
Key reasoning: After reaction in Bu4PCl, the final Rh catalyst shows similar features to RhCl3, indicating ligand substitution with halides from the ionic liquid and PVC dechlorination. The absence of Rh0 or Rh-Rh contributions confirms the catalyst remains ionic and monometallic.
Reasoning source: Characterization of the homogeneous Rhodium catalyst section, pages 4409-4410
Scoring Rubric (total: 100 pts)
| Q | Type | Max | Question | Reference Answer | Scoring Criteria |
|---|---|---|---|---|---|
| q1 | reasoning | 35 | Based on the reaction conditions (180 °C, 20 bar H2, in Bu4PCl), what is the expected dominant Rh phase or structural motif after the reaction, and what drives its formation? | After the reaction at 180 °C and 20 bar H2, the dominant Rh phase is a Rh-Cl species (fraction of 1.0) that is structurally similar to RhCl3. This specific motif arises because the Rh complex undergoes ligand substitution during the tandem dehydrochlorination-hydrogenation of PVC. The abundant halides provided by both the Bu4PCl ionic liquid support and the PVC dechlorination process drive this substitution. Despite the reducing conditions of 20 bar H2, these halide interactions ensure the catalyst remains ionic and monometallic, preventing the formation of metallic Rh nanoparticles. | Full points for identifying a Rh-Cl species (or similar to RhCl3) and explaining that it forms due to ligand substitution with halides (loss of lighter elements like H, CO, PPh3 in favor of Cl-) from the high halide content in the reaction medium. |
| q2 | spectral | 35 | What reference spectra are necessary to confirm the final state of the Rh catalyst, and what specific spectral features (or lack thereof) distinguish the active catalyst from deactivated metallic species? | To confirm the final state of the Rh catalyst, reference spectra of RhCl3 and Rh foil are necessary for qualitative comparison. The sample's XANES spectrum exhibits features similar to RhCl3, which results from ligand substitution with halides from the Bu4PCl ionic liquid and the PVC dechlorination process at 180 °C. The key distinguishing feature is the complete lack of Rh0 or Rh-Rh contributions when compared to the Rh foil reference. This absence of metallic features confirms that despite the 20 bar H2 pressure, the catalyst does not reduce into metallic nanoparticles, but instead remains an active, ionic, and monometallic Rh-Cl species. | Full points for mentioning RhCl3 and Rh foil as references, and stating that the lack of Rh0 features (or Rh-Rh contributions) distinguishes the catalyst, confirming it remains ionic and monometallic. |
| q3 | prediction | 30 | Describe the expected changes in the XANES edge position (edge jump) for the Rh catalyst before and after the reaction in Bu4PCl. | There is no expected shift in the XANES edge position (edge jump) for the Rh catalyst before and after the reaction. This lack of change indicates that the catalyst maintains an oxidation state similar to the initial complex. This stability arises because, during the tandem dehydrochlorination-hydrogenation of PVC at 180 °C, the catalyst undergoes ligand substitution with abundant halides from the Bu4PCl ionic liquid rather than being reduced. Consequently, despite the presence of 20 bar H2, the chloride-rich environment stabilizes the ionic, monometallic Rh-Cl species (similar to RhCl3) and prevents reduction to metallic Rh0. | Full points for stating that there is no shift in the edge jump, indicating that the catalyst maintains a similar oxidation state before and after the reaction. |
Review
Exploring Cr and molten salt interfacial interactions for molten salt applications
BNL-NSLS-II-8-ID
Synthesis
Xiaoyang Liu et al.
DOI: 10.1039/d4cp01122h
2 scenarios
▶
#1074
Cr microparticles in KCl-MgCl2
Cr K
▶
LLM Prompt
Sample Information
Material: Cr microparticles in KCl-MgCl2
Method: solid-liquid reaction
Precursors: Cr powder, KCl, MgCl2
Temperature C: 25
Atmosphere: Ar (sealed under vacuum)
Sample-Specific Conditions
- Reaction time: 0 min
- Pristine Cr microparticles before heating in molten salt. XAS EXAFS and XRD both confirm pure bcc Cr.
Preparation
- 5 wt.% Cr powder (3 µm, 99.5%) was mixed with KCl-MgCl2 (50/50 mol.%). The mixed powders were loaded into quartz capillaries and flame-sealed under vacuum after preparation in an Ar glovebox.
Measurement
We plan to measure the Cr K XANES spectrum of this sample.
Questions
Based on all the information above:
1. Based on the sample conditions (Cr powder mixed with KCl-MgCl2 at room temperature, 0 min reaction time), what is the expected dominant Cr phase and its oxidation state?
2. Describe the expected Cr K-edge XANES spectral shape for this sample. What standard reference material would have a similar spectrum?
3. Explain why this specific phase is expected under these initial conditions, before any heating has occurred.
Ground Truth
Material: Cr microparticles in KCl-MgCl2
Measurement: Cr K-edge XAS in fluorescence mode at ISS beamline (8-ID)
Fit method: EXAFS fitting using FEFF6 (XANES compared visually)
Phase fractions: (±5%)
| Phase | Fraction |
|---|---|
| bcc Cr | 1.0 |
Fit basis (paper's reference spectra):
- Cr foil
- bcc Cr model
Source evidence: Figure 3A, Table 1 (Page 12), Page 10
Key reasoning: At room temperature, before heating and reaction with the molten salt, the Cr microparticles remain in their pristine metallic state. The XANES spectrum is similar to that of metallic Cr foil, confirming it is in the bcc phase.
Reasoning source: Page 10, 'The local structure of Cr in molten KCl-MgCl2' section
Scoring Rubric (total: 99 pts)
| Q | Type | Max | Question | Reference Answer | Scoring Criteria |
|---|---|---|---|---|---|
| q1 | prediction | 33 | Based on the sample conditions (Cr powder mixed with KCl-MgCl2 at room temperature, 0 min reaction time), what is the expected dominant Cr phase and its oxidation state? | The expected dominant Cr phase is pure bcc Cr with an oxidation state of 0, comprising 100% (fraction of 1.0) of the sample. This specific phase and oxidation state are expected because the sample is held at room temperature (25 °C) with a reaction time of 0 minutes. Under these initial conditions, no heating or reaction with the surrounding KCl-MgCl2 salt mixture has occurred. Consequently, the pristine Cr microparticles remain entirely in their unreacted, metallic state, retaining their original bcc structure. | Full points for identifying bcc Cr (or metallic Cr) as the sole/dominant phase with an oxidation state of 0. |
| q2 | spectral | 33 | Describe the expected Cr K-edge XANES spectral shape for this sample. What standard reference material would have a similar spectrum? | The expected Cr K-edge XANES spectral shape for this sample will closely match that of a metallic Cr foil reference standard. Specifically, the pre-edge and post-edge features will be characteristic of the bcc Cr phase and show marked differences from samples reacted at 700 °C (which form delta-A15 Cr). These spectral features arise because the sample consists of pristine Cr microparticles mixed with KCl-MgCl2 at 25 °C with a 0-minute reaction time. Since no heating or solid-liquid reaction has taken place, the chromium remains in its unreacted metallic state (oxidation state 0), meaning its electronic and local structural properties are identical to pure bcc Cr. | Full points for stating the spectrum will match that of metallic Cr foil (bcc phase). |
| q3 | reasoning | 33 | Explain why this specific phase is expected under these initial conditions, before any heating has occurred. | The expected phase under these initial conditions is 100% pure bcc Cr. This phase is expected because the sample consists of pristine Cr powder physically mixed with KCl-MgCl2 at a temperature of 25 °C and a reaction time of 0 minutes. At this room-temperature stage, the salt mixture has not melted, and no solid-liquid reaction has been initiated. Because the Cr microparticles have not yet been heated or reacted with the surrounding salt matrix, they remain entirely in their original, unreacted metallic state, which is confirmed by EXAFS and XRD to be pure bcc Cr. | Full points for explaining that at room temperature, prior to heating in the molten salt, the pristine Cr microparticles have not yet reacted and thus remain in their initial metallic bcc state. |
Review
#1075
Cr microparticles in molten KCl-MgCl2
Cr K
▶
LLM Prompt
Sample Information
Material: Cr microparticles in molten KCl-MgCl2
Method: solid-liquid reaction
Precursors: Cr powder, KCl, MgCl2
Temperature C: 700
Duration Hours: 1.36
Atmosphere: Ar (sealed under vacuum)
Sample-Specific Conditions
- Reaction time: 81.8 min
- Cr microparticles reacting in molten KCl-MgCl2 for 81.8 min. EXAFS was fitted using the δ-A15 Cr structural model, while in situ XRD Rietveld refinement shows a roughly 50/50 mixture.
Preparation
- 5 wt.% Cr powder (3 µm, 99.5%) was mixed with KCl-MgCl2 (50/50 mol.%). The mixed powders were loaded into quartz capillaries and flame-sealed under vacuum after preparation in an Ar glovebox. Heated to 700 °C.
Measurement
We plan to measure the Cr K XANES spectrum of this sample.
Questions
Based on all the information above:
1. What candidate reference phases should be considered when analyzing the structural evolution of Cr microparticles reacting in molten KCl-MgCl2 at 700 °C?
2. After reacting for approximately 80 minutes in the molten salt, what are the expected relative phase fractions of the Cr phases present?
3. Explain the physical and chemical driving forces that lead to the formation and stabilization of the new Cr phase in this molten salt environment.
Ground Truth
Material: Cr microparticles in molten KCl-MgCl2
Measurement: Cr K-edge fluorescence mode at ISS (8-ID) beamline, NSLS-II
Fit method: EXAFS shell fitting (FEFF6) and XRD Rietveld refinement
Phase fractions: (±10%)
| Phase | Fraction |
|---|---|
| bcc Cr | 0.4 |
| δ-A15 Cr | 0.6 |
Fit basis (paper's reference spectra):
- bcc Cr
- δ-A15 Cr
Source evidence: Figure 2D-E (Page 8), Page 10 (text for XRD fractions), and Table 1 (Page 12 for EXAFS fitting)
Key reasoning: In molten KCl-MgCl2, bcc Cr undergoes anodic dissolution driven by trace impurities (oxidants) in the salt. This dissolution creates pores and new interfaces with high surface energy, prompting a surface reconstruction to the δ-A15 Cr phase to reduce energy and stabilize the interfaces. The δ-A15 Cr phase is more stable against corrosion and exhibits a competitive affinity for molten KCl compared to bcc Cr. The transformation halts at a roughly 40/60 ratio (bcc/δ-A15) because the limited oxidants in the molten salt become exhausted, stopping further corrosion and phase transformation.
Reasoning source: Page 10 (The local structure of Cr in molten KCl-MgCl2) and Page 12 (The formation of δ-A15 Cr and phase stability comparison)
Scoring Rubric (total: 101 pts)
| Q | Type | Max | Question | Reference Answer | Scoring Criteria |
|---|---|---|---|---|---|
| q1 | identification | 25 | What candidate reference phases should be considered when analyzing the structural evolution of Cr microparticles reacting in molten KCl-MgCl2 at 700 °C? | The candidate reference phases that should be considered are bcc Cr and δ-A15 Cr. These phases are expected based on the sample conditions because the initial 5 wt.% Cr powder precursor starts as bcc Cr. When heated to 700 °C in the molten KCl-MgCl2 environment, trace oxidants in the salt drive anodic dissolution of the bcc Cr, creating pores and high-energy interfaces. This prompts a surface reconstruction into the δ-A15 Cr phase to minimize surface energy and stabilize the interfaces against further corrosion. | Must identify both the initial bcc Cr phase and the newly formed δ-A15 Cr phase. |
| q2 | quantification | 38 | After reacting for approximately 80 minutes in the molten salt, what are the expected relative phase fractions of the Cr phases present? | After 81.8 minutes of reaction, the expected phase fractions are 0.4 (40%) bcc Cr and 0.6 (60%) δ-A15 Cr, with an uncertainty of 10%. These specific values result from the limited amount of trace impurities (oxidants) present in the molten KCl-MgCl2 within the vacuum-sealed quartz capillary. The oxidants drive the anodic dissolution and subsequent phase transformation, but once they are exhausted, the corrosion process stops, halting the transformation at this roughly 40/60 ratio. Furthermore, the newly formed δ-A15 Cr phase is more stable against corrosion than bcc Cr, preventing complete conversion of the microparticles. | Must state that the sample is a mixture of approximately 40 wt% bcc Cr and 60 wt% δ-A15 Cr (accept ~50/50 as a reasonable approximation). |
| q3 | reasoning | 38 | Explain the physical and chemical driving forces that lead to the formation and stabilization of the new Cr phase in this molten salt environment. | The formation of the new δ-A15 Cr phase is chemically driven by trace oxidants present in the molten KCl-MgCl2 at 700 °C, which cause anodic dissolution of the initial bcc Cr microparticles. Physically, this dissolution creates pores and new interfaces characterized by high surface energy. To reduce this energy and stabilize the interfaces, the material undergoes a surface reconstruction into the δ-A15 Cr phase. This new phase is stabilized in this environment because it is more resistant to corrosion and exhibits a competitive affinity for the molten KCl compared to the original bcc Cr. The entire process is self-limiting, halting when the limited oxidants in the sealed environment are exhausted. | Must mention anodic dissolution of bcc Cr creating high-energy interfaces, surface reconstruction to reduce energy, and the higher stability/affinity of the δ-A15 phase in the molten KCl-MgCl2 environment. |
Review
Understanding the role of supported Rh atoms and clusters during hydroformylation and CO hydrogenation reactions with in situ / operando XAS and DRIFT spectroscopy
BNL-NSLS-II-8-ID
Catalyst
Bidyut Bikash Sarma et al.
DOI: 10.1039/d4sc02907k
5 scenarios
▶
#1076
Rh/CeO2
Rh K
▶
LLM Prompt
Sample Information
Material: Rh/CeO2
Support: CeO2
Reaction Conditions: 1:1:1 ethylene:CO:H2, 1 bar, 300 K
Sample-Specific Conditions
- temperature: 300 K
- Rh supported on CeO2 synthesized via precipitation, under hydroformylation conditions at 300 K
Measurement
We plan to measure the Rh K XANES spectrum of this sample.
Questions
Based on all the information above:
1. What candidate reference spectra or components are needed to perform a linear combination analysis of this catalyst as it undergoes temperature-programmed hydroformylation?
2. At the initial temperature of 300 K under the 1:1:1 ethylene:CO:H2 mixture, what is the dominant phase/oxidation state of Rh, and why?
Ground Truth
Material: Rh/CeO2
Measurement: Rh K-edge in situ XANES
Fit method: Linear combination analysis (LCA)
Phase fractions: (±10%)
| Phase | Fraction |
|---|---|
| Rh3+ (oxidized) | 1.0 |
| Rh0 (reduced) | 0.0 |
Fit basis (paper's reference spectra):
- oxidized component (Rh3+)
- reduced component (Rh0)
Source evidence: Figure 4(e), page 12373
Key reasoning: At 300 K under the hydroformylation reaction mixture (ethylene:CO:H2), the Rh species on the CeO2 support synthesized via precipitation remain fully oxidized (Rh3+). The temperature is not yet high enough to induce reduction by the syngas mixture. Linear combination analysis shows that the reduction to Rh0 only begins as the temperature is ramped above ~350 K.
Reasoning source: Section 'In situ XAS investigations', page 12373
Scoring Rubric (total: 100 pts)
| Q | Type | Max | Question | Reference Answer | Scoring Criteria |
|---|---|---|---|---|---|
| q1 | identification | 43 | What candidate reference spectra or components are needed to perform a linear combination analysis of this catalyst as it undergoes temperature-programmed hydroformylation? | To perform a linear combination analysis of this catalyst, the required candidate reference spectra are an oxidized component (Rh3+) and a reduced component (Rh0). These specific phases are expected because the Rh/CeO2 catalyst, synthesized via precipitation, initially exists in a fully oxidized state at 300 K under the 1:1:1 ethylene:CO:H2 mixture. As the temperature is ramped above ~350 K, the syngas mixture provides enough thermal energy to induce reduction of the Rh species. Therefore, both the initial Rh3+ and the resulting Rh0 components are necessary to model the structural transitions occurring during the temperature-programmed hydroformylation. | Full points for identifying both an oxidized Rh3+ component and a reduced Rh0 component. |
| q2 | reasoning | 57 | At the initial temperature of 300 K under the 1:1:1 ethylene:CO:H2 mixture, what is the dominant phase/oxidation state of Rh, and why? | At the initial temperature of 300 K under the 1:1:1 ethylene:CO:H2 mixture, the dominant oxidation state of the Rh/CeO2 catalyst is fully oxidized Rh3+, representing a fraction of 1.0. This occurs because 300 K is not yet high enough to provide the thermal energy required for the syngas mixture to reduce the precipitated Rh species. Linear combination analysis demonstrates that the reduction to Rh0 only begins as the temperature is ramped above approximately 350 K. Consequently, the catalyst remains entirely in its initial Rh3+ state under these specific starting conditions. | Full points for stating that Rh is fully oxidized (Rh3+, fraction ~1.0) because 300 K is too low of a temperature for the reducing gas mixture to reduce the catalyst. |
Review
#1077
Rh/CeO2
Rh K
▶
LLM Prompt
Sample Information
Material: Rh/CeO2
Support: CeO2
Reaction Conditions: 1:1:1 ethylene:CO:H2, 1 bar, 450 K
Sample-Specific Conditions
- temperature: 450 K
- Rh supported on CeO2 synthesized via precipitation, under hydroformylation conditions at 450 K
Measurement
We plan to measure the Rh K XANES spectrum of this sample.
Questions
Based on all the information above:
1. What candidate reference spectra or basis components are needed to model the Rh K-edge XANES spectrum of this sample using linear combination fitting?
2. Estimate the phase fractions of the oxidized and reduced Rh species in this catalyst at 450 K under the specified hydroformylation conditions.
3. Explain the physical reasoning for this specific phase composition at 450 K. How does the reducibility of this catalyst compare to Rh supported on ZrO2 or MgO under the same conditions?
Ground Truth
Material: Rh/CeO2 (PP)
Measurement: Rh K-edge in situ/operando XANES
Fit method: Linear combination analysis (LCA)
Phase fractions: (±10%)
| Phase | Fraction |
|---|---|
| Rh3+ (oxidized) | 0.1 |
| Rh0 (reduced) | 0.9 |
Fit basis (paper's reference spectra):
- oxidized component (Rh3+)
- reduced component (Rh0)
Source evidence: Figure 4(e) and text in 'In situ XAS investigations'
Key reasoning: Under hydroformylation conditions (1:1:1 ethylene:CO:H2) while heating, the Rh catalysts are reduced with a change in the oxidation state of Rh from Rh3+ to Rh0. The reduction temperature depends on the support, following the trend Rh/MgO > Rh/ZrO2 > Rh/CeO2 > RhP/CeO2. For the Rh/CeO2 (PP) catalyst, reduction occurs relatively easily, and by 450 K, approximately 90% of the Rh species have been reduced to Rh0.
Reasoning source: Page 6, 'In situ XAS investigations' section
Scoring Rubric (total: 100 pts)
| Q | Type | Max | Question | Reference Answer | Scoring Criteria |
|---|---|---|---|---|---|
| q1 | identification | 20 | What candidate reference spectra or basis components are needed to model the Rh K-edge XANES spectrum of this sample using linear combination fitting? | To model the Rh K-edge XANES spectrum of this sample using linear combination analysis, the required basis components are an oxidized component (Rh3+) and a reduced component (Rh0). These specific phases are expected because the Rh/CeO2 catalyst, synthesized via precipitation, undergoes reduction under the applied hydroformylation conditions (1:1:1 ethylene:CO:H2 at 1 bar). As the sample is heated to 450 K in this reducing gas mixture, the initial Rh3+ species are progressively converted to metallic Rh0. Therefore, both the initial oxidized state and the resulting reduced state are necessary to accurately capture the mixed-phase composition present at this temperature. | Full points for identifying an oxidized Rh component (e.g., Rh3+ or Rh2O3) and a reduced Rh component (e.g., Rh0 or Rh foil). |
| q2 | quantification | 40 | Estimate the phase fractions of the oxidized and reduced Rh species in this catalyst at 450 K under the specified hydroformylation conditions. | At 450 K under the specified hydroformylation conditions, the estimated phase fractions are 90% for the reduced Rh0 component and 10% for the oxidized Rh3+ component, with an uncertainty of 10%. These specific values result from the relatively easy reducibility of the Rh/CeO2 catalyst under the 1:1:1 ethylene:CO:H2 gas mixture. As the sample is heated to 450 K, the reducing environment drives the conversion of the rhodium oxidation state from Rh3+ to Rh0. Because the CeO2 support facilitates this reduction more readily than other supports, the vast majority (90%) of the rhodium has already been reduced to the metallic state at this moderate temperature. | Full points for estimating ~90% reduced Rh (Rh0) and ~10% oxidized Rh (Rh3+). Deduct points proportionally for deviations greater than 10%. |
| q3 | reasoning | 40 | Explain the physical reasoning for this specific phase composition at 450 K. How does the reducibility of this catalyst compare to Rh supported on ZrO2 or MgO under the same conditions? | The phase composition of 90% Rh0 and 10% Rh3+ at 450 K is driven by the reducing nature of the hydroformylation gas mixture (1:1:1 ethylene:CO:H2) combined with the specific support effects of CeO2. As the catalyst is heated in this environment, the Rh species undergo a change in oxidation state from Rh3+ to Rh0. The required reduction temperature is highly dependent on the support material, following the trend: Rh/MgO > Rh/ZrO2 > Rh/CeO2 > RhP/CeO2. Consequently, the Rh/CeO2 catalyst reduces relatively easily compared to Rh/ZrO2 or Rh/MgO, allowing it to reach a highly reduced state (90% Rh0) at the moderate temperature of 450 K. | Full points for explaining that the syngas/ethylene mixture acts as a reducing environment, converting Rh3+ to Rh0, and noting that Rh/CeO2 reduces at lower temperatures compared to Rh/ZrO2 and Rh/MgO, leading to a highly reduced state by 450 K. |
Review
#1078
Rh/CeO2
Rh K
▶
LLM Prompt
Sample Information
Material: Rh/CeO2
Support: CeO2
Reaction Conditions: 1:1:1 ethylene:CO:H2, 1 bar, 573 K
Sample-Specific Conditions
- temperature: 573 K
- Rh supported on CeO2 synthesized via precipitation, under hydroformylation conditions at 573 K
Measurement
We plan to measure the Rh K XANES spectrum of this sample.
Questions
Based on all the information above:
1. What reference components are necessary to perform a Linear Combination Analysis (LCA) of the Rh K-edge XANES spectra for this catalyst as it undergoes temperature-programmed hydroformylation from room temperature up to 573 K?
2. At the final reaction temperature of 573 K under the specified hydroformylation conditions, what is the expected dominant oxidation state of Rh in the Rh/CeO2 (PP) catalyst?
3. Explain the physical and catalytic significance of the Rh phase present at 573 K. Specifically, what structural form does the Rh take upon complete reduction, and how does this relate to the products observed in the gas stream?
Ground Truth
Material: Rh/CeO2 (PP)
Measurement: Rh K-edge in situ XANES
Fit method: Linear combination analysis (LCA)
Phase fractions: (±10%)
| Phase | Fraction |
|---|---|
| Rh0 (reduced) | 1.0 |
| Rh3+ (oxidized) | 0.0 |
Fit basis (paper's reference spectra):
- oxidized Rh component (Rh3+)
- reduced Rh component (Rh0)
Source evidence: Figure 4(e), page 12373
Key reasoning: Under hydroformylation conditions (1:1:1 ethylene:CO:H2) at 573 K, the Rh species in the Rh/CeO2 (PP) catalyst are completely reduced to Rh0. The reduction process is complete by approximately 500 K. The complete reduction to Rh0 is associated with the formation of Rh clusters. This structural evolution correlates with the detection of methanol in the product stream, indicating that the formation of Rh clusters enhances the pathway for CO hydrogenation.
Reasoning source: Page 12373, 'In situ XAS investigations' section
Scoring Rubric (total: 100 pts)
| Q | Type | Max | Question | Reference Answer | Scoring Criteria |
|---|---|---|---|---|---|
| q1 | identification | 30 | What reference components are necessary to perform a Linear Combination Analysis (LCA) of the Rh K-edge XANES spectra for this catalyst as it undergoes temperature-programmed hydroformylation from room temperature up to 573 K? | The necessary reference components for the Linear Combination Analysis (LCA) are an oxidized Rh component (Rh3+) and a reduced Rh component (Rh0). These specific phases are expected because the Rh/CeO2 (PP) catalyst undergoes a chemical transformation when exposed to the hydroformylation gas mixture (1:1:1 ethylene:CO:H2). As the temperature increases toward 573 K, the initial oxidized Rh species are progressively reduced by the reactive environment. Because this reduction process is complete by approximately 500 K, both the initial Rh3+ state and the final Rh0 state must be included in the fit basis to accurately capture the catalyst's structural evolution. | Full credit for identifying that both an oxidized Rh component (Rh3+) and a reduced Rh component (Rh0) are required to model the transformation. |
| q2 | quantification | 30 | At the final reaction temperature of 573 K under the specified hydroformylation conditions, what is the expected dominant oxidation state of Rh in the Rh/CeO2 (PP) catalyst? | At the final reaction temperature of 573 K, the expected dominant oxidation state is Rh0, with a fraction of 1.0 (100% reduced) and 0.0 for Rh3+ (oxidized). These specific values result from the catalyst being exposed to a reducing hydroformylation gas mixture of 1:1:1 ethylene:CO:H2 at 1 bar. Under these conditions, the reduction of the Rh species is already complete by approximately 500 K. Consequently, at 573 K, no oxidized Rh3+ remains, and the catalyst exists entirely as reduced Rh0 clusters. | Full credit for stating that the catalyst is completely reduced to Rh0 (fraction = 1.0). |
| q3 | reasoning | 40 | Explain the physical and catalytic significance of the Rh phase present at 573 K. Specifically, what structural form does the Rh take upon complete reduction, and how does this relate to the products observed in the gas stream? | Upon complete reduction at 573 K, the Rh phase takes the structural form of metallic Rh clusters. This structural evolution occurs because the reducing hydroformylation conditions (1:1:1 ethylene:CO:H2) drive the complete reduction of Rh species to Rh0 by 500 K, leading to cluster formation. This physical transformation is catalytically significant as it directly correlates with the detection of methanol in the product gas stream. Specifically, the formation of these Rh clusters under the 573 K reaction conditions enhances the catalytic pathway for CO hydrogenation, thereby producing the observed methanol. | Full credit for explaining that complete reduction to Rh0 leads to the formation of Rh clusters, which enhances the CO hydrogenation pathway and results in the production of methanol. |
Review
#1079
Rh/ZrO2
Rh K
▶
LLM Prompt
Sample Information
Material: Rh/ZrO2
Support: ZrO2
Reaction Conditions: 1:1:1 ethylene:CO:H2, 1 bar, 500 K
Sample-Specific Conditions
- temperature: 500 K
- Rh supported on ZrO2 synthesized via precipitation, under hydroformylation conditions at 500 K
Measurement
We plan to measure the Rh K XANES spectrum of this sample.
Questions
Based on all the information above:
1. What candidate reference spectra or basis components are required to model the Rh K-edge XANES spectrum of this sample during the temperature ramp using linear combination fitting?
2. Based on the reaction conditions (1:1:1 ethylene:CO:H2, 1 bar) and the temperature of 500 K, estimate the phase fractions of the oxidized and reduced Rh species on the ZrO2 support.
3. Explain the physical reasoning for the observed phase composition at 500 K and discuss how this state relates to the catalytic activity of the material under these conditions.
Ground Truth
Material: Rh/ZrO2 (synthesized via precipitation)
Measurement: Rh K-edge in situ XANES
Fit method: Linear combination analysis (LCA)
Phase fractions: (±10%)
| Phase | Fraction |
|---|---|
| Rh3+ (oxidized) | 0.2 |
| Rh0 (reduced) | 0.8 |
Fit basis (paper's reference spectra):
- Oxidized component (Rh3+)
- Reduced component (Rh0)
Source evidence: Figure 4(f) and text on page 12373
Key reasoning: Under the hydroformylation reaction mixture (ethylene:CO:H2) while heating to 500 K, the Rh species on ZrO2 undergo reduction from Rh3+ to Rh0. At 500 K, approximately 80% of the Rh is reduced, which coincides with the observation of propanal formation, indicating that the catalyst is active for hydroformylation at this stage. The reduction of Rh/ZrO2 occurs at a higher temperature compared to Rh/CeO2 but lower than Rh/MgO.
Reasoning source: Page 12373, Section 'In situ XAS investigations'
Scoring Rubric (total: 100 pts)
| Q | Type | Max | Question | Reference Answer | Scoring Criteria |
|---|---|---|---|---|---|
| q1 | identification | 20 | What candidate reference spectra or basis components are required to model the Rh K-edge XANES spectrum of this sample during the temperature ramp using linear combination fitting? | The required basis components for linear combination analysis of the Rh K-edge XANES spectrum are an oxidized component (Rh3+) and a reduced component (Rh0). These specific phases are expected because the Rh/ZrO2 sample is exposed to a hydroformylation reaction mixture (1:1:1 ethylene:CO:H2 at 1 bar) while being heated to 500 K. The reducing environment provided by the gas mixture drives the transition of the initially oxidized Rh species on the ZrO2 support to metallic Rh0. Consequently, both the initial Rh3+ state and the newly formed Rh0 state are necessary to accurately model the spectral changes during this temperature ramp. | Full points for identifying that both an oxidized Rh component (Rh3+) and a reduced Rh component (Rh0/metal) are needed. |
| q2 | quantification | 40 | Based on the reaction conditions (1:1:1 ethylene:CO:H2, 1 bar) and the temperature of 500 K, estimate the phase fractions of the oxidized and reduced Rh species on the ZrO2 support. | At 500 K under the specified conditions, the estimated phase fractions are 80% for the reduced Rh0 component and 20% for the oxidized Rh3+ component, with an uncertainty of 10%. These specific values result from the sample being exposed to the reducing hydroformylation gas mixture (ethylene:CO:H2) at 500 K, which drives the partial reduction of the Rh species. The ZrO2 support modulates this reducibility, causing the reduction to occur at a higher temperature than on CeO2 but lower than on MgO. Therefore, at exactly 500 K, the reduction is largely complete but leaves a 20% residual oxidized fraction alongside the 80% metallic fraction. | Full points for estimating ~80% reduced Rh (Rh0) and ~20% oxidized Rh (Rh3+). Partial credit for identifying that the sample is predominantly but not completely reduced. |
| q3 | reasoning | 40 | Explain the physical reasoning for the observed phase composition at 500 K and discuss how this state relates to the catalytic activity of the material under these conditions. | The observed phase composition of 80% Rh0 and 20% Rh3+ arises because the hydroformylation reaction mixture (ethylene:CO:H2) acts as a reducing agent as the Rh/ZrO2 catalyst is heated to 500 K. The specific support, ZrO2, influences this reduction process, requiring higher temperatures for reduction compared to Rh/CeO2 but lower than Rh/MgO. This predominantly reduced state at 500 K is directly linked to the onset of catalytic activity for the material. Specifically, the formation of this ~80% Rh0 phase coincides with the observation of propanal formation, indicating that the catalyst is actively driving the hydroformylation reaction under these conditions. | Full points for explaining that the reductive syngas/ethylene environment drives the reduction of Rh3+ to Rh0, and that at 500 K (where ~80% is reduced), the catalyst becomes active for hydroformylation, as evidenced by the formation of propanal. |
Review
#1080
Rh/MgO
Rh K
▶
LLM Prompt
Sample Information
Material: Rh/MgO
Support: MgO
Reaction Conditions: 1:1:1 ethylene:CO:H2, 1 bar, 573 K
Sample-Specific Conditions
- temperature: 573 K
- Rh supported on MgO synthesized via precipitation, under hydroformylation conditions at 573 K
Measurement
We plan to measure the Rh K XANES spectrum of this sample.
Questions
Based on all the information above:
1. What candidate reference spectra or basis components should be used for Linear Combination Fitting (LCF) of the operando Rh K-edge XANES data for this sample?
2. Based on the reaction conditions (573 K, 1:1:1 ethylene:CO:H2), estimate the phase fractions of the Rh species in the Rh/MgO catalyst.
3. Explain the physical reasoning behind the observed phase composition of Rh/MgO at 573 K under these reducing conditions, particularly in comparison to other supports like CeO2 or ZrO2.
Ground Truth
Material: Rh/MgO
Measurement: Rh K-edge operando XANES
Fit method: Linear combination analysis (LCA)
Phase fractions: (±10%)
| Phase | Fraction |
|---|---|
| Rh3+ (oxidized) | 0.6 |
| Rh0 (reduced) | 0.4 |
Fit basis (paper's reference spectra):
- oxidized component (Rh3+)
- reduced component (Rh0)
Source evidence: Figure 4(c) and 4(g), page 12373
Key reasoning: Under hydroformylation conditions (ethylene:CO:H2), the reduction of Rh depends strongly on the support. The reduction temperature follows the order Rh/MgO > Rh/ZrO2 > Rh/CeO2 > RhP/CeO2. At 573 K, Rh/MgO is the most resistant to reduction among the tested catalysts, reaching only about 40% reduction to Rh0, with the majority remaining in the oxidized Rh3+ state. This indicates a strong interaction with the basic MgO support, which also correlates with its lack of catalytic activity.
Reasoning source: Page 12373, 'In situ XAS investigations' section
Scoring Rubric (total: 100 pts)
| Q | Type | Max | Question | Reference Answer | Scoring Criteria |
|---|---|---|---|---|---|
| q1 | identification | 20 | What candidate reference spectra or basis components should be used for Linear Combination Fitting (LCF) of the operando Rh K-edge XANES data for this sample? | The basis components for Linear Combination Fitting (LCF) of the operando Rh K-edge XANES data should include an oxidized component (Rh3+) and a reduced component (Rh0). These specific phases are expected because the Rh species undergo partial reduction under the applied hydroformylation conditions (1:1:1 ethylene:CO:H2 at 1 bar and 573 K). The basic MgO support exhibits a strong interaction with the Rh, making it highly resistant to reduction compared to other supports. Consequently, the catalyst does not fully reduce at 573 K, necessitating both Rh3+ and Rh0 reference spectra to accurately capture the mixed oxidation state present in the sample. | Full points for identifying oxidized (Rh3+) and reduced (Rh0) components. |
| q2 | quantification | 40 | Based on the reaction conditions (573 K, 1:1:1 ethylene:CO:H2), estimate the phase fractions of the Rh species in the Rh/MgO catalyst. | The estimated phase fractions for the Rh/MgO catalyst are 60% oxidized Rh3+ and 40% reduced Rh0, with an uncertainty of approximately 10%. These specific values result from the strong interaction between the Rh and the basic MgO support, which makes the material highly resistant to reduction under the 1:1:1 ethylene:CO:H2 hydroformylation conditions. At 573 K, the reduction process is severely hindered because the reduction temperature requirement for Rh/MgO is much higher than for other typical supports. As a result, the catalyst reaches only about 40% reduction to metallic Rh0, leaving the majority (60%) trapped in the oxidized Rh3+ state. | Full points for estimating ~60% oxidized (Rh3+) and ~40% reduced (Rh0). Partial credit for identifying that it is a mixture with a significant oxidized fraction remaining. |
| q3 | reasoning | 40 | Explain the physical reasoning behind the observed phase composition of Rh/MgO at 573 K under these reducing conditions, particularly in comparison to other supports like CeO2 or ZrO2. | The observed phase composition of 60% Rh3+ and 40% Rh0 arises because the reduction of Rh under hydroformylation conditions (ethylene:CO:H2) depends strongly on the support material. The basic MgO support interacts very strongly with the Rh species, making it the most resistant to reduction among the tested catalysts. Consequently, the required reduction temperature follows the order Rh/MgO > Rh/ZrO2 > Rh/CeO2 > RhP/CeO2. At 573 K, this strong interaction prevents full reduction compared to the more easily reduced CeO2 or ZrO2 supports, leaving the majority of Rh in the oxidized state, which also correlates with the Rh/MgO catalyst's lack of activity. | Full points for mentioning that MgO is a basic support that makes Rh highly resistant to reduction (highest reduction temperature among tested supports), resulting in incomplete reduction even at 573 K, which correlates with its lack of catalytic activity. |
Review
The effect of the nature of supports on the selective reduction of CO 2 to CO catalysed by a supported single-site heterobimetallic iron–potassium complex
ESRF-BM23
Catalyst
Abdulrahman Adamu Isah et al.
DOI: 10.1039/d5nj03345d
1 scenario
▶
#1081
FeK/ZrO2
Fe K
▶
LLM Prompt
Sample Information
Material: FeK/ZrO2
Support: ZrO2
Sample-Specific Conditions
- State: Fresh
- Freshly grafted heterobimetallic iron-potassium complex on zirconia
Measurement
We plan to measure the Fe K XANES spectrum of this sample.
Questions
Based on all the information above:
1. Based on the sample preparation (freshly grafted heterobimetallic iron-potassium complex on zirconia), what is the expected dominant phase, oxidation state, and local coordination geometry of the Fe sites?
2. Describe the specific characteristics of the pre-edge feature expected in the Fe K-edge XANES spectrum for this sample, including its relative energy position and normalized intensity.
3. What physical interpretation is drawn from the specific pre-edge intensity and position observed for this sample?
Ground Truth
Material: FeK/ZrO2-250
Measurement: Fe K-edge transmission mode, ESRF BM23
Fit method: pre-edge analysis
Phase fractions: (±5%)
| Phase | Fraction |
|---|---|
| Fe(II) single site | 1.0 |
Source evidence: Section 3.1.2, Figure S6
Key reasoning: The XANES of FeK/ZrO2-250 shows a pre-edge at + 1.2 (± 0.2) eV from the Fe(0) edge with a maximum normalized intensity of 0.10. This suggests that the Fe sites in the supported complex are in a distorted tetrahedral coordination with an iron oxidation state of +2. EPR spectroscopy also confirms the oxidation state is predominantly Fe(II) with < 0.02% Fe(III).
Reasoning source: Section 3.1.2
Scoring Rubric (total: 100 pts)
| Q | Type | Max | Question | Reference Answer | Scoring Criteria |
|---|---|---|---|---|---|
| q1 | identification | 30 | Based on the sample preparation (freshly grafted heterobimetallic iron-potassium complex on zirconia), what is the expected dominant phase, oxidation state, and local coordination geometry of the Fe sites? | The expected dominant phase is a supported monomeric Fe(II) single site, which accounts for 1.0 (100%) of the iron species. The oxidation state of the iron is +2, and the local coordination geometry is a distorted tetrahedral environment. These characteristics arise directly from the sample conditions, where the heterobimetallic iron-potassium complex is freshly grafted onto the zirconia support. This specific grafting process yields the monomeric single-site structure, while XANES pre-edge analysis and EPR spectroscopy (showing < 0.02% Fe(III)) confirm that the iron predominantly maintains its +2 oxidation state and distorted tetrahedral coordination after immobilization. | Full points for identifying a monomeric/single-site Fe(II) species in a distorted tetrahedral coordination geometry. |
| q2 | spectral | 40 | Describe the specific characteristics of the pre-edge feature expected in the Fe K-edge XANES spectrum for this sample, including its relative energy position and normalized intensity. | The Fe K-edge XANES spectrum for this sample features a distinct pre-edge peak located at +1.2 (± 0.2) eV relative to the Fe(0) edge. This pre-edge peak exhibits a maximum normalized intensity of 0.10. These specific spectral features arise directly from the sample conditions, specifically the fresh grafting of the heterobimetallic iron-potassium complex onto the zirconia support. This preparation yields a supported monomeric Fe(II) single site in a distorted tetrahedral coordination, and it is this specific geometry and +2 oxidation state that produce the characteristic pre-edge energy position and relatively high intensity. | Full points for stating the pre-edge is located at +1.2 (± 0.2) eV from the Fe(0) edge with a maximum normalized intensity of 0.10. |
| q3 | reasoning | 30 | What physical interpretation is drawn from the specific pre-edge intensity and position observed for this sample? | The specific pre-edge position at +1.2 (± 0.2) eV from the Fe(0) edge and its normalized intensity of 0.10 indicate that the iron sites are in a distorted tetrahedral coordination with an oxidation state of +2. This physical interpretation directly reflects the sample's preparation as a freshly grafted heterobimetallic iron-potassium complex on zirconia. The grafting of this specific complex onto the support yields a supported monomeric Fe(II) single site, which dictates this local structural and electronic environment. Furthermore, this structural interpretation of a predominant +2 oxidation state is corroborated by EPR spectroscopy, which confirms the presence of less than 0.02% Fe(III) in the sample. | Full points for explaining that the pre-edge features indicate the Fe sites are in a distorted tetrahedral coordination with an oxidation state of +2. |
Review
Correlative analysis of Ni( ii ) coordination states in molten salts using a combination of X-ray and optical spectroscopies and simulations
BNL-NSLS-II-8-ID
Synthesis
Yang Liu et al.
DOI: 10.1039/d5sc01059d
3 scenarios
▶
#1082
NiCl2 in LiCl-KCl
Ni K
▶
LLM Prompt
Sample Information
Material: NiCl2 in LiCl-KCl
Method: melt mixing
Precursors: NiCl2, LiCl, KCl
Temperature C: 350
Duration Hours: 3
Atmosphere: argon
Sample-Specific Conditions
- temperature: 350 °C
- 1 wt% NiCl2 dissolved in LiCl-KCl (58-42 mol%) molten salt at 350 °C
Preparation
- A stock mixture of 1 wt% NiCl2 in each chloride salt mixture was prepared using a glassy carbon crucible. The NiCl2-loaded salt mixture was melted and held at 500 °C for 3 hours to ensure complete homogeneity.
Measurement
We plan to measure the Ni K XANES spectrum of this sample.
Questions
Based on all the information above:
1. What candidate reference spectra or structural components are needed to model the Ni K-edge XANES of this sample across its phase transitions?
2. Estimate the phase fractions of the structural components for the 1 wt% NiCl2 in LiCl-KCl sample at 350 °C.
3. Explain the physical reasoning for the dominant coordination environment of Ni at 350 °C in this specific salt mixture.
Ground Truth
Material: NiCl2 in LiCl-KCl
Measurement: Ni K-edge XANES in transmission mode
Fit method: Principal Component Analysis (PCA) and Linear Combination Fitting (LCF)
Phase fractions: (±10%)
| Phase | Fraction |
|---|---|
| Component S1 | 0.95 |
| Component S2 | 0.05 |
| Component S3 | 0.0 |
Fit basis (paper's reference spectra):
- Component S1 (solid-like octahedral Ni2+)
- Component S2 (liquid-like tetrahedral [NiCl4]2-)
- Component S3 (intermediate/distorted coordination)
Source evidence: Figure 3
Key reasoning: At 350 °C, the temperature is just below the melting point of the LiCl-KCl eutectic mixture (353 °C). Consequently, the system remains predominantly in the solid state, where Ni2+ adopts an octahedral coordination environment (Component S1). The minor presence of Component S2 indicates slight localized premelting or defects beginning to form tetrahedral [NiCl4]2- complexes.
Reasoning source: Results and Discussion section
Scoring Rubric (total: 100 pts)
| Q | Type | Max | Question | Reference Answer | Scoring Criteria |
|---|---|---|---|---|---|
| q1 | identification | 30 | What candidate reference spectra or structural components are needed to model the Ni K-edge XANES of this sample across its phase transitions? | To model the Ni K-edge XANES of this sample, the required structural components are Component S1 (solid-like octahedral Ni2+), Component S2 (liquid-like tetrahedral [NiCl4]2-), and Component S3 (intermediate/distorted coordination). These specific components are needed because the 1 wt% NiCl2 in LiCl-KCl (58-42 mol%) system undergoes a structural transition near its eutectic melting point of 353 °C. At the measurement temperature of 350 °C, the sample is just below this melting point, meaning it is predominantly solid where Ni2+ adopts an octahedral geometry (Component S1). However, localized premelting or defects introduce minor amounts of tetrahedral [NiCl4]2- complexes (Component S2), necessitating a basis set that captures both solid-like and liquid-like coordination environments. | Full credit for identifying the need for components representing solid-like octahedral Ni2+ and liquid-like tetrahedral [NiCl4]2-. Partial credit for mentioning only one. |
| q2 | quantification | 30 | Estimate the phase fractions of the structural components for the 1 wt% NiCl2 in LiCl-KCl sample at 350 °C. | At 350 °C, the estimated phase fractions for the 1 wt% NiCl2 in LiCl-KCl sample are 0.95 for Component S1 (solid-like octahedral Ni2+), 0.05 for Component S2 (liquid-like tetrahedral [NiCl4]2-), and 0.0 for Component S3, with an uncertainty of 10%. These specific values result from the sample temperature of 350 °C being just below the 353 °C melting point of the LiCl-KCl eutectic mixture. Because the system is still predominantly in the solid state, the vast majority (95%) of the Ni2+ ions remain trapped in an octahedral coordination environment. The small 5% fraction of the tetrahedral Component S2 arises due to slight localized premelting or defect formation in the salt matrix just before the bulk melting transition. | Full credit for estimating ~95% Component S1 (octahedral) and ~5% Component S2 (tetrahedral). Deduct points if the dominant phase is incorrectly identified or if fractions deviate by more than 15%. |
| q3 | reasoning | 40 | Explain the physical reasoning for the dominant coordination environment of Ni at 350 °C in this specific salt mixture. | The dominant coordination environment for Ni at 350 °C in the 1 wt% NiCl2 in LiCl-KCl (58-42 mol%) mixture is solid-like octahedral Ni2+ (Component S1). This occurs because the measurement temperature of 350 °C is strictly below the 353 °C melting point of the LiCl-KCl eutectic mixture. Consequently, the bulk salt matrix remains in the solid state, forcing the dissolved Ni2+ ions to adopt the octahedral coordination characteristic of the solid lattice. The minor presence of tetrahedral [NiCl4]2- complexes is physically driven by slight localized premelting or defect formation as the system closely approaches the eutectic melting temperature. | Full credit for explaining that 350 °C is below the LiCl-KCl eutectic melting point (353 °C), causing the system to remain mostly solid with Ni2+ in an octahedral geometry, with minor premelting. |
Review
#1083
NiCl2 in NaCl-MgCl2
Ni K
▶
LLM Prompt
Sample Information
Material: NiCl2 in NaCl-MgCl2
Method: melt mixing
Precursors: NiCl2, NaCl, MgCl2
Temperature C: 450
Duration Hours: 3
Atmosphere: argon
Sample-Specific Conditions
- temperature: 450 °C
- 1 wt% NiCl2 dissolved in NaCl-MgCl2 (56-44 mol%) molten salt at 450 °C
Preparation
- A stock mixture of 1 wt% NiCl2 in each chloride salt mixture was prepared using a glassy carbon crucible. The NiCl2-loaded salt mixture was melted and held at 500 °C for 3 hours to ensure complete homogeneity.
Measurement
We plan to measure the Ni K XANES spectrum of this sample.
Questions
Based on all the information above:
1. Based on the sample conditions (NiCl2 in NaCl-MgCl2 molten salt), what are the expected coordination environments for Ni2+ that should be used as basis functions or reference spectra for Linear Combination Fitting (LCF) of the XANES data?
2. Estimate the relative phase fractions of the octahedral and tetrahedral Ni2+ components in the NaCl-MgCl2 melt at 450 °C.
3. Explain the physical and chemical reasoning for why this specific coordination environment dominates at 450 °C in the NaCl-MgCl2 melt. How does the presence of Mg2+ influence the Ni2+ speciation?
Ground Truth
Material: 1 wt% NiCl2 in NaCl-MgCl2
Measurement: Ni K-edge XANES in transmission/fluorescence mode
Fit method: Linear Combination Fitting (LCF) / MCR-ALS
Phase fractions: (±10%)
| Phase | Fraction |
|---|---|
| Component S1 | 0.85 |
| Component S2 | 0.15 |
Fit basis (paper's reference spectra):
- Component S1 (octahedral [NiCl6]4- coordination)
- Component S2 (tetrahedral [NiCl4]2- coordination)
Source evidence: Figure 3 and text discussing speciation at 450 °C
Key reasoning: In the NaCl-MgCl2 melt, the highly polarizing Mg2+ cations compete strongly for chloride ions, reducing the availability of free chloride in the melt compared to pure alkali chloride systems. This chloride-deficient environment stabilizes the octahedral [NiCl6]4- complex (Component S1) as the dominant species at 450 °C. The tetrahedral [NiCl4]2- complex (Component S2) is present only as a minor fraction at this temperature, though its proportion gradually increases at higher temperatures due to thermal expansion and entropy effects.
Reasoning source: Results and Discussion section on temperature and melt composition dependence
Scoring Rubric (total: 100 pts)
| Q | Type | Max | Question | Reference Answer | Scoring Criteria |
|---|---|---|---|---|---|
| q1 | identification | 30 | Based on the sample conditions (NiCl2 in NaCl-MgCl2 molten salt), what are the expected coordination environments for Ni2+ that should be used as basis functions or reference spectra for Linear Combination Fitting (LCF) of the XANES data? | The expected coordination environments for Ni2+ to be used as basis functions for Linear Combination Fitting are Component S1, representing octahedral [NiCl6]4- coordination, and Component S2, representing tetrahedral [NiCl4]2- coordination. These specific phases are expected because the sample consists of 1 wt% NiCl2 dissolved in a NaCl-MgCl2 (56-44 mol%) molten salt at 450 °C. In this specific melt composition, the highly polarizing Mg2+ cations strongly compete for chloride ions, creating a chloride-deficient environment relative to pure alkali chloride melts. This competitive chemical environment stabilizes the octahedral [NiCl6]4- complex as the primary species, while the tetrahedral [NiCl4]2- complex exists only as a minor component at this temperature. | Award 15 points for identifying an octahedral Ni2+ chloride complex (e.g., [NiCl6]4- or Component S1) and 15 points for identifying a tetrahedral Ni2+ chloride complex (e.g., [NiCl4]2- or Component S2). |
| q2 | quantification | 30 | Estimate the relative phase fractions of the octahedral and tetrahedral Ni2+ components in the NaCl-MgCl2 melt at 450 °C. | At 450 °C, the estimated relative phase fractions are 0.85 (85%) for the octahedral [NiCl6]4- component (Component S1) and 0.15 (15%) for the tetrahedral [NiCl4]2- component (Component S2), with an uncertainty of 10%. These specific values result directly from the 450 °C measurement temperature and the 56-44 mol% NaCl-MgCl2 melt composition. The highly polarizing Mg2+ cations in the melt compete strongly for chloride ions, reducing the availability of free chloride and thereby stabilizing the octahedral [NiCl6]4- complex as the heavily dominant 85% fraction. The tetrahedral [NiCl4]2- complex is restricted to a minor 15% fraction at 450 °C, though its proportion would gradually increase at higher temperatures due to thermal expansion and entropy effects. | Award 30 points if the response correctly estimates that the octahedral component (Component S1) is highly dominant (~80-90%) and the tetrahedral component (Component S2) is a minor fraction (~10-20%). Award 15 points if the correct dominant phase is identified but fractions are off by more than 20%. |
| q3 | reasoning | 40 | Explain the physical and chemical reasoning for why this specific coordination environment dominates at 450 °C in the NaCl-MgCl2 melt. How does the presence of Mg2+ influence the Ni2+ speciation? | The octahedral [NiCl6]4- coordination environment dominates at 450 °C due to the specific competitive ionic interactions within the 56-44 mol% NaCl-MgCl2 molten salt. The presence of Mg2+ strongly influences Ni2+ speciation because Mg2+ cations are highly polarizing and compete aggressively for chloride ions. This competition significantly reduces the availability of free chloride in the melt compared to pure alkali chloride systems, creating a chloride-deficient environment. Consequently, this environment stabilizes the octahedral [NiCl6]4- complex as the dominant species at 450 °C. The alternative tetrahedral [NiCl4]2- complex remains a minor species at this temperature, as its formation is more favored by higher temperatures where thermal expansion and entropy effects become more pronounced. | Award 20 points for explaining that Mg2+ is highly polarizing and competes strongly for chloride ions (reducing free Cl- availability). Award 20 points for connecting this chloride-deficient environment to the stabilization of the octahedral [NiCl6]4- complex over the tetrahedral complex at this temperature. |
Review
#1084
NiCl2 in LiCl-ZnCl2
Ni K
▶
LLM Prompt
Sample Information
Material: NiCl2 in LiCl-ZnCl2
Method: melt mixing
Precursors: NiCl2, LiCl, ZnCl2
Temperature C: 600
Duration Hours: 3
Atmosphere: argon
Sample-Specific Conditions
- temperature: 600 °C
- 1 wt% NiCl2 dissolved in LiCl-ZnCl2 (22-78 mol%) molten salt at 600 °C
Preparation
- A stock mixture of 1 wt% NiCl2 in each chloride salt mixture was prepared using a glassy carbon crucible. The NiCl2-loaded salt mixture was melted and held at 500 °C for 3 hours to ensure complete homogeneity.
Measurement
We plan to measure the Ni K XANES spectrum of this sample.
Questions
Based on all the information above:
1. Based on the sample conditions (1 wt% NiCl2 in LiCl-ZnCl2 at 600 °C), what is the dominant phase or spectral component present in the melt?
2. What does the phase fraction of Component S1 indicate about the speciation of Ni in this specific molten salt mixture at 600 °C?
3. If performing a component analysis on the Ni K-edge XANES data for this sample, what basis function or reference is required to fit the spectrum?
Ground Truth
Material: NiCl2 in LiCl-ZnCl2
Measurement: Ni K XANES
Fit method: not reported
Phase fractions: (±10%)
| Phase | Fraction |
|---|---|
| Component S1 | 1.0 |
Fit basis (paper's reference spectra):
- Component S1
Source evidence: Sample Information and Phase Fractions data
Key reasoning: At 600 °C, the 1 wt% NiCl2 dissolved in the LiCl-ZnCl2 (22-78 mol%) molten salt exists entirely as a single structural motif or species, designated as Component S1. This indicates that the specific temperature and melt composition stabilize a uniform coordination environment for the Ni ions.
Reasoning source: Sample-Specific Conditions and Phase Fractions
Scoring Rubric (total: 100 pts)
| Q | Type | Max | Question | Reference Answer | Scoring Criteria |
|---|---|---|---|---|---|
| q1 | identification | 30 | Based on the sample conditions (1 wt% NiCl2 in LiCl-ZnCl2 at 600 °C), what is the dominant phase or spectral component present in the melt? | The dominant spectral component present in the melt is Component S1, which accounts for 1.0 (100%) of the sample. This single-phase composition arises because the specific sample conditions—1 wt% NiCl2 dissolved in a LiCl-ZnCl2 (22-78 mol%) molten salt mixture at 600 °C under an argon atmosphere—stabilize a uniform coordination environment for the Ni ions. The combination of this specific temperature and melt composition ensures that the dissolved NiCl2 exists entirely as a single structural motif. Consequently, no other secondary phases or species are expected in the melt. | Full points if the answer identifies that the sample is 100% represented by a single component (Component S1). |
| q2 | reasoning | 40 | What does the phase fraction of Component S1 indicate about the speciation of Ni in this specific molten salt mixture at 600 °C? | The phase fraction of 1.0 (100%) for Component S1 indicates that the speciation of Ni is completely uniform in this specific molten salt mixture. Under the conditions of 1 wt% NiCl2 dissolved in a LiCl-ZnCl2 (22-78 mol%) melt at 600 °C, the specific temperature and chloride salt composition work together to stabilize a single structural motif. Because the sample was thoroughly melt-mixed to ensure complete homogeneity, the Ni ions do not partition into multiple coordination environments. Therefore, the entire Ni content exists exclusively as the single, distinct species designated as Component S1. | Full points if the answer explains that Ni exists entirely as a single homogeneous species, uniform coordination environment, or single structural motif (Component S1) under these temperature and composition conditions. |
| q3 | prediction | 30 | If performing a component analysis on the Ni K-edge XANES data for this sample, what basis function or reference is required to fit the spectrum? | To fit the Ni K-edge XANES spectrum for this sample, only a single basis function designated as Component S1 is required. This single-component fit is dictated by the sample conditions, specifically the 1 wt% NiCl2 dissolved in a LiCl-ZnCl2 (22-78 mol%) molten salt at 600 °C. These specific temperature and melt composition parameters stabilize a completely uniform coordination environment for the Ni ions, resulting in a 100% phase fraction for Component S1. As a result, the entire XANES signal originates from this single structural motif, meaning no additional reference spectra are needed to accurately model the data. | Full points if the answer states that the spectrum is entirely described by Component S1. |
Review
Cobalt promotion of the InO x –TiO 2 heterojunction for dual photothermal reduction of CO 2
BNL-NSLS-II-8-ID
Catalyst
Rocío Sayago-Carro et al.
DOI: 10.1039/d5ta07547e
3 scenarios
▶
#1085
2.5In-4Co-TiO2
Co K-edge
▶
LLM Prompt
Sample Information
Material: 2.5In-4Co-TiO2
Support: TiO2 (anatase)
Sample-Specific Conditions
- Indium content: 2.5 mol%
- 2.5 mol% In, 4 mol% Co on TiO2 anatase, initial state
Measurement
We plan to measure the Co K-edge XANES spectrum of this sample.
Questions
Based on all the information above:
1. What candidate reference spectra are needed to evaluate the oxidation state and phase composition of the cobalt species in this 2.5In-4Co-TiO2 catalyst?
2. Based on the sample conditions (2.5 mol% In, 4 mol% Co on TiO2 anatase, initial state), estimate the relative fractions of Co(II) and Co(III) species present.
3. Explain the physical reasoning for why the cobalt species in this catalyst exhibit an intermediate oxidation state rather than forming a pure bulk oxide phase.
Ground Truth
Material: 2.5In-Co-Ti
Measurement: Co K-edge, fluorescence mode, 8-ID beamline at NSLS-II
Fit method: Integral method
Phase fractions:
| Phase | Fraction |
|---|---|
| Co(II) | 0.43 |
| Co(III) | 0.57 |
Fit basis (paper's reference spectra):
- CoO
- Co2O3
- metallic Co
Source evidence: Page 7, Section 3.2, Figure 3B
Key reasoning: The Co K-edge XANES spectrum exhibits a higher white line intensity compared to CoO and Co2O3 references, indicating an increased covalent character of the Co(3d)-O(2p) interaction typical of sub-nanometric or isolated Co species. Using the integral method, the average oxidation state was determined to be 2.57, corresponding to a mixture of Co(II) and Co(III). This intermediate oxidation state is attributed to the limited size of the cobalt entities and their specific, highly defective local environments on the titania surface.
Reasoning source: Page 7, Section 3.2
Scoring Rubric (total: 101 pts)
| Q | Type | Max | Question | Reference Answer | Scoring Criteria |
|---|---|---|---|---|---|
| q1 | identification | 25 | What candidate reference spectra are needed to evaluate the oxidation state and phase composition of the cobalt species in this 2.5In-4Co-TiO2 catalyst? | To evaluate the oxidation state and phase composition of the cobalt species in the 2.5In-4Co-TiO2 catalyst, the required candidate reference spectra are CoO, Co2O3, and metallic Co. These specific references are necessary because, in its initial state on the TiO2 anatase support, the 4 mol% Co does not form a single bulk oxide. Instead, the limited size of the cobalt entities and their highly defective local environments on the titania surface result in a mixture of oxidation states. Using these references allows for the accurate modeling of this intermediate state and the increased covalent character of the Co(3d)-O(2p) interactions typical of such sub-nanometric or isolated species. | Full credit for identifying CoO (for Co(II)), Co2O3 (for Co(III)), and metallic Co (for Co(0)) as the necessary reference standards. |
| q2 | quantification | 38 | Based on the sample conditions (2.5 mol% In, 4 mol% Co on TiO2 anatase, initial state), estimate the relative fractions of Co(II) and Co(III) species present. | Based on the initial state of the 2.5In-4Co-TiO2 catalyst, the estimated relative fractions are 0.43 for Co(II) and 0.57 for Co(III). These specific values, which correspond to an average oxidation state of 2.57 determined via the integral method, result directly from the sample's composition of 4 mol% Co dispersed on a TiO2 anatase support. At this loading, the cobalt exists as sub-nanometric or isolated entities rather than bulk phases. The highly defective local environments on the titania surface stabilize this exact mixture of Co(II) and Co(III), which is evidenced by an increased covalent character of the Co(3d)-O(2p) interaction and a higher white line intensity in the XANES spectrum. | Full credit for estimating approximately 43% Co(II) and 57% Co(III) (or an average oxidation state of ~2.57). Partial credit for identifying a mixed Co(II)/Co(III) state without exact fractions. |
| q3 | reasoning | 38 | Explain the physical reasoning for why the cobalt species in this catalyst exhibit an intermediate oxidation state rather than forming a pure bulk oxide phase. | The cobalt species in the 2.5In-4Co-TiO2 catalyst exhibit an intermediate oxidation state of 2.57 because of the limited size of the cobalt entities and their highly defective local environments on the titania surface. Given the sample conditions of 4 mol% Co dispersed on TiO2 anatase in its initial state, the cobalt remains as sub-nanometric or isolated species rather than aggregating into pure bulk oxide phases. This specific dispersion on the support alters the electronic structure, stabilizing a mixture of Co(II) and Co(III). Consequently, this structural configuration causes an increased covalent character of the Co(3d)-O(2p) interaction, which is observed in the Co K-edge XANES spectrum as a higher white line intensity compared to standard CoO and Co2O3 references. | Full credit for explaining that the intermediate oxidation state is due to the limited size of the cobalt entities (sub-nanometric/isolated species) and their highly defective specific local environments on the titania surface. |
Review
#1086
10In-4Co-TiO2
Co K-edge
▶
LLM Prompt
Sample Information
Material: 10In-4Co-TiO2
Support: TiO2 (anatase)
Sample-Specific Conditions
- Indium content: 10 mol%
- 10 mol% In, 4 mol% Co on TiO2 anatase, initial state
Measurement
We plan to measure the Co K-edge XANES spectrum of this sample.
Questions
Based on all the information above:
1. What candidate reference spectra should be used to evaluate the oxidation state of cobalt in this 10In-4Co-TiO2 catalyst via XANES analysis?
2. Estimate the relative fractions of Co(II) and Co(III) species in the initial state of this 10In-4Co-TiO2 catalyst.
3. Explain the physical and structural reasons why the cobalt species in this catalyst exhibit an intermediate oxidation state (mixture of Co(II) and Co(III)) rather than forming pure bulk oxide phases.
Ground Truth
Material: 10In-Co-Ti
Measurement: Co K-edge XANES, fluorescence mode, 8-ID beamline at NSLS-II
Fit method: Integral method
Phase fractions:
| Phase | Fraction |
|---|---|
| Co(II) | 0.76 |
| Co(III) | 0.24 |
Fit basis (paper's reference spectra):
- CoO
- Co2O3
- metallic Co
Source evidence: Page 7, Section 3.2
Key reasoning: The Co K-edge XANES spectra exhibit a higher intensity of the white line compared to CoO and Co2O3 references, indicating an increased degree of covalent character of the Co(3d)-O(2p) interaction characteristic of sub-nanometric and/or isolated Co(II) type species. Using the integral method, the 10In-Co-Ti sample was determined to have an intermediate oxidation state of 2.24 (corresponding to 76% Co(II) and 24% Co(III)). This intermediate state is attributed to the limited size of the cobalt entities and their specific local environments, which are strongly defective in both structure and electronic structure.
Reasoning source: Section 3.2 Structural and electronic analysis of In and Co components, Page 7
Scoring Rubric (total: 100 pts)
| Q | Type | Max | Question | Reference Answer | Scoring Criteria |
|---|---|---|---|---|---|
| q1 | identification | 20 | What candidate reference spectra should be used to evaluate the oxidation state of cobalt in this 10In-4Co-TiO2 catalyst via XANES analysis? | The candidate reference spectra that should be used to evaluate the cobalt oxidation state are CoO, Co2O3, and metallic Co. These specific references are necessary because the 4 mol% Co loading on the TiO2 anatase support in the initial state forms sub-nanometric and/or isolated cobalt entities rather than pure bulk phases. Due to their limited size, these entities possess specific local environments that are strongly defective in both structure and electronic structure, leading to an intermediate oxidation state. Consequently, a basis set of Co(II), Co(III), and metallic Co is required to accurately model the mixed oxidation state and the increased covalent character of the Co(3d)-O(2p) interactions present in the sample. | Full points for identifying CoO (Co(II) reference), Co2O3 (Co(III) reference), and metallic Co. |
| q2 | quantification | 30 | Estimate the relative fractions of Co(II) and Co(III) species in the initial state of this 10In-4Co-TiO2 catalyst. | In the initial state of the 10In-4Co-TiO2 catalyst, the relative fractions are 76% Co(II) and 24% Co(III), which corresponds to an average intermediate oxidation state of 2.24. These specific values result from the 4 mol% Co and 10 mol% In loading on the TiO2 anatase support, which restricts the cobalt to sub-nanometric and/or isolated entities. The limited size of these cobalt species creates specific local environments that are strongly defective in both their physical and electronic structures. This defective nature increases the covalent character of the Co(3d)-O(2p) interactions—visible as a higher white line intensity in the XANES spectra—and stabilizes this specific 76:24 mixture of Co(II) and Co(III) rather than a single oxidation state. | Full points for estimating approximately 76% Co(II) and 24% Co(III), or stating an average oxidation state of ~2.24. |
| q3 | reasoning | 50 | Explain the physical and structural reasons why the cobalt species in this catalyst exhibit an intermediate oxidation state (mixture of Co(II) and Co(III)) rather than forming pure bulk oxide phases. | The cobalt species in the 10In-4Co-TiO2 catalyst exhibit an intermediate oxidation state of 2.24 (76% Co(II) and 24% Co(III)) primarily due to the limited size of the cobalt entities formed on the TiO2 anatase support. At the specific sample conditions of 4 mol% Co and 10 mol% In, the cobalt disperses into sub-nanometric and/or isolated Co(II)-type species rather than aggregating into bulk oxides. These highly dispersed species possess specific local environments that are strongly defective in both their physical and electronic structures. This defective, isolated nature leads to an increased degree of covalent character in the Co(3d)-O(2p) interactions, which manifests as a higher white line intensity in the XANES spectra and prevents the formation of pure bulk CoO or Co2O3 phases. | Full points for mentioning the limited size of the cobalt entities (sub-nanometric/isolated species), their specific local environments on the TiO2 support, and the highly defective nature of these structures leading to an intermediate oxidation state. |
Review
#1087
xIn-4Co-TiO2
In K-edge
▶
LLM Prompt
Sample Information
Material: xIn-4Co-TiO2
Support: TiO2 (anatase)
Sample-Specific Conditions
- Element edge: In K-edge
- x mol% In, 4 mol% Co on TiO2 anatase, initial state (representative for all In loadings)
Measurement
We plan to measure the In K-edge XANES spectrum of this sample.
Questions
Based on all the information above:
1. Based on the sample conditions (xIn-4Co-TiO2, initial state), what is the expected oxidation state of Indium, and what reference material would be most appropriate to confirm this state via XANES?
2. Describe the expected edge position for the In K-edge XANES spectrum of this sample. How does this feature change as the Indium loading increases from 2.5 mol% to 20 mol%?
3. Explain why the In K-edge XANES spectra for the xIn-4Co-TiO2 series exhibit an invariant absorption edge energy, and what this implies about the chemical nature of the Indium species compared to bulk indium oxide.
Ground Truth
Material: xIn-Co-Ti (x = 2.5 to 20 mol%)
Measurement: In K-edge XANES in fluorescence mode at the 7-BM beamline
Fit method: Qualitative fingerprinting (no explicit LCF reported for In K-edge XANES)
Phase fractions:
| Phase | Fraction |
|---|---|
| In(III) | 1.0 |
Fit basis (paper's reference spectra):
- In2O3
- In foil
Source evidence: Page 7, Section 3.2, Figure 3F
Key reasoning: The In 3p3/2 XPS peak maximum is located at a binding energy of 665.0 eV, remaining unchanged throughout the series of catalysts, which corresponds to an In(III) oxidation state. This is corroborated by the XANES fingerprints in the In K-edge spectra. For all samples, the XANES spectra exhibit an invariant absorption edge energy of ca. 27 938.0 eV, which is the same binding energy obtained for the pure indium oxide reference.
Reasoning source: Page 7, Section 3.2
Scoring Rubric (total: 100 pts)
| Q | Type | Max | Question | Reference Answer | Scoring Criteria |
|---|---|---|---|---|---|
| q1 | identification | 30 | Based on the sample conditions (xIn-4Co-TiO2, initial state), what is the expected oxidation state of Indium, and what reference material would be most appropriate to confirm this state via XANES? | The expected oxidation state of Indium in the initial state of the xIn-4Co-TiO2 sample is In(III), representing a fraction of 1.0. The most appropriate reference material to confirm this state via XANES is pure In2O3, with In foil used as a baseline comparison. This fully oxidized state is expected because the initial sample conditions result in the formation of sub-nanometric to nanometric indium oxide-type species dispersed on the TiO2 anatase support. The stability of this In(III) phase across all indium loadings (x = 2.5 to 20 mol%) is corroborated by an invariant In 3p3/2 XPS peak at 665.0 eV, indicating that the chemical environment of the indium remains constant regardless of its concentration on the support. | Full credit for identifying the In(III) oxidation state and suggesting In2O3 as the appropriate reference material. |
| q2 | spectral | 35 | Describe the expected edge position for the In K-edge XANES spectrum of this sample. How does this feature change as the Indium loading increases from 2.5 mol% to 20 mol%? | The expected In K-edge absorption edge position for the xIn-4Co-TiO2 sample is approximately 27,938.0 eV. As the Indium loading increases from 2.5 mol% to 20 mol%, this absorption edge energy remains completely invariant. This spectral feature arises because the indium consistently forms stable, sub-nanometric to nanometric In(III) oxide-type species on the TiO2 anatase support, regardless of the concentration. Because the fully oxidized In(III) electronic environment does not change with loading, the resulting spectral shape and edge position perfectly match the pure In2O3 reference spectrum across the entire series. | Full credit for stating the edge position is approximately 27 938.0 eV and noting that it remains invariant (unchanged) across all indium loadings. |
| q3 | reasoning | 35 | Explain why the In K-edge XANES spectra for the xIn-4Co-TiO2 series exhibit an invariant absorption edge energy, and what this implies about the chemical nature of the Indium species compared to bulk indium oxide. | The In K-edge XANES spectra for the xIn-4Co-TiO2 series exhibit an invariant absorption edge energy of ca. 27,938.0 eV because the indium consistently forms a stable In(III) oxidation state on the TiO2 anatase support. Even as the indium loading varies from 2.5 to 20 mol%, the indium deposits as sub-nanometric to nanometric oxide-type species that maintain a constant electronic environment. This implies that the chemical nature of these dispersed nanoscale indium species is electronically identical to bulk indium oxide (In2O3). This conclusion is directly supported by the fact that the XANES edge position perfectly matches the pure In2O3 reference, which is further corroborated by an unchanging In 3p3/2 XPS peak at 665.0 eV. | Full credit for explaining that the invariant edge energy (matching pure In2O3) indicates that the Indium species strictly maintain an In(III) oxidation state across all loadings, corroborating XPS findings. |
Review
Cobalt–niobium co-doping of indium oxide: structural and adsorption/catalytic properties for CO 2 valorization
BNL-NSLS-II-8-ID
Catalyst
Luis José Jiménez-Chavarriga et al.
DOI: 10.1039/d5ta08707d
3 scenarios
▶
#1088
In2O3
In K-edge
▶
LLM Prompt
Sample Information
Material: In2O3
Sample-Specific Conditions
- doping: none
- Bare indium oxide reference sample
Measurement
We plan to measure the In K-edge XANES spectrum of this sample.
Questions
Based on all the information above:
1. Based on the sample conditions, what is the expected oxidation state of Indium and the dominant phase present in this bare reference sample?
2. Describe the expected spectral features of the In K-edge XANES for this sample, specifically mentioning the edge position.
3. What does the In K-edge XANES spectrum of this bare oxide reference sample establish regarding the local environment of Indium when compared to doped samples?
Ground Truth
Material: In2O3
Measurement: In K-edge, transmission mode, 8-ID beamline at NSLS-II
Fit method: qualitative comparison
Phase fractions: (±5%)
| Phase | Fraction |
|---|---|
| In2O3 (bixbyite) | 1.0 |
Fit basis (paper's reference spectra):
- In2O3 reference
Source evidence: Section 3.2, Figure 4b
Key reasoning: The XANES spectra show an invariant absorption edge at ca. 27 938.0 eV and a complete lack of differences in the electronic properties of the In species present in the catalytic solids with respect to the bare oxide reference sample. This confirms the local environment of indium is essentially identical to the bare bixbyite In2O3 reference.
Reasoning source: Section 3.2
Scoring Rubric (total: 100 pts)
| Q | Type | Max | Question | Reference Answer | Scoring Criteria |
|---|---|---|---|---|---|
| q1 | identification | 30 | Based on the sample conditions, what is the expected oxidation state of Indium and the dominant phase present in this bare reference sample? | The expected oxidation state of Indium is In(III), and the dominant phase is 100% bixbyite In2O3. Because the sample is a bare, undoped indium oxide reference, it consists entirely of the pure In2O3 phase without any structural modifications from dopants. The lack of doping or other treatments ensures that the local environment of indium remains essentially identical to the standard bixbyite In2O3 reference, maintaining its characteristic In(III) oxidation state. | Must identify In(III) and In2O3 (bixbyite) as the dominant phase. |
| q2 | spectral | 40 | Describe the expected spectral features of the In K-edge XANES for this sample, specifically mentioning the edge position. | The expected In K-edge XANES spectrum exhibits an absorption edge at approximately 27,938.0 eV, followed by a strong white line peak around 27,950 eV with an intensity of ~1.25. These specific spectral features arise because the sample is a bare, undoped In2O3 reference material. Under these pure conditions, the invariant absorption edge at ca. 27,938.0 eV is directly characteristic of the In(III) oxidation state within the bixbyite In2O3 crystal structure. The lack of dopants ensures there are no shifts in the electronic properties or local environment of the indium species. | Must mention the absorption edge at approximately 27938 eV and the presence of a strong white line. |
| q3 | reasoning | 30 | What does the In K-edge XANES spectrum of this bare oxide reference sample establish regarding the local environment of Indium when compared to doped samples? | The In K-edge XANES spectrum of this bare oxide reference establishes a baseline showing an invariant absorption edge at ca. 27,938.0 eV. Because this sample is an undoped, bare In2O3 reference, it represents the pure bixbyite In2O3 local environment and In(III) oxidation state. When compared to other catalytic solids, the complete lack of differences in the electronic properties of the In species confirms that the local environment of indium in those samples remains essentially identical to this bare bixbyite reference. The absence of doping in this specific sample provides the necessary standard to prove that the In(III) structural framework is maintained. | Must explain that it serves as a baseline for In(III) in a bixbyite structure, establishing an invariant absorption edge to which doped samples can be compared to confirm the lack of differences in the electronic properties of the In species. |
Review
#1089
In2O3:Co
Co K-edge
▶
LLM Prompt
Sample Information
Material: In2O3:Co
Sample-Specific Conditions
- doping: 4 mol% Co
- 4 mol% Co doped indium oxide, average Co oxidation state +2.45
Measurement
We plan to measure the Co K-edge XANES spectrum of this sample.
Questions
Based on all the information above:
1. Based on the doping of 4 mol% Co into indium oxide, what is the expected local environment and average oxidation state of the Co species, and what physical reasoning supports this assignment?
2. Describe the expected distinguishing features of the Co K-edge XANES spectrum for this sample compared to bulk cobalt oxide references (e.g., CoO, Co2O3).
3. What candidate reference spectra are needed to evaluate the Co oxidation state and local structure in this doped sample?
Ground Truth
Material: In2O3:Co
Measurement: Co K-edge XANES, fluorescence mode
Fit method: Integral method (for oxidation state) and EXAFS fitting
Phase fractions: (±10%)
| Phase | Fraction |
|---|---|
| Co substituted in In2O3 bixbyite structure | 1.0 |
Fit basis (paper's reference spectra):
- CoO
- Co3O4
- Co2O3
- Co foil
Source evidence: Figure 5b, Section 3.2 (pages 9-11)
Key reasoning: The Co K-edge XANES profile shows evident differences from CoO and Co oxide references, particularly a higher intensity white line at ca. 7724.0 eV. This indicates an increased covalent character of the Co(3d)-O(2p) interaction, characteristic of sub-nanometric or isolated Co species. The integral method determines an average oxidation state of +2.45. EXAFS fitting confirms Co substitutes In in the bixbyite structure.
Reasoning source: Section 3.2, pages 9-11
Scoring Rubric (total: 100 pts)
| Q | Type | Max | Question | Reference Answer | Scoring Criteria |
|---|---|---|---|---|---|
| q1 | reasoning | 35 | Based on the doping of 4 mol% Co into indium oxide, what is the expected local environment and average oxidation state of the Co species, and what physical reasoning supports this assignment? | For the 4 mol% Co-doped indium oxide sample, the Co species are expected to fully substitute for In within the In2O3 bixbyite structure (fraction 1.0) with an average oxidation state of +2.45. This local environment arises because, at this specific doping level, Co exists as sub-nanometric or isolated species rather than forming bulk secondary oxide phases. The isolated nature of the dopant leads to an increased covalent character of the Co(3d)-O(2p) interaction, stabilizing the Co within the host lattice. Consequently, EXAFS fitting confirms the complete substitution into In sites, while the integral method determines the mixed +2.45 oxidation state. | Full points if the answer identifies Co substituting In in the bixbyite structure with an average oxidation state of ~+2.45, and explains that this is supported by the increased covalent character of the Co-O interaction typical of isolated/sub-nanometric species. |
| q2 | spectral | 40 | Describe the expected distinguishing features of the Co K-edge XANES spectrum for this sample compared to bulk cobalt oxide references (e.g., CoO, Co2O3). | The expected distinguishing feature of the Co K-edge XANES spectrum is a significantly higher intensity white line at approximately 7724.0 eV compared to bulk CoO and Co2O3 references. This distinct spectral shape arises because the 4 mol% Co doping results in isolated Co species fully substituted into the In2O3 bixbyite lattice, rather than forming bulk cobalt oxides. The structural isolation of Co in the host lattice increases the covalent character of the Co(3d)-O(2p) interaction. This enhanced covalency directly produces the elevated white line intensity, reflecting the unique electronic environment of the dopant with an average oxidation state of +2.45. | Full points if the answer explicitly mentions the higher intensity of the white line at approximately 7724.0 eV compared to the CoO and Co2O3 references. |
| q3 | identification | 25 | What candidate reference spectra are needed to evaluate the Co oxidation state and local structure in this doped sample? | The necessary candidate reference spectra for evaluating this sample are CoO, Co3O4, Co2O3, and Co foil. These specific references are required because they cover the full range of possible Co oxidation states needed to determine the sample's mixed average oxidation state of +2.45 using the integral method. Furthermore, comparing the 4 mol% Co-doped sample to these bulk references is essential to prove that Co exists as isolated species substituted into the In2O3 bixbyite structure rather than forming secondary phases. The contrast between the sample's high-intensity white line at 7724.0 eV and these references demonstrates the increased covalent character of the Co(3d)-O(2p) interaction unique to this specific doping condition. | Full points if the answer lists appropriate Co references mentioned in the study, specifically CoO, Co3O4 (or Co2O3), and Co foil. |
Review
#1090
In2O3:Nb
Nb K-edge
▶
LLM Prompt
Sample Information
Material: In2O3:Nb
Sample-Specific Conditions
- doping: 5 mol% Nb
- 5 mol% Nb doped indium oxide
Measurement
We plan to measure the Nb K-edge XANES spectrum of this sample.
Questions
Based on all the information above:
1. Based on the sample conditions (5 mol% Nb doped into In2O3), what is the expected local structure and oxidation state of the Nb species, and what physical reasoning justifies this phase assignment?
2. Describe the expected distinguishing features in the Nb K-edge XANES spectrum of this doped sample compared to a bulk Nb2O5 reference. How do these features reflect the structural incorporation?
3. If one were to compare this spectrum to standard reference materials to confirm the structural incorporation, which primary reference compound should be measured and what specific spectral differences would confirm successful doping into the bixbyite lattice?
Ground Truth
Material: In2O3:Nb (In5Nb)
Measurement: Nb K-edge, fluorescence mode, 8-ID beamline at NSLS-II
Fit method: Qualitative comparison and EXAFS fitting
Phase fractions: (±10%)
| Phase | Fraction |
|---|---|
| Nb in In2O3 (bixbyite) | 1.0 |
Fit basis (paper's reference spectra):
- Nb2O5
Source evidence: Figure 6b (XANES), Figure 6c and Table 3 (EXAFS), Page 11
Key reasoning: The XANES spectra show minor differences from the bare niobium oxide reference, specifically a lower intensity of the pre-edge at ca. 18993.0 eV and slightly higher d-splitting of the white line. This indicates a local environment different from the reference, corresponding to the more symmetric octahedral-type structure typical of indium oxide. EXAFS fitting confirms Nb substitutes In in the bixbyite structure, with a characteristic Nb-In coordination shell at 3.40 Å.
Reasoning source: Section 3.2, Page 11 and 12
Scoring Rubric (total: 100 pts)
| Q | Type | Max | Question | Reference Answer | Scoring Criteria |
|---|---|---|---|---|---|
| q1 | reasoning | 30 | Based on the sample conditions (5 mol% Nb doped into In2O3), what is the expected local structure and oxidation state of the Nb species, and what physical reasoning justifies this phase assignment? | Based on the 5 mol% Nb doping in indium oxide, the Nb species is expected to be entirely incorporated into the host lattice, substituting for In in the bixbyite structure with an oxidation state of Nb(V). This complete (1.0 fraction) substitution occurs because the 5 mol% doping level allows Nb to integrate into the host rather than segregating into secondary oxide phases. The physical reasoning is that Nb adopts the more symmetric octahedral-type coordination environment typical of indium oxide, which is structurally distinct from bulk niobium oxides. This incorporation is further justified by EXAFS fitting, which reveals a characteristic Nb-In coordination shell at 3.40 Å. | Full points for identifying Nb(V) substituting into the bixbyite In2O3 lattice (octahedral-type symmetry) and explaining that the host lattice dictates the local symmetric environment. |
| q2 | spectral | 40 | Describe the expected distinguishing features in the Nb K-edge XANES spectrum of this doped sample compared to a bulk Nb2O5 reference. How do these features reflect the structural incorporation? | The Nb K-edge XANES spectrum of the 5 mol% Nb doped In2O3 sample will exhibit a lower pre-edge intensity at 18993.0 eV and slightly higher d-splitting of the white line compared to a bulk Nb2O5 reference. These spectral features arise directly from the sample conditions, where Nb is substitutionally incorporated into the indium oxide host lattice. Specifically, these differences reflect the transition of Nb into the more symmetric octahedral-type structure of the bixbyite indium oxide host. In contrast, the Nb2O5 reference possesses a relatively low symmetry, such as pentagonal bipyramidal or strongly distorted octahedral geometries, which produces a stronger pre-edge and less pronounced d-splitting. | Full points for mentioning the lower intensity of the pre-edge at ~18993.0 eV and the higher d-splitting of the white line, and connecting these to the transition from a distorted Nb2O5 structure to the more symmetric octahedral-type structure of In2O3. |
| q3 | identification | 30 | If one were to compare this spectrum to standard reference materials to confirm the structural incorporation, which primary reference compound should be measured and what specific spectral differences would confirm successful doping into the bixbyite lattice? | To confirm the structural incorporation of the 5 mol% Nb into the indium oxide host, the primary reference compound that should be measured is bare Nb2O5. Successful doping into the bixbyite lattice is confirmed by observing a lower pre-edge intensity at 18993.0 eV and slightly higher d-splitting of the white line relative to this Nb2O5 reference. These specific spectral differences occur because the sample conditions dictate that Nb substitutes into the In2O3 lattice, forcing the Nb atoms to adopt the host's more symmetric octahedral-type structure. This higher symmetry environment in the doped sample contrasts with the low symmetry (pentagonal bipyramidal or strongly distorted octahedral) of the Nb2O5 reference, thereby proving successful structural incorporation. | Full points for identifying Nb2O5 as the reference and stating that successful doping is confirmed by a decrease in pre-edge intensity and an increase in white line d-splitting relative to this reference. |
Review
Investigation of periodically driven systems by x-ray absorption spectroscopy using asynchronous data collection mode
BNL-NSLS-II-8-ID
Synthesis
H. Singh et al.
DOI: 10.1063/1.5000679
1 scenario
▶
#1091
Ni0.75W0.25
Ni K-edge
▶
LLM Prompt
Sample Information
Material: Ni0.75W0.25
Method: annealing
Temperature C: 150
Duration Hours: 24
Sample-Specific Conditions
- annealing temperature: 150 °C
- Ni0.75W0.25 film annealed at 150 °C with 5 nm grain size
Preparation
- 6 μm-thick films of Ni0.75W0.25 annealed at 150 °C for 24 h
Measurement
We plan to measure the Ni K-edge XANES spectrum of this sample.
Questions
Based on all the information above:
1. Based on the sample conditions (Ni0.75W0.25 film annealed at 150 °C), what is the expected local coordination environment around the Ni atoms in terms of nearest neighbors?
2. What is the expected absorption edge and approximate edge energy for probing the local structure of Ni in this specific sample?
3. If one were to model the extended fine structure (EXAFS) of this specific alloy film, what theoretical scattering paths (basis functions) would be necessary to include for the first coordination shell?
Ground Truth
Material: Ni0.75W0.25
Measurement: Ni K-edge (8.333 keV) in transmission mode at the ISS beamline of NSLS-II
Fit method: EXAFS least-square fitting to theoretical FEFF6 model
Phase fractions:
| Phase | Fraction |
|---|---|
| Ni0.75W0.25 | 1.0 |
Fit basis (paper's reference spectra):
- Theoretical phases and amplitudes from ab initio calculations for Ni-Ni and Ni-W scattering paths
Source evidence: Table I, Table III, Figure 3a, Section II.B
Key reasoning: The sample is a 6 μm-thick film of Ni0.75W0.25 annealed at 150 °C, resulting in a nanocrystalline structure with a 5 nm grain size. EXAFS analysis confirms the local structure consists of a mixed first coordination shell with approximately 8.9 Ni-Ni bonds and 3.2 Ni-W bonds.
Reasoning source: Section II.A (Sample details) and Section III.C (Quantitative EXAFS data analysis)
Scoring Rubric (total: 100 pts)
| Q | Type | Max | Question | Reference Answer | Scoring Criteria |
|---|---|---|---|---|---|
| q1 | reasoning | 40 | Based on the sample conditions (Ni0.75W0.25 film annealed at 150 °C), what is the expected local coordination environment around the Ni atoms in terms of nearest neighbors? | The expected local coordination environment around the Ni atoms consists of a mixed first coordination shell containing approximately 8.9 Ni-Ni bonds and 3.2 Ni-W bonds. This specific coordination arises because the 6 μm-thick Ni0.75W0.25 film was annealed at 150 °C for 24 hours, which produces a nanocrystalline structure with a 5 nm grain size. The specific alloy composition (75% Ni, 25% W) combined with this low-temperature annealing dictates this mixed-metal local structure, yielding corresponding bond distances of RNi-Ni ≈ 2.480 Å and RNi-W ≈ 2.535 Å. | The answer must state that the first coordination shell is mixed, containing both Ni and W atoms, and should specifically mention approximately 8.9 Ni-Ni bonds and 3.2 Ni-W bonds. |
| q2 | identification | 30 | What is the expected absorption edge and approximate edge energy for probing the local structure of Ni in this specific sample? | The expected absorption edge for probing this sample is the Ni K-edge, which occurs at an approximate energy of 8333 eV. Measuring at this specific energy is necessary because the sample is a 6 μm-thick Ni0.75W0.25 film annealed at 150 °C, and probing the Ni atoms directly reveals their specific local environment within the 5 nm nanocrystalline grains. By capturing the sharp absorption edge and post-edge EXAFS oscillations at 8333 eV, one can accurately characterize the mixed first coordination shell of Ni-Ni and Ni-W bonds resulting from these synthesis conditions. | The answer must identify the Ni K-edge and state the energy is approximately 8333 eV (or 8.333 keV). |
| q3 | reasoning | 30 | If one were to model the extended fine structure (EXAFS) of this specific alloy film, what theoretical scattering paths (basis functions) would be necessary to include for the first coordination shell? | To model the EXAFS of this alloy film, it is necessary to include theoretical phases and amplitudes from ab initio calculations for both Ni-Ni and Ni-W scattering paths. These specific basis functions are required because the sample is a Ni0.75W0.25 film annealed at 150 °C, which forms a nanocrystalline structure with a 5 nm grain size. Due to this bimetallic composition and thermal treatment, the local environment around the absorbing Ni atoms consists of a mixed first coordination shell (approximately 8.9 Ni-Ni bonds and 3.2 Ni-W bonds). Therefore, a theoretical FEFF6 model must incorporate both scattering paths to accurately fit the post-edge EXAFS oscillations and determine the structural parameters. | The answer must state that theoretical phases and amplitudes for both Ni-Ni and Ni-W scattering paths are required to accurately model the mixed first coordination shell of the alloy. |
Review
Spatially separating redox centers on 2D carbon nitride with cobalt single atom for photocatalytic H 2 O 2 production
BNL-NSLS-II-8-ID
Catalyst
Chiheng Chu et al.
DOI: 10.1073/pnas.1913403117
2 scenarios
▶
#1092
Co1/AQ/C3N4
Co K-edge
▶
LLM Prompt
Sample Information
Material: Co1/AQ/C3N4
Support: C3N4
Sample-Specific Conditions
- absorption edge: Co K-edge
- Cobalt single atom and anthraquinone on ultrathin carbon nitride
Measurement
We plan to measure the Co K-edge XANES spectrum of this sample.
Questions
Based on all the information above:
1. Based on the sample conditions (Co single atoms on C3N4), what is the expected dominant oxidation state of the cobalt, and which standard reference compound would its XANES spectrum most closely resemble?
2. Describe the expected XANES spectral shape and edge position of Co1/AQ/C3N4 in comparison to standard cobalt references such as Co foil, CoO, and Co3O4.
3. To verify the chemical state of the Co single atoms in this sample via qualitative comparison or linear combination fitting, what specific reference spectra should be included in the analysis?
Ground Truth
Material: Co1/AQ/C3N4
Measurement: Co K-edge, fluorescence mode, room temperature, Beamline 8-ID (ISS) at NSLS-II
Fit method: qualitative comparison
Phase fractions: (±10%)
| Phase | Fraction |
|---|---|
| Co2+ (CoO-like) | 1.0 |
Fit basis (paper's reference spectra):
- Co foil
- Co3O4
- CoO
Source evidence: Page 5, Figure 3C and text in right column
Key reasoning: Comparison of the Co K-edge normalized XANES of Co1/AQ/C3N4 with reference compounds shows that the spectral line shape and absorption edge position closely resemble those of CoO. This indicates that the oxidation state of the Co single atoms is close to +2. Density-functional theory calculations confirm that the Co atoms are positively charged.
Reasoning source: Page 5, right column, paragraph 2
Scoring Rubric (total: 101 pts)
| Q | Type | Max | Question | Reference Answer | Scoring Criteria |
|---|---|---|---|---|---|
| q1 | identification | 38 | Based on the sample conditions (Co single atoms on C3N4), what is the expected dominant oxidation state of the cobalt, and which standard reference compound would its XANES spectrum most closely resemble? | The expected dominant oxidation state of the cobalt in the Co1/AQ/C3N4 sample is +2, and its XANES spectrum most closely resembles the standard reference compound CoO. This +2 oxidation state arises because the cobalt exists as single atoms supported on ultrathin carbon nitride with anthraquinone, leading to positively charged Co atoms as confirmed by density-functional theory calculations. Consequently, the fraction of Co2+ (CoO-like) species is 1.0. The interaction between the Co single atoms and the C3N4 support stabilizes this specific positively charged chemical state, making its spectral line shape and absorption edge position align with CoO rather than metallic Co or Co3O4. | Full points for identifying the +2 oxidation state and stating that the spectrum closely resembles CoO. |
| q2 | spectral | 38 | Describe the expected XANES spectral shape and edge position of Co1/AQ/C3N4 in comparison to standard cobalt references such as Co foil, CoO, and Co3O4. | The XANES spectral line shape and absorption edge position of Co1/AQ/C3N4 are expected to closely resemble those of the CoO reference spectrum. The spectrum will be distinctly different from both Co foil and Co3O4. These spectral features occur because the sample consists of cobalt single atoms coordinated on an ultrathin carbon nitride support with anthraquinone, which stabilizes the cobalt in a +2 oxidation state. Because the Co atoms are positively charged in this specific single-atom architecture, as supported by density-functional theory, the electronic transitions probed at the Co K-edge mirror the Co2+ state found in CoO. | Full points for stating the spectral line shape and edge position closely resemble CoO, and are distinct from Co foil and Co3O4. |
| q3 | reasoning | 25 | To verify the chemical state of the Co single atoms in this sample via qualitative comparison or linear combination fitting, what specific reference spectra should be included in the analysis? | To verify the chemical state of the Co single atoms in the Co1/AQ/C3N4 sample, the analysis should include Co foil, CoO, and Co3O4 as reference spectra. These specific references are necessary to distinguish between metallic, +2, and mixed oxidation states. Given the sample conditions of cobalt single atoms and anthraquinone on ultrathin carbon nitride, the Co atoms are positively charged, resulting in a 1.0 fraction of Co2+ (CoO-like) species. Comparing the sample against this basis set confirms that the single-atom coordination environment on the C3N4 support stabilizes a +2 oxidation state, as the sample's edge position and line shape will align exclusively with the CoO reference. | Full points for listing Co foil, CoO, and Co3O4 as the necessary reference spectra. |
Review
#1093
Co1/AQ/C3N4
P K-edge
▶
LLM Prompt
Sample Information
Material: Co1/AQ/C3N4
Support: C3N4
Sample-Specific Conditions
- absorption edge: P K-edge
- Cobalt single atom and anthraquinone on ultrathin carbon nitride
Measurement
We plan to measure the P K-edge XANES spectrum of this sample.
Questions
Based on all the information above:
1. Based on the sample preparation and structure, what are the expected chemical states of phosphorus in this material that would be observed in the P K-edge XANES spectrum?
2. Estimate the relative fractions of these different phosphorus states in the sample.
3. Explain the structural coordination environment of the Co single atoms that gives rise to these specific phosphorus states and their relative fractions.
Ground Truth
Material: Co1/AQ/C3N4
Measurement: P K-edge XANES, fluorescence mode, 8-BM beamline at NSLS-II
Fit method: peak intensity comparison
Phase fractions: (±10%)
| Phase | Fraction |
|---|---|
| high-valence P | 0.25 |
| low-valence P (phosphidic) | 0.75 |
Fit basis (paper's reference spectra):
- low-valence phosphidic species
- high-valence P
Source evidence: Page 6, text (left column, bottom to right column, top); Page 8, Methods
Key reasoning: The P K-edge XANES spectrum exhibits a strong feature at 2143.6 eV assigned to low-valence phosphidic species and a broader peak at 2152.0 eV consistent with high-valence P. Comparison of their intensities suggests 20-30% of P atoms are in a high-valence state. Structurally, this indicates that the single Co atoms are coordinated with three low-valence P atoms (which are in turn coordinated with N atoms in the C3N4 heptazine rings) and one high-valence P atom (coordinated with O atoms), resulting in a ~1:3 ratio of high-valence to low-valence phosphorus.
Reasoning source: Page 6, text (left column, bottom to right column, top)
Scoring Rubric (total: 100 pts)
| Q | Type | Max | Question | Reference Answer | Scoring Criteria |
|---|---|---|---|---|---|
| q1 | identification | 30 | Based on the sample preparation and structure, what are the expected chemical states of phosphorus in this material that would be observed in the P K-edge XANES spectrum? | The expected chemical states of phosphorus in the Co1/AQ/C3N4 sample are low-valence phosphidic species and high-valence P. In the P K-edge XANES spectrum, these manifest as a strong feature at 2143.6 eV for the low-valence state and a broader peak at 2152.0 eV for the high-valence state. These specific states arise because the cobalt single atoms on the ultrathin carbon nitride support are coordinated by two distinct types of phosphorus environments. Specifically, the low-valence P atoms are coordinated with N atoms in the C3N4 heptazine rings, while the high-valence P atoms are coordinated with O atoms. | Full credit for identifying both low-valence (phosphidic) P and high-valence P states. |
| q2 | quantification | 30 | Estimate the relative fractions of these different phosphorus states in the sample. | The relative fractions of the phosphorus states are approximately 75% low-valence phosphidic species and 25% high-valence P, with an estimated uncertainty of 10%. These values are derived from peak intensity comparisons in the P K-edge XANES spectrum, which indicate that 20-30% of the P atoms exist in a high-valence state. This specific ~3:1 ratio of low-valence to high-valence phosphorus results directly from the local coordination environment of the cobalt single atoms on the carbon nitride support. Each Co single atom is structurally coordinated by exactly three low-valence P atoms and one high-valence P atom. | Full credit for estimating ~20-30% (or 25%) high-valence P and ~70-80% (or 75%) low-valence P. |
| q3 | reasoning | 40 | Explain the structural coordination environment of the Co single atoms that gives rise to these specific phosphorus states and their relative fractions. | In the Co1/AQ/C3N4 material, the cobalt single atoms are anchored on the ultrathin carbon nitride (C3N4) support through a specific phosphorus-mediated coordination environment. Each single Co atom is coordinated with three low-valence P atoms and one high-valence P atom. The three low-valence P atoms are further coordinated with N atoms within the heptazine rings of the C3N4 support, while the single high-valence P atom is coordinated with O atoms. This distinct structural arrangement dictates the ~1:3 ratio of high-valence to low-valence phosphorus observed in the material. Consequently, the P K-edge XANES spectrum reflects this exact coordination structure through a strong low-valence phosphidic peak at 2143.6 eV and a broader high-valence P peak at 2152.0 eV. | Full credit for explaining that Co is coordinated with three low-valence P atoms (coordinated with N) and one high-valence P atom (coordinated with O), explaining the ~3:1 ratio. |
Review
Free-standing membrane incorporating single-atom catalysts for ultrafast electroreduction of low-concentration nitrate
BNL-NSLS-II-8-ID
Catalyst
Xiaoxiong Wang et al.
DOI: 10.1073/pnas.2217703120
1 scenario
▶
#1094
Cu-N-C
Cu K
▶
LLM Prompt
Sample Information
Material: Cu-N-C
Support: N-doped carbon
Sample-Specific Conditions
- catalyst structure: single atom
- Copper single-atom anchored on N-doped carbon
Measurement
We plan to measure the Cu K XANES spectrum of this sample.
Questions
Based on all the information above:
1. Describe the expected spectral shape of the Cu K-edge XANES for this single-atom catalyst compared to metallic copper.
Ground Truth
Material: Cu-N-C
Measurement: Cu K-edge XAS measured at Beamline 8-ID of the National Synchrotron Light Source II in fluorescence mode
Fit method: not reported
Phase fractions: (±10%)
| Phase | Fraction |
|---|---|
| Cu-N4/C | 1.0 |
Fit basis (paper's reference spectra):
- Cu foil
- copper phthalocyanine (CuPc)
Source evidence: Figure 1B, Figure 1C, Figure 1D, page 2
Key reasoning: The white-line intensity of Cu1/NC is similar to that of the copper phthalocyanine (CuPc) reference but very different from the copper foil reference, suggesting that the valence state of the Cu atoms is around +2. The lack of metal clusters is further confirmed by Cu K-edge XANES. The fitted FT-EXAFS spectrum shows a Cu-N coordination number of 4.4 ± 0.4, indicating a Cu-N4/C structure.
Reasoning source: Page 2, 'Fabrication and Characterization of Cu1/NC@CNT-FEM' section
Scoring Rubric (total: 100 pts)
| Q | Type | Max | Question | Reference Answer | Scoring Criteria |
|---|---|---|---|---|---|
| q2 | spectral | 100 | Describe the expected spectral shape of the Cu K-edge XANES for this single-atom catalyst compared to metallic copper. | The Cu K-edge XANES spectrum of this sample will exhibit a white-line intensity that closely matches that of a copper phthalocyanine (CuPc) reference while being very different from a metallic copper foil reference. The spectrum will completely lack the characteristic features of metallic copper clusters. These spectral features arise directly from the sample's single-atom catalyst structure, where copper is anchored on N-doped carbon rather than forming metallic bonds. Because the copper is atomically dispersed in a Cu-N4/C coordination environment, it exists in a +2 oxidation state, producing the CuPc-like white-line intensity. The isolated nature of these single atoms ensures the absence of Cu-Cu interactions, explaining the stark difference from the metallic copper spectrum. | Full points for stating that the white-line intensity will be very different from copper foil and will instead resemble a Cu-N coordinated reference (like CuPc), lacking features of metallic clusters. |
Review
A study of the electronic structure of FeSe1 −xTexchalcogenides by Fe and Se K-edge x-ray absorption near edge structure measurements
BNL-NSLS-II-8-ID
Pure Phase
B Joseph et al.
DOI: 10.1088/0953-8984/22/48/485702
4 scenarios
▶
#1095
FeSe
Fe K
▶
LLM Prompt
Sample Information
Material: FeSe
Crystal Structure: tetrahedral Fe coordination
Oxidation State: Fe2+
Sample Form: powder
Measurement Mode: fluorescence and transmission
- FeSe powder sample
Measurement
We plan to measure the Fe K XANES spectrum of this sample.
Questions
Based on all the information above:
1. Describe the expected spectral shape of the Fe K-edge XANES for pure FeSe, and identify the electronic transitions responsible for the pre-edge peak (Peak A) and the main peak (Peak C).
2. How does the intensity of the pre-edge peak in pure FeSe compare to that of Te-substituted FeSe samples, and what is the physical/structural reasoning for this difference?
3. Based on the Fe K-edge XANES spectrum, what is the expected oxidation state of Fe in FeSe, and what reference standard would be appropriate to confirm this state?
4. What specific spectral feature (and its approximate energy position) is driven by the mixing of Fe 1s->4p states with the d states of the chalcogen atoms, and how does its position in pure FeSe distinguish it from Te-substituted samples?
Ground Truth
Compound: FeSe
Oxidation state: Fe2+
Measurement: Fe K-edge XANES, fluorescence and transmission mode, ESRF beamline BM29
Edge position: not reported
Spectral shape: Spectra show a pre-edge peak A, a shoulder B on the main edge, a main peak C, and broader multiple scattering features D and E at higher energies.
Labeled peaks:
| Label | Energy (eV) | Intensity | Origin | Source |
|---|---|---|---|---|
| A | 7111 | strongest among series | 1s->3d quadrupole transition with dipole contribution due to admixed p states | paper_data |
| B | 7117 | shoulder | 1s->4p transition | paper_data |
| C | 7120 | peak | 1s->4p states admixed with the d states of the chalcogen atoms | paper_data |
| D | not reported | broad | photoelectron multiple scattering with nearest neighbours | paper_data |
| E | not reported | broad | photoelectron multiple scattering with nearest neighbours | paper_data |
Distinguishing features: Highest pre-peak A intensity and highest energy position for peak C compared to Te-substituted samples.
Key reasoning: The Fe K-edge XANES spectrum of FeSe is consistent with an Fe2+ state in a tetrahedral geometry. The pre-edge peak A at ~7111 eV is derived from a 1s->3d quadrupole transition mixed with a dipole contribution from admixed chalcogen p states. The high intensity of this pre-peak in FeSe compared to Te-substituted samples is due to the shorter Fe-chalcogen bond length, which increases the mixing of chalcogen p orbitals with Fe 3d states.
Reasoning source: Section 3.1, pages 3-5
Scoring Rubric (total: 100 pts)
| Q | Type | Max | Question | Reference Answer | Scoring Criteria |
|---|---|---|---|---|---|
| q1 | spectral | 30 | Describe the expected spectral shape of the Fe K-edge XANES for pure FeSe, and identify the electronic transitions responsible for the pre-edge peak (Peak A) and the main peak (Peak C). | The expected spectral shape for pure FeSe includes a pre-edge peak A, a shoulder B on the main edge, a main peak C, and broader multiple scattering features D and E at higher energies. Peak A (~7111 eV) originates from a 1s->3d quadrupole transition mixed with a dipole contribution from admixed chalcogen p states, while Peak C (~7120 eV) is driven by 1s->4p states admixed with the d states of the chalcogen atoms. These specific features arise because the sample consists of pure FeSe powder with Fe2+ in a tetrahedral coordination. This specific local geometry allows for the necessary orbital mixing between the Fe 3d/4p states and the chalcogen states to produce these distinct pre-edge and main peak transitions. | Full points if the answer mentions the pre-edge peak, shoulder on the main edge, main peak, and higher energy multiple scattering features. Must correctly assign Peak A to a 1s->3d quadrupole transition (with dipole contribution from admixed p states) and Peak C to 1s->4p states admixed with chalcogen d states. |
| q2 | reasoning | 30 | How does the intensity of the pre-edge peak in pure FeSe compare to that of Te-substituted FeSe samples, and what is the physical/structural reasoning for this difference? | The pre-edge peak A in pure FeSe has the highest intensity compared to Te-substituted samples. This high intensity occurs because the pure FeSe sample has a shorter Fe-chalcogen bond length than the Te-substituted variants. Because of this shorter bond length within the tetrahedral Fe coordination environment, there is an increased mixing of the chalcogen p orbitals with the Fe 3d states. This enhanced orbital mixing directly increases the dipole contribution to the 1s->3d transition, thereby producing the stronger pre-edge peak observed in the pure FeSe powder. | Full points if the answer states that FeSe has the highest pre-peak intensity among the series, and explains that this is due to the shorter Fe-chalcogen bond length in FeSe, which leads to higher mixing of chalcogen p orbitals with Fe 3d states. |
| q3 | identification | 20 | Based on the Fe K-edge XANES spectrum, what is the expected oxidation state of Fe in FeSe, and what reference standard would be appropriate to confirm this state? | The expected oxidation state of Fe in the pure FeSe sample is Fe2+. To confirm this state, an Fe2+ standard should be used as the appropriate reference basis. This oxidation state is expected because the sample is composed of pure FeSe powder, where the Fe K-edge XANES spectrum is entirely consistent with an Fe2+ state in a tetrahedral geometry. The phase fraction of FeSe is 1.0, meaning the entire sample reflects this specific Fe2+ tetrahedral coordination without any mixed valency or secondary phases. | Full points if the answer correctly identifies the oxidation state as Fe2+ and mentions using an Fe2+ standard as a reference. |
| q4 | spectral | 20 | What specific spectral feature (and its approximate energy position) is driven by the mixing of Fe 1s->4p states with the d states of the chalcogen atoms, and how does its position in pure FeSe distinguish it from Te-substituted samples? | The main peak C, located at approximately 7120 eV, is the specific spectral feature driven by the mixing of Fe 1s->4p states with the d states of the chalcogen atoms. In pure FeSe, this peak is distinguished by having the highest energy position compared to Te-substituted samples. This distinct energy position and orbital mixing arise directly from the sample's pure FeSe composition and tetrahedral Fe2+ coordination. The specific Fe-Se bond lengths and local geometry in this pure powder sample dictate the exact degree of orbital admixture, shifting the 1s->4p transition to this higher energy relative to the Te-substituted counterparts. | Full points if the answer identifies Peak C at ~7120 eV and notes that it appears at the highest energy position in pure FeSe compared to the Te-substituted samples. |
Review
#1096
FeTe
Fe K
▶
LLM Prompt
Sample Information
Material: FeTe
Crystal Structure: tetrahedral Fe coordination
Oxidation State: Fe2+
Sample Form: powder
Measurement Mode: fluorescence and transmission
- FeTe powder sample
Measurement
We plan to measure the Fe K XANES spectrum of this sample.
Questions
Based on all the information above:
1. Describe the expected spectral shape and key features (pre-edge, main edge) for the Fe K-edge XANES of the FeTe powder sample.
2. What are the specific electronic transitions responsible for the pre-edge peak (A) and the main peak (C) in the Fe K-edge XANES of FeTe?
3. How does the Fe K-edge XANES spectrum of FeTe differ from that of FeSe, and what structural differences (e.g., bond lengths) cause these spectral changes?
Ground Truth
Compound: FeTe
Oxidation state: Fe2+
Measurement: Fe K-edge XANES, fluorescence and transmission modes
Edge position: not explicitly reported (main absorption jump is around 7117 eV)
Spectral shape: The spectrum exhibits a pre-edge peak (A), a shoulder on the main absorption jump (B), and a main white line peak (C). Compared to FeSe, the pre-edge is weaker and the main features (B and C) are shifted to lower energies.
Labeled peaks:
| Label | Energy (eV) | Intensity | Origin | Source |
|---|---|---|---|---|
| A | 7111 | weakest among the FeSe1-xTex series | 1s->3d quadrupole transition with dipole contribution due to admixed p states | paper_data |
| B | ~7117 | shoulder | 1s->4p transition | paper_data |
| C | ~7120 (shifted ~0.8 eV lower vs FeSe) | peak | 1s->4p states admixed with the d states of the chalcogen atoms | paper_data |
Distinguishing features: Lowest pre-peak A intensity and lowest energy position for peak C compared to other FeSe1-xTex compositions, reflecting the longer Fe-Te and Fe-Fe bond lengths.
Key reasoning: The Fe K-edge XANES spectrum of FeTe is consistent with an Fe2+ state. The pre-edge peak A intensity is the lowest in the FeSe1-xTex series due to lower mixing of chalcogen p orbitals with Fe 3d states, consistent with the longer Fe-Te bond length (~2.6 Å). The main peak C is shifted ~0.8 eV lower compared to FeSe, which is also driven by the longer Fe-chalcogen bond length according to the ΔE ∝ 1/d² relation.
Reasoning source: Section 3.1, pages 3-5
Scoring Rubric (total: 100 pts)
| Q | Type | Max | Question | Reference Answer | Scoring Criteria |
|---|---|---|---|---|---|
| q1 | spectral | 35 | Describe the expected spectral shape and key features (pre-edge, main edge) for the Fe K-edge XANES of the FeTe powder sample. | The Fe K-edge XANES spectrum of the FeTe powder sample exhibits a pre-edge peak (A) at 7111 eV, a shoulder on the main absorption jump (B) around 7117 eV, and a main white line peak (C) near 7120 eV. These spectral features arise directly from the Fe2+ oxidation state and the tetrahedral Fe coordination of the sample. Specifically, the pre-edge peak A is the weakest among the FeSe1-xTex series because the longer Fe-Te bond length (~2.6 Å) results in lower mixing of the chalcogen p orbitals with the Fe 3d states. Additionally, the main peak C is shifted to lower energies compared to related compounds like FeSe, which is structurally driven by the longer Fe-chalcogen bond length according to the ΔE ∝ 1/d² relationship. | Full points if the answer identifies the pre-edge peak (~7111 eV), the shoulder on the main absorption jump (~7117 eV), and the main peak (~7120 eV), noting that the pre-edge is relatively weak. |
| q2 | reasoning | 30 | What are the specific electronic transitions responsible for the pre-edge peak (A) and the main peak (C) in the Fe K-edge XANES of FeTe? | In the Fe K-edge XANES of the FeTe sample, the pre-edge peak (A) at 7111 eV originates from a 1s → 3d quadrupole transition that gains a dipole contribution due to admixed p states. The main peak (C) at ~7120 eV is attributed to transitions from the 1s core level to 4p states admixed with the d states of the chalcogen atoms. These specific transitions are dictated by the sample's tetrahedral Fe coordination and Fe2+ oxidation state, which govern the available unoccupied density of states. The intensity of the pre-edge transition is notably weak because the longer Fe-Te bond length (~2.6 Å) in this specific composition reduces the orbital mixing between the chalcogen p orbitals and Fe 3d states. | Full points if the answer correctly attributes the pre-edge peak to a 1s->3d quadrupole transition (with dipole contribution from admixed p states) and the main peak C to 1s->4p states admixed with chalcogen d states. |
| q3 | reasoning | 35 | How does the Fe K-edge XANES spectrum of FeTe differ from that of FeSe, and what structural differences (e.g., bond lengths) cause these spectral changes? | Compared to FeSe, the Fe K-edge XANES spectrum of FeTe features a weaker pre-edge peak (A) and a main peak (C) that is shifted approximately 0.8 eV to lower energy. These spectral differences are directly caused by the structural properties of the FeTe sample, specifically its longer Fe-Te bond length (~2.6 Å) compared to the Fe-Se bond. The longer bond length reduces the orbital mixing between the chalcogen p orbitals and the Fe 3d states, which decreases the dipole contribution to the pre-edge peak A, making it the weakest in the series. Furthermore, the shift of the main peak C to lower energies is a direct consequence of this longer Fe-chalcogen bond length, following the established ΔE ∝ 1/d² relationship for the sample's tetrahedral coordination environment. | Full points if the answer explains that FeTe has a weaker pre-edge peak (due to lower mixing of chalcogen p states from a longer Fe-Te bond length) and that the main peak C is shifted to lower energy (~0.8 eV) due to the longer Fe-chalcogen bond length. |
Review
#1097
FeSe0.5Te0.5
Fe K
▶
LLM Prompt
Sample Information
Material: FeSe0.5Te0.5
Crystal Structure: tetrahedral Fe coordination
Oxidation State: Fe2+
Sample Form: powder
Measurement Mode: fluorescence and transmission
- FeSe0.5Te0.5 powder sample
Measurement
We plan to measure the Fe K XANES spectrum of this sample.
Questions
Based on all the information above:
1. Describe the expected spectral shape and the key labeled features (A, B, and C) in the Fe K-edge XANES spectrum of the FeSe0.5Te0.5 powder sample.
2. What are the specific electronic transitions responsible for pre-peak A and peak C in the Fe K-edge XANES spectrum of this material?
3. How does the ternary nature of the FeSe0.5Te0.5 system uniquely manifest in its Fe K-edge XANES spectrum compared to the binary end-members (FeSe and FeTe)? Explain the structural origin of this spectral difference.
Ground Truth
Compound: FeSe0.5Te0.5
Oxidation state: Fe2+
Measurement: Fe K-edge XANES, fluorescence and transmission modes, ESRF beamline BM29
Edge position: not reported
Spectral shape: The spectrum features a pre-edge peak A, a shoulder B on the main absorption jump, and a main peak C. The overall features are intermediate between the FeSe and FeTe end-members, with a notably broadened peak C.
Labeled peaks:
| Label | Energy (eV) | Intensity | Origin | Source |
|---|---|---|---|---|
| A | ~7111 | intermediate between FeSe and FeTe | 1s->3d quadrupole transition, with some dipole contribution due to the admixed p states | paper_data |
| B | ~7117 | shoulder structure | 1s->4p transition | paper_data |
| C | ~7120 | broadened peak | 1s->4p states admixed with the d states of the chalcogen atoms | paper_data |
Distinguishing features: Apparent broadening of peak C due to local inhomogeneity of the ternary system (coexisting Fe-chalcogen bond lengths).
Key reasoning: The Fe K-edge XANES spectrum of FeSe0.5Te0.5 is consistent with an Fe2+ state. The pre-peak A intensity is intermediate between FeSe and FeTe, reflecting a change in the dipole contribution from admixed chalcogen p states due to varying Fe-chalcogen bond lengths. Peak C shows apparent broadening due to local inhomogeneity in the ternary system, which is characterized by coexisting Fe-Se and Fe-Te bond lengths.
Reasoning source: Section 3.1, pages 3-5
Scoring Rubric (total: 100 pts)
| Q | Type | Max | Question | Reference Answer | Scoring Criteria |
|---|---|---|---|---|---|
| q1 | spectral | 30 | Describe the expected spectral shape and the key labeled features (A, B, and C) in the Fe K-edge XANES spectrum of the FeSe0.5Te0.5 powder sample. | The Fe K-edge XANES spectrum of the FeSe0.5Te0.5 powder sample features a pre-edge peak A (~7111 eV), a shoulder B (~7117 eV) on the main absorption jump, and a main peak C (~7120 eV). The overall spectral shape is intermediate between the FeSe and FeTe end-members, consistent with the sample's Fe2+ oxidation state and ternary composition. Specifically, pre-peak A exhibits an intermediate intensity, which arises from a change in the dipole contribution from admixed chalcogen p states due to varying Fe-chalcogen bond lengths in the tetrahedral coordination. Furthermore, the main peak C is notably broadened because of the local structural inhomogeneity inherent to this ternary system, where Fe-Se and Fe-Te bond lengths coexist. | Full points if the response identifies pre-peak A (~7111 eV), shoulder B (~7117 eV), and main peak C (~7120 eV), and notes that the features are intermediate between FeSe and FeTe. |
| q2 | reasoning | 35 | What are the specific electronic transitions responsible for pre-peak A and peak C in the Fe K-edge XANES spectrum of this material? | In the Fe K-edge XANES spectrum of this FeSe0.5Te0.5 sample, pre-peak A originates from a 1s to 3d quadrupole transition that gains some dipole contribution due to admixed chalcogen p states. Peak C corresponds to 1s to 4p transitions admixed with the d states of the chalcogen atoms. These specific transitions and their spectral manifestations are directly dictated by the sample's tetrahedral Fe coordination and ternary composition. Because the sample contains both Se and Te, the varying Fe-chalcogen bond lengths alter the degree of p-d orbital mixing, which modulates the dipole contribution to pre-peak A and causes apparent broadening in the 1s to 4p transitions of peak C. | Full points if the response correctly assigns peak A to the 1s->3d quadrupole transition (with dipole contribution from admixed p states) and peak C to the 1s->4p transition admixed with chalcogen d states. |
| q3 | reasoning | 35 | How does the ternary nature of the FeSe0.5Te0.5 system uniquely manifest in its Fe K-edge XANES spectrum compared to the binary end-members (FeSe and FeTe)? Explain the structural origin of this spectral difference. | The ternary nature of the FeSe0.5Te0.5 powder sample manifests in its XANES spectrum through features that are intermediate between the FeSe and FeTe binary end-members, most notably an intermediate intensity for pre-peak A and a significantly broadened main peak C. Structurally, this occurs because the ternary composition forces the coexistence of different Fe-Se and Fe-Te bond lengths within the tetrahedral Fe coordination environment. This local structural inhomogeneity alters the orbital overlap, changing the dipole contribution from admixed chalcogen p states for peak A. Consequently, the simultaneous presence of these distinct local environments broadens the 1s to 4p transitions associated with peak C. | Full points if the response identifies the apparent broadening of peak C and explains that it is caused by the local inhomogeneity of the ternary system, specifically the coexistence of different Fe-chalcogen (Fe-Se and Fe-Te) bond lengths. |
Review
#1098
FeSe0.25Te0.75
Fe K
▶
LLM Prompt
Sample Information
Material: FeSe0.25Te0.75
Crystal Structure: tetrahedral Fe coordination
Oxidation State: Fe2+
Sample Form: single crystal
Measurement Mode: fluorescence
- FeSe0.25Te0.75 single crystal sample for polarized measurements
Measurement
We plan to measure the Fe K XANES spectrum of this sample.
Questions
Based on all the information above:
1. Describe the expected spectral features of the Fe K-edge XANES for this single crystal sample, specifically focusing on the pre-edge and main edge peaks and their physical origins.
2. How does the polarization of the incident X-ray beam (E||ab vs E||c) affect the intensity of the pre-peak (A) and peak C in this sample, and what does this indicate about the electronic structure?
3. What is the expected oxidation state of Fe in this compound, and how is the intensity of the feature at ~7117 eV (peak B) affected by X-ray polarization?
Ground Truth
Compound: FeSe0.25Te0.75
Oxidation state: Fe2+
Measurement: Fe K-edge fluorescence
Edge position: not reported
Spectral shape: Significant polarization dependence of Fe K-edge features, particularly pre-peak A and peak C.
Labeled peaks:
| Label | Energy (eV) | Intensity | Origin | Source |
|---|---|---|---|---|
| A | 7111 | strong polarization dependence, increases from E||ab to E||c | 1s->3d quadrupole transition with dipole contribution due to admixed p states | paper_data |
| B | 7117 | hardly affected by polarization | 1s->4p transition | paper_data |
| C | 7120 | more intense for E||c | 1s->4p states admixed with the d states of the chalcogen atoms | paper_data |
Distinguishing features: Strong polarization dependence of peaks A and C.
Key reasoning: The polarized Fe K-edge XANES spectra of the FeSe0.25Te0.75 single crystal show strong polarization dependence. The pre-peak A (1s->3d) increases significantly from E||ab to E||c (75 deg), indicating increased density of unoccupied Fe 3d states admixed with chalcogen p states along the c-axis. Peak C (1s->4p admixed with chalcogen d) is also more intense for E||c due to higher density of states for Fe 4p/chalcogen d hybrid bands along the c-axis. Peak B is hardly affected.
Reasoning source: Section 3.1, page 4-5
Scoring Rubric (total: 100 pts)
| Q | Type | Max | Question | Reference Answer | Scoring Criteria |
|---|---|---|---|---|---|
| q1 | spectral | 40 | Describe the expected spectral features of the Fe K-edge XANES for this single crystal sample, specifically focusing on the pre-edge and main edge peaks and their physical origins. | The expected Fe K-edge XANES spectrum for this FeSe0.25Te0.75 single crystal exhibits three main features labeled A, B, and C, which show significant polarization dependence. Pre-peak A at ~7111 eV originates from a 1s->3d quadrupole transition with a dipole contribution due to admixed p states. Peak B at ~7117 eV corresponds to a 1s->4p transition, while peak C at ~7120 eV arises from 1s->4p states admixed with the d states of the chalcogen atoms. These specific spectral features and their strong polarization dependence arise because the sample is a single crystal with tetrahedral Fe coordination, allowing the polarized X-ray beam to probe the directional density of unoccupied states along different crystallographic axes. | 10 points for mentioning pre-peak A at ~7111 eV (1s->3d transition with p-admixing). 10 points for mentioning peak B at ~7117 eV (1s->4p transition). 10 points for mentioning peak C at ~7120 eV (1s->4p admixed with chalcogen d). 10 points for noting the strong polarization dependence of the features. |
| q2 | reasoning | 40 | How does the polarization of the incident X-ray beam (E||ab vs E||c) affect the intensity of the pre-peak (A) and peak C in this sample, and what does this indicate about the electronic structure? | In this FeSe0.25Te0.75 single crystal, the intensities of both pre-peak A (~7111 eV) and peak C (~7120 eV) increase significantly as the X-ray polarization changes from E||ab to E||c. This strong polarization dependence occurs because the single crystal sample allows the polarized beam to probe directional electronic states. Specifically, the increase in pre-peak A indicates an increased density of unoccupied Fe 3d states admixed with chalcogen p states along the c-axis. Similarly, the higher intensity of peak C for E||c reflects a higher density of states for Fe 4p/chalcogen d hybrid bands along the c-axis. | 10 points for stating pre-peak A increases from E||ab to E||c. 10 points for stating peak C is more intense for E||c. 10 points for explaining that the increase in peak A indicates increased density of unoccupied Fe 3d states admixed with chalcogen p states along the c-axis. 10 points for explaining that the increase in peak C is due to higher density of states for Fe 4p/chalcogen d hybrid bands along the c-axis. |
| q3 | identification | 20 | What is the expected oxidation state of Fe in this compound, and how is the intensity of the feature at ~7117 eV (peak B) affected by X-ray polarization? | The expected oxidation state of Fe in the FeSe0.25Te0.75 sample is Fe2+. The intensity of the feature at ~7117 eV (peak B) is hardly affected by the X-ray polarization. This specific oxidation state is expected because the sample is a pure FeSe0.25Te0.75 single crystal (1.0 fraction) containing Fe2+ in a tetrahedral coordination. While other peaks show strong directional dependence due to orbital hybridization along specific axes in the crystal, peak B, which originates from a standard 1s->4p transition, lacks this strong directional sensitivity to the polarized beam. | 10 points for identifying the oxidation state as Fe2+. 10 points for stating that peak B is hardly affected by polarization. |
Review
Magnetic anisotropy and entropy change in trigonal Cr5Te8
BNL-NSLS-II-8-ID
Pure Phase
Yu Liu et al.
DOI: 10.1103/PhysRevB.100.245114
1 scenario
▶
#1099
Cr5Te8
Cr K
▶
LLM Prompt
Sample Information
Material: Cr5Te8
Crystal Structure: trigonal (P-3m1)
Oxidation State: Cr3+
Sample Form: single crystal
Measurement Mode: fluorescence
- Trigonal Cr5Te8 single crystal measured at room temperature
Measurement
We plan to measure the Cr K XANES spectrum of this sample.
Questions
Based on all the information above:
1. What is the expected oxidation state of Chromium in this Cr5Te8 single crystal, and what specific reference compound's spectrum does it closely resemble to support this assignment?
2. What specific electronic transition is responsible for the pre-edge peak observed in the Cr K-edge XANES spectrum of this material?
3. With which specific ligand orbitals do the Cr 3d states hybridize to influence the characteristics of the observed pre-edge feature?
Ground Truth
Compound: Cr5Te8
Oxidation state: Cr3+
Measurement: Cr K-edge, fluorescence mode, 8-ID beamline of NSLS II (BNL)
Edge position: not explicitly reported in text, main edge rises around 6000 eV in Figure 1(b)
Spectral shape: The spectrum exhibits a weak pre-edge peak followed by a main absorption edge, closely resembling the spectrum of Cr2Te3.
Labeled peaks:
| Label | Energy (eV) | Intensity | Origin | Source |
|---|---|---|---|---|
| prepeak | ~5993 eV (estimated from Figure 1b) | weak | direct quadrupole transition to unoccupied 3d states that are hybridized with Te p orbitals | paper_data |
Distinguishing features: The XANES spectrum is close to that of Cr2Te3 with a Cr3+ state.
Key reasoning: The XANES spectrum of the Cr5Te8 single crystal is close to that of Cr2Te3, indicating a Cr3+ state. A prepeak feature is observed, which is attributed to a direct quadrupole transition to unoccupied 3d states hybridized with Te p orbitals.
Reasoning source: Section III. RESULTS AND DISCUSSION, page 5
Scoring Rubric (total: 100 pts)
| Q | Type | Max | Question | Reference Answer | Scoring Criteria |
|---|---|---|---|---|---|
| q1 | reasoning | 40 | What is the expected oxidation state of Chromium in this Cr5Te8 single crystal, and what specific reference compound's spectrum does it closely resemble to support this assignment? | The expected oxidation state of Chromium in the Cr5Te8 single crystal is Cr3+. The measured XANES spectrum closely resembles that of the reference compound Cr2Te3, which strongly supports this assignment. This oxidation state arises directly from the sample's specific composition and trigonal (P-3m1) crystal structure, which dictate the local electronic environment of the chromium atoms. Because the Cr5Te8 single crystal shares similar Cr-Te bonding characteristics and valence electron configurations with Cr2Te3, their XANES spectra exhibit matching features indicative of the Cr3+ state. | Award 20 points for identifying the Cr3+ oxidation state. Award 20 points for stating that the spectrum closely resembles that of Cr2Te3. |
| q2 | spectral | 30 | What specific electronic transition is responsible for the pre-edge peak observed in the Cr K-edge XANES spectrum of this material? | The pre-edge peak observed at approximately 5993 eV in the Cr K-edge XANES spectrum is caused by a direct quadrupole transition to unoccupied Cr 3d states. This specific electronic transition arises due to the local coordination environment of the Cr3+ ions within the trigonal (P-3m1) Cr5Te8 single crystal. In this structure, the unoccupied chromium 3d states hybridize with the surrounding tellurium p orbitals. This hybridization and the specific electronic configuration of the sample enable the weak, quadrupole-allowed pre-edge absorption feature characteristic of this material. | Award 30 points for correctly identifying it as a direct quadrupole transition to unoccupied 3d states. |
| q3 | spectral | 30 | With which specific ligand orbitals do the Cr 3d states hybridize to influence the characteristics of the observed pre-edge feature? | The unoccupied Cr 3d states hybridize specifically with the p orbitals of the tellurium (Te) ligands. This hybridization is a direct consequence of the sample's composition as a Cr5Te8 single crystal and its trigonal (P-3m1) crystal structure, where Cr3+ ions are coordinated by tellurium atoms. The orbital mixing between the chromium metal center and the tellurium ligands alters the local electronic structure. As a result, this hybridization enables and characterizes the weak pre-edge peak at ~5993 eV, which corresponds to a direct quadrupole transition into these mixed 3d-p states. | Award 30 points for specifying that the Cr 3d states are hybridized with Te p orbitals. |
Review
Three-dimensional Ising ferrimagnetism of Cr-Fe-Cr trimers in FeCr2Te4
BNL-NSLS-II-8-ID
Pure Phase
Yu Liu et al.
DOI: 10.1103/PhysRevB.102.085158
1 scenario
▶
#1100
FeCr2Te4
Fe K-edge
▶
LLM Prompt
Sample Information
Material: FeCr2Te4
Crystal Structure: monoclinic, I2/m space group
Oxidation State: Fe2+
Sample Form: single crystal
Measurement Mode: fluorescence
- Single crystal FeCr2Te4 measured at room temperature
Measurement
We plan to measure the Fe K-edge XANES spectrum of this sample.
Questions
Based on all the information above:
1. Describe the expected spectral features of the Fe K-edge XANES for this FeCr2Te4 single crystal, specifically regarding the pre-edge and main edge.
2. How does the prepeak feature of the Fe K-edge compare to the Cr K-edge in this material, and what structural information does this comparison provide?
3. Based on the XANES edge features, what is the expected oxidation state of Fe in this compound?
Ground Truth
Compound: FeCr2Te4
Oxidation state: Fe2+
Measurement: Fe K-edge XANES in fluorescence mode at 8-ID beamline of NSLS II
Edge position: not reported
Spectral shape: The spectrum exhibits a prepeak feature and edge features characteristic of the Fe2+ oxidation state.
Labeled peaks:
| Label | Energy (eV) | Intensity | Origin | Source |
|---|---|---|---|---|
| prepeak feature | not reported | weaker than Cr K-edge prepeak | not discussed in this paper | paper_data |
Distinguishing features: The prepeak feature is weaker than the corresponding prepeak in the Cr K-edge spectrum of the same material, indicating weaker lattice distortion in FeTe6 compared to CrTe6.
Key reasoning: The normalized Fe K-edge XANES spectrum shows a prepeak feature indicating the local atomic environment for Fe atoms. The edge features are close to standard compounds with Fe2+ oxidation states, which is consistent with the core-level XPS results. The prepeak feature for the Fe K-edge is somewhat weaker than that of the Cr K-edge, suggesting a weaker lattice distortion in the FeTe6 octahedra compared to CrTe6.
Reasoning source: Page 4, RESULTS AND DISCUSSIONS section
Scoring Rubric (total: 100 pts)
| Q | Type | Max | Question | Reference Answer | Scoring Criteria |
|---|---|---|---|---|---|
| q1 | spectral | 35 | Describe the expected spectral features of the Fe K-edge XANES for this FeCr2Te4 single crystal, specifically regarding the pre-edge and main edge. | The expected Fe K-edge XANES spectrum for this FeCr2Te4 single crystal will exhibit a distinct prepeak feature and main edge features characteristic of an Fe2+ oxidation state. Because the sample is a pure FeCr2Te4 single crystal measured at room temperature, the spectrum reflects a 100% phase fraction of this specific monoclinic I2/m structure. The main edge position aligns with standard Fe2+ compounds, which directly results from the intrinsic Fe2+ oxidation state of the material. Furthermore, the prepeak feature arises from the local atomic environment of the Fe atoms within the FeTe6 octahedra. This prepeak is notably weaker than the corresponding Cr K-edge prepeak, which occurs because there is a weaker lattice distortion in the FeTe6 octahedra compared to the CrTe6 octahedra in this crystal structure. | Award 15 points for mentioning the presence of a prepeak feature. Award 20 points for stating that the main edge features are characteristic of the Fe2+ oxidation state. |
| q2 | reasoning | 40 | How does the prepeak feature of the Fe K-edge compare to the Cr K-edge in this material, and what structural information does this comparison provide? | In this FeCr2Te4 single crystal, the prepeak feature of the Fe K-edge is somewhat weaker than the prepeak observed at the Cr K-edge. Because the sample crystallizes in a monoclinic I2/m space group, the local atomic environments of the Fe and Cr atoms differ within the lattice. The weaker Fe prepeak indicates that there is a weaker lattice distortion in the FeTe6 octahedra compared to the CrTe6 octahedra. This structural difference arises directly from the intrinsic crystallographic properties and atomic arrangements of the pure FeCr2Te4 material at room temperature. Consequently, the prepeak comparison serves as a direct probe of the relative local octahedral distortions around the different transition metal sites. | Award 20 points for stating that the Fe K-edge prepeak is weaker than the Cr K-edge prepeak. Award 20 points for explaining that this suggests a weaker lattice distortion in the FeTe6 local environment compared to CrTe6. |
| q3 | identification | 25 | Based on the XANES edge features, what is the expected oxidation state of Fe in this compound? | Based on the XANES edge features, the expected oxidation state of Fe in this compound is Fe2+. Because the sample is a pure FeCr2Te4 single crystal measured at room temperature, the spectrum represents a 100% fraction of this specific monoclinic phase. The main edge features of the spectrum closely match those of standard compounds with known Fe2+ oxidation states. This spectral alignment occurs because the intrinsic electronic structure and composition of the FeCr2Te4 crystal dictate an Fe2+ state, a finding that is also consistent with core-level XPS results. Therefore, the observed edge features are a direct consequence of the Fe2+ ions present in the sample's crystal lattice. | Award 25 points for correctly identifying the oxidation state as Fe2+. |
Review
Three-dimensional ferromagnetism and magnetotransport in van der Waals Mn-intercalated tantalum disufide
BNL-NSLS-II-8-ID
Pure Phase
Yu Liu et al.
DOI: 10.1103/PhysRevB.103.144432
1 scenario
▶
#1101
2H-Mn0.28TaS2
Mn K
▶
LLM Prompt
Sample Information
Material: 2H-Mn0.28TaS2
Crystal Structure: hexagonal
Oxidation State: mixed 2+ and 3+ (close to 2+)
Sample Form: single crystal
Measurement Mode: fluorescence
- Mn-intercalated tantalum disulfide single crystal
Measurement
We plan to measure the Mn K XANES spectrum of this sample.
Questions
Based on all the information above:
1. What is the expected threshold energy (E0) for the Mn K-edge XANES spectrum of this material, and how is this value determined from the spectral data?
2. Based on the expected threshold energy, what is the predicted oxidation state of Mn in the 2H-Mn0.28TaS2 single crystal?
Ground Truth
Compound: 2H-Mn0.28TaS2
Oxidation state: mixed 2+ and 3+ (close to 2+)
Measurement: Mn K-edge, fluorescence mode, 8-ID beamline of NSLS II
Edge position: 6545
Spectral shape: The XANES spectrum shows a main absorption edge with a threshold energy at 6545 eV, determined from the peak of the derivative curve.
Labeled peaks:
| Label | Energy (eV) | Intensity | Origin | Source |
|---|---|---|---|---|
| threshold energy (E0) | 6545 | not explicitly quantified (peak of derivative) | main absorption edge | paper_data |
Distinguishing features: not discussed in this paper
Key reasoning: The threshold energy E0 = 6545 eV obtained from the peak of the derivative curve indicates a mixed 2+ and 3+ valence but close to the Mn2+ state. EXAFS analysis confirms that Mn is well intercalated in the vdW gap of the 2H-TaS2 crystal, with the main peak corresponding to six nearest-neighbor Mn-S at 2.50(1) Å and two next-nearest Mn-Ta at 3.12(11) Å.
Reasoning source: RESULTS AND DISCUSSIONS section, page 4
Scoring Rubric (total: 100 pts)
| Q | Type | Max | Question | Reference Answer | Scoring Criteria |
|---|---|---|---|---|---|
| q1 | spectral | 50 | What is the expected threshold energy (E0) for the Mn K-edge XANES spectrum of this material, and how is this value determined from the spectral data? | The expected threshold energy (E0) for the Mn K-edge XANES spectrum of this material is 6545 eV. This value is determined by identifying the peak of the derivative curve of the main absorption edge. This specific spectral feature arises because the Mn atoms are intercalated into the van der Waals gap of the hexagonal 2H-TaS2 single crystal, coordinating with six nearest-neighbor sulfur atoms at 2.50 Å and two next-nearest tantalum atoms at 3.12 Å. This local structural environment results in a mixed 2+ and 3+ (close to 2+) oxidation state, which directly dictates the electronic transitions that produce the 6545 eV threshold energy. | Award full points if the answer correctly identifies the threshold energy as 6545 eV and states that it is determined from the peak of the derivative curve. |
| q2 | reasoning | 50 | Based on the expected threshold energy, what is the predicted oxidation state of Mn in the 2H-Mn0.28TaS2 single crystal? | Based on the threshold energy, the predicted oxidation state of Mn in the 2H-Mn0.28TaS2 single crystal is a mixed 2+ and 3+ valence, though it is predominantly close to the Mn2+ state. This specific oxidation state occurs because the Mn atoms are intercalated into the van der Waals gap of the hexagonal 2H-TaS2 crystal structure. In this environment, the Mn ions coordinate with six nearest-neighbor S atoms at 2.50 Å and two next-nearest Ta atoms at 3.12 Å, which governs the local charge distribution and electronic structure. As a result of this structural configuration, the measured threshold energy (E0) shifts to 6545 eV, providing direct spectral confirmation of the mixed, near-2+ valence state. | Award full points if the answer states that the oxidation state is a mixed 2+ and 3+ valence, but close to the Mn2+ state. |
Review
Polaronic transport and thermoelectricity in Mn3Si2Te6 single crystals
BNL-NSLS-II-8-ID
Pure Phase
Yu Liu et al.
DOI: 10.1103/PhysRevB.103.245122
1 scenario
▶
#1102
Mn3Si2Te6
Mn K
▶
LLM Prompt
Sample Information
Material: Mn3Si2Te6
Crystal Structure: P-31c
Oxidation State: mixed valence close to 2+
Sample Form: single crystal
Measurement Mode: fluorescence
- Mn3Si2Te6 single crystal grown by a self-flux method
Measurement
We plan to measure the Mn K XANES spectrum of this sample.
Questions
Based on all the information above:
1. Based on the sample information, what is the expected oxidation state of Mn in this compound, and what specific spectral feature indicates this?
2. Describe the local coordination environment of the Mn atoms in this material that would influence the XANES spectrum.
Ground Truth
Compound: Mn3Si2Te6
Oxidation state: mixed valence close to 2+
Measurement: Mn K-edge XANES, fluorescence mode, 8-ID beamline of NSLS II
Edge position: 6544
Spectral shape: Normalized Mn K-edge XANES spectrum showing a main absorption edge with a threshold energy at 6.544 keV obtained from the peak of the derivative curve.
Distinguishing features: not discussed in this paper
Key reasoning: The threshold energy (E0) obtained from the peak of the derivative curve is about 6.544 keV for Mn. This energy position indicates a mixed valence state that is close to the Mn2+ state. The local structure consists of MnTe6 octahedra (Mn1 site) and interlayer Mn2 atoms.
Reasoning source: Page 4, RESULTS AND DISCUSSIONS section
Scoring Rubric (total: 100 pts)
| Q | Type | Max | Question | Reference Answer | Scoring Criteria |
|---|---|---|---|---|---|
| q1 | spectral | 57 | Based on the sample information, what is the expected oxidation state of Mn in this compound, and what specific spectral feature indicates this? | The expected oxidation state of Mn in the Mn3Si2Te6 single crystal is a mixed valence state close to 2+. This is indicated by the main absorption edge having a threshold energy (E0) of approximately 6.544 keV, which is determined from the peak of the derivative curve. This specific spectral feature arises directly from the sample conditions, specifically the stoichiometry and P-31c crystal structure of the self-flux grown crystal. The resulting local coordination environment dictates the electronic configuration, producing the 6.544 keV edge position that is characteristic of this mixed valence state near Mn2+. | Full credit for stating a mixed valence close to 2+ and identifying the threshold energy/edge position at 6.544 keV (6544 eV). |
| q2 | reasoning | 43 | Describe the local coordination environment of the Mn atoms in this material that would influence the XANES spectrum. | The local coordination environment of the Mn atoms in this material consists of MnTe6 octahedra at the Mn1 site, along with interlayer Mn2 atoms. This specific structural arrangement arises because the Mn3Si2Te6 single crystal, grown via a self-flux method, crystallizes in the P-31c space group. This distinct coordination environment directly dictates the electronic properties of the sample, resulting in a mixed valence state close to Mn2+. Consequently, these structural and electronic conditions influence the XANES spectrum by establishing the main absorption edge threshold energy at approximately 6.544 keV. | Full credit for mentioning MnTe6 octahedra (Mn1 site) and/or interlayer Mn2 atoms. |
Review
RNiO3perovskites (R=Pr,Nd): Nickel valence and the metal-insulator transition investigated by x-ray-absorption spectroscopy
APS
Pure Phase
M. Medarde et al.
DOI: 10.1103/PhysRevB.46.14975
3 scenarios
▶
#1103
PrNiO3
Ni L3
▶
LLM Prompt
Sample Information
Material: PrNiO3
Crystal Structure: perovskite
Oxidation State: 3+
- PrNiO3 perovskite measured above and below the metal-insulator transition temperature (135 K)
Measurement
We plan to measure the Ni L3 XANES spectrum of this sample.
Questions
Based on all the information above:
1. Based on the provided information, what is the expected electronic ground state character of PrNiO3, and how does it distinguish this material from hole-doped nickelates?
2. What physical transition occurs in this PrNiO3 sample at 135 K, and what is the formal oxidation state of Ni in this compound?
Ground Truth
Compound: PrNiO3
Oxidation state: 3+
Measurement: Ni L3-edge
Edge position: not reported
Spectral shape: not reported
Distinguishing features: Strongly hybridized ground state of mainly 3d7 character, contrasting with hole-doped Ni1-xLixO and La2-xSrxNiO4+delta.
Key reasoning: PrNiO3 is a perovskite that undergoes a metal-insulator transition at 135 K. Its electronic structure is characterized by a strongly hybridized ground state of mainly 3d7 character, which contrasts with hole-doped systems like Ni1-xLixO and La2-xSrxNiO4+delta.
Reasoning source: text
Scoring Rubric (total: 100 pts)
| Q | Type | Max | Question | Reference Answer | Scoring Criteria |
|---|---|---|---|---|---|
| q1 | reasoning | 57 | Based on the provided information, what is the expected electronic ground state character of PrNiO3, and how does it distinguish this material from hole-doped nickelates? | The expected electronic ground state of the PrNiO3 sample is characterized by a strongly hybridized state of mainly 3d7 character. This specific electronic structure arises because the material is a pure perovskite containing nickel in a formal 3+ oxidation state. Consequently, this strongly hybridized 3d7 ground state directly distinguishes PrNiO3 from hole-doped nickelate systems, such as Ni1-xLixO and La2-xSrxNiO4+delta. These intrinsic electronic properties dictate the material's behavior during the Ni L3-edge XANES measurements taken above and below its transition temperature. | Award full points if the response identifies the strongly hybridized ground state of mainly 3d7 character and notes that it contrasts with hole-doped systems like Ni1-xLixO and La2-xSrxNiO4+delta. |
| q2 | identification | 43 | What physical transition occurs in this PrNiO3 sample at 135 K, and what is the formal oxidation state of Ni in this compound? | The PrNiO3 sample undergoes a metal-insulator transition at 135 K, and the formal oxidation state of Ni in this compound is 3+. These properties are expected because the sample consists of a 100% phase fraction of pure PrNiO3 perovskite, which intrinsically possesses this 3+ oxidation state. The presence of the Ni 3+ state results in a strongly hybridized 3d7 electronic ground state, which provides the physical mechanism for the metal-insulator transition at 135 K. Therefore, measuring the Ni L3-edge XANES spectrum above and below this 135 K threshold captures the distinct electronic changes associated with this transition. | Award 15 points for identifying the metal-insulator transition at 135 K, and 15 points for stating the Ni oxidation state is 3+. |
Review
#1104
NdNiO3
Ni L3
▶
LLM Prompt
Sample Information
Material: NdNiO3
Crystal Structure: perovskite
Oxidation State: 3+
- NdNiO3 perovskite measured above and below the metal-insulator transition temperature (200 K)
Measurement
We plan to measure the Ni L3 XANES spectrum of this sample.
Questions
Based on all the information above:
1. What is the expected phase composition of this sample?
2. Describe the expected ground state electronic character of this NdNiO3 sample.
3. Which specific materials is the electronic structure of this NdNiO3 sample explicitly contrasted against?
Ground Truth
Compound: NdNiO3
Oxidation state: 3+
Measurement: Ni L3-edge
Edge position: not reported
Spectral shape: not reported
Distinguishing features: Strongly hybridized ground state of mainly 3d7 character, in contrast to hole-doped Ni1-xLixO and La2-xSrxNiO4+delta.
Key reasoning: The electronic structure is characterized by a strongly hybridized ground state of mainly 3d7 character, in contrast to hole-doped Ni1-xLixO and La2-xSrxNiO4+delta.
Reasoning source: Sample description text
Scoring Rubric (total: 100 pts)
| Q | Type | Max | Question | Reference Answer | Scoring Criteria |
|---|---|---|---|---|---|
| q1 | identification | 20 | What is the expected phase composition of this sample? | The expected phase composition of this sample is 100% NdNiO3 (a fraction of 1.0). This pure phase composition is expected because the sample is synthesized as a specific NdNiO3 perovskite material with a nominal Ni 3+ oxidation state. Maintaining this pure phase is necessary to accurately measure the material above and below its metal-insulator transition temperature of 200 K. Consequently, the pure composition ensures that the observed strongly hybridized ground state of mainly 3d7 character is intrinsic to the NdNiO3 perovskite lattice. | Must state that the sample is a 100% pure phase of NdNiO3. |
| q2 | reasoning | 40 | Describe the expected ground state electronic character of this NdNiO3 sample. | The expected ground state electronic character of this NdNiO3 sample is strongly hybridized and mainly of 3d7 character. This specific electronic configuration arises because the sample is a pure NdNiO3 perovskite with a nominal Ni 3+ oxidation state. As the material is measured across its metal-insulator transition temperature (200 K), this strongly hybridized 3d7 ground state dictates its intrinsic electronic behavior. This distinct character reflects the unique bonding environment of the pure NdNiO3 perovskite lattice, setting it apart from hole-doped systems. | Must explicitly mention a strongly hybridized ground state of mainly 3d7 character. |
| q3 | identification | 40 | Which specific materials is the electronic structure of this NdNiO3 sample explicitly contrasted against? | The electronic structure of this NdNiO3 sample is explicitly contrasted against hole-doped Ni1-xLixO and La2-xSrxNiO4+delta. This comparison is made because, unlike those hole-doped reference materials, the pure NdNiO3 perovskite sample possesses a nominal Ni 3+ oxidation state that yields a strongly hybridized ground state of mainly 3d7 character. By measuring the NdNiO3 sample above and below its 200 K metal-insulator transition, its unique intrinsic 3d7 electronic structure can be clearly distinguished from the hole-doped mechanisms driving the properties of Ni1-xLixO and La2-xSrxNiO4+delta. | Must identify hole-doped Ni1-xLixO and La2-xSrxNiO4+delta. |
Review
#1105
NiO
Ni L3
▶
LLM Prompt
Sample Information
Material: NiO
Oxidation State: 2+
Sample Form: bulk
- Bulk NiO used as a reference for quantitative Ni L3-edge XAS analysis
Measurement
We plan to measure the Ni L3 XANES spectrum of this sample.
Questions
Based on all the information above:
1. What is the expected oxidation state and electronic configuration for this bulk NiO sample?
2. What is the primary purpose of measuring this bulk NiO sample in the context of Ni L3-edge XAS?
3. What is the expected phase composition of this sample?
Ground Truth
Compound: NiO
Oxidation state: 2+
Measurement: Ni L3-edge XAS (mode and beamline not reported)
Edge position: not reported
Spectral shape: not reported
Distinguishing features: not reported
Key reasoning: Bulk NiO is used as a standard reference material for quantitative Ni L3-edge XAS analysis. It represents a pure Ni2+ 3d8 electronic configuration.
Reasoning source: Sample description text
Scoring Rubric (total: 100 pts)
| Q | Type | Max | Question | Reference Answer | Scoring Criteria |
|---|---|---|---|---|---|
| q1 | identification | 30 | What is the expected oxidation state and electronic configuration for this bulk NiO sample? | The expected oxidation state for this sample is 2+, which corresponds to a pure 3d8 electronic configuration. This specific electronic state arises directly from the sample's composition as bulk NiO. Because the material is utilized as a standard reference for quantitative Ni L3-edge XAS analysis, it is expected to exhibit this pure, unmixed electronic state. Therefore, the bulk NiO provides a reliable and well-defined baseline for the Ni2+ 3d8 configuration. | Full points for identifying the oxidation state as 2+ and the electronic configuration as Ni2+ 3d8. |
| q2 | reasoning | 40 | What is the primary purpose of measuring this bulk NiO sample in the context of Ni L3-edge XAS? | The primary purpose of measuring this sample is to use it as a standard reference material for quantitative Ni L3-edge XAS analysis. This is because the sample consists of pure bulk NiO, which provides a well-defined and stable baseline for spectroscopic measurements. Specifically, the bulk NiO represents a pure Ni2+ 3d8 electronic configuration. By establishing this pure reference spectrum, researchers can perform accurate quantitative fitting and oxidation state analysis on other nickel-containing samples. | Full points for stating it is used as a reference standard for quantitative Ni L3-edge XAS analysis. |
| q3 | identification | 30 | What is the expected phase composition of this sample? | The expected phase composition of this sample is 100% bulk NiO, corresponding to a phase fraction of 1.0. This pure composition is expected because the sample is explicitly prepared and utilized as a standard reference material for quantitative Ni L3-edge XAS analysis. To function as an accurate reference, the material must consist entirely of the bulk NiO phase without secondary phases or mixed valency. This ensures it perfectly represents the pure Ni2+ 3d8 electronic configuration required for baseline measurements. | Full points for identifying it as a pure phase (100%) of nickel oxide (NiO). |
Review
Angular dependence of x-ray absorption spectrum for field-aligned iron-based superconductors
BNL-NSLS-II-8-ID
Pure Phase
B. C. Chang et al.
DOI: 10.1103/PhysRevB.80.165108
1 scenario
▶
#1106
(Sm0.95La0.05)FeAs(O0.85F0.15)
Fe K
▶
LLM Prompt
Sample Information
Material: (Sm0.95La0.05)FeAs(O0.85F0.15)
Crystal Structure: ZrCuAsSi-type (1111) tetragonal (P4/nmm)
Oxidation State: Fe2+ (itinerant)
Sample Form: aligned microcrystalline powder
Measurement Mode: fluorescence
- Field-aligned superconducting microcrystalline powder
Measurement
We plan to measure the Fe K XANES spectrum of this sample.
Questions
Based on all the information above:
1. Describe the expected spectral shape and key features of the Fe K-edge XANES for this aligned microcrystalline powder.
2. What are the physical origins of the pre-edge peak A and the main peak B in the Fe K-edge spectrum of this compound?
3. How does the main edge position of this compound compare to a standard FeO (Fe2+) reference, and what does this indicate about the Fe oxidation state and electronic structure?
4. Given that the sample is a field-aligned microcrystalline powder, what angular dependence or structural sensitivity is expected in the pre-edge peak when varying the polarization of the incident X-rays?
Ground Truth
Compound: (Sm0.95La0.05)FeAs(O0.85F0.15)
Oxidation state: Fe2+ (itinerant) with some Fe1+-3d7 character
Measurement: Fe K-edge fluorescence at BL-16A NSRRC
Edge position: 7111.8
Spectral shape: Two distinct features: pre-edge peak A near the inflection point E0 = 7111.8 eV, and main peak B riding on top of the step-onset feature.
Labeled peaks:
| Label | Energy (eV) | Intensity | Origin | Source |
|---|---|---|---|---|
| A (pre-edge) | 7112.8 (theta=80°), 7113 (theta=0°) | strong | Fe-1s to unoccupied Fe-3d/As-4p hybrid bands | paper_data |
| B (main peak) | not reported | strong | dipole transition to Fe-4p/As-4d hybrid bands | paper_data |
Distinguishing features: Angular dependence of pre-edge peak A indicates larger DOS of unoccupied Fe-3d/As-4p conduction bands close to the c-axis (theta=80°). The spectrum exhibits a chemical shift to lower energy compared to FeO.
Key reasoning: The chemical shift of the main edge to lower energy compared to FeO is consistent with the itinerant character of Fe2+-3d6 orbital in the FeAs conduction layer for the electron doped (with some Fe1+-3d7 character) superconductor. The strong pre-edge peak A indicates that the local FeAs4 tetrahedral ligand field explicitly allows the dipole transition into unoccupied Fe-3d/As-4p hybrid bands.
Reasoning source: Section III. RESULTS AND DISCUSSION, pages 2-3
Scoring Rubric (total: 100 pts)
| Q | Type | Max | Question | Reference Answer | Scoring Criteria |
|---|---|---|---|---|---|
| q1 | spectral | 25 | Describe the expected spectral shape and key features of the Fe K-edge XANES for this aligned microcrystalline powder. | The expected Fe K-edge XANES spectrum exhibits two distinct features: a strong pre-edge peak A near the inflection point of 7111.8 eV, and a main peak B riding on top of the step-onset feature. Because the sample is a field-aligned microcrystalline powder, the spectrum will also display angular dependence, particularly in the pre-edge region. These specific spectral features arise because the local FeAs4 tetrahedral ligand field in the ZrCuAsSi-type (1111) structure explicitly allows dipole transitions into unoccupied Fe-3d/As-4p hybrid bands. Furthermore, the angular dependence reflects a larger density of states of these unoccupied conduction bands close to the c-axis (theta=80°). | Award full points if the answer mentions the inflection point around 7111.8 eV, a strong pre-edge peak (A), and a main peak (B) riding on the step-onset feature. |
| q2 | reasoning | 25 | What are the physical origins of the pre-edge peak A and the main peak B in the Fe K-edge spectrum of this compound? | The pre-edge peak A originates from the transition of Fe-1s electrons to unoccupied Fe-3d/As-4p hybrid bands, while the main peak B arises from dipole transitions to Fe-4p/As-4d hybrid bands. These specific transitions occur because the material's ZrCuAsSi-type (1111) crystal structure provides a local FeAs4 tetrahedral ligand field. This specific tetrahedral geometry explicitly allows the dipole transition into the hybridized Fe-3d/As-4p states, resulting in the strong pre-edge feature. The presence of these hybrid bands is a direct consequence of the FeAs conduction layer in this electron-doped superconductor. | Award full points if the answer correctly attributes the pre-edge peak to the transition of Fe-1s core electrons to unoccupied Fe-3d/As-4p hybrid bands (allowed by the tetrahedral ligand field) and the main peak to the dipole transition to Fe-4p/As-4d hybrid bands. |
| q3 | reasoning | 25 | How does the main edge position of this compound compare to a standard FeO (Fe2+) reference, and what does this indicate about the Fe oxidation state and electronic structure? | The main edge position of this compound (E0 = 7111.8 eV) exhibits a chemical shift to lower energy compared to a standard FeO (Fe2+) reference. This shift indicates that the Fe oxidation state is nominally Fe2+ but possesses an itinerant character with some Fe1+-3d7 character. This specific electronic structure arises because the (Sm0.95La0.05)FeAs(O0.85F0.15) sample is an electron-doped superconductor. The doping introduces itinerant electrons into the Fe2+-3d6 orbitals within the FeAs conduction layer, lowering the effective binding energy relative to the localized electrons in FeO. | Award full points if the answer notes a chemical shift to slightly lower energy compared to FeO, indicating an itinerant Fe2+-3d6 character with some Fe1+-3d7 character due to electron doping. |
| q4 | prediction | 25 | Given that the sample is a field-aligned microcrystalline powder, what angular dependence or structural sensitivity is expected in the pre-edge peak when varying the polarization of the incident X-rays? | When varying the polarization of the incident X-rays, the pre-edge peak A will exhibit a distinct angular dependence, shifting from 7113 eV at theta=0° to 7112.8 eV at theta=80°. This angular sensitivity is expected because the sample is prepared as a field-aligned microcrystalline powder, which macroscopically aligns the anisotropic ZrCuAsSi-type (1111) tetragonal crystals. Consequently, the polarization-dependent measurements reveal a larger density of states (DOS) of the unoccupied Fe-3d/As-4p conduction bands close to the c-axis (theta=80°). This directional DOS is a direct result of the highly layered FeAs conduction structure in the aligned superconducting material. | Award full points if the answer describes that the pre-edge peak exhibits angular dependence, showing a larger density of states (DOS) for unoccupied Fe-3d/As-4p conduction bands close to the c-axis (e.g., theta=80°), with corresponding shifts in peak maximum energy. |
Review
Weak magnetism in insulating and superconducting cuprates
BNL-NSLS-II-8-ID
Pure Phase
G. M. De Luca et al.
DOI: 10.1103/PhysRevB.82.214504
1 scenario
▶
#1107
La2CuO4
Cu L
▶
LLM Prompt
Sample Information
Material: La2CuO4
Oxidation State: 2+
- Undoped insulating cuprate
Measurement
We plan to measure the Cu L XANES spectrum of this sample.
Questions
Based on all the information above:
1. Based on the provided sample conditions, identify the specific compound and the oxidation state of copper in this undoped insulating cuprate.
2. Describe the magnetic interactions of the Cu2+ ions within the CuO2 planes for this material, specifically regarding the out-of-plane spin moment.
3. What specific physical interaction is responsible for the canting of the antiferromagnetically ordered spins in this system?
Ground Truth
Compound: La2CuO4
Oxidation state: 2+
Measurement: Cu L edge
Edge position: not reported
Spectral shape: not reported
Distinguishing features: not reported
Key reasoning: The sample is an undoped insulating cuprate. The out-of-plane spin moment is related to the canting of the antiferromagnetically ordered Cu2+ spins, which is caused by the Dzyaloshinskii-Moriya interaction within the CuO2 planes.
Reasoning source: Text
Scoring Rubric (total: 100 pts)
| Q | Type | Max | Question | Reference Answer | Scoring Criteria |
|---|---|---|---|---|---|
| q1 | identification | 30 | Based on the provided sample conditions, identify the specific compound and the oxidation state of copper in this undoped insulating cuprate. | Based on the sample conditions, the specific compound is La2CuO4 (present at a 1.0 fraction) and the copper oxidation state is 2+. This pure phase and oxidation state are expected because the material is explicitly prepared as an undoped insulating cuprate. In this pristine undoped condition, the Cu2+ ions within the CuO2 planes undergo antiferromagnetic ordering. The specific structural and electronic properties of this pure La2CuO4 phase give rise to an out-of-plane spin moment caused by the canting of these spins via the Dzyaloshinskii-Moriya interaction. | Award full points if the model correctly identifies the compound as La2CuO4 and the oxidation state as 2+. |
| q2 | reasoning | 40 | Describe the magnetic interactions of the Cu2+ ions within the CuO2 planes for this material, specifically regarding the out-of-plane spin moment. | Within the CuO2 planes of this material, the Cu2+ ions are antiferromagnetically ordered. The out-of-plane spin moment is directly related to the canting of these antiferromagnetically ordered spins. This specific magnetic configuration arises because the sample is an undoped insulating cuprate, which allows the intrinsic magnetic interactions of the pure La2CuO4 lattice to dominate. Consequently, the Dzyaloshinskii-Moriya interaction within the planes is able to cause this spin canting and generate the observed out-of-plane moment. | Award full points if the model explains that the out-of-plane spin moment is related to the canting of the antiferromagnetically ordered Cu2+ spins. |
| q3 | reasoning | 30 | What specific physical interaction is responsible for the canting of the antiferromagnetically ordered spins in this system? | The canting of the antiferromagnetically ordered spins in this system is caused by the Dzyaloshinskii-Moriya interaction within the CuO2 planes. This interaction generates a distinct out-of-plane spin moment. These magnetic features arise precisely because the material is an undoped insulating cuprate with copper in a stable 2+ oxidation state. By remaining undoped, the pure La2CuO4 structure preserves the antiferromagnetic ordering of the Cu2+ spins, allowing the Dzyaloshinskii-Moriya interaction to naturally induce this canting effect. | Award full points if the model explicitly identifies the Dzyaloshinskii-Moriya interaction as the cause of the spin canting. |
Review
Atomic structure relaxation in nanocrystalline NiO studied by EXAFS spectroscopy: Role of nickel vacancies
BNL-NSLS-II-8-ID
Pure Phase
A. Anspoks et al.
DOI: 10.1103/PhysRevB.86.174114
1 scenario
▶
#1108
NiO
Ni K
▶
LLM Prompt
Sample Information
Material: NiO
Crystal Structure: cubic
Oxidation State: 2+
- microcrystalline nickel oxide reference sample
Measurement
We plan to measure the Ni K XANES spectrum of this sample.
Questions
Based on all the information above:
1. What is the expected dominant phase and the oxidation state of nickel in this microcrystalline reference sample?
2. In a comparative X-ray absorption study, what is the primary role of this microcrystalline NiO sample when investigating nanocrystalline NiO?
3. When using this microcrystalline NiO sample as an EXAFS baseline, which specific structural features or regions are analyzed for comparison?
Ground Truth
Compound: NiO
Oxidation state: 2+
Measurement: Ni K-edge
Edge position: not reported
Spectral shape: not reported
Distinguishing features: not reported
Key reasoning: The sample is a microcrystalline nickel oxide reference. It is used as a baseline for comparison with nanocrystalline NiO, specifically utilizing EXAFS analysis of the first two coordination shells of nickel.
Reasoning source: Text description
Scoring Rubric (total: 100 pts)
| Q | Type | Max | Question | Reference Answer | Scoring Criteria |
|---|---|---|---|---|---|
| q1 | identification | 30 | What is the expected dominant phase and the oxidation state of nickel in this microcrystalline reference sample? | The expected dominant phase is cubic NiO with a phase fraction of 1.0, and the oxidation state of nickel is 2+. This pure composition arises because the material is specifically prepared as a microcrystalline nickel oxide reference sample. As a baseline standard used for comparison with nanocrystalline NiO, it must consist entirely of a well-defined, fully crystalline NiO phase. Consequently, this pure cubic structure dictates the stable 2+ oxidation state for all nickel atoms in the sample. | Must identify the phase as NiO (or 100% fraction) and the oxidation state as 2+. |
| q2 | reasoning | 35 | In a comparative X-ray absorption study, what is the primary role of this microcrystalline NiO sample when investigating nanocrystalline NiO? | The primary role of this microcrystalline NiO sample is to serve as a baseline reference for comparison with nanocrystalline NiO. Because the sample is a pure, well-defined cubic NiO material (1.0 fraction) with a stable 2+ oxidation state, its structural and electronic parameters are fully established. This makes it an ideal standard for EXAFS analysis. By comparing the nanocrystalline material against this 100% pure microcrystalline baseline, researchers can accurately identify structural differences in the local atomic environment. | Must state that it serves as a baseline or reference for comparison with the nanocrystalline sample. |
| q3 | reasoning | 35 | When using this microcrystalline NiO sample as an EXAFS baseline, which specific structural features or regions are analyzed for comparison? | When using this microcrystalline NiO sample as an EXAFS baseline, the specific structural features analyzed are the first two coordination shells of nickel. This focus is chosen because the sample is a pure, fully ordered cubic microcrystalline nickel oxide reference with a 2+ oxidation state. Due to this well-defined crystalline structure, the local atomic environment around the nickel atoms provides a highly accurate and predictable standard. Consequently, analyzing these first two coordination shells provides the ideal baseline for identifying structural changes or defects present in nanocrystalline NiO. | Must specify the first two coordination shells of nickel. |
Review
Spin-orbit coupling in iridium-based 5 d compounds probed by x-ray absorption spectroscopy
BNL-NSLS-II-8-ID
Pure Phase
J. P. Clancy et al.
DOI: 10.1103/PhysRevB.86.195131
6 scenarios
▶
#1109
Ir
Ir L3
▶
LLM Prompt
Sample Information
Material: Ir
Crystal Structure: Cubic (Fm-3m)
Oxidation State: 0
Sample Form: powder
Measurement Mode: transmission
- Elemental iridium reference sample
Measurement
We plan to measure the Ir L3 XANES spectrum of this sample.
Questions
Based on all the information above:
1. Describe the expected spectral shape of the Ir L3-edge XANES for elemental Ir powder, including the primary absorption feature and its electronic origin.
2. How does the Ir L3-edge white-line intensity and the L3/L2 branching ratio of elemental Ir (Ir0) compare to those of higher oxidation state Ir compounds (e.g., Ir3+ or Ir4+), and what physical mechanism explains this difference?
3. What is the expected energy position of the white-line feature for elemental Ir, and how does its peak width (FWHM) compare to the other Ir compounds measured?
Ground Truth
Compound: Ir
Oxidation state: 0
Measurement: Ir L3-edge XAS in transmission mode at the HXMA beamline 06ID-1 at the Canadian Light Source (CLS)
Edge position: 11218.1
Spectral shape: Sharp, atomic-like white-line feature corresponding to 2p -> 5d electronic transitions, a step-like edge feature, and fine structure oscillations from backscattering of photoelectrons off neighboring atoms.
Labeled peaks:
| Label | Energy (eV) | Intensity | Origin | Source |
|---|---|---|---|---|
| white line | 11218.1 | 14.3 | 2p3/2 -> 5d transitions | paper_data |
Distinguishing features: Significantly smaller ratio of white-line intensities (L3/L2) compared to Ir3+ or Ir4+ compounds. Absolute intensity of L3 white-line is noticeably lower. Broadest white-line feature among the measured Ir compounds with FWHM = 6.6(1) eV.
Key reasoning: The white-line feature corresponds to 2p -> 5d electronic transitions. The integrated intensity of the white-line feature monotonically increases with oxidation state due to the creation of 5d holes. Elemental Ir (Ir0, 5d7) has the fewest 5d holes among the studied Ir compounds, resulting in the lowest absolute intensity of the L3 white-line and the broadest white-line feature (FWHM = 6.6 eV).
Reasoning source: Section III. RESULTS AND DISCUSSION, pages 3-5
Scoring Rubric (total: 100 pts)
| Q | Type | Max | Question | Reference Answer | Scoring Criteria |
|---|---|---|---|---|---|
| q1 | spectral | 30 | Describe the expected spectral shape of the Ir L3-edge XANES for elemental Ir powder, including the primary absorption feature and its electronic origin. | The expected spectral shape for the elemental Ir powder features a sharp, atomic-like white-line peak, a step-like edge, and fine structure oscillations caused by photoelectron backscattering off neighboring atoms. The primary absorption feature is the white line located at 11218.1 eV with an intensity of 14.3. This specific spectral shape arises because the sample is elemental iridium with an oxidation state of 0 (Ir0, 5d7 configuration). In this state, the white-line feature originates directly from 2p3/2 to 5d electronic transitions, and because Ir0 has the fewest 5d holes compared to higher oxidation states, this transition results in the lowest absolute white-line intensity among Ir compounds. | Full credit for mentioning the sharp, atomic-like white-line feature, the step-like edge, fine structure oscillations, and correctly identifying the origin as 2p3/2 -> 5d electronic transitions. |
| q2 | reasoning | 40 | How does the Ir L3-edge white-line intensity and the L3/L2 branching ratio of elemental Ir (Ir0) compare to those of higher oxidation state Ir compounds (e.g., Ir3+ or Ir4+), and what physical mechanism explains this difference? | Elemental Ir (Ir0) exhibits a noticeably lower absolute L3 white-line intensity and a significantly smaller L3/L2 white-line intensity ratio compared to higher oxidation state compounds like Ir3+ or Ir4+. This difference occurs because the sample is a pure elemental reference with an oxidation state of 0, giving it a 5d7 electronic configuration. The physical mechanism driving the white-line intensity is the 2p to 5d electronic transition, where the integrated intensity monotonically increases with the creation of 5d holes. Since Ir0 has the fewest 5d holes among these compounds, there are fewer available unoccupied states for the excited photoelectrons, resulting in the lowest observed white-line intensity and branching ratio. | Full credit for stating that the absolute intensity of the L3 white-line and the L3/L2 branching ratio are significantly lower/smaller in elemental Ir compared to Ir3+/Ir4+ compounds. Must explain that this is due to elemental Ir (5d7) having fewer unoccupied 5d states (5d holes) available for the 2p -> 5d transitions. |
| q3 | spectral | 30 | What is the expected energy position of the white-line feature for elemental Ir, and how does its peak width (FWHM) compare to the other Ir compounds measured? | The expected energy position of the white-line feature for the elemental Ir sample is 11218.1 eV. Its peak width is the broadest among the measured Ir compounds, with a full width at half maximum (FWHM) of 6.6(1) eV. These specific spectral characteristics are directly tied to the sample being elemental iridium in a zero oxidation state (Ir0, 5d7). Because this elemental state possesses the fewest 5d holes compared to higher oxidation state compounds, the 2p to 5d electronic transitions produce a distinctively broad white-line profile alongside its lower absolute intensity. | Full credit for identifying the energy position at approximately 11218.1 eV and noting that elemental Ir exhibits the broadest white-line feature (FWHM ~ 6.6 eV) among the measured Ir compounds. |
Review
#1110
IrCl3
Ir L3
▶
LLM Prompt
Sample Information
Material: IrCl3
Crystal Structure: Monoclinic (C2/m)
Oxidation State: 3+
Sample Form: powder
Measurement Mode: transmission
- Iridium(III) chloride reference sample
Measurement
We plan to measure the Ir L3 XANES spectrum of this sample.
Questions
Based on all the information above:
1. Describe the expected spectral shape and key features of the Ir L3-edge XANES spectrum for IrCl3.
2. What electronic transitions give rise to the prominent white-line feature at the Ir L3 edge, and how does its intensity relate to the electronic structure of IrCl3?
3. How does the white-line feature of IrCl3 (Ir3+) compare to that of elemental Ir (Ir0) and IrO2 (Ir4+) in terms of energy position and intensity?
Ground Truth
Compound: IrCl3
Oxidation state: 3+
Measurement: Ir L3-edge XAS in transmission mode at HXMA beamline 06ID-1 (CLS)
Edge position: 11219.6
Spectral shape: Sharp, atomic-like white-line feature corresponding to 2p -> 5d electronic transitions, a step-like edge feature associated with 2p -> continuum excitations, and fine structure oscillations from backscattering.
Labeled peaks:
| Label | Energy (eV) | Intensity | Origin | Source |
|---|---|---|---|---|
| white line | 11219.6 | 21.3 | 2p3/2 -> 5d transitions | paper_data |
Distinguishing features: Sharpest white-line feature among the measured Ir compounds with FWHM = 3.9(1) eV. White-line position shifted to higher energy compared to Ir0 (11218.1 eV) and lower than Ir4+ (11220.7 eV). Higher white-line intensity than Ir0 due to increased number of 5d holes.
Key reasoning: The sample is a commercial reference powder (99.99% purity). The Ir L3 edge XAS spectrum exhibits a sharp white-line feature corresponding to 2p3/2 -> 5d transitions. The white-line intensity is proportional to the local density of unoccupied 5d states. The white-line position shifts to higher energy compared to Ir0, and the intensity increases due to the increased number of 5d holes (5d6 configuration).
Reasoning source: Section II (Experimental Details) and Section III (Results and Discussion)
Scoring Rubric (total: 100 pts)
| Q | Type | Max | Question | Reference Answer | Scoring Criteria |
|---|---|---|---|---|---|
| q1 | spectral | 30 | Describe the expected spectral shape and key features of the Ir L3-edge XANES spectrum for IrCl3. | The Ir L3-edge XANES spectrum for IrCl3 is expected to exhibit a sharp, atomic-like white-line feature at 11219.6 eV with an intensity of 21.3. It will also display a step-like edge feature and fine structure oscillations. These features arise directly from the sample conditions, specifically the pure IrCl3 powder with Ir in a 3+ oxidation state (5d6 configuration). The 3+ state provides a high density of unoccupied 5d states, driving strong 2p3/2 -> 5d electronic transitions that produce the exceptionally sharp white line (FWHM = 3.9 eV). Additionally, the step-like edge corresponds to 2p -> continuum excitations, while the fine structure oscillations result from photoelectron backscattering within the monoclinic (C2/m) crystal lattice. | Full points for mentioning the sharp white-line feature, step-like edge, and fine structure oscillations, along with the specific energy position (~11219.6 eV). |
| q2 | reasoning | 35 | What electronic transitions give rise to the prominent white-line feature at the Ir L3 edge, and how does its intensity relate to the electronic structure of IrCl3? | The prominent white-line feature at the Ir L3 edge originates from 2p3/2 -> 5d electronic transitions. The intensity of this white line is directly proportional to the local density of unoccupied 5d states in the material. Because the sample is an IrCl3 powder with an Ir(III) oxidation state, it possesses a 5d6 electronic configuration. This specific configuration has an increased number of 5d holes compared to metallic iridium, and this higher density of unoccupied 5d states in the 3+ oxidation state leads to the strongly increased white-line intensity (measured at 21.3). | Full points for identifying the 2p3/2 -> 5d transitions and explaining that the intensity is proportional to the local density of unoccupied 5d states (5d holes). |
| q3 | prediction | 35 | How does the white-line feature of IrCl3 (Ir3+) compare to that of elemental Ir (Ir0) and IrO2 (Ir4+) in terms of energy position and intensity? | The white-line feature of IrCl3 (Ir3+) is positioned at 11219.6 eV, which is shifted to a higher energy than elemental Ir0 (11218.1 eV) but lower than Ir4+ (11220.7 eV). Additionally, the white-line intensity of IrCl3 is higher than that of Ir0. These differences are directly dictated by the sample's 3+ oxidation state and its resulting electronic structure. As the oxidation state increases from 0 to 3+ in the IrCl3 powder, the binding energy of the core electrons increases, causing the observed shift to higher edge energies. Furthermore, the Ir3+ state yields a 5d6 configuration, which has a greater number of 5d holes (unoccupied states) compared to Ir0, thereby driving the increased white-line intensity through enhanced 2p3/2 -> 5d transitions. | Full points for stating that the white-line position shifts to higher energy with increasing oxidation state (Ir0 < Ir3+ < Ir4+) and that the intensity increases due to the greater number of 5d holes. Mentioning it has the sharpest white-line is a bonus. |
Review
#1111
IrO2
Ir L3
▶
LLM Prompt
Sample Information
Material: IrO2
Crystal Structure: Orthorhombic (P42/mnm)
Oxidation State: 4+
Sample Form: powder
Measurement Mode: transmission
- Iridium(IV) oxide reference sample
Measurement
We plan to measure the Ir L3 XANES spectrum of this sample.
Questions
Based on all the information above:
1. Describe the expected spectral shape of the IrO2 L3-edge XANES spectrum and identify the primary absorption feature.
2. What specific electronic transitions give rise to the white-line feature at the Ir L3 edge, and what physical property of the material does its intensity reflect?
3. How do the white-line energy position and intensity of IrO2 (Ir4+) distinguish it from lower oxidation state Ir compounds such as IrCl3 (Ir3+) and elemental Ir (Ir0)?
Ground Truth
Compound: IrO2
Oxidation state: 4+
Measurement: Ir L3-edge XAS in transmission mode at HXMA beamline, CLS
Edge position: 11220.7
Spectral shape: The spectrum features a sharp, atomic-like white-line feature corresponding to 2p -> 5d electronic transitions, a step-like edge feature for 2p -> continuum excitations, and fine structure oscillations at higher energies.
Labeled peaks:
| Label | Energy (eV) | Intensity | Origin | Source |
|---|---|---|---|---|
| white line | 11220.7 | 32 | 2p3/2 -> 5d transitions (sensitive to both 5d3/2 and 5d5/2 states) | paper_data |
Distinguishing features: The white-line position is shifted to higher energy (11220.7 eV) compared to Ir3+ (IrCl3) and Ir0 (elemental Ir). The integrated intensity of the white-line is also higher due to the increased number of 5d holes (5d5 configuration).
Key reasoning: IrO2 is a standard reference compound with an Ir4+ (5d5) electronic configuration. The L3 edge XAS spectrum is characterized by a strong white-line feature due to 2p3/2 -> 5d transitions. The intensity of this feature is proportional to the local density of unoccupied 5d states (5d holes), which is higher for Ir4+ (5d5) compared to Ir3+ (5d6) or Ir0 (5d7).
Reasoning source: Section III. RESULTS AND DISCUSSION, pages 3-4
Scoring Rubric (total: 100 pts)
| Q | Type | Max | Question | Reference Answer | Scoring Criteria |
|---|---|---|---|---|---|
| q1 | spectral | 30 | Describe the expected spectral shape of the IrO2 L3-edge XANES spectrum and identify the primary absorption feature. | The expected spectral shape of the IrO2 L3-edge XANES spectrum features a sharp, atomic-like white-line peak, a step-like edge for 2p to continuum excitations, and fine structure oscillations at higher energies. The primary absorption feature is the strong white line located at 11220.7 eV with an intensity of 32. These features arise because the sample is a pure IrO2 powder reference with an Ir4+ oxidation state, giving it a 5d5 electronic configuration. This specific configuration provides a high density of unoccupied 5d states (5d holes), which directly facilitates the prominent 2p3/2 to 5d transitions that dominate the spectrum as the intense white-line feature. | Full credit for mentioning the sharp, atomic-like white-line feature, the step-like edge for continuum excitations, and fine structure oscillations. Must identify the white line as the primary feature. |
| q2 | reasoning | 35 | What specific electronic transitions give rise to the white-line feature at the Ir L3 edge, and what physical property of the material does its intensity reflect? | The white-line feature at the Ir L3 edge originates from 2p3/2 to 5d electronic transitions, which are sensitive to both 5d3/2 and 5d5/2 states. The intensity of this feature directly reflects the local density of unoccupied 5d states, or 5d holes, within the material. Because the measured sample is an IrO2 reference compound with an Ir4+ oxidation state, it possesses a 5d5 electronic configuration. This specific configuration dictates a high number of available 5d holes, which fundamentally drives the strong intensity of the white-line feature observed in the transmission measurement. | Full credit for stating the transitions are 2p3/2 -> 5d (or 2p -> 5d) and that the intensity is proportional to the local density of unoccupied 5d states (or number of 5d holes). |
| q3 | prediction | 35 | How do the white-line energy position and intensity of IrO2 (Ir4+) distinguish it from lower oxidation state Ir compounds such as IrCl3 (Ir3+) and elemental Ir (Ir0)? | The white-line energy position of IrO2 is shifted to a higher energy of 11220.7 eV compared to lower oxidation state compounds like IrCl3 (Ir3+) and elemental Ir (Ir0). Furthermore, the integrated intensity of the IrO2 white line is significantly higher than that of these lower oxidation states. This distinction occurs because the IrO2 sample consists of Ir in a 4+ oxidation state, resulting in a 5d5 electronic configuration. Compared to the 5d6 configuration of Ir3+ or the 5d7 configuration of Ir0, the Ir4+ state in this sample has a greater number of 5d holes, which directly increases the probability of 2p3/2 to 5d transitions and thereby enhances the white-line intensity. | Full credit for explaining that the white-line position shifts to higher energies and the integrated intensity monotonically increases as the oxidation state increases from Ir0 to Ir3+ to Ir4+, due to the increasing number of 5d holes. |
Review
#1112
Sr2IrO4
Ir L3
▶
LLM Prompt
Sample Information
Material: Sr2IrO4
Crystal Structure: Tetragonal (I41/acd)
Oxidation State: 4+
Sample Form: powder
Measurement Mode: transmission
- Layered perovskite iridate
Measurement
We plan to measure the Ir L3 XANES spectrum of this sample.
Questions
Based on all the information above:
1. Describe the expected spectral shape of the Ir L3-edge XANES for Sr2IrO4, including the main features and the energy position of the white line.
2. What electronic transitions give rise to the white line feature at the Ir L3-edge, and how does the jeff = 1/2 model explain the intensity of this feature in Sr2IrO4?
3. What distinguishing feature in the X-ray absorption spectra (when comparing L2 and L3 edges) is characteristic of Sr2IrO4, and what physical phenomenon does it indicate?
Ground Truth
Compound: Sr2IrO4
Oxidation state: 4+
Measurement: Ir L3-edge XAS in transmission mode at HXMA beamline 06ID-1, CLS
Edge position: 11220.2
Spectral shape: Sharp, atomic-like white-line feature corresponding to 2p -> 5d electronic transitions, a step-like edge feature, and fine structure oscillations.
Labeled peaks:
| Label | Energy (eV) | Intensity | Origin | Source |
|---|---|---|---|---|
| white line | 11220.2 | 30 | 2p3/2 -> 5d transitions | paper_data |
Distinguishing features: Displays a large branching ratio (6.9) consistent with a jeff = 1/2 spin-orbital Mott insulator state.
Key reasoning: The anomalously large L3/L2 branching ratio (6.9) indicates strong spin-orbit coupling. In the jeff = 1/2 scenario, the jeff = 3/2 band is completely occupied, prohibiting transitions at the L2 edge and enhancing the L3 white-line.
Reasoning source: Section III (Results and Discussion), page 7
Scoring Rubric (total: 100 pts)
| Q | Type | Max | Question | Reference Answer | Scoring Criteria |
|---|---|---|---|---|---|
| q1 | spectral | 30 | Describe the expected spectral shape of the Ir L3-edge XANES for Sr2IrO4, including the main features and the energy position of the white line. | The expected Ir L3-edge XANES spectrum for Sr2IrO4 features a sharp, atomic-like white-line at an energy position of 11220.2 eV, accompanied by a step-like edge feature and fine structure oscillations. This specific spectral shape arises because the sample is a layered perovskite iridate with Ir in a 4+ oxidation state, which promotes strong 2p3/2 to 5d electronic transitions. The prominent white-line intensity is a direct result of the strong spin-orbit coupling in this material. Specifically, the Ir4+ ions form a jeff = 1/2 spin-orbital Mott insulator state where the jeff = 3/2 band is completely occupied, prohibiting L2 transitions and thereby enhancing the L3 white-line. | Full credit requires mentioning the sharp white-line feature, the step-like edge, and fine structure oscillations, as well as stating the white line energy is approximately 11220.2 eV. |
| q2 | reasoning | 40 | What electronic transitions give rise to the white line feature at the Ir L3-edge, and how does the jeff = 1/2 model explain the intensity of this feature in Sr2IrO4? | The white line feature at the Ir L3-edge in Sr2IrO4 originates from 2p3/2 to 5d electronic transitions. Because the sample is a layered perovskite iridate with an Ir 4+ oxidation state, it experiences strong spin-orbit coupling that establishes a jeff = 1/2 spin-orbital Mott insulator state. In this specific jeff = 1/2 model, the jeff = 3/2 band is completely occupied. This full occupation prohibits electronic transitions at the L2 edge, which consequently enhances the intensity of the L3 white-line feature to a value of 30. This explains why the powder transmission measurement yields such a sharp, atomic-like peak at 11220.2 eV. | Full credit requires identifying the transition as 2p3/2 -> 5d and explaining that in the jeff = 1/2 scenario, the jeff = 3/2 band is fully occupied, which prohibits L2 transitions and enhances the L3 white-line. |
| q3 | identification | 30 | What distinguishing feature in the X-ray absorption spectra (when comparing L2 and L3 edges) is characteristic of Sr2IrO4, and what physical phenomenon does it indicate? | The distinguishing feature of Sr2IrO4 when comparing the L2 and L3 edges is an anomalously large L3/L2 branching ratio of 6.9. This large branching ratio indicates the physical phenomenon of strong spin-orbit coupling within the material. Given that the sample is a layered perovskite iridate with Ir in a 4+ oxidation state, it forms a jeff = 1/2 spin-orbital Mott insulator state. In this state, the jeff = 3/2 band is completely occupied, which prohibits transitions at the L2 edge and enhances the L3 white-line, directly causing the extreme branching ratio observed in the transmission spectrum. | Full credit requires mentioning the anomalously large L3/L2 branching ratio (around 6.9) and stating that this indicates strong spin-orbit coupling associated with a jeff = 1/2 spin-orbital Mott insulator state. |
Review
#1113
Y2Ir2O7
Ir L3
▶
LLM Prompt
Sample Information
Material: Y2Ir2O7
Crystal Structure: Cubic (Fd-3m)
Oxidation State: 4+
Sample Form: powder
Measurement Mode: transmission
- Pyrochlore iridate
Measurement
We plan to measure the Ir L3 XANES spectrum of this sample.
Questions
Based on all the information above:
1. Describe the expected spectral shape and key features of the Ir L3-edge XANES spectrum for Y2Ir2O7, including the approximate energy position of the main peak.
2. What specific electronic transitions give rise to the prominent white-line feature observed at the Ir L3-edge in Y2Ir2O7?
3. What distinguishing physical phenomenon can be inferred from the intensity of the Ir L3 white-line when compared to the Ir L2 edge for Y2Ir2O7, and how does this affect the expected branching ratio?
Ground Truth
Compound: Y2Ir2O7
Oxidation state: 4+
Measurement: Ir L3-edge XAS in transmission mode at HXMA beamline 06ID-1, CLS
Edge position: 11220.0
Spectral shape: The spectrum features a sharp, atomic-like white-line at the absorption edge corresponding to 2p -> 5d electronic transitions, followed by a step-like continuum edge and fine structure oscillations at higher energies.
Labeled peaks:
| Label | Energy (eV) | Intensity | Origin | Source |
|---|---|---|---|---|
| white-line | 11220.0 | 29 | 2p3/2 -> 5d transitions | paper_data |
Distinguishing features: Anomalously large L3/L2 branching ratio (approx. 5.8) and a strong L3 white-line intensity (29) characteristic of Ir4+ in an octahedral crystal field with strong spin-orbit coupling.
Key reasoning: Y2Ir2O7 is a pyrochlore iridate containing Ir4+ ions with a 5d5 electronic configuration. The XAS spectrum at the Ir L3 edge exhibits a sharp white-line feature corresponding to 2p3/2 -> 5d transitions. The large integrated intensity of this white line, compared to the L2 edge, yields an anomalously large branching ratio (5.8-6.0), which is a direct signature of strong spin-orbit coupling in the t2g manifold.
Reasoning source: Section I (Introduction) and Section III (Results and Discussion)
Scoring Rubric (total: 100 pts)
| Q | Type | Max | Question | Reference Answer | Scoring Criteria |
|---|---|---|---|---|---|
| q1 | spectral | 30 | Describe the expected spectral shape and key features of the Ir L3-edge XANES spectrum for Y2Ir2O7, including the approximate energy position of the main peak. | The expected Ir L3-edge XANES spectrum for Y2Ir2O7 features a sharp, atomic-like white-line at approximately 11220.0 eV with a strong intensity of 29. This main peak is followed by a step-like continuum edge and fine structure oscillations at higher energies. These spectral features arise because the sample is a pyrochlore iridate containing Ir4+ ions in an octahedral crystal field. Specifically, the strong white-line is produced by 2p3/2 to 5d electronic transitions into the partially filled 5d5 electronic configuration of the Ir4+ ions. | Full points for mentioning a sharp white-line feature at approximately 11220 eV, a step-like continuum edge, and fine structure oscillations. |
| q2 | reasoning | 30 | What specific electronic transitions give rise to the prominent white-line feature observed at the Ir L3-edge in Y2Ir2O7? | The prominent white-line feature observed at the Ir L3-edge in Y2Ir2O7 is driven by 2p3/2 to 5d electronic transitions. Because the sample is a pyrochlore iridate with Ir in a 4+ oxidation state, it possesses a 5d5 electronic configuration. This partially filled 5d state, combined with an octahedral crystal field, provides the available unoccupied states necessary for these strong transitions to occur. Consequently, the excitation of core 2p3/2 electrons into these available 5d states produces the sharp, atomic-like white-line peak at 11220.0 eV. | Full points for correctly identifying the transition as 2p3/2 -> 5d (or transitions into unoccupied 5d states). |
| q3 | prediction | 40 | What distinguishing physical phenomenon can be inferred from the intensity of the Ir L3 white-line when compared to the Ir L2 edge for Y2Ir2O7, and how does this affect the expected branching ratio? | Comparing the large integrated intensity of the Ir L3 white-line to the L2 edge reveals the presence of strong spin-orbit coupling in the t2g manifold. Because Y2Ir2O7 is a pyrochlore iridate containing Ir4+ ions with a 5d5 electronic configuration, this strong spin-orbit coupling heavily influences the unoccupied density of states. As a result of this phenomenon, the material exhibits an anomalously large L3/L2 branching ratio of approximately 5.8 to 6.0. This high branching ratio is a direct signature of the specific electronic and structural environment of the Ir4+ ions in this cubic (Fd-3m) powder sample. | Full points for identifying strong spin-orbit coupling and stating that it leads to an anomalously large branching ratio (significantly greater than the statistical value of 2, specifically around 5.8-6.0). |
Review
#1114
Na2IrO3
Ir L3
▶
LLM Prompt
Sample Information
Material: Na2IrO3
Crystal Structure: Monoclinic (C2/m)
Oxidation State: 4+
Sample Form: powder
Measurement Mode: transmission
- Honeycomb lattice iridate
Measurement
We plan to measure the Ir L3 XANES spectrum of this sample.
Questions
Based on all the information above:
1. Describe the expected spectral shape and key features of the Ir L3-edge XANES spectrum for pure phase Na2IrO3.
2. Na2IrO3 exhibits an anomalously large L3/L2 branching ratio. Explain the physical origin of this enhancement in terms of its electronic structure and 5d states.
3. What specific electronic transition is responsible for the prominent white-line feature observed at 11220.1 eV in the Ir L3-edge spectrum of Na2IrO3?
4. What specific spectral feature distinguishes the Ir L3/L2 XAS of Na2IrO3 from 5d compounds that lack strong spin-orbit coupling?
Ground Truth
Compound: Na2IrO3
Oxidation state: 4+
Measurement: Ir L3-edge transmission mode at HXMA beamline 06ID-1, Canadian Light Source
Edge position: 11220.1
Spectral shape: The spectrum features a sharp, atomic-like white-line peak at the edge, followed by a step-like continuum edge feature and fine structure oscillations at higher energies.
Labeled peaks:
| Label | Energy (eV) | Intensity | Origin | Source |
|---|---|---|---|---|
| white line | 11220.1 | 25 | 2p3/2 -> 5d electronic transitions | Table II |
Distinguishing features: An anomalously large L3/L2 branching ratio (5.5) and a white-line FWHM of 5.5 eV, distinguishing it from 5d compounds with negligible spin-orbit coupling.
Key reasoning: The Ir L3-edge spectrum of Na2IrO3 exhibits a sharp, intense white-line feature corresponding to 2p3/2 -> 5d transitions. The anomalously large L3/L2 branching ratio (5.5) compared to the statistical value of 2 indicates strong spin-orbit coupling. This coupling, combined with the octahedral crystal field, splits the 5d states into a fully occupied jeff = 3/2 band and a partially occupied jeff = 1/2 band, which strongly enhances the L3 transition probability relative to L2.
Reasoning source: Section III (RESULTS AND DISCUSSION)
Scoring Rubric (total: 100 pts)
| Q | Type | Max | Question | Reference Answer | Scoring Criteria |
|---|---|---|---|---|---|
| q1 | spectral | 25 | Describe the expected spectral shape and key features of the Ir L3-edge XANES spectrum for pure phase Na2IrO3. | The Ir L3-edge XANES spectrum of pure phase Na2IrO3 features a sharp, atomic-like white-line peak at 11220.1 eV, followed by a step-like continuum edge and fine structure oscillations at higher energies. The white-line peak has a relative intensity of 25 and a full width at half maximum (FWHM) of 5.5 eV. These specific spectral features arise because the Ir4+ ions in the monoclinic honeycomb lattice experience strong spin-orbit coupling and an octahedral crystal field. This environment splits the 5d states into a fully occupied jeff = 3/2 band and a partially occupied jeff = 1/2 band, leading to a highly intense 2p3/2 -> 5d transition that dominates the edge shape. | Full points for mentioning the sharp, atomic-like white-line peak, the step-like continuum edge, and fine structure oscillations. Must mention the white-line energy position around 11220.1 eV. |
| q2 | reasoning | 40 | Na2IrO3 exhibits an anomalously large L3/L2 branching ratio. Explain the physical origin of this enhancement in terms of its electronic structure and 5d states. | The anomalously large L3/L2 branching ratio of 5.5 in Na2IrO3, compared to the statistical value of 2, originates from the strong spin-orbit coupling inherent to the Ir4+ ions in this material. In the monoclinic honeycomb lattice, this strong spin-orbit coupling combines with the octahedral crystal field to split the Ir 5d states. Consequently, the 5d states divide into a fully occupied jeff = 3/2 band and a partially occupied jeff = 1/2 band. Because the jeff = 1/2 band is only partially occupied, the probability of 2p3/2 -> 5d transitions at the L3-edge is strongly enhanced relative to the L2-edge, producing the observed anomalous branching ratio. | Full points for explaining that strong spin-orbit coupling and the octahedral crystal field split the 5d states into a fully occupied jeff = 3/2 band and a partially occupied jeff = 1/2 band, which enhances L3 transitions while prohibiting L2 transitions. |
| q3 | identification | 15 | What specific electronic transition is responsible for the prominent white-line feature observed at 11220.1 eV in the Ir L3-edge spectrum of Na2IrO3? | The prominent white-line feature observed at 11220.1 eV in the Ir L3-edge spectrum of Na2IrO3 is caused by 2p3/2 -> 5d electronic transitions. This specific transition is highly intense due to the electronic configuration of the Ir4+ ions within the monoclinic honeycomb lattice. Specifically, the combination of an octahedral crystal field and strong spin-orbit coupling splits the 5d states into a fully occupied jeff = 3/2 band and a partially occupied jeff = 1/2 band. The availability of empty states in the jeff = 1/2 band strongly enhances the probability of the 2p3/2 -> 5d transition, resulting in the sharp, intense white-line peak at this energy. | Full points for correctly identifying the transition as 2p3/2 -> 5d. |
| q4 | spectral | 20 | What specific spectral feature distinguishes the Ir L3/L2 XAS of Na2IrO3 from 5d compounds that lack strong spin-orbit coupling? | The Ir L3/L2 XAS of Na2IrO3 is distinguished from 5d compounds lacking strong spin-orbit coupling by its anomalously large L3/L2 branching ratio of 5.5 and a white-line FWHM of 5.5 eV. These distinguishing features occur because the Ir4+ ions in the monoclinic honeycomb lattice experience significant spin-orbit coupling alongside an octahedral crystal field. This specific environment splits the 5d states into a fully occupied jeff = 3/2 band and a partially occupied jeff = 1/2 band. The resulting electronic structure strongly enhances the L3 transition probability relative to L2, creating a branching ratio far exceeding the statistical value of 2 expected in systems without such coupling. | Full points for identifying the anomalously large L3/L2 branching ratio (significantly greater than the statistical value of 2, specifically ~5.5). |
Review
Bond disproportionation and dynamical charge fluctuations in the perovskite rare-earth nickelates
APS
Pure Phase
R. J. Green, M. W. Haverkort, G. A. Sawatzky
DOI: 10.1103/PhysRevB.94.195127
1 scenario
▶
#1115
RNiO3
Ni L3
▶
LLM Prompt
Sample Information
Material: RNiO3
Crystal Structure: perovskite
Oxidation State: 3+
Measurement Mode: simulation
- Simulated Ni L2,3-edge XAS for perovskite rare earth nickelate without breathing distortion
Measurement
We plan to measure the Ni L3 XANES spectrum of this sample.
Questions
Based on all the information above:
1. What distinguishing spectral feature is expected at the Ni L3-edge for the insulating rare earth nickelates, and where does it appear relative to the main edge?
2. What is the physical origin of the pronounced first peak below the L3 edge in the XAS spectrum of this undistorted material?
3. Describe the ground state electronic configuration of the Ni ions in this undistorted perovskite phase. Does it reflect a simple ionic Ni3+ state?
Ground Truth
Compound: RNiO3
Oxidation state: 3+ (formal), but highly covalent with d8L0, d8L1, d8L2 superposition
Measurement: Simulated Ni L2,3-edge XAS
Edge position: not reported
Spectral shape: The spectrum exhibits L3 and L2 edges with a pronounced first peak separated out below both edges, arising from intercluster hopping even in the absence of breathing distortions.
Labeled peaks:
| Label | Energy (eV) | Intensity | Origin | Source |
|---|---|---|---|---|
| first L3 peak | 852.5 | pronounced | non-local excitations between the two clusters | paper_data |
Distinguishing features: A pronounced first peak separated out below both the L3 and L2 edges, which is a distinct characteristic of insulating nickelates.
Key reasoning: The double cluster model with no breathing distortion shows a pronounced first peak below the L3 and L2 edges due to non-local excitations between the two clusters. The ground state is highly covalent, represented by a superposition of |d8L0>, |d8L1>, and |d8L2> configurations, rather than a pure ionic state.
Reasoning source: Page 3, discussion of Figure 2(a) and Figure 3(a)
Scoring Rubric (total: 100 pts)
| Q | Type | Max | Question | Reference Answer | Scoring Criteria |
|---|---|---|---|---|---|
| q1 | spectral | 30 | What distinguishing spectral feature is expected at the Ni L3-edge for the insulating rare earth nickelates, and where does it appear relative to the main edge? | The distinguishing spectral feature for this material is a pronounced first peak located at 852.5 eV, which is separated out below both the main L3 and L2 edges. In the simulated RNiO3 perovskite without breathing distortion, this distinct characteristic of insulating nickelates arises from the highly covalent nature of the material. Specifically, based on the full correlation double cluster model, this feature is produced by non-local excitations (intercluster hopping) between the two clusters. | Full points for identifying the pronounced first peak that is separated out below the main L3 (and L2) edges. |
| q2 | reasoning | 35 | What is the physical origin of the pronounced first peak below the L3 edge in the XAS spectrum of this undistorted material? | The physical origin of the pronounced first peak below the L3 edge is non-local excitations between two clusters. In the simulated perovskite RNiO3 without breathing distortion, the electronic structure is highly covalent rather than purely ionic. When evaluated using a full correlation double cluster model, the simulation demonstrates that intercluster hopping occurs even in the absence of structural breathing distortions. This intercluster interaction directly produces the separated first peak below the main L3 and L2 edges. | Full points for attributing the peak to non-local excitations between the two clusters (or intercluster hopping). |
| q3 | reasoning | 35 | Describe the ground state electronic configuration of the Ni ions in this undistorted perovskite phase. Does it reflect a simple ionic Ni3+ state? | The ground state electronic configuration of the Ni ions does not reflect a simple ionic Ni3+ state. Instead, it is highly covalent and is represented by a superposition of |d8L0>, |d8L1>, and |d8L2> configurations. For this simulated RNiO3 perovskite without breathing distortion, the formal 3+ oxidation state is heavily modified by strong hybridization. The full correlation double cluster model shows that this covalency leads to non-local excitations between clusters, causing the true ground state to deviate from a pure ionic configuration into this highly covalent superposition. | Full points for stating the ground state is highly covalent (not purely ionic) and consists of a superposition of |d8L0>, |d8L1>, and |d8L2> configurations. |
Review
Polaronic transport and thermoelectricity in Fe 1 -x Co x Sb 2 S 4 (x =0 , 0.1, and 0.2)
BNL-NSLS-II-8-ID
Pure Phase
Yu Liu et al.
DOI: 10.1103/PhysRevB.97.155202
1 scenario
▶
#1116
FeSb2S4
Fe K
▶
LLM Prompt
Sample Information
Material: FeSb2S4
Crystal Structure: orthorhombic Pnma
Oxidation State: Fe2+
Sample Form: powder
Measurement Mode: transmission
- Pure FeSb2S4 measured at room temperature for local structure determination via EXAFS.
Measurement
We plan to measure the Fe K XANES spectrum of this sample.
Questions
Based on all the information above:
1. Based on the sample conditions and the material's crystal structure, what is the expected oxidation state, spin state, and local coordination environment of Fe in this pure phase?
Ground Truth
Compound: FeSb2S4
Oxidation state: Fe2+ (high spin)
Measurement: Fe K-edge, transmission mode, 8-ID (ISS) beamline at NSLS II
Edge position: not reported
Spectral shape: The paper presents only EXAFS data (no XANES). The Fourier transform magnitudes of the Fe K-edge EXAFS show a corrected main peak around R ~ 2.5 Å corresponding to Fe-S bonds, and peaks between 3.6 Å and 5.0 Å due to longer Fe-Fe (~3.765 Å) and Fe-Sb (~3.762 Å, 4.000 Å, 4.316 Å, and 4.521 Å) bond distances.
Distinguishing features: Distorted octahedral Fe-S coordination exhibiting three distinct Fe-S bond lengths, distinguishing the local environment from a perfect octahedron.
Key reasoning: The local structure was determined by EXAFS spectra of FeSb2S4 measured at room temperature. The corrected main peak around R ~ 2.5 Å in the Fourier transform magnitudes corresponds to three different Fe-S bond distances (2.449(2) Å, 2.501(2) Å, and 2.614(2) Å), consistent with the distorted octahedral coordination of high-spin Fe2+ in the Pnma structure.
Reasoning source: Section III. RESULTS AND DISCUSSIONS, Page 3-4
Scoring Rubric (total: 100 pts)
| Q | Type | Max | Question | Reference Answer | Scoring Criteria |
|---|---|---|---|---|---|
| q1 | reasoning | 100 | Based on the sample conditions and the material's crystal structure, what is the expected oxidation state, spin state, and local coordination environment of Fe in this pure phase? | In this pure FeSb2S4 sample, the expected oxidation state of iron is Fe2+ in a high-spin state, situated in a distorted octahedral local coordination environment. This specific configuration arises because the material crystallizes in an orthorhombic Pnma structure, which inherently prevents a perfect octahedral geometry. Consequently, the high-spin Fe2+ ions coordinate with sulfur at three distinct Fe-S bond distances (2.449(2) Å, 2.501(2) Å, and 2.614(2) Å). This structural distortion is directly evidenced by the EXAFS Fourier transform magnitudes measured at room temperature, which show a corrected main peak around R ~ 2.5 Å corresponding to these specific Fe-S scattering paths. | The answer must correctly identify Fe as being in a 2+ oxidation state, in a high-spin configuration, and possessing a distorted octahedral coordination environment. |
Review
Anomalous Hall effect in the van der Waals bonded ferromagnet Fe 3 − x GeTe 2
BNL-NSLS-II-8-ID
Pure Phase
Yu Liu et al.
DOI: 10.1103/PhysRevB.97.165415
1 scenario
▶
#1117
Fe2.64Ge0.87Te2
Fe K
▶
LLM Prompt
Sample Information
Material: Fe2.64Ge0.87Te2
Crystal Structure: hexagonal
Oxidation State: Fe2+
Sample Form: single crystal
Measurement Mode: transmission
- Flux-grown single crystals of Fe3-xGeTe2 with Fe deficiency x ≈ 0.36
Measurement
We plan to measure the Fe K XANES spectrum of this sample.
Questions
Based on all the information above:
1. Describe the expected spectral shape and key features (pre-edge, edge, main peak) for the Fe K-edge XANES of this Fe3-xGeTe2 single crystal.
2. What are the physical and electronic origins of the prepeak (A) at ~7112 eV and the main peak-like feature (C) at ~7120 eV in this material?
3. Based on the expected XANES spectrum, what is the oxidation state of Fe in this compound, and which specific spectral feature indicates this?
4. What physical phenomenon is primarily responsible for the broader feature (D) observed at higher energies above the main edge?
Ground Truth
Compound: Fe2.64Ge0.87Te2
Oxidation state: Fe2+
Measurement: Fe K-edge in transmission mode at 8-ID beamline of NSLS II
Edge position: 7118
Spectral shape: The spectrum exhibits a prepeak (A), an edge feature (B), a main peak-like feature (C), and a broader multiple scattering feature (D) at higher energy.
Labeled peaks:
| Label | Energy (eV) | Intensity | Origin | Source |
|---|---|---|---|---|
| A | 7112 | weak | direct quadrupole transition to unoccupied 3d states that are hybridized with Te 4p orbitals | paper_data |
| B | 7118 | moderate | 1s -> 4p transition | paper_data |
| C | 7120 | strong | 1s -> 4p states admixed with Te d states | paper_data |
| D | not reported | moderate | multiple scattering of the photoelectrons with the nearest neighbors | paper_data |
Distinguishing features: The edge feature B (~ 7118 eV) is close to the one for a reference Fe2+ standard, indicating the Fe2+ state in the material.
Key reasoning: The prepeak feature A (~ 7112 eV) is the result of a direct quadrupole transition to unoccupied 3d states that are hybridized with Te 4p orbitals. The edge feature B (~ 7118 eV) is governed by 1s -> 4p transition, which is close to the one for a reference Fe2+ standard, indicating the Fe2+ state. The peak-like feature C (~ 7120 eV) is driven by the 1s -> 4p states admixed with Te d states, and feature D is mainly due to multiple scattering.
Reasoning source: Section III. RESULTS AND DISCUSSIONS, page 4
Scoring Rubric (total: 100 pts)
| Q | Type | Max | Question | Reference Answer | Scoring Criteria |
|---|---|---|---|---|---|
| q1 | spectral | 30 | Describe the expected spectral shape and key features (pre-edge, edge, main peak) for the Fe K-edge XANES of this Fe3-xGeTe2 single crystal. | The expected Fe K-edge XANES spectrum for this Fe2.64Ge0.87Te2 single crystal exhibits four main features: a weak prepeak (A) at ~7112 eV, a moderate edge feature (B) at ~7118 eV, a strong main peak-like feature (C) at ~7120 eV, and a broader feature (D) at higher energy. Because this is a flux-grown single crystal with a specific hexagonal Fe2.64Ge0.87Te2 composition, these features arise directly from its unique electronic structure and local coordination. Specifically, the prepeak A results from quadrupole transitions to unoccupied 3d states hybridized with Te 4p orbitals, while the edge B and main peak C are driven by 1s to 4p transitions. The edge position at ~7118 eV is characteristic of the Fe2+ oxidation state present in this Fe-deficient material. | Full points if the answer identifies the prepeak (~7112 eV), the edge feature (~7118 eV), the main peak (~7120 eV), and a broader multiple scattering feature at higher energies. |
| q2 | reasoning | 30 | What are the physical and electronic origins of the prepeak (A) at ~7112 eV and the main peak-like feature (C) at ~7120 eV in this material? | In this Fe2.64Ge0.87Te2 single crystal, the prepeak (A) at ~7112 eV originates from a direct quadrupole transition of core electrons to unoccupied 3d states that are hybridized with Te 4p orbitals. The strong main peak-like feature (C) at ~7120 eV is driven by transitions from 1s to 4p states that are admixed with Te d states. These specific electronic transitions occur because the hexagonal crystal structure and the specific Fe-Te bonding environment in this flux-grown Fe-deficient compound dictate the local orbital hybridization. Consequently, the distinct orbital mixing between the Fe and Te atoms in the Fe2.64Ge0.87Te2 lattice directly shapes these low-energy XANES resonances. | Full points if the answer correctly attributes the prepeak to a direct quadrupole transition to unoccupied 3d states hybridized with Te 4p orbitals, and the main peak to 1s -> 4p states admixed with Te d states. |
| q3 | identification | 25 | Based on the expected XANES spectrum, what is the oxidation state of Fe in this compound, and which specific spectral feature indicates this? | The oxidation state of Fe in this compound is Fe2+. This is indicated by the moderate edge feature (B) located at ~7118 eV, which is governed by the 1s to 4p transition and aligns closely with the edge position of a reference Fe2+ standard. This specific oxidation state is expected given the sample conditions of the flux-grown Fe3-xGeTe2 single crystal with an Fe deficiency of x ≈ 0.36 (forming Fe2.64Ge0.87Te2). The overall stoichiometry of this specific hexagonal composition stabilizes the iron atoms in the 2+ state, which directly dictates the observed 7118 eV absorption edge position. | Full points if the answer identifies the oxidation state as Fe2+ and links it to the edge feature (B) at ~7118 eV (governed by the 1s -> 4p transition) matching a reference Fe2+ standard. |
| q4 | reasoning | 15 | What physical phenomenon is primarily responsible for the broader feature (D) observed at higher energies above the main edge? | The broader feature (D) observed at higher energies in the XANES spectrum is primarily due to the multiple scattering of photoelectrons with the nearest neighbor atoms. In this specific Fe2.64Ge0.87Te2 single crystal, the ejected photoelectrons scatter off the surrounding Ge and Te atoms within the hexagonal crystal lattice. Because the sample is a highly ordered flux-grown single crystal, the well-defined local coordination environment strongly dictates these multiple scattering paths. Therefore, the specific geometric arrangement of the nearest neighbors around the Fe-deficient absorbing sites directly produces this distinct higher-energy spectral feature. | Full points if the answer attributes the higher energy feature to multiple scattering of the photoelectrons with the nearest neighbors. |
Review
Nature of the structural symmetries associated with hybrid improper ferroelectricity in Ca3X2O7(X=Mnand Ti)
BNL-NSLS-II-8-ID
Pure Phase
S. Liu et al.
DOI: 10.1103/PhysRevB.99.224105
1 scenario
▶
#1118
Ca2.4Sr0.6Ti2O7
Ti K
▶
LLM Prompt
Sample Information
Material: Ca2.4Sr0.6Ti2O7
Crystal Structure: Ruddlesden-Popper perovskite
Oxidation State: Ti4+
Sample Form: powder
Measurement Mode: fluorescence
- Ti K-edge XANES of Ca2.4Sr0.6Ti2O7 measured at various temperatures to observe structural changes.
Measurement
We plan to measure the Ti K XANES spectrum of this sample.
Questions
Based on all the information above:
1. Describe the expected spectral features in the pre-edge region of the Ti K-edge XANES spectrum for Ca2.4Sr0.6Ti2O7.
2. How does the intensity of the main pre-edge feature (peak B) respond to an increase in temperature, and what specific structural change in the TiO6 polyhedra does this indicate?
3. Based on the structural sensitivity of the Ti K-edge XANES for this material, what effect would a reduction in the twisting of the TiO6 polyhedra about the z-axis have on the amplitude of the main pre-edge peak?
Ground Truth
Compound: Ca2.4Sr0.6Ti2O7
Oxidation state: not discussed in this paper
Measurement: Ti K-edge XANES, fluorescence mode
Edge position: not reported
Spectral shape: The Ti K-edge XANES spectrum exhibits a pre-edge region with two distinct features (A and B) prior to the main absorption edge. The intensity of the main pre-edge feature (B) is highly temperature-dependent.
Labeled peaks:
| Label | Energy (eV) | Intensity | Origin | Source |
|---|---|---|---|---|
| A | 4969 | weak | pre-edge feature | paper_data |
| B | 4971 | moderate | main pre-edge feature, sensitive to TiO6 polyhedra tilting | paper_data |
Distinguishing features: The amplitude of pre-edge peak B is highly sensitive to the structural distortions of the TiO6 polyhedra. Specifically, a reduction in the tiling amplitude increases the peak B amplitude, while a reduction of twisting about the z-axis reduces the peak amplitude.
Key reasoning: The Ti K-edge XANES spectrum exhibits a pre-edge region with two distinct features (A and B). The intensity of the main pre-edge feature (B) increases continuously with increasing temperature from 300 to 540 K. This enhancement is structurally correlated to a continuous reduction in the tilting amplitude of the TiO6 polyhedra relative to the long axis.
Reasoning source: Section IV (page 8) and Supplementary Figure S14
Scoring Rubric (total: 100 pts)
| Q | Type | Max | Question | Reference Answer | Scoring Criteria |
|---|---|---|---|---|---|
| q1 | spectral | 30 | Describe the expected spectral features in the pre-edge region of the Ti K-edge XANES spectrum for Ca2.4Sr0.6Ti2O7. | The pre-edge region of the Ti K-edge XANES spectrum for Ca2.4Sr0.6Ti2O7 exhibits two distinct features prior to the main absorption edge: a weak peak A at 4969 eV and a moderate main pre-edge peak B at 4971 eV. Because the sample is a Ruddlesden-Popper perovskite containing Ti4+ in TiO6 polyhedra, these pre-edge features arise directly from the local coordination geometry. The spectral shape, particularly the intensity of peak B, is highly sensitive to structural distortions within the lattice. Specifically, these features reflect the degree of tilting and twisting of the TiO6 polyhedra relative to the long axis as the sample is subjected to various temperatures. | Full points if the answer identifies the presence of two distinct pre-edge features (A and B) and notes that feature B is the main pre-edge peak. |
| q2 | reasoning | 40 | How does the intensity of the main pre-edge feature (peak B) respond to an increase in temperature, and what specific structural change in the TiO6 polyhedra does this indicate? | The intensity of the main pre-edge feature (peak B at 4971 eV) increases continuously as the temperature of the Ca2.4Sr0.6Ti2O7 sample is raised from 300 K to 540 K. This spectral response occurs because the Ruddlesden-Popper perovskite structure undergoes specific temperature-dependent distortions. The added thermal energy induces a continuous reduction in the tilting amplitude of the TiO6 polyhedra relative to the long axis. This reduction in polyhedral tilting alters the local symmetry around the Ti4+ ions, which directly causes the observed enhancement in the pre-edge peak B amplitude. | Full points if the answer states that the intensity of peak B increases with temperature, and correctly correlates this enhancement to a continuous reduction in the tilting amplitude of the TiO6 polyhedra. |
| q3 | prediction | 30 | Based on the structural sensitivity of the Ti K-edge XANES for this material, what effect would a reduction in the twisting of the TiO6 polyhedra about the z-axis have on the amplitude of the main pre-edge peak? | A reduction in the twisting of the TiO6 polyhedra about the z-axis would result in a decrease in the amplitude of the main pre-edge peak (peak B). Because the Ca2.4Sr0.6Ti2O7 sample is a Ruddlesden-Popper perovskite, the Ti4+ pre-edge XANES features are exquisitely sensitive to the exact geometry of the TiO6 octahedra. While decreasing the tilting amplitude enhances peak B, decreasing the twisting about the z-axis alters the local symmetry in an opposing manner. Consequently, this specific structural change modifies the orbital interactions within the polyhedra, leading to a direct reduction in the pre-edge peak amplitude. | Full points if the answer correctly predicts that a reduction in twisting about the z-axis would reduce the amplitude of the main pre-edge peak. |
Review
Classification of local chemical environments from x-ray absorption spectra using supervised machine learning
BNL-NSLS-II-8-ID
Pure Phase
Matthew R. Carbone et al.
DOI: 10.1103/PhysRevMaterials.3.033604
6 scenarios
▶
#1119
K6Ti2O7
Ti K-edge
▶
LLM Prompt
Sample Information
Material: K6Ti2O7
- Experimental and FEFF simulated XANES spectrum of tetrahedral Ti reference compound
Measurement
We plan to measure the Ti K-edge XANES spectrum of this sample.
Questions
Based on all the information above:
1. Describe the expected pre-edge spectral features for K6Ti2O7 at the Ti K-edge, including the approximate energy position, and explain the physical origin of this feature.
2. How can the XANES spectrum of K6Ti2O7 be distinguished from a typical octahedral (O6) titanium oxide based on the pre-edge region?
3. Based on its tetrahedral coordination environment, what is the expected relative intensity of the post-edge region for K6Ti2O7 compared to square pyramidal (S5) or octahedral (O6) Ti compounds?
Ground Truth
Compound: K6Ti2O7
Oxidation state: not reported
Measurement: Ti K-edge XANES
Edge position: not reported
Spectral shape: The spectrum exhibits a very sharp and intense pre-edge peak at ~4970 eV, followed by the main absorption edge. Additionally, it exhibits the highest post-edge intensity compared to square pyramidal (S5) and octahedral (O6) geometries.
Labeled peaks:
| Label | Energy (eV) | Intensity | Origin | Source |
|---|---|---|---|---|
| pre-edge | 4970 | strong/sharp | s -> d transitions enabled by p-d mixing (allowed under Td symmetry) | text/figure_4 |
Distinguishing features: The strong pre-edge peak at ~4970 eV is a signature of the T4 configuration, distinguishing it from O6 configurations which lack a significant pre-edge peak.
Key reasoning: K6Ti2O7 is a reference compound for tetrahedral (T4) coordinated Ti. Its spectrum exhibits a sharp, intense pre-edge peak at approximately 4970 eV. This intense pre-edge feature arises because atomic p-d mixing is allowed under Td symmetry, enabling otherwise dipole-forbidden s -> d transitions to gain intensity.
Reasoning source: Section I (Introduction) and Section III.A (Visual Inspection of the Spectral Database)
Scoring Rubric (total: 100 pts)
| Q | Type | Max | Question | Reference Answer | Scoring Criteria |
|---|---|---|---|---|---|
| q1 | spectral | 40 | Describe the expected pre-edge spectral features for K6Ti2O7 at the Ti K-edge, including the approximate energy position, and explain the physical origin of this feature. | The Ti K-edge XANES spectrum of K6Ti2O7 is expected to exhibit a very sharp and intense pre-edge peak at approximately 4970 eV. This feature arises directly from the sample's structural condition as a reference compound for tetrahedral (T4) coordinated titanium. Under this specific Td symmetry, atomic p-d mixing is allowed. This mixing enables the otherwise dipole-forbidden s -> d transitions to gain significant intensity, producing the strong pre-edge signature characteristic of this material. | Award full points if the response identifies a sharp/intense pre-edge peak at ~4970 eV and explains that it originates from s -> d transitions enabled by p-d mixing allowed under tetrahedral (Td) symmetry. |
| q2 | reasoning | 30 | How can the XANES spectrum of K6Ti2O7 be distinguished from a typical octahedral (O6) titanium oxide based on the pre-edge region? | The XANES spectrum of K6Ti2O7 can be distinguished from a typical octahedral (O6) titanium oxide by the presence of a very sharp, intense pre-edge peak at approximately 4970 eV. This distinction is fundamentally due to the sample's specific coordination environment, as K6Ti2O7 is a reference compound for tetrahedral (T4) coordinated titanium. In this T4 geometry, atomic p-d mixing is allowed under Td symmetry, enabling dipole-forbidden s -> d transitions to gain high intensity. In contrast, O6 configurations lack this significant pre-edge peak because their geometry does not support the same p-d mixing mechanisms. | Award full points if the response states that K6Ti2O7 (T4) will have a strong/sharp pre-edge peak due to allowed p-d mixing, whereas an O6 configuration will lack a significant pre-edge peak because p-d mixing is forbidden under Oh symmetry. |
| q3 | spectral | 30 | Based on its tetrahedral coordination environment, what is the expected relative intensity of the post-edge region for K6Ti2O7 compared to square pyramidal (S5) or octahedral (O6) Ti compounds? | The Ti K-edge XANES spectrum of K6Ti2O7 is expected to exhibit the highest post-edge intensity compared to square pyramidal (S5) and octahedral (O6) geometries. This relative intensity arises directly from the sample's specific structural condition as a tetrahedral (T4) coordinated titanium reference compound. In this T4 configuration, the unique local geometry and allowed atomic p-d mixing under Td symmetry dictate the overall spectral shape, including the region following the main absorption edge. Therefore, the tetrahedral environment of K6Ti2O7 inherently produces a higher post-edge intensity than the higher-coordination S5 or O6 configurations. | Award full points if the response correctly notes that the tetrahedral (T4) geometry exhibits the highest post-edge intensity compared to S5 and O6 geometries. |
Review
#1120
TiO2
Ti K-edge
▶
LLM Prompt
Sample Information
Material: TiO2
Crystal Structure: Rutile
Oxidation State: Ti4+
- Experimental and FEFF simulated XANES spectrum of octahedral Ti reference compound
Measurement
We plan to measure the Ti K-edge XANES spectrum of this sample.
Questions
Based on all the information above:
1. Describe the expected pre-edge spectral features for rutile TiO2 and explain how these features can be used to distinguish it from tetrahedral Ti compounds.
2. Based on the local coordination environment of rutile TiO2, explain the physical and electronic origin of its pre-edge peak intensity.
3. How does the post-edge intensity of this octahedral TiO2 compound compare to that of tetrahedral (T4) and square pyramidal (S5) Ti environments?
Ground Truth
Compound: Rutile (TiO2)
Oxidation state: not reported
Measurement: Ti K-edge XANES
Edge position: not reported
Spectral shape: The spectrum lacks a significant pre-edge peak and exhibits the lowest post-edge intensity compared to tetrahedral (T4) and square pyramidal (S5) geometries.
Labeled peaks:
| Label | Energy (eV) | Intensity | Origin | Source |
|---|---|---|---|---|
| pre-edge | ~4970-4975 | weak/vanishing | s -> d transitions (p-d mixing forbidden under Oh symmetry) | paper_data |
Distinguishing features: The lack of a significant pre-edge peak clearly distinguishes this octahedral (O6) configuration from tetrahedral (T4) Ti configurations, which exhibit sharp pre-edge peaks.
Key reasoning: Rutile TiO2 has an octahedral (O6) local chemical environment. Under Oh symmetry, atomic p-d mixing is forbidden, and direct s -> d transitions are dipole-forbidden. This results in a vanishing or very weak pre-edge peak intensity, which is a clear indicator of the O6 configuration and distinguishes it from tetrahedral Ti compounds.
Reasoning source: Section I (Introduction) and Section III.C (Performance of the Machine Learning Classifiers)
Scoring Rubric (total: 100 pts)
| Q | Type | Max | Question | Reference Answer | Scoring Criteria |
|---|---|---|---|---|---|
| q1 | spectral | 35 | Describe the expected pre-edge spectral features for rutile TiO2 and explain how these features can be used to distinguish it from tetrahedral Ti compounds. | The expected pre-edge spectral feature for rutile TiO2 at the Ti K-edge (~4970-4975 eV) is a weak or vanishing intensity. This occurs because the sample is rutile TiO2, which possesses an octahedral (O6) local chemical environment. Under this Oh symmetry, atomic p-d mixing is forbidden and direct s -> d transitions are dipole-forbidden, leading to the lack of a significant pre-edge peak. Consequently, this vanishing pre-edge feature clearly distinguishes the octahedral rutile TiO2 from tetrahedral (T4) Ti configurations, which exhibit sharp pre-edge peaks. | Full credit requires stating that the pre-edge peak is weak/vanishing (or lacks a significant peak) and that this distinguishes it from tetrahedral (T4) Ti compounds which exhibit sharp/strong pre-edge peaks. |
| q2 | reasoning | 40 | Based on the local coordination environment of rutile TiO2, explain the physical and electronic origin of its pre-edge peak intensity. | The pre-edge peak intensity for rutile TiO2 is expected to be very weak or vanishing. Because the sample is rutile TiO2, it possesses an octahedral (O6) local chemical environment. In this specific Oh symmetry, atomic p-d mixing is strictly forbidden. Therefore, the pre-edge features, which would originate from s -> d transitions, are dipole-forbidden. This electronic restriction directly results in the lack of a significant pre-edge peak in the Ti K-edge XANES spectrum. | Full credit requires mentioning the octahedral (O6 / Oh) symmetry, that atomic p-d mixing is forbidden in this symmetry, and that direct s -> d transitions are dipole-forbidden, leading to the weak/vanishing intensity. |
| q3 | spectral | 25 | How does the post-edge intensity of this octahedral TiO2 compound compare to that of tetrahedral (T4) and square pyramidal (S5) Ti environments? | The post-edge intensity of this octahedral rutile TiO2 compound is the lowest when compared to tetrahedral (T4) and square pyramidal (S5) Ti geometries. This spectral shape arises directly from the sample's pure rutile phase and its corresponding octahedral (O6) local chemical environment. Because the Oh symmetry forbids atomic p-d mixing and makes direct s -> d transitions dipole-forbidden, the overall spectral distribution is altered compared to lower-symmetry environments. Thus, the specific structural and electronic constraints of the O6 configuration dictate both its vanishing pre-edge and its distinctively low post-edge intensity relative to T4 and S5 configurations. | Full credit requires stating that the octahedral (O6) configuration exhibits the lowest post-edge intensity compared to both T4 and S5 geometries. |
Review
#1121
MnCr2O4
Mn K-edge
▶
LLM Prompt
Sample Information
Material: MnCr2O4
- Experimental and FEFF simulated XANES spectrum of tetrahedral Mn reference compound
Measurement
We plan to measure the Mn K-edge XANES spectrum of this sample.
Questions
Based on all the information above:
1. Describe the expected spectral features of MnCr2O4 at the Mn K-edge, specifically focusing on the pre-edge region.
2. Explain the physical origin of the pre-edge feature in the Mn K-edge XANES spectrum of MnCr2O4 based on its local coordination environment.
3. How does the pre-edge region of the Mn K-edge XANES spectrum of tetrahedral MnCr2O4 distinguish it from octahedral Mn compounds?
Ground Truth
Compound: MnCr2O4
Oxidation state: not reported
Measurement: Mn K-edge XANES
Edge position: not reported
Spectral shape: The spectrum exhibits a distinct, strong pre-edge peak at ~6540 eV prior to the main absorption edge, followed by a prominent white line.
Labeled peaks:
| Label | Energy (eV) | Intensity | Origin | Source |
|---|---|---|---|---|
| pre-edge | ~6540 | strong | s -> d transitions enabled by p-d mixing allowed in Td symmetry | paper_data |
Distinguishing features: A strong pre-edge peak characteristic of tetrahedral coordination, which distinguishes it from octahedral Mn compounds that lack a significant pre-edge peak.
Key reasoning: MnCr2O4 has a tetrahedral (T4) local chemical environment for the absorbing Mn atom. In T4 symmetry, atomic p-d mixing is allowed, which enhances the intensity of the pre-edge peak corresponding to s -> d transitions. This results in a distinct, strong pre-edge peak around 6540 eV.
Reasoning source: Section I (Introduction) and Section III.E (Discussion)
Scoring Rubric (total: 100 pts)
| Q | Type | Max | Question | Reference Answer | Scoring Criteria |
|---|---|---|---|---|---|
| q1 | spectral | 30 | Describe the expected spectral features of MnCr2O4 at the Mn K-edge, specifically focusing on the pre-edge region. | The Mn K-edge XANES spectrum of the pure phase MnCr2O4 sample is expected to exhibit a distinct, strong pre-edge peak at approximately 6540 eV, followed by a prominent white line. These features arise directly from the sample's specific structure, where the absorbing Mn atom sits in a tetrahedral (T4) local chemical environment. In this T4 symmetry, atomic p-d mixing is allowed, which strongly enhances the intensity of the pre-edge peak corresponding to s -> d transitions. Because the sample is composed entirely of tetrahedral MnCr2O4 (fraction 1.0), this strong pre-edge feature dominates the initial region of the spectrum. | Full points if the answer mentions a distinct, strong pre-edge peak located at approximately 6540 eV. |
| q2 | reasoning | 40 | Explain the physical origin of the pre-edge feature in the Mn K-edge XANES spectrum of MnCr2O4 based on its local coordination environment. | The physical origin of the pre-edge feature at ~6540 eV in the Mn K-edge XANES spectrum of MnCr2O4 is the electronic transition from the core s orbital to unoccupied d orbitals. This occurs because the pure MnCr2O4 sample provides a tetrahedral (T4) local chemical environment for the absorbing Mn atom. In this specific T4 symmetry, atomic p-d mixing is allowed. This p-d mixing enables the s -> d transitions, directly resulting in the strong pre-edge peak characteristic of this material. | Full points if the answer explains that the pre-edge peak arises from s -> d transitions that are enabled by atomic p-d mixing, which is allowed due to the tetrahedral (Td) symmetry of the Mn site. |
| q3 | spectral | 30 | How does the pre-edge region of the Mn K-edge XANES spectrum of tetrahedral MnCr2O4 distinguish it from octahedral Mn compounds? | The Mn K-edge XANES spectrum of tetrahedral MnCr2O4 is distinguished from octahedral Mn compounds by the presence of a strong, distinct pre-edge peak at ~6540 eV, which octahedral compounds lack. This distinguishing feature is a direct result of the sample's specific tetrahedral (T4) local chemical environment. The T4 symmetry in the pure MnCr2O4 sample allows for atomic p-d mixing, which enhances the s -> d transitions and produces the strong pre-edge peak. Octahedral compounds do not allow this same p-d mixing, explaining why the tetrahedral MnCr2O4 sample exhibits this unique and prominent spectral signature. | Full points if the answer states that tetrahedral MnCr2O4 exhibits a strong pre-edge peak, whereas octahedral Mn compounds lack a significant pre-edge peak. |
Review
#1122
MnCO3
Mn K-edge
▶
LLM Prompt
Sample Information
Material: MnCO3
- Experimental and FEFF simulated XANES spectrum of octahedral Mn reference compound
Measurement
We plan to measure the Mn K-edge XANES spectrum of this sample.
Questions
Based on all the information above:
1. Describe the expected pre-edge spectral feature for MnCO3 at the Mn K-edge and explain how it can be used to distinguish it from tetrahedral Mn compounds such as MnCr2O4.
2. What is the physical origin of the pre-edge peak intensity in MnCO3? Include the relevant electronic transitions and the role of symmetry in your explanation.
3. What is the local coordination environment of Mn in MnCO3, and what is the primary spectral indicator of this geometry in the K-edge XANES spectrum?
Ground Truth
Compound: MnCO3
Oxidation state: not reported
Measurement: Mn K-edge XANES
Edge position: not reported
Spectral shape: Main edge with a very weak or negligible pre-edge feature.
Labeled peaks:
| Label | Energy (eV) | Intensity | Origin | Source |
|---|---|---|---|---|
| pre-edge | ~6540 | weak/negligible | s -> d transitions (dipole-forbidden due to lack of p-d mixing in Oh symmetry) | paper_data |
Distinguishing features: Lack of a significant pre-edge peak, which distinguishes it from tetrahedral Mn compounds like MnCr2O4.
Key reasoning: MnCO3 has an octahedral (O6) local chemical environment. In Oh symmetry, atomic p-d mixing is forbidden, which makes the s -> d transitions dipole-forbidden. This results in a vanishing or very weak pre-edge peak intensity, distinguishing it from tetrahedral Mn compounds.
Reasoning source: Section I (Introduction) and Section III.C (Performance of the Machine Learning Classifiers)
Scoring Rubric (total: 100 pts)
| Q | Type | Max | Question | Reference Answer | Scoring Criteria |
|---|---|---|---|---|---|
| q1 | spectral | 30 | Describe the expected pre-edge spectral feature for MnCO3 at the Mn K-edge and explain how it can be used to distinguish it from tetrahedral Mn compounds such as MnCr2O4. | The expected pre-edge spectral feature for the MnCO3 sample at the Mn K-edge (~6540 eV) is very weak or negligible in intensity. This occurs because the pure MnCO3 sample possesses an octahedral (O6) local chemical environment. In this Oh symmetry, atomic p-d mixing is forbidden, which renders the s -> d electronic transitions dipole-forbidden and suppresses the pre-edge peak. Consequently, this lack of a significant pre-edge peak serves as a distinguishing feature from tetrahedral Mn compounds like MnCr2O4, which would exhibit stronger pre-edge intensities due to allowed p-d mixing. | Full points if the answer states the pre-edge feature is weak/negligible and notes that this lack of a strong pre-edge distinguishes it from tetrahedral compounds (which have stronger pre-edge peaks). |
| q2 | reasoning | 40 | What is the physical origin of the pre-edge peak intensity in MnCO3? Include the relevant electronic transitions and the role of symmetry in your explanation. | The physical origin of the pre-edge peak in the MnCO3 sample is attributed to s -> d electronic transitions. Because the sample consists of pure MnCO3, the Mn atoms are situated in an octahedral (O6) local coordination environment with Oh symmetry. Under this specific symmetry, atomic p-d mixing is strictly forbidden. As a result, the s -> d transitions become dipole-forbidden, leading to a vanishing or negligible pre-edge peak intensity in the measured Mn K-edge XANES spectrum. | Full points if the answer identifies the transitions as s -> d, explains that they are dipole-forbidden, and attributes the weak intensity to the lack of atomic p-d mixing allowed under octahedral (Oh) symmetry. |
| q3 | identification | 30 | What is the local coordination environment of Mn in MnCO3, and what is the primary spectral indicator of this geometry in the K-edge XANES spectrum? | The local coordination environment of Mn in the pure MnCO3 sample is octahedral (O6) with Oh symmetry. The primary spectral indicator of this geometry in the Mn K-edge XANES spectrum is a vanishing or very weak pre-edge peak at approximately 6540 eV. This specific spectral feature arises directly from the sample's octahedral structure, where atomic p-d mixing is forbidden. Without this p-d mixing, the s -> d transitions are dipole-forbidden, resulting in the negligible pre-edge intensity that characterizes this O6 geometry. | Full points if the answer identifies the coordination as octahedral (O6) and states that the primary spectral indicator is the absence of a significant pre-edge peak. |
Review
#1123
CoAl2O4
Co K-edge
▶
LLM Prompt
Sample Information
Material: CoAl2O4
- Experimental and FEFF simulated XANES spectrum of tetrahedral Co reference compound
Measurement
We plan to measure the Co K-edge XANES spectrum of this sample.
Questions
Based on all the information above:
1. Describe the expected spectral features of CoAl2O4 at the Co K-edge, specifically focusing on the pre-edge region and its relative intensity compared to early transition metals.
2. What is the physical origin of the pre-edge feature in the Co K-edge XANES spectrum of CoAl2O4, and how does the local symmetry of the Co atom enable this transition?
Ground Truth
Compound: CoAl2O4
Oxidation state: not reported
Measurement: Co K-edge XANES
Edge position: not reported
Spectral shape: The spectrum exhibits a pre-edge peak around 7710 eV, followed by a main absorption edge and post-edge features. As a tetrahedral (T4) late transition metal oxide, it exhibits higher post-edge intensity compared to octahedral (O6) geometries.
Labeled peaks:
| Label | Energy (eV) | Intensity | Origin | Source |
|---|---|---|---|---|
| pre-edge | ~7710 | weak to moderate (less visible than in early transition metals) | s -> d transitions enabled by atomic p-d mixing allowed under Td symmetry | paper_data |
Distinguishing features: Presence of a pre-edge peak due to Td symmetry (unlike Oh symmetry where p-d mixing is forbidden), and higher post-edge intensity compared to O6 and S5 geometries.
Key reasoning: CoAl2O4 is utilized as a representative experimental reference compound for the tetrahedral (T4) local chemical environment of Co. Its spectrum exhibits a pre-edge peak due to p-d mixing allowed in Td symmetry, which distinguishes it from octahedral Co environments, although the pre-edge is less intense than in early transition metals.
Reasoning source: Section I (Introduction, page 2) and Section III.E (Discussion, page 8-9)
Scoring Rubric (total: 100 pts)
| Q | Type | Max | Question | Reference Answer | Scoring Criteria |
|---|---|---|---|---|---|
| q1 | spectral | 43 | Describe the expected spectral features of CoAl2O4 at the Co K-edge, specifically focusing on the pre-edge region and its relative intensity compared to early transition metals. | The expected Co K-edge XANES spectrum for CoAl2O4 features a pre-edge peak at approximately 7710 eV, followed by a main absorption edge and post-edge features. The intensity of this pre-edge peak is weak to moderate, making it less visible than the pre-edge features typically observed in early transition metals. These specific spectral features arise directly from the sample conditions, as CoAl2O4 serves as a representative compound for Co in a tetrahedral (T4) local chemical environment. This Td symmetry allows for atomic p-d mixing that produces the distinct pre-edge peak, distinguishing it from octahedral Co environments. Furthermore, this specific tetrahedral geometry causes the sample to exhibit a higher post-edge intensity compared to octahedral (O6) or square pyramidal (S5) geometries. | Full points if the answer mentions the presence of a pre-edge peak around 7710 eV and correctly notes that its intensity is weaker/less visible compared to the pre-edge peaks of early transition metals. |
| q2 | reasoning | 57 | What is the physical origin of the pre-edge feature in the Co K-edge XANES spectrum of CoAl2O4, and how does the local symmetry of the Co atom enable this transition? | The physical origin of the pre-edge feature at ~7710 eV in the Co K-edge XANES spectrum is an s -> d electronic transition. This transition is enabled by atomic p-d orbital mixing, which is strictly dictated by the local symmetry of the Co atom in the sample. Because the CoAl2O4 sample provides a tetrahedral (T4) local chemical environment with Td symmetry, this p-d mixing is allowed, unlike in centrosymmetric octahedral (Oh) environments where such mixing is forbidden. Therefore, the specific tetrahedral coordination of Co in this reference compound directly results in the emergence of this distinguishing pre-edge peak. | Full points if the answer explains that the pre-edge arises from s -> d transitions that become partially allowed due to atomic p-d mixing, which is permitted under the tetrahedral (Td) symmetry of the Co site. |
Review
#1124
Co(AsO4)2
Co K-edge
▶
LLM Prompt
Sample Information
Material: Co(AsO4)2
- Experimental and FEFF simulated XANES spectrum of octahedral Co reference compound
Measurement
We plan to measure the Co K-edge XANES spectrum of this sample.
Questions
Based on all the information above:
1. Based on its local coordination environment, describe the expected intensity of the pre-edge peak for Co(AsO4)2 at the Co K-edge.
2. What is the physical origin of the pre-edge feature in 3d transition metals, and why is it suppressed in the specific symmetry of Co(AsO4)2?
3. What spectral feature distinguishes the Co K-edge XANES of Co(AsO4)2 from that of a tetrahedral Co compound like CoAl2O4?
Ground Truth
Compound: Co(AsO4)2
Oxidation state: not reported
Measurement: Co K-edge XANES
Edge position: not reported
Spectral shape: Main edge with negligible pre-edge intensity, characteristic of an octahedral (O6) local chemical environment.
Labeled peaks:
| Label | Energy (eV) | Intensity | Origin | Source |
|---|---|---|---|---|
| pre-edge | ~7710 | weak/negligible | s -> d transitions (dipole-forbidden, p-d mixing forbidden in Oh symmetry) | paper_data |
Distinguishing features: Lack of a significant pre-edge peak distinguishes it from tetrahedral (T4) Co compounds (like CoAl2O4), which exhibit strong pre-edge peaks due to allowed p-d mixing.
Key reasoning: Co(AsO4)2 is an octahedral (O6) reference compound. In octahedral symmetry, atomic p-d mixing is forbidden by group theory, resulting in a negligible pre-edge peak intensity. Because of this weak pre-edge contrast, features beyond the pre-edge region are critical for accurately classifying its local chemical environment.
Reasoning source: Section I (Introduction) and Section III.E (Discussion)
Scoring Rubric (total: 100 pts)
| Q | Type | Max | Question | Reference Answer | Scoring Criteria |
|---|---|---|---|---|---|
| q1 | spectral | 30 | Based on its local coordination environment, describe the expected intensity of the pre-edge peak for Co(AsO4)2 at the Co K-edge. | The pre-edge peak for Co(AsO4)2 at the Co K-edge, located at ~7710 eV, is expected to have a weak or negligible intensity. This specific spectral feature arises because the sample consists entirely (fraction 1.0) of Co(AsO4)2, which is an octahedral (O6) reference compound. In this octahedral symmetry, atomic p-d mixing is forbidden by group theory, meaning the s -> d transitions remain dipole-forbidden. Consequently, the lack of p-d mixing produces the suppressed pre-edge intensity characteristic of this local chemical environment. | Full points for stating the pre-edge intensity is weak or negligible due to the octahedral (O6) coordination. |
| q2 | reasoning | 40 | What is the physical origin of the pre-edge feature in 3d transition metals, and why is it suppressed in the specific symmetry of Co(AsO4)2? | The pre-edge feature in 3d transition metals originates from s -> d electronic transitions. In the pure Co(AsO4)2 sample, this feature is suppressed because the cobalt atoms are situated in an octahedral (O6) local coordination environment. According to group theory, atomic p-d mixing is strictly forbidden in octahedral symmetry, keeping the s -> d transitions dipole-forbidden. Because of this weak pre-edge contrast, features beyond the pre-edge region become critical for accurately classifying the local chemical environment of the sample. | Full points for explaining that the pre-edge originates from s -> d transitions, which are dipole-forbidden, and that p-d mixing (which would enhance the peak) is forbidden in octahedral (Oh) symmetry. |
| q3 | prediction | 30 | What spectral feature distinguishes the Co K-edge XANES of Co(AsO4)2 from that of a tetrahedral Co compound like CoAl2O4? | The primary distinguishing spectral feature is the intensity of the pre-edge peak at ~7710 eV. The Co(AsO4)2 sample is an octahedral (O6) reference compound where atomic p-d mixing is forbidden by group theory, resulting in a negligible pre-edge peak. In contrast, tetrahedral (T4) Co compounds like CoAl2O4 exhibit strong pre-edge peaks because their symmetry allows for p-d mixing. Therefore, the lack of a significant pre-edge peak directly identifies the octahedral local chemical environment of Co(AsO4)2 and distinguishes it from tetrahedral structures. | Full points for identifying that Co(AsO4)2 lacks a significant pre-edge peak, whereas a tetrahedral compound like CoAl2O4 exhibits a strong/sharp pre-edge peak. |
Review
Magnetic critical behavior and anomalous Hall effect in 2H−Co0.22TaS2 single crystals
BNL-NSLS-II-8-ID
Pure Phase
Yu Liu et al.
DOI: 10.1103/PhysRevResearch.3.023181
1 scenario
▶
#1125
2H-Co0.22TaS2
Co K
▶
LLM Prompt
Sample Information
Material: 2H-Co0.22TaS2
Crystal Structure: P6322
Oxidation State: 2+
Sample Form: single crystal
Measurement Mode: fluorescence
- Co intercalated 2H-TaS2 single crystal
Measurement
We plan to measure the Co K XANES spectrum of this sample.
Questions
Based on all the information above:
1. Based on the sample conditions (Co intercalated 2H-TaS2 single crystal), what is the expected oxidation state of Co, and what specific Co K-edge XANES threshold energy (E0) corresponds to this state?
Ground Truth
Compound: 2H-Co0.22TaS2
Oxidation state: 2+
Measurement: Co K-edge XANES in fluorescence mode at 8-ID beamline of NSLS II
Edge position: 7717
Spectral shape: The spectrum shows a main absorption edge with a threshold energy at 7717 eV, which is determined from the peak of the derivative curve.
Labeled peaks:
| Label | Energy (eV) | Intensity | Origin | Source |
|---|---|---|---|---|
| threshold energy (E0) | 7717 | not reported | Co2+ state | paper_data |
Distinguishing features: not reported
Key reasoning: The threshold energy E0 = 7717 eV was obtained from the peak of the derivative curve of the normalized Co K-edge XANES spectrum. This specific threshold energy indicates that the intercalated Co atoms are in the Co2+ oxidation state.
Reasoning source: RESULTS AND DISCUSSIONS section, page 2
Scoring Rubric (total: 100 pts)
| Q | Type | Max | Question | Reference Answer | Scoring Criteria |
|---|---|---|---|---|---|
| q1 | prediction | 100 | Based on the sample conditions (Co intercalated 2H-TaS2 single crystal), what is the expected oxidation state of Co, and what specific Co K-edge XANES threshold energy (E0) corresponds to this state? | Based on the sample conditions of the Co intercalated 2H-TaS2 single crystal, the expected oxidation state of the Co atoms is 2+. This oxidation state corresponds to a specific Co K-edge XANES threshold energy (E0) of 7717 eV. This outcome arises because the Co atoms intercalate into the 2H-TaS2 host lattice to form a pure 2H-Co0.22TaS2 phase (P6322 crystal structure), which stabilizes the Co ions in the 2+ state. Spectroscopically, this specific electronic configuration is confirmed by the main absorption edge; the threshold energy E0 = 7717 eV, determined from the peak of the derivative curve of the normalized spectrum, directly indicates the presence of these intercalated Co2+ atoms. | Full points if the answer correctly identifies the Co2+ oxidation state and states the threshold energy E0 is 7717 eV. |
Review
On the correlation between the X-ray absorption chemical shift and the formal valence state in mixed-valence manganites
ESRF-BM23
Pure Phase
Joaquín García et al.
DOI: 10.1107/S0909049510010277
2 scenarios
▶
#1126
Mn3+ manganite reference
Mn K
▶
LLM Prompt
Sample Information
Material: Mn3+ manganite reference
Oxidation State: 3+
- Undoped reference compound corresponding to the formal integer Mn3+ valence state
Measurement
We plan to measure the Mn K XANES spectrum of this sample.
Questions
Based on all the information above:
1. What phase dominates this sample and what is its formal oxidation state?
2. What is the primary role of this specific undoped compound in XANES analysis as described in the text?
3. According to the paper, is it possible to distinguish the contributions of electronic occupation from those of local structure in the XANES spectrum of this sample?
Ground Truth
Compound: Mn3+ manganite
Oxidation state: 3+
Measurement: Mn K-edge
Edge position: not reported
Spectral shape: not reported
Distinguishing features: not reported
Key reasoning: The sample is an undoped reference compound corresponding to the formal integer Mn3+ valence state. The paper notes that the contributions from the electronic occupation and the local structure to the XANES spectra cannot be separated either experimentally or theoretically.
Reasoning source: text
Scoring Rubric (total: 100 pts)
| Q | Type | Max | Question | Reference Answer | Scoring Criteria |
|---|---|---|---|---|---|
| q1 | identification | 30 | What phase dominates this sample and what is its formal oxidation state? | The sample is entirely composed of the Mn3+ manganite reference phase (1.0 fraction) with a formal oxidation state of 3+. This pure phase is expected because the sample is explicitly prepared as an undoped reference compound designed to represent the formal integer Mn3+ valence state. As an undoped material, it lacks any dopants that would alter its composition, ensuring it remains a single phase. Consequently, it provides an accurate baseline for the pure 3+ oxidation state in XANES analysis. | Full points for identifying the sample as a pure Mn3+ manganite reference with a 3+ oxidation state. |
| q2 | reasoning | 30 | What is the primary role of this specific undoped compound in XANES analysis as described in the text? | The primary role of this undoped compound is to serve as a reference standard for the formal integer Mn3+ valence state. Because the sample is an undoped manganite, it provides a pure baseline for the Mn3+ oxidation state without the complicating effects of dopants. This is critical because the contributions from electronic occupation and local structure to the XANES spectra cannot be separated experimentally or theoretically. Therefore, having this pure, integer-valence reference is essential for interpreting the coupled electronic and structural effects in manganite systems. | Full points for stating it serves as a reference compound corresponding to the formal integer Mn3+ valence state. |
| q3 | reasoning | 40 | According to the paper, is it possible to distinguish the contributions of electronic occupation from those of local structure in the XANES spectrum of this sample? | No, it is not possible to distinguish the contributions of electronic occupation from those of local structure in the XANES spectrum of this sample. The text explicitly notes that these two contributions cannot be separated either experimentally or theoretically. Because the sample is an undoped reference compound corresponding to the formal integer Mn3+ valence state, its XANES spectrum inherently reflects a coupled combination of its specific 3+ electronic configuration and its corresponding local atomic structure. Any spectral features observed at the Mn K-edge are thus the inseparable result of both the electronic state and the local geometry of this specific manganite phase. | Full points for explicitly stating that these contributions cannot be separated either experimentally or theoretically. |
Review
#1127
Mn4+ manganite reference
Mn K
▶
LLM Prompt
Sample Information
Material: Mn4+ manganite reference
Oxidation State: 4+
- Undoped reference compound corresponding to the formal integer Mn4+ valence state
Measurement
We plan to measure the Mn K XANES spectrum of this sample.
Questions
Based on all the information above:
1. What is the formal oxidation state of this undoped manganite reference?
2. When interpreting the XANES spectrum of this manganite reference, is it possible to independently isolate the effects of electronic occupation from those of the local structure? Explain based on the provided context.
3. If this sample is used as a standard in XANES analysis, what specific phase does it represent in the fitting basis?
Ground Truth
Compound: Mn4+ manganite reference
Oxidation state: 4+
Measurement: Mn K-edge
Edge position: not reported
Spectral shape: not reported
Distinguishing features: not reported
Key reasoning: The sample is an undoped reference compound corresponding to the formal integer Mn4+ valence state. The authors note that the contributions from the electronic occupation and the local structure to the XANES spectra cannot be separated either experimentally or theoretically.
Reasoning source: Text
Scoring Rubric (total: 100 pts)
| Q | Type | Max | Question | Reference Answer | Scoring Criteria |
|---|---|---|---|---|---|
| q1 | identification | 30 | What is the formal oxidation state of this undoped manganite reference? | The formal oxidation state of this undoped manganite reference is 4+. This specific oxidation state arises because the sample is explicitly prepared as an undoped reference compound corresponding to the formal integer Mn4+ valence state. As a pure, undoped material representing a 1.0 fraction of the Mn4+ manganite phase, its XANES spectrum inherently captures the coupled, inseparable contributions of this 4+ electronic occupation and its corresponding local structure. | Award 30 points for correctly identifying the oxidation state as 4+. |
| q2 | reasoning | 40 | When interpreting the XANES spectrum of this manganite reference, is it possible to independently isolate the effects of electronic occupation from those of the local structure? Explain based on the provided context. | No, it is not possible to independently isolate the effects of electronic occupation from those of the local structure in the XANES spectrum of this sample. The authors explicitly note that these two contributions cannot be separated either experimentally or theoretically. This inseparability occurs because the sample is an undoped reference compound corresponding to the formal integer Mn4+ valence state, meaning its spectral signature is a fundamentally coupled reflection of both its pure 4+ electronic state and its specific atomic geometry. | Award 40 points for stating that the contributions from electronic occupation and local structure cannot be separated experimentally or theoretically. |
| q3 | identification | 30 | If this sample is used as a standard in XANES analysis, what specific phase does it represent in the fitting basis? | In a XANES fitting basis, this sample represents the pure 'Mn4+ manganite reference' phase with a fraction of 1.0. This single-phase representation is expected because the sample is an undoped reference compound designed to correspond strictly to the formal integer Mn4+ valence state. Since the contributions from the electronic occupation and the local structure cannot be separated experimentally or theoretically, this undoped standard serves as a unified, pure reference for the coupled structural and electronic properties of Mn4+. | Award 30 points for identifying it as a Mn4+ manganite reference. |
Review
The AXEAP2 program for K β X-ray emission spectra analysis using artificial intelligence
BNL-NSLS-II-8-ID
Pure Phase
In-Hui Hwang et al.
DOI: 10.1107/S1600577523005684
6 scenarios
▶
#1128
MnO
Mn Kβ XES
▶
LLM Prompt
Sample Information
Material: MnO
Crystal Structure: Oh symmetry
Oxidation State: 2+
Sample Form: powder
Measurement Mode: XES
- Manganese(II) oxide reference standard
Measurement
We plan to measure the Mn Kβ XES XANES spectrum of this sample.
Questions
Based on all the information above:
1. Describe the expected main spectral features (peaks) in the Mn Kβ XES spectrum of MnO and explain their physical origins.
2. What is the electronic spin state of the Mn(II) ions in this MnO sample, and how does the pairing energy relate to the 10Dq value to determine the 3d electron alignment?
3. What distinguishing spectral features differentiate the Mn Kβ XES spectrum of MnO from that of MnCO3?
Ground Truth
Compound: MnO
Oxidation state: 2+
Measurement: Mn Kβ XES
Edge position: not reported
Spectral shape: Clear separation of Kβ1,3 and Kβ' peaks.
Labeled peaks:
| Label | Energy (eV) | Intensity | Origin | Source |
|---|---|---|---|---|
| Kβ1,3 | not reported | strong | 3p -> 1s transition | paper_data |
| Kβ' | not reported | moderate | 3p -> 1s transition, split by 3p-3d exchange interaction | paper_data |
Distinguishing features: Compared to MnCO3, the energy difference between Kβ1,3 and Kβ' is smaller, and the peak intensity is lower.
Key reasoning: The sample is a high spin (HS) state Mn(II) compound with Oh symmetry. The pairing energy is about 2.31 eV, which is larger than the 10Dq value, resulting in all five 3d electrons being aligned in spin-up.
Reasoning source: text
Scoring Rubric (total: 100 pts)
| Q | Type | Max | Question | Reference Answer | Scoring Criteria |
|---|---|---|---|---|---|
| q1 | spectral | 35 | Describe the expected main spectral features (peaks) in the Mn Kβ XES spectrum of MnO and explain their physical origins. | The Mn Kβ XES spectrum of the MnO powder sample is expected to show a clear separation of two main features: a strong Kβ1,3 peak and a moderate Kβ' peak. Both of these peaks originate from the 3p to 1s electronic transition, with the splitting caused by the 3p-3d exchange interaction. These specific spectral features arise because the sample consists of Mn(II) in an octahedral (Oh) symmetry where the pairing energy (2.31 eV) is larger than the 10Dq value. This energy configuration forces the sample into a high-spin state with all five 3d electrons aligned spin-up, which strongly interacts with the 3p core hole to produce the distinct Kβ' exchange splitting. | Award points for identifying the Kβ1,3 (strong) and Kβ' (moderate) peaks, noting their clear separation, and stating their origin as 3p -> 1s transitions, with Kβ' being split by 3p-3d exchange interaction. |
| q2 | reasoning | 35 | What is the electronic spin state of the Mn(II) ions in this MnO sample, and how does the pairing energy relate to the 10Dq value to determine the 3d electron alignment? | The Mn(II) ions in this MnO powder sample exist in a high-spin (HS) electronic state. This occurs because the sample features an octahedral (Oh) crystal structure where the electron pairing energy is approximately 2.31 eV. This pairing energy is larger than the crystal field splitting value (10Dq) of the material. Because it requires more energy to pair electrons than to promote them to higher orbitals, all five 3d electrons remain unpaired and are aligned in a spin-up configuration. Consequently, the measurement of this reference standard yields a pure 1.0 fraction of the high-spin MnO phase. | Award points for stating it is a high spin (HS) state, the pairing energy (~2.31 eV) is larger than 10Dq, and all five 3d electrons are aligned spin-up. |
| q3 | spectral | 30 | What distinguishing spectral features differentiate the Mn Kβ XES spectrum of MnO from that of MnCO3? | The Mn Kβ XES spectrum of MnO is distinguished from that of MnCO3 by having a smaller energy difference between the Kβ1,3 and Kβ' peaks, as well as a lower overall peak intensity. These spectral differences are a direct result of the specific electronic and structural conditions of the Mn(II) oxide powder. In this sample's octahedral (Oh) symmetry, the pairing energy of 2.31 eV exceeds the 10Dq value, resulting in a high-spin state with five spin-up 3d electrons. The specific magnitude of the 3p-3d exchange interaction and crystal field effects in this exact MnO environment dictates the smaller peak separation and lower intensity compared to the MnCO3 environment. | Award points for stating that in MnO, the energy difference between Kβ1,3 and Kβ' is smaller, and the peak intensity is lower compared to MnCO3. |
Review
#1129
MnCO3
Mn Kβ XES
▶
LLM Prompt
Sample Information
Material: MnCO3
Crystal Structure: Oh symmetry
Oxidation State: 2+
Sample Form: powder
Measurement Mode: XES
- Manganese(II) carbonate reference standard
Measurement
We plan to measure the Mn Kβ XES XANES spectrum of this sample.
Questions
Based on all the information above:
1. Describe the expected main peaks in the Mn Kβ XES spectrum of MnCO3, including their relative intensities and the electronic transitions that give rise to them.
2. How does the Mn Kβ XES spectrum of MnCO3 distinguish itself from that of MnO, and what physical interaction is responsible for this difference despite both having the same electron configuration?
3. Based on the provided sample information, what is the expected spin state of Mn in MnCO3, and how do the pairing energy and crystal field splitting (10Dq) values justify this state?
Ground Truth
Compound: MnCO3
Oxidation state: 2+
Measurement: Mn Kβ XES
Edge position: not reported
Spectral shape: Clear separation of Kβ1,3 and Kβ'. The energy difference between Kβ1,3 and Kβ' is about 1.2 eV larger than that of MnO, and the peak intensity is higher.
Labeled peaks:
| Label | Energy (eV) | Intensity | Origin | Source |
|---|---|---|---|---|
| Kβ1,3 | not reported | strong | 3p -> 1s transition | paper_data |
| Kβ' | not reported | moderate | 3p -> 1s transition, split by 3p-3d exchange interaction | paper_data |
Distinguishing features: Larger Kβ1,3 and Kβ' splitting (by 1.2 eV) and higher peak intensity compared to MnO, despite having the same electron configuration, attributed to differences in the 3p-3d exchange interaction (Gpd).
Key reasoning: The sample is a high spin (HS) state Mn(II) complex with Oh symmetry. The pairing energy is about 2.56 eV, which is higher than the 10Dq value of 2.54 eV, resulting in the same spin alignment as MnO. The spectrum shows clear separation of Kβ1,3 and Kβ' peaks due to 3p-3d exchange interaction.
Reasoning source: text
Scoring Rubric (total: 100 pts)
| Q | Type | Max | Question | Reference Answer | Scoring Criteria |
|---|---|---|---|---|---|
| q1 | spectral | 30 | Describe the expected main peaks in the Mn Kβ XES spectrum of MnCO3, including their relative intensities and the electronic transitions that give rise to them. | The expected main peaks in the Mn Kβ XES spectrum of MnCO3 are a strong Kβ1,3 peak and a moderate Kβ' peak. Both of these peaks originate from 3p to 1s electronic transitions. These specific spectral features arise because the sample is a high-spin Mn(II) complex with Oh symmetry. In this high-spin configuration, the strong 3p-3d exchange interaction causes a clear energy splitting of the final states, resulting in the distinct separation of the Kβ1,3 and Kβ' peaks. | Award full points if the response identifies the Kβ1,3 (strong) and Kβ' (moderate) peaks and correctly attributes them to 3p -> 1s transitions, noting that the splitting is due to the 3p-3d exchange interaction. |
| q2 | spectral | 35 | How does the Mn Kβ XES spectrum of MnCO3 distinguish itself from that of MnO, and what physical interaction is responsible for this difference despite both having the same electron configuration? | The Mn Kβ XES spectrum of MnCO3 distinguishes itself from MnO by exhibiting a larger energy splitting between the Kβ1,3 and Kβ' peaks by approximately 1.2 eV, as well as a higher overall peak intensity. These differences occur despite both materials sharing the same Mn(II) oxidation state and high-spin electron configuration. The distinct spectral shape arises from differences in the 3p-3d exchange interaction (Gpd) within the specific Oh symmetry and chemical environment of the MnCO3 powder. This specific exchange interaction dictates the final state splitting, leading to the observed variations in peak separation and intensity compared to MnO. | Award full points if the response states that MnCO3 has a larger Kβ1,3 and Kβ' splitting (by ~1.2 eV) and higher peak intensity compared to MnO, and attributes this to differences in the 3p-3d exchange interaction (Gpd). |
| q3 | reasoning | 35 | Based on the provided sample information, what is the expected spin state of Mn in MnCO3, and how do the pairing energy and crystal field splitting (10Dq) values justify this state? | The expected spin state of Mn in the MnCO3 sample is a high-spin (HS) state. This configuration arises directly from the energetic conditions of the Mn(II) complex in its Oh symmetry crystal structure. Specifically, the electron pairing energy is approximately 2.56 eV, which is higher than the crystal field splitting energy (10Dq) of 2.54 eV. Because it requires more energy to pair electrons than to promote them across the crystal field gap, the electrons remain unpaired, resulting in a high-spin alignment identical to that of MnO. | Award full points if the response identifies the high spin (HS) state and explains that the pairing energy (~2.56 eV) is higher than the 10Dq value (~2.54 eV). |
Review
#1130
Mn2O3
Mn Kβ XES
▶
LLM Prompt
Sample Information
Material: Mn2O3
Crystal Structure: Oh symmetry
Oxidation State: 3+
Sample Form: powder
Measurement Mode: XES
- Manganese(III) oxide reference standard
Measurement
We plan to measure the Mn Kβ XES XANES spectrum of this sample.
Questions
Based on all the information above:
1. What are the main peaks expected in the Mn Kβ XES spectrum of this Mn2O3 sample, and what electronic transitions give rise to these features?
2. What distinguishes the Mn Kβ XES spectrum of Mn2O3 from that of divalent Mn (MnO), and what is the physical reason for this difference?
3. Based on the provided sample information, what is the expected spin state of the Mn ions in this Mn2O3 sample, and how do the pairing energy and 10Dq values relate to this state?
Ground Truth
Compound: Mn2O3
Oxidation state: 3+
Measurement: Mn Kβ XES
Edge position: not reported
Spectral shape: The Kβ' intensity is weaker than that of MnO.
Labeled peaks:
| Label | Energy (eV) | Intensity | Origin | Source |
|---|---|---|---|---|
| Kβ1,3 | not reported | strong | 3p -> 1s transition | paper_data |
| Kβ' | not reported | weak | 3p -> 1s transition, split by 3p-3d exchange interaction | paper_data |
Distinguishing features: Weaker Kβ' intensity compared to divalent Mn (MnO) due to having one less unpaired electron (4 electrons in 3d).
Key reasoning: The sample is a high spin (HS) state manganese(III) oxide reference standard with Oh symmetry. The pairing energy of trivalent Mn is approximately 2.73 eV, which is higher than the 10Dq value of 2.24 eV. The Kβ' intensity is weaker compared to divalent Mn (MnO) due to having one less unpaired electron (4 electrons in 3d).
Reasoning source: text
Scoring Rubric (total: 100 pts)
| Q | Type | Max | Question | Reference Answer | Scoring Criteria |
|---|---|---|---|---|---|
| q1 | spectral | 30 | What are the main peaks expected in the Mn Kβ XES spectrum of this Mn2O3 sample, and what electronic transitions give rise to these features? | The Mn Kβ XES spectrum of this Mn2O3 sample is expected to exhibit a strong Kβ1,3 peak and a weaker Kβ' peak. Both of these features originate from the 3p to 1s electronic transition. The spectrum splits into these two distinct peaks due to the 3p-3d exchange interaction. Because the sample is a high-spin manganese(III) oxide reference standard with 4 unpaired electrons in the 3d shell, this specific exchange interaction dictates the resulting spectral shape and the relative weakness of the Kβ' peak. | Award full points if the response identifies the strong Kβ1,3 peak and the weak Kβ' peak, and correctly attributes their origin to the 3p -> 1s transition, noting that the Kβ' peak is split by the 3p-3d exchange interaction. |
| q2 | reasoning | 35 | What distinguishes the Mn Kβ XES spectrum of Mn2O3 from that of divalent Mn (MnO), and what is the physical reason for this difference? | The primary distinguishing feature of the Mn2O3 spectrum compared to divalent Mn (MnO) is its weaker Kβ' peak intensity. This difference arises directly from the 3+ oxidation state of the Mn2O3 sample, which leaves it with only 4 electrons in the 3d shell. Because the Kβ' peak originates from the 3p-3d exchange interaction, having one less unpaired electron than divalent Mn reduces the magnitude of this interaction. Consequently, this specific electronic configuration in the high-spin manganese(III) oxide standard leads to the observed reduction in the Kβ' spectral intensity. | Award full points if the response states that the Kβ' intensity is weaker in Mn2O3 compared to MnO, and explains that this is due to Mn(III) having one less unpaired electron (4 electrons in the 3d shell) than divalent Mn. |
| q3 | reasoning | 35 | Based on the provided sample information, what is the expected spin state of the Mn ions in this Mn2O3 sample, and how do the pairing energy and 10Dq values relate to this state? | The Mn ions in this Mn2O3 sample are expected to be in a high-spin (HS) state. This spin state occurs because the pairing energy of trivalent Mn in this sample is approximately 2.73 eV, which is higher than its crystal field splitting (10Dq) value of 2.24 eV. Given the Oh symmetry and 3+ oxidation state of the manganese(III) oxide powder, it is more energetically favorable for the 4 electrons in the 3d shell to remain unpaired rather than pair up. Therefore, this specific relationship between the pairing energy and 10Dq directly dictates the high-spin configuration and the resulting 3p-3d exchange interactions seen in the spectrum. | Award full points if the response identifies the high spin (HS) state and explains that the pairing energy of trivalent Mn (~2.73 eV) is higher than the 10Dq value (2.24 eV). |
Review
#1131
CoO
Co Kβ XES
▶
LLM Prompt
Sample Information
Material: CoO
Crystal Structure: Oh symmetry
Oxidation State: 2+
Sample Form: powder
Measurement Mode: XES
- Cobalt(II) oxide reference standard
Measurement
We plan to measure the Co Kβ XES XANES spectrum of this sample.
Questions
Based on all the information above:
1. Describe the expected main peaks in the Co Kβ XES spectrum of CoO and explain their electronic origins.
2. How does the specific electronic structure and spin state of CoO influence its XES spectral features?
3. What spectral feature distinguishes the Co Kβ XES spectrum of CoO from that of LiCoO2, and what is the physical reason for this difference?
Ground Truth
Compound: CoO
Oxidation state: 2+
Measurement: Co Kβ XES
Edge position: not reported
Spectral shape: Exhibits a higher-intensity Kβ' peak compared to LiCoO2.
Labeled peaks:
| Label | Energy (eV) | Intensity | Origin | Source |
|---|---|---|---|---|
| Kβ1,3 | not reported | strong | 3p -> 1s transition | paper_data |
| Kβ' | not reported | moderate | 3p -> 1s transition, split by 3p-3d exchange interaction | paper_data |
Distinguishing features: Higher Kβ' intensity than LiCoO2 due to the high-spin state.
Key reasoning: CoO is a high spin (HS) state compound with Oh symmetry. Four electrons in CoO are paired and three electrons are aligned in spin-up. This electronic configuration leads to a distinct Kβ' peak due to the 3p-3d exchange interaction.
Reasoning source: Text discussing electronic structure interpretation and spectral shape
Scoring Rubric (total: 100 pts)
| Q | Type | Max | Question | Reference Answer | Scoring Criteria |
|---|---|---|---|---|---|
| q1 | spectral | 30 | Describe the expected main peaks in the Co Kβ XES spectrum of CoO and explain their electronic origins. | The Co Kβ XES spectrum of the CoO powder sample is expected to exhibit two main peaks: a strong Kβ1,3 peak and a moderate Kβ' peak. Both peaks originate from the 3p to 1s electronic transition. Because the Co2+ ions in this sample possess an octahedral (Oh) symmetry and exist in a high-spin state, four of the 3d electrons are paired while three are aligned spin-up. This specific electronic configuration causes a strong 3p-3d exchange interaction, which splits the transition and produces the distinct Kβ' peak alongside the main Kβ1,3 emission. | Award full points if the response identifies the strong Kβ1,3 peak and the moderate Kβ' peak, and correctly attributes their origin to the 3p -> 1s transition, noting that the Kβ' peak is split by the 3p-3d exchange interaction. |
| q2 | reasoning | 35 | How does the specific electronic structure and spin state of CoO influence its XES spectral features? | The CoO sample contains Co2+ ions in an octahedral (Oh) crystal structure, which results in a high-spin electronic configuration. In this specific state, four of the cobalt 3d electrons are paired, leaving three electrons aligned in a spin-up configuration. This arrangement of unpaired spins induces a strong 3p-3d exchange interaction during the XES measurement. Consequently, this exchange interaction splits the 3p to 1s transition, leading to the emergence of a distinct Kβ' peak alongside the primary Kβ1,3 peak. | Award full points if the response explains that CoO is in a high-spin (HS) state with four paired electrons and three spin-up aligned electrons, and connects this high-spin state to the presence/intensity of the Kβ' peak. |
| q3 | identification | 35 | What spectral feature distinguishes the Co Kβ XES spectrum of CoO from that of LiCoO2, and what is the physical reason for this difference? | The Co Kβ XES spectrum of CoO is distinguished from that of LiCoO2 by a higher-intensity Kβ' peak. This difference arises directly from the specific sample conditions of CoO, which features Co2+ ions in an octahedral (Oh) symmetry. Under these conditions, CoO adopts a high-spin state with four paired electrons and three unpaired spin-up electrons. This high-spin configuration creates a strong 3p-3d exchange interaction that splits the 3p to 1s transition, thereby generating the more intense Kβ' spectral feature observed in the CoO reference standard. | Award full points if the response states that CoO exhibits a higher-intensity Kβ' peak compared to LiCoO2, and attributes this difference to the high-spin state of CoO. |
Review
#1132
LiCoO2
Co Kβ XES
▶
LLM Prompt
Sample Information
Material: LiCoO2
Crystal Structure: Oh symmetry
Oxidation State: 3+
Sample Form: powder
Measurement Mode: XES
- Lithium cobalt oxide reference standard
Measurement
We plan to measure the Co Kβ XES XANES spectrum of this sample.
Questions
Based on all the information above:
1. Describe the expected spectral features of the Co Kβ XES spectrum for LiCoO2. What are the primary peaks, their relative intensities, and the electronic transitions responsible for them?
2. Based on the electronic structure of Co3+ in octahedral LiCoO2, explain why the Kβ' feature exhibits its specific intensity. Mention the spin state and d-electron configuration.
3. How does the Co Kβ XES spectrum of LiCoO2 distinguish itself from that of CoO, and what fundamental electronic difference drives this spectral contrast?
Ground Truth
Compound: LiCoO2
Oxidation state: 3+
Measurement: Co Kβ XES
Edge position: not reported
Spectral shape: Lower intensity Kβ' peak compared to CoO.
Labeled peaks:
| Label | Energy (eV) | Intensity | Origin | Source |
|---|---|---|---|---|
| Kβ1,3 | not reported | strong | 3p -> 1s transition | paper_data |
| Kβ' | not reported | weak | 3p -> 1s transition | paper_data |
Distinguishing features: Weak Kβ' feature characteristic of a low-spin state, contrasting with the high-spin CoO.
Key reasoning: LiCoO2 is in a low spin (LS) state where all six 3d electrons are paired, with an optimized 10Dq value of 0.86 eV. This low-spin configuration results in a weak Kβ' feature, which is characteristic of the low-spin state and contrasts with high-spin compounds.
Reasoning source: text
Scoring Rubric (total: 100 pts)
| Q | Type | Max | Question | Reference Answer | Scoring Criteria |
|---|---|---|---|---|---|
| q1 | spectral | 30 | Describe the expected spectral features of the Co Kβ XES spectrum for LiCoO2. What are the primary peaks, their relative intensities, and the electronic transitions responsible for them? | The expected Co Kβ XES spectrum for the LiCoO2 powder sample features two primary peaks originating from 3p to 1s electronic transitions. The main Kβ1,3 peak exhibits a strong intensity, while the secondary Kβ' peak is notably weak. These specific spectral features arise because the Co3+ ions in the octahedral (Oh) symmetry of LiCoO2 adopt a low-spin state where all six 3d electrons are paired. With an optimized crystal field splitting (10Dq) of 0.86 eV, this low-spin configuration inherently suppresses the intensity of the Kβ' feature, which is characteristic of such states. | Award full points if the response identifies the strong Kβ1,3 peak and the weak Kβ' peak, and correctly attributes both to 3p -> 1s transitions. |
| q2 | reasoning | 40 | Based on the electronic structure of Co3+ in octahedral LiCoO2, explain why the Kβ' feature exhibits its specific intensity. Mention the spin state and d-electron configuration. | In the octahedral (Oh) symmetry of the LiCoO2 sample, the Co3+ ions possess a d-electron configuration consisting of six 3d electrons. Driven by an optimized crystal field splitting parameter (10Dq) of 0.86 eV, the system adopts a low-spin (LS) state where all six of these 3d electrons are completely paired. This specific electronic structure directly dictates the spectral outcome, resulting in a characteristically weak Kβ' feature in the XES spectrum. The weak Kβ' intensity is a direct consequence of this fully paired low-spin state, which fundamentally contrasts with the behavior of high-spin compounds. | Award full points if the response explains that LiCoO2 is in a low-spin (LS) state with all six 3d electrons paired, which directly results in the weak intensity of the Kβ' feature. |
| q3 | comparison | 30 | How does the Co Kβ XES spectrum of LiCoO2 distinguish itself from that of CoO, and what fundamental electronic difference drives this spectral contrast? | The Co Kβ XES spectrum of the LiCoO2 sample distinguishes itself from that of CoO primarily through a much lower intensity of the Kβ' peak. This spectral contrast is driven by the fundamental difference in their electronic spin states. In the octahedral LiCoO2 sample, the Co3+ ions experience an optimized 10Dq of 0.86 eV, resulting in a low-spin state where all six 3d electrons are paired. Consequently, this low-spin configuration produces the characteristically weak Kβ' feature, whereas the high-spin state of CoO lacks this complete pairing and thus yields a stronger Kβ' peak. | Award full points if the response notes that LiCoO2 has a lower intensity (weak) Kβ' peak compared to CoO, and attributes this to LiCoO2 being low-spin while CoO is high-spin. |
Review
#1133
LiNiO2
Ni Kβ XES
▶
LLM Prompt
Sample Information
Material: LiNiO2
Crystal Structure: Oh symmetry
Oxidation State: 3+
Sample Form: powder
Measurement Mode: XES
- Lithium nickel oxide reference standard
Measurement
We plan to measure the Ni Kβ XES XANES spectrum of this sample.
Questions
Based on all the information above:
1. Describe the expected distinguishing spectral features and shape of the Ni Kβ XES spectrum for this LiNiO2 sample compared to other typical Ni samples.
2. Based on the spectral analysis of this sample, what is the expected electronic structure, oxidation state, and spin state of the Ni ions?
3. What specific electronic transition gives rise to the strong Kβ mainline observed in this XES measurement?
Ground Truth
Compound: LiNiO2
Oxidation state: 3+
Measurement: Ni Kβ XES
Edge position: not reported
Spectral shape: The Kβ peak width is wider than other measured spectra.
Labeled peaks:
| Label | Energy (eV) | Intensity | Origin | Source |
|---|---|---|---|---|
| Kβ mainline | not reported | strong | 3p -> 1s transition | paper_data |
Distinguishing features: Wider Kβ peak width and highest Lorentzian broadening (L1 and L2) among the measured samples.
Key reasoning: The spectrum is best fit by a low spin (LS) trivalent model (Ni3+). Six electrons are paired and one electron is aligned in spin-up. The Kβ peak width is wider than other measured spectra, with the highest Lorentzian broadening among the measured samples.
Reasoning source: text
Scoring Rubric (total: 100 pts)
| Q | Type | Max | Question | Reference Answer | Scoring Criteria |
|---|---|---|---|---|---|
| q1 | spectral | 35 | Describe the expected distinguishing spectral features and shape of the Ni Kβ XES spectrum for this LiNiO2 sample compared to other typical Ni samples. | The expected distinguishing spectral feature of this LiNiO2 sample is a strong Kβ mainline that exhibits a wider peak width compared to other measured spectra. Additionally, it displays the highest Lorentzian broadening (L1 and L2) among the measured samples. These specific spectral features arise directly from the sample's composition as a LiNiO2 powder with Ni in an Oh symmetry. Because the Ni ions exist in a 3+ oxidation state and are best fit by a low spin trivalent model (with six paired electrons and one spin-up electron), these unique electronic and crystal field effects produce the observed peak broadening. | Full points if the answer mentions the wider Kβ peak width and the highest Lorentzian broadening compared to other measured samples. |
| q2 | reasoning | 40 | Based on the spectral analysis of this sample, what is the expected electronic structure, oxidation state, and spin state of the Ni ions? | The Ni ions in this sample are expected to have a 3+ oxidation state and exist in a low spin (LS) state. Specifically, the electronic structure consists of six paired electrons and one electron aligned in spin-up. This configuration arises because the sample is a LiNiO2 powder where the Ni ions are situated in an Oh symmetry environment. Under these specific structural and compositional conditions, atomic multiplet and crystal field effects dictate a low spin trivalent model, which directly causes the uniquely wide Kβ peak width and high Lorentzian broadening observed in the spectrum. | Full points if the answer identifies a low spin (LS) trivalent model (Ni3+), specifying that six electrons are paired and one electron is aligned in spin-up. |
| q3 | spectral | 25 | What specific electronic transition gives rise to the strong Kβ mainline observed in this XES measurement? | The strong Kβ mainline observed in this XES measurement originates specifically from the 3p -> 1s electronic transition. This transition occurs because the measurement mode is Ni Kβ XES, which probes the decay of a 3p electron into a 1s core hole in the LiNiO2 powder sample. Given the sample conditions of Ni in a 3+ oxidation state and Oh symmetry, this transition is heavily influenced by the local electronic environment. Specifically, the low spin trivalent state (six paired electrons and one spin-up) dictates the final state multiplet interactions, resulting in the unusually wide Kβ peak width and high Lorentzian broadening characteristic of this transition. | Full points if the answer correctly identifies the 3p -> 1s transition. |
Review
Five-analyzer Johann spectrometer for hard X-ray photon-in/photon-out spectroscopy at the Inner Shell Spectroscopy beamline at NSLS-II: design, alignment and data acquisition
BNL-NSLS-II-8-ID
Pure Phase
Akhil Tayal et al.
DOI: 10.1107/S1600577524009342
3 scenarios
▶
#1134
CuO
Cu K-edge
▶
LLM Prompt
Sample Information
Material: CuO
Oxidation State: Cu2+
Sample Form: pellet
Measurement Mode: HERFD-XANES
- Copper oxide reference sample used to verify the Bragg angle calibration of individual spherically bent crystal analyzers (SBCAs)
Measurement
We plan to measure the Cu K-edge XANES spectrum of this sample.
Questions
Based on all the information above:
1. Identify the specific chemical compound and its oxidation state present in this reference sample.
2. What is the primary purpose of measuring the HERFD-XANES spectrum of this specific CuO sample, and what does the spectral consistency across individual analyzers demonstrate?
Ground Truth
Compound: CuO
Oxidation state: Cu2+
Measurement: Cu K-edge HERFD-XANES
Edge position: not reported
Spectral shape: HERFD-XANES spectra measured by individual SBCAs show good agreement with the central SBCA, demonstrating consistent spectrometer calibration.
Distinguishing features: not reported
Key reasoning: The sample is a pure copper oxide reference (1 wt% diluted in boron nitride) used to verify the Bragg angle calibration of individual spherically bent crystal analyzers (SBCAs). The HERFD-XANES spectra measured by individual SBCAs show good agreement with the central SBCA, demonstrating consistent spectrometer calibration.
Reasoning source: Figure 4 and associated text describing spectrometer calibration
Scoring Rubric (total: 100 pts)
| Q | Type | Max | Question | Reference Answer | Scoring Criteria |
|---|---|---|---|---|---|
| q1 | identification | 43 | Identify the specific chemical compound and its oxidation state present in this reference sample. | The sample consists entirely of pure copper(II) oxide (CuO) with copper in the Cu2+ oxidation state, representing a phase fraction of 1.0. This specific phase and oxidation state are present because the material was explicitly prepared as a stable, well-defined reference standard. Specifically, it is a pure CuO sample diluted to 1 wt% in boron nitride and pressed into a pellet. This pure composition is required to reliably verify the Bragg angle calibration of individual spherically bent crystal analyzers (SBCAs) during Cu K-edge HERFD-XANES measurements. | Full points for correctly identifying the compound as CuO and the oxidation state as Cu2+. |
| q3 | reasoning | 57 | What is the primary purpose of measuring the HERFD-XANES spectrum of this specific CuO sample, and what does the spectral consistency across individual analyzers demonstrate? | The primary purpose of measuring the Cu K-edge HERFD-XANES spectrum of this CuO pellet is to verify the Bragg angle calibration of the individual spherically bent crystal analyzers (SBCAs). Because the sample is prepared as a pure, well-defined Cu2+ reference standard (diluted to 1 wt% in boron nitride), its intrinsic spectral features are constant and predictable. Therefore, the observed good agreement between the spectra measured by individual SBCAs and the central SBCA directly demonstrates consistent and accurate spectrometer calibration across the different analyzer crystals. | Full points for explaining that the sample is used to verify the Bragg angle calibration of individual spherically bent crystal analyzers (SBCAs), and that the good agreement of spectra demonstrates consistent spectrometer calibration. |
Review
#1135
Cu-zeolite
Cu K-edge
▶
LLM Prompt
Sample Information
Material: Cu-zeolite
Crystal Structure: zeolite
Measurement Mode: HERFD-XANES and TFY
- Cu-zeolite sample measured under operando conditions to demonstrate spectrometer capabilities on realistic catalytic systems
Measurement
We plan to measure the Cu K-edge XANES spectrum of this sample.
Questions
Based on all the information above:
1. Based on the provided sample information, what specific spectral feature is utilized to monitor the redox kinetics in this operando Cu-zeolite system, and what oxidation states are involved?
2. How does the choice of measurement mode (HERFD vs. TFY) impact the observed XANES spectrum for this sample?
3. What is the primary material phase present in this sample and what is its approximate copper loading?
Ground Truth
Compound: Cu-zeolite
Oxidation state: Cu(I) and Cu(II)
Measurement: Cu K-edge HERFD-XANES and TFY
Edge position: not reported
Spectral shape: Comparison of HERFD and total fluorescence yield (TFY) data shows enhanced resolution in the HERFD mode. The intensity of pre-edge features in the HERFD spectra can be used to isolate Cu(I)/Cu(II) redox kinetics.
Distinguishing features: Enhanced resolution in HERFD mode compared to TFY, allowing isolation of Cu(I)/Cu(II) redox kinetics via pre-edge features.
Key reasoning: The sample is a Cu-zeolite with ~1.5 wt% Cu loading measured under operando conditions. The intensity of pre-edge features in the HERFD spectra is used to isolate Cu(I)/Cu(II) redox kinetics, demonstrating the spectrometer's capabilities on realistic catalytic systems.
Reasoning source: figure_5 and associated text
Scoring Rubric (total: 100 pts)
| Q | Type | Max | Question | Reference Answer | Scoring Criteria |
|---|---|---|---|---|---|
| q1 | spectral | 40 | Based on the provided sample information, what specific spectral feature is utilized to monitor the redox kinetics in this operando Cu-zeolite system, and what oxidation states are involved? | The intensity of the pre-edge features in the XANES spectra is utilized to monitor the redox kinetics, involving both Cu(I) and Cu(II) oxidation states. This occurs because the Cu-zeolite sample is measured under operando conditions to demonstrate the spectrometer's capabilities on a realistic catalytic system. During these operando measurements, the active copper sites transition between the Cu(I) and Cu(II) states, and the high-resolution HERFD mode allows their distinct pre-edge features to be isolated to track the underlying redox kinetics. | Full points for identifying the pre-edge features and specifying Cu(I) and Cu(II) oxidation states. |
| q2 | spectral | 30 | How does the choice of measurement mode (HERFD vs. TFY) impact the observed XANES spectrum for this sample? | The High-Energy Resolution Fluorescence Detected (HERFD) mode provides significantly enhanced spectral resolution compared to the Total Fluorescence Yield (TFY) mode. This Cu-zeolite sample is measured under operando conditions specifically to demonstrate the spectrometer's capabilities on realistic catalytic systems. The enhanced resolution achieved by selecting the HERFD mode over TFY is structurally necessary to clearly resolve the pre-edge features. Consequently, this allows researchers to successfully isolate and monitor the Cu(I)/Cu(II) redox kinetics occurring within the catalyst. | Full points for stating that HERFD mode provides enhanced resolution compared to total fluorescence yield (TFY) data. |
| q3 | identification | 30 | What is the primary material phase present in this sample and what is its approximate copper loading? | The primary material phase present is Cu-zeolite, which accounts for a 1.0 (100%) fraction of the sample, with an approximate copper loading of 1.5 wt%. This specific composition arises because the sample was prepared as a realistic catalytic system to demonstrate the spectrometer's capabilities under operando conditions. The ~1.5 wt% Cu loading provides a representative concentration of active copper sites within the zeolite crystal structure. During the operando measurements, these active sites transition between Cu(I) and Cu(II) oxidation states, allowing the redox kinetics of the pure Cu-zeolite phase to be effectively monitored. | Full points for identifying Cu-zeolite and stating the ~1.5 wt% Cu loading. |
Review
#1136
Hg in muscle tissue
Hg L3-edge
▶
LLM Prompt
Sample Information
Material: Hg in muscle tissue
Sample Form: freeze dried, homogenized, pressed pellet
Measurement Mode: HERFD-XANES
- Biological tissue sample measured to demonstrate the spectrometer's sensitivity to ultra-dilute concentrations
Measurement
We plan to measure the Hg L3-edge XANES spectrum of this sample.
Questions
Based on all the information above:
1. Based on the sample conditions (19.3 ppm Hg in muscle tissue), why is the HERFD-XANES measurement mode specifically highlighted for this experiment, and what does it demonstrate?
2. What is the expected phase composition of the mercury in this dolphin muscle tissue sample?
3. What experimental strategy was necessary during the HERFD-XANES measurement to obtain a reliable spectrum from this highly dilute (19.3 ppm) biological sample?
Ground Truth
Compound: Hg in muscle tissue (19.3 ppm by weight)
Oxidation state: not reported
Measurement: Hg L3-edge HERFD-XANES
Edge position: not reported
Spectral shape: HERFD-XANES spectrum at the Hg L3 edge collected by averaging 236 scans on a highly dilute biological sample.
Distinguishing features: not reported
Key reasoning: The sample is a highly dilute biological tissue (19.3 ppm by weight) measured to demonstrate the spectrometer's sensitivity to ultra-dilute concentrations. The HERFD-XANES spectrum was successfully collected by averaging 236 scans to achieve sufficient signal for this highly dilute biological sample.
Reasoning source: Sample description and spectral shape summary
Scoring Rubric (total: 100 pts)
| Q | Type | Max | Question | Reference Answer | Scoring Criteria |
|---|---|---|---|---|---|
| q1 | reasoning | 40 | Based on the sample conditions (19.3 ppm Hg in muscle tissue), why is the HERFD-XANES measurement mode specifically highlighted for this experiment, and what does it demonstrate? | The HERFD-XANES measurement mode is specifically highlighted to demonstrate the spectrometer's high sensitivity to ultra-dilute concentrations. This is necessary because the sample consists of Hg in muscle tissue at an extremely low concentration of just 19.3 ppm by weight. Standard measurement techniques would struggle to resolve features at this trace level in a complex biological matrix. By utilizing HERFD-XANES and averaging 236 scans, the experiment successfully achieves sufficient signal to analyze the highly dilute biological sample. | The answer must explain that the sample has an ultra-dilute concentration (19.3 ppm) and that HERFD-XANES is used to demonstrate the spectrometer's high sensitivity required to measure such dilute biological samples. |
| q2 | identification | 30 | What is the expected phase composition of the mercury in this dolphin muscle tissue sample? | The expected phase composition is modeled entirely as a single phase of Hg in muscle tissue, representing a fraction of 1.0 (100%). This assignment arises directly from the sample conditions, which consist of a freeze-dried, homogenized biological tissue containing an ultra-dilute mercury concentration of 19.3 ppm by weight. Because the primary goal of the experiment is to demonstrate the spectrometer's sensitivity to trace elements rather than performing complex speciation, the mercury is treated as a single bulk tissue phase. The highly dilute nature of the sample dictates this approach, as the focus is on obtaining a viable HERFD-XANES signal from the biological matrix. | The answer must identify that the sample is treated as a single phase of 'Hg tissue' (fraction 1.0). |
| q3 | reasoning | 30 | What experimental strategy was necessary during the HERFD-XANES measurement to obtain a reliable spectrum from this highly dilute (19.3 ppm) biological sample? | To obtain a reliable HERFD-XANES spectrum, the necessary experimental strategy involved averaging 236 individual scans. This extensive signal averaging was required because the sample is a highly dilute biological tissue containing only 19.3 ppm Hg by weight. At such an ultra-dilute concentration, the fluorescence signal from the freeze-dried, pressed pellet is extremely weak. By accumulating data over 236 scans, the experiment successfully achieved a sufficient signal-to-noise ratio to demonstrate the spectrometer's sensitivity to trace elements in biological matrices. | The answer must mention that extensive signal averaging was required, specifically noting the averaging of 236 scans. |
Review
Spontaneous phase segregation of Sr 2 NiO 3 and SrNi 2 O 3 during SrNiO 3 heteroepitaxy
APS
Thin Film
Le Wang et al.
DOI: 10.1126/sciadv.abe2866
4 scenarios
▶
#1137
SrNiO3-delta on LSAT
Ni L-edge
▶
LLM Prompt
Sample Information
Material: SrNiO3-delta on LSAT
Deposition Method: OPA-MBE
Substrate: LSAT(001)
Deposition Temperature C: 700
Film Thickness Nm: 25
Composition Variable: Sr/Ni flux ratio
Composition Value: 1:1
Sample-Specific Conditions
- Film type: SNO
- SrNiO3-delta film grown with 1:1 Sr/Ni flux ratio. Identified as Ni2+. XLD analysis yields a hole ratio r = 1.12 and orbital polarization P = 5.7%.
Measurement
We plan to measure the Ni L-edge XANES spectrum of this sample.
Questions
Based on all the information above:
1. Based on the 1:1 Sr/Ni flux ratio and deposition conditions, what is the expected dominant Ni oxidation state and corresponding structural phases in this SrNiO3-delta film?
2. What specific quantitative parameters derived from X-ray linear dichroism (XLD) characterize the electronic structure of the Ni L-edge for this sample?
3. If performing spectral comparison or linear combination fitting for this sample, what specific reference spectra or basis functions would be required?
Ground Truth
Material: SrNiO3-delta on LSAT
Measurement: Ni L-edge XANES and XLD
Fit method: XLD analysis
Phase fractions: (±10%)
| Phase | Fraction |
|---|---|
| Ni2+ (Sr2NiO3 and SrNi2O3) | 1.0 |
Fit basis (paper's reference spectra):
- Ni2+ reference spectra (Sr2NiO3 and SrNi2O3)
Source evidence: Figure 3
Key reasoning: The SNO film grown with a 1:1 Sr/Ni flux ratio results in an oxygen-deficient SrNiO3-delta structure. Spectral analysis identifies the nickel as entirely Ni2+, corresponding to phases such as Sr2NiO3 and SrNi2O3. XLD analysis further confirms the electronic state with a hole ratio r = 1.12 and orbital polarization P = 5.7%.
Reasoning source: Figure 3 and associated text
Scoring Rubric (total: 100 pts)
| Q | Type | Max | Question | Reference Answer | Scoring Criteria |
|---|---|---|---|---|---|
| q1 | identification | 30 | Based on the 1:1 Sr/Ni flux ratio and deposition conditions, what is the expected dominant Ni oxidation state and corresponding structural phases in this SrNiO3-delta film? | The expected dominant Ni oxidation state is exclusively Ni2+ (fraction of 1.0), corresponding to structural phases such as Sr2NiO3 and SrNi2O3. This occurs because the SNO film is grown using OPA-MBE at 700 °C with a 1:1 Sr/Ni flux ratio, which results in an oxygen-deficient SrNiO3-delta structure. The specific stoichiometry and oxygen deficiency driven by these deposition conditions force the nickel entirely into the Ni2+ state. Consequently, the resulting compound manifests as Sr2NiO3 and SrNi2O3 phases rather than a higher oxidation state. | Full points for identifying Ni2+ as the exclusive oxidation state (fraction 1.0) and naming Sr2NiO3 and/or SrNi2O3 as the corresponding phases. |
| q2 | spectral | 40 | What specific quantitative parameters derived from X-ray linear dichroism (XLD) characterize the electronic structure of the Ni L-edge for this sample? | The electronic structure of the Ni L-edge is characterized by a hole ratio of r = 1.12 and an orbital polarization of P = 5.7% derived from X-ray linear dichroism (XLD) analysis. These specific spectral features arise because the 25 nm SrNiO3-delta film, grown on an LSAT(001) substrate at 700 °C with a 1:1 Sr/Ni flux ratio, forms an oxygen-deficient structure containing exclusively Ni2+. The specific oxygen deficiency and structural phases (Sr2NiO3 and SrNi2O3) dictated by these deposition conditions determine the electronic state and orbital occupancy of the Ni ions. Therefore, the XLD measurement yields these exact polarization and hole ratio values to reflect this unique Ni2+ electronic configuration. | Full points for correctly stating the hole ratio (r = 1.12) and the orbital polarization (P = 5.7%). |
| q3 | reasoning | 30 | If performing spectral comparison or linear combination fitting for this sample, what specific reference spectra or basis functions would be required? | The required basis functions for spectral comparison would be Ni2+ reference spectra, specifically those corresponding to Sr2NiO3 and SrNi2O3 phases. These references are necessary because the film grown via OPA-MBE at 700 °C with a 1:1 Sr/Ni flux ratio forms an oxygen-deficient SrNiO3-delta structure. Under these specific deposition conditions, the nickel is reduced entirely to an oxidation state of Ni2+ with a fraction of 1.0. Therefore, fitting the Ni L-edge XANES and XLD data requires these specific Ni2+ basis spectra to accurately capture the electronic state, which exhibits a hole ratio of r = 1.12 and orbital polarization of P = 5.7%. | Full points for specifying Ni2+ reference spectra, specifically mentioning Sr2NiO3 and SrNi2O3. |
Review
#1138
NdNiO3 on SrTiO3
Ni L-edge
▶
LLM Prompt
Sample Information
Material: NdNiO3 on SrTiO3
Substrate: SrTiO3(001)
Sample-Specific Conditions
- Reference type: Ni3+ standard
- Plasma-annealed NdNiO3 film used as Ni3+ reference.
Measurement
We plan to measure the Ni L-edge XANES spectrum of this sample.
Questions
Based on all the information above:
1. Based on the provided sample conditions, identify the expected compound and the dominant Ni oxidation state. What specific treatment was applied to the film to achieve this state?
2. Explain the physical reasoning behind applying oxygen plasma annealing to this NdNiO3 film when preparing it as a reference standard.
3. Given that this sample serves as the pure Ni3+ standard reference, what other candidate reference spectrum (in terms of oxidation state) would be necessary to perform a linear combination fit (LCF) on a partially reduced NdNiO3 film?
Ground Truth
Material: NdNiO3 on SrTiO3
Measurement: Ni L-edge XANES
Fit method: not reported
Phase fractions:
| Phase | Fraction |
|---|---|
| Ni3+ (NdNiO3) | 1.0 |
Source evidence: Figure 3
Key reasoning: The NdNiO3 film was subjected to oxygen plasma annealing to ensure full oxygenation. This treatment stabilizes the pure Ni3+ state, allowing the sample to serve as a standard reference spectrum for Ni3+.
Reasoning source: Sample description
Scoring Rubric (total: 100 pts)
| Q | Type | Max | Question | Reference Answer | Scoring Criteria |
|---|---|---|---|---|---|
| q1 | identification | 30 | Based on the provided sample conditions, identify the expected compound and the dominant Ni oxidation state. What specific treatment was applied to the film to achieve this state? | The expected compound is NdNiO3 grown on an SrTiO3(001) substrate, and the dominant Ni oxidation state is a pure Ni3+ state with a fraction of 1.0. To achieve this state, the film was subjected to an oxygen plasma annealing treatment. This specific treatment is necessary because it ensures full oxygenation of the material. By fully oxygenating the film, the pure Ni3+ state is stabilized, allowing the sample to serve as an accurate standard reference spectrum for Ni3+ in Ni L-edge XANES measurements. | Full credit for identifying the compound as NdNiO3, the oxidation state as Ni3+, and stating that oxygen plasma annealing was used. |
| q2 | reasoning | 35 | Explain the physical reasoning behind applying oxygen plasma annealing to this NdNiO3 film when preparing it as a reference standard. | Oxygen plasma annealing is applied to the NdNiO3 film to ensure the material achieves full oxygenation. Without this treatment, the presence of oxygen vacancies could introduce reduced phases that compromise the standard. By fully oxygenating the sample through plasma annealing, the pure Ni3+ state is stabilized. This guarantees that the resulting Ni L-edge XANES spectrum accurately represents the pure Ni3+ end-member, distinguishing the fully oxygenated state from any reduced phases. | Full credit for explaining that oxygen plasma annealing ensures full oxygenation of the film, thereby stabilizing a pure Ni3+ state so it can act as an accurate end-member reference. |
| q3 | prediction | 35 | Given that this sample serves as the pure Ni3+ standard reference, what other candidate reference spectrum (in terms of oxidation state) would be necessary to perform a linear combination fit (LCF) on a partially reduced NdNiO3 film? | To perform a linear combination fit on a partially reduced NdNiO3 film, a reference spectrum representing a reduced Ni phase would be necessary alongside this pure Ni3+ standard. The plasma-annealed NdNiO3 sample provides the fully oxygenated Ni3+ end-member reference spectrum. Because a partially reduced film will contain a mixture of fully oxygenated and reduced phases, fitting its spectrum requires both end-members. Therefore, combining this pure Ni3+ standard with a reduced Ni reference allows for the accurate quantification of the different oxidation states present in the sample. | Full credit for identifying the need for a Ni2+ reference spectrum (e.g., from a fully reduced or hydrogenated phase) to capture the reduction from the Ni3+ state. |
Review
#1139
NdNiO3-delta on SrTiO3
Ni L-edge
▶
LLM Prompt
Sample Information
Material: NdNiO3-delta on SrTiO3
Substrate: SrTiO3(001)
Sample-Specific Conditions
- Reference type: Ni2+ standard
- Vacuum-annealed NdNiO3-delta film used as Ni2+ reference.
Measurement
We plan to measure the Ni L-edge XANES spectrum of this sample.
Questions
Based on all the information above:
1. Based on the vacuum annealing treatment of the film, what oxidation state of Ni dominates this sample, and what is the resulting chemical formula?
2. What is the primary purpose of measuring the XANES spectrum of this specific vacuum-annealed sample in the context of the broader study?
3. If this spectrum is utilized in a Linear Combination Fitting (LCF) analysis of other mixed-phase nickelate films, what specific basis function does it provide?
Ground Truth
Material: NdNiO3-delta on SrTiO3
Measurement: Ni L-edge XANES
Fit method: not reported
Phase fractions:
| Phase | Fraction |
|---|---|
| Ni2+ (NdNiO3-delta) | 1.0 |
Fit basis (paper's reference spectra):
- Vacuum-annealed NdNiO3-delta (Ni2+ reference)
Source evidence: figure_3
Key reasoning: The vacuum-annealed NdNiO3-delta film is explicitly prepared and utilized as a pure Ni2+ reference standard for the analysis.
Reasoning source: Sample description and figure_3
Scoring Rubric (total: 100 pts)
| Q | Type | Max | Question | Reference Answer | Scoring Criteria |
|---|---|---|---|---|---|
| q1 | identification | 40 | Based on the vacuum annealing treatment of the film, what oxidation state of Ni dominates this sample, and what is the resulting chemical formula? | Based on the vacuum annealing treatment, the sample is dominated by the Ni2+ oxidation state with a fraction of 1.0, and the resulting chemical formula is NdNiO3-delta. These specific properties arise because the NdNiO3 film on the SrTiO3(001) substrate was subjected to vacuum annealing to explicitly prepare it as a pure Ni2+ reference standard. Consequently, this treatment yields a fully reduced NdNiO3-delta phase that exclusively contains Ni2+. | Full credit for identifying the oxidation state as Ni2+ and the compound as NdNiO3-delta. |
| q2 | reasoning | 30 | What is the primary purpose of measuring the XANES spectrum of this specific vacuum-annealed sample in the context of the broader study? | The primary purpose of measuring the Ni L-edge XANES spectrum of this sample is to establish a pure Ni2+ reference standard for the analysis. This is because the NdNiO3-delta film on SrTiO3(001) was specifically vacuum-annealed to ensure it contains a 1.0 fraction of Ni2+. As a result of this targeted preparation, the measured spectrum exhibits the characteristic spectral shape of a pure Ni2+ state, allowing it to serve as the distinguishing Ni2+ reference for the broader study. | Full credit for explaining that the sample is used to establish a pure Ni2+ reference standard. |
| q3 | reasoning | 30 | If this spectrum is utilized in a Linear Combination Fitting (LCF) analysis of other mixed-phase nickelate films, what specific basis function does it provide? | If utilized in a fitting analysis, this spectrum provides the specific basis function for the pure Ni2+ state, represented by vacuum-annealed NdNiO3-delta. This basis function is appropriate because the sample was explicitly prepared via vacuum annealing to serve as a pure Ni2+ reference standard. The vacuum annealing of the film on the SrTiO3(001) substrate yields a composition of NdNiO3-delta with a Ni2+ fraction of exactly 1.0. Consequently, its Ni L-edge XANES spectrum isolates the characteristic features of the Ni2+ oxidation state, making it an ideal reference component for fitting. | Full credit for stating it provides the Ni2+ reference spectrum (or vacuum-annealed NdNiO3-delta basis). |
Review
#1140
NiO on MgO
Ni L-edge
▶
LLM Prompt
Sample Information
Material: NiO on MgO
Substrate: MgO(001)
Sample-Specific Conditions
- Reference type: NiO standard
- NiO film grown on MgO(001) used as Ni2+ standard.
Measurement
We plan to measure the Ni L-edge XANES spectrum of this sample.
Questions
Based on all the information above:
1. Based on the sample conditions (NiO film grown on MgO(001)), what is the expected oxidation state and primary phase of the nickel in this film?
2. What is the primary purpose of measuring this specific pure-phase NiO on MgO(001) sample in a XANES study?
3. If performing Linear Combination Fitting (LCF) on unknown nickel thin films, what specific basis function would this sample provide?
Ground Truth
Material: NiO on MgO
Measurement: Ni L-edge
Fit method: not reported
Phase fractions: (±10%)
| Phase | Fraction |
|---|---|
| nickel_oxide_L3 | 1.0 |
Fit basis (paper's reference spectra):
- NiO standard
Source evidence: figure_3
Key reasoning: The sample is a NiO film grown on MgO(001) and is explicitly used as a Ni2+ standard reference for the Ni L-edge measurements.
Reasoning source: Sample description
Scoring Rubric (total: 100 pts)
| Q | Type | Max | Question | Reference Answer | Scoring Criteria |
|---|---|---|---|---|---|
| q1 | identification | 40 | Based on the sample conditions (NiO film grown on MgO(001)), what is the expected oxidation state and primary phase of the nickel in this film? | The expected primary phase of the nickel in this film is pure nickel oxide (NiO), and the expected oxidation state is Ni2+. This phase and oxidation state arise directly from the sample conditions, where a NiO film was specifically grown on an MgO(001) substrate. Because the material is synthesized as a pure NiO film, it consists entirely of Ni2+ with a phase fraction of 1.0. Consequently, the targeted composition and growth conditions ensure it serves as a well-defined reference material for this specific oxidation state. | Full credit for identifying NiO as the primary phase (fraction 1.0) and Ni2+ as the oxidation state. |
| q2 | reasoning | 30 | What is the primary purpose of measuring this specific pure-phase NiO on MgO(001) sample in a XANES study? | The primary purpose of measuring this specific NiO on MgO(001) sample is to use it as a Ni2+ standard reference for Ni L-edge XANES measurements. This purpose arises directly from the sample's composition and growth conditions, which yield a pure, well-defined nickel oxide phase. By measuring this specific film, researchers obtain an unambiguous spectral signature of Ni2+ without interference from other oxidation states. This pure reference spectrum is essential for accurately identifying and quantifying the Ni2+ component in subsequent measurements. | Full credit for stating it is used as a Ni2+ standard or reference spectrum for comparison or fitting. |
| q3 | prediction | 30 | If performing Linear Combination Fitting (LCF) on unknown nickel thin films, what specific basis function would this sample provide? | When performing Linear Combination Fitting (LCF), this sample would provide the "NiO standard" basis function. This specific basis function arises because the sample conditions involve a pure NiO film grown on an MgO(001) substrate, resulting in a material that is 100% nickel oxide (a fraction of 1.0). Because the sample is explicitly synthesized and utilized as a Ni2+ standard reference, its Ni L-edge spectrum perfectly represents the pure Ni2+ state. Therefore, it serves as an ideal, single-component reference spectrum for fitting the Ni2+ contribution in unknown nickel thin films. | Full credit for indicating it provides the Ni2+ (or NiO) standard reference spectrum. |
Review
Lattice site–dependent metal leaching in perovskites toward a honeycomb-like water oxidation catalyst
APS
Catalyst
Yubo Chen et al.
DOI: 10.1126/sciadv.abk1788
5 scenarios
▶
#1141
SrSc0.5Ir0.5O3
Ir L3-edge
▶
LLM Prompt
Sample Information
Material: SrSc0.5Ir0.5O3
Sample-Specific Conditions
- B-site cation: Sc
- Pristine SrSc0.5Ir0.5O3 perovskite
Measurement
We plan to measure the Ir L3-edge XANES spectrum of this sample.
Questions
Based on all the information above:
1. What is the dominant phase and the expected oxidation state of Ir in the pristine SrSc0.5Ir0.5O3 sample?
2. Explain the chemical reasoning for why Ir adopts the 5+ oxidation state in this specific perovskite structure.
3. Based on its pure-phase composition and oxidation state, what is the primary utility of this sample's XANES spectrum in a broader XAS study?
Ground Truth
Material: SrSc0.5Ir0.5O3
Measurement: Ir L3-edge, ex-situ
Fit method: not reported
Phase fractions:
| Phase | Fraction |
|---|---|
| SrSc0.5Ir0.5O3 (Ir5+) | 1.0 |
Source evidence: Sample metadata and phase fractions
Key reasoning: The pristine SrSc0.5Ir0.5O3 sample is synthesized via a solid-state method and forms a single-phase perovskite. The substitution of Sc3+ into the B-site forces Ir to adopt a 5+ oxidation state to maintain charge neutrality with Sr2+ and O3(2-).
Reasoning source: Sample description and chemical formula
Scoring Rubric (total: 100 pts)
| Q | Type | Max | Question | Reference Answer | Scoring Criteria |
|---|---|---|---|---|---|
| q1 | identification | 30 | What is the dominant phase and the expected oxidation state of Ir in the pristine SrSc0.5Ir0.5O3 sample? | The dominant phase in the pristine sample is a single-phase SrSc0.5Ir0.5O3 perovskite, which accounts for 100% of the material. In this phase, the expected oxidation state of iridium is Ir5+. This specific phase and oxidation state arise because the material is synthesized as a stable, pure perovskite structure. Furthermore, the substitution of Sc3+ into the B-site of the perovskite lattice forces the Ir cations to adopt a 5+ oxidation state in order to maintain overall charge neutrality with the Sr2+ and O3(2-) ions. | Full credit for identifying the phase as SrSc0.5Ir0.5O3 and the Ir oxidation state as 5+. |
| q2 | reasoning | 40 | Explain the chemical reasoning for why Ir adopts the 5+ oxidation state in this specific perovskite structure. | In the pristine SrSc0.5Ir0.5O3 perovskite, iridium adopts a 5+ oxidation state strictly to satisfy charge balance requirements within the crystal lattice. The perovskite structure contains Sr2+ cations and O3(2-) anions, which establish a specific baseline charge environment. When Sc3+ is substituted into the B-site alongside iridium, the overall charge neutrality of the single-phase structure must be maintained. Consequently, this specific B-site composition forces the iridium ions to take on a 5+ oxidation state to perfectly balance the charges of the Sr, Sc, and O ions. | Full credit for explaining that the presence of Sc3+ and Sr2+ in the lattice forces Ir to be 5+ to maintain overall charge neutrality with the oxygen anions. |
| q3 | prediction | 30 | Based on its pure-phase composition and oxidation state, what is the primary utility of this sample's XANES spectrum in a broader XAS study? | The primary utility of this sample's Ir L3-edge XANES spectrum is to serve as a pure Ir5+ reference standard. This utility directly results from the sample's pristine, single-phase perovskite composition (SrSc0.5Ir0.5O3) where the phase fraction is 1.0. Because the substitution of Sc3+ into the B-site forces all iridium into a uniform 5+ oxidation state to maintain charge neutrality, the material lacks mixed valences. Therefore, its stable and pure nature provides an ideal, unambiguous spectral baseline for identifying Ir5+ features in broader XAS studies. | Full credit for stating it serves as a pure Ir5+ reference standard. |
Review
#1142
SrCo0.5Ir0.5O3
Ir L3-edge
▶
LLM Prompt
Sample Information
Material: SrCo0.5Ir0.5O3
Sample-Specific Conditions
- B-site cation: Co
- Pristine SrCo0.5Ir0.5O3 perovskite
Measurement
We plan to measure the Ir L3-edge XANES spectrum of this sample.
Questions
Based on all the information above:
1. Based on the sample conditions, what is the expected dominant phase and the oxidation state of Ir in this pristine perovskite?
2. Explain why the sample is expected to consist entirely of the Ir5+ phase without any other Ir species present.
3. If you were to model this sample's XANES spectrum, what specific structural motif or reference state would be required to capture its composition?
Ground Truth
Material: SrCo0.5Ir0.5O3
Measurement: Ir L3-edge, ex-situ
Fit method: not reported
Phase fractions: (±10%)
| Phase | Fraction |
|---|---|
| SrCo0.5Ir0.5O3 (Ir5+) | 1.0 |
Fit basis (paper's reference spectra):
- not reported
Source evidence: Sample description and phase fractions data
Key reasoning: The sample is a pristine SrCo0.5Ir0.5O3 perovskite prepared via a solid-state method. Because it is measured ex-situ prior to any catalytic reaction, it remains entirely in its initial synthesized phase, which contains Ir in the 5+ oxidation state.
Reasoning source: Sample conditions and description
Scoring Rubric (total: 100 pts)
| Q | Type | Max | Question | Reference Answer | Scoring Criteria |
|---|---|---|---|---|---|
| q1 | identification | 40 | Based on the sample conditions, what is the expected dominant phase and the oxidation state of Ir in this pristine perovskite? | The expected dominant phase is SrCo0.5Ir0.5O3, with iridium present entirely in the 5+ oxidation state. This specific phase and oxidation state are expected because the sample is a pristine perovskite prepared via a solid-state method. Since the measurement is performed ex-situ prior to any catalytic reaction, the material remains completely in its initial synthesized state. Consequently, the Ir species is fully stabilized as Ir5+ within the pristine perovskite structure without any alteration. | Award 20 points for identifying the pure SrCo0.5Ir0.5O3 phase and 20 points for correctly stating the Ir5+ oxidation state. |
| q2 | reasoning | 30 | Explain why the sample is expected to consist entirely of the Ir5+ phase without any other Ir species present. | The sample is expected to consist of a 1.0 fraction (100%) of the SrCo0.5Ir0.5O3 (Ir5+) phase. This complete phase purity arises directly from the sample conditions, which specify a pristine perovskite synthesized via a solid-state method. Because the XANES measurement is conducted ex-situ before the sample undergoes any catalytic reaction, there is no driving force for structural or electronic changes. Therefore, the initial synthesized phase is perfectly preserved, ensuring that all iridium remains exclusively in the 5+ oxidation state without forming secondary species. | Award full points for explaining that the sample is pristine and measured ex-situ (prior to any reaction), thus retaining its initial solid-state synthesized Ir5+ perovskite structure. |
| q3 | prediction | 30 | If you were to model this sample's XANES spectrum, what specific structural motif or reference state would be required to capture its composition? | To model this sample's XANES spectrum, a reference state representing the pristine SrCo0.5Ir0.5O3 perovskite with Ir in a 5+ oxidation state is required, accounting for a 1.0 phase fraction. This specific reference is necessary because the sample conditions describe an as-synthesized material prepared via a solid-state method. Because the measurement is taken ex-situ prior to any catalytic reaction, the material has not undergone any structural or electronic degradation. Thus, the spectrum will exclusively reflect the initial synthesized phase, requiring only the Ir5+ perovskite state to fully capture its composition. | Award full points for identifying the need for an Ir5+ reference or the pristine SrCo0.5Ir0.5O3 perovskite structure. |
Review
#1143
SrSc0.5Ir0.5O3
Sc K-edge
▶
LLM Prompt
Sample Information
Material: SrSc0.5Ir0.5O3
Sample-Specific Conditions
- B-site cation: Sc
- Pristine SrSc0.5Ir0.5O3 perovskite
Measurement
We plan to measure the Sc K-edge XANES spectrum of this sample.
Questions
Based on all the information above:
1. What is the expected dominant phase for the pristine SrSc0.5Ir0.5O3 sample?
2. Based on the provided sample conditions, explain why a single pure phase is expected for this material.
3. Which specific X-ray absorption edge and measurement mode are targeted to probe the local environment of the B-site cation in this perovskite?
Ground Truth
Material: SrSc0.5Ir0.5O3
Measurement: Sc K-edge ex-situ
Fit method: not reported
Phase fractions:
| Phase | Fraction |
|---|---|
| SrSc0.5Ir0.5O3 | 1.0 |
Source evidence: Sample Information and Specific Conditions provided in text
Key reasoning: The sample is described as a pristine SrSc0.5Ir0.5O3 perovskite synthesized via a solid-state method. As a pristine, untreated material prior to any catalytic reaction, it exists as a single pure perovskite phase with Sc occupying the B-site.
Reasoning source: Sample Information section
Scoring Rubric (total: 100 pts)
| Q | Type | Max | Question | Reference Answer | Scoring Criteria |
|---|---|---|---|---|---|
| q1 | identification | 30 | What is the expected dominant phase for the pristine SrSc0.5Ir0.5O3 sample? | The expected dominant phase for this sample is SrSc0.5Ir0.5O3, which constitutes 100% (a fraction of 1.0) of the material. This single pure phase is expected because the sample is described as a pristine, untreated perovskite prior to any catalytic reaction. Under these initial conditions, the material maintains its solid-state synthesized structure, existing entirely as a pure perovskite phase with Sc occupying the B-site. | Full credit if the answer identifies SrSc0.5Ir0.5O3 as the pure/dominant phase. |
| q2 | reasoning | 40 | Based on the provided sample conditions, explain why a single pure phase is expected for this material. | A single pure phase of SrSc0.5Ir0.5O3 (fraction of 1.0) is expected because the material is in its pristine, as-synthesized state. The sample conditions specify that this is an untreated perovskite prior to any catalytic reaction. Because it has not yet been subjected to any reactive environments, it retains its original solid-state synthesized structure, existing entirely as a single pure perovskite phase with Sc occupying the B-site. | Full credit if the answer explains that the sample is a pristine, untreated perovskite prepared via a solid-state method, meaning it has not undergone any reaction conditions that would induce phase segregation or transformation. |
| q3 | identification | 30 | Which specific X-ray absorption edge and measurement mode are targeted to probe the local environment of the B-site cation in this perovskite? | The targeted measurement is the Sc K-edge XANES spectrum, collected in an ex-situ mode. This specific edge is chosen because Sc is explicitly identified as the B-site cation in the SrSc0.5Ir0.5O3 perovskite structure. Probing the Sc K-edge allows for the direct investigation of the local environment of this specific B-site cation. The ex-situ measurement is appropriate because the sample is a pristine, untreated material prior to any catalytic reaction, meaning it exists as a stable, single pure perovskite phase. | Full credit if the answer specifies the Sc K-edge and ex-situ measurement mode. |
Review
#1144
SrCo0.5Ir0.5O3
Co K-edge
▶
LLM Prompt
Sample Information
Material: SrCo0.5Ir0.5O3
Sample-Specific Conditions
- B-site cation: Co
- Pristine SrCo0.5Ir0.5O3 perovskite
Measurement
We plan to measure the Co K-edge XANES spectrum of this sample.
Questions
Based on all the information above:
1. Given the synthesis of pristine SrCo0.5Ir0.5O3 via a solid-state method, what is the expected dominant phase, and what does the Co K-edge XANES spectrum confirm about the Co atoms in this structure?
2. Based on the composition of the SrCo0.5Ir0.5O3 perovskite, what is the expected oxidation state of Co, and how would this be reflected in the XANES edge position compared to a Co2+ reference?
3. Describe the expected spectral shape of the Co K-edge XANES for this pristine perovskite, specifically focusing on the pre-edge and white line features and their electronic origins.
Ground Truth
Material: SrCo0.5Ir0.5O3
Measurement: Co K-edge XANES, ex-situ
Fit method: not reported
Phase fractions: (±10%)
| Phase | Fraction |
|---|---|
| SrCo0.5Ir0.5O3 | 1.0 |
Fit basis (paper's reference spectra):
- not reported
Source evidence: XANES spectra figures and structural characterization in the text
Key reasoning: The pristine SrCo0.5Ir0.5O3 sample is prepared via a solid-state method, forming a single-phase perovskite structure. The Co K-edge XANES spectrum confirms the local octahedral coordination and the oxidized state of Co incorporated into the B-site of the perovskite lattice.
Reasoning source: Results and Discussion section
Scoring Rubric (total: 100 pts)
| Q | Type | Max | Question | Reference Answer | Scoring Criteria |
|---|---|---|---|---|---|
| q1 | reasoning | 30 | Given the synthesis of pristine SrCo0.5Ir0.5O3 via a solid-state method, what is the expected dominant phase, and what does the Co K-edge XANES spectrum confirm about the Co atoms in this structure? | The expected dominant phase is a single-phase SrCo0.5Ir0.5O3 perovskite, representing a 1.0 fraction of the sample. This phase arises because the pristine sample is prepared via a solid-state method specifically designed to form this perovskite structure. The Co K-edge XANES spectrum confirms that the Co atoms are successfully incorporated into the B-site of this perovskite lattice. Consequently, the spectrum verifies the local octahedral coordination and the highly oxidized state of the Co atoms resulting from this specific structural environment. | Full points if the answer identifies SrCo0.5Ir0.5O3 as the pure/dominant phase (fraction 1.0) and explains that XANES confirms Co incorporation into the B-site of the perovskite lattice with octahedral coordination. |
| q2 | prediction | 35 | Based on the composition of the SrCo0.5Ir0.5O3 perovskite, what is the expected oxidation state of Co, and how would this be reflected in the XANES edge position compared to a Co2+ reference? | The expected oxidation state of Co in the pristine SrCo0.5Ir0.5O3 perovskite is between +3 and +4. This highly oxidized state occurs because Co is incorporated into the B-site of the perovskite lattice, where it must balance the overall charge of the pristine SrCo0.5Ir0.5O3 structure. As a result of this high oxidation state, the XANES absorption edge is positioned at a higher energy compared to standard Co2+ references. This shift to higher energy directly reflects the oxidized state of the B-site Co, distinguishing the sample from lower-valent cobalt oxides like CoO or Co3O4. | Full points if the answer states the oxidation state is between +3 and +4 (or highly oxidized) and predicts that the absorption edge position will be shifted to higher energy compared to Co2+ references. |
| q3 | spectral | 35 | Describe the expected spectral shape of the Co K-edge XANES for this pristine perovskite, specifically focusing on the pre-edge and white line features and their electronic origins. | The Co K-edge XANES spectrum exhibits a weak pre-edge feature followed by a strong white line. The weak pre-edge originates from a 1s to 3d transition, which is dipole-forbidden but becomes allowed via p-d mixing due to the local octahedral coordination of Co in the perovskite B-site. The strong white line arises from the allowed 1s to 4p dipole transition. These specific spectral features are produced because the pristine SrCo0.5Ir0.5O3 sample forms a single-phase perovskite structure where Co is highly oxidized and octahedrally coordinated. | Full points if the answer identifies a weak pre-edge (originating from the 1s to 3d transition) and a strong white line (originating from the 1s to 4p transition), typical for octahedral Co. |
Review
#1145
IrO2
Ir L3-edge
▶
LLM Prompt
Sample Information
Material: IrO2
Sample-Specific Conditions
- reference: IrO2
- Reference material
Measurement
We plan to measure the Ir L3-edge XANES spectrum of this sample.
Questions
Based on all the information above:
1. Describe the expected spectral shape of the Ir L3-edge XANES for rutile IrO2. Specifically, what physical phenomenon dictates the shape of the white line?
2. How does the Ir L3-edge XANES spectrum of crystalline rutile IrO2 distinguish itself from that of metallic Ir or amorphous IrOx species?
3. What is the formal oxidation state of Ir in this reference material, and what is the primary purpose of measuring its spectrum in the context of catalyst characterization?
Ground Truth
Material: IrO2
Measurement: Ir L3-edge, ex-situ
Fit method: not applicable
Phase fractions:
| Phase | Fraction |
|---|---|
| rutile IrO2 | 1.0 |
Source evidence: Figure 2
Key reasoning: Rutile IrO2 is used as a standard reference material for Ir4+ in an octahedral coordination environment. It provides a baseline spectrum to compare the oxidation state and local coordination of the synthesized Ir-based catalysts.
Reasoning source: Results and Discussion
Scoring Rubric (total: 100 pts)
| Q | Type | Max | Question | Reference Answer | Scoring Criteria |
|---|---|---|---|---|---|
| q1 | spectral | 40 | Describe the expected spectral shape of the Ir L3-edge XANES for rutile IrO2. Specifically, what physical phenomenon dictates the shape of the white line? | The Ir L3-edge XANES spectrum for the IrO2 reference sample exhibits an intense white line that is distinctly split into two peaks. These peaks correspond to the 2p3/2 to 5d (t2g) and 2p3/2 to 5d (eg) transitions. This specific spectral shape arises because the sample is a pure rutile IrO2 reference material, where the Ir4+ ions are situated in a well-defined octahedral coordination environment. Consequently, the physical phenomenon dictating this shape is the octahedral crystal field splitting of the Ir 5d states by the surrounding oxygen atoms, which separates the d-orbitals into distinct t2g and eg levels. | Full credit if the answer mentions an intense white line that is split into two peaks (t2g and eg) and correctly attributes this splitting to the octahedral crystal field of the surrounding oxygen ligands. |
| q2 | identification | 30 | How does the Ir L3-edge XANES spectrum of crystalline rutile IrO2 distinguish itself from that of metallic Ir or amorphous IrOx species? | The spectrum of crystalline rutile IrO2 is distinguished by the distinct splitting of its intense white line into well-resolved t2g and eg peaks. In contrast, metallic Ir exhibits a lower white line intensity with no splitting, while amorphous IrOx shows broadened and less resolved spectral features. These distinguishing features arise because the sample is a highly crystalline rutile IrO2 reference material with a strict, long-range octahedral coordination environment. This structural order and the specific Ir4+ oxidation state in the reference sample produce the sharp, characteristic crystal field splitting that is inherently absent or blurred in metallic or disordered amorphous phases. | Full credit if the answer notes that crystalline rutile IrO2 has a distinctly resolved splitting of the white line, whereas metallic Ir lacks this splitting (and has lower intensity) and amorphous IrOx shows broadened, less resolved features. |
| q3 | reasoning | 30 | What is the formal oxidation state of Ir in this reference material, and what is the primary purpose of measuring its spectrum in the context of catalyst characterization? | The formal oxidation state of Ir in this reference material is +4. Because the sample is a pure rutile IrO2 standard, it inherently consists of a 1.0 fraction of rutile IrO2, providing a well-defined Ir4+ species in an octahedral coordination environment. The primary purpose of measuring its spectrum is to establish a reliable baseline for this specific electronic and structural state. This allows researchers to accurately evaluate and compare the oxidation state and local coordination environment of newly synthesized Ir-based catalysts against this known standard. | Full credit if the answer identifies the oxidation state as +4 and explains that it serves as a baseline/reference for Ir4+ in an octahedral environment to evaluate the oxidation state and local structure of unknown catalysts. |
Review
Biogenic-to-lithogenic handoff of particulate Zn affects the Zn cycle in the Southern Ocean
BNL-NSLS-II-8-ID
Environmental
J. Duan et al.
DOI: 10.1126/science.adh8199
11 scenarios
▶
#1146
marine particles
Zn K
▶
LLM Prompt
Sample Information
Material: marine particles
Sample Origin: Southern Ocean
Sample-Specific Conditions
- Water mass: SASW
- Suspended marine particles from Subantarctic Surface Water
Measurement
We plan to measure the Zn K XANES spectrum of this sample.
Questions
Based on all the information above:
1. What candidate reference spectra or structural motifs should be considered when analyzing the Zn speciation of suspended marine particles from Subantarctic Surface Water?
Ground Truth
Material: marine particles
Measurement: Zn K-edge XANES
Fit method: Combination of XRF elemental correlations and XANES fitting
Phase fractions: (±19%)
| Phase | Fraction |
|---|---|
| Zn-phosphoryl | 0.21 |
| Other | 0.79 |
Fit basis (paper's reference spectra):
- Zn-phosphoryl
- Zn-carboxylic/amino acids
- Zn-silica
- Zn-Fe/Mn oxides
- Zn-Al oxides
- Zn hydroxide/clays
Source evidence: Page 21, text: 'enriched Zn-phosphoryl phase observed in surface waters ranged between 21 ± 19% (n = 4) in Subantarctic Surface Water'
Key reasoning: In the surface ocean, phytoplankton assimilate dissolved Zn and produce Zn bound to organic ligands, including phosphoryl groups. The presence of the Zn-phosphoryl phase is consistent with biological production in surface waters. The remaining fraction consists of other biogenic or lithogenic phases.
Reasoning source: Page 21 and Page 37
Scoring Rubric (total: 100 pts)
| Q | Type | Max | Question | Reference Answer | Scoring Criteria |
|---|---|---|---|---|---|
| q1 | identification | 100 | What candidate reference spectra or structural motifs should be considered when analyzing the Zn speciation of suspended marine particles from Subantarctic Surface Water? | When analyzing the Zn speciation of suspended marine particles from Subantarctic Surface Water, the candidate reference spectra should include Zn-phosphoryl, Zn-carboxylic/amino acids, Zn-silica, Zn-Fe/Mn oxides, Zn-Al oxides, and Zn hydroxide/clays. These specific phases are expected because, in the surface ocean environment, phytoplankton assimilate dissolved Zn and produce Zn bound to organic ligands like phosphoryl groups. The presence of the Zn-phosphoryl phase is directly consistent with this biological production in surface waters, while the remaining references account for other biogenic or lithogenic phases present in the suspended particles. | Full credit for identifying biogenic organic phases (like Zn-phosphoryl, Zn-carboxylic/amino acids) and potential lithogenic or biogenic inorganic phases (like Zn-silica, Zn-Fe/Mn oxides). |
Review
#1147
marine particles
Zn K
▶
LLM Prompt
Sample Information
Material: marine particles
Sample Origin: Southern Ocean
Sample-Specific Conditions
- Water mass: AASW
- Suspended marine particles from Antarctic Surface Water
Measurement
We plan to measure the Zn K XANES spectrum of this sample.
Questions
Based on all the information above:
1. What are the primary candidate Zn phases (reference spectra) that should be considered when modeling the XANES spectra of these Southern Ocean marine particles?
2. Based on the environmental conditions (Antarctic Surface Water), estimate the relative fractions of the major Zn phases in these suspended particles.
3. Provide the biogeochemical reasoning for why these specific Zn phases and their relative abundances are expected in Antarctic Surface Water.
Ground Truth
Material: marine particles
Measurement: Zn K-edge XANES
Fit method: Linear combination fitting (LCF) of XANES spectra combined with XRF elemental correlations
Phase fractions: (±23%)
| Phase | Fraction |
|---|---|
| Zn-phosphoryl | 0.36 |
| Other | 0.64 |
Fit basis (paper's reference spectra):
- Zn-phosphoryl
- Zn-silica
- Zn-Fe/Mn oxides
- Zn-hydroxide/clays
- Zn-carboxylic/amino acids
- Zn-Al oxides
Source evidence: Page 21, text ('36 ± 23% (n = 3) in Antarctic Surface Water')
Key reasoning: In surface waters like the Antarctic Surface Water, biological production is active. Phytoplankton assimilate dissolved Zn and produce Zn bound to ligands such as phosphoryls. This results in a significant fraction of particulate Zn being associated with biogenic Zn-phosphoryl complexes. The remaining fraction comprises other phases, which may include lithogenic materials or other organic complexes.
Reasoning source: Pages 21 and 37
Scoring Rubric (total: 100 pts)
| Q | Type | Max | Question | Reference Answer | Scoring Criteria |
|---|---|---|---|---|---|
| q1 | identification | 30 | What are the primary candidate Zn phases (reference spectra) that should be considered when modeling the XANES spectra of these Southern Ocean marine particles? | When modeling the Zn K-edge XANES spectra of these Southern Ocean marine particles, the primary candidate reference phases to consider are Zn-phosphoryl, Zn-silica, Zn-Fe/Mn oxides, Zn-hydroxide/clays, Zn-carboxylic/amino acids, and Zn-Al oxides. These specific phases are expected because the sample consists of suspended particles from the Antarctic Surface Water (AASW), an environment characterized by active biological production and suspended minerals. Phytoplankton in these surface waters assimilate dissolved Zn to produce biogenic organic complexes, necessitating the inclusion of Zn-phosphoryl and Zn-carboxylic/amino acids in the model. Furthermore, the presence of lithogenic materials and inorganic scavengers in the marine water column accounts for the inclusion of the remaining silica, clay, and oxide phases. | Full points for identifying a mix of biogenic (e.g., Zn-phosphoryl, Zn-silica, Zn-organic acids) and lithogenic (e.g., Zn-Fe/Mn oxides, Zn-clays/hydroxides) reference phases. |
| q2 | quantification | 30 | Based on the environmental conditions (Antarctic Surface Water), estimate the relative fractions of the major Zn phases in these suspended particles. | Based on linear combination fitting of the XANES spectra, the estimated relative fractions for these suspended marine particles are 0.36 (36% ± 23%) for Zn-phosphoryl and 0.64 (64%) for other combined phases. These specific values result directly from the environmental conditions present in the Antarctic Surface Water (AASW). Because AASW is a surface water mass with active biological production, phytoplankton actively assimilate dissolved Zn and bind it to ligands such as phosphoryls. Consequently, a significant portion (36%) of the particulate Zn is associated with these biogenic Zn-phosphoryl complexes, while the remaining 64% comprises other phases like lithogenic materials or other organic complexes. | Full points for estimating Zn-phosphoryl at approximately 35-40% and the remainder as 'other' or mixed lithogenic/organic phases, within the ±23% uncertainty range. |
| q3 | reasoning | 40 | Provide the biogeochemical reasoning for why these specific Zn phases and their relative abundances are expected in Antarctic Surface Water. | The specific Zn phases and their relative abundances in these Southern Ocean marine particles are driven by the active biological production characteristic of the Antarctic Surface Water (AASW). In this surface water mass, phytoplankton actively assimilate dissolved Zn from the water column to support biological functions. Once assimilated, the Zn is bound to intracellular ligands, predominantly forming biogenic Zn-phosphoryl complexes, which directly accounts for the significant 36% fraction of Zn-phosphoryl observed in the particles. The remaining 64% of the particulate Zn consists of other phases, which arise from a combination of other organic complexes and lithogenic materials suspended in the marine environment. | Full points for explaining that active biological production by phytoplankton in surface waters leads to the assimilation of dissolved Zn into biogenic pools, specifically binding to phosphoryl ligands, while other phases represent a mix of lithogenic or alternative organic components. |
Review
#1148
marine particles
Zn K
▶
LLM Prompt
Sample Information
Material: marine particles
Sample Origin: Southern Ocean
Sample-Specific Conditions
- Water mass: STSW
- Suspended marine particles from Subtropical Surface Water
Measurement
We plan to measure the Zn K XANES spectrum of this sample.
Questions
Based on all the information above:
1. What candidate reference spectra (basis functions) should be considered when modeling the Zn K-edge XANES spectra of suspended marine particles from the Southern Ocean?
2. Estimate the quantitative phase fractions of Zn in these suspended marine particles specifically from Subtropical Surface Water (STSW).
3. Explain the biogeochemical reasoning for the dominant Zn phase found in these Subtropical Surface Water particles.
Ground Truth
Material: marine particles
Measurement: Zn K-edge XANES
Fit method: Combination of XRF elemental correlations and XANES linear combination fitting
Phase fractions: (±16%)
| Phase | Fraction |
|---|---|
| Zn-phosphoryl | 0.84 |
| Other | 0.16 |
Fit basis (paper's reference spectra):
- Zn-phosphoryl
- Zn-silica
- Zn-Fe/Mn oxides
- Zn-hydroxide/clays
- Zn-carboxylic/amino acids
- Zn-Al oxides
Source evidence: Page 21, text ('84% (n = 1) in Subtropical Surface Water (table S3)')
Key reasoning: In the surface ocean, phytoplankton assimilate dissolved Zn and produce Zn bound to organic ligands, particularly phosphoryl groups. The highly enriched Zn-phosphoryl phase (84%) observed in Subtropical Surface Water is consistent with active biological production and phytoplankton uptake in these surface waters. The remaining fraction consists of 'other' phases which include minor organic complexes or mixed phases.
Reasoning source: Page 21 (Results) and Page 37 (Discussion)
Scoring Rubric (total: 100 pts)
| Q | Type | Max | Question | Reference Answer | Scoring Criteria |
|---|---|---|---|---|---|
| q1 | identification | 20 | What candidate reference spectra (basis functions) should be considered when modeling the Zn K-edge XANES spectra of suspended marine particles from the Southern Ocean? | When modeling the Zn K-edge XANES spectra of suspended marine particles from the Southern Ocean, the candidate reference spectra should include Zn-phosphoryl, Zn-silica, Zn-Fe/Mn oxides, Zn-hydroxide/clays, Zn-carboxylic/amino acids, and Zn-Al oxides. These specific phases are expected because suspended marine particles in the surface ocean consist of a mixture of biological and mineral components. Active phytoplankton in the surface water assimilate dissolved Zn into organic ligands, necessitating references like Zn-phosphoryl and Zn-carboxylic/amino acids. Meanwhile, the inorganic references (silica, clays, and various oxides) account for the mineral dust, scavenging components, and mixed phases present in the Southern Ocean environment. | Full points for identifying a comprehensive set of biogenic and lithogenic candidate phases, including Zn-phosphoryl, Zn-silica, Zn-Fe/Mn oxides, Zn-clays/hydroxides, and Zn-organic acids. |
| q2 | quantification | 40 | Estimate the quantitative phase fractions of Zn in these suspended marine particles specifically from Subtropical Surface Water (STSW). | For suspended marine particles from Subtropical Surface Water (STSW), the quantitative phase fractions of Zn are 84% Zn-phosphoryl and 16% 'Other' phases, with an estimated uncertainty of 16%. These specific values arise because STSW is a surface ocean environment characterized by active biological production. In these surface waters, phytoplankton actively assimilate dissolved Zn and produce Zn bound to organic ligands, particularly phosphoryl groups, driving the highly enriched 84% fraction. The remaining 16% represents minor organic complexes or mixed phases that coexist in this surface water mass. | Full points for estimating Zn-phosphoryl at ~84% and 'Other' (or minor mixed/organic phases) at ~16%. |
| q3 | reasoning | 40 | Explain the biogeochemical reasoning for the dominant Zn phase found in these Subtropical Surface Water particles. | The dominant Zn phase found in Subtropical Surface Water (STSW) particles is Zn-phosphoryl, which accounts for 84% of the speciation. The biogeochemical reasoning for this stems from the conditions of the surface ocean, which supports active biological production. In this environment, phytoplankton actively assimilate dissolved Zn from the water column to support their biological functions. Once taken up, the phytoplankton produce Zn that is predominantly bound to organic ligands, specifically phosphoryl groups. This direct biological uptake and organic complexation mechanism explains why the Zn-phosphoryl phase is so highly enriched in STSW suspended particles. | Full points for explaining that in surface waters, active biological production and phytoplankton assimilation of dissolved Zn lead to the formation of Zn bound to organic ligands, predominantly phosphoryl groups. |
Review
#1149
marine particles
Zn K
▶
LLM Prompt
Sample Information
Material: marine particles
Sample Origin: Southern Ocean
Sample-Specific Conditions
- Water mass: LCDW
- Suspended marine particles from Lower Circumpolar Deep Water near mid-Atlantic ridge
Measurement
We plan to measure the Zn K XANES spectrum of this sample.
Questions
Based on all the information above:
1. What candidate reference spectra (phases) should be included in a linear combination fitting basis to model the speciation of particulate Zn in the Southern Ocean water column?
Ground Truth
Material: marine particles
Measurement: Zn K-edge XANES, fluorescence mode (APS Sector 13 GeoSoilEnviroCARS / NSLS-II)
Fit method: Linear combination fitting guided by micro-XRF elemental correlations
Phase fractions: (±9%)
| Phase | Fraction |
|---|---|
| Zn-Fe/Mn oxides | 0.21 |
| Other | 0.79 |
Fit basis (paper's reference spectra):
- Zn-phosphoryl
- Zn-carboxylic/amino acids
- Zn-silica
- Zn-Fe/Mn oxides
- Zn-Al oxides
- Zn hydroxide/clays
Source evidence: Page 21, text: 'In deep waters (sites GT-1W and GT-1E), appreciable amounts of Zn–Fe/Mn oxides were present in Lower Circumpolar Deep Water (21%; n = 1)... near the mid-Atlantic ridge'
Key reasoning: In deep waters near the mid-Atlantic ridge, hydrothermal sources likely contribute to the presence of Zn-Fe/Mn oxides. Additionally, the increased proportion of lithogenic particulate Zn in deep waters illustrates the remineralization and desorption of organic particulate Zn. The released dissolved Zn is concurrently readsorbed by stable mineral phases in oxic seawater, such as Fe and Mn oxides, which act as scavengers.
Reasoning source: Pages 21 and 50
Scoring Rubric (total: 100 pts)
| Q | Type | Max | Question | Reference Answer | Scoring Criteria |
|---|---|---|---|---|---|
| q1 | identification | 100 | What candidate reference spectra (phases) should be included in a linear combination fitting basis to model the speciation of particulate Zn in the Southern Ocean water column? | To model the speciation of particulate Zn in this Southern Ocean sample, the linear combination fitting basis should include Zn-phosphoryl, Zn-carboxylic/amino acids, Zn-silica, Zn-Fe/Mn oxides, Zn-Al oxides, and Zn hydroxide/clays. These specific phases are expected because the sample consists of suspended marine particles from the Lower Circumpolar Deep Water near the mid-Atlantic ridge, where both biological remineralization and hydrothermal activity dictate Zn speciation. In these deep waters, organic particulate Zn undergoes remineralization and desorption, which accounts for the residual organic references like phosphoryl and amino/carboxylic acids. The released dissolved Zn is concurrently readsorbed by stable mineral scavengers in the oxic seawater, necessitating mineral references such as silica, clays, and notably Zn-Fe/Mn oxides, which are further supplied by nearby mid-Atlantic ridge hydrothermal sources. | Full credit for identifying a mix of biogenic (e.g., Zn-phosphoryl, Zn-carboxylic/amino acids, Zn-silica) and lithogenic (e.g., Zn-Fe/Mn oxides, Zn-Al oxides, Zn hydroxide/clays) reference phases. |
Review
#1150
marine particles
Zn K
▶
LLM Prompt
Sample Information
Material: marine particles
Sample Origin: Southern Ocean
Sample-Specific Conditions
- Water mass: AABW
- Suspended marine particles from Antarctic Bottom Water near mid-Atlantic ridge
Measurement
We plan to measure the Zn K XANES spectrum of this sample.
Questions
Based on all the information above:
1. What candidate reference spectra or structural motifs should be included in the basis set to model the Zn speciation of marine particles in the Southern Ocean?
Ground Truth
Material: marine particles
Measurement: Zn K-edge XANES
Fit method: LCF combined with XRF elemental correlations
Phase fractions: (±9%)
| Phase | Fraction |
|---|---|
| Zn-Fe/Mn oxides | 0.22 |
| Other | 0.78 |
Fit basis (paper's reference spectra):
- Zn-phosphoryl
- Zn-silica
- Zn-Fe/Mn oxides
- Zn-hydroxide/clays
- Zn-carboxylic/amino acids
- Zn-Al oxides
Source evidence: Page 21, text
Key reasoning: In deep waters such as the Antarctic Bottom Water near the mid-Atlantic ridge, appreciable amounts of Zn-Fe/Mn oxides are present. This is potentially due to hydrothermal sources in the vicinity that release Fe and Mn, which subsequently form oxides and scavenge Zn from the water column.
Reasoning source: Page 21, Results section
Scoring Rubric (total: 100 pts)
| Q | Type | Max | Question | Reference Answer | Scoring Criteria |
|---|---|---|---|---|---|
| q1 | identification | 100 | What candidate reference spectra or structural motifs should be included in the basis set to model the Zn speciation of marine particles in the Southern Ocean? | To model the Zn speciation of these marine particles, the basis set should include Zn-phosphoryl, Zn-silica, Zn-Fe/Mn oxides, Zn-hydroxide/clays, Zn-carboxylic/amino acids, and Zn-Al oxides. These specific reference spectra are necessary because the sample consists of suspended particles from the Antarctic Bottom Water (AABW) near the mid-Atlantic ridge. In this deep water environment, hydrothermal sources in the vicinity release Fe and Mn that subsequently form oxides and scavenge Zn from the water column, explaining the expected presence of Zn-Fe/Mn oxides. The remaining organic and inorganic motifs, such as silica, clays, and amino acids, account for the other biological and lithogenic materials suspended in this specific Southern Ocean water mass. | Full credit for identifying a mix of biogenic (e.g., phosphoryl, silica, organic acids) and lithogenic/authigenic (e.g., Fe/Mn oxides, clays, Al oxides) reference phases. |
Review
#1151
marine particles
Zn K
▶
LLM Prompt
Sample Information
Material: marine particles
Sample Origin: Southern Ocean
Sample-Specific Conditions
- Water mass: UCDW
- Suspended marine particles from Upper Circumpolar Deep Water at site M3
Measurement
We plan to measure the Zn K XANES spectrum of this sample.
Questions
Based on all the information above:
1. Based on the sample origin (Southern Ocean marine particles), what candidate reference spectra should be included in a Linear Combination Fitting (LCF) analysis of the Zn K-edge XANES data to capture both biogenic and lithogenic pools?
Ground Truth
Material: marine particles
Measurement: Zn K-edge XANES
Fit method: LCF combined with XRF elemental correlations
Phase fractions: (±5%)
| Phase | Fraction |
|---|---|
| Zn-silica | 0.31 |
| Other | 0.69 |
Fit basis (paper's reference spectra):
- Zn-phosphoryl
- Zn-silica
- Zn-Fe/Mn oxides
- Zn-hydroxide/clays
- Zn-carboxylic/amino acids
- Zn-Al oxides
Source evidence: Page 21, text: 'Zn-silica was abundant in deep waters at site M3 (up to 31% in Upper Circumpolar Deep Water)'
Key reasoning: In deep waters at site M3 (Upper Circumpolar Deep Water), biogenic silica produced from silicifying phytoplankton is an important Zn-bearing particulate phase. Diatoms contribute substantially to surface water biomass at site M3, supporting the presence of silica-bound pZn. Extensive remineralization of biogenic Zn-phosphoryl and additional scavenging of Zn onto biogenic silica particle surfaces explain the occurrence of Zn-silica particles in deep water.
Reasoning source: Pages 21 and 49
Scoring Rubric (total: 100 pts)
| Q | Type | Max | Question | Reference Answer | Scoring Criteria |
|---|---|---|---|---|---|
| q1 | identification | 100 | Based on the sample origin (Southern Ocean marine particles), what candidate reference spectra should be included in a Linear Combination Fitting (LCF) analysis of the Zn K-edge XANES data to capture both biogenic and lithogenic pools? | To capture both biogenic and lithogenic pools in the Zn K-edge XANES LCF analysis, the candidate reference spectra should include Zn-phosphoryl, Zn-silica, Zn-Fe/Mn oxides, Zn-hydroxide/clays, Zn-carboxylic/amino acids, and Zn-Al oxides. These specific phases are expected because the sample consists of suspended marine particles from the Upper Circumpolar Deep Water (UCDW) at site M3 in the Southern Ocean. In this deep water environment, diatoms from surface biomass produce biogenic silica, making it a crucial Zn-bearing particulate phase. The presence of these diverse phases is driven by the extensive remineralization of biogenic Zn-phosphoryl and the additional scavenging of Zn onto biogenic silica particle surfaces. | Full credit for identifying a mix of biogenic (e.g., Zn-phosphoryl, Zn-silica, Zn-organic acids) and lithogenic (e.g., Zn-Fe/Mn oxides, clays, Al oxides) phases. |
Review
#1152
marine particles
Zn K
▶
LLM Prompt
Sample Information
Material: marine particles
Sample Origin: Southern Ocean
Sample-Specific Conditions
- Water mass: LCDW
- Suspended marine particles from Lower Circumpolar Deep Water at site GT-1E
Measurement
We plan to measure the Zn K XANES spectrum of this sample.
Questions
Based on all the information above:
1. What candidate reference spectra are needed to model the Zn speciation of marine particles in the Southern Ocean using XANES?
Ground Truth
Material: marine particles
Measurement: Zn K-edge XANES
Fit method: Speciation analysis combining XRF elemental correlations with XANES spectra
Phase fractions: (±5%)
| Phase | Fraction |
|---|---|
| Zn-silica | 0.35 |
| Other | 0.65 |
Fit basis (paper's reference spectra):
- Zn-phosphoryl
- Zn-silica
- Zn-Fe/Mn oxides
- Zn-hydroxide/clays
- Zn-carboxylic/amino acids
- Zn-Al oxides
Source evidence: Page 21 (text)
Key reasoning: Zn-silica is abundant in deep waters at site GT-1E (up to 35% in Lower Circumpolar Deep Water). Diatoms contribute substantially to surface water biomass at this site in the Antarctic Zone, providing the biogenic silica source. The occurrence of Zn-silica in deep water is explained by the extensive remineralization of biogenic Zn-phosphoryl and the additional scavenging of Zn onto biogenic silica particle surfaces.
Reasoning source: Pages 21 and 49
Scoring Rubric (total: 100 pts)
| Q | Type | Max | Question | Reference Answer | Scoring Criteria |
|---|---|---|---|---|---|
| q1 | identification | 100 | What candidate reference spectra are needed to model the Zn speciation of marine particles in the Southern Ocean using XANES? | To model the Zn speciation of these marine particles using XANES, the required candidate reference spectra are Zn-phosphoryl, Zn-silica, Zn-Fe/Mn oxides, Zn-hydroxide/clays, Zn-carboxylic/amino acids, and Zn-Al oxides. These specific phases are expected in suspended particles from the Lower Circumpolar Deep Water (LCDW) at site GT-1E due to the region's distinct biological and chemical dynamics. Specifically, diatoms contribute substantially to the surface water biomass in this Antarctic Zone, providing a major biogenic silica source. As these particles sink into the deep water, extensive remineralization of biogenic Zn-phosphoryl occurs, coupled with the additional scavenging of Zn onto biogenic silica and other available mineral surfaces like oxides and clays, necessitating this diverse set of fitting standards. | Full points if the answer lists the primary biogenic and lithogenic reference pools identified in the paper (Zn-phosphoryl, Zn-silica, Zn-Fe/Mn oxides, Zn-hydroxide/clays, Zn-carboxylic/amino acids, Zn-Al oxides). |
Review
#1153
marine particles
Zn K
▶
LLM Prompt
Sample Information
Material: marine particles
Sample Origin: Southern Ocean
Sample-Specific Conditions
- Water mass: SASW
- Suspended marine particles from Subantarctic Surface Water at sites TM5 and TM7
Measurement
We plan to measure the Zn K XANES spectrum of this sample.
Questions
Based on all the information above:
1. Based on the sample origin (Subantarctic Surface Water at sites TM5 and TM7), what are the expected major Zn host phases, and what reference spectra should be included in a linear combination fitting analysis?
2. Estimate the phase fractions of Zn in this suspended marine particle sample from the Subantarctic Surface Water (sites TM5/TM7).
Ground Truth
Material: marine particles
Measurement: Zn K-edge XANES
Fit method: Combined XRF-XANES fitting
Phase fractions: (±9%)
| Phase | Fraction |
|---|---|
| Zn-Fe/Mn oxides | 0.52 |
| Other | 0.48 |
Fit basis (paper's reference spectra):
- Zn-phosphoryl
- Zn-silica
- Zn-Fe/Mn oxides
- Zn-hydroxide/clays
- Zn-carboxylic/amino acids
- Zn-Al oxides
Source evidence: Page 36, text
Key reasoning: The strong signature of Zn-Fe/Mn oxides in surface waters at sites TM5 and TM7 is likely influenced by the Agulhas Current system. This current system is rich in lithogenic material, which results in increased lithogenic particulate Zn concentrations in these specific locations, contrasting with typical biogenically-dominated surface waters.
Reasoning source: Page 36, text
Scoring Rubric (total: 100 pts)
| Q | Type | Max | Question | Reference Answer | Scoring Criteria |
|---|---|---|---|---|---|
| q1 | identification | 46 | Based on the sample origin (Subantarctic Surface Water at sites TM5 and TM7), what are the expected major Zn host phases, and what reference spectra should be included in a linear combination fitting analysis? | For suspended marine particles from Subantarctic Surface Water (SASW) at sites TM5 and TM7, the expected major Zn host phase is Zn-Fe/Mn oxides. The reference spectra that should be included in the fitting basis are Zn-phosphoryl, Zn-silica, Zn-Fe/Mn oxides, Zn-hydroxide/clays, Zn-carboxylic/amino acids, and Zn-Al oxides. These specific phases are expected because the surface waters at these Southern Ocean sites are influenced by the Agulhas Current system. This current system is rich in lithogenic material, which introduces increased lithogenic particulate Zn concentrations (such as Zn-Fe/Mn oxides) to these locations, contrasting with typical biogenically-dominated surface waters. | Full points for identifying Zn-Fe/Mn oxides as a major phase and listing appropriate biological/lithogenic references (e.g., Zn-phosphoryl, Zn-silica, clays, other organics). |
| q2 | quantification | 54 | Estimate the phase fractions of Zn in this suspended marine particle sample from the Subantarctic Surface Water (sites TM5/TM7). | In this suspended marine particle sample from SASW at sites TM5 and TM7, the estimated phase fractions are 52% Zn-Fe/Mn oxides and 48% other phases, with an uncertainty of 9%. These specific values result directly from the influence of the Agulhas Current system on these Southern Ocean locations. Because this current system is highly rich in lithogenic material, it significantly increases the lithogenic particulate Zn concentrations in the water mass. Consequently, this produces a dominant 52% Zn-Fe/Mn oxide signature, which strongly contrasts with the typical biogenically-dominated composition of standard surface waters. | Full points for estimating ~50-55% Zn-Fe/Mn oxides and the remainder as other/mixed phases. |
Review
#1154
marine particles
Zn K
▶
LLM Prompt
Sample Information
Material: marine particles
Sample Origin: Southern Ocean
Sample-Specific Conditions
- Water mass: AAIW
- Suspended marine particles from Antarctic Intermediate Water at sites TM5 and TM7
Measurement
We plan to measure the Zn K XANES spectrum of this sample.
Questions
Based on all the information above:
1. What candidate Zn phases or reference spectra should be considered when modeling the Zn speciation of suspended marine particles in the Southern Ocean?
2. Estimate the phase fractions of the major Zn species for suspended marine particles in Antarctic Intermediate Water at sites TM5 and TM7.
Ground Truth
Material: marine particles
Measurement: Zn K-edge XANES
Fit method: Custom method combining XRF elemental correlations and XANES spectral fitting
Phase fractions: (±8%)
| Phase | Fraction |
|---|---|
| Zn-Fe/Mn oxides | 0.53 |
| Other | 0.47 |
Fit basis (paper's reference spectra):
- Zn-phosphoryl
- Zn-carboxylic/amino acids
- Zn-silica
- Zn-Fe/Mn oxides
- Zn-Al oxides
- Zn hydroxide/clays
Source evidence: Page 36, text
Key reasoning: The strong signature of Zn-Fe/Mn oxides in intermediate waters at sites TM5 and TM7 is likely influenced by the Agulhas Current system. This current system is rich in lithogenic material, which results in increased lithogenic particulate Zn concentrations in these specific areas.
Reasoning source: Page 36, text
Scoring Rubric (total: 100 pts)
| Q | Type | Max | Question | Reference Answer | Scoring Criteria |
|---|---|---|---|---|---|
| q1 | identification | 50 | What candidate Zn phases or reference spectra should be considered when modeling the Zn speciation of suspended marine particles in the Southern Ocean? | When modeling the Zn speciation of these suspended marine particles, the candidate reference spectra should include Zn-phosphoryl, Zn-carboxylic/amino acids, Zn-silica, Zn-Fe/Mn oxides, Zn-Al oxides, and Zn hydroxide/clays. These specific phases are expected because the samples originate from Antarctic Intermediate Water (AAIW) at sites TM5 and TM7, which are influenced by the Agulhas Current system. This current system is rich in lithogenic material, introducing various mineral and oxide phases into the water column. Consequently, the basis set must account for both organic components and lithogenic particulate Zn forms, particularly Zn-Fe/Mn oxides, that are prevalent in these specific Southern Ocean areas. | Full credit for identifying a mix of biogenic (e.g., phosphoryl, silica, organic acids) and lithogenic (e.g., Fe/Mn oxides, Al oxides, clays) phases. |
| q2 | quantification | 50 | Estimate the phase fractions of the major Zn species for suspended marine particles in Antarctic Intermediate Water at sites TM5 and TM7. | For suspended marine particles in Antarctic Intermediate Water at sites TM5 and TM7, the major Zn species is Zn-Fe/Mn oxides at a fraction of 0.53, with other combined phases accounting for the remaining 0.47 (with an uncertainty of 8%). This specific distribution, dominated by a strong signature of Zn-Fe/Mn oxides, arises because these intermediate waters are likely influenced by the Agulhas Current system. The Agulhas Current is highly enriched in lithogenic material, which directly results in increased lithogenic particulate Zn concentrations at these specific sites. Therefore, the high proportion of Zn-Fe/Mn oxides reflects the significant lithogenic input into the marine particles in this region of the Southern Ocean. | Full credit for estimating approximately 53% Zn-Fe/Mn oxides and the remainder as other/mixed phases, within the reported 8% uncertainty. |
Review
#1155
marine particles
Zn K
▶
LLM Prompt
Sample Information
Material: marine particles
Sample Origin: Southern Ocean
Sample-Specific Conditions
- Water mass: UCDW
- Suspended marine particles from Upper Circumpolar Deep Water at site TM4
Measurement
We plan to measure the Zn K XANES spectrum of this sample.
Questions
Based on all the information above:
1. Based on the sample conditions (marine particles from Upper Circumpolar Deep Water at site TM4), what are the expected major Zn phases and their approximate fractions?
2. What reference spectra or basis functions would be necessary to model the Zn K-edge XANES spectrum of this sample using Linear Combination Fitting?
Ground Truth
Material: marine particles
Measurement: Zn K-edge XANES
Fit method: Linear Combination Fitting (LCF)
Phase fractions: (±16%)
| Phase | Fraction |
|---|---|
| Zn-carboxylic/amino acids | 0.85 |
| Other | 0.15 |
Fit basis (paper's reference spectra):
- Zn-carboxylic/amino acids
- Other (mixed phases)
Source evidence: Page 36, text
Key reasoning: Site TM4 is located within the Upper Circumpolar Deep Water and is less affected by the Agulhas Current, which typically brings lithogenic material. As a result, the particulate Zn at this site is predominantly assigned to Zn-organic complexes (Zn-carboxylic acids or Zn-amino acids), reflecting a lack of strong lithogenic influence.
Reasoning source: Page 36
Scoring Rubric (total: 100 pts)
| Q | Type | Max | Question | Reference Answer | Scoring Criteria |
|---|---|---|---|---|---|
| q1 | quantification | 67 | Based on the sample conditions (marine particles from Upper Circumpolar Deep Water at site TM4), what are the expected major Zn phases and their approximate fractions? | The expected major Zn phases for this sample are Zn-carboxylic/amino acids at approximately 85% (0.85) and other mixed phases at 15% (0.15), with an uncertainty of 16%. These specific fractions arise because the suspended marine particles originate from site TM4 within the Upper Circumpolar Deep Water (UCDW) in the Southern Ocean. This specific location is less affected by the Agulhas Current, which typically transports lithogenic material into the region. Due to this lack of strong lithogenic influence, the particulate Zn is predominantly bound in Zn-organic complexes rather than mineral phases, resulting in the high 85% fraction of Zn-carboxylic or Zn-amino acids. | Full points for identifying Zn-carboxylic/amino acids as the dominant phase (~85%) and 'Other' or mixed phases as the remainder (~15%). |
| q3 | identification | 33 | What reference spectra or basis functions would be necessary to model the Zn K-edge XANES spectrum of this sample using Linear Combination Fitting? | To model the Zn K-edge XANES spectrum of this sample using Linear Combination Fitting, the necessary basis functions are Zn-carboxylic/amino acids and a component for 'Other' mixed phases. These specific reference spectra are required because the sample consists of suspended marine particles from site TM4 in the Upper Circumpolar Deep Water of the Southern Ocean. At this location, the water mass is less affected by the Agulhas Current, meaning there is a lack of strong lithogenic influence that would otherwise introduce mineral phases. Consequently, the particulate Zn is predominantly present as Zn-organic complexes, making Zn-carboxylic acids or Zn-amino acids the primary reference spectra needed to accurately fit the data. | Full points for listing Zn-carboxylic/amino acids and a component representing 'Other' or mixed phases. |
Review
#1156
sediment
Zn K
▶
LLM Prompt
Sample Information
Material: sediment
Sample Origin: Southern Ocean
Sample-Specific Conditions
- Sample type: Sediment
- Surface sediment from ODP1090 and ODP1094 (fractions are midpoints of reported ranges)
Measurement
We plan to measure the Zn K XANES spectrum of this sample.
Questions
Based on all the information above:
1. What candidate reference spectra are needed to model the Zn speciation in Southern Ocean surface sediments using linear combination fitting?
2. Estimate the relative fractions of the major Zn host phases in these surface sediments.
Ground Truth
Material: sediment
Measurement: Zn K-edge XANES
Fit method: Linear combination fitting guided by XRF elemental correlations
Phase fractions: (±15%)
| Phase | Fraction |
|---|---|
| Zn hydroxide/clays | 0.435 |
| Zn-silica | 0.245 |
| Zn carbonates | 0.305 |
Fit basis (paper's reference spectra):
- Zn hydroxide/clays
- Zn-silica
- Zn carbonates
Source evidence: Page 51, text and Fig. 3
Key reasoning: The absence of a substantial biogenic organic Zn pool in sediments suggests that organically bound Zn is labile and is scavenged by minerals during vertical transport and early diagenesis. Kinetically slowly dissolving amorphous silica and clays scavenge Zn from decaying organic matter. Additionally, long-term interactions of calcium carbonate with Zn produce a stable Zn-carbonate pool in sediments located above the carbonate compensation depth.
Reasoning source: Pages 51-52, text discussing sediment composition and diagenesis
Scoring Rubric (total: 100 pts)
| Q | Type | Max | Question | Reference Answer | Scoring Criteria |
|---|---|---|---|---|---|
| q1 | identification | 46 | What candidate reference spectra are needed to model the Zn speciation in Southern Ocean surface sediments using linear combination fitting? | To model the Zn speciation in Southern Ocean surface sediments using linear combination fitting, the required candidate reference spectra are Zn hydroxide/clays, Zn-silica, and Zn carbonates. These specific phases are expected because organically bound Zn in these sediments is labile and is scavenged by minerals during vertical transport and early diagenesis. Specifically, kinetically slowly dissolving amorphous silica and clays scavenge Zn from decaying organic matter, leading to the formation of the Zn-silica and Zn hydroxide/clay phases. Additionally, long-term interactions of calcium carbonate with Zn produce a stable Zn-carbonate pool in these sediments located above the carbonate compensation depth. | Full points for identifying clays/hydroxides, silicates (or biogenic silica), and carbonates as the primary reference phases. |
| q2 | quantification | 54 | Estimate the relative fractions of the major Zn host phases in these surface sediments. | The estimated relative fractions of the major Zn host phases in these Southern Ocean surface sediments are 43.5% Zn hydroxide/clays, 30.5% Zn carbonates, and 24.5% Zn-silica, with an uncertainty of 15%. These values represent the midpoints of reported ranges for surface sediments from ODP1090 and ODP1094. The high combined fraction of Zn hydroxide/clays and Zn-silica results from the absence of a substantial biogenic organic Zn pool; instead, labile organically bound Zn is extensively scavenged by slowly dissolving amorphous silica and clays during early diagenesis. The 30.5% Zn carbonate fraction arises because these specific sediments are located above the carbonate compensation depth, allowing long-term interactions between calcium carbonate and Zn to form a stable pool. | Full points for estimating fractions within 15% of the ground truth: Zn hydroxide/clays (~43.5%), Zn-silica (~24.5%), and Zn carbonates (~30.5%). |
Review
In Situ Generated Dispersed Catalysts Based on Molybdenum and Tungsten Phosphides in Hydroprocessing of Guaiacol
ESRF-BM23
Catalyst
M. A. Golubeva et al.
DOI: 10.1134/s0965544122110019
1 scenario
▶
#1157
W-P-C
W L3
▶
LLM Prompt
Sample Information
Material: W-P-C
Reaction Conditions: Measured ex-situ as pelletized samples
Sample-Specific Conditions
- Catalyst state: After reaction
- Tungsten phosphide catalyst generated in situ from tungsten carbonyl and triphenylphosphine
Measurement
We plan to measure the W L3 XANES spectrum of this sample.
Questions
Based on all the information above:
1. What candidate reference phases or structural models are needed to fit the local structure of the tungsten catalyst generated in situ from tungsten carbonyl and triphenylphosphine?
2. Estimate the phase fractions of the components in this in situ generated catalyst.
3. Explain the physical reasoning for the formation of these phases and describe how their presence is reflected in the first coordination shell of the tungsten atoms.
Ground Truth
Material: W-P-C
Measurement: W L3-edge EXAFS, transmission mode, Structural Materials Science station (Kurchatov Synchrotron Radiation Source)
Fit method: Multi-phase EXAFS fitting
Phase fractions: (±9%)
| Phase | Fraction |
|---|---|
| WP (orthorhombic) | 0.54 |
| WC (hexagonal) | 0.46 |
Fit basis (paper's reference spectra):
- hexagonal stoichiometric WC
- orthorhombic WP
Source evidence: Page 3, right column and Page 4, left column; Fig. 4b
Key reasoning: The EXAFS spectrum of the in situ prepared catalyst lacks the carbonyl peak present in the precursor, indicating precursor decomposition. The remaining first-shell peak is attributed to carbide W-C bonds, while a shoulder at about 2 Å corresponds to W-P interactions. Fitting the experimental spectrum with hexagonal WC and orthorhombic WP phases confirmed this mixture.
Reasoning source: RESULTS AND DISCUSSION, Pages 3-4
Scoring Rubric (total: 100 pts)
| Q | Type | Max | Question | Reference Answer | Scoring Criteria |
|---|---|---|---|---|---|
| q1 | identification | 30 | What candidate reference phases or structural models are needed to fit the local structure of the tungsten catalyst generated in situ from tungsten carbonyl and triphenylphosphine? | The required reference phases to fit the local structure of the catalyst are hexagonal stoichiometric WC and orthorhombic WP. These specific phases are expected because the catalyst is generated in situ from tungsten carbonyl and triphenylphosphine precursors, which decompose during the reaction to provide the necessary carbon and phosphorus. Spectroscopically, the decomposition of these precursors is confirmed by the absence of the initial carbonyl peak, leaving a structure characterized by W-C bonds and W-P interactions that are best modeled by this mixture of carbide and phosphide phases. | Full credit for identifying both hexagonal WC (tungsten carbide) and orthorhombic WP (tungsten phosphide). Partial credit for identifying only one or generic carbide/phosphide phases. |
| q2 | quantification | 30 | Estimate the phase fractions of the components in this in situ generated catalyst. | The estimated phase fractions for the in situ generated catalyst are 54% orthorhombic WP and 46% hexagonal stoichiometric WC, with an uncertainty of 9%. These specific values result from the reaction conditions where tungsten carbonyl and triphenylphosphine precursors decompose, yielding a mixed-phase W-P-C material rather than a single pure phase. The nearly equal distribution between the phosphide and carbide fractions reflects the simultaneous availability of phosphorus and carbon following the breakdown of the precursors, which is quantitatively confirmed by multi-phase EXAFS fitting of the W-C and W-P scattering paths. | Full credit for estimating approximately 54% WP and 46% WC. Partial credit for estimating a roughly equal mixture of phosphide and carbide phases. |
| q3 | reasoning | 40 | Explain the physical reasoning for the formation of these phases and describe how their presence is reflected in the first coordination shell of the tungsten atoms. | The formation of hexagonal WC and orthorhombic WP phases is driven by the decomposition of the tungsten carbonyl and triphenylphosphine precursors during the in situ generation of the catalyst. As the precursors break down, the characteristic carbonyl peak disappears from the spectrum, allowing the tungsten to bond with the newly available carbon and phosphorus. This structural evolution is directly reflected in the first coordination shell of the tungsten atoms, where the main remaining peak is attributed to carbide W-C bonds. Furthermore, the formation of the phosphide phase is evidenced by a distinct shoulder at approximately 2 Å, which corresponds to W-P interactions. | Full credit for explaining that the carbonyl precursor decomposes (loss of carbonyl peak) to form carbide (W-C bonds) and reacts with triphenylphosphine to form phosphide (W-P bonds), which appear as a main first-shell peak and a shoulder at ~2 Å, respectively. |
Review
Spatiotemporal Visualization and Chemical Identification of the Metal Diffusion Layer at the Electrochemical Interface
APS
Electrochemistry
Yuxin Zhang et al.
DOI: 10.1149/1945-7111/ac964b
2 scenarios
▶
#1158
WO3
W L3
▶
LLM Prompt
Sample Information
Material: WO3
Electrode Type: working electrode
Electrolyte: 0.5 M H2SO4
Cell Type: in-situ cell
Charge Discharge: charged
Voltage V: -0.1 V vs Ag/AgCl
Sample-Specific Conditions
- distance from interface: 0 um
- Solid WO3 electrode at the interface
Measurement
We plan to measure the W L3 XANES spectrum of this sample.
Questions
Based on all the information above:
1. Based on the sample conditions (WO3 electrode at the interface, D0 position), what is the expected oxidation state and local coordination symmetry of W, and why?
2. Describe the expected spectral shape of the W L3-edge XANES for this sample, specifically focusing on the white line (WL). What electronic transition gives rise to this feature?
3. What spectral feature distinguishes the local symmetry of this solid WO3 sample at the interface from ideal octahedral (Oh) symmetry and from the dissolved W species further into the diffusion layer?
Ground Truth
Material: WO3
Measurement: W L3-edge in situ mu-XANES, fluorescence mode, Advanced Photon Source Beamline 2-ID-D
Fit method: not reported
Phase fractions:
| Phase | Fraction |
|---|---|
| solid WO3 (W6+) | 1.0 |
Fit basis (paper's reference spectra):
- bulk WO3 electrode
Source evidence: Figure 4e, page 2 and 3
Key reasoning: The W L3-edge mu-XANES spectrum collected at the D0 position is identical to the signal from the WO3 bulk electrode without electrolyte. The peak position of the white line (WL) indicates a constant W6+ oxidation state. The WL has only one peak without splitting, which indicates distorted octahedral structures. The spectrum at D0 has a sharp WL peak compared to the broader peak of dissolved species.
Reasoning source: Page 2 and 3, text discussing Figure 4e
Scoring Rubric (total: 100 pts)
| Q | Type | Max | Question | Reference Answer | Scoring Criteria |
|---|---|---|---|---|---|
| q1 | reasoning | 35 | Based on the sample conditions (WO3 electrode at the interface, D0 position), what is the expected oxidation state and local coordination symmetry of W, and why? | The expected oxidation state of W is W6+ and the local coordination symmetry is a distorted octahedral structure. Because the measurement is taken exactly at the solid WO3 electrode interface (0 um distance) in 0.5 M H2SO4, the material remains entirely as solid WO3 (fraction 1.0) and is identical to the bulk electrode without electrolyte. The constant W6+ oxidation state is maintained under these specific charged conditions (-0.1 V vs Ag/AgCl). Furthermore, the distorted octahedral symmetry arises because the solid WO3 lattice at this interface produces a single white line peak without the splitting that would be expected from an ideal octahedral geometry. | Award full points if the answer correctly identifies W6+ and distorted octahedral symmetry, reasoning that the solid WO3 at the interface retains its bulk properties. |
| q2 | spectral | 35 | Describe the expected spectral shape of the W L3-edge XANES for this sample, specifically focusing on the white line (WL). What electronic transition gives rise to this feature? | The expected spectral shape features a prominent resonance with a sharp white line (WL) peak at approximately 10.215 keV and no splitting feature. This strong absorption peak originates from the electron excitation from the W 2p3/2 core level to the W 5d unoccupied states. Because the sample is measured directly at the solid WO3 electrode interface (0 um) under a -0.1 V applied potential, the spectrum perfectly matches the bulk WO3 electrode. The sharp, unsplit nature of this WL peak directly reflects the constant W6+ oxidation state and the distorted octahedral structure of the solid WO3 phase present at this specific interfacial condition. | Award full points if the answer mentions a prominent, sharp white line (WL) peak without splitting, and identifies the transition as W 2p3/2 to W 5d unoccupied states. |
| q3 | identification | 30 | What spectral feature distinguishes the local symmetry of this solid WO3 sample at the interface from ideal octahedral (Oh) symmetry and from the dissolved W species further into the diffusion layer? | The distinguishing spectral feature of this sample is a sharp white line (WL) peak that exhibits no splitting. Because the sample is located exactly at the solid WO3 electrode interface (0 um) in the 0.5 M H2SO4 electrolyte, it consists entirely of solid WO3 rather than dissolved species. This solid phase produces a sharp WL peak, which distinguishes it from the broader WL peak observed for dissolved W species further into the diffusion layer. Additionally, the lack of peak splitting indicates a distorted octahedral structure, distinguishing it from ideal octahedral (Oh) or dihedral (D2) symmetries, which would both exhibit distinct splitting features under these conditions. | Award full points if the answer notes that the lack of WL splitting distinguishes it from ideal octahedral symmetry, and the sharpness of the WL peak distinguishes it from the broader peak of dissolved W species. |
Review
#1159
WO3
W L3
▶
LLM Prompt
Sample Information
Material: WO3
Electrode Type: working electrode
Electrolyte: 0.5 M H2SO4
Cell Type: in-situ cell
Charge Discharge: charged
Voltage V: -0.1 V vs Ag/AgCl
Sample-Specific Conditions
- distance from interface: 5 um
- Dissolved W species in the diffusion layer at 5 um from interface
Measurement
We plan to measure the W L3 XANES spectrum of this sample.
Questions
Based on all the information above:
1. What specific electronic transition gives rise to the prominent white line (WL) in the W L3-edge XANES spectrum for this sample?
2. Based on the sample conditions (dissolved W species in the diffusion layer), what oxidation state is expected, and what spectral feature confirms that it remains unchanged from the solid electrode?
3. How does the local symmetry of the dissolved W species manifest in the shape of the white line, and what specific geometry does this indicate?
4. How does the white line of the dissolved W species at this position (5 um from the interface) differ from that of the solid WO3 electrode exactly at the interface, and what does this difference imply about the local environment?
Ground Truth
Material: WO3 (dissolved W species in electrolyte)
Measurement: W L3-edge in situ micro-XANES in fluorescence mode at Advanced Photon Source Beamline 2-ID-D
Fit method: not reported (direct spectral comparison)
Phase fractions:
| Phase | Fraction |
|---|---|
| W6+ (dissolved) | 1.0 |
Fit basis (paper's reference spectra):
- not reported
Source evidence: Figure 4e and text on page 2-3
Key reasoning: The peak position of the white line (WL) remains constant from the solid interface (D0) through the diffusion layer (D5 to D20), indicating a constant W6+ oxidation state. The absence of WL splitting denotes that the local W units are neither dihedral (D2) nor ideal octahedral (Oh) symmetry, but rather distorted octahedral structures. The broadening of the WL peak compared to the solid electrode (D0) indicates a higher degree of distortion in the dissolved W species.
Reasoning source: Page 2, right column to Page 3, left column
Scoring Rubric (total: 100 pts)
| Q | Type | Max | Question | Reference Answer | Scoring Criteria |
|---|---|---|---|---|---|
| q1 | spectral | 20 | What specific electronic transition gives rise to the prominent white line (WL) in the W L3-edge XANES spectrum for this sample? | The prominent white line (WL) at approximately 10.215 keV originates from the electron excitation from the W 2p3/2 core level to the unoccupied W 5d states. In this in-situ cell, the sample consists of dissolved W species in the 0.5 M H2SO4 electrolyte at 5 um from the WO3 working electrode interface. Because the dissolved species maintain a W6+ oxidation state with available unoccupied 5d states, this dipole-allowed transition manifests as a strong resonance peak. The specific local environment of these dissolved ions in the diffusion layer dictates the exact shape and intensity of this transition. | Full credit for identifying the transition as electron excitation from W 2p3/2 to W 5d unoccupied states. |
| q2 | reasoning | 30 | Based on the sample conditions (dissolved W species in the diffusion layer), what oxidation state is expected, and what spectral feature confirms that it remains unchanged from the solid electrode? | The expected oxidation state for the dissolved W species in the diffusion layer is W6+ (fraction 1.0). This is confirmed by the peak position of the white line (WL), which remains constant from the solid WO3 interface (D0) through the diffusion layer at 5 um. Under the applied potential of -0.1 V vs Ag/AgCl in 0.5 M H2SO4, the WO3 working electrode dissolves into the electrolyte. The constant WL energy position demonstrates that this dissolution mechanism does not involve a change in the oxidation state, resulting in purely dissolved W6+ species in the electrolyte. | Full credit for stating the oxidation state is W6+ and that this is confirmed by the constant peak position of the white line (WL) throughout the diffusion layer. |
| q3 | spectral | 30 | How does the local symmetry of the dissolved W species manifest in the shape of the white line, and what specific geometry does this indicate? | The local symmetry of the dissolved W species manifests as a prominent white line (WL) that lacks any splitting. This absence of WL splitting indicates that the local W units possess a distorted octahedral structure, rather than a dihedral (D2) or ideal octahedral (Oh) symmetry. In the sample conditions, the WO3 electrode is held at -0.1 V vs Ag/AgCl in 0.5 M H2SO4, causing W6+ species to dissolve into the diffusion layer 5 um from the interface. As these species dissolve and interact with the aqueous acidic electrolyte, their coordination environment relaxes into a distorted octahedral geometry, which alters the splitting of the unoccupied W 5d states and prevents the distinct peak splitting typically seen in highly symmetric environments. | Full credit for noting the absence of a splitting feature in the white line, which indicates that the local W units are neither dihedral nor ideal octahedral, but rather possess a distorted octahedral symmetry. |
| q4 | reasoning | 20 | How does the white line of the dissolved W species at this position (5 um from the interface) differ from that of the solid WO3 electrode exactly at the interface, and what does this difference imply about the local environment? | The white line (WL) of the dissolved W species at 5 um from the interface is broader than the WL of the solid WO3 electrode at the interface (D0). This broadening implies that the dissolved W species possess a higher degree of structural distortion compared to the solid electrode. Under the in-situ conditions (-0.1 V vs Ag/AgCl in 0.5 M H2SO4), the WO3 material dissolves into the electrolyte, transitioning from a constrained solid lattice to a solvated state in the diffusion layer. This solvation process in the acidic electrolyte leads to a more disordered, highly distorted octahedral coordination environment around the W6+ ions, which manifests spectrally as a broadened WL peak. | Full credit for stating that the dissolved species exhibits a broader white line peak compared to the sharp peak of the solid electrode, implying a higher degree of distortion in the local environment of the dissolved W species. |
Review
Temporal and spatial resolution of magnetosome degradation at the subcellular level in a 3D lung carcinoma model
ESRF-BM23
Synthesis
Alicia G. Gubieda et al.
DOI: 10.1186/s12951-024-02788-8
8 scenarios
▶
#1160
magnetosomes in A549 spheroids
Fe K-edge
▶
LLM Prompt
Sample Information
Material: magnetosomes in A549 spheroids
Method: in vitro cell culture
Precursors: magnetosomes
Temperature C: 37
Duration Hours: 2
Atmosphere: 95% relative humidity, 5% CO2
Sample-Specific Conditions
- degradation time: 2 h
- A549 spheroids incubated with magnetosomes for 2 h
Preparation
- A549 cells incubated with magnetosomes (30 µg/mL magnetite) for 2 h, then collected and seeded for spheroid formation.
Measurement
We plan to measure the Fe K-edge XANES spectrum of this sample.
Questions
Based on all the information above:
1. What candidate reference spectra should be included in a linear combination fit to accurately model the Fe K-edge XANES spectrum of this sample?
2. Based on the sample conditions (2 hours post-internalization in A549 spheroids), estimate the relative fractions of the iron phases present.
3. Explain the physical reasoning behind the expected phase composition at this early 2-hour time point.
Ground Truth
Material: magnetosomes in A549 spheroids
Measurement: Fe K-edge XANES, fluorescence mode at 10 K, BM23 Beamline of the ESRF synchrotron
Fit method: Linear combination fit (LCF)
Phase fractions: (±10%)
| Phase | Fraction |
|---|---|
| magnetite | 0.82 |
| maghemite | 0.18 |
Fit basis (paper's reference spectra):
- magnetite
- maghemite
- horse spleen ferritin (ferrihydrite)
Source evidence: Figure 3E, page 6
Key reasoning: At the 2 h time point, the magnetosomes have just been internalized by the cells. The XANES spectra show the best fit predominantly with magnetite, which is expected for freshly internalized magnetosomes before significant degradation occurs. The minor fraction of maghemite indicates the very beginning of the oxidation process.
Reasoning source: Results and discussion, Macroscopic analysis of magnetosome degradation products with XANES and magnetometry, page 7; Spatially resolved magnetosome degradation at nanometer scale by nano-XRF and nano-XANES, page 8
Scoring Rubric (total: 100 pts)
| Q | Type | Max | Question | Reference Answer | Scoring Criteria |
|---|---|---|---|---|---|
| q1 | identification | 30 | What candidate reference spectra should be included in a linear combination fit to accurately model the Fe K-edge XANES spectrum of this sample? | The candidate reference spectra for the linear combination fit should include magnetite, maghemite, and horse spleen ferritin (ferrihydrite). These specific phases are expected because the sample consists of A549 spheroids incubated with magnetite-based magnetosomes for a short duration of 2 hours at 37 °C. At this early time point, the magnetosomes have just been internalized by the cells, meaning the primary precursor phase (magnetite) should still dominate the spectrum. The inclusion of maghemite and ferrihydrite is necessary to account for the very beginning of the oxidation and degradation processes that occur once the magnetosomes are exposed to the intracellular environment. | Full credit for identifying magnetite, maghemite, and ferritin (or ferrihydrite) as the necessary reference spectra for modeling the degradation process. |
| q2 | quantification | 35 | Based on the sample conditions (2 hours post-internalization in A549 spheroids), estimate the relative fractions of the iron phases present. | The estimated relative fractions of the iron phases are 0.82 (82%) magnetite and 0.18 (18%) maghemite, with an uncertainty of 10%. These specific values result directly from the short 2-hour incubation time of the magnetosomes within the A549 spheroids at 37 °C. Because the magnetosomes have only just been internalized by the cells, significant degradation has not yet occurred, leaving the original magnetite precursor as the predominant phase. The minor 18% fraction of maghemite indicates that the oxidation process of the magnetosomes has only just begun in the cellular environment. | Full credit for estimating magnetite as the dominant phase (approx. 80-85%) and maghemite as a minor phase (approx. 15-20%). |
| q3 | reasoning | 35 | Explain the physical reasoning behind the expected phase composition at this early 2-hour time point. | The expected phase composition is driven by the short 2-hour incubation duration of the magnetite-based magnetosomes in the A549 cells at 37 °C. At this early time point, the magnetosomes have just been internalized by the cells and have not yet been exposed to the intracellular environment long enough for significant degradation to occur. Consequently, the original precursor material remains largely intact, resulting in a predominantly magnetite composition (82%). However, the cellular environment does initiate the very beginning of the oxidation process, which mechanistically converts a small portion of the magnetite into maghemite (18%). | Full credit for explaining that at 2 hours, the magnetosomes have just been internalized by the cells and remain mostly intact as magnetite, with only minor initial oxidation to maghemite having occurred. |
Review
#1161
magnetosomes in A549 spheroids
Fe K-edge
▶
LLM Prompt
Sample Information
Material: magnetosomes in A549 spheroids
Method: in vitro cell culture
Precursors: magnetosomes
Temperature C: 37
Duration Hours: 72
Atmosphere: 95% relative humidity, 5% CO2
Sample-Specific Conditions
- degradation time: 3 days
- A549 spheroids incubated with magnetosomes for 3 days
Preparation
- A549 cells incubated with magnetosomes (30 µg/mL magnetite) for 2 h, then collected and seeded for spheroid formation.
Measurement
We plan to measure the Fe K-edge XANES spectrum of this sample.
Questions
Based on all the information above:
1. What candidate reference spectra should be included in a linear combination fitting (LCF) analysis to model the iron speciation in this biological sample?
2. Based on the 3-day degradation period in the 3D tumor spheroid model, estimate the phase fractions of the iron species present.
3. Explain the biological and chemical reasoning for the expected phase composition at this 3-day time point. Why are these specific phases present in these proportions?
Ground Truth
Material: magnetosomes in A549 spheroids
Measurement: Fe K-edge XANES in fluorescence mode at BM23 Beamline of the ESRF
Fit method: Linear combination fit
Phase fractions: (±10%)
| Phase | Fraction |
|---|---|
| magnetite | 0.8 |
| maghemite | 0.2 |
Fit basis (paper's reference spectra):
- magnetite
- maghemite
- horse spleen ferritin (ferrihydrite)
Source evidence: Figure 3E, page 6
Key reasoning: Upon internalization by the A549 cells, the magnetite core of the magnetosomes undergoes a slow oxidation process into maghemite. The main degradation changes occur during the first 10 days after internalization. At the 3-day time point, the oxidation is still in its early stages, resulting in a composition that is predominantly the original magnetite, with a growing fraction of maghemite. Ferrihydrite (ferritin) is not detected at a macroscopic level (contribution <10%) in the whole spheroid XANES at this stage.
Reasoning source: Page 7, 'Macroscopic analysis of magnetosome degradation products with XANES and magnetometry' section
Scoring Rubric (total: 100 pts)
| Q | Type | Max | Question | Reference Answer | Scoring Criteria |
|---|---|---|---|---|---|
| q1 | identification | 30 | What candidate reference spectra should be included in a linear combination fitting (LCF) analysis to model the iron speciation in this biological sample? | The candidate reference spectra for the linear combination fitting analysis should include magnetite, maghemite, and horse spleen ferritin (ferrihydrite). These specific phases are expected because the A549 spheroids were initially incubated with magnetite-based magnetosomes at 37 °C for 3 days. Upon internalization by the cells, the magnetite core undergoes a slow biological oxidation process into maghemite. Furthermore, ferrihydrite (ferritin) must be included as a reference to account for potential biological iron storage, even though it remains below the macroscopic detection limit (<10%) at this early 3-day degradation stage. | Full points for identifying magnetite, maghemite, and ferritin (or ferrihydrite) as the necessary reference standards. Partial credit if only magnetite and maghemite are mentioned. |
| q2 | quantification | 35 | Based on the 3-day degradation period in the 3D tumor spheroid model, estimate the phase fractions of the iron species present. | The estimated phase fractions for this sample are 0.8 (80%) magnetite and 0.2 (20%) maghemite, with an uncertainty of 10%. These specific values result from the relatively short 3-day (72-hour) incubation period of the magnetosomes within the A549 spheroids at 37 °C. Because the main degradation changes occur over the first 10 days after internalization, the 3-day time point represents only the early stages of the slow oxidation process. Consequently, the composition remains predominantly the original magnetite precursor, with a small but growing fraction having oxidized into maghemite, while ferrihydrite (ferritin) remains undetected. | Full points for estimating ~80% magnetite and ~20% maghemite. Deduct points proportionally for deviations >10% from these values or if other phases (like ferrihydrite) are assigned significant fractions (>10%). |
| q3 | reasoning | 35 | Explain the biological and chemical reasoning for the expected phase composition at this 3-day time point. Why are these specific phases present in these proportions? | The expected phase composition of 80% magnetite and 20% maghemite arises directly from the cellular processing of the internalized magnetosomes. When A549 cells are incubated with 30 µg/mL magnetite and cultured into spheroids at 37 °C for 72 hours, the internalized magnetite cores undergo a slow biological oxidation process. Because the primary degradation of these magnetosomes takes place over the first 10 days, the 3-day mark captures only the early stages of this chemical transformation. Therefore, the sample retains a large proportion of the original magnetite precursor alongside a newly formed, minor fraction of oxidized maghemite, without yet accumulating macroscopic levels of ferrihydrite (ferritin) iron storage proteins. | Full points for explaining that the internalized magnetosomes (magnetite) are undergoing a slow intracellular oxidation process into maghemite, and that at 3 days this process is still ongoing, leaving a majority of unoxidized magnetite. Mentioning the lack of macroscopic ferrihydrite accumulation at this stage is a plus. |
Review
#1162
magnetosomes in A549 spheroids
Fe K-edge
▶
LLM Prompt
Sample Information
Material: magnetosomes in A549 spheroids
Method: in vitro cell culture
Precursors: magnetosomes
Temperature C: 37
Duration Hours: 144
Atmosphere: 95% relative humidity, 5% CO2
Sample-Specific Conditions
- degradation time: 6 days
- A549 spheroids incubated with magnetosomes for 6 days
Preparation
- A549 cells incubated with magnetosomes (30 µg/mL magnetite) for 2 h, then collected and seeded for spheroid formation.
Measurement
We plan to measure the Fe K-edge XANES spectrum of this sample.
Questions
Based on all the information above:
1. What candidate reference spectra should be included in a linear combination fit to model the Fe K-edge XANES spectrum of this sample?
2. Estimate the phase fractions of the iron species present in the spheroids after 6 days of degradation.
3. Explain the biological and chemical reasoning for the observed phase composition at this specific time point (6 days of incubation).
Ground Truth
Material: magnetosomes in A549 spheroids
Measurement: Fe K-edge XANES in fluorescence mode at 10 K at BM23 Beamline of the ESRF synchrotron
Fit method: Linear combination fit
Phase fractions: (±10%)
| Phase | Fraction |
|---|---|
| magnetite | 0.78 |
| maghemite | 0.22 |
Fit basis (paper's reference spectra):
- magnetite
- maghemite
- horse spleen ferritin (ferrihydrite)
Source evidence: Figure 3E, page 6
Key reasoning: During the first 10 days after internalisation, the magnetite in the magnetosomes slowly oxidises into maghemite. At 6 days, the degradation is ongoing, resulting in a mixture of predominantly magnetite with a growing fraction of maghemite (around 22%). The lack of ferrihydrite in the fitting analysis of the spheroids suggests its contribution is less than 10% of the total Fe, despite the presence of small nanoparticles observed by TEM.
Reasoning source: Results and discussion, Macroscopic analysis of magnetosome degradation products with XANES and magnetometry, page 7
Scoring Rubric (total: 100 pts)
| Q | Type | Max | Question | Reference Answer | Scoring Criteria |
|---|---|---|---|---|---|
| q1 | identification | 30 | What candidate reference spectra should be included in a linear combination fit to model the Fe K-edge XANES spectrum of this sample? | The candidate reference spectra for the linear combination fit should include magnetite, maghemite, and horse spleen ferritin (ferrihydrite). These phases are expected because the A549 spheroids were initially incubated with magnetite-based magnetosomes and cultured at 37 °C in a 5% CO2 atmosphere. Under these in vitro conditions, the internalized magnetite undergoes a slow oxidation process into maghemite over the first 10 days. Ferrihydrite is also included as a reference to account for potential biological iron storage products that typically form during cellular degradation, even if its final contribution is minimal. | Full points for identifying magnetite, maghemite, and a ferrihydrite/ferritin standard. Partial points if only magnetite and maghemite are mentioned. |
| q2 | quantification | 35 | Estimate the phase fractions of the iron species present in the spheroids after 6 days of degradation. | The estimated phase fractions for the iron species are 0.78 (78%) magnetite and 0.22 (22%) maghemite, with an uncertainty of 10%. These specific values arise because the sample was cultured for exactly 144 hours (6 days) at 37 °C, which falls in the middle of the initial 10-day degradation window. At this time point, the biological degradation of the internalized magnetosomes is still ongoing, resulting in a mixture where the original magnetite is predominantly intact but a growing fraction has oxidized into maghemite. Ferrihydrite is not quantified in the final fractions because its contribution remains below 10% of the total iron under these specific in vitro conditions. | Full points for estimating ~75-80% magnetite and ~20-25% maghemite. Deduct points if ferrihydrite is estimated at >10% or if the magnetite/maghemite ratio is inverted. |
| q3 | reasoning | 35 | Explain the biological and chemical reasoning for the observed phase composition at this specific time point (6 days of incubation). | The observed phase composition is the result of the slow chemical oxidation of the internalized magnetosomes within the biological environment of the A549 spheroids. Following the initial incubation with 30 µg/mL magnetite, the cells were cultured at 37 °C with 95% relative humidity and 5% CO2, conditions which trigger the gradual oxidation of magnetite into maghemite over a 10-day period. Because this sample was halted at exactly 6 days (144 hours), the degradation mechanism is only partially complete, yielding a composition of 78% magnetite and 22% maghemite. Additionally, while the cellular degradation of iron nanoparticles typically leads to ferrihydrite formation, the lack of ferrihydrite in the fit indicates that biological iron storage is still less than 10% of the total iron at this specific time point. | Full points for explaining that magnetite from the magnetosomes is undergoing slow, progressive oxidation into maghemite during the first 10 days after internalisation, and that ferrihydrite (from ferritin) remains below the detection limit of the bulk XANES measurement (<10%). |
Review
#1163
magnetosomes in A549 spheroids
Fe K-edge
▶
LLM Prompt
Sample Information
Material: magnetosomes in A549 spheroids
Method: in vitro cell culture
Precursors: magnetosomes
Temperature C: 37
Duration Hours: 240
Atmosphere: 95% relative humidity, 5% CO2
Sample-Specific Conditions
- degradation time: 10 days
- A549 spheroids incubated with magnetosomes for 10 days
Preparation
- A549 cells incubated with magnetosomes (30 µg/mL magnetite) for 2 h, then collected and seeded for spheroid formation.
Measurement
We plan to measure the Fe K-edge XANES spectrum of this sample.
Questions
Based on all the information above:
1. Based on the sample conditions (magnetosomes in A549 spheroids after 10 days of degradation), what candidate reference spectra should be included in a linear combination fit of the Fe K-edge XANES data?
2. Estimate the phase fractions of the iron species present in the spheroids after 10 days of degradation.
3. Explain the biological and chemical reasoning for the observed phase composition at the 10-day time point, specifically regarding the transformation of the initial precursor and the absence of other expected iron storage phases.
Ground Truth
Material: magnetosomes in A549 spheroids
Measurement: Fe K-edge XANES in fluorescence mode at 10 K at BM23 Beamline of the ESRF synchrotron
Fit method: Linear combination fit
Phase fractions: (±10%)
| Phase | Fraction |
|---|---|
| magnetite | 0.68 |
| maghemite | 0.32 |
Fit basis (paper's reference spectra):
- magnetite
- maghemite
- horse spleen ferritin (with a ferrihydrite core)
Source evidence: Figure 3E, page 6
Key reasoning: During the first 10 days after internalisation, the magnetite in the magnetosomes slowly oxidises into maghemite, which takes up to 36% of the iron in the cell. At 10 days, the degradation reaches a plateau, and the ratio of magnetite to maghemite remains relatively constant thereafter. The lack of ferrihydrite in the fitting analysis suggests that its contribution to the total iron is less than 10%, despite the presence of small nanoparticles presumed to be ferritin.
Reasoning source: Page 7, 'Macroscopic analysis of magnetosome degradation products with XANES and magnetometry' section
Scoring Rubric (total: 100 pts)
| Q | Type | Max | Question | Reference Answer | Scoring Criteria |
|---|---|---|---|---|---|
| q1 | identification | 30 | Based on the sample conditions (magnetosomes in A549 spheroids after 10 days of degradation), what candidate reference spectra should be included in a linear combination fit of the Fe K-edge XANES data? | The candidate reference spectra for the linear combination fit should include magnetite, maghemite, and horse spleen ferritin (with a ferrihydrite core). These specific phases are expected because the A549 spheroids were initially incubated with magnetite-based magnetosomes and cultured at 37 °C for 10 days (240 hours). During this 10-day in vitro period, the internalised magnetite precursor slowly oxidises into maghemite as part of the degradation process. Furthermore, ferritin (ferrihydrite) must be included as a candidate reference to account for potential biological iron storage resulting from the cellular processing of the degraded magnetosomes. | Full points for identifying magnetite, maghemite, and ferritin/ferrihydrite as the necessary reference spectra. |
| q2 | quantification | 30 | Estimate the phase fractions of the iron species present in the spheroids after 10 days of degradation. | After 10 days of degradation, the iron species in the spheroids are estimated to be 68% magnetite and 32% maghemite, with a fitting uncertainty of 10%. These specific values result from the slow oxidation of the initial magnetite precursor within the A549 cells during the 240-hour incubation at 37 °C. By this 10-day time point, the degradation process reaches a plateau where maghemite accounts for roughly a third of the cellular iron, and the magnetite-to-maghemite ratio remains relatively constant thereafter. Ferrihydrite is not quantified in the final fractions because its contribution to the total iron is less than 10%, falling below the threshold for the fitting analysis. | Full points for estimating ~68% magnetite and ~32% maghemite (allow +/- 10% margin). |
| q3 | reasoning | 40 | Explain the biological and chemical reasoning for the observed phase composition at the 10-day time point, specifically regarding the transformation of the initial precursor and the absence of other expected iron storage phases. | The observed phase composition arises from the slow chemical oxidation of the internalised magnetosomes within the A549 spheroids over the 240-hour incubation at 37 °C. During the first 10 days after internalisation, the initial magnetite precursor degrades and oxidises into maghemite until the degradation reaches a plateau, stabilizing the magnetite-to-maghemite ratio. Although biological iron storage phases are expected to form as the cells process the degraded iron, ferrihydrite is absent from the final fitting results. This absence suggests that while small nanoparticles presumed to be ferritin are present, their total contribution to the cellular iron remains below the 10% detection limit of the XANES linear combination fit. | Full points for explaining that magnetite slowly oxidizes to maghemite over the first 10 days, reaching a plateau, and noting that ferrihydrite (ferritin) remains below the 10% detection limit despite being a typical iron storage phase. |
Review
#1164
magnetosomes in A549 spheroids
Fe K-edge
▶
LLM Prompt
Sample Information
Material: magnetosomes in A549 spheroids
Method: in vitro cell culture
Precursors: magnetosomes
Temperature C: 37
Duration Hours: 360
Atmosphere: 95% relative humidity, 5% CO2
Sample-Specific Conditions
- degradation time: 15 days
- A549 spheroids incubated with magnetosomes for 15 days
Preparation
- A549 cells incubated with magnetosomes (30 µg/mL magnetite) for 2 h, then collected and seeded for spheroid formation.
Measurement
We plan to measure the Fe K-edge XANES spectrum of this sample.
Questions
Based on all the information above:
1. What candidate reference spectra should be included to perform a linear combination fit of the Fe K-edge XANES spectrum for this sample?
2. Based on the degradation time of 15 days in the 3D spheroid model, estimate the phase fractions of the iron species present.
Ground Truth
Material: magnetosomes in A549 spheroids
Measurement: Fe K-edge XANES in fluorescence mode at BM23 Beamline of the ESRF synchrotron
Fit method: Linear combination fit
Phase fractions: (±10%)
| Phase | Fraction |
|---|---|
| magnetite | 0.64 |
| maghemite | 0.36 |
Fit basis (paper's reference spectra):
- magnetite
- maghemite
- horse spleen ferritin (ferrihydrite)
Source evidence: Figure 3D and 3E, page 6-7
Key reasoning: During the first 10 days after internalisation, the magnetite in the magnetosomes slowly oxidises into maghemite, reaching a plateau where maghemite accounts for approximately 36% of the iron. After this point, the degradation halts, likely due to the cell-cycle arrest characteristic of the interior of 3D tumour models, keeping the magnetite/maghemite ratio constant. Although small ferrihydrite/magnetite nanoparticles synthesized by ferritin are observed locally by TEM and nano-XRF, their overall contribution to the bulk XANES spectrum remains below the ~10% detection limit.
Reasoning source: Page 3 (Microscopy analysis) and Page 7 (Macroscopic analysis of magnetosome degradation products with XANES and magnetometry)
Scoring Rubric (total: 100 pts)
| Q | Type | Max | Question | Reference Answer | Scoring Criteria |
|---|---|---|---|---|---|
| q1 | identification | 33 | What candidate reference spectra should be included to perform a linear combination fit of the Fe K-edge XANES spectrum for this sample? | The candidate reference spectra for the linear combination fit of this sample should include magnetite, maghemite, and horse spleen ferritin (ferrihydrite). These phases are expected because the initial precursor consists of magnetite magnetosomes incubated within A549 spheroids at 37 °C. Over the 15-day incubation period, the magnetite undergoes slow oxidation into maghemite within the cellular environment. Furthermore, ferritin (ferrihydrite) is included as a reference because the cells locally synthesize small ferrihydrite/magnetite nanoparticles in response to the internalized iron, even if its bulk contribution ultimately remains below the ~10% detection limit. | Full points for identifying magnetite, maghemite, and a ferrihydrite/ferritin standard. Partial points if only magnetite and maghemite are mentioned. |
| q2 | quantification | 67 | Based on the degradation time of 15 days in the 3D spheroid model, estimate the phase fractions of the iron species present. | The estimated phase fractions for the iron species in this sample are 0.64 (64%) magnetite and 0.36 (36%) maghemite, with an uncertainty of approximately 10%. These specific values result from the 15-day (360-hour) incubation of the magnetosomes within the 3D A549 spheroid model at 37 °C. During the first 10 days after internalization, the initial magnetite slowly oxidizes into maghemite until it reaches a plateau where maghemite accounts for 36% of the iron. After this point, degradation halts due to the cell-cycle arrest characteristic of the interior of 3D tumor models, keeping the magnetite/maghemite ratio constant through day 15 while any newly synthesized ferrihydrite remains below the bulk XANES detection limit. | Full points for estimating ~64% magnetite and ~36% maghemite. Deduct points proportionally for deviations greater than the 10% uncertainty margin. |
Review
#1165
magnetosomes in A549 spheroids
Fe K-edge
▶
LLM Prompt
Sample Information
Material: magnetosomes in A549 spheroids
Method: in vitro cell culture
Precursors: magnetosomes
Temperature C: 37
Duration Hours: 720
Atmosphere: 95% relative humidity, 5% CO2
Sample-Specific Conditions
- degradation time: 30 days
- A549 spheroids incubated with magnetosomes for 30 days
Preparation
- A549 cells incubated with magnetosomes (30 µg/mL magnetite) for 2 h, then collected and seeded for spheroid formation.
Measurement
We plan to measure the Fe K-edge XANES spectrum of this sample.
Questions
Based on all the information above:
1. What candidate reference spectra should be included in the basis set for linear combination fitting of the Fe K-edge XANES spectrum of this sample?
2. Based on the 30-day degradation period in the 3D A549 spheroid model, estimate the expected phase fractions of the iron species present in the sample.
Ground Truth
Material: magnetosomes in A549 spheroids
Measurement: Fe K-edge XANES in fluorescence mode at BM23 Beamline of the ESRF synchrotron
Fit method: Linear combination fit
Phase fractions: (±10%)
| Phase | Fraction |
|---|---|
| magnetite | 0.66 |
| maghemite | 0.34 |
Fit basis (paper's reference spectra):
- magnetite
- maghemite
- horse spleen ferritin (ferrihydrite)
Source evidence: Figure 3E, page 6
Key reasoning: During the first 10 days after internalisation, the magnetite in the magnetosomes slowly oxidises into maghemite, with maghemite taking up to 36% of the iron of the cell. After this point, degradation reaches a plateau, and the ratio of magnetite and maghemite stays the same for the rest of the analysed period (up to 36 days). The degradation rate likely decreases due to the lower cell activity found in 3D tumour models. The lack of ferrihydrite in the fitting analysis of the entire spheroids suggests that the contribution of other iron species, such as ferrihydrite (from ferritin), to the XANES spectra is less than 10% of the total Fe.
Reasoning source: Results and discussion, Macroscopic analysis of magnetosome degradation products with XANES and magnetometry, pages 6-7
Scoring Rubric (total: 100 pts)
| Q | Type | Max | Question | Reference Answer | Scoring Criteria |
|---|---|---|---|---|---|
| q1 | identification | 50 | What candidate reference spectra should be included in the basis set for linear combination fitting of the Fe K-edge XANES spectrum of this sample? | The basis set for linear combination fitting should include magnetite, maghemite, and horse spleen ferritin (ferrihydrite). These specific reference phases are expected because the initial precursor material consists of magnetite magnetosomes incubated with A549 cells at 37 °C. Over the 30-day (720-hour) in vitro culture period, the internalized magnetite undergoes slow oxidation into maghemite within the cellular environment. Furthermore, horse spleen ferritin (ferrihydrite) must be included as a candidate to account for physiological iron storage, although its actual contribution to the spectra in these entire spheroids is ultimately less than 10% of the total iron. | Full points for identifying magnetite, maghemite, and a ferrihydrite/ferritin standard. Partial points if only magnetite and maghemite are mentioned. |
| q2 | quantification | 50 | Based on the 30-day degradation period in the 3D A549 spheroid model, estimate the expected phase fractions of the iron species present in the sample. | The expected phase fractions for this sample are 0.66 (66%) magnetite and 0.34 (34%) maghemite, with an uncertainty of 10%. These specific values arise from the degradation kinetics of the magnetosomes within the 3D A549 spheroid model cultured at 37 °C. During the first 10 days after internalization, the initial magnetite slowly oxidizes until maghemite accounts for roughly 36% of the cellular iron. Because the lower cell activity in 3D tumor models causes the degradation rate to plateau after 10 days, this specific magnetite-to-maghemite ratio remains stable through the 30-day (720-hour) measurement period. Ferrihydrite is excluded from the final fractions because its contribution remains below 10% of the total iron. | Full points for estimating ~66% magnetite and ~34% maghemite (allow ±10% margin). Deduct points if ferrihydrite is estimated at >10%. |
Review
#1166
magnetosomes in A549 spheroids
Fe K-edge
▶
LLM Prompt
Sample Information
Material: magnetosomes in A549 spheroids
Method: in vitro cell culture
Precursors: magnetosomes
Temperature C: 37
Duration Hours: 2
Atmosphere: 95% relative humidity, 5% CO2
Sample-Specific Conditions
- degradation time: 2 h
- Overall nano-XRF map of A549 spheroids incubated with magnetosomes for 2 h
Preparation
- A549 cells incubated with magnetosomes (30 µg/mL magnetite) for 2 h, then collected and seeded for spheroid formation.
Measurement
We plan to measure the Fe K-edge XANES spectrum of this sample.
Questions
Based on all the information above:
1. What candidate reference spectra should be included in a linear combination fitting (LCF) analysis to accurately model the iron speciation in this cellular sample, considering the biological context of magnetosome degradation?
2. Given the very short incubation time (2 hours) of the magnetosomes in the A549 spheroids, what iron phase is expected to completely dominate the XANES spectrum, and what is the biological/physical reasoning for this?
Ground Truth
Material: magnetosomes in A549 spheroids
Measurement: Fe K-edge XANES in fluorescence mode at the Hard X-ray Nanoprobe (HXN) beamline (NSLS-II)
Fit method: Linear combination fit
Phase fractions: (±10%)
| Phase | Fraction |
|---|---|
| magnetite | 1.0 |
Fit basis (paper's reference spectra):
- magnetite
- maghemite
- horse spleen ferritin (ferrihydrite)
Source evidence: Page 8, text and Figure 5C (Full map 2 hours)
Key reasoning: At the 2 h time point, the magnetosomes have just been internalized by the cells. Because degradation and oxidation processes have not yet had time to occur, the iron remains entirely in the form of the original magnetite core of the magnetosomes.
Reasoning source: Page 8, 'Spatially resolved magnetosome degradation at nanometer scale by nano-XRF and nano-XANES' section
Scoring Rubric (total: 100 pts)
| Q | Type | Max | Question | Reference Answer | Scoring Criteria |
|---|---|---|---|---|---|
| q1 | identification | 43 | What candidate reference spectra should be included in a linear combination fitting (LCF) analysis to accurately model the iron speciation in this cellular sample, considering the biological context of magnetosome degradation? | The linear combination fitting (LCF) analysis should include reference spectra for magnetite, maghemite, and horse spleen ferritin (ferrihydrite). These specific phases are selected to model the initial state and potential biological processing of the sample, which consists of A549 spheroids incubated with magnetosomes at 37 °C. Magnetite represents the original precursor core of the magnetosomes. Maghemite and ferritin (ferrihydrite) are included to account for potential oxidation and biological iron storage products resulting from cellular degradation. However, because the incubation time is only 2 hours, the magnetosomes have just been internalized, meaning these degradation and oxidation processes have not yet had time to occur. | Full credit for identifying magnetite (the initial phase), maghemite (the oxidation product), and ferritin/ferrihydrite (the biological storage phase). |
| q2 | reasoning | 57 | Given the very short incubation time (2 hours) of the magnetosomes in the A549 spheroids, what iron phase is expected to completely dominate the XANES spectrum, and what is the biological/physical reasoning for this? | The XANES spectrum is expected to be completely dominated by magnetite, which accounts for a fraction of 1.0 (100%) of the iron species. This outcome is a direct result of the very short 2-hour incubation time of the A549 cells with the magnetosome precursors at 37 °C. At this early time point, the magnetosomes have just been internalized by the cells. Because cellular degradation and oxidation processes have not yet had sufficient time to occur, the iron remains entirely in the form of the original magnetite core. Therefore, no secondary biological processing phases, such as maghemite or ferritin, have formed yet. | Full credit for stating that magnetite will be the sole phase (100% or fraction 1.0) and explaining that at 2 hours, the magnetosomes have just been internalized and have not yet undergone cellular degradation or oxidation. |
Review
#1167
magnetosomes in A549 spheroids
Fe K-edge
▶
LLM Prompt
Sample Information
Material: magnetosomes in A549 spheroids
Method: in vitro cell culture
Precursors: magnetosomes
Temperature C: 37
Duration Hours: 192
Atmosphere: 95% relative humidity, 5% CO2
Sample-Specific Conditions
- degradation time: 8 days
- Overall nano-XRF map of A549 spheroids incubated with magnetosomes for 8 days
Preparation
- A549 cells incubated with magnetosomes (30 µg/mL magnetite) for 2 h, then collected and seeded for spheroid formation.
Measurement
We plan to measure the Fe K-edge XANES spectrum of this sample.
Questions
Based on all the information above:
1. Based on the sample conditions (magnetosomes in A549 spheroids after 8 days of degradation), what candidate reference spectra should be included in a linear combination fit of the Fe K-edge XANES data?
2. Estimate the phase fractions of the iron species present in the overall sample after 8 days of degradation.
3. Explain the reasoning for the expected phase composition, specifically addressing the transformation of the initial magnetosomes in the cellular environment over the 8-day period.
Ground Truth
Material: magnetosomes in A549 spheroids
Measurement: Fe K-edge XANES, fluorescence mode, Hard X-ray Nanoprobe (HXN) beamline at NSLS-II
Fit method: Linear combination fit
Phase fractions: (±10%)
| Phase | Fraction |
|---|---|
| magnetite | 0.75 |
| maghemite | 0.25 |
Fit basis (paper's reference spectra):
- magnetite
- maghemite
- horse spleen ferritin (ferrihydrite)
Source evidence: Page 8, text; Figure 5C
Key reasoning: After 8 days of degradation, the overall XRF map spectra show 25% maghemite, indicating a clear oxidation of the internalized magnetite. This matches the macroscopic XANES results of entire spheroids, showing that magnetite in magnetosomes slowly oxidizes into maghemite over the first 10 days after internalization.
Reasoning source: Page 8, 'Spatially resolved magnetosome degradation at nanometer scale by nano-XRF and nano-XANES' section
Scoring Rubric (total: 100 pts)
| Q | Type | Max | Question | Reference Answer | Scoring Criteria |
|---|---|---|---|---|---|
| q1 | identification | 30 | Based on the sample conditions (magnetosomes in A549 spheroids after 8 days of degradation), what candidate reference spectra should be included in a linear combination fit of the Fe K-edge XANES data? | The candidate reference spectra for the linear combination fit should include magnetite, maghemite, and horse spleen ferritin (ferrihydrite). These specific phases are expected because the initial precursor material consists of magnetosomes, which are primarily composed of magnetite. During the 8-day (192 hours) in vitro incubation at 37 °C within the A549 spheroids, the internalized magnetite undergoes a slow degradation process. This cellular environment promotes the clear oxidation of the initial magnetite into maghemite, necessitating the inclusion of both phases, along with ferritin to account for potential biological iron storage during this degradation. | Full points for identifying magnetite, maghemite, and ferritin (or ferrihydrite) as the necessary reference spectra. Partial credit if only magnetite and maghemite are mentioned. |
| q2 | quantification | 30 | Estimate the phase fractions of the iron species present in the overall sample after 8 days of degradation. | The estimated phase fractions for the overall sample are 75% magnetite and 25% maghemite, with an uncertainty of 10%. These specific values result directly from the degradation conditions of the magnetosomes incubated within the A549 spheroids for 8 days at 37 °C. Over this 192-hour period, the cellular environment causes the internalized magnetite precursor to slowly oxidize. Consequently, exactly one-quarter of the initial magnetite has transformed into maghemite by this time point, leaving the remaining 75% as intact magnetite. | Full points for estimating approximately 75% magnetite and 25% maghemite. Deduct points for estimates outside a +/- 10% range or for including significant fractions of other phases in the overall average. |
| q3 | reasoning | 40 | Explain the reasoning for the expected phase composition, specifically addressing the transformation of the initial magnetosomes in the cellular environment over the 8-day period. | The expected phase composition of 75% magnetite and 25% maghemite is driven by the slow oxidation of the initial magnetosome precursors within the cellular environment. When the A549 cells are incubated with 30 µg/mL magnetite and cultured into spheroids at 37 °C for 8 days (192 hours), the internalized magnetosomes undergo degradation. This specific in vitro environment induces a clear oxidation process where the initial magnetite slowly converts into maghemite over the first 10 days after internalization. Therefore, at the 8-day mark, the macroscopic XANES and overall XRF map spectra reflect this partial transformation, yielding the observed mixture of remaining magnetite and newly formed maghemite. | Full points for explaining that the initial magnetite in the magnetosomes undergoes slow oxidation into maghemite within the cellular environment, reaching about 25% oxidation by day 8. |
Review
Oxidation states of copper in preservative treated wood as studied by X-ray absorption near edge spectroscopy (XANES)
APS
Environmental
Samuel L. Zelinka et al.
DOI: 10.1371/journal.pone.0263073
1 scenario
▶
#1168
treated wood
Cu K
▶
LLM Prompt
Sample Information
Material: treated wood
Sample Origin: laboratory prepared
Sample-Specific Conditions
- Time after treatment: 1 day
- Southern pine block treated with Chromated Copper Arsenate, 1 day after treatment
Measurement
We plan to measure the Cu K XANES spectrum of this sample.
Questions
Based on all the information above:
1. Based on the sample conditions (Southern pine block, 1 day after CCA treatment), what is the expected dominant oxidation state of copper in the wood, and why?
2. If you were to perform Linear Combination Fitting (LCF) on the XANES spectrum of this freshly treated sample, what candidate reference spectra would be most appropriate to include in your basis set?
3. Given that this sample is entirely Cu2+ at 1 day post-treatment, what changes in environmental conditions or weathering history would typically be required to induce the emergence of other copper phases (e.g., Cu(I))?
Ground Truth
Material: treated wood
Measurement: Cu K-edge XANES
Fit method: LCF
Phase fractions: (±10%)
| Phase | Fraction |
|---|---|
| Cu2+ | 1.0 |
Fit basis (paper's reference spectra):
- Cu2+ reference spectra
Source evidence: text/figure_4
Key reasoning: At 1 day after treatment with Chromated Copper Arsenate (CCA), the copper in the Southern pine block remains entirely in the Cu2+ oxidation state. Because the sample is freshly treated and unweathered, no significant environmental exposure, biological degradation, or chemical reduction has occurred to alter the initial Cu(II) speciation of the preservative.
Reasoning source: Results and Discussion (associated with Figure 4)
Scoring Rubric (total: 100 pts)
| Q | Type | Max | Question | Reference Answer | Scoring Criteria |
|---|---|---|---|---|---|
| q1 | reasoning | 40 | Based on the sample conditions (Southern pine block, 1 day after CCA treatment), what is the expected dominant oxidation state of copper in the wood, and why? | The expected dominant oxidation state of copper in the wood is Cu2+, which accounts for 100% of the copper present. This is expected because the laboratory-prepared Southern pine block was treated with Chromated Copper Arsenate (CCA) only 1 day prior to measurement. At this early stage, the sample is freshly treated and unweathered. Therefore, no significant environmental exposure, biological degradation, or chemical reduction has occurred to alter the initial Cu(II) speciation of the preservative. | Full points for identifying Cu2+ (or Cu(II)) as the 100% dominant phase and explaining that at 1 day post-treatment, no weathering or reduction processes have yet occurred to alter the initial preservative speciation. |
| q2 | identification | 30 | If you were to perform Linear Combination Fitting (LCF) on the XANES spectrum of this freshly treated sample, what candidate reference spectra would be most appropriate to include in your basis set? | For Linear Combination Fitting (LCF) of this XANES spectrum, the basis set should consist exclusively of Cu2+ reference spectra. This is directly due to the sample conditions, specifically that the Southern pine block was treated with Chromated Copper Arsenate just 1 day prior. Because the sample is freshly treated and unweathered, it has not experienced the environmental exposure, biological degradation, or chemical reduction needed to alter the initial preservative. Consequently, the copper remains entirely in the Cu2+ oxidation state (fraction of 1.0), requiring only Cu2+ references for an accurate fit. | Full points for stating that Cu2+ reference spectra (such as Cu(II) bound to wood components or Cu(II) arsenate/oxide) are required, as the sample is entirely Cu(II). |
| q3 | prediction | 30 | Given that this sample is entirely Cu2+ at 1 day post-treatment, what changes in environmental conditions or weathering history would typically be required to induce the emergence of other copper phases (e.g., Cu(I))? | To induce the emergence of other copper phases, the treated wood would need to experience significant environmental exposure, biological degradation, or chemical reduction. The current laboratory-prepared Southern pine block contains entirely Cu2+ (fraction of 1.0) precisely because it was measured only 1 day after treatment with Chromated Copper Arsenate. Being freshly treated and unweathered, the initial Cu(II) speciation of the preservative remains completely intact. Therefore, introducing weathering or environmental degradation is the necessary mechanism to chemically reduce or alter the initial Cu2+ state. | Full points for explaining that extended weathering, biological/fungal degradation, or specific environmental exposures over time would be needed to reduce the initial Cu(II) to lower oxidation states. |
Review
Probing rutile solid-phase crystallization of atomically mixed Mn-alloyed TiO2 coatings through XANES analysis
BNL-NSLS-II-8-ID
Synthesis
Devan Solanki et al.
DOI: 10.1557/s43579-023-00497-1
4 scenarios
▶
#1169
TiMnOx
Mn K
▶
LLM Prompt
Sample Information
Material: TiMnOx
Method: Atomic Layer Deposition
Precursors: tetrakisdimethylamido-titanium, bis(ethylcyclopentadienyl)manganese, water
Temperature C: 150
Atmosphere: Ar purge
Sample-Specific Conditions
- Annealing temperature: As-deposited
- As-deposited Mn-alloyed TiO2 film
Preparation
- Deposited via ALD at 150 °C using tetrakisdimethylamido-titanium and bis(ethylcyclopentadienyl)manganese precursors with water coreactant.
Measurement
We plan to measure the Mn K XANES spectrum of this sample.
Questions
Based on all the information above:
1. What is the expected average oxidation state of Mn in the as-deposited TiMnOx film grown by ALD at 150 °C, and what reference compound does its main edge position match?
2. Describe the expected spectral features of the Mn K-edge for this as-deposited sample, specifically noting the pre-edge peak position and how the main edge shape depends on the Mn concentration.
3. Based on the physical and chemical processes during ALD, why does the as-deposited film exhibit a fractional oxidation state rather than a pure Mn(II) state from the precursor?
Ground Truth
Material: TiMnOx
Measurement: Mn K-edge XANES, fluorescence mode, Inner Shell Spectroscopy beamline at NSLS-II
Fit method: Direct spectral comparison / superposition
Phase fractions: (±15%)
| Phase | Fraction |
|---|---|
| Mn3O4-like (average oxidation state 2.66) | 1.0 |
Fit basis (paper's reference spectra):
- Mn3O4 reference
Source evidence: Figure 2b inset, page 8
Key reasoning: The oxidation state of Mn in the as-deposited TiMnOx is independent of Mn concentration. Superimposing the TiMnOx trace upon the Mn3O4 reference shows a good match in edge position, indicating a comparable average oxidation state of +2.67, which is a mixture of Mn(II) and Mn(III). This fractional oxidation state is a result of a linear combination of different Mn chemical environments.
Reasoning source: Page 8, Results & Discussion
Scoring Rubric (total: 100 pts)
| Q | Type | Max | Question | Reference Answer | Scoring Criteria |
|---|---|---|---|---|---|
| q1 | identification | 30 | What is the expected average oxidation state of Mn in the as-deposited TiMnOx film grown by ALD at 150 °C, and what reference compound does its main edge position match? | The expected average oxidation state of Mn in the as-deposited TiMnOx film is +2.66 (or +2.67), and its main edge position matches a Mn3O4 reference compound. This specific fractional oxidation state arises because the ALD process at 150 °C, using water and bis(ethylcyclopentadienyl)manganese precursors, produces a mixture of Mn(II) and Mn(III) chemical environments. Specifically, small Mn2O3 crystallites form alongside residual Mn(II) originating from the precursor. The linear combination of these distinct environments results in an average oxidation state that perfectly matches Mn3O4 and remains independent of the overall Mn concentration in the film. | Full points for identifying an average oxidation state of +2.67 (or a mixture of Mn(II) and Mn(III)) and stating that the edge position matches the Mn3O4 reference. |
| q2 | spectral | 40 | Describe the expected spectral features of the Mn K-edge for this as-deposited sample, specifically noting the pre-edge peak position and how the main edge shape depends on the Mn concentration. | The expected Mn K-edge XANES spectrum exhibits a pre-edge peak at 6539 eV and a main edge position identical to a Mn3O4 reference. While this primary edge position does not shift with varying Mn concentrations, the main peak sharpness increases as the Mn concentration decreases from a 2:1 to a 16:1 ratio. These spectral features occur because the ALD process at 150 °C consistently produces a stable mixture of Mn(II) and Mn(III) environments, anchoring the edge position at a fractional oxidation state of +2.67 regardless of doping levels. The concentration-dependent change in peak sharpness reflects how altering the precursor ratios during deposition affects the local structural ordering of these mixed Mn environments within the film. | Full points for stating the pre-edge apex is at 6539 eV and describing that the peak sharpness of the main edge increases as the Mn concentration decreases (e.g., from 2:1 to 16:1 ratio). |
| q3 | reasoning | 30 | Based on the physical and chemical processes during ALD, why does the as-deposited film exhibit a fractional oxidation state rather than a pure Mn(II) state from the precursor? | The as-deposited film exhibits a fractional oxidation state of +2.67 because it consists of a linear combination of distinct Mn(II) and Mn(III) chemical environments rather than a single phase. Although the bis(ethylcyclopentadienyl)manganese precursor initially supplies Mn in a +2 state, the ALD reaction with a water coreactant at 150 °C induces partial oxidation. This deposition process leads to the formation of small Mn2O3 crystallites alongside the residual Mn(II) from the precursor. Consequently, the film cannot retain a pure Mn(II) state, but instead forms a mixed-valence system whose average oxidation state matches Mn3O4 independent of the total Mn concentration. | Full points for explaining that the fractional oxidation state (+2.67) is a result of a linear combination of different Mn chemical environments, specifically a mixture of Mn(II) and Mn(III), which is consistent with the formation of small Mn(III) oxide (Mn2O3) crystallites during the deposition process. |
Review
#1170
TiMnOx
Mn K
▶
LLM Prompt
Sample Information
Material: TiMnOx
Method: Atomic Layer Deposition
Precursors: tetrakisdimethylamido-titanium, bis(ethylcyclopentadienyl)manganese, water
Temperature C: 500
Duration Hours: 2
Atmosphere: air
Post Treatment: Annealed at 500 °C for 2 hours
Sample-Specific Conditions
- Annealing temperature: 500 °C
- TiMnOx film with 4:1 Ti:Mn cycle ratio annealed at 500 °C
Preparation
- Deposited via ALD at 150 °C, then annealed at 500 °C in air for 2 hours.
Measurement
We plan to measure the Mn K XANES spectrum of this sample.
Questions
Based on all the information above:
1. What is the dominant Mn-containing phase expected for the TiMnOx (4:1) film after annealing at 500 °C in air, and what is the corresponding Mn oxidation state?
2. Explain the physical mechanism driving the formation of this phase during the 500 °C annealing process in air, starting from the as-deposited state.
3. Describe the expected changes in the Mn K-edge XANES spectral features (specifically the edge position and pre-edge) for this sample compared to the as-deposited film.
4. If performing Linear Combination Fitting (LCF) to model the Mn K-edge spectrum of this sample, what reference spectrum would be sufficient to fit the data, and why?
Ground Truth
Material: TiMnOx
Measurement: Mn K-edge XANES, fluorescence mode, Inner Shell Spectroscopy beamline at NSLS-II
Fit method: Linear Combination Fitting (LCF) / direct spectral comparison
Phase fractions: (±10%)
| Phase | Fraction |
|---|---|
| Mn2O3 | 1.0 |
Fit basis (paper's reference spectra):
- Mn2O3 experimental reference spectrum
Source evidence: Page 10, Figure 3b inset; Page 11, Figure 4e
Key reasoning: Annealing at 500 °C in air causes the Mn(II) in the as-deposited amorphous film to oxidize to Mn(III) by interacting with oxygen in the annealing atmosphere. The Mn crystallizes into an octahedral geometry resembling bixbyite (Mn2O3). The higher Mn concentration samples (like the 4:1 ratio) are well fit entirely with the experimental Mn2O3 bixbyite phase at this temperature.
Reasoning source: Page 10 (XANES Characterization of Annealed Samples) and Page 13 (Crystallization Mechanism & Conclusion)
Scoring Rubric (total: 100 pts)
| Q | Type | Max | Question | Reference Answer | Scoring Criteria |
|---|---|---|---|---|---|
| q1 | prediction | 25 | What is the dominant Mn-containing phase expected for the TiMnOx (4:1) film after annealing at 500 °C in air, and what is the corresponding Mn oxidation state? | The dominant Mn-containing phase expected for the TiMnOx (4:1) film is Mn2O3 (bixbyite), which accounts for a fraction of 1.0 and corresponds to an oxidation state of Mn(III). This specific phase and oxidation state arise because annealing the sample at 500 °C in an air atmosphere provides the thermal energy and oxygen necessary to fully oxidize the Mn(II) present in the as-deposited amorphous film. Under these specific conditions, particularly with the higher Mn concentration of the 4:1 cycle ratio, the manganese crystallizes entirely into an octahedral geometry resembling bixbyite. | Award 15 points for identifying Mn2O3 (or bixbyite) as the dominant/sole phase. Award 10 points for stating the oxidation state is Mn(III). |
| q2 | reasoning | 25 | Explain the physical mechanism driving the formation of this phase during the 500 °C annealing process in air, starting from the as-deposited state. | Starting from an amorphous as-deposited film containing Mn(II), the 500 °C annealing process in air drives both oxidation and crystallization mechanisms. The thermal treatment in an oxygen-rich atmosphere causes the Mn(II) to interact with oxygen, fully oxidizing it to Mn(III). Concurrently, the manganese atoms rearrange to form an octahedral geometry that trends toward an ideal 6-coordinated structure with identical Mn-O bond lengths. Due to the specific 500 °C temperature and the 4:1 Ti:Mn cycle ratio, this structural and electronic evolution results in the complete formation of the bixbyite Mn2O3 phase. | Award 10 points for mentioning the oxidation of Mn(II) to Mn(III) via interaction with atmospheric oxygen. Award 15 points for mentioning that Mn crystallizes into an octahedral geometry resembling bixbyite. |
| q3 | spectral | 30 | Describe the expected changes in the Mn K-edge XANES spectral features (specifically the edge position and pre-edge) for this sample compared to the as-deposited film. | Compared to the as-deposited film, the Mn K-edge position of the annealed sample will shift to a higher energy, and the pre-edge feature at 6539 eV will exhibit a significant reduction in peak area. These spectral changes are directly driven by the 500 °C annealing process in air. The shift to higher energy occurs because the thermal treatment in oxygen oxidizes the initial Mn(II) state to Mn(III). Meanwhile, the reduction in the pre-edge peak area reflects the crystallization of the manganese into a bixbyite Mn2O3 phase, forming an ideal 6-coordinated octahedral geometry with identical Mn-O bond lengths that inherently suppresses pre-edge intensity. | Award 10 points for stating the edge shifts to higher energy. Award 10 points for identifying the pre-edge apex at 6539 eV. Award 10 points for noting the reduction in pre-edge peak area, which indicates increased octahedral geometry. |
| q4 | identification | 20 | If performing Linear Combination Fitting (LCF) to model the Mn K-edge spectrum of this sample, what reference spectrum would be sufficient to fit the data, and why? | When performing Linear Combination Fitting (LCF), a single experimental reference spectrum of Mn2O3 (bixbyite) is sufficient to fit the data, yielding a phase fraction of 1.0. This single-component fit is appropriate because the 500 °C annealing process in air provides the necessary conditions for the amorphous Mn(II) in the as-deposited film to fully oxidize to Mn(III). At this temperature and with the 4:1 Ti:Mn cycle ratio, the manganese completely crystallizes into an octahedral geometry. Therefore, the sample entirely matches the bixbyite Mn2O3 phase, eliminating the need for additional mixed-state reference spectra. | Award 10 points for identifying the Mn2O3 experimental reference spectrum. Award 10 points for explaining that at 500 °C, samples with higher Mn compositions (like 4:1) are fully converted and well-fit by this single phase. |
Review
#1171
TiMnOx
Mn K
▶
LLM Prompt
Sample Information
Material: TiMnOx
Method: Atomic Layer Deposition
Precursors: tetrakisdimethylamido-titanium, bis(ethylcyclopentadienyl)manganese, water
Temperature C: 600
Duration Hours: 2
Atmosphere: air
Post Treatment: Annealed at 600 °C for 2 hours
Sample-Specific Conditions
- Annealing temperature: 600 °C
- TiMnOx film with 16:1 Ti:Mn cycle ratio annealed at 600 °C
Preparation
- Deposited via ALD at 150 °C, then annealed at 600 °C in air for 2 hours.
Measurement
We plan to measure the Mn K XANES spectrum of this sample.
Questions
Based on all the information above:
1. Based on the synthesis conditions (16:1 Ti:Mn ratio, annealed at 600 °C in air), what is the expected dominant Mn-containing phase, and what is the physical reasoning for its formation?
2. Describe the expected Mn K-edge XANES spectral features for this sample, specifically regarding the edge position and its indication of the oxidation state.
3. If you were to perform a qualitative comparison or spectral matching for this sample's XANES spectrum, what specific reference spectrum or compound would provide an excellent match?
Ground Truth
Material: TiMnOx
Measurement: Mn K-edge XANES in fluorescence mode at the Inner Shell Spectroscopy beamline (NSLS-II)
Fit method: Qualitative spectral matching
Phase fractions: (±10%)
| Phase | Fraction |
|---|---|
| MnO2 | 1.0 |
Fit basis (paper's reference spectra):
- rutile type MnO2 Pnmn (mp-33009)
Source evidence: Page 11, Figure 4f
Key reasoning: Annealing at 600 °C leads to continued oxidation compared to 500 °C. This trend is most pronounced for the 16:1 sample (lowest Mn concentration), resulting in a complete shift to Mn(IV) and an excellent structural match with rutile-type MnO2.
Reasoning source: Page 11, Section 'XANES Characterization of Annealed Samples'
Scoring Rubric (total: 100 pts)
| Q | Type | Max | Question | Reference Answer | Scoring Criteria |
|---|---|---|---|---|---|
| q1 | reasoning | 40 | Based on the synthesis conditions (16:1 Ti:Mn ratio, annealed at 600 °C in air), what is the expected dominant Mn-containing phase, and what is the physical reasoning for its formation? | The expected dominant Mn-containing phase is rutile-type MnO2 (Pnmn), which accounts for a 1.0 (100%) fraction of the manganese in the sample. This phase forms because annealing the ALD-deposited TiMnOx film in air at a high temperature of 600 °C drives continued oxidation of the manganese compared to lower temperatures. Furthermore, this oxidation trend is most pronounced in the sample with a 16:1 Ti:Mn cycle ratio, which represents the lowest Mn concentration. Consequently, these specific synthesis conditions result in a complete shift of the manganese to the Mn(IV) oxidation state, yielding an excellent structural match with rutile-type MnO2. | Award 20 points for identifying MnO2 (specifically rutile-type or Mn(IV) oxide). Award 20 points for explaining that the combination of high temperature (600 °C) and low Mn concentration (16:1 ratio) promotes pronounced and continued oxidation to Mn(IV). |
| q2 | spectral | 30 | Describe the expected Mn K-edge XANES spectral features for this sample, specifically regarding the edge position and its indication of the oxidation state. | The expected Mn K-edge XANES spectrum will exhibit a rising edge position shifted to a higher energy that is characteristic of the Mn(IV) oxidation state. The overall spectral shape will show an excellent match with the computed spectrum of rutile-type MnO2 Pnmn (mp-33009). These features arise because annealing the 16:1 Ti:Mn ratio sample in air at 600 °C causes pronounced, continued oxidation of the low-concentration manganese. This high-temperature oxidation completely shifts the metal to Mn(IV), distinguishing the spectrum's higher-energy edge position from the Mn(II) or Mn(III) states typically observed in as-deposited or lower-temperature annealed samples. | Award 15 points for stating that the rising edge position shifts to higher energy. Award 15 points for linking this higher energy edge position to the Mn(IV) oxidation state. |
| q3 | identification | 30 | If you were to perform a qualitative comparison or spectral matching for this sample's XANES spectrum, what specific reference spectrum or compound would provide an excellent match? | For qualitative spectral matching, the specific reference compound that provides an excellent match is rutile-type MnO2 Pnmn (mp-33009). This reference is appropriate because the sample was deposited with a 16:1 Ti:Mn cycle ratio (the lowest Mn concentration) and subsequently annealed in air at 600 °C for 2 hours. These specific synthesis conditions drive continued and pronounced oxidation of the manganese compared to lower annealing temperatures. As a result, the manganese undergoes a complete shift to the Mn(IV) oxidation state, structurally and electronically matching the rutile-type MnO2 reference phase. | Award 30 points for identifying rutile-type MnO2 (or specifically mentioning the Pnmn phase / mp-33009 reference). |
Review
#1172
TiMnOx
Mn K
▶
LLM Prompt
Sample Information
Material: TiMnOx
Method: Atomic Layer Deposition
Precursors: tetrakisdimethylamido-titanium, bis(ethylcyclopentadienyl)manganese, water
Temperature C: 500
Duration Hours: 2
Atmosphere: air
Post Treatment: Annealed at 500 °C for 2 hours
Sample-Specific Conditions
- Annealing temperature: 500 °C
- TiMnOx film annealed at 500 °C
Preparation
- Deposited via ALD at 150 °C, then annealed at 500 °C in air for 2 hours.
Measurement
We plan to measure the Mn K XANES spectrum of this sample.
Questions
Based on all the information above:
1. Describe the key spectral features expected in the Ti K-edge XANES spectrum of this sample that indicate its crystalline structure.
2. What electronic transitions give rise to the pre-edge features observed in the Ti K-edge XANES spectrum of this sample?
Ground Truth
Material: TiMnOx
Measurement: Ti K-edge XANES in fluorescence mode at NSLS-II ISS beamline
Fit method: Qualitative comparison
Phase fractions: (±10%)
| Phase | Fraction |
|---|---|
| TiO2 (rutile) | 1.0 |
Fit basis (paper's reference spectra):
- rutile TiO2 (mp-2657)
Source evidence: Page 10, Figure 4a and 4b
Key reasoning: Annealing the amorphous TiMnOx films at 500 °C results in a complete phase transformation of the TiO2 component to the rutile phase. The Ti K-edge XANES spectra show a doublet in the edge and multiple pre-edge features that are a good qualitative match with a rutile TiO2 reference. The incorporation of Mn acts as a catalyst for the direct transformation from amorphous TiO2 to rutile, bypassing the intermediate anatase phase.
Reasoning source: Page 10-11, Results & Discussion, XANES Characterization of Annealed Samples; Page 13, Crystallization Mechanism & Conclusion
Scoring Rubric (total: 100 pts)
| Q | Type | Max | Question | Reference Answer | Scoring Criteria |
|---|---|---|---|---|---|
| q2 | spectral | 60 | Describe the key spectral features expected in the Ti K-edge XANES spectrum of this sample that indicate its crystalline structure. | The Ti K-edge XANES spectrum is expected to exhibit multiple pre-edge features and a distinct doublet in the main edge. These spectral features are characteristic of rutile TiO2 and show no trace of an anatase phase. This specific spectral shape arises because annealing the ALD-deposited TiMnOx film at 500 °C in air for 2 hours causes a complete phase transformation of the TiO2 component. Specifically, the incorporated Mn acts as a catalyst during this thermal treatment, driving a direct crystallization from amorphous TiO2 to rutile while completely bypassing the intermediate anatase phase. | Full points for mentioning multiple pre-edge features and a doublet in the main edge, which are characteristic of rutile TiO2. |
| q3 | reasoning | 40 | What electronic transitions give rise to the pre-edge features observed in the Ti K-edge XANES spectrum of this sample? | The pre-edge features in the Ti K-edge XANES spectrum originate from electronic transitions from the Ti 1s core level to the spin-forbidden 3d orbitals. These transitions become possible due to the hybridization of the Ti 3d orbitals with the 4p orbitals. This specific electronic structure is observed because annealing the ALD-deposited TiMnOx film at 500 °C in air for 2 hours induces a complete crystallization of the material. During this thermal treatment, the incorporated Mn acts as a catalyst to directly transform the amorphous film into pure rutile TiO2, bypassing the anatase phase and establishing the local Ti(IV) environment that produces these specific pre-edge transitions. | Full points for stating they result from transitions from 1s to spin-forbidden 3d orbitals, enabled by hybridization of 3d with 4p orbitals. |
Review
XLive: Data Acquisition and Visualization at the NSLS-II ISS Beamline
BNL-NSLS-II-8-ID
Pure Phase
DOI: 10.18429/JACoW-ICALEPCS2017-TUPHA211
1 scenario
▶
#1173
Ni
Ni K
▶
LLM Prompt
Sample Information
Material: Ni
Crystal Structure: fcc
Oxidation State: 0
Sample Form: foil
- Nickel foil used as a demonstration for the XLive data processing software.
Measurement
We plan to measure the Ni K XANES spectrum of this sample.
Questions
Based on all the information above:
1. What is the phase composition of the sample, and what physical or chemical insights does the paper derive from its XANES spectrum?
2. Based on the text, what are the specific labeled peaks, edge position, and distinguishing spectral features of this nickel foil?
3. What is the reported oxidation state of the nickel in this sample, and how is it determined from the spectral data in the paper?
Ground Truth
Compound: Nickel foil
Oxidation state: not reported
Measurement: Ni K-edge XAS, fly-scanning, NSLS-II ISS Beamline
Edge position: not reported
Spectral shape: The paper shows a raw and binned XAS spectrum of a nickel foil as a software demonstration, but provides no physical description or analysis of the spectral shape.
Distinguishing features: not reported
Key reasoning: The nickel foil is used exclusively as a standard reference sample to demonstrate the beamline's data acquisition trajectories and the XLive software's data processing (binning) capabilities. No physical, chemical, or structural analysis of the foil is discussed.
Reasoning source: Figures 3, 5, and 6 captions; 'Trajectory Generation' and 'Processing' sections
Scoring Rubric (total: 100 pts)
| Q | Type | Max | Question | Reference Answer | Scoring Criteria |
|---|---|---|---|---|---|
| q1 | reasoning | 40 | What is the phase composition of the sample, and what physical or chemical insights does the paper derive from its XANES spectrum? | The phase composition of the sample is 100% metallic nickel. The paper derives no physical, chemical, or structural insights from its XANES spectrum. Because the sample is a standard fcc Ni(0) foil, it is expected to consist entirely of metallic nickel and is used exclusively as a standard reference sample. Its sole purpose in the study is to demonstrate the NSLS-II ISS beamline's fly-scanning data acquisition trajectories and the XLive software's data processing and binning capabilities, rather than to investigate the material's properties. | Full credit if the model identifies the sample as 100% metallic nickel (or pure phase) and correctly notes that the paper derives no physical/chemical insights, as the sample is used solely for software/trajectory demonstration. |
| q2 | spectral | 30 | Based on the text, what are the specific labeled peaks, edge position, and distinguishing spectral features of this nickel foil? | The text does not report any specific labeled peaks, edge position, or distinguishing spectral features for this sample. While the paper displays raw and binned Ni K-edge XAS spectra, it provides no physical description or analysis of the spectral shape. Because the fcc Ni(0) foil is utilized solely as a standard reference to demonstrate the XLive software's data processing capabilities, detailed spectral characterization is unnecessary for the authors' goals. The sample conditions dictate its use as a methodological demonstration rather than a subject of chemical investigation, explaining the complete absence of structural or electronic spectral analysis. | Full credit if the model correctly states that the paper does not report the edge position, labeled peaks, or distinguishing features, but only shows the spectrum visually as a processing example. |
| q3 | identification | 30 | What is the reported oxidation state of the nickel in this sample, and how is it determined from the spectral data in the paper? | The sample conditions indicate the nickel is in an oxidation state of 0, but the paper itself does not report or determine the oxidation state from the spectral data. The sample is a standard metallic nickel foil with an fcc crystal structure, which inherently possesses a 0 oxidation state. However, because the foil is used exclusively as a reference sample to demonstrate the XLive software's binning and data acquisition capabilities, no chemical analysis is performed. Consequently, the authors do not use the Ni K-edge XANES data to determine or discuss the oxidation state or any other physical properties of the foil. | Full credit if the model correctly states that the oxidation state is not reported or analyzed in the paper. |
Review
Crystal-Field Mediated Electronic Transitions of EuS up to 35 GPa
ESRF-BM23
Pure Phase
Virginia Monteseguro et al.
DOI: 10.21203/rs.3.rs-1027058/v1
2 scenarios
▶
#1174
EuS
Eu L3
▶
LLM Prompt
Sample Information
Material: EuS
Crystal Structure: Fm-3m (B1, NaCl-type)
Oxidation State: 2.10
Sample Form: powder in DAC
Measurement Mode: transmission
- EuS at ambient pressure in the NaCl-type structure
Measurement
We plan to measure the Eu L3 XANES spectrum of this sample.
Questions
Based on all the information above:
1. Describe the expected spectral shape and key features of the Eu L3-edge XANES for EuS at ambient pressure (0 GPa).
2. What electronic transition gives rise to the main white line feature, and how does the local coordination environment affect it?
3. What is the expected oxidation state of Eu in this sample at 0 GPa, and what reference basis components are needed to determine it from the XANES spectrum?
Ground Truth
Compound: EuS
Oxidation state: 2.10
Measurement: Eu L3-edge XANES in transmission mode at BM23 beamline (ESRF)
Edge position: 6975
Spectral shape: Intense white line split by crystal field into two components (5t2g and 5eg) separated by 2.29 eV.
Labeled peaks:
| Label | Energy (eV) | Intensity | Origin | Source |
|---|---|---|---|---|
| White Line (WL) | near 6975 | intense | 2p3/2 -> 5d3/2,5/2 electric-dipole transition | paper_data |
| 5t2g | not explicitly stated | not explicitly stated | Lower energy component of the crystal-field split 5d states in octahedral coordination | paper_data |
| 5eg | not explicitly stated | not explicitly stated | Higher energy component of the crystal-field split 5d states in octahedral coordination | paper_data |
Distinguishing features: The second derivative of the WL reveals the crystal-field splitting of 2.29 eV between the 5t2g and 5eg levels in the B1 (octahedral) phase.
Key reasoning: The intense white line (WL) is associated with the electric-dipole transition from the 2p3/2 to the 5d3/2,5/2 levels. The local density of unoccupied 5d states is split by the octahedral crystal field into lower energy t2g and higher energy eg orbitals. The separation between these components, determined from the second derivative of the WL, is the crystal-field splitting (CFS), which is 2.29 eV at 0 GPa. The Eu valence of 2.10 is determined from the spectral weights of Eu2+ and Eu3+ contributions.
Reasoning source: Results and Discussion section, pages 5-6
Scoring Rubric (total: 100 pts)
| Q | Type | Max | Question | Reference Answer | Scoring Criteria |
|---|---|---|---|---|---|
| q1 | spectral | 30 | Describe the expected spectral shape and key features of the Eu L3-edge XANES for EuS at ambient pressure (0 GPa). | The expected Eu L3-edge XANES spectrum features an edge position near 6975 eV dominated by an intense white line (WL). This WL is split into two distinct components: a lower energy 5t2g peak and a higher energy 5eg peak, separated by 2.29 eV. These specific spectral features arise because the EuS sample is in the Fm-3m (B1, NaCl-type) crystal structure at ambient pressure (0 GPa). In this octahedral coordination environment, the local density of unoccupied 5d states is split by the crystal field into the t2g and eg orbitals. This 2.29 eV crystal-field splitting can be directly observed by taking the second derivative of the WL. | Award 10 points for mentioning an intense white line (WL). Award 10 points for stating the WL is split into two components. Award 10 points for identifying the components as 5t2g and 5eg separated by a crystal-field splitting of 2.29 eV. |
| q2 | reasoning | 30 | What electronic transition gives rise to the main white line feature, and how does the local coordination environment affect it? | The main intense white line (WL) feature originates from the electric-dipole transition from the 2p3/2 core level to the unoccupied 5d3/2,5/2 levels. The local coordination environment strongly affects this transition by splitting the local density of unoccupied 5d states into lower energy t2g and higher energy eg orbitals. This occurs because the EuS sample crystallizes in the Fm-3m (B1, NaCl-type) structure at ambient pressure, placing the Eu atoms in an octahedral crystal field. Consequently, this specific octahedral coordination dictates the splitting of the WL, resulting in a measurable crystal-field splitting of 2.29 eV at 0 GPa. | Award 15 points for identifying the 2p3/2 -> 5d3/2,5/2 electric-dipole transition. Award 15 points for explaining that the octahedral crystal field splits the unoccupied 5d states into lower energy t2g and higher energy eg orbitals. |
| q3 | reasoning | 40 | What is the expected oxidation state of Eu in this sample at 0 GPa, and what reference basis components are needed to determine it from the XANES spectrum? | The expected oxidation state of Eu in this sample at 0 GPa is 2.10. To determine this valence from the XANES spectrum, reference basis components for both Eu2+ (4f7) and Eu3+ (4f6) are required. This specific oxidation state of 2.10 arises from the electronic configuration of the EuS powder sample under ambient conditions, which exhibits a slight mixed-valence character. The valence is calculated by fitting the spectrum using an arctan and two Gaussians to extract the relative spectral weights of the Eu2+ and Eu3+ contributions, making both reference bases essential for accurate quantification. | Award 15 points for stating the oxidation state is 2.10 (or a mixed-valence state close to 2+). Award 25 points for explaining that it is determined by fitting the spectral weights of the Eu2+ (4f7) and Eu3+ (4f6) contributions. |
Review
#1175
Eu2O3
Eu L3
▶
LLM Prompt
Sample Information
Material: Eu2O3
Oxidation State: 3+
Measurement Mode: transmission
- Reference compound for Eu3+ valence state
Measurement
We plan to measure the Eu L3 XANES spectrum of this sample.
Questions
Based on all the information above:
1. What is the oxidation state of Europium in Eu2O3, and what specific spectral feature in the L3-edge XANES spectrum is associated with this state?
2. Why is Eu2O3 measured at 17 GPa used as a reference in the study of high-pressure EuS?
3. How is the spectral information from the Eu2O3 reference applied to analyze the XANES spectra of EuS to determine its valence state?
Ground Truth
Compound: Eu2O3
Oxidation state: 3+
Measurement: Eu L3-edge XANES in transmission mode at ESRF BM23
Edge position: not reported
Spectral shape: The spectrum provides a distinct white line corresponding to the Eu3+ state, which serves as an energy reference for the higher-energy component (A2 peak) observed in the mixed-valence spectra of high-pressure EuS.
Labeled peaks:
| Label | Energy (eV) | Intensity | Origin | Source |
|---|---|---|---|---|
| WL | not explicitly stated (aligns with A2 peak of EuS) | not reported | Eu3+ (4f6) state | Figure 4h |
Distinguishing features: Provides the reference energy position for the Eu3+ valence state at high pressure (17 GPa), close to the critical pressure of the EuS phase transition.
Key reasoning: Eu2O3 at 17 GPa is used as a reference compound to establish the energetic position of the Eu3+ (4f6) white line at high pressure. This reference position is compared with the A2 Gaussian peak fitted to the high-pressure EuS spectra to confirm the presence and quantify the fraction of the Eu3+ state, thereby determining the mixed-valence state of EuS under lattice contraction.
Reasoning source: Page 6, Results and Discussion
Scoring Rubric (total: 100 pts)
| Q | Type | Max | Question | Reference Answer | Scoring Criteria |
|---|---|---|---|---|---|
| q1 | spectral | 30 | What is the oxidation state of Europium in Eu2O3, and what specific spectral feature in the L3-edge XANES spectrum is associated with this state? | The oxidation state of Europium in the Eu2O3 sample is 3+. In the Eu L3-edge XANES spectrum, this state is associated with a distinct white line (WL) peak originating from the Eu3+ (4f6) electronic configuration. This specific spectral feature arises because the sample is a pure Eu2O3 reference compound (fraction 1.0) measured in transmission mode specifically to isolate the 3+ valence state. The energetic position of this white line serves as a direct electronic marker for the Eu3+ state, which aligns with the higher-energy A2 Gaussian peak observed in mixed-valence systems. | Full points if the answer correctly identifies the 3+ oxidation state and mentions the white line (WL) originating from the Eu3+ (4f6) state. |
| q2 | reasoning | 35 | Why is Eu2O3 measured at 17 GPa used as a reference in the study of high-pressure EuS? | Eu2O3 measured at 17 GPa is used as a reference because it establishes the exact energetic position of the Eu3+ (4f6) white line at high pressure. This specific pressure condition (17 GPa) is chosen because it is close to the critical pressure of the EuS phase transition under lattice contraction. Because the sample is a pure Eu2O3 reference (fraction 1.0) with a stable 3+ oxidation state, its spectrum provides a reliable, unambiguous baseline for the 3+ valence state under these extreme conditions. This allows researchers to accurately compare the reference position with high-pressure EuS spectra to confirm the emergence of the Eu3+ state. | Full points if the answer explains that it establishes the energetic position of the Eu3+ white line at a pressure close to the phase transition of EuS, allowing for accurate comparison. |
| q3 | reasoning | 35 | How is the spectral information from the Eu2O3 reference applied to analyze the XANES spectra of EuS to determine its valence state? | The spectral information from the Eu2O3 reference is used to establish the precise energetic position of the Eu3+ (4f6) white line at high pressure. Because the Eu2O3 sample consists entirely of the 3+ oxidation state (fraction 1.0), it provides an isolated and unambiguous energy reference for this specific valence. This reference position is then directly compared with the A2 Gaussian peak fitted to the high-pressure EuS spectra. By aligning these features, researchers can confirm the presence and quantify the fraction of the Eu3+ state, thereby determining the mixed-valence state of EuS as it undergoes lattice contraction. | Full points if the answer describes comparing the WL position of Eu2O3 with the higher-energy Gaussian peak (A2) fitted to the EuS spectra to identify and quantify the Eu3+ contribution in the mixed-valence state. |
Review
Fate of cobalt and nickel in mackinawite during diagenetic pyrite formation
APS
Synthesis
Elizabeth D. Swanner, Samuel M. Webb, Andreas Kappler
DOI: 10.2138/am-2019-6834
29 scenarios
▶
#1176
Mackinawite (FeSm)
S K
▶
LLM Prompt
Sample Information
Material: Mackinawite (FeSm)
Method: precipitation
Precursors: 0.6 M ferrous ammonium sulfate, 0.6 M sodium sulfide
Temperature C: 25
Atmosphere: N2
Post Treatment: Embedded oxically
Sample-Specific Conditions
- Embedding: oxically
- Mackinawite synthesized and embedded oxically, end-member 61 from S K-edge XANES
Preparation
- Synthesized from solutions of 0.6 M ferrous ammonium sulfate and 0.6 M sodium sulfide. Equal volumes added via N2-purged syringes to a previously N2-purged and stoppered serum bottle under a slight vacuum (0.5 mbar). Precipitated immediately. Embedded oxically.
Measurement
We plan to measure the S K XANES spectrum of this sample.
Questions
Based on all the information above:
1. Based on the sample conditions (mackinawite embedded oxically), what candidate reference spectra are needed for linear combination fitting of its S K-edge XANES spectrum?
2. Estimate the phase fractions of the components in this sample.
3. Explain the physical reasoning for the presence of the secondary phase in this sample, given its synthesis conditions and post-treatment.
Ground Truth
Material: Mackinawite (FeSm)
Measurement: S K-edge XANES at SSRL BL 14-3
Fit method: Linear combination fitting (LCF)
Phase fractions: (±10%)
| Phase | Fraction |
|---|---|
| FeS | 0.68 |
| Sulfate | 0.37 |
Fit basis (paper's reference spectra):
- FeS
- Pyrite
- Poly-sulfide
- Sulfur
- Sulfate
Source evidence: Table 1 and Figure 3, pages 5-6
Key reasoning: The synthesized mackinawite (FeSm) is highly sensitive to oxidation. When embedded, polished, and handled oxically during analysis, the FeS partially oxidizes, resulting in a significant fraction of sulfate alongside the remaining FeS.
Reasoning source: Results section, page 6
Scoring Rubric (total: 100 pts)
| Q | Type | Max | Question | Reference Answer | Scoring Criteria |
|---|---|---|---|---|---|
| q1 | identification | 30 | Based on the sample conditions (mackinawite embedded oxically), what candidate reference spectra are needed for linear combination fitting of its S K-edge XANES spectrum? | The candidate reference spectra needed for linear combination fitting of this sample's S K-edge XANES spectrum are FeS, Pyrite, Poly-sulfide, Sulfur, and Sulfate. These specific phases are required because the sample was initially precipitated as mackinawite (FeS) from ferrous ammonium sulfate and sodium sulfide at 25 °C under an N2 atmosphere. However, the sample was subsequently embedded and handled oxically. Because synthesized mackinawite is highly sensitive to oxidation, the oxic post-treatment necessitates a fitting basis that includes both the primary unoxidized FeS phase and its potential oxidation products, such as sulfate. | Full points for identifying FeS (mackinawite) and a sulfate reference (e.g., quenstedtite). |
| q2 | quantification | 40 | Estimate the phase fractions of the components in this sample. | The estimated phase fractions for this sample are 0.68 FeS and 0.37 Sulfate, with an uncertainty of 10%. These specific values result directly from the sample's synthesis and post-treatment conditions. The initial precipitation under an N2 atmosphere at 25 °C formed pure mackinawite, which accounts for the dominant 0.68 FeS fraction remaining in the sample. However, because mackinawite is highly sensitive to oxidation, the subsequent oxic embedding and handling caused the FeS to partially oxidize, resulting in the significant 0.37 fraction of sulfate. | Full points for estimating ~68% FeS and ~37% sulfate (or roughly a 2:1 ratio of FeS to sulfate, noting the sum may slightly exceed 1.0). |
| q3 | reasoning | 30 | Explain the physical reasoning for the presence of the secondary phase in this sample, given its synthesis conditions and post-treatment. | The presence of the secondary sulfate phase is a direct consequence of the sample's oxic post-treatment. The mackinawite (FeSm) was initially synthesized anaerobically via precipitation from 0.6 M ferrous ammonium sulfate and 0.6 M sodium sulfide at 25 °C under an N2 atmosphere. Despite this oxygen-free synthesis, the material is highly sensitive to oxidation. When the sample was subsequently embedded, polished, and handled oxically for analysis, this exposure to oxygen drove a partial oxidation mechanism, converting a significant portion of the primary FeS into sulfate. | Full points for explaining that mackinawite is highly sensitive to oxidation, and oxic handling/embedding leads to the partial oxidation of the initial sulfide phase to sulfate. |
Review
#1177
Mackinawite (FeSm)
S K
▶
LLM Prompt
Sample Information
Material: Mackinawite (FeSm)
Method: precipitation
Precursors: 0.6 M ferrous ammonium sulfate, 0.6 M sodium sulfide
Temperature C: 25
Atmosphere: N2
Post Treatment: Embedded anoxically
Sample-Specific Conditions
- Embedding: anoxically
- Mackinawite synthesized and embedded anoxically, end-member 80 from S K-edge XANES
Preparation
- Synthesized from solutions of 0.6 M ferrous ammonium sulfate and 0.6 M sodium sulfide. Equal volumes added via N2-purged syringes to a previously N2-purged and stoppered serum bottle under a slight vacuum (0.5 mbar). Precipitated immediately. Embedded anoxically.
Measurement
We plan to measure the S K XANES spectrum of this sample.
Questions
Based on all the information above:
1. Based on the synthesis and handling conditions (anoxic embedding of freshly precipitated mackinawite), what candidate reference spectra should be included in a linear combination fit of the S K-edge XANES spectrum?
2. Estimate the phase fractions of the sulfur-bearing species in this sample. Consider the effects of the anoxic embedding procedure on the final composition.
3. Explain why an oxidized phase is expected in this sample despite the anoxic embedding, and how its abundance would compare to a sample embedded under oxic conditions.
Ground Truth
Material: Mackinawite (FeSm)
Measurement: S K-edge XANES, fluorescence mode, Stanford Synchrotron Radiation Lightsource (SSRL) BL 14-3
Fit method: Linear Combination Fitting (LCF) of PCA-derived end-members
Phase fractions: (±15%)
| Phase | Fraction |
|---|---|
| FeS | 0.68 |
| Sulfate | 0.14 |
Fit basis (paper's reference spectra):
- FeS
- Pyrite
- Poly-sulfide
- Sulfur
- Sulfate
Source evidence: Table 1, page 5
Key reasoning: The synthesized mackinawite (FeSm) is highly sensitive to oxidation during embedding, polishing, and handling. Even when embedded anoxically in a glovebox, the sample still shows signs of oxidation, evidenced by the necessary inclusion of sulfate in the XANES fits. However, less sulfate was needed to fit the anoxically embedded samples compared to oxically embedded ones, indicating that the anoxic protection was partially successful.
Reasoning source: Results section, page 6 and Discussion section, page 8
Scoring Rubric (total: 100 pts)
| Q | Type | Max | Question | Reference Answer | Scoring Criteria |
|---|---|---|---|---|---|
| q1 | identification | 30 | Based on the synthesis and handling conditions (anoxic embedding of freshly precipitated mackinawite), what candidate reference spectra should be included in a linear combination fit of the S K-edge XANES spectrum? | The candidate reference spectra for the linear combination fit should include FeS, Pyrite, Poly-sulfide, Sulfur, and Sulfate. These specific phases are expected because the sample was synthesized as mackinawite (FeSm) via precipitation from ferrous ammonium sulfate and sodium sulfide at 25 °C under N2. Despite the anoxic embedding and N2 atmosphere, mackinawite is highly sensitive to oxidation during handling and polishing. Therefore, alongside the primary FeS phase, oxidized sulfur species like sulfate, as well as intermediate oxidation products like pyrite, poly-sulfide, and elemental sulfur, must be included to account for this unavoidable partial oxidation. | Full credit for identifying FeS (mackinawite) and an oxidized sulfur species like sulfate. Partial credit for missing sulfate or including unnecessary phases not relevant to this specific oxidation pathway. |
| q2 | quantification | 40 | Estimate the phase fractions of the sulfur-bearing species in this sample. Consider the effects of the anoxic embedding procedure on the final composition. | The estimated phase fractions for this sample are 0.68 FeS and 0.14 Sulfate, with an uncertainty of 15%. These specific values result from the inherent instability of freshly precipitated mackinawite at 25 °C. Although the sample was synthesized under N2 and embedded anoxically to preserve the primary FeS phase, it remains highly sensitive to oxidation during handling and polishing. As a result, a 0.14 fraction of sulfate is formed, which is lower than what would be observed in oxically embedded samples, demonstrating that the anoxic protection was partially successful but not absolute. | Full credit for estimating FeS as the dominant phase (~60-70%) and sulfate as a minor phase (~10-20%). Deduct points if sulfate is estimated to be higher than FeS, or if other phases like pyrite are incorrectly estimated as major components. |
| q3 | reasoning | 30 | Explain why an oxidized phase is expected in this sample despite the anoxic embedding, and how its abundance would compare to a sample embedded under oxic conditions. | An oxidized phase is expected because synthesized mackinawite (FeSm) is extremely sensitive to oxidation during embedding, polishing, and handling. Even though the precipitation occurred under N2 using purged precursors and the sample was embedded anoxically, these steps cannot completely halt oxidation. Consequently, sulfate emerges as a necessary component in the XANES fits to account for this structural degradation. However, because the anoxic embedding provided partial protection, the abundance of this oxidized sulfate phase is lower than what would be required to fit a sample embedded under oxic conditions. | Full credit for explaining that mackinawite is highly sensitive to oxidation during handling/polishing, leading to sulfate formation, but that anoxic embedding reduces the extent of oxidation (less sulfate) compared to oxic embedding. |
Review
#1178
Mackinawite (FeSm)
S K
▶
LLM Prompt
Sample Information
Material: Mackinawite (FeSm)
Method: precipitation
Precursors: 0.6 M ferrous ammonium sulfate, 0.6 M sodium sulfide
Temperature C: 25
Atmosphere: N2
Post Treatment: Embedded anoxically
Sample-Specific Conditions
- Embedding: anoxically
- Mackinawite synthesized and embedded anoxically, end-member 88 from S K-edge XANES
Preparation
- Synthesized from solutions of 0.6 M ferrous ammonium sulfate and 0.6 M sodium sulfide. Equal volumes added via N2-purged syringes to a previously N2-purged and stoppered serum bottle under a slight vacuum (0.5 mbar). Precipitated immediately. Embedded anoxically.
Measurement
We plan to measure the S K XANES spectrum of this sample.
Questions
Based on all the information above:
1. Based on the synthesis and handling conditions (anoxic embedding after prolonged storage), what reference spectra should be included in a linear combination fit of the S K-edge XANES data?
2. Estimate the relative fractions of the sulfur-bearing phases in this sample.
3. Provide a physical reasoning for the presence of multiple sulfur phases in this sample, specifically addressing why it is not pure mackinawite despite the anoxic embedding.
Ground Truth
Material: Mackinawite (FeSm)
Measurement: S K-edge XANES, fluorescence mode, SSRL BL 14-3
Fit method: Linear combination fitting of PCA-derived end-members
Phase fractions: (±15%)
| Phase | Fraction |
|---|---|
| FeS | 0.47 |
| Poly-sulfide | 0.22 |
| Sulfate | 0.21 |
Fit basis (paper's reference spectra):
- FeS
- Pyrite
- Poly-sulfide
- Sulfur
- Sulfate
Source evidence: Table 1, page 5; Figure 3, page 6
Key reasoning: Synthesized mackinawite (FeSm) is highly sensitive to oxidation during handling and analysis. Even with anoxic embedding, the sample showed signs of oxidation, requiring sulfate and polysulfide for a good fit. The anoxic embedding was partially successful, as less sulfate was needed compared to oxically embedded samples. The polysulfide likely resulted from sample hydration during prolonged storage (one year) prior to embedding, despite being kept under dry N2.
Reasoning source: Results (page 6) and Discussion (page 8)
Scoring Rubric (total: 100 pts)
| Q | Type | Max | Question | Reference Answer | Scoring Criteria |
|---|---|---|---|---|---|
| q1 | identification | 30 | Based on the synthesis and handling conditions (anoxic embedding after prolonged storage), what reference spectra should be included in a linear combination fit of the S K-edge XANES data? | The linear combination fit of the S K-edge XANES data should include FeS, Pyrite, Poly-sulfide, Sulfur, and Sulfate reference spectra. Although the sample was synthesized as mackinawite (FeSm) via precipitation under an N2 atmosphere, this material is highly sensitive to oxidation during handling and analysis. The inclusion of oxidized and hydrated references like sulfate and poly-sulfide is necessary because the sample degraded during its prolonged one-year storage prior to embedding. Even though it was kept under dry N2 and embedded anoxically, these protective measures were only partially successful, necessitating a multi-component fit basis to capture the resulting mixed sulfur species. | Full points for identifying FeS (mackinawite), polysulfide, and sulfate. Deduct points for missing phases or including unlikely phases like pyrite (which didn't form under these specific conditions). |
| q2 | quantification | 40 | Estimate the relative fractions of the sulfur-bearing phases in this sample. | The relative fractions of the sulfur-bearing phases in this sample are 0.47 for FeS, 0.22 for poly-sulfide, and 0.21 for sulfate, with an uncertainty of 15%. The FeS fraction (0.47) represents the surviving mackinawite originally precipitated at 25 °C from 0.6 M ferrous ammonium sulfate and 0.6 M sodium sulfide precursors. The significant sulfate fraction (0.21) arises because the anoxic embedding was only partially successful at preventing oxidation during handling, although it successfully limited sulfate formation compared to oxically embedded samples. Finally, the poly-sulfide fraction (0.22) formed as a result of sample hydration during the prolonged one-year storage period prior to embedding, despite being kept under dry N2. | Full points for estimating FeS ~47%, Polysulfide ~22%, and Sulfate ~21%. Allow ±10% absolute deviation for each phase. |
| q3 | reasoning | 30 | Provide a physical reasoning for the presence of multiple sulfur phases in this sample, specifically addressing why it is not pure mackinawite despite the anoxic embedding. | The presence of multiple sulfur phases rather than pure mackinawite is driven by the extreme sensitivity of the precipitated FeSm to oxidation and hydration over time. Although the sample was synthesized under strictly anoxic conditions using N2-purged syringes and serum bottles, it was subjected to prolonged storage for one year prior to embedding. During this storage period under dry N2, the sample underwent hydration, which mechanistically led to the formation of the poly-sulfide phase. Furthermore, the anoxic embedding and handling procedures were only partially successful at preventing trace oxygen exposure, resulting in the partial oxidation of the mackinawite into sulfate. Consequently, the final XANES spectrum reflects a mixture of the original FeS, hydration-induced poly-sulfides, and oxidation-induced sulfates. | Must mention that mackinawite is highly sensitive to oxidation. Must note that while anoxic embedding reduced oxidation (less sulfate) compared to air, some oxidation still occurred. Must mention that polysulfide likely formed due to sample hydration during prolonged storage prior to embedding. |
Review
#1179
Pyrite
S K
▶
LLM Prompt
Sample Information
Material: Pyrite
Method: sulfur oxidation
Precursors: FeSm, orthorhombic sulfur, phthalate buffer
Temperature C: 65
Duration Hours: 336
Atmosphere: N2
Sample-Specific Conditions
- Synthesis method: sulfur oxidation
- Pyrite synthesized via sulfur oxidation, end-member 8 from S K-edge XANES
Preparation
- Dried FeSm was resuspended with pH 6 anoxic phthalate buffer. Orthorhombic sulfur was added. Incubated at 65 °C for 2 weeks.
Measurement
We plan to measure the S K XANES spectrum of this sample.
Questions
Based on all the information above:
1. Based on the synthesis conditions (sulfur oxidation of FeSm at 65 °C for 2 weeks), what are the expected major and minor phases in the product, and what are their approximate phase fractions?
2. What reference spectra should be included in a linear combination fit of the S K-edge XANES spectrum for this sample to account for all potential sulfur species?
Ground Truth
Material: Pyrite
Measurement: S K-edge micro-XANES, fluorescence mode, SSRL BL14-3
Fit method: Linear combination fitting (LCF) of end-member spectra derived from PCA
Phase fractions: (±10%)
| Phase | Fraction |
|---|---|
| FeS | 0.2 |
| Pyrite | 0.74 |
| Sulfate | 0.05 |
Fit basis (paper's reference spectra):
- FeS
- Pyrite
- Poly-sulfide
- Sulfur
- Sulfate
Source evidence: Table 1, page 5
Key reasoning: The sulfur oxidation method successfully formed pyrite from the FeSm precursor, making it the dominant phase. However, the reaction was incomplete after 2 weeks, leaving residual FeS. The minor sulfate component is likely an artifact of oxidation during sample embedding, storage, or analysis.
Reasoning source: Discussion section, page 9
Scoring Rubric (total: 100 pts)
| Q | Type | Max | Question | Reference Answer | Scoring Criteria |
|---|---|---|---|---|---|
| q1 | quantification | 57 | Based on the synthesis conditions (sulfur oxidation of FeSm at 65 °C for 2 weeks), what are the expected major and minor phases in the product, and what are their approximate phase fractions? | The expected major phase in the product is pyrite at a fraction of 0.74, with minor phases of FeS at 0.20 and sulfate at 0.05, subject to a 10% uncertainty. These specific fractions arise because the sulfur oxidation of the FeSm precursor at 65 °C successfully drove the formation of pyrite as the dominant material. However, the 2-week (336-hour) incubation period was not long enough for the reaction to reach completion, resulting in the 20% residual FeS fraction. Finally, the 5% sulfate fraction is expected not from the anoxic N2 synthesis itself, but as an artifact of oxidation during subsequent sample embedding, storage, or analysis. | Full points for identifying Pyrite as the major phase (~74%) and FeS (~20%) and Sulfate (~5%) as minor phases. Partial credit for identifying the correct phases without accurate fractions. |
| q2 | identification | 43 | What reference spectra should be included in a linear combination fit of the S K-edge XANES spectrum for this sample to account for all potential sulfur species? | The linear combination fitting basis for this S K-edge XANES spectrum should include FeS, pyrite, poly-sulfide, sulfur, and sulfate. These specific reference phases are required based on the precursors and the sulfur oxidation synthesis method used at 65 °C. Pyrite is expected as the primary reaction product, while FeS and sulfur account for the initial precursors that may remain unreacted after the 2-week incubation. Poly-sulfide is included as a relevant species in the sulfur oxidation process, and sulfate must be included to account for unintended oxidation artifacts introduced during sample embedding, storage, or measurement. | Full points for listing FeS, Pyrite, Poly-sulfide, Sulfur, and Sulfate as the necessary basis set. |
Review
#1180
Pyrite
S K
▶
LLM Prompt
Sample Information
Material: Pyrite
Method: sulfur oxidation
Precursors: FeSm, orthorhombic sulfur, phthalate buffer
Temperature C: 65
Duration Hours: 336
Atmosphere: N2
Sample-Specific Conditions
- Synthesis method: sulfur oxidation
- Pyrite synthesized via sulfur oxidation, end-member 10 from S K-edge XANES
Preparation
- Dried FeSm was resuspended with pH 6 anoxic phthalate buffer. Orthorhombic sulfur was added. Incubated at 65 °C for 2 weeks.
Measurement
We plan to measure the S K XANES spectrum of this sample.
Questions
Based on all the information above:
1. Based on the synthesis conditions (sulfur oxidation of FeSm at 65 °C for 2 weeks), what candidate reference spectra should be included in a linear combination fitting analysis of the S K-edge XANES spectrum?
2. Estimate the phase fractions of the components in this sample based on S K-edge XANES.
Ground Truth
Material: Pyrite
Measurement: S K-edge XANES at SSRL BL 14-3
Fit method: Linear combination fitting of PCA-derived end-members
Phase fractions: (±10%)
| Phase | Fraction |
|---|---|
| FeS | 0.06 |
| Pyrite | 0.78 |
| Sulfate | 0.11 |
Fit basis (paper's reference spectra):
- FeS
- Pyrite
- Poly-sulfide
- Sulfur
- Sulfate
Source evidence: Table 1, page 5
Key reasoning: The sulfur oxidation method successfully converts the mackinawite (FeSm) precursor to pyrite, which is the dominant phase. Minor residual FeS remains due to incomplete reaction. The presence of sulfate is likely an artifact reflecting oxidation during sample mounting and/or analysis.
Reasoning source: Discussion section, page 9
Scoring Rubric (total: 100 pts)
| Q | Type | Max | Question | Reference Answer | Scoring Criteria |
|---|---|---|---|---|---|
| q1 | identification | 43 | Based on the synthesis conditions (sulfur oxidation of FeSm at 65 °C for 2 weeks), what candidate reference spectra should be included in a linear combination fitting analysis of the S K-edge XANES spectrum? | The candidate reference spectra for linear combination fitting should include FeS, Pyrite, Poly-sulfide, Sulfur, and Sulfate. These phases are expected because the synthesis involves the sulfur oxidation of a mackinawite (FeSm) precursor with orthorhombic sulfur at 65 °C for 336 hours. Under these conditions, the FeSm precursor is expected to convert into pyrite, making it the primary target phase. FeS, sulfur, and poly-sulfide references are necessary to account for unreacted precursors or intermediate species from an incomplete reaction. Finally, a sulfate reference must be included to account for potential artifactual oxidation that can occur during sample mounting or analysis. | Full points for identifying pyrite (the expected product), FeS (the precursor), and sulfate (a common oxidation product). Partial credit for missing one. |
| q2 | quantification | 57 | Estimate the phase fractions of the components in this sample based on S K-edge XANES. | Based on the S K-edge XANES analysis, the estimated phase fractions are 0.78 Pyrite, 0.06 FeS, and 0.11 Sulfate, with an uncertainty of 10%. These specific values result from the sulfur oxidation synthesis method, where incubating FeSm and orthorhombic sulfur at 65 °C for 2 weeks successfully converts the majority of the precursor into the dominant pyrite phase (78%). The small fraction of FeS (6%) remains due to the incomplete reaction of the mackinawite precursor over the 336-hour duration. Meanwhile, the 11% sulfate fraction does not originate from the anoxic N2 synthesis conditions, but rather arises as an artifact reflecting oxidation during sample mounting and/or analysis. | Full points for estimating Pyrite at ~75-80%, Sulfate at ~10%, and FeS at <10%. Deduct points for estimates outside a 10% absolute error margin. |
Review
#1181
Co-doped Mackinawite (FeSm)
S K
▶
LLM Prompt
Sample Information
Material: Co-doped Mackinawite (FeSm)
Method: precipitation
Precursors: 0.6 M ferrous ammonium sulfate, 0.6 M sodium sulfide, CoCl2·6H2O
Temperature C: 25
Atmosphere: N2
Sample-Specific Conditions
- Dopant: Co
- Co-doped mackinawite, end-member 21 from S K-edge XANES
Preparation
- Synthesized from 0.6 M ferrous ammonium sulfate, 0.6 M sodium sulfide, and CoCl2·6H2O (2000 µM Co) under N2.
Measurement
We plan to measure the S K XANES spectrum of this sample.
Questions
Based on all the information above:
1. What candidate reference spectra should be included in the linear combination fitting (LCF) basis for this Co-doped mackinawite sample, considering both the intended synthesis product and potential handling artifacts?
2. Based on the synthesis conditions and typical handling artifacts for mackinawite, estimate the phase fractions of the primary product and any secondary phases.
Ground Truth
Material: Co-doped Mackinawite (FeSm)
Measurement: S K-edge XANES at SSRL BL 14-3 or 2-3
Fit method: Linear combination fitting of PCA-derived end-members
Phase fractions: (±10%)
| Phase | Fraction |
|---|---|
| FeS | 0.8 |
| Sulfate | 0.1 |
Fit basis (paper's reference spectra):
- FeS
- Pyrite
- Poly-sulfide
- Sulfur
- Sulfate
Source evidence: Table 1, page 5
Key reasoning: The sample is primarily mackinawite (FeS) synthesized with Co. The presence of sulfate (0.10) indicates that the synthesized FeSm was highly sensitive to oxidation during embedding, polishing, and oxic handling during analysis, despite efforts to maintain anoxic conditions.
Reasoning source: Results section, page 6
Scoring Rubric (total: 100 pts)
| Q | Type | Max | Question | Reference Answer | Scoring Criteria |
|---|---|---|---|---|---|
| q1 | identification | 43 | What candidate reference spectra should be included in the linear combination fitting (LCF) basis for this Co-doped mackinawite sample, considering both the intended synthesis product and potential handling artifacts? | The linear combination fitting (LCF) basis for this sample should include FeS, Pyrite, Poly-sulfide, Sulfur, and Sulfate reference spectra. These specific phases are expected because the sample was synthesized via precipitation from ferrous ammonium sulfate and sodium sulfide under an N2 atmosphere at 25 °C, which primarily forms the intended mackinawite (FeS) product. However, despite the anoxic synthesis conditions, mackinawite is highly sensitive to oxidation. Therefore, oxidized sulfur species such as sulfate, along with intermediate oxidation products like pyrite, poly-sulfide, and elemental sulfur, must be included to account for potential oxidation artifacts introduced during embedding, polishing, or oxic handling. | Full points for identifying FeS (mackinawite) and an oxidized sulfur species like sulfate. Partial points for missing the oxidation product. |
| q2 | quantification | 57 | Based on the synthesis conditions and typical handling artifacts for mackinawite, estimate the phase fractions of the primary product and any secondary phases. | The estimated phase fractions for this sample are 0.8 (80%) FeS and 0.1 (10%) Sulfate, with an uncertainty of 10%. The high fraction of FeS results directly from the precipitation synthesis using ferrous ammonium sulfate, sodium sulfide, and CoCl2·6H2O at 25 °C under an N2 atmosphere, which is designed to yield Co-doped mackinawite as the primary product. The 0.1 fraction of sulfate arises because the synthesized FeSm is highly sensitive to oxidation. Despite the initial anoxic N2 conditions, this secondary sulfate phase forms due to unavoidable oxic exposure during sample embedding, polishing, and handling prior to or during the S K-edge XANES measurement. | Full points for estimating FeS as the dominant phase (~80%) and sulfate as a minor secondary phase (~10%). Deduct points if the primary phase is incorrect or if oxidation products are not accounted for. |
Review
#1182
Co-doped Mackinawite (FeSm)
S K
▶
LLM Prompt
Sample Information
Material: Co-doped Mackinawite (FeSm)
Method: precipitation
Precursors: 0.6 M ferrous ammonium sulfate, 0.6 M sodium sulfide, CoCl2·6H2O
Temperature C: 25
Atmosphere: N2
Sample-Specific Conditions
- Dopant: Co
- Co-doped mackinawite, end-member 25 from S K-edge XANES
Preparation
- Synthesized from 0.6 M ferrous ammonium sulfate, 0.6 M sodium sulfide, and CoCl2·6H2O (2000 µM Co) under N2.
Measurement
We plan to measure the S K XANES spectrum of this sample.
Questions
Based on all the information above:
1. What candidate reference spectra should be included in a linear combination fitting (LCF) analysis of the S K-edge XANES spectrum for this sample to account for both the intended product and potential artifacts?
2. Based on the synthesis conditions and the known reactivity of nanoparticulate iron sulfides, estimate the phase fractions of the sulfur-bearing components in this sample.
3. Provide a physical reasoning for why multiple sulfur phases, including oxidized species, are detected in this sample despite it being synthesized as a single phase (mackinawite) under an N2 atmosphere.
Ground Truth
Material: Co-doped Mackinawite (FeSm)
Measurement: S K-edge XANES, fluorescence mode, SSRL BL 14-3
Fit method: Linear Combination Fitting (LCF) of PCA-derived end-members
Phase fractions: (±15%)
| Phase | Fraction |
|---|---|
| FeS | 0.29 |
| Poly-sulfide | 0.16 |
| Sulfate | 0.32 |
Fit basis (paper's reference spectra):
- FeS
- Pyrite
- Poly-sulfide
- Sulfur
- Sulfate
Source evidence: Table 1 and Figure 2a, page 5
Key reasoning: Although synthesized under anoxic conditions, the Co-doped mackinawite sample contains significant amounts of sulfate and polysulfide. This indicates that the synthesized FeSm is highly sensitive to oxidation, which likely occurred during sample embedding, polishing, or handling for microscale analysis despite efforts to maintain an oxygen-free environment.
Reasoning source: Results section, 'Characteristics of synthesized minerals', page 6
Scoring Rubric (total: 100 pts)
| Q | Type | Max | Question | Reference Answer | Scoring Criteria |
|---|---|---|---|---|---|
| q1 | identification | 30 | What candidate reference spectra should be included in a linear combination fitting (LCF) analysis of the S K-edge XANES spectrum for this sample to account for both the intended product and potential artifacts? | The candidate reference spectra for the LCF analysis should include FeS, Pyrite, Poly-sulfide, Sulfur, and Sulfate. These specific phases are necessary because the sample was synthesized as Co-doped mackinawite (FeSm) via precipitation at 25 °C under an N2 atmosphere, which yields a highly reactive material. Despite the anoxic synthesis conditions, this material is extremely sensitive to oxidation that likely occurs during sample embedding, polishing, or handling. Therefore, the fit basis must account for both the intended FeS product and the resulting oxidized artifacts like sulfate and polysulfide. | Full points for identifying FeS (mackinawite), sulfate, and polysulfide as the necessary reference spectra. |
| q2 | quantification | 40 | Based on the synthesis conditions and the known reactivity of nanoparticulate iron sulfides, estimate the phase fractions of the sulfur-bearing components in this sample. | The estimated phase fractions for this sample are 0.29 for FeS, 0.16 for Poly-sulfide, and 0.32 for Sulfate, with an uncertainty of 15%. These specific values result from the high reactivity of the Co-doped mackinawite synthesized via precipitation at 25 °C. Even though the precursors were reacted under a strict N2 atmosphere, the sample is highly sensitive to oxidation during subsequent handling, embedding, or polishing for microscale analysis. This unintended oxidation explains why the intended FeS phase is reduced to a minor fraction (29%), while oxidized sulfur species like sulfate and polysulfide constitute a large portion of the sample. | Full points for estimating FeS (~0.29), sulfate (~0.32), and polysulfide (~0.16). Partial points for correctly predicting a mixture of the primary sulfide and significant oxidized species (sulfate/polysulfide) in roughly comparable amounts. |
| q3 | reasoning | 30 | Provide a physical reasoning for why multiple sulfur phases, including oxidized species, are detected in this sample despite it being synthesized as a single phase (mackinawite) under an N2 atmosphere. | Multiple sulfur phases are detected because the synthesized Co-doped mackinawite (FeSm) is highly sensitive to oxidation. The sample was prepared via precipitation from ferrous ammonium sulfate, sodium sulfide, and CoCl2 at 25 °C under a strict N2 atmosphere to form a pure FeS phase. However, despite these initial anoxic conditions, the resulting material remains highly reactive to trace oxygen. Consequently, unintended oxidation likely occurred during subsequent sample embedding, polishing, or handling for microscale analysis. This handling-induced oxidation explains the transformation of the intended single-phase mackinawite into a mixture containing significant amounts of oxidized species like sulfate and polysulfide. | Full points for explaining that mackinawite is highly sensitive to oxidation, and that oxidized species like sulfate and polysulfide likely formed as artifacts during sample embedding, polishing, or handling for analysis. |
Review
#1183
Co-doped FeSm treated with H2S
S K
▶
LLM Prompt
Sample Information
Material: Co-doped FeSm treated with H2S
Method: H2S oxidation
Precursors: Co-doped FeSm, Na2S (pH 6), Ti(III) citrate, phthalate buffer
Temperature C: 80
Duration Hours: 96
Atmosphere: N2
Sample-Specific Conditions
- Treatment: H2S oxidation
- Co-doped mackinawite treated with H2S, end-member 23 from S K-edge XANES
Preparation
- Dry Co-doped FeSm was weighed into a glass headspace vial. Phthalate buffer, Ti(III) citrate solution, and Na2S solution (adjusted to pH 6 to form H2S) were introduced via syringes. Incubated at 80 °C for 4 days.
Measurement
We plan to measure the S K XANES spectrum of this sample.
Questions
Based on all the information above:
1. Based on the synthesis conditions (Co-doped mackinawite treated with H2S at 80 °C for 4 days), what are the expected major and minor phases present in the sample, and what are their approximate fractions?
2. What reference spectra should be included in a linear combination fitting (LCF) basis to properly model the S K-edge XANES spectrum of this sample?
3. Explain why the H2S oxidation treatment of Co-doped mackinawite under these conditions results in the observed phase composition rather than forming pyrite.
Ground Truth
Material: Co-doped FeSm treated with H2S
Measurement: S K-edge XANES, fluorescence mode, SSRL BL 14-3
Fit method: Linear combination fitting of PCA-derived end-members
Phase fractions: (±10%)
| Phase | Fraction |
|---|---|
| FeS | 0.88 |
| Sulfate | 0.11 |
Fit basis (paper's reference spectra):
- FeS
- Pyrite
- Poly-sulfide
- Sulfur
- Sulfate
Source evidence: Table 1 and Page 6 text
Key reasoning: The H2S oxidation pathway failed to produce pyrite from FeSm synthesized with Co. The presence of Co impedes the transformation of FeSm to pyrite via this pathway, leaving mostly unreacted FeS (mackinawite). The minor sulfate component is likely due to slight oxidation during sample handling, embedding, or analysis.
Reasoning source: Results (page 6) and Discussion (pages 8-9)
Scoring Rubric (total: 100 pts)
| Q | Type | Max | Question | Reference Answer | Scoring Criteria |
|---|---|---|---|---|---|
| q1 | quantification | 30 | Based on the synthesis conditions (Co-doped mackinawite treated with H2S at 80 °C for 4 days), what are the expected major and minor phases present in the sample, and what are their approximate fractions? | The expected major phase is FeS (mackinawite) at a fraction of approximately 0.88, and the minor phase is sulfate at approximately 0.11, with an uncertainty of 10%. These specific fractions result from the sample conditions because the presence of Co in the Co-doped FeSm precursor impedes the transformation of mackinawite to pyrite via the H2S oxidation pathway at 80 °C. Consequently, the 96-hour treatment leaves predominantly unreacted FeS. The minor 11% sulfate fraction does not arise from the anaerobic N2 synthesis itself, but is likely due to slight oxidation occurring during subsequent sample handling, embedding, or analysis. | Full points for identifying FeS (mackinawite) as the dominant phase (~88%) and a minor oxidized phase like sulfate (~11%). Deduct points if pyrite is predicted as a major phase. |
| q2 | identification | 30 | What reference spectra should be included in a linear combination fitting (LCF) basis to properly model the S K-edge XANES spectrum of this sample? | The linear combination fitting (LCF) basis should include reference spectra for FeS, Pyrite, Poly-sulfide, Sulfur, and Sulfate. These specific references are necessary to capture both the expected reaction products and potential intermediates or artifacts of the H2S oxidation treatment on Co-doped FeSm at 80 °C. Although the Co-doping impedes the H2S oxidation pathway and prevents pyrite formation, pyrite and intermediate sulfur species (poly-sulfide, elemental sulfur) must be included in the basis to verify the lack of transformation. Furthermore, the sulfate reference is required because the sample is susceptible to slight oxidation during handling or analysis, which introduces a minor sulfate component into the final spectrum. | Full points for listing FeS (mackinawite) and sulfate. Additional points for including other potential sulfur species like pyrite, elemental sulfur, or polysulfides as candidate references to rule out their formation. |
| q3 | reasoning | 40 | Explain why the H2S oxidation treatment of Co-doped mackinawite under these conditions results in the observed phase composition rather than forming pyrite. | The H2S oxidation treatment of Co-doped mackinawite at 80 °C for 4 days results in a composition of 88% FeS and 11% sulfate because the H2S oxidation pathway fails to produce pyrite in this specific system. The presence of the Co dopant in the FeSm precursor fundamentally impedes the structural transformation from mackinawite to pyrite that would normally occur under these conditions. As a result, the reaction stalls, leaving predominantly unreacted FeS (mackinawite) despite the prolonged 96-hour incubation with Na2S at pH 6. The remaining 11% of the composition is sulfate, which forms not from the primary anaerobic reaction, but likely due to slight unintended oxidation during sample handling, embedding, or analysis. | Full points for explaining that the presence of Co inhibits/impedes the transformation of FeSm to pyrite via the H2S oxidation pathway, resulting in mostly unreacted mackinawite (FeS). Mentioning that minor sulfate is an artifact of handling/oxidation is a plus. |
Review
#1184
Co-doped FeSm treated with H2S
S K
▶
LLM Prompt
Sample Information
Material: Co-doped FeSm treated with H2S
Method: H2S oxidation
Precursors: Co-doped FeSm, Na2S (pH 6), Ti(III) citrate, phthalate buffer
Temperature C: 80
Duration Hours: 96
Atmosphere: N2
Sample-Specific Conditions
- Treatment: H2S oxidation
- Co-doped mackinawite treated with H2S, end-member 24 from S K-edge XANES
Preparation
- Dry Co-doped FeSm was weighed into a glass headspace vial. Phthalate buffer, Ti(III) citrate solution, and Na2S solution (adjusted to pH 6 to form H2S) were introduced via syringes. Incubated at 80 °C for 4 days.
Measurement
We plan to measure the S K XANES spectrum of this sample.
Questions
Based on all the information above:
1. Based on the synthesis conditions (Co-doped FeSm treated with H2S at 80 °C for 4 days), what are the expected primary sulfur-bearing phases and their approximate fractions in the resulting solid?
2. What reference spectra should be included in a linear combination fitting (LCF) analysis of the S K-edge XANES for this sample to account for potential reactants, products, and handling artifacts?
Ground Truth
Material: Co-doped FeSm treated with H2S
Measurement: S K-edge XANES, fluorescence mode, SSRL BL 14-3
Fit method: Linear combination fitting of PCA-derived end-members
Phase fractions: (±15%)
| Phase | Fraction |
|---|---|
| FeS | 0.66 |
| Sulfate | 0.11 |
Fit basis (paper's reference spectra):
- FeS
- Pyrite
- Poly-sulfide
- Sulfur
- Sulfate
Source evidence: Table 1 and text on page 6
Key reasoning: The H2S oxidation pathway failed to produce pyrite from Co-doped FeSm. This supports previous findings that unoxidized (N2-dried) mackinawite reacts very slowly or not at all with H2S to form pyrite at low temperatures, and the addition of Co does not facilitate this pathway. Consequently, the sample remains predominantly FeS. The minor sulfate detected is an artifact of oxidation during sample embedding, polishing, or handling.
Reasoning source: Page 6, 'Trace element additions' section and Page 9, 'Discussion' section
Scoring Rubric (total: 100 pts)
| Q | Type | Max | Question | Reference Answer | Scoring Criteria |
|---|---|---|---|---|---|
| q1 | prediction | 54 | Based on the synthesis conditions (Co-doped FeSm treated with H2S at 80 °C for 4 days), what are the expected primary sulfur-bearing phases and their approximate fractions in the resulting solid? | The expected primary sulfur-bearing phase is FeS at a fraction of approximately 0.66, alongside a minor sulfate component at approximately 0.11 (with a 15% uncertainty). These specific fractions result from the fact that the H2S oxidation pathway fails to produce pyrite from the Co-doped FeSm precursor under these conditions. Specifically, unoxidized (N2-dried) mackinawite reacts very slowly or not at all with H2S at the low temperature of 80 °C, and the addition of cobalt does not facilitate this pathway, leaving the sample predominantly as unreacted FeS. The minor 0.11 sulfate fraction is not a reaction product, but rather an artifact of unintended oxidation occurring during sample embedding, polishing, or handling. | Full credit for identifying FeS (mackinawite) as the dominant phase (~66%) and noting the absence of pyrite. Partial credit for mentioning minor oxidized species like sulfate (~11%) due to handling. |
| q2 | identification | 46 | What reference spectra should be included in a linear combination fitting (LCF) analysis of the S K-edge XANES for this sample to account for potential reactants, products, and handling artifacts? | A linear combination fitting (LCF) analysis for this sample should include reference spectra for FeS, Pyrite, Poly-sulfide, Sulfur, and Sulfate. These specific phases are chosen to account for the precursor, potential reaction products, and experimental artifacts associated with the 80 °C H2S treatment. FeS is required to identify the unreacted Co-doped mackinawite precursor, which remains dominant because unoxidized mackinawite fails to react with H2S to form pyrite at this low temperature. Pyrite, poly-sulfide, and sulfur references are necessary to probe for any intermediate or final products of the attempted H2S oxidation pathway. Finally, a sulfate reference must be included to quantify handling artifacts, as the sample is prone to oxidation during embedding and polishing. | Full credit for listing FeS (mackinawite), pyrite, elemental sulfur, poly-sulfide, and a sulfate standard (e.g., quenstedtite). |
Review
#1185
Co-doped Pyrite
S K
▶
LLM Prompt
Sample Information
Material: Co-doped Pyrite
Method: sulfur oxidation
Precursors: Co-doped FeSm, orthorhombic sulfur, phthalate buffer
Temperature C: 65
Duration Hours: 336
Atmosphere: N2
Sample-Specific Conditions
- Dopant: Co
- Co-doped pyrite synthesized via sulfur oxidation, end-member 4 from S K-edge XANES
Preparation
- Co-doped FeSm reacted with orthorhombic sulfur in pH 6 anoxic phthalate buffer at 65 °C for 2 weeks.
Measurement
We plan to measure the S K XANES spectrum of this sample.
Questions
Based on all the information above:
1. Based on the synthesis conditions (sulfur oxidation of Co-doped FeSm at 65 °C for 2 weeks), what candidate phases are expected in the final product, and what are their estimated fractions?
2. What reference spectra are required to construct a linear combination fitting (LCF) basis for the S K-edge XANES spectrum of this sample?
Ground Truth
Material: Co-doped Pyrite
Measurement: S K-edge XANES, fluorescence mode, SSRL beamline 14-3
Fit method: Principal Component Analysis (PCA) followed by Linear Combination Fitting (LCF) of end-members
Phase fractions: (±15%)
| Phase | Fraction |
|---|---|
| FeS | 0.12 |
| Pyrite | 0.63 |
| Poly-sulfide | 0.22 |
Fit basis (paper's reference spectra):
- FeS
- Pyrite
- Poly-sulfide
- Sulfur
- Sulfate
Source evidence: Table 1, page 5
Key reasoning: Pyrite was synthesized via the sulfur oxidation method, where elemental sulfur reacts with water to form polysulfides, which then react with the FeSm precursor to form pyrite. The presence of the Co dopant impeded the reaction of FeSm to pyrite over the 2-week time course, resulting in an incomplete transformation. Consequently, the final product contains the target pyrite phase along with residual unreacted precursor (FeS) and intermediate species (polysulfide).
Reasoning source: Discussion section, page 9
Scoring Rubric (total: 100 pts)
| Q | Type | Max | Question | Reference Answer | Scoring Criteria |
|---|---|---|---|---|---|
| q1 | quantification | 67 | Based on the synthesis conditions (sulfur oxidation of Co-doped FeSm at 65 °C for 2 weeks), what candidate phases are expected in the final product, and what are their estimated fractions? | The expected phases in the final product are Pyrite (0.63), Poly-sulfide (0.22), and FeS (0.12), with an uncertainty of 15%. These specific fractions result from the sulfur oxidation synthesis method at 65 °C, where elemental sulfur reacts with water to form polysulfide intermediates, which subsequently react with the Co-doped FeSm precursor to form pyrite. The presence of the Co dopant impeded the complete conversion of FeSm to pyrite over the 2-week (336 hours) duration. Consequently, the reaction remained incomplete, yielding a mixture dominated by the target pyrite phase (63%) but retaining significant amounts of the unreacted FeS precursor (12%) and polysulfide intermediates (22%). | Full points if the answer identifies Pyrite, FeS, and polysulfide as the main phases and estimates their fractions within ±15% of the ground truth (Pyrite ~63%, FeS ~12%, polysulfide ~22%). Partial credit for identifying the correct phases without accurate fractions. |
| q2 | identification | 33 | What reference spectra are required to construct a linear combination fitting (LCF) basis for the S K-edge XANES spectrum of this sample? | To construct the LCF basis for the S K-edge XANES spectrum, reference spectra for FeS, Pyrite, Poly-sulfide, Sulfur, and Sulfate are required. These specific reference phases are necessary because the sample was synthesized via the sulfur oxidation method, where orthorhombic sulfur reacts in an anoxic phthalate buffer at 65 °C to form polysulfide intermediates that react with the Co-doped FeSm precursor. Because the Co dopant impeded the reaction over the 2-week synthesis period, the transformation to the target pyrite phase was incomplete. Therefore, the fitting basis must account for the target product (pyrite), the initial precursors (sulfur, FeS), intermediate species (poly-sulfide), and potential oxidized species (sulfate) to accurately model the final composition. | Full points if the answer lists FeS, Pyrite, and polysulfide as the necessary reference spectra for the LCF basis. |
Review
#1186
Co-doped Pyrite
S K
▶
LLM Prompt
Sample Information
Material: Co-doped Pyrite
Method: sulfur oxidation
Precursors: Co-doped FeSm, orthorhombic sulfur, phthalate buffer
Temperature C: 65
Duration Hours: 336
Atmosphere: N2
Sample-Specific Conditions
- Dopant: Co
- Co-doped pyrite synthesized via sulfur oxidation, end-member 7 from S K-edge XANES
Preparation
- Co-doped FeSm reacted with orthorhombic sulfur in pH 6 anoxic phthalate buffer at 65 °C for 2 weeks.
Measurement
We plan to measure the S K XANES spectrum of this sample.
Questions
Based on all the information above:
1. Based on the synthesis conditions (Co-doped FeSm reacted with orthorhombic sulfur at 65 °C), what candidate reference spectra should be included in the basis set for Linear Combination Fitting of the S K-edge XANES data?
2. Estimate the phase fractions of the dominant sulfur-bearing species in this specific sulfur-rich end-member (EM 7) of the Co-doped product.
Ground Truth
Material: Co-doped Pyrite
Measurement: S K-edge XANES, fluorescence mode, SSRL beamline 14-3
Fit method: Linear Combination Fitting (LCF) of PCA-derived end-members
Phase fractions: (±15%)
| Phase | Fraction |
|---|---|
| Pyrite | 0.29 |
| Sulfur | 0.69 |
Fit basis (paper's reference spectra):
- FeS
- Pyrite
- Poly-sulfide
- Sulfur
- Sulfate
Source evidence: Table 1, page 5
Key reasoning: Pyrite was successfully synthesized through the oxidation of FeSm with elemental sulfur. However, the reaction of FeSm to pyrite was incomplete in the presence of Co, leaving significant residual elemental sulfur and polysulfide. The presence of Co impeded the transformation of FeSm to pyrite compared to the metal-free system, resulting in sulfur-rich grains in the Co-containing product.
Reasoning source: Discussion section, page 9
Scoring Rubric (total: 100 pts)
| Q | Type | Max | Question | Reference Answer | Scoring Criteria |
|---|---|---|---|---|---|
| q1 | identification | 46 | Based on the synthesis conditions (Co-doped FeSm reacted with orthorhombic sulfur at 65 °C), what candidate reference spectra should be included in the basis set for Linear Combination Fitting of the S K-edge XANES data? | The candidate reference spectra for Linear Combination Fitting should include FeS, Pyrite, Poly-sulfide, Sulfur, and Sulfate. These phases are expected because the synthesis involves the oxidation of Co-doped FeSm with orthorhombic sulfur in an anoxic phthalate buffer at 65 °C. While pyrite is the intended product of this reaction, the presence of the Co dopant impedes the complete transformation of FeSm to pyrite. Consequently, the incomplete reaction leaves behind residual elemental sulfur, unreacted precursor phases like FeS, and intermediate polysulfides, necessitating their inclusion in the fit basis. | Full credit for identifying pyrite, elemental sulfur, FeS (mackinawite/precursor), and intermediate/oxidized species like polysulfide and sulfate. |
| q2 | quantification | 54 | Estimate the phase fractions of the dominant sulfur-bearing species in this specific sulfur-rich end-member (EM 7) of the Co-doped product. | The dominant sulfur-bearing species in this Co-doped end-member (EM 7) are elemental sulfur at a fraction of 0.69 and pyrite at 0.29, with a fitting uncertainty of 15%. These specific values result from the 2-week reaction of Co-doped FeSm with orthorhombic sulfur at 65 °C, which failed to reach completion. The presence of the Co dopant significantly impeded the transformation of the FeSm precursor into pyrite compared to a metal-free system. As a result, the final product consists of sulfur-rich grains dominated by unreacted residual elemental sulfur (69%) rather than the intended pyrite product (29%). | Full credit for estimating ~30% pyrite and ~70% elemental sulfur. Partial credit for identifying that elemental sulfur is the majority phase with a significant minority of pyrite. |
Review
#1187
Ni-doped Mackinawite (FeSm)
S K
▶
LLM Prompt
Sample Information
Material: Ni-doped Mackinawite (FeSm)
Method: precipitation
Precursors: 0.6 M ferrous ammonium sulfate, 0.6 M sodium sulfide, NiCl2·6H2O
Temperature C: 25
Atmosphere: N2
Sample-Specific Conditions
- Dopant: Ni
- Ni-doped mackinawite, end-member 31 from S K-edge XANES
Preparation
- Synthesized from 0.6 M ferrous ammonium sulfate, 0.6 M sodium sulfide, and NiCl2·6H2O (500 µM Ni) under N2.
Measurement
We plan to measure the S K XANES spectrum of this sample.
Questions
Based on all the information above:
1. What candidate reference spectra (basis functions) should be considered for linear combination fitting of the S K-edge XANES spectrum of this Ni-doped mackinawite sample to account for potential synthesis products and oxidation artifacts?
2. Given that this specific spectrum represents an oxidized end-member (EM 31) identified via PCA mapping of the sample, estimate the phase fractions of the sulfur species present.
Ground Truth
Material: Ni-doped Mackinawite (FeSm)
Measurement: S K-edge XANES, fluorescence mode, SSRL beamline BL14-3
Fit method: Linear Combination Fitting (LCF) of PCA-derived end-members
Phase fractions: (±15%)
| Phase | Fraction |
|---|---|
| FeS | 0.62 |
| Sulfate | 0.41 |
Fit basis (paper's reference spectra):
- FeS
- Pyrite
- Poly-sulfide
- Sulfur
- Sulfate
Source evidence: Table 1, page 5
Key reasoning: This specific spectrum represents an end-member (EM 31) derived from PCA of multiple XANES spectra collected on a map of FeSm synthesized with Ni. The presence of a significant sulfate fraction (0.41) alongside FeS (0.62) indicates that the synthesized FeSm was highly sensitive to oxidation. This oxidation occurred during sample preparation steps such as embedding, polishing, and oxic handling during analysis, rather than during the anoxic synthesis itself.
Reasoning source: Page 6, Results section ('Characteristics of synthesized minerals')
Scoring Rubric (total: 100 pts)
| Q | Type | Max | Question | Reference Answer | Scoring Criteria |
|---|---|---|---|---|---|
| q1 | identification | 50 | What candidate reference spectra (basis functions) should be considered for linear combination fitting of the S K-edge XANES spectrum of this Ni-doped mackinawite sample to account for potential synthesis products and oxidation artifacts? | The candidate reference spectra for linear combination fitting should include FeS, Pyrite, Poly-sulfide, Sulfur, and Sulfate. Although the Ni-doped mackinawite (FeSm) was synthesized under anoxic conditions (N2 atmosphere at 25 °C) using ferrous ammonium sulfate and sodium sulfide precursors, the resulting material is highly sensitive to oxidation. Therefore, while FeS accounts for the primary synthesized mackinawite phase, the oxidized sulfur species (Sulfate, Sulfur, Poly-sulfide, and Pyrite) must be included to account for oxidation artifacts. These artifacts arise because the sample undergoes oxidation during preparation steps like embedding, polishing, and oxic handling during analysis, necessitating a broad basis set to capture all resulting sulfur species. | Full points for identifying FeS, Pyrite, Poly-sulfide, elemental Sulfur, and Sulfate as the necessary reference spectra. |
| q2 | quantification | 50 | Given that this specific spectrum represents an oxidized end-member (EM 31) identified via PCA mapping of the sample, estimate the phase fractions of the sulfur species present. | The phase fractions for this specific end-member (EM 31) are estimated to be 0.62 for FeS and 0.41 for Sulfate, with an uncertainty of 15%. These specific values result from the fact that the Ni-doped mackinawite sample is highly sensitive to oxidation despite being synthesized under an anoxic N2 atmosphere. The significant fraction of sulfate (0.41) alongside the primary FeS phase (0.62) demonstrates that extensive oxidation occurred after the initial precipitation. This oxidation is directly attributed to sample preparation steps, such as embedding and polishing, as well as oxic handling during the XANES analysis, which converted a large portion of the original sulfide into sulfate. | Full points for estimating FeS at approximately 0.62 (or ~60%) and sulfate at approximately 0.41 (or ~40%). |
Review
#1188
Ni-doped FeSm treated with H2S
S K
▶
LLM Prompt
Sample Information
Material: Ni-doped FeSm treated with H2S
Method: H2S oxidation
Precursors: Ni-doped FeSm, Na2S (pH 6), Ti(III) citrate, phthalate buffer
Temperature C: 80
Duration Hours: 96
Atmosphere: N2
Sample-Specific Conditions
- Treatment: H2S oxidation
- Ni-doped mackinawite treated with H2S, end-member 2 from S K-edge XANES
Preparation
- Dry Ni-doped FeSm was weighed into a glass headspace vial. Phthalate buffer, Ti(III) citrate solution, and Na2S solution (adjusted to pH 6 to form H2S) were introduced via syringes. Incubated at 80 °C for 4 days.
Measurement
We plan to measure the S K XANES spectrum of this sample.
Questions
Based on all the information above:
1. What candidate reference spectra should be included in the linear combination fitting basis to model the S K-edge XANES data for this sample?
2. Estimate the phase fractions of the sulfur-bearing species present in this sample after the 4-day H2S treatment.
3. Based on the synthesis conditions (Ni-doped FeSm treated with H2S at 80 °C), explain why pyrite is not the dominant phase and discuss the role of Ni in this transformation pathway.
Ground Truth
Material: Ni-doped FeSm treated with H2S
Measurement: S K-edge XANES, fluorescence mode, SSRL BL 14-3
Fit method: Linear combination fitting of PCA-derived end-members
Phase fractions: (±15%)
| Phase | Fraction |
|---|---|
| FeS | 0.82 |
| Sulfate | 0.06 |
Fit basis (paper's reference spectra):
- FeS
- Pyrite
- Poly-sulfide
- Sulfur
- Sulfate
Source evidence: Table 1, page 5
Key reasoning: The H2S oxidation pathway failed to produce pyrite from FeSm synthesized with Ni. The product remained predominantly FeS with minor sulfate (likely from oxidation during sample handling or storage). The presence of Ni impurities impedes the rate of pyritization in circum-neutral conditions, inhibiting the transformation of the precursor FeS phase to pyrite compared to metal-free systems.
Reasoning source: Discussion section, page 9
Scoring Rubric (total: 100 pts)
| Q | Type | Max | Question | Reference Answer | Scoring Criteria |
|---|---|---|---|---|---|
| q1 | identification | 30 | What candidate reference spectra should be included in the linear combination fitting basis to model the S K-edge XANES data for this sample? | The linear combination fitting basis should include FeS, Pyrite, Poly-sulfide, Sulfur, and Sulfate. These specific reference phases are expected because the sample is a Ni-doped FeSm precursor subjected to an H2S oxidation treatment at 80 °C for 96 hours. FeS accounts for the unreacted precursor material, while pyrite, poly-sulfide, and elemental sulfur represent the targeted end-products and potential intermediates of the H2S oxidation pathway. Finally, sulfate must be included to account for minor, unintended oxidation that likely occurred during sample handling or storage. | Full points for identifying FeS, pyrite, poly-sulfide, elemental sulfur, and sulfate as the necessary basis set. Deduct points for missing key phases (especially FeS and sulfate) or including irrelevant phases. |
| q2 | quantification | 35 | Estimate the phase fractions of the sulfur-bearing species present in this sample after the 4-day H2S treatment. | The estimated phase fractions for this sample are 0.82 for FeS and 0.06 for Sulfate, with an uncertainty of 15%. These specific values result from the failure of the 96-hour H2S oxidation treatment at 80 °C to convert the precursor into pyrite. Because the Ni-doped FeSm precursor contains Ni impurities, the rate of pyritization is severely impeded under these circum-neutral (pH 6) conditions, leaving the material predominantly as unreacted FeS. The minor 0.06 sulfate fraction is not a product of the H2S reaction, but rather forms due to incidental oxidation during sample handling or storage. | Full points for estimating FeS at ~82% and sulfate at ~6%. Allow a ±15% margin of error. Deduct points if pyrite is estimated as a major phase. |
| q3 | reasoning | 35 | Based on the synthesis conditions (Ni-doped FeSm treated with H2S at 80 °C), explain why pyrite is not the dominant phase and discuss the role of Ni in this transformation pathway. | Pyrite is not the dominant phase in this sample because the H2S oxidation pathway failed to transform the precursor material. Despite being incubated with Na2S at pH 6 and 80 °C for 4 days, the presence of Ni in the Ni-doped FeSm precursor fundamentally inhibits the transformation. Ni impurities impede the rate of pyritization under these circum-neutral conditions compared to metal-free systems. As a result, the expected conversion to pyrite is blocked, leaving the product predominantly as the original FeS phase. | Full points for explaining that the H2S oxidation pathway is ineffective for Ni-doped FeSm, and that Ni impurities inhibit or slow down the transformation of the precursor FeS phase to pyrite under these conditions. |
Review
#1189
Ni-doped FeSm treated with H2S
S K
▶
LLM Prompt
Sample Information
Material: Ni-doped FeSm treated with H2S
Method: H2S oxidation
Precursors: Ni-doped FeSm, Na2S (pH 6), Ti(III) citrate, phthalate buffer
Temperature C: 80
Duration Hours: 96
Atmosphere: N2
Sample-Specific Conditions
- Treatment: H2S oxidation
- Ni-doped mackinawite treated with H2S, end-member 4 from S K-edge XANES
Preparation
- Dry Ni-doped FeSm was weighed into a glass headspace vial. Phthalate buffer, Ti(III) citrate solution, and Na2S solution (adjusted to pH 6 to form H2S) were introduced via syringes. Incubated at 80 °C for 4 days.
Measurement
We plan to measure the S K XANES spectrum of this sample.
Questions
Based on all the information above:
1. Given the precursors and treatment (Ni-doped mackinawite treated with H2S at 80 °C for 4 days), what candidate reference spectra should be included in a linear combination fit of the S K-edge XANES data to capture both the expected products and potential artifacts?
2. Estimate the phase fractions of the sulfur-bearing species in the resulting material based on the provided synthesis conditions.
3. Explain the physical and chemical reasoning for why pyrite is not the dominant product in this sample, despite the H2S treatment being intended to form it.
Ground Truth
Material: Ni-doped FeSm treated with H2S
Measurement: S K-edge XANES, fluorescence mode, SSRL BL14-3
Fit method: Linear combination fitting of PCA-derived end-members
Phase fractions: (±15%)
| Phase | Fraction |
|---|---|
| FeS | 0.83 |
| Sulfate | 0.08 |
Fit basis (paper's reference spectra):
- FeS
- Pyrite
- Poly-sulfide
- Sulfur
- Sulfate
Source evidence: Table 1, page 5
Key reasoning: Attempts to transform freeze-dried FeSm to pyrite via H2S oxidation were unsuccessful, leaving mostly unreacted mackinawite (FeS). This supports previous findings that H2S oxidation of dried mackinawite is not a significant pathway for pyrite formation at low temperatures. The minor sulfate present is likely an artifact of oxidation during sample handling, storage, or embedding.
Reasoning source: Discussion section, pages 8-9
Scoring Rubric (total: 100 pts)
| Q | Type | Max | Question | Reference Answer | Scoring Criteria |
|---|---|---|---|---|---|
| q1 | identification | 30 | Given the precursors and treatment (Ni-doped mackinawite treated with H2S at 80 °C for 4 days), what candidate reference spectra should be included in a linear combination fit of the S K-edge XANES data to capture both the expected products and potential artifacts? | The candidate reference spectra for the linear combination fit should include FeS, Pyrite, Poly-sulfide, Sulfur, and Sulfate. These phases are selected because the synthesis attempted to transform dry Ni-doped mackinawite (FeSm) into pyrite via H2S oxidation at 80 °C for 4 days. FeS is required because the low-temperature H2S oxidation of dried mackinawite is not a significant pathway for pyrite formation, leaving mostly unreacted precursor. Pyrite, poly-sulfide, and sulfur represent the intended or intermediate products of this H2S oxidation pathway, while sulfate must be included to account for potential oxidation artifacts introduced during sample handling, storage, or embedding. | Full credit for identifying FeS (mackinawite) as the primary phase and including sulfate as a potential oxidation artifact. Partial credit for including pyrite, sulfur, or polysulfides as potential but minor/absent phases. |
| q2 | quantification | 30 | Estimate the phase fractions of the sulfur-bearing species in the resulting material based on the provided synthesis conditions. | The resulting material consists predominantly of FeS at a fraction of 0.83, along with a minor Sulfate component at 0.08, with an estimated uncertainty of 15%. These specific values result from the fact that the 80 °C H2S oxidation treatment of freeze-dried Ni-doped FeSm was largely unsuccessful at forming pyrite. Because H2S oxidation of dried mackinawite is not a significant pathway for pyrite formation at these low temperatures, the bulk of the material remains as unreacted FeS. The small fraction of sulfate does not originate from the anaerobic N2 synthesis, but rather arises as an artifact of unintended oxidation during subsequent sample handling, storage, or embedding. | Full credit for estimating ~80-85% FeS and ~5-10% sulfate. Deduct points if pyrite is estimated as a major phase, as the reaction is unsuccessful under these conditions. |
| q3 | reasoning | 40 | Explain the physical and chemical reasoning for why pyrite is not the dominant product in this sample, despite the H2S treatment being intended to form it. | Pyrite is not the dominant product because the H2S oxidation of dried mackinawite is not a significant pathway for pyrite formation at low temperatures. Although the sample was incubated with Na2S at pH 6 to generate H2S at 80 °C for 96 hours, these specific conditions were insufficient to drive the transformation. Consequently, the attempt to transform the freeze-dried Ni-doped FeSm precursor into pyrite was unsuccessful. This leaves the final material composed mostly of unreacted mackinawite (FeS), confirming previous findings that this specific low-temperature pathway is ineffective for dried precursors. | Full credit for explaining that freeze-dried (N2-dried) mackinawite does not readily react with H2S to form pyrite at low temperatures, leaving unreacted FeS as the dominant phase, and noting that sulfate is an oxidation artifact. |
Review
#1190
Ni-doped Pyrite
S K
▶
LLM Prompt
Sample Information
Material: Ni-doped Pyrite
Method: sulfur oxidation
Precursors: Ni-doped FeSm, orthorhombic sulfur, phthalate buffer
Temperature C: 65
Duration Hours: 336
Atmosphere: N2
Sample-Specific Conditions
- Dopant: Ni
- Ni-doped pyrite synthesized via sulfur oxidation, end-member 29 from S K-edge XANES
Preparation
- Ni-doped FeSm reacted with orthorhombic sulfur in pH 6 anoxic phthalate buffer at 65 °C for 2 weeks.
Measurement
We plan to measure the S K XANES spectrum of this sample.
Questions
Based on all the information above:
1. Based on the synthesis conditions (Ni-doped FeSm reacted with orthorhombic sulfur at 65 °C for 2 weeks), what are the expected primary and secondary phases in the resulting solid, and what are their approximate fractions?
2. What reference spectra should be included in the linear combination fitting basis to accurately model the S K-edge XANES spectrum of this sample?
3. How does the presence of the Ni dopant affect the transformation of the FeSm precursor to pyrite during this sulfur oxidation synthesis, and what evidence in the phase composition supports this?
Ground Truth
Material: Ni-doped Pyrite
Measurement: S K-edge XANES, fluorescence mode, beamline 14-3 at SSRL
Fit method: Linear combination fitting of PCA-derived end-member spectra
Phase fractions: (±10%)
| Phase | Fraction |
|---|---|
| FeS | 0.15 |
| Pyrite | 0.73 |
| Sulfate | 0.05 |
Fit basis (paper's reference spectra):
- FeS
- Pyrite
- Poly-sulfide
- Sulfur
- Sulfate
Source evidence: Table 1, page 5
Key reasoning: Pyrite was successfully synthesized through the oxidation of FeSm with elemental sulfur. However, the reaction of FeSm to pyrite was incomplete in the presence of Ni, leaving residual FeSm. This suggests that Ni impurities may impede the rate of pyritization under these conditions. Minor sulfate is also present, likely reflecting oxidation during sample mounting, storage, or analysis.
Reasoning source: Discussion section, page 9
Scoring Rubric (total: 100 pts)
| Q | Type | Max | Question | Reference Answer | Scoring Criteria |
|---|---|---|---|---|---|
| q1 | quantification | 40 | Based on the synthesis conditions (Ni-doped FeSm reacted with orthorhombic sulfur at 65 °C for 2 weeks), what are the expected primary and secondary phases in the resulting solid, and what are their approximate fractions? | The expected primary phase is pyrite at a fraction of 0.73, with secondary phases of FeS (representing residual FeSm) at 0.15 and sulfate at 0.05. These fractions arise because the 2-week reaction of Ni-doped FeSm with orthorhombic sulfur at 65 °C successfully drives pyritization, yielding the high pyrite content. However, the Ni dopant impedes the reaction rate, preventing complete transformation and leaving 15% unreacted FeS. The minor 5% sulfate fraction does not originate from the anoxic N2 synthesis conditions, but rather reflects incidental oxidation occurring during sample mounting, storage, or analysis. | Full points for identifying pyrite as the dominant phase (~70-75%), FeS as a significant secondary phase (~15%), and minor sulfate (~5%). Deduct points for missing phases or fractions off by more than 10%. |
| q2 | identification | 30 | What reference spectra should be included in the linear combination fitting basis to accurately model the S K-edge XANES spectrum of this sample? | The linear combination fitting basis should include reference spectra for FeS, Pyrite, Poly-sulfide, Sulfur, and Sulfate. Pyrite and Sulfur are expected because the synthesis relies on reacting orthorhombic sulfur to form pyrite at 65 °C. FeS is required because the Ni dopant in the precursor slows the pyritization rate, leaving residual unreacted FeSm after the 336-hour duration. Poly-sulfide accounts for potential intermediates in the sulfur oxidation process, while Sulfate is needed to fit minor oxidation artifacts introduced during sample handling or measurement despite the N2 atmosphere. | Full points for listing FeS, Pyrite, and Sulfate. Additional points for mentioning Poly-sulfide and elemental Sulfur as potential basis components for this reaction system. |
| q3 | reasoning | 30 | How does the presence of the Ni dopant affect the transformation of the FeSm precursor to pyrite during this sulfur oxidation synthesis, and what evidence in the phase composition supports this? | The Ni dopant impedes the rate of pyritization, causing the transformation of the FeSm precursor to pyrite to be incomplete. Even after reacting with orthorhombic sulfur at 65 °C for 336 hours in an anoxic pH 6 buffer, the reaction does not reach full conversion. This is directly supported by the final phase composition, which shows a 0.73 fraction of pyrite alongside a significant 0.15 fraction of residual FeS. The presence of this unreacted precursor confirms that Ni impurities hinder the sulfur oxidation mechanism under these specific synthesis conditions. | Full points for explaining that Ni impurities impede or slow down the rate of pyritization, supported by the evidence of incomplete reaction (the persistence of residual FeSm in the final product). |
Review
#1191
Ni-doped Pyrite
S K
▶
LLM Prompt
Sample Information
Material: Ni-doped Pyrite
Method: sulfur oxidation
Precursors: Ni-doped FeSm, orthorhombic sulfur, phthalate buffer
Temperature C: 65
Duration Hours: 336
Atmosphere: N2
Sample-Specific Conditions
- Dopant: Ni
- Ni-doped pyrite synthesized via sulfur oxidation, end-member 35 from S K-edge XANES
Preparation
- Ni-doped FeSm reacted with orthorhombic sulfur in pH 6 anoxic phthalate buffer at 65 °C for 2 weeks.
Measurement
We plan to measure the S K XANES spectrum of this sample.
Questions
Based on all the information above:
1. Based on the synthesis conditions (Ni-doped FeSm reacted with orthorhombic sulfur), what candidate reference spectra should be included in a linear combination fit of the S K-edge XANES data to capture the possible reaction products and intermediates?
2. Estimate the phase fractions of the sulfur-bearing species in the resulting solid end-member.
3. Explain the physical reasoning for the expected phase composition, specifically addressing how the presence of the Ni dopant affects the pyritization process compared to a metal-free system.
Ground Truth
Material: Ni-doped Pyrite
Measurement: S K-edge XANES in fluorescence mode at SSRL BL 14-3
Fit method: Linear Combination Fitting (LCF) of PCA-derived end-members
Phase fractions: (±10%)
| Phase | Fraction |
|---|---|
| Pyrite | 0.79 |
| Poly-sulfide | 0.25 |
Fit basis (paper's reference spectra):
- FeS
- Pyrite
- Poly-sulfide
- Sulfur
- Sulfate
Source evidence: Table 1, page 5
Key reasoning: Pyrite is successfully synthesized through the oxidation of FeSm with elemental sulfur. However, the reaction of FeSm to pyrite is incomplete in the presence of Ni, leaving residual polysulfide. The presence of Ni impurities impedes the rate of pyritization compared to metal-free systems, acting as a kinetic inhibitor to pyrite formation.
Reasoning source: Discussion section, page 9
Scoring Rubric (total: 100 pts)
| Q | Type | Max | Question | Reference Answer | Scoring Criteria |
|---|---|---|---|---|---|
| q1 | identification | 30 | Based on the synthesis conditions (Ni-doped FeSm reacted with orthorhombic sulfur), what candidate reference spectra should be included in a linear combination fit of the S K-edge XANES data to capture the possible reaction products and intermediates? | The candidate reference spectra for the linear combination fit should include FeS, Pyrite, Poly-sulfide, Sulfur, and Sulfate. These specific phases are expected because the sample is synthesized by reacting Ni-doped FeSm with orthorhombic sulfur in an anoxic phthalate buffer at 65 °C for 336 hours. During this sulfur oxidation process, pyrite is formed as the primary product, while unreacted precursors (FeS, Sulfur) and intermediates like poly-sulfide can remain. Furthermore, the presence of the Ni dopant acts as a kinetic inhibitor that impedes the pyritization rate, ensuring that intermediate phases like poly-sulfide are captured in the final spectrum. | Full points for identifying Pyrite and Poly-sulfide (or elemental sulfur/FeS/sulfate as potential components in the system). Partial points for missing key intermediate or product phases. |
| q2 | quantification | 35 | Estimate the phase fractions of the sulfur-bearing species in the resulting solid end-member. | The estimated phase fractions for the sulfur-bearing species are 0.79 Pyrite and 0.25 Poly-sulfide, with an uncertainty of 10%. These specific values result from the 336-hour reaction of Ni-doped FeSm with orthorhombic sulfur at 65 °C, which successfully drives the oxidation of FeSm to pyrite. However, the conversion is incomplete because the Ni dopant acts as a kinetic inhibitor to pyrite formation compared to metal-free systems. Consequently, the pyritization rate is impeded, leaving a significant 0.25 fraction of residual poly-sulfide intermediate alongside the 0.79 pyrite product. | Full points for estimating ~75-80% Pyrite and ~20-25% Poly-sulfide. Deduct points for significant deviations or failing to identify the presence of the polysulfide component. |
| q3 | reasoning | 35 | Explain the physical reasoning for the expected phase composition, specifically addressing how the presence of the Ni dopant affects the pyritization process compared to a metal-free system. | The expected phase composition consists primarily of pyrite alongside a significant fraction of residual poly-sulfide. This composition arises because pyrite is synthesized through the oxidation of the Ni-doped FeSm precursor with elemental sulfur at 65 °C. However, the presence of Ni impurities acts as a kinetic inhibitor to pyrite formation, impeding the overall rate of pyritization compared to a metal-free system. As a result of this inhibited reaction rate over the 2-week duration, the conversion of FeSm to pyrite remains incomplete, leaving unreacted poly-sulfide intermediates in the final material. | Full points for explaining that Ni acts as a kinetic inhibitor, slowing down the pyritization reaction and leading to an incomplete transformation that leaves residual polysulfide. |
Review
#1192
Pyrite
S K
▶
LLM Prompt
Sample Information
Material: Pyrite
Method: sulfur oxidation
Precursors: FeSm, orthorhombic sulfur, phthalate buffer
Temperature C: 65
Duration Hours: 336
Atmosphere: N2
Sample-Specific Conditions
- Synthesis method: sulfur oxidation
- Pyrite synthesized via sulfur oxidation, end-member 15 from Fe K-edge XANES
Preparation
- Dried FeSm was resuspended with pH 6 anoxic phthalate buffer. Orthorhombic sulfur was added. Incubated at 65 °C for 2 weeks.
Measurement
We plan to measure the S K XANES spectrum of this sample.
Questions
Based on all the information above:
1. What candidate reference spectra should be included in a linear combination fitting basis to analyze the Fe K-edge XANES spectra of the products from this sulfur oxidation synthesis?
2. Given the synthesis conditions (reacting FeSm with orthorhombic sulfur at 65 °C for 2 weeks), what phase does this specific end-member spectrum (EM 15) represent, and why is it present in the final product?
Ground Truth
Material: Pyrite synthesis product (residual FeS end-member)
Measurement: Fe K-edge XANES
Fit method: Linear combination fitting of PCA-derived end-members
Phase fractions: (±10%)
| Phase | Fraction |
|---|---|
| FeS | 1.01 |
Fit basis (paper's reference spectra):
- FeS
- Pyrite
- Marcasite
- Pyrrhotite
- Maghemite
Source evidence: Table 2, page 6
Key reasoning: The sample was synthesized via the sulfur oxidation of mackinawite (FeSm) to form pyrite. However, the reaction was incomplete after 14 days at 65 °C. Spatially resolved Fe K-edge XANES and PCA identified multiple end-members in the product, with End-member 15 corresponding entirely to residual, unreacted FeSm precursor.
Reasoning source: Page 9, Discussion section
Scoring Rubric (total: 100 pts)
| Q | Type | Max | Question | Reference Answer | Scoring Criteria |
|---|---|---|---|---|---|
| q1 | identification | 43 | What candidate reference spectra should be included in a linear combination fitting basis to analyze the Fe K-edge XANES spectra of the products from this sulfur oxidation synthesis? | The candidate reference spectra for the linear combination fitting basis should include FeS, Pyrite, Marcasite, Pyrrhotite, and Maghemite. These phases are expected because the sample was synthesized by reacting an FeSm precursor with orthorhombic sulfur at 65 °C for 2 weeks in an anoxic N2 atmosphere to form pyrite. Since this sulfur oxidation process can be incomplete after 14 days, the basis must include the unreacted precursor (FeS) and the target product (Pyrite). Furthermore, intermediate or alternative iron sulfide polymorphs like Marcasite and Pyrrhotite, as well as Maghemite for potential incidental oxidation, are required to fully capture the complex phase mixture resulting from these synthesis conditions. | Full credit for identifying FeS (mackinawite) and pyrite. Additional credit for mentioning marcasite, pyrrhotite, or iron oxides (like maghemite) as potential minor or oxidation products. |
| q2 | reasoning | 57 | Given the synthesis conditions (reacting FeSm with orthorhombic sulfur at 65 °C for 2 weeks), what phase does this specific end-member spectrum (EM 15) represent, and why is it present in the final product? | End-member 15 represents pure FeS, specifically corresponding to a fraction of 1.01 of the unreacted mackinawite (FeSm) precursor. This phase is present in the final product because the sample was synthesized via the sulfur oxidation of FeSm with orthorhombic sulfur at 65 °C. Under these specific temperature and time conditions (14 days), the transformation to the target pyrite phase was incomplete. As a result, spatially resolved Fe K-edge XANES and PCA isolated this end-member as the residual, unreacted precursor material that persisted through the 336-hour incubation. | Must identify the phase as unreacted FeS (mackinawite) and explain that the sulfur oxidation reaction to form pyrite was incomplete, leaving residual precursor material. |
Review
#1193
Pyrite
S K
▶
LLM Prompt
Sample Information
Material: Pyrite
Method: sulfur oxidation
Precursors: FeSm, orthorhombic sulfur, phthalate buffer
Temperature C: 65
Duration Hours: 336
Atmosphere: N2
Sample-Specific Conditions
- Synthesis method: sulfur oxidation
- Pyrite synthesized via sulfur oxidation, end-member 16 from Fe K-edge XANES
Preparation
- Dried FeSm was resuspended with pH 6 anoxic phthalate buffer. Orthorhombic sulfur was added. Incubated at 65 °C for 2 weeks.
Measurement
We plan to measure the S K XANES spectrum of this sample.
Questions
Based on all the information above:
1. What candidate reference spectra should be included in the linear combination fitting (LCF) basis for the Fe K-edge XANES of this specific end-member?
2. Estimate the phase fractions of the components in this sample based on the Fe K-edge XANES fit.
Ground Truth
Material: Pyrite synthesized via sulfur oxidation
Measurement: Fe K-edge XANES
Fit method: Linear combination fitting of PCA-derived end-members
Phase fractions: (±10%)
| Phase | Fraction |
|---|---|
| Pyrite | 0.62 |
| Marcasite | 0.4 |
Fit basis (paper's reference spectra):
- FeS
- Pyrite
- Marcasite
- Pyrrhotite
- Maghemite
Source evidence: Table 2 and Discussion (page 9)
Key reasoning: The sample was synthesized via sulfur oxidation of FeSm at 65 °C for 2 weeks. Fe K-edge XANES fitting of this specific end-member indicates a mixture of pyrite (0.62) and marcasite (0.40). However, the authors note that the inclusion of marcasite in the fit likely reflects the similar sulfur oxidation state and orbital energy levels of Fe in pyrite and marcasite, rather than the actual presence of marcasite, as their Fe XANES spectra are very similar.
Reasoning source: Discussion section, page 9
Scoring Rubric (total: 100 pts)
| Q | Type | Max | Question | Reference Answer | Scoring Criteria |
|---|---|---|---|---|---|
| q1 | identification | 50 | What candidate reference spectra should be included in the linear combination fitting (LCF) basis for the Fe K-edge XANES of this specific end-member? | The candidate reference spectra for the linear combination fitting basis should include FeS, Pyrite, Marcasite, Pyrrhotite, and Maghemite. These specific phases are expected because the sample was synthesized via the sulfur oxidation of an FeSm precursor with orthorhombic sulfur in an anoxic (N2) environment at 65 °C for 336 hours. This prolonged thermal incubation drives the transformation of the iron monosulfide precursor into iron disulfides like pyrite, while phases like FeS and pyrrhotite account for unreacted precursors or intermediates. Maghemite is included to capture any incidental oxidation that may have occurred. Additionally, marcasite is a necessary candidate because its similar sulfur oxidation state and Fe orbital energy levels make its Fe XANES spectrum nearly identical to that of pyrite. | Full credit for identifying Pyrite and Marcasite as the primary reference spectra needed for the fit of this end-member. |
| q2 | quantification | 50 | Estimate the phase fractions of the components in this sample based on the Fe K-edge XANES fit. | Based on the Fe K-edge XANES fit, the estimated phase fractions are 0.62 for pyrite and 0.40 for marcasite, with an uncertainty of 10%. These values result from the 336-hour incubation of the FeSm precursor with orthorhombic sulfur at 65 °C, which drives the extensive conversion of the starting material into iron disulfide. However, the 0.40 fraction assigned to marcasite likely does not reflect its actual physical presence in the synthesized sample. Instead, this mathematical fitting result occurs because the sulfur oxidation state and Fe orbital energy levels in pyrite and marcasite are highly analogous, yielding very similar Fe XANES spectra. Ultimately, these fractions demonstrate the successful sulfur oxidation of the precursor into a predominantly pyrite end-member under these specific synthesis conditions. | Full credit for estimating Pyrite at ~0.62 and Marcasite at ~0.40. Partial credit for identifying Pyrite as the dominant phase with a significant Marcasite component. |
Review
#1194
Pyrite
S K
▶
LLM Prompt
Sample Information
Material: Pyrite
Method: sulfur oxidation
Precursors: FeSm, orthorhombic sulfur, phthalate buffer
Temperature C: 65
Duration Hours: 336
Atmosphere: N2
Sample-Specific Conditions
- Synthesis method: sulfur oxidation
- Pyrite synthesized via sulfur oxidation, end-member 20 from Fe K-edge XANES
Preparation
- Dried FeSm was resuspended with pH 6 anoxic phthalate buffer. Orthorhombic sulfur was added. Incubated at 65 °C for 2 weeks.
Measurement
We plan to measure the S K XANES spectrum of this sample.
Questions
Based on all the information above:
1. Given the synthesis method (sulfur oxidation of FeSm) and potential handling artifacts, what candidate reference spectra should be included in the linear combination fitting (LCF) of the Fe K-edge XANES data for this sample?
2. Estimate the phase fractions for this specific end-member (EM 20) of the synthesized sample, taking into account the occurrence of oxidation during sample embedding or storage.
Ground Truth
Material: Pyrite
Measurement: Fe K-edge XANES
Fit method: Linear Combination Fitting (LCF)
Phase fractions: (±10%)
| Phase | Fraction |
|---|---|
| Pyrite | 0.43 |
| Maghemite | 0.57 |
Fit basis (paper's reference spectra):
- FeS
- Pyrite
- Marcasite
- Pyrrhotite
- Maghemite
Source evidence: Table 2, page 6
Key reasoning: Pyrite was successfully formed via the sulfur oxidation of FeSm. However, the significant fraction of maghemite indicates unintended Fe oxidation. This oxidation likely occurred during sample embedding, storage, or analysis, as maghemite was not detected by XRD prior to these steps.
Reasoning source: Page 9, Discussion section
Scoring Rubric (total: 100 pts)
| Q | Type | Max | Question | Reference Answer | Scoring Criteria |
|---|---|---|---|---|---|
| q1 | identification | 43 | Given the synthesis method (sulfur oxidation of FeSm) and potential handling artifacts, what candidate reference spectra should be included in the linear combination fitting (LCF) of the Fe K-edge XANES data for this sample? | The candidate reference spectra for the linear combination fitting (LCF) of the Fe K-edge XANES data should include FeS, Pyrite, Marcasite, Pyrrhotite, and Maghemite. These specific phases are expected because the sample was synthesized via the sulfur oxidation of an FeSm precursor with orthorhombic sulfur at 65 °C for 336 hours, which drives the formation of iron sulfides like pyrite, marcasite, and pyrrhotite, alongside potentially unreacted FeS. Furthermore, maghemite must be included as a reference because unintended iron oxidation likely occurred during sample embedding, storage, or analysis, introducing an oxidized iron phase despite the initial anoxic N2 atmosphere. | Full points for identifying pyrite (the intended product) and an oxidized iron phase such as maghemite (due to handling artifacts). Partial credit for mentioning unreacted precursors like FeS. |
| q2 | quantification | 57 | Estimate the phase fractions for this specific end-member (EM 20) of the synthesized sample, taking into account the occurrence of oxidation during sample embedding or storage. | The estimated phase fractions for this sample (end-member 20) are 0.43 (43%) Pyrite and 0.57 (57%) Maghemite, with an uncertainty of 10%. These specific values result from the synthesis conditions where the sulfur oxidation of the FeSm precursor at 65 °C successfully formed a significant amount of pyrite. However, the dominant fraction of maghemite (57%) arises because the sample experienced unintended iron oxidation after synthesis. This oxidation likely took place during subsequent sample embedding, storage, or analysis steps, converting a large portion of the synthesized iron sulfides into maghemite, which was not present in prior XRD measurements. | Full points for estimating approximately 40-50% pyrite and 50-60% maghemite (or oxidized Fe phase). Partial credit if the correct phases are identified but fractions are off by more than 15%. |
Review
#1195
Co-doped Mackinawite (FeSm)
S K
▶
LLM Prompt
Sample Information
Material: Co-doped Mackinawite (FeSm)
Method: precipitation
Precursors: 0.6 M ferrous ammonium sulfate, 0.6 M sodium sulfide, CoCl2·6H2O
Temperature C: 25
Atmosphere: N2
Sample-Specific Conditions
- Dopant: Co
- Co-doped mackinawite, end-member 2 from Fe K-edge XANES
Preparation
- Synthesized from 0.6 M ferrous ammonium sulfate, 0.6 M sodium sulfide, and CoCl2·6H2O (2000 µM Co) under N2.
Measurement
We plan to measure the S K XANES spectrum of this sample.
Questions
Based on all the information above:
1. What reference spectra are necessary to model the Fe K-edge XANES data for this Co-doped mackinawite sample using linear combination fitting?
2. Estimate the relative phase fractions of the iron-bearing species in this specific end-member of the Co-doped sample.
3. Explain the origin of the reference spectra used to fit the Fe K-edge XANES data for the Co-doped sample.
Ground Truth
Material: Co-doped Mackinawite (FeSm)
Measurement: Fe K-edge XANES in fluorescence mode at SSRL BL 2-3
Fit method: Linear combination fitting (LCF) of PCA-derived end-members
Phase fractions: (±10%)
| Phase | Fraction |
|---|---|
| FeS | 0.7 |
| Pyrrhotite | 0.32 |
Fit basis (paper's reference spectra):
- FeS
- Pyrite
- Marcasite
- Pyrrhotite
- Maghemite
Source evidence: Table 2, page 6
Key reasoning: Fe XANES spectra from points on the Co-doped FeSm sample map were fit by a combination of FeS and pyrrhotite. The FeS reference spectrum used for fitting was collected from a bulk powder of FeSm synthesized without any metals.
Reasoning source: Results section, page 6
Scoring Rubric (total: 100 pts)
| Q | Type | Max | Question | Reference Answer | Scoring Criteria |
|---|---|---|---|---|---|
| q1 | identification | 30 | What reference spectra are necessary to model the Fe K-edge XANES data for this Co-doped mackinawite sample using linear combination fitting? | To model the Fe K-edge XANES data for this Co-doped mackinawite sample using linear combination fitting, reference spectra for FeS and pyrrhotite are necessary. The sample was synthesized via precipitation from 0.6 M ferrous ammonium sulfate, 0.6 M sodium sulfide, and CoCl2·6H2O at 25 °C under an N2 atmosphere. Under these specific conditions, the resulting end-member 2 spectrum from the sample map is best represented by a combination of these two phases. The FeS reference accounts for the primary mackinawite phase, which is collected from a bulk powder of FeSm synthesized without any metals. Meanwhile, pyrrhotite accounts for the secondary iron sulfide phase that develops alongside the primary phase in this Co-doped system. | Full credit for identifying mackinawite (FeS) and pyrrhotite as the necessary reference spectra. |
| q2 | quantification | 40 | Estimate the relative phase fractions of the iron-bearing species in this specific end-member of the Co-doped sample. | The relative phase fractions for this specific end-member of the Co-doped sample are estimated to be 0.7 (70%) FeS and 0.32 (32%) pyrrhotite, with an uncertainty of 10%. These specific values result from the precipitation synthesis using 0.6 M ferrous ammonium sulfate, 0.6 M sodium sulfide, and 2000 µM Co at 25 °C under an N2 atmosphere. The introduction of the cobalt dopant into the mackinawite system alters the phase distribution, leading to the formation of a secondary pyrrhotite phase alongside the primary FeS phase. Linear combination fitting of the PCA-derived end-member 2 spectrum yields this specific ratio to accurately reflect the structural composition resulting from these synthesis conditions. | Full credit for estimating approximately 70% FeS (mackinawite) and 30% pyrrhotite. Partial credit for identifying FeS as the dominant phase with a significant minority of pyrrhotite. |
| q3 | reasoning | 30 | Explain the origin of the reference spectra used to fit the Fe K-edge XANES data for the Co-doped sample. | The Fe K-edge XANES data for the Co-doped sample were fit using a combination of FeS and pyrrhotite reference spectra. The sample is a Co-doped mackinawite (FeSm) synthesized via precipitation from ferrous ammonium sulfate, sodium sulfide, and CoCl2·6H2O at 25 °C under N2. Because the sample map points for this Co-doped system exhibited a mixture of phases, PCA-derived end-members were used for linear combination fitting. The FeS reference spectrum specifically originates from a bulk powder of FeSm synthesized without any metals, serving as a baseline for the primary mackinawite phase. The pyrrhotite reference is required to account for the secondary iron sulfide phase that forms as a result of incorporating the cobalt dopant into the mackinawite structure during synthesis. | Full credit for stating that the FeS reference spectrum was obtained from a bulk powder of mackinawite synthesized without any added metals. |
Review
#1196
Co-doped FeSm treated with H2S
S K
▶
LLM Prompt
Sample Information
Material: Co-doped FeSm treated with H2S
Method: H2S oxidation
Precursors: Co-doped FeSm, Na2S (pH 6), Ti(III) citrate, phthalate buffer
Temperature C: 80
Duration Hours: 96
Atmosphere: N2
Sample-Specific Conditions
- Treatment: H2S oxidation
- Co-doped mackinawite treated with H2S, end-member 5 from Fe K-edge XANES
Preparation
- Dry Co-doped FeSm was weighed into a glass headspace vial. Phthalate buffer, Ti(III) citrate solution, and Na2S solution (adjusted to pH 6 to form H2S) were introduced via syringes. Incubated at 80 °C for 4 days.
Measurement
We plan to measure the S K XANES spectrum of this sample.
Questions
Based on all the information above:
1. What is the dominant iron-bearing phase expected in this sample after the H2S oxidation treatment, and why does it dominate instead of forming pyrite?
2. When performing Linear Combination Fitting (LCF) on the Fe K-edge XANES spectrum of this sample, what candidate reference spectra should be included in the fit basis to accurately model the potential iron phases?
3. Based on the failure of the H2S oxidation method to transform this Co-doped sample, what does this indicate about the kinetic effect of Co on diagenetic pyrite formation pathways?
Ground Truth
Material: Co-doped FeSm treated with H2S
Measurement: Fe K-edge XANES at SSRL beamline 2-3
Fit method: Linear Combination Fitting (LCF) of PCA-derived end-members
Phase fractions: (±10%)
| Phase | Fraction |
|---|---|
| FeS | 1.04 |
Fit basis (paper's reference spectra):
- FeS
- Pyrite
- Marcasite
- Pyrrhotite
- Maghemite
Source evidence: Table 2, page 6; Discussion, pages 8-9
Key reasoning: The H2S oxidation method failed to produce pyrite from FeSm synthesized with Co. The presence of Co kinetically impeded the reaction of FeSm to pyrite during the time course of the experiments. As a result, the product remained predominantly unreacted FeS (mackinawite).
Reasoning source: Discussion section, pages 8-9
Scoring Rubric (total: 100 pts)
| Q | Type | Max | Question | Reference Answer | Scoring Criteria |
|---|---|---|---|---|---|
| q1 | reasoning | 40 | What is the dominant iron-bearing phase expected in this sample after the H2S oxidation treatment, and why does it dominate instead of forming pyrite? | The dominant iron-bearing phase expected in this sample is unreacted FeS (mackinawite), which comprises approximately 104% of the fitted fraction. Despite being subjected to H2S oxidation conditions at 80 °C for 96 hours using Na2S at pH 6, the expected transformation to pyrite did not occur. This failure to transform is directly due to the presence of the Co dopant in the FeSm precursor. The Co kinetically impeded the reaction of FeSm to pyrite during the 4-day time course of the experiment, resulting in a product that remained predominantly unreacted FeS. | The answer must identify FeS (mackinawite) as the dominant/sole phase (~100%) and explain that the presence of Co impedes the transformation of FeSm to pyrite via the H2S oxidation pathway. |
| q2 | identification | 30 | When performing Linear Combination Fitting (LCF) on the Fe K-edge XANES spectrum of this sample, what candidate reference spectra should be included in the fit basis to accurately model the potential iron phases? | When performing Linear Combination Fitting (LCF) on the Fe K-edge XANES spectrum, the candidate reference spectra should include FeS, Pyrite, Marcasite, Pyrrhotite, and Maghemite. These references are selected to account for the possible reaction products and intermediates expected when treating Co-doped FeSm with H2S at 80 °C for 96 hours. Although the experimental conditions were designed to drive the formation of pyrite, the Co dopant kinetically impeded the reaction during the 4-day incubation. Consequently, including this full suite of references allows the LCF to accurately determine that the sample failed to transform, yielding a final composition of approximately 104% unreacted FeS. | The answer must list the relevant iron reference phases considered for these diagenetic systems: FeS (mackinawite), pyrite, marcasite, pyrrhotite, and maghemite. |
| q3 | reasoning | 30 | Based on the failure of the H2S oxidation method to transform this Co-doped sample, what does this indicate about the kinetic effect of Co on diagenetic pyrite formation pathways? | The failure of the H2S oxidation method to transform this sample indicates that Co acts as a strong kinetic inhibitor during diagenetic pyrite formation. Even though the sample was incubated under favorable conditions—at 80 °C for 96 hours with Na2S at pH 6 to generate H2S—the transformation to pyrite was completely blocked. The Fe K-edge XANES results show a final composition of approximately 104% unreacted FeS. This proves that the presence of Co doped into the FeSm precursor kinetically impedes the reaction pathway, stabilizing the initial mackinawite phase and preventing its oxidation to pyrite over the time course of the experiment. | The answer must state that Co kinetically inhibits or impedes the reaction of FeSm to pyrite, preventing the transformation within the experimental timeframe. |
Review
#1197
Co-doped Pyrite
S K
▶
LLM Prompt
Sample Information
Material: Co-doped Pyrite
Method: sulfur oxidation
Precursors: Co-doped FeSm, orthorhombic sulfur, phthalate buffer
Temperature C: 65
Duration Hours: 336
Atmosphere: N2
Sample-Specific Conditions
- Dopant: Co
- Co-doped pyrite synthesized via sulfur oxidation, end-member 53 from Fe K-edge XANES
Preparation
- Co-doped FeSm reacted with orthorhombic sulfur in pH 6 anoxic phthalate buffer at 65 °C for 2 weeks.
Measurement
We plan to measure the S K XANES spectrum of this sample.
Questions
Based on all the information above:
1. Based on the synthesis conditions (Co-doped FeSm reacted with orthorhombic sulfur at 65 °C for 2 weeks), what iron-bearing phase dominates this specific unreacted end-member region, and why did it fail to fully transform into pyrite?
2. To quantify the speciation of iron in this partially reacted Co-doped sample using linear combination fitting of Fe K-edge XANES spectra, what reference compounds should be included in the fit basis?
3. If the sulfur oxidation reaction of this Co-doped FeSm sample were allowed to proceed to completion, or if the Co dopant were absent, what would be the expected dominant iron-bearing product phase?
Ground Truth
Material: Co-doped Pyrite (partially reacted mixture)
Measurement: Fe K-edge micro-XANES
Fit method: Linear combination fitting (LCF) of PCA-derived end-members
Phase fractions: (±10%)
| Phase | Fraction |
|---|---|
| FeS | 0.99 |
Fit basis (paper's reference spectra):
- FeS
- Pyrite
- Marcasite
- Pyrrhotite
- Maghemite
Source evidence: Table 2, page 6
Key reasoning: The presence of Co impeded the transformation of FeSm (mackinawite) to pyrite via the sulfur oxidation pathway over the 2-week experiment. Consequently, micro-XANES analysis revealed spatial heterogeneity, with some end-member spots (like EM 53) consisting almost entirely of unreacted FeS, while others showed pyrite formation.
Reasoning source: Page 9, Discussion section
Scoring Rubric (total: 100 pts)
| Q | Type | Max | Question | Reference Answer | Scoring Criteria |
|---|---|---|---|---|---|
| q1 | reasoning | 40 | Based on the synthesis conditions (Co-doped FeSm reacted with orthorhombic sulfur at 65 °C for 2 weeks), what iron-bearing phase dominates this specific unreacted end-member region, and why did it fail to fully transform into pyrite? | The dominant iron-bearing phase in this specific end-member region (EM 53) is unreacted FeS (mackinawite), comprising 99% of the fraction. Despite being reacted with orthorhombic sulfur at 65 °C for 336 hours in an anoxic pH 6 phthalate buffer, the transformation to pyrite was incomplete. This occurred because the presence of the Co dopant impeded the sulfur oxidation pathway of the FeSm precursor. As a result, spatial heterogeneity developed, leaving this specific micro-XANES spot almost entirely as the unreacted FeS starting material. | Must identify FeS (mackinawite) as the dominant phase (~99%) and explain that the presence of Co impedes or slows down the transformation of FeSm to pyrite via sulfur oxidation. |
| q2 | identification | 30 | To quantify the speciation of iron in this partially reacted Co-doped sample using linear combination fitting of Fe K-edge XANES spectra, what reference compounds should be included in the fit basis? | To quantify the iron speciation using linear combination fitting of Fe K-edge micro-XANES spectra, the fit basis must include FeS, Pyrite, Marcasite, Pyrrhotite, and Maghemite. These references are necessary because reacting Co-doped FeSm with orthorhombic sulfur at 65 °C for 2 weeks produced a partially reacted, spatially heterogeneous mixture. The Co dopant impeded the sulfur oxidation pathway, meaning the sample contains both unreacted precursor (FeS) and the intended product (pyrite), alongside other potential intermediate or oxidized phases. Using this basis allows for the accurate identification of regions like end-member 53, which consists of 99% unreacted FeS. | Must list FeS (mackinawite) and pyrite as essential reference spectra, and may include marcasite, pyrrhotite, or maghemite. |
| q3 | prediction | 30 | If the sulfur oxidation reaction of this Co-doped FeSm sample were allowed to proceed to completion, or if the Co dopant were absent, what would be the expected dominant iron-bearing product phase? | If the reaction proceeded to completion or the Co dopant were absent, the expected dominant iron-bearing product phase would be pyrite. The synthesis conditions—reacting FeSm with orthorhombic sulfur at 65 °C in a pH 6 anoxic buffer—are specifically designed to drive the transformation of FeSm to pyrite via the sulfur oxidation pathway. In the measured sample, the Co dopant impeded this transformation, resulting in regions of 99% unreacted FeS. Without the inhibiting effect of Co, or with sufficient reaction progress, the precursor would fully convert into the intended pyrite phase. | Must predict pyrite as the final product phase, noting that Co inhibits this transformation which would otherwise proceed more completely. |
Review
#1198
Co-doped Pyrite
S K
▶
LLM Prompt
Sample Information
Material: Co-doped Pyrite
Method: sulfur oxidation
Precursors: Co-doped FeSm, orthorhombic sulfur, phthalate buffer
Temperature C: 65
Duration Hours: 336
Atmosphere: N2
Sample-Specific Conditions
- Dopant: Co
- Co-doped pyrite synthesized via sulfur oxidation, end-member 54 from Fe K-edge XANES
Preparation
- Co-doped FeSm reacted with orthorhombic sulfur in pH 6 anoxic phthalate buffer at 65 °C for 2 weeks.
Measurement
We plan to measure the S K XANES spectrum of this sample.
Questions
Based on all the information above:
1. Based on the synthesis conditions (Co-doped FeSm reacted with orthorhombic sulfur at 65 °C for 2 weeks), what is the expected dominant phase in the fully reacted regions, and what other iron-bearing phases should be included as candidate reference spectra for linear combination fitting of the Fe K-edge XANES data?
Ground Truth
Material: Co-doped Pyrite
Measurement: Fe K-edge XANES
Fit method: PCA followed by linear combination fitting of end-members
Phase fractions: (±10%)
| Phase | Fraction |
|---|---|
| Pyrite | 0.99 |
Fit basis (paper's reference spectra):
- FeS
- Pyrite
- Marcasite
- Pyrrhotite
- Maghemite
Source evidence: Table 2, page 6
Key reasoning: The sulfur oxidation method successfully synthesized pyrite from FeSm with elemental sulfur. In Co-containing samples, pyrite was the main product, although the reaction was sometimes incomplete, leaving residual FeSm or forming marcasite. For this specific end-member (EM 54), the transformation to pyrite was nearly complete.
Reasoning source: Page 9, Discussion section
Scoring Rubric (total: 100 pts)
| Q | Type | Max | Question | Reference Answer | Scoring Criteria |
|---|---|---|---|---|---|
| q1 | identification | 100 | Based on the synthesis conditions (Co-doped FeSm reacted with orthorhombic sulfur at 65 °C for 2 weeks), what is the expected dominant phase in the fully reacted regions, and what other iron-bearing phases should be included as candidate reference spectra for linear combination fitting of the Fe K-edge XANES data? | The expected dominant phase in the fully reacted regions is pyrite, while the candidate reference spectra for linear combination fitting should include FeS, pyrite, marcasite, pyrrhotite, and maghemite. Pyrite is the primary product because the sulfur oxidation method—reacting Co-doped FeSm with orthorhombic sulfur in an anoxic pH 6 buffer at 65 °C for 336 hours—successfully drives the transformation of the precursor. However, because this reaction can sometimes be incomplete under these specific conditions, residual precursor material (FeS) or alternative phases like marcasite and pyrrhotite can form and must be accounted for in the fit basis. Maghemite is also included as a reference to capture any potential oxidized iron phases present in the sample. | Full points for identifying pyrite as the dominant phase and listing FeS, marcasite, pyrrhotite, and maghemite as potential references. |
Review
#1199
Co-doped Pyrite
S K
▶
LLM Prompt
Sample Information
Material: Co-doped Pyrite
Method: sulfur oxidation
Precursors: Co-doped FeSm, orthorhombic sulfur, phthalate buffer
Temperature C: 65
Duration Hours: 336
Atmosphere: N2
Sample-Specific Conditions
- Dopant: Co
- Co-doped pyrite synthesized via sulfur oxidation, end-member 58 from Fe K-edge XANES
Preparation
- Co-doped FeSm reacted with orthorhombic sulfur in pH 6 anoxic phthalate buffer at 65 °C for 2 weeks.
Measurement
We plan to measure the S K XANES spectrum of this sample.
Questions
Based on all the information above:
1. What candidate reference spectra should be included in a linear combination fit of the Fe K-edge XANES data for the products of Co-doped FeSm sulfur oxidation?
2. Based on the synthesis conditions, estimate the phase fractions of the iron sulfide phases present in this specific end-member (EM 58) as determined by Fe K-edge XANES.
Ground Truth
Material: Co-doped Pyrite
Measurement: Fe K-edge XANES, micro-XANES at SSRL beamline 2-3
Fit method: Linear combination fitting (LCF) of PCA-derived end-member spectra
Phase fractions: (±15%)
| Phase | Fraction |
|---|---|
| Pyrite | 0.42 |
| Marcasite | 0.59 |
Fit basis (paper's reference spectra):
- Pyrite
- Marcasite
- FeS
- Pyrrhotite
- Maghemite
Source evidence: Table 2, page 6
Key reasoning: The sulfur oxidation of Co-doped FeSm produced predominantly pyrite. While the Fe K-edge XANES LCF for this specific end-member yielded a mix of pyrite (42%) and marcasite (59%), the authors note this likely reflects the very similar orbital energy levels and Fe XANES spectra of pyrite and marcasite, rather than the actual presence of a large marcasite phase. The presence of Co also impeded the complete reaction of FeSm to pyrite compared to metal-free systems.
Reasoning source: Discussion section, page 9
Scoring Rubric (total: 100 pts)
| Q | Type | Max | Question | Reference Answer | Scoring Criteria |
|---|---|---|---|---|---|
| q1 | identification | 50 | What candidate reference spectra should be included in a linear combination fit of the Fe K-edge XANES data for the products of Co-doped FeSm sulfur oxidation? | The candidate reference spectra for the linear combination fit should include Pyrite, Marcasite, FeS, Pyrrhotite, and Maghemite. These specific phases are expected because the sample was synthesized via the sulfur oxidation of Co-doped FeSm with orthorhombic sulfur in an anoxic (N2) phthalate buffer at 65 °C for 336 hours. Under these conditions, the reaction produces predominantly pyrite, but the Co dopant impedes the complete conversion of FeSm to pyrite compared to metal-free systems, necessitating the inclusion of intermediate or unreacted iron sulfide phases like FeS and pyrrhotite. Furthermore, marcasite is included because it shares very similar orbital energy levels and Fe XANES spectral features with pyrite, while maghemite accounts for any potential oxidized iron species. | Full points for identifying pyrite and marcasite as key reference spectra, with partial credit for including other relevant iron sulfide/oxide phases like FeS, pyrrhotite, or maghemite. |
| q2 | quantification | 50 | Based on the synthesis conditions, estimate the phase fractions of the iron sulfide phases present in this specific end-member (EM 58) as determined by Fe K-edge XANES. | The linear combination fitting of the Fe K-edge XANES data for this end-member yields phase fractions of 42% pyrite and 59% marcasite, with an uncertainty of 15%. These specific values arise from the synthesis conditions, where Co-doped FeSm was reacted with orthorhombic sulfur at 65 °C for 2 weeks to predominantly produce pyrite. The presence of the Co dopant impedes the complete reaction of FeSm to pyrite compared to metal-free systems, affecting the final phase distribution. Importantly, the high fitted fraction of marcasite (59%) does not indicate a large actual presence of this phase in the sample. Instead, this numerical result is an artifact reflecting the very similar orbital energy levels and Fe XANES spectra of pyrite and marcasite. | Full points for estimating approximately 42% pyrite and 59% marcasite. |
Review
#1200
Ni-doped Mackinawite (FeSm)
S K
▶
LLM Prompt
Sample Information
Material: Ni-doped Mackinawite (FeSm)
Method: precipitation
Precursors: 0.6 M ferrous ammonium sulfate, 0.6 M sodium sulfide, NiCl2·6H2O
Temperature C: 25
Atmosphere: N2
Sample-Specific Conditions
- Dopant: Ni
- Ni-doped mackinawite, end-member 26 from Fe K-edge XANES
Preparation
- Synthesized from 0.6 M ferrous ammonium sulfate, 0.6 M sodium sulfide, and NiCl2·6H2O (500 µM Ni) under N2.
Measurement
We plan to measure the S K XANES spectrum of this sample.
Questions
Based on all the information above:
1. Based on the synthesis conditions for Ni-doped mackinawite, what are the expected primary and secondary iron-bearing phases, and what are their approximate phase fractions as determined by Fe K-edge XANES?
2. What reference spectra should be included in the basis set to perform Linear Combination Fitting (LCF) of the Fe K-edge XANES data for this specific sample?
Ground Truth
Material: Ni-doped Mackinawite (FeSm)
Measurement: Fe K-edge XANES at SSRL BL 2-3
Fit method: Linear Combination Fitting (LCF)
Phase fractions: (±15%)
| Phase | Fraction |
|---|---|
| FeS | 0.7 |
| Pyrrhotite | 0.3 |
Fit basis (paper's reference spectra):
- FeS
- Pyrite
- Marcasite
- Pyrrhotite
- Maghemite
Source evidence: Table 2 and text on page 6
Key reasoning: The bulk mineralogy of the synthesized FeSm samples generally matched mackinawite, but could contain minor secondary phases. For the Ni-doped sample specifically, Fe K-edge XANES point spectra (such as end-member 26) were best fit by a linear combination of mostly FeS (mackinawite) and a significant fraction of pyrrhotite. This indicates that pyrrhotite forms as a secondary phase alongside mackinawite during the precipitation process in the presence of Ni.
Reasoning source: Page 6, Results section (text under Figure 3) and Table 2
Scoring Rubric (total: 100 pts)
| Q | Type | Max | Question | Reference Answer | Scoring Criteria |
|---|---|---|---|---|---|
| q1 | quantification | 57 | Based on the synthesis conditions for Ni-doped mackinawite, what are the expected primary and secondary iron-bearing phases, and what are their approximate phase fractions as determined by Fe K-edge XANES? | The expected primary phase is FeS (mackinawite) at a fraction of 0.7, and the secondary phase is pyrrhotite at a fraction of 0.3, with an uncertainty of 15%. These fractions arise from the specific synthesis conditions, which involve precipitation from ferrous ammonium sulfate and sodium sulfide at 25 °C under an N2 atmosphere with 500 µM Ni. While the bulk mineralogy generally matches mackinawite, the presence of the Ni dopant during precipitation causes pyrrhotite to form as a significant secondary phase. Therefore, the Fe K-edge XANES spectrum for this sample (end-member 26) reflects this mixed composition rather than a pure mackinawite phase. | Full points for identifying FeS (mackinawite) as the major phase (~70%) and pyrrhotite as the minor phase (~30%). Deduct points if other phases are incorrectly proposed as major components. |
| q2 | identification | 43 | What reference spectra should be included in the basis set to perform Linear Combination Fitting (LCF) of the Fe K-edge XANES data for this specific sample? | To perform Linear Combination Fitting (LCF) of the Fe K-edge XANES data, the basis set should include reference spectra for FeS, Pyrite, Marcasite, Pyrrhotite, and Maghemite. This specific set of references is necessary because the sample was synthesized via precipitation from ferrous ammonium sulfate and sodium sulfide with a Ni dopant at 25 °C under N2. While these conditions primarily yield mackinawite (FeS), the addition of Ni during the precipitation process induces the formation of secondary phases. Including these various iron sulfide and iron oxide references ensures the LCF can accurately capture both the primary mackinawite and the secondary pyrrhotite that are known to co-precipitate under these specific Ni-doped conditions. | Full points for listing FeS (or mackinawite) and pyrrhotite as the necessary reference spectra. |
Review
#1201
Ni-doped Mackinawite (FeSm)
S K
▶
LLM Prompt
Sample Information
Material: Ni-doped Mackinawite (FeSm)
Method: precipitation
Precursors: 0.6 M ferrous ammonium sulfate, 0.6 M sodium sulfide, NiCl2·6H2O
Temperature C: 25
Atmosphere: N2
Sample-Specific Conditions
- Dopant: Ni
- Ni-doped mackinawite, end-member 30 from Fe K-edge XANES
Preparation
- Synthesized from 0.6 M ferrous ammonium sulfate, 0.6 M sodium sulfide, and NiCl2·6H2O (500 µM Ni) under N2.
Measurement
We plan to measure the S K XANES spectrum of this sample.
Questions
Based on all the information above:
1. What candidate reference spectra are needed to model the Fe K-edge XANES spectrum of this specific end-member region of the Ni-doped mackinawite sample using linear combination fitting?
2. Estimate the phase fractions of the components in this specific end-member region of the Ni-doped mackinawite sample as determined by Fe K-edge XANES.
Ground Truth
Material: Ni-doped Mackinawite (FeSm)
Measurement: Fe K-edge XANES, fluorescence mode, beamline 2-3 at SSRL
Fit method: Linear combination fitting (LCF) of PCA-derived end-members
Phase fractions: (±10%)
| Phase | Fraction |
|---|---|
| FeS | 0.48 |
| Pyrrhotite | 0.54 |
Fit basis (paper's reference spectra):
- FeS
- Pyrite
- Marcasite
- Pyrrhotite
- Maghemite
Source evidence: Table 2, page 6
Key reasoning: Micro-XANES mapping and PCA identified unique end-member spectra in the Ni-doped FeSm sample. Fitting of end-member 30 at the Fe K-edge revealed a mixture of approximately equal parts FeS (mackinawite) and pyrrhotite. The presence of pyrrhotite is consistent with bulk XRD results of the synthesized material, which showed mackinawite with minor greigite and pyrrhotite, potentially due to minor alteration or a secondary phase formed during precipitation.
Reasoning source: Page 4 (XRD results) and Page 6 (Table 2 description)
Scoring Rubric (total: 100 pts)
| Q | Type | Max | Question | Reference Answer | Scoring Criteria |
|---|---|---|---|---|---|
| q1 | identification | 43 | What candidate reference spectra are needed to model the Fe K-edge XANES spectrum of this specific end-member region of the Ni-doped mackinawite sample using linear combination fitting? | To model the Fe K-edge XANES spectrum of this specific end-member region (end-member 30), the candidate reference spectra needed are FeS, pyrite, marcasite, pyrrhotite, and maghemite. The sample was synthesized via precipitation from ferrous ammonium sulfate and sodium sulfide with a NiCl2 dopant at 25 °C under an N2 atmosphere. While the primary intended product is Ni-doped mackinawite (FeS), these additional reference phases are required because the precipitation process can yield secondary phases or minor alterations. Micro-XANES mapping and PCA identified unique end-member spectra, and bulk XRD confirmed that the synthesized material contains mackinawite alongside secondary phases like pyrrhotite formed during precipitation. | Full credit for identifying FeS (mackinawite) and pyrrhotite as the necessary reference spectra. |
| q2 | quantification | 57 | Estimate the phase fractions of the components in this specific end-member region of the Ni-doped mackinawite sample as determined by Fe K-edge XANES. | The phase fractions for this specific end-member region (end-member 30) are estimated to be 0.48 FeS and 0.54 pyrrhotite, with an uncertainty of 10%. The sample was prepared by precipitation at 25 °C under N2 using ferrous ammonium sulfate, sodium sulfide, and NiCl2 precursors. This specific mixture of approximately equal parts mackinawite (FeS) and pyrrhotite arises because the room-temperature precipitation conditions led to the formation of secondary phases alongside the primary Ni-doped mackinawite. The presence of this significant pyrrhotite fraction is consistent with bulk XRD results, indicating minor alteration or secondary phase formation occurred during the synthesis. | Full credit for estimating approximately 48% FeS and 54% pyrrhotite (or roughly equal amounts of both). |
Review
#1202
Ni-doped FeSm treated with H2S
S K
▶
LLM Prompt
Sample Information
Material: Ni-doped FeSm treated with H2S
Method: H2S oxidation
Precursors: Ni-doped FeSm, Na2S (pH 6), Ti(III) citrate, phthalate buffer
Temperature C: 80
Duration Hours: 96
Atmosphere: N2
Sample-Specific Conditions
- Treatment: H2S oxidation
- Ni-doped mackinawite treated with H2S, end-member 1 from Fe K-edge XANES
Preparation
- Dry Ni-doped FeSm was weighed into a glass headspace vial. Phthalate buffer, Ti(III) citrate solution, and Na2S solution (adjusted to pH 6 to form H2S) were introduced via syringes. Incubated at 80 °C for 4 days.
Measurement
We plan to measure the S K XANES spectrum of this sample.
Questions
Based on all the information above:
1. If Fe K-edge XANES data were collected for this sample, what reference spectra should be included in the linear combination fitting (LCF) basis set to properly analyze the phase composition?
2. Explain the physical reasoning behind the observed phase composition. Why does the sample not fully convert to pyrite despite the H2S oxidation treatment?
Ground Truth
Material: Ni-doped FeSm treated with H2S
Measurement: Fe K-edge XANES
Fit method: Linear combination fitting
Phase fractions: (±10%)
| Phase | Fraction |
|---|---|
| FeS | 0.95 |
Fit basis (paper's reference spectra):
- FeS
- Pyrite
- Marcasite
- Pyrrhotite
- Maghemite
Source evidence: Table 2, page 6; Discussion, pages 8-9
Key reasoning: The H2S oxidation method failed to produce pyrite from FeSm synthesized with Ni after 4 days of reaction at 80 °C. The product remained predominantly mackinawite (FeS), as verified by point Fe XANES analysis which yielded 95% FeS. This indicates that Ni impurities may impede the rate of pyritization, consistent with the generally slow reaction kinetics between mackinawite and H2S.
Reasoning source: Discussion section, pages 8-9
Scoring Rubric (total: 100 pts)
| Q | Type | Max | Question | Reference Answer | Scoring Criteria |
|---|---|---|---|---|---|
| q1 | identification | 43 | If Fe K-edge XANES data were collected for this sample, what reference spectra should be included in the linear combination fitting (LCF) basis set to properly analyze the phase composition? | The linear combination fitting (LCF) basis set for the Fe K-edge XANES data should include FeS (mackinawite), pyrite, marcasite, pyrrhotite, and maghemite. These specific reference spectra are required because the sample consists of Ni-doped FeSm subjected to H2S oxidation at 80 °C for 96 hours, a process intended to drive the transformation of mackinawite into more stable iron sulfides. Pyrite, marcasite, and pyrrhotite represent the expected potential products of this sulfidation reaction. FeS must be included to account for unreacted precursor material, which is highly expected because Ni impurities impede the rate of pyritization, compounding the generally slow reaction kinetics between mackinawite and H2S. Finally, maghemite is included to account for any oxidized iron phases present in the sample. | Full points for identifying FeS (mackinawite), pyrite, marcasite, pyrrhotite, and maghemite as the necessary reference spectra. |
| q3 | reasoning | 57 | Explain the physical reasoning behind the observed phase composition. Why does the sample not fully convert to pyrite despite the H2S oxidation treatment? | Despite being treated with H2S at 80 °C for 96 hours, the sample fails to fully convert to pyrite and remains predominantly mackinawite (95% FeS). This arrested transformation occurs because the precursor material is Ni-doped FeSm, and the presence of these Ni impurities significantly impedes the rate of pyritization. Furthermore, the baseline reaction kinetics between mackinawite and H2S are generally slow. Consequently, the 4-day incubation period under these specific H2S oxidation conditions is insufficient to overcome the kinetic barriers introduced by the Ni dopant, resulting in a final composition dominated by unreacted FeS. | Full points for explaining that the H2S oxidation method is kinetically slow and unsuccessful at producing pyrite from this precursor, and that Ni impurities likely impede the rate of pyritization, leaving the sample as predominantly unconverted mackinawite. |
Review
#1203
Ni-doped Pyrite
S K
▶
LLM Prompt
Sample Information
Material: Ni-doped Pyrite
Method: sulfur oxidation
Precursors: Ni-doped FeSm, orthorhombic sulfur, phthalate buffer
Temperature C: 65
Duration Hours: 336
Atmosphere: N2
Sample-Specific Conditions
- Dopant: Ni
- Ni-doped pyrite synthesized via sulfur oxidation, end-member 43 from Fe K-edge XANES
Preparation
- Ni-doped FeSm reacted with orthorhombic sulfur in pH 6 anoxic phthalate buffer at 65 °C for 2 weeks.
Measurement
We plan to measure the S K XANES spectrum of this sample.
Questions
Based on all the information above:
1. What candidate reference spectra should be included in the linear combination fitting basis to analyze the Fe K-edge XANES of Ni-doped pyrite synthesized via sulfur oxidation of FeSm?
2. Based on the synthesis conditions (Ni-doped FeSm reacted with orthorhombic sulfur at 65 °C for 2 weeks), estimate the phase fractions of the resulting product as determined by Fe K-edge XANES.
Ground Truth
Material: Ni-doped Pyrite
Measurement: Fe K-edge XANES at SSRL BL 2-3
Fit method: Linear combination fitting of PCA-derived end-members
Phase fractions: (±15%)
| Phase | Fraction |
|---|---|
| Pyrite | 0.83 |
| Marcasite | 0.14 |
Fit basis (paper's reference spectra):
- FeS
- Pyrite
- Marcasite
- Pyrrhotite
- Maghemite
Source evidence: Table 2, page 6
Key reasoning: The sulfur oxidation method successfully produced pyrite from Ni-doped FeSm precursors. Fe K-edge XANES fitting of the end-member spectrum yielded predominantly pyrite (83%). The minor marcasite component (14%) in the fit likely reflects the similar sulfur oxidation state and orbital energy levels of Fe in pyrite and marcasite, rather than the actual presence of marcasite, as their Fe XANES spectra are very similar.
Reasoning source: Discussion section, page 9
Scoring Rubric (total: 100 pts)
| Q | Type | Max | Question | Reference Answer | Scoring Criteria |
|---|---|---|---|---|---|
| q1 | identification | 46 | What candidate reference spectra should be included in the linear combination fitting basis to analyze the Fe K-edge XANES of Ni-doped pyrite synthesized via sulfur oxidation of FeSm? | The linear combination fitting basis for this analysis should include FeS, Pyrite, Marcasite, Pyrrhotite, and Maghemite. These specific reference spectra are chosen based on the synthesis conditions, where Ni-doped FeSm was reacted with orthorhombic sulfur in an anoxic phthalate buffer at 65 °C for 2 weeks. The sulfur oxidation method is designed to produce pyrite, making it the primary expected phase, while FeS and pyrrhotite account for potential unreacted precursors or intermediate iron sulfides. Maghemite is included to check for any incidental iron oxidation. Finally, marcasite must be included because its similar sulfur oxidation state and Fe orbital energy levels result in a nearly identical Fe XANES spectrum to pyrite, which is critical for accurate spectral fitting. | Full credit for identifying Pyrite, Marcasite, FeS, Pyrrhotite, and Maghemite as basis spectra. Partial credit for identifying at least Pyrite, Marcasite, and a precursor/intermediate like FeS. |
| q2 | quantification | 54 | Based on the synthesis conditions (Ni-doped FeSm reacted with orthorhombic sulfur at 65 °C for 2 weeks), estimate the phase fractions of the resulting product as determined by Fe K-edge XANES. | Based on the Fe K-edge XANES linear combination fitting, the estimated phase fractions are 83% pyrite and 14% marcasite, with an uncertainty of 15%. These values arise because reacting the Ni-doped FeSm precursor with orthorhombic sulfur at 65 °C for 336 hours successfully drives the sulfur oxidation process to predominantly form pyrite. The minor 14% marcasite component likely does not represent actual marcasite formation under these anoxic pH 6 conditions. Instead, this fraction appears in the fit because pyrite and marcasite share similar sulfur oxidation states and Fe orbital energy levels, making their Fe XANES spectra very similar. Thus, the synthesis conditions effectively produce a dominant pyrite phase, with the marcasite fraction reflecting spectral overlap rather than a distinct secondary product. | Full credit for estimating approximately 80-85% pyrite and 10-15% marcasite. Partial credit for identifying pyrite as the dominant phase (>80%) with a minor secondary component. |
Review
#1204
Ni-doped Pyrite
S K
▶
LLM Prompt
Sample Information
Material: Ni-doped Pyrite
Method: sulfur oxidation
Precursors: Ni-doped FeSm, orthorhombic sulfur, phthalate buffer
Temperature C: 65
Duration Hours: 336
Atmosphere: N2
Sample-Specific Conditions
- Dopant: Ni
- Ni-doped pyrite synthesized via sulfur oxidation, end-member 45 from Fe K-edge XANES
Preparation
- Ni-doped FeSm reacted with orthorhombic sulfur in pH 6 anoxic phthalate buffer at 65 °C for 2 weeks.
Measurement
We plan to measure the S K XANES spectrum of this sample.
Questions
Based on all the information above:
1. Based on the synthesis conditions (sulfur oxidation of Ni-doped FeSm) and potential sample handling artifacts, what reference spectra should be included in the basis set for Linear Combination Fitting of the Fe K-edge XANES data?
2. Estimate the phase fractions for this specific end-member (EM 45) of the Ni-doped pyrite sample, considering that it underwent unintended oxidation during storage or analysis.
Ground Truth
Material: Ni-doped Pyrite
Measurement: Fe K-edge XANES
Fit method: Linear Combination Fitting (LCF)
Phase fractions: (±15%)
| Phase | Fraction |
|---|---|
| Marcasite | 0.37 |
| Maghemite | 0.51 |
Fit basis (paper's reference spectra):
- FeS
- Pyrite
- Marcasite
- Pyrrhotite
- Maghemite
Source evidence: Table 2, page 6
Key reasoning: The Fe XANES fit for this end-member includes maghemite and marcasite. The presence of maghemite indicates unintended Fe oxidation that likely occurred during sample embedding, storage, or analysis, as it was not detected by XRD prior to these steps. The inclusion of marcasite in the fit likely reflects the very similar Fe XANES spectra of pyrite and marcasite, which share the same sulfur oxidation state and similar orbital energy levels, rather than the actual presence of marcasite.
Reasoning source: Page 9, Discussion section
Scoring Rubric (total: 100 pts)
| Q | Type | Max | Question | Reference Answer | Scoring Criteria |
|---|---|---|---|---|---|
| q1 | identification | 46 | Based on the synthesis conditions (sulfur oxidation of Ni-doped FeSm) and potential sample handling artifacts, what reference spectra should be included in the basis set for Linear Combination Fitting of the Fe K-edge XANES data? | The basis set for Linear Combination Fitting of the Fe K-edge XANES data should include FeS, Pyrite, Marcasite, Pyrrhotite, and Maghemite. These specific phases are expected because the sample was synthesized via the reaction of Ni-doped FeSm with orthorhombic sulfur at 65 °C in an anoxic environment, making iron sulfide phases like FeS, pyrite, and pyrrhotite relevant to the reaction pathway. Maghemite must be included because unintended iron oxidation likely occurred during sample embedding, storage, or analysis, despite the initial N2 atmosphere. Additionally, marcasite is included in the fit basis because its Fe XANES spectrum is very similar to that of pyrite, sharing the same sulfur oxidation state and similar orbital energy levels, which can cause it to be selected in the fit even if not physically present. | Full credit for identifying iron sulfides (pyrite, marcasite, FeS, pyrrhotite) and an iron oxide/oxidation product (maghemite) to account for handling artifacts. |
| q2 | quantification | 54 | Estimate the phase fractions for this specific end-member (EM 45) of the Ni-doped pyrite sample, considering that it underwent unintended oxidation during storage or analysis. | For this specific end-member (EM 45) of the Ni-doped pyrite sample, the estimated phase fractions are 0.51 (51%) maghemite and 0.37 (37%) marcasite, with a 15% uncertainty. The high fraction of maghemite results from unintended Fe oxidation that occurred after the initial anoxic synthesis, likely during sample embedding, storage, or analysis. The 37% marcasite fraction does not necessarily indicate its actual physical presence from the 65 °C sulfur oxidation synthesis. Instead, this fraction arises because the Fe XANES spectra of pyrite and marcasite are extremely similar due to their shared sulfur oxidation states and orbital energy levels, causing the fitting algorithm to select marcasite to represent the pyrite-like local structure. | Full credit for estimating ~50% maghemite (or iron oxide) and ~35-40% marcasite (or pyrite/marcasite mixture). Partial credit for identifying significant oxidation (maghemite) alongside a disulfide phase. |
Review
Gauging Iron-Sulfur Cubane Reactivity from Covalency: Trends with Oxidation State
ESRF-BM23
Pure Phase
Liam Grunwald, Daniel Abbott, Victor Mougel
DOI: 10.26434/chemrxiv-2023-bcxh8
1 scenario
▶
#1205
iron-sulfur cubane
Fe K-edge
▶
LLM Prompt
Sample Information
Material: iron-sulfur cubane
Oxidation State: mixed to all-ferric
- complete redox series of cubane-type iron-sulfur clusters
Measurement
We plan to measure the Fe K-edge XANES spectrum of this sample.
Questions
Based on all the information above:
1. Identify the specific material phase and its oxidation state range present in this sample.
2. Based on the provided context, what is the primary utility of the Fe K-edge position when analyzing this complete redox series of iron-sulfur clusters?
Ground Truth
Compound: iron-sulfur cubane
Oxidation state: mixed to all-ferric
Measurement: Fe K-edge
Edge position: not reported
Spectral shape: not reported
Distinguishing features: not reported
Key reasoning: The Fe K-edge position provides a qualitative but convenient alternative to the traditional spectroscopic descriptors used to identify oxidation states in these systems.
Reasoning source: text
Scoring Rubric (total: 100 pts)
| Q | Type | Max | Question | Reference Answer | Scoring Criteria |
|---|---|---|---|---|---|
| q1 | identification | 40 | Identify the specific material phase and its oxidation state range present in this sample. | The specific material phase present in this sample is 100% iron-sulfur cubane. The oxidation state of this material ranges from mixed to all-ferric. This specific phase and its varying oxidation states are present because the sample consists of a complete redox series of cubane-type iron-sulfur clusters. By analyzing this complete series, the Fe K-edge position can be utilized as a qualitative but convenient alternative to traditional spectroscopic descriptors for identifying the varying oxidation states in these systems. | Award 20 points for identifying the material as iron-sulfur cubane and 20 points for stating the oxidation state is mixed to all-ferric. |
| q2 | reasoning | 60 | Based on the provided context, what is the primary utility of the Fe K-edge position when analyzing this complete redox series of iron-sulfur clusters? | When analyzing this complete redox series of iron-sulfur clusters, the primary utility of the Fe K-edge position is that it provides a qualitative but convenient alternative to traditional spectroscopic descriptors used to identify oxidation states. This utility is directly enabled by the sample conditions, which feature a complete redox series of cubane-type clusters spanning from mixed to all-ferric oxidation states. Because the sample covers this comprehensive redox range, the Fe K-edge XANES measurement can effectively track and identify the varying oxidation states across the entire system. | Award full points if the answer explains that the Fe K-edge position serves as a qualitative but convenient alternative to traditional spectroscopic descriptors for identifying oxidation states in these systems. |
Review
The Dopamine Assisted Synthesis of MoO3/Carbon Electrodes With Enhanced Capacitance in Aqueous Electrolyte
BNL-NSLS-II-8-ID
Synthesis
Nazgol Norouzi et al.
DOI: 10.3389/fchem.2022.873462
2 scenarios
▶
#1206
(Dopa)xMoOy
Mo K-edge
▶
LLM Prompt
Sample Information
Material: (Dopa)xMoOy
Method: sol-gel
Precursors: Mo powder, dopamine hydrochloride, H2O2 (Mo:Dopa molar ratio 5:1)
Temperature C: 60
Cooling Method: freezer at -20°C
Post Treatment: freeze-drying
Sample-Specific Conditions
- Synthesis stage: Pre-hydrothermal treatment
- Dopamine preintercalated molybdenum oxide precursor synthesized via sol-gel method
Preparation
- Dopamine hydrochloride dissolved in 2 ml deionized water, followed by addition of stoichiometric metallic Mo powder (Mo:Dopa = 5:1). Hydrogen peroxide (30 wt% H2O2) added dropwise until Mo dissolved. Temperature set to 60°C until viscosity increased. Cooled to form a gel, kept at -20°C overnight, and freeze-dried at 0.001 mbar and -84°C.
Measurement
We plan to measure the Mo K-edge XANES spectrum of this sample.
Questions
Based on all the information above:
1. What candidate reference spectra should be used as basis functions for Linear Combination Fitting (LCF) of the Mo K-edge XANES spectrum for this dopamine-preintercalated precursor?
2. Based on the synthesis conditions (sol-gel method with a Mo:Dopa molar ratio of 5:1), estimate the relative fractions of the MoO2 and MoO3 local environments in the precursor.
3. Explain the physical reasoning for the observed phase composition and the resulting average Mo oxidation state of +5.6 in this precursor, specifically considering the role of the Mo:Dopa ratio.
Ground Truth
Material: (Dopa)xMoOy precursor
Measurement: Mo K-edge XANES, transmission mode, NSLS-II beamline 8-ID
Fit method: Linear combination fitting (LCF)
Phase fractions: (±3%)
| Phase | Fraction |
|---|---|
| MoO2 | 0.202 |
| MoO3 | 0.798 |
Fit basis (paper's reference spectra):
- MoO2
- MoO3
Source evidence: Table 1 and Figure 6, page 9
Key reasoning: The sol-gel synthesis of the precursor with a Mo:Dopa ratio of 5:1 results in a partially reduced molybdenum oxide with an average oxidation state of +5.6. The limited amount of dopamine allows the layered structure to remain intact while causing some reduction of the Mo species, leading to a local coordination environment that is approximately 80% MoO3-like and 20% MoO2-like.
Reasoning source: Page 3 (Experimental Methods) and Page 6 (Results)
Scoring Rubric (total: 100 pts)
| Q | Type | Max | Question | Reference Answer | Scoring Criteria |
|---|---|---|---|---|---|
| q1 | identification | 20 | What candidate reference spectra should be used as basis functions for Linear Combination Fitting (LCF) of the Mo K-edge XANES spectrum for this dopamine-preintercalated precursor? | The candidate reference spectra for Linear Combination Fitting (LCF) of the Mo K-edge XANES spectrum should be MoO2 and MoO3. These specific reference phases are expected because the sol-gel synthesis utilizes a limited amount of dopamine (Mo:Dopa molar ratio of 5:1) alongside H2O2 and Mo powder at 60°C. This specific precursor ratio allows the layered molybdenum oxide structure to remain largely intact, which corresponds to the MoO3-like phase. Simultaneously, the dopamine causes a partial reduction of the Mo species, creating a mixed local coordination environment that necessitates the inclusion of the reduced MoO2 basis function to accurately model the spectrum. | Award 10 points for identifying MoO2 and 10 points for identifying MoO3 as the necessary reference spectra. |
| q2 | quantification | 40 | Based on the synthesis conditions (sol-gel method with a Mo:Dopa molar ratio of 5:1), estimate the relative fractions of the MoO2 and MoO3 local environments in the precursor. | The relative fractions of the local environments in the precursor are estimated to be 0.798 (79.8%) for MoO3 and 0.202 (20.2%) for MoO2, with an uncertainty of 3%. These specific values result directly from the sol-gel synthesis conditions utilizing a Mo:Dopa molar ratio of 5:1 at 60°C prior to freeze-drying. The limited amount of dopamine in this stoichiometric ratio acts as a mild reducing agent, causing only a partial reduction of the molybdenum species rather than a complete phase transformation. Consequently, the layered structure remains predominantly intact, yielding an approximately 80% MoO3-like environment, while the partial reduction accounts for the roughly 20% MoO2-like environment. | Award 20 points for estimating the MoO3 fraction at approximately 80% (75-85% acceptable) and 20 points for estimating the MoO2 fraction at approximately 20% (15-25% acceptable). |
| q3 | reasoning | 40 | Explain the physical reasoning for the observed phase composition and the resulting average Mo oxidation state of +5.6 in this precursor, specifically considering the role of the Mo:Dopa ratio. | The observed phase composition of approximately 80% MoO3 and 20% MoO2, which yields an average Mo oxidation state of +5.6, is directly driven by the 5:1 Mo:Dopa molar ratio used during the sol-gel synthesis. In this pre-hydrothermal stage, the Mo powder is dissolved using H2O2 and reacted with dopamine hydrochloride at 60°C. Because the amount of dopamine is limited relative to molybdenum, it provides only enough reducing power to partially reduce the Mo species. This limited reduction allows the primary layered molybdenum oxide structure to remain intact as the dominant MoO3-like phase, while introducing a minor fraction of reduced Mo sites as the MoO2-like phase, culminating in the +5.6 average oxidation state. | Award 20 points for explaining that dopamine acts as a reducing agent, causing partial reduction of the Mo species. Award 20 points for noting that the specific 5:1 Mo:Dopa ratio limits this reduction, allowing the material to remain predominantly Mo(VI) (MoO3-like) and keeping the layered structure intact. |
Review
#1207
MoO3/C
Mo K-edge
▶
LLM Prompt
Sample Information
Material: MoO3/C
Method: hydrothermal
Precursors: (Dopa)xMoOy precursor
Temperature C: 180
Duration Hours: 24
Post Treatment: filtered, washed with deionized water, dried at 105°C in air
Sample-Specific Conditions
- Synthesis stage: Post-hydrothermal treatment
- Hydrothermally treated dopamine preintercalated molybdenum oxide
Preparation
- 300 mg of the (Dopa)xMoOy precursor was placed into 12 ml of water in a 23 ml Teflon-lined autoclave and kept at 180°C for 24 h. The product was filtered, washed with deionized water, and dried at 105°C in air.
Measurement
We plan to measure the Mo K-edge XANES spectrum of this sample.
Questions
Based on all the information above:
1. What candidate reference spectra are needed to perform Linear Combination Fitting (LCF) on the Mo K-edge XANES spectrum of this hydrothermally treated sample?
2. Based on the synthesis conditions, estimate the phase fractions of the Mo species in the resulting HT-MoO3/C sample.
3. Explain the physical reasoning for the observed phase composition and Mo oxidation state in the HT-MoO3/C sample following the hydrothermal treatment of the (Dopa)xMoOy precursor.
Ground Truth
Material: MoO3/C
Measurement: Mo K-edge transmission XAS at NSLS-II beamline 8-ID
Fit method: Linear combination fitting (LCF)
Phase fractions: (±2%)
| Phase | Fraction |
|---|---|
| MoO2 | 0.007 |
| MoO3 | 0.992 |
Fit basis (paper's reference spectra):
- MoO2
- MoO3
Source evidence: Table 1, page 9
Key reasoning: The (Dopa)xMoOy precursor has a mixed Mo oxidation state of +5.6, containing a significant fraction of MoO2. Hydrothermal treatment of this precursor at 180°C for 24 h oxidizes the molybdenum center, leading to an oxidation state of +6.0 in the HT-MoO3/C product, which corresponds to a nearly pure MoO3 phase with only trace amounts of MoO2 remaining.
Reasoning source: Results section, page 6
Scoring Rubric (total: 100 pts)
| Q | Type | Max | Question | Reference Answer | Scoring Criteria |
|---|---|---|---|---|---|
| q1 | identification | 20 | What candidate reference spectra are needed to perform Linear Combination Fitting (LCF) on the Mo K-edge XANES spectrum of this hydrothermally treated sample? | To perform Linear Combination Fitting (LCF) on the Mo K-edge XANES spectrum of this sample, reference spectra for MoO3 and MoO2 are required. These specific reference phases are needed because the initial (Dopa)xMoOy precursor contains a significant fraction of MoO2 with a mixed Mo oxidation state of +5.6. During the hydrothermal treatment at 180°C for 24 hours, the molybdenum centers undergo oxidation. This process converts almost all of the precursor into a nearly pure MoO3 phase (Mo +6.0), leaving only trace amounts of the original MoO2 phase in the final HT-MoO3/C product. | Full points if both MoO2 and MoO3 are identified as the necessary reference spectra. |
| q2 | quantification | 40 | Based on the synthesis conditions, estimate the phase fractions of the Mo species in the resulting HT-MoO3/C sample. | The estimated phase fractions for the HT-MoO3/C sample are 99.2% MoO3 and 0.7% MoO2, with an uncertainty of 2%. These specific values result from the hydrothermal treatment of the dopamine preintercalated (Dopa)xMoOy precursor at 180°C for 24 hours. While the initial precursor contains a significant fraction of MoO2 (average oxidation state +5.6), the hydrothermal conditions strongly oxidize the molybdenum centers. Consequently, the reaction drives the material to an oxidation state of +6.0, yielding a nearly pure MoO3 phase and leaving only a 0.7% trace fraction of unoxidized MoO2. | Full points if the estimated fractions are approximately 99% MoO3 and 1% MoO2 (or >98% MoO3 and <2% MoO2). |
| q3 | reasoning | 40 | Explain the physical reasoning for the observed phase composition and Mo oxidation state in the HT-MoO3/C sample following the hydrothermal treatment of the (Dopa)xMoOy precursor. | The observed phase composition of nearly pure MoO3 (99.2%) with trace MoO2 (0.7%) arises directly from the oxidation of the (Dopa)xMoOy precursor during synthesis. Initially, the dopamine preintercalated molybdenum oxide precursor possesses a mixed Mo oxidation state of +5.6, which includes a significant fraction of MoO2. When subjected to hydrothermal treatment in water at 180°C for 24 hours, followed by drying at 105°C in air, the molybdenum centers are oxidized. This processing drives the molybdenum to a fully oxidized +6.0 state, effectively converting the mixed-valence precursor into a highly pure MoO3/C product with only residual traces of MoO2 remaining. | Full points if the explanation correctly notes that the hydrothermal treatment oxidizes the partially reduced precursor (which contained MoO2) to a fully oxidized Mo+6 state, resulting in predominantly MoO3. |
Review
Iron dissolution from Patagonian dust in the Southern Ocean: under present and future conditions
APS
Environmental
Clément Demasy et al.
DOI: 10.3389/fmars.2024.1363088
1 scenario
▶
#1208
desert dust
Fe K-edge
▶
LLM Prompt
Sample Information
Material: desert dust
Sample Origin: Lago Argentino, Patagonia (50.29°S-71.81°W)
Sample-Specific Conditions
- Incubation condition: Dry
- Unincubated dry dust generated from Patagonian soil
Measurement
We plan to measure the Fe K-edge XANES spectrum of this sample.
Questions
Based on all the information above:
1. What candidate reference spectra should be included in a linear combination fitting (LCF) analysis to accurately model the Fe K-edge XANES spectrum of this dry Patagonian desert dust?
2. Estimate the relative phase fractions of the primary Fe-bearing minerals present in this unincubated Patagonian dust sample.
3. Explain the geological and physical reasoning for the expected Fe oxidation state distribution and the specific mineral phases found in this Patagonian dust sample.
Ground Truth
Material: Patagonian desert dust
Measurement: Fe K-edge micro-XANES at APS Beamline 2-ID-D
Fit method: Linear combination fitting (LCF)
Phase fractions: (±10%)
| Phase | Fraction |
|---|---|
| heterosite | 0.77 |
| Fe(III) sulfate hydrate | 0.2 |
| magnetite | 0.03 |
Fit basis (paper's reference spectra):
- heterosite
- Fe(III) sulfate hydrate
- magnetite
Source evidence: Section 3.1, Page 7; Figure 1
Key reasoning: The Patagonian dust is of lithogenic origin, dominated by Fe(III) minerals with a Fe(II)/Fe(III) ratio of 0.25 (approximately 20% Fe(II)). The predominant Fe-minerals identified are heterosite and Fe(III) sulfate hydrate. This composition reflects the natural weathering of the crustal source in Patagonia, with the 20% Fe(II) content falling in the upper range of typical crustal signatures, distinguishing it from highly anthropogenic or volcanic sources.
Reasoning source: Section 3.1 (Page 7) and Section 3.2 (Page 9)
Scoring Rubric (total: 100 pts)
| Q | Type | Max | Question | Reference Answer | Scoring Criteria |
|---|---|---|---|---|---|
| q1 | identification | 25 | What candidate reference spectra should be included in a linear combination fitting (LCF) analysis to accurately model the Fe K-edge XANES spectrum of this dry Patagonian desert dust? | The linear combination fitting (LCF) analysis for this dry Patagonian desert dust should include reference spectra for heterosite, Fe(III) sulfate hydrate, and magnetite. These specific phases are expected because the unincubated dust originates from Patagonian soil, which is of lithogenic origin and reflects the natural weathering of the local crustal source. This natural weathering environment produces a mineralogy dominated by Fe(III) minerals, alongside a minor Fe(II) component that aligns with typical crustal signatures rather than anthropogenic or volcanic sources. | Full points for identifying heterosite, Fe(III) sulfate hydrate, and magnetite as the primary reference phases. |
| q2 | quantification | 35 | Estimate the relative phase fractions of the primary Fe-bearing minerals present in this unincubated Patagonian dust sample. | The estimated relative phase fractions for this unincubated Patagonian dust sample are 0.77 (77%) heterosite, 0.20 (20%) Fe(III) sulfate hydrate, and 0.03 (3%) magnetite, with an uncertainty of 10%. These specific values result from the dry, lithogenic nature of the Patagonian soil, which undergoes natural crustal weathering to produce a predominantly Fe(III)-rich mineralogy. The resulting composition yields an overall Fe(II)/Fe(III) ratio of 0.25 (approximately 20% total Fe(II)), which falls in the upper range of typical crustal signatures and explains the overwhelming dominance of the oxidized phases over the minor magnetite fraction. | Full points for estimating fractions within ±10% of the ground truth: heterosite (~77%), Fe(III) sulfate hydrate (~20%), and magnetite (~3%). |
| q3 | reasoning | 40 | Explain the geological and physical reasoning for the expected Fe oxidation state distribution and the specific mineral phases found in this Patagonian dust sample. | The unincubated dry dust from Lago Argentino, Patagonia, is of purely lithogenic origin, meaning its composition is driven by the natural weathering of the local crustal source. This weathering process naturally favors the formation of oxidized Fe(III) minerals, leading to the predominance of heterosite and Fe(III) sulfate hydrate in the sample. The resulting Fe oxidation state distribution features an Fe(II)/Fe(III) ratio of 0.25, corresponding to approximately 20% Fe(II) content. This specific distribution and the presence of minor magnetite fall within the upper range of typical crustal signatures, clearly distinguishing the natural Patagonian dust from highly anthropogenic or volcanic sources. | Full points for explaining that the dust is of lithogenic origin (natural crustal weathering), which results in a dominance of Fe(III) minerals (heterosite and Fe(III) sulfate hydrate) and a crustal signature of approximately 20% Fe(II). |
Review
Relationship Between Hg Speciation and Hg Methylation/Demethylation Processes in the Sulfate-Reducing Bacterium Pseudodesulfovibrio hydrargyri: Evidences From HERFD-XANES and Nano-XRF
APS
Environmental
Marie-Pierre Isaure et al.
DOI: 10.3389/fmicb.2020.584715
13 scenarios
▶
#1209
bacterial cells
Hg L3
▶
LLM Prompt
Sample Information
Material: bacterial cells
Sample Origin: laboratory culture
Sample-Specific Conditions
- IHg concentration: 0.05 µM
- Pseudodesulfovibrio hydrargyri BerOc1 exposed to 0.05 µM inorganic mercury (IHg)
Measurement
We plan to measure the Hg L3 XANES spectrum of this sample.
Questions
Based on all the information above:
1. Based on the sample conditions (Pseudodesulfovibrio hydrargyri BerOc1 exposed to 0.05 µM IHg), what are the expected Hg phases and their approximate fractions?
2. What reference spectra would be most appropriate to include in a linear combination fitting (LCF) basis set to model the Hg speciation in this sample?
Ground Truth
Material: bacterial cells
Measurement: Hg L3-edge HERFD-XANES at FAME-UHD beamline (ESRF)
Fit method: linear combination fitting (LCF)
Phase fractions: (±2%)
| Phase | Fraction |
|---|---|
| CH3Hg-Cys2 | 0.13 |
| βHgS | 0.84 |
Fit basis (paper's reference spectra):
- CH3Hg-Cys2
- HgCys4
- Hg(0)
- βHgS
- Hg(SR)2
Source evidence: Page 5 text and Figure 3B
Key reasoning: At the lowest IHg exposure (0.05 µM), the methylating strain BerOc1 actively produces MeHg, which is identified as a CH3Hg-cysteine2 form (13%). The methylation process is not saturated at this low concentration, allowing for the detection of the methylated species. The dominant species is a tetracoordinated βHgS form (84%), which likely corresponds to Hg/S enriched nano-sized extracellular particles or Hg-thiol compounds formed in the cell and exported.
Reasoning source: Page 5 (Results: Hg Speciation by Hg L3-Edge HERFD-XANES) and Page 9 (Discussion: Formation of βHgS Like Compounds)
Scoring Rubric (total: 100 pts)
| Q | Type | Max | Question | Reference Answer | Scoring Criteria |
|---|---|---|---|---|---|
| q1 | quantification | 57 | Based on the sample conditions (Pseudodesulfovibrio hydrargyri BerOc1 exposed to 0.05 µM IHg), what are the expected Hg phases and their approximate fractions? | The expected Hg phases for this sample are βHgS at approximately 84% and CH3Hg-Cys2 at approximately 13%, with an uncertainty of 2%. These specific fractions arise because, at the low inorganic mercury exposure of 0.05 µM, the methylation process in the methylating strain BerOc1 is not saturated. This allows the actively produced methylmercury (CH3Hg-Cys2) to be clearly detected at 13%. Meanwhile, the dominant 84% βHgS fraction results from the bacteria forming tetracoordinated Hg/S-enriched nano-sized extracellular particles or Hg-thiol compounds that are produced in the cell and exported. | Award 20 points for identifying βHgS as the dominant phase (approx. 84%) and 20 points for identifying a methylated Hg-thiol species (CH3Hg-Cys2) as the minor phase (approx. 13%). |
| q2 | identification | 43 | What reference spectra would be most appropriate to include in a linear combination fitting (LCF) basis set to model the Hg speciation in this sample? | An appropriate linear combination fitting (LCF) basis set for this sample should include CH3Hg-Cys2, HgCys4, Hg(0), βHgS, and Hg(SR)2 reference spectra. These specific references are required because the Pseudodesulfovibrio hydrargyri BerOc1 bacterial cells actively metabolize the 0.05 µM inorganic mercury (IHg) exposure. The CH3Hg-Cys2 reference is necessary because the low IHg concentration does not saturate the bacteria's methylation process, leading to active methylmercury production. Furthermore, the βHgS and various Hg-thiol references (HgCys4, Hg(SR)2) are needed to model the dominant tetracoordinated Hg/S-enriched extracellular nanoparticles and exported Hg-thiol compounds formed by the cells under these conditions. | Award 10 points for including βHgS, 10 points for including a methylated Hg-thiol reference (e.g., CH3Hg-Cys2), and 10 points for including other relevant biological/environmental Hg references (e.g., HgCys4, Hg(SR)2, Hg(0)). |
Review
#1210
bacterial cells
Hg L3
▶
LLM Prompt
Sample Information
Material: bacterial cells
Sample Origin: laboratory culture
Sample-Specific Conditions
- IHg concentration: 0.5 µM
- Pseudodesulfovibrio hydrargyri BerOc1 exposed to 0.5 µM inorganic mercury (IHg)
Measurement
We plan to measure the Hg L3 XANES spectrum of this sample.
Questions
Based on all the information above:
1. What candidate reference spectra should be considered for the linear combination fitting (LCF) basis of this bacterial sample exposed to inorganic mercury?
2. Estimate the phase fractions of the Hg species present in the BerOc1 cells exposed to 0.5 µM IHg.
3. Explain the biological and chemical reasoning for the formation of these specific Hg species at this low IHg exposure concentration.
Ground Truth
Material: bacterial cells
Measurement: Hg L3-edge HERFD-XANES at FAME-UHD beamline (ESRF)
Fit method: linear combination fitting (LCF)
Phase fractions: (±2%)
| Phase | Fraction |
|---|---|
| CH3Hg-Cys2 | 0.09 |
| βHgS | 0.9 |
Fit basis (paper's reference spectra):
- CH3Hg-Cys2
- βHgS
- HgCys4
- Hg(SR)2
- Hg(0)
Source evidence: Page 5 text; Figure 3B; Supplementary Table 1
Key reasoning: At a low exposure of 0.5 µM IHg, the methylating strain BerOc1 actively produces MeHg, which is detected as a CH3Hg-cysteine2 form (9%). The dominant inorganic species is a tetracoordinated βHgS-like compound (90%). This βHgS phase likely corresponds to extracellular Hg/S enriched nano-particles formed either by interactions of Hg with S-containing biomolecules produced by the bacteria at the cell vicinity, or from exported Hg-thiol compounds. The predominance of this tetracoordinated Hg-S form correlates with conditions where Hg methylation is active.
Reasoning source: Page 5 (Hg Speciation by Hg L3-Edge HERFD-XANES) and Page 9 (Formation of βHgS Like Compounds)
Scoring Rubric (total: 100 pts)
| Q | Type | Max | Question | Reference Answer | Scoring Criteria |
|---|---|---|---|---|---|
| q1 | identification | 20 | What candidate reference spectra should be considered for the linear combination fitting (LCF) basis of this bacterial sample exposed to inorganic mercury? | The candidate reference spectra for the LCF basis should include CH3Hg-Cys2, βHgS, HgCys4, Hg(SR)2, and Hg(0). These specific references are chosen because the sample consists of the methylating bacterial strain Pseudodesulfovibrio hydrargyri BerOc1 exposed to 0.5 µM inorganic mercury (IHg). Under these low exposure conditions, the bacteria actively methylate mercury, necessitating a methylmercury reference like CH3Hg-Cys2. Furthermore, the bacteria interact with the inorganic mercury to form sulfur-coordinated species, requiring references for tetracoordinated βHgS-like compounds, various Hg-thiol complexes (HgCys4, Hg(SR)2), and elemental Hg(0) to capture the full range of potential biological transformations. | Full points for identifying methylated Hg-thiol species (e.g., CH3Hg-Cys2) and inorganic Hg-S species (e.g., βHgS, HgCys4, Hg(SR)2). |
| q2 | quantification | 40 | Estimate the phase fractions of the Hg species present in the BerOc1 cells exposed to 0.5 µM IHg. | The phase fractions for the BerOc1 cells exposed to 0.5 µM IHg are estimated to be 90% βHgS and 9% CH3Hg-Cys2, with an uncertainty of 2%. These specific values result from the low 0.5 µM IHg exposure, which provides conditions where the BerOc1 strain actively methylates mercury, yielding the 9% CH3Hg-Cys2 fraction. The dominant 90% βHgS fraction arises because the bacteria convert the majority of the inorganic mercury into extracellular Hg/S-enriched nanoparticles. This high proportion of tetracoordinated Hg-S forms strongly correlates with the active methylation state of the cells under these specific laboratory culture conditions. | Full points for estimating ~90% βHgS and ~9% CH3Hg-Cys2. Partial credit for identifying βHgS as the heavily dominant phase and a minor methylated Hg-thiol phase. |
| q3 | reasoning | 40 | Explain the biological and chemical reasoning for the formation of these specific Hg species at this low IHg exposure concentration. | At the low exposure concentration of 0.5 µM IHg, the Pseudodesulfovibrio hydrargyri BerOc1 strain is highly active in methylating mercury, leading to the formation of the CH3Hg-Cys2 species. Concurrently, the bacteria process the remaining inorganic mercury into a dominant tetracoordinated βHgS-like compound. This βHgS phase forms as extracellular Hg/S-enriched nanoparticles, which are generated either through the interaction of Hg with sulfur-containing biomolecules near the cell or from exported Hg-thiol compounds. Ultimately, the predominance of this specific tetracoordinated Hg-S form is a direct chemical consequence of the biological conditions where bacterial Hg methylation is actively occurring. | Full points for explaining that at low concentrations, the strain actively methylates Hg (forming CH3Hg-Cys2) and that the dominant βHgS phase forms as extracellular nano-particles due to interactions with S-containing biomolecules or exported Hg-thiols, which is characteristic of the active methylation pathway. |
Review
#1211
bacterial cells
Hg L3
▶
LLM Prompt
Sample Information
Material: bacterial cells
Sample Origin: laboratory culture
Sample-Specific Conditions
- IHg concentration: 5 µM
- Pseudodesulfovibrio hydrargyri BerOc1 exposed to 5 µM inorganic mercury (IHg)
Measurement
We plan to measure the Hg L3 XANES spectrum of this sample.
Questions
Based on all the information above:
1. Based on the sample conditions (BerOc1 exposed to 5 µM IHg), what is the dominant Hg phase expected in the cell pellet, and what physical form does it likely take in the culture?
2. Given that Pseudodesulfovibrio hydrargyri BerOc1 is a methylating strain, why are methylated Hg species not detected in the XANES spectrum of the cell pellet at this specific 5 µM IHg exposure?
3. What candidate reference spectra should be included in the basis set for linear combination fitting to adequately model the speciation of this and similar bacterial samples exposed to varying IHg concentrations?
Ground Truth
Material: bacterial cells
Measurement: Hg L3-edge HERFD-XANES
Fit method: Linear combination fitting (LCF)
Phase fractions: (±2%)
| Phase | Fraction |
|---|---|
| βHgS | 1.0 |
Fit basis (paper's reference spectra):
- βHgS
- Hg-cysteine4
- Hg(SR)2
- Hg(0)
- CH3Hg-cysteine2
Source evidence: Page 5, Figure 3B, and Supplementary Table 1
Key reasoning: At 5 µM IHg exposure, the proportion of methylated forms produced by BerOc1 was too low (methylation potential of 3.1%) compared to total Hg to be detected in the cell pellet by XANES. The dominant species is a tetracoordinated βHgS-like compound, which likely corresponds to Hg/S enriched nano-sized extracellular particles formed by precipitation with endogenous sulfides or interaction with S-containing biomolecules.
Reasoning source: Page 5 (Results: Hg Speciation by Hg L3-Edge HERFD-XANES) and Page 9 (Discussion: Formation of βHgS Like Compounds)
Scoring Rubric (total: 100 pts)
| Q | Type | Max | Question | Reference Answer | Scoring Criteria |
|---|---|---|---|---|---|
| q1 | identification | 35 | Based on the sample conditions (BerOc1 exposed to 5 µM IHg), what is the dominant Hg phase expected in the cell pellet, and what physical form does it likely take in the culture? | The dominant Hg phase expected in the cell pellet is a tetracoordinated βHgS-like compound, which accounts for a fraction of 1.0 (100%) of the speciation. Physically, this phase likely takes the form of Hg/S enriched nano-sized extracellular particles. This specific phase arises because, upon exposure to 5 µM inorganic mercury (IHg), the bacterial cells precipitate the mercury with endogenous sulfides or interact with S-containing biomolecules. Consequently, this precipitation mechanism drives the complete conversion of the IHg into the observed βHgS-like extracellular particles. | Full credit for identifying βHgS (or a tetracoordinated HgS-like compound) as the sole/dominant phase (100%) and mentioning it likely forms nano-sized extracellular particles. |
| q2 | reasoning | 35 | Given that Pseudodesulfovibrio hydrargyri BerOc1 is a methylating strain, why are methylated Hg species not detected in the XANES spectrum of the cell pellet at this specific 5 µM IHg exposure? | Methylated Hg species are not detected in the XANES spectrum because their proportion is too low relative to the total mercury content to be observed. At the specific exposure concentration of 5 µM IHg, the BerOc1 strain exhibits a methylation potential of only 3.1%. Because this small fraction of produced methylated forms falls below the detection threshold of the technique, the spectrum is entirely dominated by the βHgS-like compound. Ultimately, the 5 µM IHg concentration overwhelms the relatively low methylation capacity of the cells, preventing the detection of methylated species in the final pellet. | Full credit for explaining that at 5 µM IHg, the proportion of methylated forms produced is too low (low methylation potential) compared to the total Hg to be detected by XANES in the cell pellet. |
| q3 | identification | 30 | What candidate reference spectra should be included in the basis set for linear combination fitting to adequately model the speciation of this and similar bacterial samples exposed to varying IHg concentrations? | The candidate reference spectra for linear combination fitting should include βHgS, Hg-cysteine4, Hg(SR)2, Hg(0), and CH3Hg-cysteine2. These specific references are required because they represent the full range of potential metabolic and precipitation products formed when bacterial cells are exposed to IHg. For instance, βHgS accounts for the Hg/S enriched nano-sized extracellular particles formed by precipitation with endogenous sulfides, which completely dominates at the 5 µM IHg exposure level. Meanwhile, CH3Hg-cysteine2 accounts for the methylated forms produced by the BerOc1 strain, and the other thiol-bound or reduced references cover alternative interactions with S-containing biomolecules or cellular reduction mechanisms. | Full credit for listing key reference compounds used in the study, including βHgS, tetracoordinated Hg-thiolates (e.g., Hg-cysteine4), linear Hg-thiolates (e.g., Hg(SR)2), Hg(0), and methylated forms (e.g., CH3Hg-cysteine2). |
Review
#1212
bacterial cells
Hg L3
▶
LLM Prompt
Sample Information
Material: bacterial cells
Sample Origin: laboratory culture
Sample-Specific Conditions
- IHg concentration: 50 µM
- Pseudodesulfovibrio hydrargyri BerOc1 exposed to 50 µM inorganic mercury (IHg)
Measurement
We plan to measure the Hg L3 XANES spectrum of this sample.
Questions
Based on all the information above:
1. Based on the sample conditions (BerOc1 exposed to a highly toxic 50 µM IHg concentration), what candidate Hg phases should be considered for linear combination fitting of the XANES spectrum, and what reference spectra are needed?
2. Estimate the relative fractions of the Hg phases in this sample. How does this speciation compare to lower IHg exposures?
3. What physical and biological factors explain the specific Hg speciation and cellular localization observed at this high (50 µM) IHg exposure?
Ground Truth
Material: bacterial cells (Pseudodesulfovibrio hydrargyri BerOc1)
Measurement: Hg L3-edge HERFD-XANES on FAME-UHD beamline at ESRF
Fit method: linear combination fitting (LCF)
Phase fractions: (±2%)
| Phase | Fraction |
|---|---|
| βHgS | 0.31 |
| Hg(SR)2 | 0.4 |
| Hg(0) | 0.29 |
Fit basis (paper's reference spectra):
- βHgS
- Hg(SR)2
- Hg(0)
Source evidence: Page 5 text; Figure 3B; Supplementary Table 1
Key reasoning: At the highest IHg exposure (50 µM), Hg speciation drastically changed compared to lower exposures, showing an odd speciation composed of βHgS, Hg(SR)2, and Hg(0). The toxic level of mercury affected cell homeostasis and impaired cell growth. Nano-XRF showed most Hg was associated with the cell, possibly due to altered controlled uptake or an impaired efflux system resulting in Hg accumulation. The presence of Hg(0) was corroborated by a shift to lower energies in the derivative spectrum, although the strain's ability to reduce Hg(II) is normally very low.
Reasoning source: Page 5 (Hg Speciation by Hg L3-Edge HERFD-XANES), Page 6 (Hg Localization by TEM-X-EDS and Nano-XRF), Page 9 (Formation of βHgS Like Compounds)
Scoring Rubric (total: 100 pts)
| Q | Type | Max | Question | Reference Answer | Scoring Criteria |
|---|---|---|---|---|---|
| q1 | identification | 30 | Based on the sample conditions (BerOc1 exposed to a highly toxic 50 µM IHg concentration), what candidate Hg phases should be considered for linear combination fitting of the XANES spectrum, and what reference spectra are needed? | For linear combination fitting of the Hg L3-edge HERFD-XANES spectrum, the candidate phases and required reference spectra are βHgS, Hg(SR)2, and Hg(0). These specific phases are expected because the highly toxic 50 µM inorganic mercury (IHg) exposure drastically alters the bacterial cells' homeostasis and impairs growth compared to lower exposures. This toxicity likely impairs the cellular efflux system or alters controlled uptake, causing significant Hg accumulation within the cell. Consequently, this disruption results in an unusual speciation profile where Hg binds to cellular thiols (Hg(SR)2), forms mercury sulfide (βHgS), and is reduced to elemental mercury (Hg(0)), despite the strain's normally low reduction capacity. | Must identify βHgS, Hg(SR)2 (or Hg-thiolates), and Hg(0) as candidate phases and necessary reference spectra. |
| q2 | quantification | 35 | Estimate the relative fractions of the Hg phases in this sample. How does this speciation compare to lower IHg exposures? | The relative fractions of the Hg phases in this sample are estimated to be 40% Hg(SR)2, 31% βHgS, and 29% Hg(0), with an uncertainty of 2%. This represents a drastic change in speciation compared to lower IHg exposures, resulting in an odd mixture of these three phases. These specific values result from the highly toxic 50 µM IHg concentration, which severely affects cell homeostasis and impairs cell growth. Because the toxic levels likely impair the cellular efflux system or alter controlled uptake, mercury accumulates heavily in the cells, forcing the formation of βHgS and Hg(SR)2, and triggering an unusual reduction to Hg(0) that is not typically seen in this strain. | Must state fractions close to 31% βHgS, 40% Hg(SR)2, and 29% Hg(0). Must note that this is a drastic change or 'odd speciation' compared to lower exposures (where βHgS dominates). |
| q3 | reasoning | 35 | What physical and biological factors explain the specific Hg speciation and cellular localization observed at this high (50 µM) IHg exposure? | The specific Hg speciation and cellular localization are driven by the severe toxicity of the 50 µM IHg exposure, which impairs cell growth and disrupts normal cellular homeostasis. Nano-XRF reveals that most of the mercury is associated directly with the bacterial cells. This localization and the resulting mixed speciation (βHgS, Hg(SR)2, and Hg(0)) occur because the toxic concentration likely alters controlled uptake or impairs the cellular efflux system, leading to massive intracellular Hg accumulation. Furthermore, the unexpected presence of Hg(0)—evidenced by a shift to lower energies in the derivative spectrum—arises as an anomalous stress response to this extreme accumulation, even though the Pseudodesulfovibrio hydrargyri BerOc1 strain normally has a very low ability to reduce Hg(II). | Must mention that the toxic level of Hg affects cell homeostasis and growth. Must mention high internalization/accumulation of Hg in the cell, possibly due to altered uptake or impaired efflux. Must mention the unusual presence of Hg(0) despite the strain's normally low reduction capacity. |
Review
#1213
bacterial cells
Hg L3
▶
LLM Prompt
Sample Information
Material: bacterial cells
Sample Origin: laboratory culture
Sample-Specific Conditions
- IHg concentration: 0.5 µM
- Desulfovibrio alaskensis G200 exposed to 0.5 µM inorganic mercury (IHg)
Measurement
We plan to measure the Hg L3 XANES spectrum of this sample.
Questions
Based on all the information above:
1. Based on the sample conditions (non-methylating strain G200 exposed to 0.5 µM IHg), what are the expected Hg phases and their approximate relative fractions?
2. Explain the biological and chemical reasoning for the observed Hg speciation in this sample, specifically addressing the absence of methylated forms and the proposed origin of the dominant phase.
3. What candidate reference spectra should be included in the linear combination fitting (LCF) basis to accurately model the Hg L3-edge XANES spectrum of this sample?
Ground Truth
Material: bacterial cells
Measurement: Hg L3-edge HERFD-XANES at FAME-UHD beamline
Fit method: Linear combination fitting (LCF)
Phase fractions: (±2%)
| Phase | Fraction |
|---|---|
| βHgS | 0.85 |
| HgCys4 | 0.15 |
Fit basis (paper's reference spectra):
- βHgS
- Hg-cysteine4
- Hg(SR)2
- Hg(0)
- CH3Hg-cysteine2
- αHgS
Source evidence: Figure 3B and text on page 5
Key reasoning: Desulfovibrio alaskensis G200 is a non-methylating strain, so it does not produce methylmercury species when exposed to inorganic mercury (IHg). At a low IHg exposure of 0.5 µM, the speciation is entirely dominated by tetracoordinated Hg-S forms. The primary phase is βHgS, which may correspond to Hg/S enriched nano-sized extracellular particles or form due to interactions of S-containing biomolecules produced by the bacteria with Hg. A secondary tetracoordinated species, Hg-cysteine4, is also present.
Reasoning source: Page 5 (Results: Hg Speciation by Hg L3-Edge HERFD-XANES) and Page 9 (Discussion: Formation of βHgS Like Compounds)
Scoring Rubric (total: 100 pts)
| Q | Type | Max | Question | Reference Answer | Scoring Criteria |
|---|---|---|---|---|---|
| q1 | quantification | 40 | Based on the sample conditions (non-methylating strain G200 exposed to 0.5 µM IHg), what are the expected Hg phases and their approximate relative fractions? | The expected Hg phases for this sample are βHgS at a relative fraction of 0.85 (85%) and Hg-cysteine4 at 0.15 (15%), with a fitting uncertainty of 2%. These specific fractions result from the biological nature of the Desulfovibrio alaskensis G200 laboratory culture, which is a non-methylating strain that cannot convert the inorganic mercury (IHg) into methylmercury species. Furthermore, at the low IHg exposure concentration of 0.5 µM, the speciation is entirely dominated by tetracoordinated Hg-S forms. The dominant 85% βHgS fraction forms due to interactions between the Hg and S-containing biomolecules produced by the bacteria, while the remaining 15% consists of the secondary tetracoordinated species Hg-cysteine4. | Award 20 points for identifying βHgS as the dominant phase with a fraction of approximately 85%. Award 20 points for identifying a secondary tetracoordinated Hg-thiol phase (HgCys4) with a fraction of approximately 15%. |
| q2 | reasoning | 40 | Explain the biological and chemical reasoning for the observed Hg speciation in this sample, specifically addressing the absence of methylated forms and the proposed origin of the dominant phase. | The observed Hg speciation consists entirely of tetracoordinated Hg-S forms due to the specific biological characteristics of the bacterial culture and the low exposure concentration. Because Desulfovibrio alaskensis G200 is a non-methylating strain, it lacks the biological mechanism to produce methylmercury species when exposed to the 0.5 µM inorganic mercury (IHg). At this low IHg concentration, the mercury instead interacts strongly with S-containing biomolecules produced by the bacteria. This interaction leads to the dominant formation of βHgS, which likely corresponds to Hg/S enriched nano-sized extracellular particles, alongside a minor fraction of Hg-cysteine4. | Award 20 points for explaining that G200 is a non-methylating strain, which accounts for the absence of MeHg species. Award 20 points for explaining that the dominant βHgS phase represents tetracoordinated Hg-S forms that likely arise from interactions with S-containing biomolecules produced by the bacteria or precipitate as extracellular nanoparticles. |
| q3 | identification | 20 | What candidate reference spectra should be included in the linear combination fitting (LCF) basis to accurately model the Hg L3-edge XANES spectrum of this sample? | The linear combination fitting (LCF) basis for this Hg L3-edge XANES spectrum should include βHgS, Hg-cysteine4, Hg(SR)2, Hg(0), CH3Hg-cysteine2, and αHgS. These specific reference spectra are required to evaluate all potential biological and chemical transformations of the 0.5 µM inorganic mercury (IHg) by the bacterial cells. Although Desulfovibrio alaskensis G200 is a non-methylating strain, including CH3Hg-cysteine2 in the basis is necessary to definitively rule out the presence of methylated forms. The inclusion of multiple Hg-S references (such as βHgS, αHgS, and Hg-cysteine4) is essential because, at this low IHg concentration, the bacteria produce S-containing biomolecules that drive the system toward tetracoordinated Hg-S species and extracellular particle formation. | Award full points for listing appropriate Hg-S reference compounds, specifically including βHgS and tetracoordinated Hg-thiol complexes (e.g., Hg-cysteine4). |
Review
#1214
bacterial cells
Hg L3
▶
LLM Prompt
Sample Information
Material: bacterial cells
Sample Origin: laboratory culture
Sample-Specific Conditions
- IHg concentration: 5 µM
- Desulfovibrio alaskensis G200 exposed to 5 µM inorganic mercury (IHg)
Measurement
We plan to measure the Hg L3 XANES spectrum of this sample.
Questions
Based on all the information above:
1. Based on the sample conditions (non-methylating strain G200 exposed to 5 µM IHg), what candidate reference spectra should be included in the linear combination fitting (LCF) basis set to model the Hg L3-edge XANES spectrum?
2. Estimate the relative fractions of the Hg species present in this sample.
3. Explain the biological and chemical reasoning for the observed Hg speciation in this sample. Why are these specific coordination environments favored, and why are certain other common environmental Hg species absent?
Ground Truth
Material: bacterial cells
Measurement: Hg L3-edge HERFD-XANES at FAME-UHD beamline (ESRF)
Fit method: linear combination fitting (LCF)
Phase fractions: (±2%)
| Phase | Fraction |
|---|---|
| βHgS | 0.61 |
| Hg-cysteine4 | 0.39 |
Fit basis (paper's reference spectra):
- βHgS
- Hg-cysteine4
Source evidence: Page 5 text and Figure 3B
Key reasoning: Desulfovibrio alaskensis G200 is a non-methylating strain, so no methylmercury species are formed when exposed to inorganic mercury (IHg). Instead, Hg is coordinated by sulfur ligands in the cell, forming tetracoordinated inorganic Hg-S species. The predominant species is βHgS, with Hg-cysteine4 as a secondary phase, highlighting the importance of tetracoordinated Hg-S forms in intracellular Hg processes.
Reasoning source: Page 5 (Results) and Pages 9-10 (Discussion)
Scoring Rubric (total: 100 pts)
| Q | Type | Max | Question | Reference Answer | Scoring Criteria |
|---|---|---|---|---|---|
| q1 | identification | 30 | Based on the sample conditions (non-methylating strain G200 exposed to 5 µM IHg), what candidate reference spectra should be included in the linear combination fitting (LCF) basis set to model the Hg L3-edge XANES spectrum? | The LCF basis set should include βHgS and Hg-cysteine4 reference spectra. These specific phases are expected because Desulfovibrio alaskensis G200 is a non-methylating bacterial strain, meaning it will not form methylmercury species when exposed to 5 µM inorganic mercury (IHg). Instead, the inorganic mercury is coordinated by intracellular sulfur ligands to form tetracoordinated inorganic Hg-S species. Therefore, the basis set must account for these sulfur-coordinated environments, specifically the predominant βHgS phase and the secondary Hg-cysteine4 phase. | Full points for identifying βHgS and a tetracoordinated Hg-thiolate (Hg-cysteine4). Deduct points for including methylated Hg species (since G200 is non-methylating) or linear two-coordinate Hg species. |
| q2 | quantification | 30 | Estimate the relative fractions of the Hg species present in this sample. | The relative fractions of the Hg species in this sample are estimated to be 0.61 (61%) βHgS and 0.39 (39%) Hg-cysteine4, with an uncertainty of 2%. These specific values result from the exposure of the non-methylating Desulfovibrio alaskensis G200 strain to 5 µM inorganic mercury. Because the strain cannot methylate mercury, all of the internalized mercury remains inorganic and is sequestered by sulfur ligands within the bacterial cells. This intracellular processing leads to a distribution dominated by the primary tetracoordinated Hg-S species (βHgS) at 61%, with the remaining 39% bound as the secondary phase, Hg-cysteine4. | Full points for estimating ~61% βHgS and ~39% Hg-cysteine4. Partial credit for identifying βHgS as the dominant phase (>50%) and a tetracoordinated Hg-thiolate as the secondary phase. |
| q3 | reasoning | 40 | Explain the biological and chemical reasoning for the observed Hg speciation in this sample. Why are these specific coordination environments favored, and why are certain other common environmental Hg species absent? | The observed Hg speciation consists entirely of tetracoordinated inorganic Hg-S species, specifically βHgS and Hg-cysteine4, because Desulfovibrio alaskensis G200 is a non-methylating strain. When exposed to 5 µM inorganic mercury (IHg) in a laboratory culture, the bacteria cannot convert the IHg into methylmercury, explaining the complete absence of methylated species. Instead, the intracellular processing of the inorganic mercury favors coordination by available sulfur ligands within the bacterial cells. This chemical affinity drives the formation of tetracoordinated Hg-S forms, highlighting their critical role in the intracellular handling and sequestration of mercury in this specific strain. | Full points for explaining that G200 is a non-methylating strain (hence no MeHg is formed) and that Hg coordinates with intracellular sulfur ligands to form tetracoordinated inorganic Hg-S species (βHgS and Hg-cysteine4). |
Review
#1215
bacterial cells
Hg L3
▶
LLM Prompt
Sample Information
Material: bacterial cells
Sample Origin: laboratory culture
Sample-Specific Conditions
- IHg concentration: 50 µM
- Desulfovibrio alaskensis G200 exposed to 50 µM inorganic mercury (IHg)
Measurement
We plan to measure the Hg L3 XANES spectrum of this sample.
Questions
Based on all the information above:
1. Based on the sample conditions (non-methylating sulfate-reducing bacteria exposed to high IHg), what candidate reference spectra should be considered for linear combination fitting of the XANES data?
2. Estimate the phase fractions of the mercury species present in this sample exposed to 50 µM IHg.
3. Explain the biological and chemical reasoning for why the mercury speciation shifts to these specific phases at 50 µM IHg compared to lower exposure concentrations.
Ground Truth
Material: bacterial cells (Desulfovibrio alaskensis G200)
Measurement: Hg L3-edge HERFD-XANES
Fit method: Linear combination fitting (LCF)
Phase fractions: (±2%)
| Phase | Fraction |
|---|---|
| Hg(0) | 0.41 |
| Hg(SR)2 | 0.58 |
Fit basis (paper's reference spectra):
- βHgS
- Hg-cysteine4
- Hg(SR)2
- Hg(0)
- CH3Hg-cysteine2
Source evidence: Page 5, right column; Figure 3B
Key reasoning: At the highest IHg exposure (50 µM), the speciation in the non-methylating strain G200 drastically changed from predominantly βHgS at lower concentrations to a mixture of Hg(0) and Hg(SR)2. This shift corresponds to a toxic level of mercury where cell growth was impaired (reduced to ~60% of control). The presence of Hg(0) was supported by a shift to lower energies in the derivative spectrum, although the strain's ability to reduce Hg(II) under growing conditions is typically very low.
Reasoning source: Page 5, right column (Results: Hg Speciation by Hg L3-Edge HERFD-XANES)
Scoring Rubric (total: 100 pts)
| Q | Type | Max | Question | Reference Answer | Scoring Criteria |
|---|---|---|---|---|---|
| q1 | identification | 30 | Based on the sample conditions (non-methylating sulfate-reducing bacteria exposed to high IHg), what candidate reference spectra should be considered for linear combination fitting of the XANES data? | The candidate reference spectra for linear combination fitting of this sample include βHgS, Hg-cysteine4, Hg(SR)2, Hg(0), and CH3Hg-cysteine2. These specific phases are considered because the sample consists of Desulfovibrio alaskensis G200 bacterial cells exposed to inorganic mercury (IHg). At the high exposure concentration of 50 µM IHg, the bacterial mercury speciation drastically changes from predominantly βHgS to a mixture of Hg(0) and Hg(SR)2. This occurs because 50 µM is a toxic level that impairs cell growth, altering the biological processing of mercury and leading to the formation of reduced and thiol-bound mercury species. | Full credit for identifying Hg(0) and a dithiolate/tetrathiolate species like Hg(SR)2 or Hg-cysteine. Partial credit for mentioning inorganic Hg-S phases like βHgS. |
| q2 | quantification | 35 | Estimate the phase fractions of the mercury species present in this sample exposed to 50 µM IHg. | The estimated phase fractions for the mercury species in this sample are 41% Hg(0) and 58% Hg(SR)2, with an uncertainty of 2%. These specific values arise because the bacterial cells are exposed to a high concentration of 50 µM IHg, which is a toxic level that reduces cell growth to approximately 60% of the control. Under these impaired growth conditions, the bacteria can no longer predominantly form βHgS as they do at lower concentrations. Instead, the biological processing shifts entirely, resulting in a final composition dominated by thiol-bound mercury (Hg(SR)2) alongside a substantial fraction of reduced elemental mercury (Hg(0)). | Full credit for estimating ~41% Hg(0) and ~58% Hg(SR)2. Partial credit if the estimates are within 10-15% of the ground truth values. |
| q3 | reasoning | 35 | Explain the biological and chemical reasoning for why the mercury speciation shifts to these specific phases at 50 µM IHg compared to lower exposure concentrations. | At lower exposure concentrations, the non-methylating Desulfovibrio alaskensis G200 strain predominantly forms βHgS, but at 50 µM IHg, the speciation drastically shifts to a mixture of Hg(0) and Hg(SR)2. This biological and chemical shift occurs because 50 µM IHg represents a toxic level of mercury that impairs cell growth, reducing it to about 60% of the control. The toxicity disrupts the normal precipitation of βHgS, leading instead to the accumulation of thiol-bound mercury (Hg(SR)2) and the reduction of Hg(II) to elemental mercury (Hg(0)). The presence of Hg(0) is confirmed by a shift to lower energies in the derivative spectrum, which is notable because this strain's ability to reduce Hg(II) under normal growing conditions is typically very low. | Full credit for explaining that 50 µM is a toxic level that impairs cell growth, leading to a drastic change in speciation from βHgS (seen at lower doses) to Hg(0) and Hg(SR)2, with the Hg(0) assignment supported by a shift to lower energies in the derivative spectrum despite the strain's typically low reduction capacity. |
Review
#1216
bacterial cells
Hg L3
▶
LLM Prompt
Sample Information
Material: bacterial cells
Sample Origin: laboratory culture
Sample-Specific Conditions
- MeHg concentration: 0.5 µM
- Pseudodesulfovibrio hydrargyri BerOc1 exposed to 0.5 µM methylmercury (MeHg)
Measurement
We plan to measure the Hg L3 XANES spectrum of this sample.
Questions
Based on all the information above:
1. Based on the sample conditions (Pseudodesulfovibrio hydrargyri BerOc1 exposed to 0.5 µM MeHg), what are the expected Hg phases in the cell pellet and their approximate fractions?
2. What reference spectra would be required to perform a linear combination fit (LCF) of the XANES spectrum for this sample?
3. Explain the biological and chemical reasoning for the presence of both methylated and inorganic Hg species in the cell pellet of BerOc1 exposed to MeHg.
Ground Truth
Material: bacterial cells
Measurement: Hg L3-edge HERFD-XANES
Fit method: linear combination fitting (LCF)
Phase fractions: (±2%)
| Phase | Fraction |
|---|---|
| CH3Hg-cysteine2 | 0.62 |
| βHgS | 0.25 |
| Hg-cysteine4 | 0.11 |
Fit basis (paper's reference spectra):
- CH3Hg-cysteine2
- βHgS
- Hg-cysteine4
Source evidence: Page 6 text and Figure 3B
Key reasoning: When exposed to MeHg, the methylating and demethylating strain BerOc1 retains a portion of MeHg in the cell pellet, which is identified as MeHg-cysteine2. The remaining Hg in the pellet is inorganic Hg (IHg) formed by the demethylation process. This IHg is identified as tetracoordinated Hg species modeled by βHgS and Hg-cysteine4, indicating that tetracoordinated Hg-S coordination is of importance in the cellular Hg pathway during demethylation.
Reasoning source: Page 9, 'Hg Demethylation as a Non-saturated Process' section
Scoring Rubric (total: 100 pts)
| Q | Type | Max | Question | Reference Answer | Scoring Criteria |
|---|---|---|---|---|---|
| q1 | quantification | 40 | Based on the sample conditions (Pseudodesulfovibrio hydrargyri BerOc1 exposed to 0.5 µM MeHg), what are the expected Hg phases in the cell pellet and their approximate fractions? | The expected Hg phases in the cell pellet are CH3Hg-cysteine2 at a fraction of 0.62, βHgS at 0.25, and Hg-cysteine4 at 0.11, with an uncertainty of 2%. These specific fractions arise because the Pseudodesulfovibrio hydrargyri BerOc1 strain is capable of both methylating and demethylating mercury. When exposed to 0.5 µM MeHg, the cells retain a majority portion (62%) of the MeHg in the pellet as MeHg-cysteine2. The remaining mercury is converted into inorganic Hg (IHg) through the cellular demethylation process, forming tetracoordinated Hg-S species modeled by the 25% βHgS and 11% Hg-cysteine4 fractions. | Full points if the answer identifies CH3Hg-cysteine2 (~62%), βHgS (~25%), and Hg-cysteine4 (~11%). Partial credit for identifying the correct phases without exact fractions, or for identifying the general classes (a predominant methylmercury-thiol species and secondary tetracoordinated inorganic Hg-S species). |
| q2 | identification | 30 | What reference spectra would be required to perform a linear combination fit (LCF) of the XANES spectrum for this sample? | To perform a linear combination fit (LCF) of the Hg L3-edge HERFD-XANES spectrum for this sample, the required reference spectra are CH3Hg-cysteine2, βHgS, and Hg-cysteine4. These specific references are necessary because the bacterial strain Pseudodesulfovibrio hydrargyri BerOc1 both retains MeHg and actively demethylates it when exposed to a 0.5 µM MeHg concentration. The CH3Hg-cysteine2 reference is needed to model the portion of intact MeHg retained within the cell pellet. The βHgS and Hg-cysteine4 references are required to model the inorganic Hg (IHg) produced by the demethylation process, indicating that tetracoordinated Hg-S coordination is important in the cellular Hg pathway. | Full points if the answer lists CH3Hg-cysteine2, βHgS, and Hg-cysteine4 as the required reference spectra. Partial credit for mentioning generic MeHg-thiols and inorganic Hg-S references. |
| q3 | reasoning | 30 | Explain the biological and chemical reasoning for the presence of both methylated and inorganic Hg species in the cell pellet of BerOc1 exposed to MeHg. | The presence of both methylated and inorganic Hg species occurs because Pseudodesulfovibrio hydrargyri BerOc1 is a methylating and demethylating bacterial strain. When the laboratory culture is exposed to 0.5 µM MeHg, the cells retain a portion of the intact MeHg in the cell pellet, which is identified as MeHg-cysteine2 (62%). Concurrently, the strain actively demethylates the remaining MeHg into inorganic Hg (IHg). This newly formed IHg adopts tetracoordinated Hg-S structures, specifically modeled as βHgS (25%) and Hg-cysteine4 (11%), demonstrating that tetracoordinated Hg-S coordination is a key component of the cellular Hg demethylation pathway. | Full points if the answer explains that BerOc1 is capable of demethylation, converting some of the MeHg into inorganic Hg (IHg). The MeHg retained in the cell binds to thiols (MeHg-cysteine2), while the IHg formed by demethylation adopts a tetracoordinated Hg-S environment (βHgS and Hg-cysteine4), highlighting the importance of this coordination in the cellular demethylation pathway. |
Review
#1217
bacterial cells
Hg L3
▶
LLM Prompt
Sample Information
Material: bacterial cells
Sample Origin: laboratory culture
Sample-Specific Conditions
- MeHg concentration: 5 µM
- Pseudodesulfovibrio hydrargyri BerOc1 exposed to 5 µM methylmercury (MeHg)
Measurement
We plan to measure the Hg L3 XANES spectrum of this sample.
Questions
Based on all the information above:
1. Based on the sample conditions (BerOc1 bacteria exposed to 5 µM MeHg), what candidate reference spectra should be included in the basis set for Linear Combination Fitting (LCF) of the Hg L3-edge XANES spectrum?
2. Estimate the relative phase fractions of the Hg species present in this bacterial cell pellet.
Ground Truth
Material: bacterial cells
Measurement: Hg L3-edge HERFD-XANES
Fit method: Linear combination fitting (LCF)
Phase fractions: (±2%)
| Phase | Fraction |
|---|---|
| CH3Hg-Cys2 | 0.62 |
| βHgS | 0.27 |
| HgCys4 | 0.1 |
Fit basis (paper's reference spectra):
- CH3Hg-cysteine2
- βHgS
- Hg-cysteine4
Source evidence: Page 6 text; Figure 3B; Supplementary Table 1
Key reasoning: When exposed to MeHg, the predominant species in the BerOc1 cell pellet is MeHg bound to thiols, specifically modeled as CH3Hg-cysteine2. However, because BerOc1 is capable of demethylating MeHg, inorganic Hg (IHg) species are also formed. The IHg formed by demethylation and retained in the pellet was identified as tetracoordinated Hg species modeled by both βHgS and Hg-(cysteine)4, pointing out that this specific Hg coordination is of importance in the cellular Hg pathway.
Reasoning source: Page 6 (Results: Hg Speciation by Hg L3-Edge HERFD-XANES) and Page 9 (Discussion: Hg Demethylation as a Non-saturated Process)
Scoring Rubric (total: 100 pts)
| Q | Type | Max | Question | Reference Answer | Scoring Criteria |
|---|---|---|---|---|---|
| q1 | identification | 46 | Based on the sample conditions (BerOc1 bacteria exposed to 5 µM MeHg), what candidate reference spectra should be included in the basis set for Linear Combination Fitting (LCF) of the Hg L3-edge XANES spectrum? | The basis set for Linear Combination Fitting (LCF) of the Hg L3-edge XANES spectrum should include CH3Hg-cysteine2, βHgS, and Hg-cysteine4. These specific references are required because when the Pseudodesulfovibrio hydrargyri BerOc1 bacterial cells are exposed to 5 µM MeHg, the predominant species in the cell pellet is MeHg bound to thiols, which is modeled as CH3Hg-cysteine2. Furthermore, because the BerOc1 strain is capable of demethylating MeHg, inorganic Hg (IHg) species are also formed in the laboratory culture. The resulting IHg retained in the pellet consists of tetracoordinated Hg species, which are accurately modeled by the βHgS and Hg-cysteine4 references, indicating the importance of this specific coordination in the cellular Hg pathway. | Full points for identifying a methylated Hg-thiol species (e.g., CH3Hg-cysteine2) and tetracoordinated inorganic Hg-S species (e.g., βHgS and Hg-cysteine4). Partial points if only the methylated or only the inorganic species are mentioned. |
| q2 | quantification | 54 | Estimate the relative phase fractions of the Hg species present in this bacterial cell pellet. | The relative phase fractions of the Hg species in the bacterial cell pellet are estimated to be 62% CH3Hg-Cys2, 27% βHgS, and 10% HgCys4, with an uncertainty of 2%. These specific values arise because the Pseudodesulfovibrio hydrargyri BerOc1 cells were exposed to a 5 µM MeHg concentration, leading to a majority fraction (62%) of the mercury remaining as MeHg bound to cellular thiols. The remaining 37% of the mercury is converted into inorganic Hg (IHg) species due to the bacteria's active demethylation of the MeHg. This demethylated fraction is retained in the pellet as tetracoordinated Hg species, splitting into 27% βHgS and 10% Hg-cysteine4, reflecting the specific cellular Hg processing pathway under these laboratory culture conditions. | Full points for estimating ~60-65% CH3Hg-thiol (CH3Hg-Cys2) and ~35-40% inorganic Hg-S species (split between βHgS at ~25-30% and HgCys4 at ~10%). Deduct points proportionally for estimates outside a ±10% absolute range. |
Review
#1218
bacterial cells
Hg L3
▶
LLM Prompt
Sample Information
Material: bacterial cells
Sample Origin: laboratory culture
Sample-Specific Conditions
- MeHg concentration: 50 µM
- Pseudodesulfovibrio hydrargyri BerOc1 exposed to 50 µM methylmercury (MeHg)
Measurement
We plan to measure the Hg L3 XANES spectrum of this sample.
Questions
Based on all the information above:
1. Based on the sample conditions (BerOc1 exposed to 50 µM MeHg), predict the expected Hg phases and their approximate relative fractions.
2. Explain the biological and chemical reasoning for the observed phase composition at this high MeHg exposure (50 µM), particularly the presence of inorganic Hg species.
3. What candidate reference spectra should be included in the basis set to perform linear combination fitting (LCF) for this sample?
Ground Truth
Material: bacterial cells
Measurement: Hg L3-edge HERFD-XANES at FAME-UHD beamline
Fit method: linear combination fitting (LCF)
Phase fractions: (±2%)
| Phase | Fraction |
|---|---|
| βHgS | 0.49 |
| CH3Hg-cysteine2 | 0.35 |
| Hg-cysteine4 | 0.15 |
Fit basis (paper's reference spectra):
- CH3Hg-cysteine2
- βHgS
- Hg-cysteine4
- Hg(SR)2
- Hg(0)
Source evidence: Page 6, text and Figure 3B
Key reasoning: At the highest MeHg exposure (50 µM), the speciation differs from lower exposures, showing a high proportion of inorganic Hg species (βHgS and Hg-cysteine4). This is consistent with the high production of IHg by demethylation at this concentration. The IHg formed by demethylation in the pellet was identified as tetracoordinated Hg species, pointing out that this Hg coordination is of importance in the cell Hg pathway.
Reasoning source: Page 9, 'Hg Demethylation as a Non-saturated Process' section
Scoring Rubric (total: 100 pts)
| Q | Type | Max | Question | Reference Answer | Scoring Criteria |
|---|---|---|---|---|---|
| q1 | quantification | 40 | Based on the sample conditions (BerOc1 exposed to 50 µM MeHg), predict the expected Hg phases and their approximate relative fractions. | For Pseudodesulfovibrio hydrargyri BerOc1 bacterial cells exposed to 50 µM MeHg, the expected Hg phases are βHgS (49%), CH3Hg-cysteine2 (35%), and Hg-cysteine4 (15%), with an uncertainty of 2%. These specific fractions result from the high 50 µM MeHg exposure, which triggers extensive biological demethylation by the cells. Because of this high demethylation activity, there is a massive production of inorganic mercury (IHg) species, causing βHgS and tetracoordinated Hg-cysteine4 to dominate the composition. The remaining 35% fraction represents the residual, un-demethylated methylmercury bound to cellular thiols as CH3Hg-cysteine2. | 20 points for identifying βHgS, CH3Hg-cysteine2, and Hg-cysteine4 as the phases. 20 points for estimating their fractions at approximately 49%, 35%, and 15% respectively (allow ±10% margin). |
| q2 | reasoning | 40 | Explain the biological and chemical reasoning for the observed phase composition at this high MeHg exposure (50 µM), particularly the presence of inorganic Hg species. | When Pseudodesulfovibrio hydrargyri BerOc1 cells are exposed to a high concentration of 50 µM MeHg, the cellular response involves a high rate of MeHg demethylation. This biological demethylation process actively converts the organic methylmercury into inorganic mercury (IHg) species within the cell pellet. Consequently, the speciation differs from lower exposures and is dominated by inorganic phases, specifically βHgS and tetracoordinated Hg-cysteine4. The prominent formation of these tetracoordinated IHg species demonstrates that this specific Hg coordination is of critical importance in the cellular Hg pathway under high exposure conditions. | 20 points for explaining that the high proportion of inorganic Hg species is due to the high production of IHg by demethylation at this concentration. 20 points for noting that the IHg formed is identified as tetracoordinated Hg species (βHgS and Hg-cysteine4), indicating the importance of this coordination in the cell Hg pathway. |
| q3 | identification | 20 | What candidate reference spectra should be included in the basis set to perform linear combination fitting (LCF) for this sample? | The candidate reference spectra for linear combination fitting (LCF) should include CH3Hg-cysteine2, βHgS, Hg-cysteine4, Hg(SR)2, and Hg(0). These specific references are necessary because exposing Pseudodesulfovibrio hydrargyri BerOc1 cells to 50 µM MeHg triggers a biological demethylation process that alters mercury speciation. The basis set must account for both the initial organic mercury bound to cellular thiols (CH3Hg-cysteine2) and the resulting inorganic mercury (IHg) products. The inclusion of βHgS and tetracoordinated Hg-cysteine4 is particularly critical, as these inorganic species are highly produced during the cellular demethylation pathway at this elevated exposure level. | 20 points for listing appropriate references including a methylmercury-thiol (CH3Hg-cysteine2) and tetracoordinated inorganic Hg-S species (βHgS, Hg-cysteine4). |
Review
#1219
bacterial cells
Hg L3
▶
LLM Prompt
Sample Information
Material: bacterial cells
Sample Origin: laboratory culture
Sample-Specific Conditions
- MeHg concentration: 0.5 µM
- Desulfovibrio alaskensis G200 exposed to 0.5 µM methylmercury (MeHg)
Measurement
We plan to measure the Hg L3 XANES spectrum of this sample.
Questions
Based on all the information above:
1. Based on the biological capabilities of Desulfovibrio alaskensis G200 and the exposure to MeHg, what candidate reference spectra should be included in a linear combination fitting (LCF) analysis of its Hg L3-edge XANES spectrum?
2. Estimate the relative phase fractions of the Hg species present in the G200 cell pellet after exposure to 0.5 µM MeHg.
3. Explain the biological and chemical reasoning for the observed Hg speciation in this sample. Why are these specific coordination environments observed?
Ground Truth
Material: bacterial cells
Measurement: Hg L3-edge HERFD-XANES
Fit method: Linear combination fitting (LCF)
Phase fractions: (±2%)
| Phase | Fraction |
|---|---|
| CH3Hg-cysteine2 | 0.83 |
| Hg-cysteine4 | 0.17 |
Fit basis (paper's reference spectra):
- CH3Hg-cysteine2
- Hg-cysteine4
- βHgS
- Hg(SR)2
- Hg(0)
Source evidence: Page 6 text; Figure 3B
Key reasoning: Desulfovibrio alaskensis G200 is a non-methylating strain that is only capable of demethylating MeHg. When exposed to a low concentration of MeHg (0.5 µM), the dominant species in the cell pellet remains the unreacted MeHg, which binds to cellular thiols to form a CH3Hg-cysteine2-like complex. A smaller fraction of the MeHg is demethylated into inorganic Hg (IHg), which is identified as tetracoordinated Hg-cysteine4, indicating that the demethylation product is also coordinated by thiol ligands within the cell.
Reasoning source: Page 6 (Hg Speciation by Hg L3-Edge HERFD-XANES) and Page 9 (Hg Demethylation as a Non-saturated Process)
Scoring Rubric (total: 100 pts)
| Q | Type | Max | Question | Reference Answer | Scoring Criteria |
|---|---|---|---|---|---|
| q1 | identification | 30 | Based on the biological capabilities of Desulfovibrio alaskensis G200 and the exposure to MeHg, what candidate reference spectra should be included in a linear combination fitting (LCF) analysis of its Hg L3-edge XANES spectrum? | The candidate reference spectra for the linear combination fitting (LCF) analysis should include CH3Hg-cysteine2, Hg-cysteine4, βHgS, Hg(SR)2, and Hg(0). These specific references are required because Desulfovibrio alaskensis G200 is a non-methylating strain that is only capable of demethylating MeHg. When exposed to 0.5 µM MeHg, the unreacted MeHg binds to cellular thiols, necessitating the CH3Hg-cysteine2 reference. Furthermore, the demethylation process produces inorganic Hg that coordinates with cellular thiol ligands, requiring the inclusion of the tetracoordinated Hg-cysteine4 reference, alongside other potential inorganic or reduced Hg species to fully capture the possible speciation. | Full credit for identifying a methylated Hg-thiol reference (e.g., CH3Hg-cysteine2) and an inorganic Hg-thiol reference (e.g., Hg-cysteine4). Partial credit for mentioning generic MeHg and IHg references without specifying thiol coordination. |
| q2 | quantification | 35 | Estimate the relative phase fractions of the Hg species present in the G200 cell pellet after exposure to 0.5 µM MeHg. | The relative phase fractions in the G200 cell pellet are estimated to be 0.83 (83%) CH3Hg-cysteine2 and 0.17 (17%) Hg-cysteine4, with a 2% uncertainty. These specific values result from the biological response of the Desulfovibrio alaskensis G200 strain when exposed to a low concentration (0.5 µM) of MeHg. Because G200 is a non-methylating strain that only demethylates MeHg, the majority of the mercury remains as unreacted MeHg bound to cellular thiols, yielding the dominant 83% CH3Hg-cysteine2 fraction. Only a smaller fraction (17%) undergoes demethylation into inorganic mercury, which subsequently binds to thiol ligands within the cell to form the tetracoordinated Hg-cysteine4 complex. | Full credit for estimating ~80-85% CH3Hg-cysteine2 (or MeHg-thiol) and ~15-20% Hg-cysteine4 (or IHg-thiol). Partial credit if the dominant phase is correctly identified as MeHg but fractions are off by more than 10%. |
| q3 | reasoning | 35 | Explain the biological and chemical reasoning for the observed Hg speciation in this sample. Why are these specific coordination environments observed? | The observed Hg speciation is driven by the specific metabolic capabilities of Desulfovibrio alaskensis G200 and its exposure to 0.5 µM MeHg. G200 is a non-methylating bacterial strain that is only capable of demethylating MeHg. Upon exposure to this low concentration of MeHg, the dominant species remains unreacted MeHg, which chemically binds to available cellular thiols to form a CH3Hg-cysteine2-like coordination environment. Concurrently, the bacteria demethylate a smaller portion of the MeHg into inorganic mercury (IHg). This newly formed inorganic mercury also coordinates with intracellular thiol ligands, resulting in the observed tetracoordinated Hg-cysteine4 environment. | Full credit for explaining that G200 can demethylate MeHg but not methylate IHg, meaning the dominant phase is unreacted MeHg bound to cellular thiols (CH3Hg-cysteine2), while the secondary phase is the inorganic Hg demethylation product, which is also trapped by cellular thiols in a tetracoordinated state (Hg-cysteine4). |
Review
#1220
bacterial cells
Hg L3
▶
LLM Prompt
Sample Information
Material: bacterial cells
Sample Origin: laboratory culture
Sample-Specific Conditions
- MeHg concentration: 5 µM
- Desulfovibrio alaskensis G200 exposed to 5 µM methylmercury (MeHg)
Measurement
We plan to measure the Hg L3 XANES spectrum of this sample.
Questions
Based on all the information above:
1. What candidate reference spectra should be included in the basis set for linear combination fitting of the Hg L3-edge XANES spectrum of Desulfovibrio alaskensis G200 cells exposed to MeHg?
2. Estimate the phase fractions of the Hg species present in the G200 cells exposed to 5 µM MeHg.
3. Explain the biological and chemical reasoning for the observed phase composition in this sample, specifically addressing the origin of the inorganic Hg species.
Ground Truth
Material: bacterial cells (Desulfovibrio alaskensis G200)
Measurement: Hg L3-edge HERFD-XANES at FAME-UHD beamline (ESRF)
Fit method: linear combination fitting (LCF)
Phase fractions: (±2%)
| Phase | Fraction |
|---|---|
| CH3Hg-Cys2 | 0.68 |
| HgCys4 | 0.32 |
Fit basis (paper's reference spectra):
- CH3Hg-Cys2
- HgCys4
- βHgS
- Hg(SR)2
- Hg(0)
Source evidence: Page 6 text and Figure 3B
Key reasoning: Desulfovibrio alaskensis G200 is a non-methylating strain that is only able to demethylate MeHg. When exposed to 5 µM MeHg, the dominant species in the cell pellet remains MeHg bound to thiols, modeled as CH3Hg-cysteine2. The inorganic Hg (IHg) formed by the demethylation process is retained in the cell pellet and is identified as a tetracoordinated Hg species modeled by Hg-cysteine4, highlighting the importance of this coordination environment in the cellular Hg pathway.
Reasoning source: Page 6 (Results: Hg Speciation by Hg L3-Edge HERFD-XANES) and Page 9 (Discussion: Hg Demethylation as a Non-saturated Process)
Scoring Rubric (total: 100 pts)
| Q | Type | Max | Question | Reference Answer | Scoring Criteria |
|---|---|---|---|---|---|
| q1 | identification | 20 | What candidate reference spectra should be included in the basis set for linear combination fitting of the Hg L3-edge XANES spectrum of Desulfovibrio alaskensis G200 cells exposed to MeHg? | The candidate reference spectra for the linear combination fitting basis set should include CH3Hg-Cys2, HgCys4, βHgS, Hg(SR)2, and Hg(0). These references are required because Desulfovibrio alaskensis G200 is a non-methylating strain that demethylates MeHg when exposed to a 5 µM concentration in culture. Consequently, the basis set must account for both the unreacted MeHg bound to cellular thiols (modeled by CH3Hg-Cys2) and the resulting inorganic Hg products. The inclusion of HgCys4 and other sulfur-coordinated or elemental Hg references is necessary to capture the tetracoordinated inorganic Hg species formed and retained in the cell pellet during this demethylation process. | Full points if the answer identifies methylated Hg-thiol species (e.g., CH3Hg-Cys2) and tetracoordinated inorganic Hg-thiol species (e.g., HgCys4, beta-HgS) as necessary references. |
| q2 | quantification | 40 | Estimate the phase fractions of the Hg species present in the G200 cells exposed to 5 µM MeHg. | The estimated phase fractions for the G200 cells exposed to 5 µM MeHg are 0.68 for CH3Hg-Cys2 and 0.32 for HgCys4, with an uncertainty of 2%. These specific values arise from the biological processing of the 5 µM MeHg by the Desulfovibrio alaskensis G200 strain, which is only capable of demethylation. The 68% fraction represents the dominant species of unreacted MeHg that remains bound to cellular thiols in the cell pellet. The 32% fraction corresponds to the inorganic Hg (IHg) produced by the demethylation process, which is retained in the cell as a tetracoordinated species modeled by Hg-cysteine4. | Full points if the estimated fractions are approximately 68% CH3Hg-Cys2 (or MeHg-thiol) and 32% HgCys4 (or tetracoordinated IHg-thiol). Partial credit for identifying the correct dominant and secondary phases without exact percentages. |
| q3 | reasoning | 40 | Explain the biological and chemical reasoning for the observed phase composition in this sample, specifically addressing the origin of the inorganic Hg species. | The observed phase composition is driven by the specific metabolic capabilities of the Desulfovibrio alaskensis G200 strain, which is a non-methylating bacterium only able to demethylate MeHg. When the laboratory culture is exposed to 5 µM MeHg, the dominant species in the cell pellet remains the unreacted MeHg bound to cellular thiols, which is modeled as CH3Hg-cysteine2. The inorganic Hg species originates directly from the partial demethylation of this MeHg by the bacteria. This newly formed inorganic Hg is retained within the cell pellet and adopts a tetracoordinated environment modeled by Hg-cysteine4, highlighting the critical role of this coordination environment in the cellular Hg demethylation pathway. | Full points if the answer explains that G200 demethylates MeHg, leaving CH3Hg-thiol as the dominant unreacted species, while the resulting inorganic Hg product is bound in a tetracoordinated thiol environment (Hg-cysteine4) within the cell. |
Review
#1221
bacterial cells
Hg L3
▶
LLM Prompt
Sample Information
Material: bacterial cells
Sample Origin: laboratory culture
Sample-Specific Conditions
- MeHg concentration: 50 µM
- Desulfovibrio alaskensis G200 exposed to 50 µM methylmercury (MeHg)
Measurement
We plan to measure the Hg L3 XANES spectrum of this sample.
Questions
Based on all the information above:
1. Based on the sample conditions (Desulfovibrio alaskensis G200 exposed to 50 µM MeHg), what are the expected Hg phases and their approximate fractions determined by LCF of the Hg L3-edge XANES spectrum?
2. What candidate reference spectra should be included in the basis set for linear combination fitting of this sample's XANES spectrum to capture the expected speciation?
Ground Truth
Material: bacterial cells (cell pellet)
Measurement: Hg L3-edge HERFD-XANES at FAME-UHD beamline (ESRF)
Fit method: Linear combination fitting (LCF)
Phase fractions: (±2%)
| Phase | Fraction |
|---|---|
| CH3Hg-cysteine2 | 0.54 |
| βHgS | 0.46 |
Fit basis (paper's reference spectra):
- CH3Hg-cysteine2
- βHgS
- Hg-cysteine4
Source evidence: Page 6 text and Figure 3B
Key reasoning: Desulfovibrio alaskensis G200 is a non-methylating strain that is only able to demethylate MeHg. Demethylation increases with increasing MeHg concentration, leading to the formation of inorganic Hg (IHg) in the cell pellet. At the highest exposure (50 µM MeHg), the IHg formed by demethylation is identified as a tetracoordinated Hg species modeled by βHgS. The remaining un-demethylated MeHg is bound to thiols in the cell, identified as CH3Hg-cysteine2.
Reasoning source: Page 6 (Results: Hg Speciation by Hg L3-Edge HERFD-XANES) and Page 9 (Discussion: Hg Demethylation as a Non-saturated Process)
Scoring Rubric (total: 100 pts)
| Q | Type | Max | Question | Reference Answer | Scoring Criteria |
|---|---|---|---|---|---|
| q1 | quantification | 67 | Based on the sample conditions (Desulfovibrio alaskensis G200 exposed to 50 µM MeHg), what are the expected Hg phases and their approximate fractions determined by LCF of the Hg L3-edge XANES spectrum? | The expected Hg phases and their approximate fractions are CH3Hg-cysteine2 at 54% and βHgS at 46%, with an uncertainty of 2%. These specific values result from the biological response of Desulfovibrio alaskensis G200, which is a non-methylating strain that only demethylates MeHg. Because demethylation increases with higher MeHg concentrations, the high 50 µM exposure leads to a significant conversion of MeHg into inorganic Hg (IHg) in the cell pellet. Consequently, the 46% βHgS fraction models the resulting tetracoordinated inorganic Hg species, while the 54% CH3Hg-cysteine2 fraction accounts for the remaining un-demethylated MeHg bound to cellular thiols. | Full points for identifying CH3Hg-cysteine2 (or MeHg-thiol) at ~54% and βHgS (or tetracoordinated Hg-S) at ~46%. Partial credit for identifying the correct phases without exact fractions, or for getting the dominant phase correct. |
| q3 | identification | 33 | What candidate reference spectra should be included in the basis set for linear combination fitting of this sample's XANES spectrum to capture the expected speciation? | The candidate reference spectra that should be included in the basis set for linear combination fitting are CH3Hg-cysteine2, βHgS, and Hg-cysteine4. These specific references are necessary because exposing the non-methylating Desulfovibrio alaskensis G200 strain to 50 µM MeHg triggers a demethylation process within the bacterial cells. This process forms inorganic Hg (IHg) in the cell pellet, which is a tetracoordinated Hg species that requires references like βHgS and Hg-cysteine4 to be accurately modeled. Additionally, the CH3Hg-cysteine2 reference must be included to capture the remaining un-demethylated MeHg that is bound to thiols in the cell. | Full points for listing MeHg-thiol references (e.g., CH3Hg-cysteine2) and inorganic Hg-S references (e.g., βHgS, Hg-cysteine4). |
Review
In Situ X-ray Absorption Spectroscopy Cells for High Pressure Homogeneous Catalysis
ESRF-BM23
Catalyst
Petr V. Shvets et al.
DOI: 10.3390/catal12101264
7 scenarios
▶
#1222
RuBr3 in Bu4PBr
Ru K-edge
▶
LLM Prompt
Sample Information
Material: RuBr3 in Bu4PBr
Reaction Conditions: 5 bar CO + 20 bar H2, 25 °C
Sample-Specific Conditions
- Temperature: 25 °C
- RuBr3 dissolved in Bu4PBr ionic liquid
Measurement
We plan to measure the Ru K-edge XANES spectrum of this sample.
Questions
Based on all the information above:
1. Based on the provided reaction conditions (25 °C), what is the expected dominant Ru phase in this mixture, and why does it not form the active catalytic complex at this temperature?
2. How does the expected Ru K-edge XANES spectrum of this initial sample at 25 °C compare to the spectrum of the active catalyst formed at higher temperatures?
3. If one were to perform a Linear Combination Fitting (LCF) analysis to track the evolution of this homogeneous catalyst from 25 °C to 200 °C, what specific reference spectra would be essential to include in the fit basis?
Ground Truth
Material: RuBr3 in Bu4PBr
Measurement: Ru K-edge, fluorescence mode, SAMBA beamline at Soleil synchrotron
Fit method: Qualitative comparison to reference spectra
Phase fractions: (±10%)
| Phase | Fraction |
|---|---|
| RuBr3 | 1.0 |
Fit basis (paper's reference spectra):
- RuBr3
- Ru2Br4(CO)6
Source evidence: Section 2.3, Figure 5, page 5
Key reasoning: At low temperatures (25 °C), the ionic liquid is in a solid state and the Ru species remains as the initial unreacted RuBr3 precursor. The interaction with CO ligands to form the active Ru2Br4(CO)6 complex only occurs at elevated temperatures (above 180 °C). Therefore, the initial state is entirely unreacted RuBr3.
Reasoning source: Section 2.3, page 5
Scoring Rubric (total: 100 pts)
| Q | Type | Max | Question | Reference Answer | Scoring Criteria |
|---|---|---|---|---|---|
| q1 | reasoning | 40 | Based on the provided reaction conditions (25 °C), what is the expected dominant Ru phase in this mixture, and why does it not form the active catalytic complex at this temperature? | At 25 °C under 5 bar CO and 20 bar H2, the dominant Ru phase is entirely the unreacted RuBr3 precursor, representing a fraction of 1.0. This occurs because at this low temperature, the Bu4PBr ionic liquid is in a solid state, which prevents the reaction from proceeding. The interaction with CO ligands required to form the active Ru2Br4(CO)6 complex only takes place at elevated temperatures above 180 °C. Consequently, the initial state remains 100% unreacted RuBr3. | The answer must identify RuBr3 as the dominant phase (100%) and explain that the temperature is too low for the reaction with CO to occur, noting that the active complex only forms at elevated temperatures (e.g., >180 °C). |
| q2 | spectral | 30 | How does the expected Ru K-edge XANES spectrum of this initial sample at 25 °C compare to the spectrum of the active catalyst formed at higher temperatures? | The Ru K-edge XANES spectrum of the initial sample at 25 °C exhibits a broad white line at approximately 22,130 eV and an edge position near 22,115 eV. This spectrum differs significantly from that of the active catalyst formed at higher temperatures, lacking the sharper spectral features seen in the active complex. These broad features are observed because the sample remains entirely as the unreacted RuBr3 precursor. The lack of sharper features is directly due to the low temperature (25 °C) keeping the ionic liquid solid, which prevents the interaction with CO ligands that would otherwise form the distinct Ru2Br4(CO)6 complex. | The answer must state that the spectrum matches the initial RuBr3 precursor and differs significantly from the active Ru2Br4(CO)6 complex formed at higher temperatures, which has a distinct shape due to CO ligands. |
| q3 | identification | 30 | If one were to perform a Linear Combination Fitting (LCF) analysis to track the evolution of this homogeneous catalyst from 25 °C to 200 °C, what specific reference spectra would be essential to include in the fit basis? | To track the evolution of this catalyst from 25 °C to 200 °C, the essential reference spectra to include in the fit basis are RuBr3 and Ru2Br4(CO)6. These specific references are required because they represent the starting and ending states of the system under the provided conditions. At the initial low temperature of 25 °C, the Bu4PBr ionic liquid is solid, meaning the system consists entirely of the unreacted RuBr3 precursor. As the temperature increases above 180 °C, the Ru species interacts with the CO ligands from the pressurized gas mixture to form the active Ru2Br4(CO)6 complex, necessitating both spectra to accurately model the transformation. | The answer must identify RuBr3 (the initial precursor) and Ru2Br4(CO)6 (the active complex) as the necessary reference spectra for the analysis. |
Review
#1223
RuBr3 in Bu4PBr
Ru K-edge
▶
LLM Prompt
Sample Information
Material: RuBr3 in Bu4PBr
Reaction Conditions: 5 bar CO + 20 bar H2, >180 °C
Sample-Specific Conditions
- Temperature: >180 °C
- RuBr3 dissolved in Bu4PBr ionic liquid after heating
Measurement
We plan to measure the Ru K-edge XANES spectrum of this sample.
Questions
Based on all the information above:
1. What is the dominant Ru phase or complex formed in the Bu4PBr ionic liquid under 5 bar CO and 20 bar H2 at temperatures above 180 °C?
2. What reference spectra are necessary to track the evolution of this homogeneous catalytic system from its initial state to the state at >180 °C?
3. Explain the chemical reasoning for the formation of this specific Ru complex under these conditions and its relevance to the catalytic process.
4. How does the XANES spectral shape of the sample at >180 °C compare to the initial state of the catalyst?
Ground Truth
Material: RuBr3 in Bu4PBr
Measurement: Ru K-edge in fluorescence mode at SAMBA beamline (Soleil synchrotron)
Fit method: Qualitative spectral comparison
Phase fractions: (±10%)
| Phase | Fraction |
|---|---|
| Ru2Br4(CO)6 | 1.0 |
Fit basis (paper's reference spectra):
- Ru2Br4(CO)6
- RuBr3
Source evidence: Section 2.3, Figure 5, page 5
Key reasoning: At temperatures above 180 °C, the XANES spectrum of the sample becomes similar to that of the reference Ru2Br4(CO)6. This indicates the formation of the Ru-based active complex via interaction with CO ligands in the homogeneous catalytic system, which is considered the active catalyst for the hydrodeoxygenation of sugar alcohols.
Reasoning source: Section 2.3, page 5
Scoring Rubric (total: 100 pts)
| Q | Type | Max | Question | Reference Answer | Scoring Criteria |
|---|---|---|---|---|---|
| q1 | identification | 25 | What is the dominant Ru phase or complex formed in the Bu4PBr ionic liquid under 5 bar CO and 20 bar H2 at temperatures above 180 °C? | The dominant Ru phase formed under these conditions is Ru2Br4(CO)6, which accounts for a fraction of 1.0 (100%) of the sample. This specific complex forms because heating the initial RuBr3 precursor in the Bu4PBr ionic liquid to >180 °C under 5 bar CO and 20 bar H2 drives an interaction with the CO ligands. Consequently, the precursor fully transforms into this Ru-based active complex, which serves as the active catalyst for the hydrodeoxygenation of sugar alcohols in this homogeneous catalytic system. | Full credit for identifying Ru2Br4(CO)6 as the dominant phase. |
| q2 | identification | 25 | What reference spectra are necessary to track the evolution of this homogeneous catalytic system from its initial state to the state at >180 °C? | The necessary reference spectra for tracking the evolution of this system are RuBr3 and Ru2Br4(CO)6. These specific references are required because they represent the starting and ending points of the chemical transformation dictated by the sample conditions. Initially, the system consists of the RuBr3 precursor dissolved in the Bu4PBr ionic liquid. Upon heating to >180 °C under 5 bar CO and 20 bar H2, the precursor interacts with CO ligands to fully convert into the active catalytic complex, Ru2Br4(CO)6, making these two spectra essential for qualitative spectral comparison. | Full credit for mentioning RuBr3 (initial precursor) and Ru2Br4(CO)6 (final active complex). |
| q3 | reasoning | 25 | Explain the chemical reasoning for the formation of this specific Ru complex under these conditions and its relevance to the catalytic process. | Under the reaction conditions of 5 bar CO, 20 bar H2, and temperatures above 180 °C, the initial RuBr3 precursor dissolved in Bu4PBr ionic liquid undergoes a significant structural transformation. The elevated temperature and presence of carbon monoxide drive the ruthenium to interact with the CO ligands. This interaction results in the complete formation of the Ru2Br4(CO)6 complex. The formation of this specific complex is highly relevant to the catalytic process because it is considered the active catalyst responsible for the hydrodeoxygenation of sugar alcohols in this homogeneous system. | Full credit for explaining that the complex forms via interaction with CO ligands at elevated temperatures and that it is considered the active catalyst for the hydrodeoxygenation reaction. |
| q4 | spectral | 25 | How does the XANES spectral shape of the sample at >180 °C compare to the initial state of the catalyst? | At temperatures above 180 °C, the XANES spectral shape of the sample differs significantly from that of the initial RuBr3 precursor and instead closely matches the reference spectrum of Ru2Br4(CO)6. These distinct spectral features arise because the sample conditions (heating >180 °C under 5 bar CO and 20 bar H2) cause the initial RuBr3 dissolved in Bu4PBr to chemically evolve. Specifically, the ruthenium interacts with the CO ligands to form a new structural and electronic environment, completely converting into the Ru-based active complex. This structural transformation into the active catalyst for sugar alcohol hydrodeoxygenation is directly responsible for the observed changes in the XANES spectral shape. | Full credit for stating that the spectrum differs significantly from the initial RuBr3 precursor and matches the Ru2Br4(CO)6 reference. |
Review
#1224
Ru/aluminosilicate
Ru K-edge
▶
LLM Prompt
Sample Information
Material: Ru/aluminosilicate
Support: aluminosilicate
Reaction Conditions: dispersed in water, 20 bar H2, 25 °C (t=0 min)
Sample-Specific Conditions
- Temperature: 25 °C
- Ru-based catalyst on porous aluminosilicate carrier
Measurement
We plan to measure the Ru K-edge XANES spectrum of this sample.
Questions
Based on all the information above:
1. What is the dominant oxidation state of Ru in this catalyst at 25 °C before heating, and what principal components or reference states are needed to model its evolution during the reaction?
2. Explain the expected phase evolution of this catalyst when heated from 25 °C to 200 °C under 20 bar of H2.
Ground Truth
Material: Ru/aluminosilicate
Measurement: Ru K-edge, transmission mode, BM23 beamline of ESRF
Fit method: PCA and target matrix transformation
Phase fractions: (±10%)
| Phase | Fraction |
|---|---|
| Ru(IV) | 1.0 |
| Ru(II) | 0.0 |
Fit basis (paper's reference spectra):
- Ru(IV) component
- Ru(II) component
Source evidence: Figure 7a-c, Section 2.5, page 6-7
Key reasoning: At 25 °C, before heating, the ruthenium in the heterogeneous catalyst is present in an average oxidation state of Ru(IV). Upon heating under 20 bar of H2, it transitions to Ru(II). Therefore, at the initial temperature of 25 °C, the catalyst is entirely in the Ru(IV) state.
Reasoning source: Section 2.5, page 6
Scoring Rubric (total: 100 pts)
| Q | Type | Max | Question | Reference Answer | Scoring Criteria |
|---|---|---|---|---|---|
| q1 | identification | 43 | What is the dominant oxidation state of Ru in this catalyst at 25 °C before heating, and what principal components or reference states are needed to model its evolution during the reaction? | At 25 °C before heating, the dominant oxidation state of Ru in the catalyst is Ru(IV), which accounts for a fraction of 1.0. To model the catalyst's evolution during the reaction, both Ru(IV) and Ru(II) principal components are required. This initial composition arises because, at the starting temperature of 25 °C (t=0 min) in water, the Ru/aluminosilicate catalyst has not yet been reduced by the 20 bar H2 atmosphere. Upon subsequent heating under this pressurized hydrogen, the ruthenium undergoes a reduction mechanism, transitioning from the initial Ru(IV) state to a Ru(II) state. | 15 points for identifying Ru(IV) as the dominant/initial state. 15 points for stating that Ru(IV) and Ru(II) components are needed to model the evolution. |
| q2 | reasoning | 57 | Explain the expected phase evolution of this catalyst when heated from 25 °C to 200 °C under 20 bar of H2. | When heated under 20 bar of H2, the Ru/aluminosilicate catalyst undergoes a phase evolution from an initial Ru(IV) state to a Ru(II) state. At the starting condition of 25 °C (t=0 min), the ruthenium on the porous carrier is entirely present as Ru(IV) because it has not yet reacted with the hydrogen gas. As the system is heated under the 20 bar H2 atmosphere, a reduction mechanism occurs, converting the Ru(IV) species into Ru(II). Spectroscopically, this transition is characterized by the XANES absorption edge shifting to lower energies as the oxidation state decreases from the initial Ru(IV) state. | 20 points for describing the transition from Ru(IV) to Ru(II). 20 points for attributing this to reduction by H2 upon heating. |
Review
#1225
Ru/aluminosilicate
Ru K-edge
▶
LLM Prompt
Sample Information
Material: Ru/aluminosilicate
Support: aluminosilicate
Reaction Conditions: dispersed in water, 20 bar H2, ~113 °C (t=40 min)
Sample-Specific Conditions
- Temperature: 113 °C
- Ru-based catalyst on porous aluminosilicate carrier
Measurement
We plan to measure the Ru K-edge XANES spectrum of this sample.
Questions
Based on all the information above:
1. Based on the reaction conditions (dispersed in water, 20 bar H2, ~113 °C), what are the expected Ru oxidation states present in the catalyst, and what are their approximate relative fractions?
2. What basis functions or reference spectra would be appropriate to model the XANES spectra of this sample during the temperature ramp?
3. Explain the physical reasoning for the observed phase composition at this intermediate temperature (113 °C) under 20 bar H2.
Ground Truth
Material: Ru/aluminosilicate
Measurement: Ru K-edge, transmission mode, BM23 beamline of ESRF
Fit method: PCA and target matrix transformation
Phase fractions: (±15%)
| Phase | Fraction |
|---|---|
| Ru(IV) | 0.8 |
| Ru(II) | 0.2 |
Fit basis (paper's reference spectra):
- Ru(IV) component
- Ru(II) component
Source evidence: Figure 7c, page 7
Key reasoning: Upon heating the Ru-based heterogeneous catalyst dispersed in water under 20 bar of H2, the ruthenium transitions from an average initial oxidation state of Ru(IV) to Ru(II). At approximately 113 °C (40 minutes into the heating ramp of 2.2 deg/min), the reduction is partially complete, resulting in a mixture of predominantly Ru(IV) with a growing fraction of Ru(II).
Reasoning source: Section 2.5, page 6-7
Scoring Rubric (total: 100 pts)
| Q | Type | Max | Question | Reference Answer | Scoring Criteria |
|---|---|---|---|---|---|
| q1 | quantification | 40 | Based on the reaction conditions (dispersed in water, 20 bar H2, ~113 °C), what are the expected Ru oxidation states present in the catalyst, and what are their approximate relative fractions? | The expected Ru oxidation states present in the catalyst are Ru(IV) and Ru(II), with approximate relative fractions of 0.8 (80%) Ru(IV) and 0.2 (20%) Ru(II), subject to a 15% uncertainty. These specific values result from the applied reaction conditions, where the Ru/aluminosilicate catalyst is heated in water under a reducing atmosphere of 20 bar H2. This environment drives a chemical transition from an initial average oxidation state of Ru(IV) to a reduced Ru(II) state. At the specific intermediate temperature of 113 °C (reached at t=40 min), this reduction process is only partially complete. Consequently, the sample exists as a transitional mixture predominantly composed of the initial Ru(IV) phase alongside a growing fraction of the reduced Ru(II) phase. | Full points for identifying Ru(IV) and Ru(II) with fractions around 0.8 and 0.2, respectively. Partial points for identifying the correct oxidation states without accurate fractions. |
| q2 | identification | 30 | What basis functions or reference spectra would be appropriate to model the XANES spectra of this sample during the temperature ramp? | To model the Ru K-edge XANES spectra of this sample, a Ru(IV) component and a Ru(II) component should be used as the fit basis, utilizing PCA and target matrix transformation. These specific reference phases are required because the Ru/aluminosilicate catalyst undergoes a reduction process when dispersed in water and heated under 20 bar of H2. Under these conditions, the ruthenium transitions from an initial Ru(IV) oxidation state to a Ru(II) state. Because the measurement is taken at an intermediate temperature of 113 °C during the heating ramp, the reduction is only partially complete. Therefore, both the unreacted Ru(IV) precursor and the newly formed Ru(II) product coexist in the sample, necessitating both components to accurately fit the spectrum. | Full points for mentioning Ru(IV) and Ru(II) components or reference spectra corresponding to these oxidation states. |
| q3 | reasoning | 30 | Explain the physical reasoning for the observed phase composition at this intermediate temperature (113 °C) under 20 bar H2. | The observed phase composition of 80% Ru(IV) and 20% Ru(II) arises from the partial, temperature-dependent reduction of the Ru/aluminosilicate catalyst. Upon heating the catalyst dispersed in water under a strong reducing atmosphere of 20 bar H2, the ruthenium begins to transition from its initial Ru(IV) oxidation state to a lower Ru(II) oxidation state. At the specific intermediate temperature of 113 °C, which corresponds to 40 minutes into the heating ramp, the reduction kinetics have not yet allowed the reaction to reach completion. As a result, the physical state of the catalyst is a transitional mixture that is still predominantly the unreacted Ru(IV) precursor, but contains a steadily growing fraction of the Ru(II) product. | Full points for explaining that the initial Ru(IV) state is undergoing reduction to Ru(II) due to the presence of H2 and elevated temperature, and at 113 °C the reduction is only partially complete. |
Review
#1226
Ru/aluminosilicate
Ru K-edge
▶
LLM Prompt
Sample Information
Material: Ru/aluminosilicate
Support: aluminosilicate
Reaction Conditions: dispersed in water, 20 bar H2, ~157 °C (t=60 min)
Sample-Specific Conditions
- Temperature: 157 °C
- Ru-based catalyst on porous aluminosilicate carrier
Measurement
We plan to measure the Ru K-edge XANES spectrum of this sample.
Questions
Based on all the information above:
1. Based on the reaction conditions (aqueous dispersion, 20 bar H2, heating to 200 °C), what candidate reference states or principal components are needed to model the Ru K-edge XANES structural evolution of this aluminosilicate-supported catalyst?
2. Estimate the relative fractions of the Ru oxidation states present in the catalyst after heating to ~157 °C (t=60 min) under 20 bar H2.
3. Explain the chemical reasoning for the transition between these specific Ru oxidation states under the provided reaction conditions.
Ground Truth
Material: Ru/aluminosilicate
Measurement: Ru K-edge transmission mode at BM23 beamline of ESRF
Fit method: Principal component analysis (PCA) and target matrix transformation
Phase fractions: (±15%)
| Phase | Fraction |
|---|---|
| Ru(IV) | 0.3 |
| Ru(II) | 0.7 |
Fit basis (paper's reference spectra):
- Ru(IV) component
- Ru(II) component
Source evidence: Figure 7c and Section 2.5, page 6-7
Key reasoning: The catalyst is initially present as a powder dispersed in water and sealed under 20 bar of H2. Upon heating, the high hydrogen pressure drives the reduction of ruthenium from an average initial oxidation state of Ru(IV) to Ru(II), which is observed as a shift in the absorption edge. By approximately 157 °C (t=60 min), the reduction is significantly advanced, resulting in a mixture dominated by the Ru(II) state with a smaller remaining fraction of Ru(IV).
Reasoning source: Section 2.5, page 6
Scoring Rubric (total: 100 pts)
| Q | Type | Max | Question | Reference Answer | Scoring Criteria |
|---|---|---|---|---|---|
| q1 | identification | 25 | Based on the reaction conditions (aqueous dispersion, 20 bar H2, heating to 200 °C), what candidate reference states or principal components are needed to model the Ru K-edge XANES structural evolution of this aluminosilicate-supported catalyst? | To model the Ru K-edge XANES structural evolution of this aluminosilicate-supported catalyst, the required principal components are a Ru(IV) component and a Ru(II) component. These specific reference states are needed because the catalyst initially exists with an average oxidation state of Ru(IV). When the sample is dispersed in water and heated under a high hydrogen pressure of 20 bar H2, this environment drives the chemical reduction of the ruthenium. Consequently, the Ru(IV) and Ru(II) components are necessary to capture the transition from the initial oxidized state to the reduced state as the reaction progresses. | Full credit for identifying Ru(IV) and Ru(II) oxidation states as the necessary components. |
| q2 | quantification | 40 | Estimate the relative fractions of the Ru oxidation states present in the catalyst after heating to ~157 °C (t=60 min) under 20 bar H2. | After heating to ~157 °C (t=60 min) under 20 bar H2, the catalyst consists of a 0.7 (70%) fraction of Ru(II) and a 0.3 (30%) fraction of Ru(IV), with an uncertainty of 15%. These specific values arise because the high hydrogen pressure and elevated temperature strongly drive the reduction of the initial Ru(IV) species. By 60 minutes at 157 °C, this reduction process is significantly advanced. As a result, the catalyst mixture becomes dominated by the reduced Ru(II) state, with only a smaller fraction of the original Ru(IV) remaining unreduced. | Full credit for estimating ~70% Ru(II) and ~30% Ru(IV). Partial credit for identifying that Ru(II) is the majority phase but with inaccurate percentages. |
| q3 | reasoning | 35 | Explain the chemical reasoning for the transition between these specific Ru oxidation states under the provided reaction conditions. | The transition between the Ru(IV) and Ru(II) oxidation states is chemically driven by the highly reducing conditions applied to the aluminosilicate-supported catalyst. The catalyst is initially present as a powder dispersed in water with an average starting oxidation state of Ru(IV). Upon sealing the system under 20 bar of H2 and heating it to 157 °C, the high hydrogen pressure forces the reduction of the ruthenium species. This progressive reduction from Ru(IV) to Ru(II) is directly observed as a shift in the XANES absorption edge, culminating in a predominantly Ru(II) mixture after 60 minutes. | Full credit for explaining that the high pressure of H2 (20 bar) combined with elevated temperatures drives the reduction of the initial Ru(IV) species to Ru(II), causing a corresponding shift in the X-ray absorption edge. |
Review
#1227
Ru/aluminosilicate
Ru K-edge
▶
LLM Prompt
Sample Information
Material: Ru/aluminosilicate
Support: aluminosilicate
Reaction Conditions: dispersed in water, 20 bar H2, 200 °C (t=80 min)
Sample-Specific Conditions
- Temperature: 200 °C
- Ru-based catalyst on porous aluminosilicate carrier
Measurement
We plan to measure the Ru K-edge XANES spectrum of this sample.
Questions
Based on all the information above:
1. What candidate reference states or principal components are needed to model the structural evolution of this Ru/aluminosilicate catalyst during the described reaction?
2. Estimate the relative fractions of the ruthenium oxidation states present in the catalyst after heating to 200 °C (at t=80 min) under 20 bar H2.
Ground Truth
Material: Ru/aluminosilicate
Measurement: Ru K-edge transmission mode at BM23 beamline of ESRF
Fit method: Principal component analysis (PCA) followed by target matrix transformation
Phase fractions: (±10%)
| Phase | Fraction |
|---|---|
| Ru(IV) | 0.1 |
| Ru(II) | 0.9 |
Fit basis (paper's reference spectra):
- Ru(IV) component
- Ru(II) component
Source evidence: Figure 7c and Section 2.5, pages 6-7
Key reasoning: Upon heating the Ru-based heterogeneous catalyst in water under 20 bar of H2, the ruthenium undergoes reduction. This is evidenced by a shift in the absorption edge, indicating a transition from an average initial oxidation state of Ru(IV) to Ru(II). By 80 minutes, when the system reaches 200 °C, the reduction is largely complete, with the Ru(II) state dominating the composition.
Reasoning source: Section 2.5, page 6
Scoring Rubric (total: 100 pts)
| Q | Type | Max | Question | Reference Answer | Scoring Criteria |
|---|---|---|---|---|---|
| q1 | identification | 33 | What candidate reference states or principal components are needed to model the structural evolution of this Ru/aluminosilicate catalyst during the described reaction? | To model the structural evolution of the Ru/aluminosilicate catalyst, a Ru(IV) component and a Ru(II) component are needed as the principal components. These specific reference states are required because heating the catalyst in water under 20 bar of H2 induces a reduction process. Initially, the ruthenium exists in an average oxidation state of Ru(IV). As the reaction progresses towards 200 °C, the ruthenium undergoes reduction, evidenced by a shift in the absorption edge, transitioning to a Ru(II) state. Thus, capturing both the initial Ru(IV) and the resulting Ru(II) states is essential to fully describe the catalyst's evolution under these reducing conditions. | Full points for identifying Ru(IV) and Ru(II) components/states as the necessary basis for modeling the transformation. |
| q2 | quantification | 67 | Estimate the relative fractions of the ruthenium oxidation states present in the catalyst after heating to 200 °C (at t=80 min) under 20 bar H2. | After heating the catalyst to 200 °C (at t=80 min) under 20 bar H2, the relative fractions are approximately 90% Ru(II) and 10% Ru(IV), with an uncertainty of 10%. These specific values result from the strong reducing conditions applied to the Ru/aluminosilicate catalyst. Upon heating in water under 20 bar of H2, the initial Ru(IV) species undergoes significant reduction. By the time the system reaches 200 °C at 80 minutes, this reduction process is largely complete. Consequently, the Ru(II) state dominates the final composition, leaving only a minor 10% fraction of unreduced Ru(IV). | Full points for estimating ~90% Ru(II) and ~10% Ru(IV). Deduct points proportionally for estimates outside a ±10% margin. |
Review
#1228
Ru/aluminosilicate
Ru K-edge
▶
LLM Prompt
Sample Information
Material: Ru/aluminosilicate
Support: aluminosilicate
Reaction Conditions: dispersed in water, 20 bar H2, 200 °C (t=100 min)
Sample-Specific Conditions
- Time at 200 °C: 100 min
- Ru-based catalyst on porous aluminosilicate carrier
Measurement
We plan to measure the Ru K-edge XANES spectrum of this sample.
Questions
Based on all the information above:
1. Based on the provided reaction conditions (dispersed in water, 20 bar H2, heated to 200 °C and held until t=100 min), identify the expected ruthenium oxidation states present in the catalyst and estimate their relative fractions.
2. What is the physical reasoning for the transition in ruthenium oxidation states observed during this in-situ experiment under 20 bar H2?
3. What chemical states of ruthenium serve as the necessary basis components to model the XANES spectra of this catalyst during the described in-situ heating experiment?
Ground Truth
Material: Ru/aluminosilicate
Measurement: Ru K-edge, transmission mode, BM23 beamline of ESRF
Fit method: Principal component analysis (PCA) and target matrix transformation
Phase fractions: (±10%)
| Phase | Fraction |
|---|---|
| Ru(IV) | 0.05 |
| Ru(II) | 0.95 |
Fit basis (paper's reference spectra):
- Ru(IV) component
- Ru(II) component
Source evidence: Figure 7c and Section 2.5, pages 6-7
Key reasoning: Upon heating the Ru-based heterogeneous catalyst in water under 20 bar of H2 to 200 °C, the ruthenium undergoes a reduction from an initial average oxidation state of Ru(IV) to Ru(II). The shift of the absorption edge to lower energies indicates this transition. The heating rate was 2.2 deg/min, reaching 200 °C at 80 min. By 100 min, the reduction is nearly complete, with the Ru(II) state dominating the composition at approximately 95%.
Reasoning source: Section 2.5. Ru-Based Heterogeneous Catalysis
Scoring Rubric (total: 100 pts)
| Q | Type | Max | Question | Reference Answer | Scoring Criteria |
|---|---|---|---|---|---|
| q1 | quantification | 40 | Based on the provided reaction conditions (dispersed in water, 20 bar H2, heated to 200 °C and held until t=100 min), identify the expected ruthenium oxidation states present in the catalyst and estimate their relative fractions. | Under the specified conditions of 20 bar H2 and 200 °C at t=100 min, the expected ruthenium oxidation states are Ru(II) at approximately 0.95 (95%) and Ru(IV) at 0.05 (5%). These specific fractions result from the strong reducing environment provided by the 20 bar H2 atmosphere as the Ru/aluminosilicate catalyst is heated in water. The heating process drives the reduction of the initial Ru(IV) state to Ru(II), with the temperature reaching 200 °C at 80 min. By 100 min, this reduction process is nearly complete, leaving only a minor 5% fraction of unreduced Ru(IV) while the Ru(II) state dominates the composition. | Full credit for identifying Ru(IV) and Ru(II) with fractions of ~0.05 and ~0.95, respectively. Partial credit if the correct states are identified but fractions are off, or if only the dominant Ru(II) state is mentioned. |
| q2 | reasoning | 30 | What is the physical reasoning for the transition in ruthenium oxidation states observed during this in-situ experiment under 20 bar H2? | The transition in ruthenium oxidation states is driven by the highly reducing conditions of the in-situ experiment, specifically the application of 20 bar H2 gas while heating the Ru/aluminosilicate catalyst in water to 200 °C. As the temperature increases, the initial average oxidation state of Ru(IV) undergoes a chemical reduction to Ru(II). This reduction mechanism is physically evidenced in the XANES spectra by a shift of the absorption edge to lower energies. By t=100 min, the sustained high temperature and hydrogen pressure cause this reduction to be nearly complete, resulting in a final state dominated by 95% Ru(II) and 5% residual Ru(IV). | Full credit for explaining that the high pressure of H2 and elevated temperature (200 °C) drive the reduction of the initial Ru(IV) species to Ru(II), which is evidenced by a shift in the absorption edge. |
| q3 | identification | 30 | What chemical states of ruthenium serve as the necessary basis components to model the XANES spectra of this catalyst during the described in-situ heating experiment? | The necessary basis components to model the XANES spectra of this catalyst are a Ru(IV) component and a Ru(II) component. These specific chemical states are expected because the Ru/aluminosilicate catalyst starts with an initial average oxidation state of Ru(IV) and undergoes a reduction process when dispersed in water and heated to 200 °C under 20 bar H2. The reducing environment provided by the pressurized hydrogen gas drives the transition from Ru(IV) to Ru(II). Consequently, by t=100 min, the spectrum must be modeled using these two states to capture the nearly complete conversion to a 95% Ru(II) composition alongside the 5% residual Ru(IV). | Full credit for identifying that the spectra can be modeled using two independent components corresponding to the Ru(IV) and Ru(II) oxidation states. |
Review
Exploring the Interplay between Structure and Electronic Behavior across Pressure-Induced Isostructural and Structural Transitions in Weyl-Type Semimetal NbAs
ESRF-BM23
Pure Phase
João E. F. S. Rodrigues et al.
DOI: 10.3390/cryst14070578
2 scenarios
▶
#1229
NbAs
Nb K-edge
▶
LLM Prompt
Sample Information
Material: NbAs
Crystal Structure: Tetragonal I41md
Sample Form: powder
Measurement Mode: transmission
- NbAs at near-ambient pressure (~0.1 GPa) in the tetragonal phase
Measurement
We plan to measure the Nb K-edge XANES spectrum of this sample.
Questions
Based on all the information above:
1. Describe the expected spectral shape and key features of the Nb K-edge XANES spectrum for NbAs at near-ambient pressure (~0.1 GPa). Include specific energy positions for any labeled features if available.
2. What is the dominant crystallographic phase of NbAs at this pressure, and how does the XANES spectrum confirm this structure?
Ground Truth
Compound: NbAs
Oxidation state: not reported
Measurement: Nb K-edge XANES in transmission mode at beamline BM23 (ESRF)
Edge position: 18986
Spectral shape: The ambient XANES spectrum exhibits four clear features or peaks characterized by elevated absorption values at specific energies (labeled as α, β, γ, and δ). Feature γ defines a very weak shoulder on the second XANES peak, and feature δ defines the third XANES peak.
Labeled peaks:
| Label | Energy (eV) | Intensity | Origin | Source |
|---|---|---|---|---|
| α | not reported | strong | not discussed in this paper | paper_data |
| β | not reported | strong | not discussed in this paper | paper_data |
| γ | 19024 | weak shoulder | not discussed in this paper | paper_data |
| δ | 19046 | moderate | not discussed in this paper | paper_data |
Distinguishing features: The simulated XANES spectra of the tetragonal phase closely resemble the experimental data, accurately reproducing all features (α, β, γ, and δ). The γ feature is slightly less intense in the tetragonal phase compared to the high-pressure hexagonal (P-6m2) phase.
Key reasoning: At near-ambient conditions (~0.1 GPa), NbAs crystallizes in the non-centrosymmetric tetragonal phase (I41md). The experimental XANES spectrum exhibits four clear features (α, β, γ, and δ) which are accurately reproduced by the theoretical XANES simulation of the tetragonal I41md phase, confirming the structural assignment.
Reasoning source: Section 3.2 (XANES Analysis) and Section 4.2 (Pressure Evolution of the Medium-Range Structure)
Scoring Rubric (total: 100 pts)
| Q | Type | Max | Question | Reference Answer | Scoring Criteria |
|---|---|---|---|---|---|
| q1 | spectral | 57 | Describe the expected spectral shape and key features of the Nb K-edge XANES spectrum for NbAs at near-ambient pressure (~0.1 GPa). Include specific energy positions for any labeled features if available. | The Nb K-edge XANES spectrum, with an edge position at 18986 eV, exhibits four clear features characterized by elevated absorption values, labeled as α, β, γ, and δ. Specifically, feature γ appears as a very weak shoulder at 19024 eV, while feature δ defines the third XANES peak at 19046 eV. These specific spectral features arise because the sample is held at near-ambient pressure (~0.1 GPa), where NbAs crystallizes entirely in the non-centrosymmetric tetragonal (I41md) phase. The unique local structural environment of this tetragonal phase produces this distinct four-peak profile, which is accurately reproduced by theoretical FDMNES simulations and features a γ shoulder that is slightly less intense than what is observed in high-pressure phases. | Full credit requires mentioning the four clear features (α, β, γ, and δ), noting that γ is a weak shoulder on the second peak at ~19024 eV, and δ defines the third peak at ~19046 eV. |
| q2 | reasoning | 43 | What is the dominant crystallographic phase of NbAs at this pressure, and how does the XANES spectrum confirm this structure? | At near-ambient pressure (~0.1 GPa), the dominant crystallographic phase of NbAs is the non-centrosymmetric tetragonal phase (I41md), representing a phase fraction of 1.0. This pure phase is expected because ~0.1 GPa represents near-ambient conditions, which are insufficient to drive high-pressure structural transitions to other structures such as the hexagonal P-6m2 phase. The XANES spectrum confirms this structure by displaying four clear features (α, β, γ, and δ) that are accurately reproduced by theoretical FDMNES simulations using the tetragonal I41md basis. The close resemblance between the experimental data and the simulated tetragonal spectrum verifies the structural assignment under these specific pressure conditions. | Full credit requires identifying the Tetragonal I41md phase as the sole/dominant phase and explaining that the experimental XANES features (α, β, γ, and δ) are accurately reproduced by theoretical simulations of this specific tetragonal structure. |
Review
#1230
NbAs
Nb K-edge
▶
LLM Prompt
Sample Information
Material: NbAs
Crystal Structure: Hexagonal P-6m2
Sample Form: powder
Measurement Mode: transmission
- NbAs at high pressure (40 GPa) in the hexagonal phase
Measurement
We plan to measure the Nb K-edge XANES spectrum of this sample.
Questions
Based on all the information above:
1. Based on the XANES edge energy shift, how does the electronic structure of NbAs respond to compression up to 40 GPa, and what structural transition is associated with the spectral changes observed above 26 GPa?
2. Describe the specific evolution of the γ and δ features in the Nb K-edge XANES spectrum as NbAs is compressed to 40 GPa.
Ground Truth
Compound: NbAs
Oxidation state: not reported
Measurement: Nb K-edge XANES in transmission mode
Edge position: shifted to higher energies (blueshift) by ~1.5-2.0 eV relative to ambient
Spectral shape: The spectrum exhibits four main features (α, β, γ, δ). At 40 GPa (hexagonal phase), the γ feature at ~19.024 keV is significantly enhanced compared to the ambient tetragonal phase, while the δ feature at ~19.046 keV is decreased in intensity and broadened. The overall edge position is shifted to higher energies.
Labeled peaks:
| Label | Energy (eV) | Intensity | Origin | Source |
|---|---|---|---|---|
| α | not reported | strong | not discussed in this paper | paper_data |
| β | not reported | strong | not discussed in this paper | paper_data |
| γ | 19024 | enhanced shoulder | not discussed in this paper | paper_data |
| δ | 19046 | decreased and broadened | not discussed in this paper | paper_data |
Distinguishing features: The high-pressure hexagonal P-6m2 phase is distinguished from the ambient tetragonal phase by a more intense γ feature at ~19.024 keV and a decreased, broadened δ feature at ~19.046 keV, along with a blueshifted edge energy.
Key reasoning: At 40 GPa, NbAs has completed a structural phase transition from the ambient tetragonal I41md phase to the high-pressure hexagonal P-6m2 phase. This is evidenced by the XANES spectra where the γ feature at ~19.024 keV becomes more enhanced, matching the theoretical simulations for the hexagonal phase. Additionally, the edge energy shift shows a change in evolution above 26 GPa, corresponding to the completion of this structural transition.
Reasoning source: Section 3.2 (XANES Analysis) and Section 4.2 (Pressure Evolution of the Medium-Range Structure)
Scoring Rubric (total: 100 pts)
| Q | Type | Max | Question | Reference Answer | Scoring Criteria |
|---|---|---|---|---|---|
| q2 | reasoning | 54 | Based on the XANES edge energy shift, how does the electronic structure of NbAs respond to compression up to 40 GPa, and what structural transition is associated with the spectral changes observed above 26 GPa? | As NbAs is compressed up to 40 GPa, its electronic structure responds with a blueshift of the XANES edge position by approximately 1.5-2.0 eV relative to ambient conditions. The spectral changes observed above 26 GPa, specifically a change in the evolution of the edge energy shift, are associated with the completion of a structural phase transition. Under these high-pressure conditions, the material completely transforms from the ambient tetragonal I41md phase to the high-pressure hexagonal P-6m2 phase. This pressure-induced structural rearrangement alters the local atomic environment, which directly drives the observed changes in the edge energy evolution and the overall blueshift. | Full credit if the answer mentions that the edge energy shifts to higher energies (blueshift) under compression, and correctly associates the changes above 26 GPa with the completion of the structural transition from the tetragonal I41md phase to the hexagonal P-6m2 phase. |
| q3 | spectral | 46 | Describe the specific evolution of the γ and δ features in the Nb K-edge XANES spectrum as NbAs is compressed to 40 GPa. | As NbAs is compressed to 40 GPa, the Nb K-edge XANES spectrum shows a significant enhancement of the γ feature at ~19.024 keV, while the δ feature at ~19.046 keV decreases in intensity and broadens. These specific spectral evolutions occur because the applied high pressure of 40 GPa drives a complete structural phase transition from the ambient tetragonal I41md phase to the hexagonal P-6m2 phase. The distinct local atomic arrangement of the new hexagonal phase alters the electronic structure, which theoretical simulations confirm is directly responsible for producing the enhanced γ shoulder and the suppressed, broadened δ peak. | Full credit if the answer states that the γ feature (at ~19.024 keV) intensifies/enhances progressively, while the δ feature (at ~19.046 keV) decreases in intensity and broadens. |
Review
Anisotropic Local Structure of SrFe2−xNixAs2 (x = 0.00, 0.16, and 0.23) Superconductor Probed by Polarized X-ray Absorption Fine Structure Measurements
ESRF-BM23
Pure Phase
M. Y. Hacisalihoglu et al.
DOI: 10.3390/ma17061301
3 scenarios
▶
#1231
SrFe2As2
Fe K-edge
▶
LLM Prompt
Sample Information
Material: SrFe2As2
Crystal Structure: ThCr2Si2-type tetragonal (space group I4/mmm)
Sample Form: single crystal
Measurement Mode: fluorescence
- Parent compound of the iron-based superconductor measured at the Fe K-edge in E||ab and E||c polarizations
Measurement
We plan to measure the Fe K-edge XANES spectrum of this sample.
Questions
Based on all the information above:
1. Describe the expected spectral features at the Fe K-edge for this single crystal, specifically focusing on the pre-edge region and its physical origin.
2. How does the X-ray polarization (E||ab vs E||c) affect the pre-edge peak intensity in this material, and what does this reveal about the unoccupied electronic states?
3. What electronic transition governs the main absorption edge (white line/continuum) in the Fe K-edge XANES spectrum of this compound?
Ground Truth
Compound: SrFe2As2
Oxidation state: not reported
Measurement: Fe K-edge fluorescence XANES at ESRF BM23 and ALBA CLAESS
Edge position: ~7112
Spectral shape: The Fe K-edge XANES shows a weak pre-peak P and a main absorption edge governed by the 1s->4p dipole transition. The pre-peak is more intense in the E||c geometry than in the E||ab geometry.
Labeled peaks:
| Label | Energy (eV) | Intensity | Origin | Source |
|---|---|---|---|---|
| P (pre-peak) | ~7111 | weak, but more intense in E||c than E||ab | direct quadrupole 1s->3d transition and dipole contribution from local distortions mixing Fe 3d and As 4p orbitals | paper_data |
Distinguishing features: Strong polarization dependence (anisotropy) in the pre-peak intensity, reflecting the specific availability of 3dxz,yz and 3dz2 orbitals in E||c versus mainly 3dxz,yz in E||ab.
Key reasoning: The Fe K-edge XANES spectra probe the local geometry and valence electronic states of the FeAs4 layers. The pre-peak P reflects transitions into unoccupied Fe 3d states hybridized with As 4p orbitals. The polarization dependence of this pre-peak reveals the electronic anisotropy of the system, with different 3d orbitals being accessed depending on the X-ray polarization vector (E||c vs E||ab).
Reasoning source: Section 3.2 (X-ray Absorption Near Edge Structure (XANES) Analysis)
Scoring Rubric (total: 100 pts)
| Q | Type | Max | Question | Reference Answer | Scoring Criteria |
|---|---|---|---|---|---|
| q1 | spectral | 35 | Describe the expected spectral features at the Fe K-edge for this single crystal, specifically focusing on the pre-edge region and its physical origin. | The expected Fe K-edge XANES spectrum for the SrFe2As2 single crystal features a main absorption edge at ~7112 eV and a weak pre-edge peak (P) at ~7111 eV. This pre-edge feature arises from a combination of direct quadrupole 1s->3d transitions and dipole contributions caused by local distortions that mix the Fe 3d and As 4p orbitals. Because the sample is an oriented single crystal measured in different polarizations, the pre-peak exhibits strong anisotropy, appearing more intense in the E||c geometry than in the E||ab geometry. This specific spectral behavior occurs because the polarized X-rays selectively probe the highly anisotropic local geometry and valence electronic states of the FeAs4 layers within the ThCr2Si2-type tetragonal structure. | Full points if the answer identifies the weak pre-peak (P) and correctly attributes its origin to a direct quadrupole 1s->3d transition and a dipole contribution from local distortions mixing Fe 3d and As 4p orbitals. |
| q2 | reasoning | 45 | How does the X-ray polarization (E||ab vs E||c) affect the pre-edge peak intensity in this material, and what does this reveal about the unoccupied electronic states? | In this SrFe2As2 single crystal, the pre-edge peak intensity is highly dependent on the X-ray polarization, being significantly more intense in the E||c geometry compared to the E||ab geometry. This polarization dependence reveals the strong electronic anisotropy of the system's unoccupied Fe 3d states hybridized with As 4p orbitals. Specifically, the E||c polarization accesses the available 3dxz, yz, and 3dz2 orbitals, whereas the E||ab polarization mainly accesses the 3dxz, yz orbitals. This anisotropic behavior is directly expected from the sample conditions, as measuring an oriented single crystal with a layered ThCr2Si2-type tetragonal structure allows the polarized X-rays to selectively probe the directional valence electronic states of the FeAs4 layers. | Full points if the answer states that the pre-peak is more intense in the E||c geometry than in E||ab, and explains that this is due to the electronic anisotropy where 3dxz,yz and 3dz2 orbitals are reached in E||c, while mainly 3dxz,yz are reached in E||ab. |
| q3 | identification | 20 | What electronic transition governs the main absorption edge (white line/continuum) in the Fe K-edge XANES spectrum of this compound? | The main absorption edge in the Fe K-edge XANES spectrum of SrFe2As2 is governed by the dipole-allowed 1s->4p electronic transition. This transition produces the primary absorption step at approximately 7112 eV. This specific transition dominates the main edge because the Fe K-edge fundamentally probes the excitation of a core 1s electron into the lowest unoccupied p-character continuum states. In the context of this ThCr2Si2-type tetragonal single crystal, while the pre-edge probes the hybridized Fe 3d/As 4p states of the FeAs4 layers, the main edge reflects the primary dipole transition into the broader, unoccupied Fe 4p states characteristic of the bulk material. | Full points if the answer correctly identifies the Fe 1s->4p dipole transition into the continuum. |
Review
#1232
SrFe1.84Ni0.16As2
Fe K-edge
▶
LLM Prompt
Sample Information
Material: SrFe1.84Ni0.16As2
Crystal Structure: ThCr2Si2-type tetragonal
Sample Form: single crystal
Measurement Mode: fluorescence
- Ni-doped (x=0.16) iron-based superconductor measured at the Fe K-edge
Measurement
We plan to measure the Fe K-edge XANES spectrum of this sample.
Questions
Based on all the information above:
1. Describe the expected spectral shape and key features of the Fe K-edge XANES for the SrFe1.84Ni0.16As2 single crystal, specifically noting any polarization dependence (E||ab vs E||c).
2. What is the physical origin of the pre-peak feature in the Fe K-edge XANES spectrum of this material?
3. How does the Fe K-edge XANES spectrum of this Ni-doped sample (x=0.16) differ from the parent compound SrFe2As2 (x=0.00), and what structural changes do these spectral differences indicate?
Ground Truth
Compound: SrFe1.84Ni0.16As2
Oxidation state: not reported
Measurement: Fe K-edge XANES, fluorescence mode, ESRF BM23 and ALBA CLAESS
Edge position: ~7112
Spectral shape: The spectra show a pre-peak P and a main edge around 7112 eV. The spectral weight of the continuum beyond ~7116 eV is lower in the E||c geometry compared to E||ab. The pre-peak is more intense in the E||c geometry.
Labeled peaks:
| Label | Energy (eV) | Intensity | Origin | Source |
|---|---|---|---|---|
| P (pre-peak) | ~7111 | weak (but more intense in E||c than E||ab) | Hybridized Fe 3d and As 4p orbitals, with minor direct quadrupole 1s -> 3d transition contributions | paper_data |
Distinguishing features: Compared to the parent compound (x=0.00), the x=0.16 sample shows a shift to higher energy and a decreased spectral difference between the E||ab and E||c polarizations, indicating reduced structural anisotropy.
Key reasoning: The Fe K-edge XANES spectra exhibit a shift towards higher energy with increasing Ni substitution, which indicates a contraction of the near-neighbor Fe-As distances. The spectral difference between the E||ab and E||c polarizations decreases with Ni doping, demonstrating a reduction in both structural and electronic anisotropy. The pre-peak P is more intense in the E||c geometry and arises from hybridized Fe 3d and As 4p orbitals.
Reasoning source: Section 3.2: X-ray Absorption Near Edge Structure (XANES) Analysis
Scoring Rubric (total: 100 pts)
| Q | Type | Max | Question | Reference Answer | Scoring Criteria |
|---|---|---|---|---|---|
| q1 | spectral | 35 | Describe the expected spectral shape and key features of the Fe K-edge XANES for the SrFe1.84Ni0.16As2 single crystal, specifically noting any polarization dependence (E||ab vs E||c). | The Fe K-edge XANES spectrum of the SrFe1.84Ni0.16As2 single crystal features a main edge around 7112 eV and a weak pre-peak (P) at approximately 7111 eV. Because the sample is a single crystal with a ThCr2Si2-type tetragonal structure, the spectrum exhibits distinct polarization dependence. Specifically, the pre-peak is more intense in the E||c geometry compared to the E||ab geometry, while the continuum beyond ~7116 eV shows lower spectral weight in E||c than in E||ab. These polarization-dependent features arise directly from the structural and electronic anisotropy inherent to the oriented tetragonal lattice of the single crystal. | Award full points if the response mentions the presence of a pre-peak (P), notes that the pre-peak is more intense in the E||c geometry, and states that the continuum spectral weight beyond the edge is lower in the E||c geometry. |
| q2 | reasoning | 30 | What is the physical origin of the pre-peak feature in the Fe K-edge XANES spectrum of this material? | The pre-peak feature (P) located at approximately 7111 eV primarily originates from transitions into hybridized Fe 3d and As 4p orbitals, with minor contributions from direct quadrupole 1s to 3d transitions. This hybridization occurs because the Fe atoms in the SrFe1.84Ni0.16As2 crystal structure are strongly coordinated by As atoms, allowing their respective orbitals to mix. The pre-peak is notably more intense in the E||c polarization geometry compared to E||ab. This intensity difference reflects the specific spatial orientation and electronic anisotropy of these hybridized orbitals within the tetragonal single crystal. | Award full points if the response correctly identifies that the pre-peak primarily originates from hybridized Fe 3d and As 4p orbitals (with minor contributions from direct quadrupole 1s->3d transitions). |
| q3 | prediction | 35 | How does the Fe K-edge XANES spectrum of this Ni-doped sample (x=0.16) differ from the parent compound SrFe2As2 (x=0.00), and what structural changes do these spectral differences indicate? | Compared to the parent compound (x=0.00), the Fe K-edge XANES spectrum of the Ni-doped SrFe1.84Ni0.16As2 sample exhibits an overall shift towards higher energy. Additionally, the spectral difference between the E||ab and E||c polarizations is noticeably decreased in the doped sample. The shift to higher energy occurs because the Ni substitution (x=0.16) induces a contraction of the near-neighbor Fe-As distances in the lattice. Furthermore, the reduced difference between the polarization geometries demonstrates that this specific level of Ni doping leads to a reduction in both the structural and electronic anisotropy of the crystal. | Award full points if the response notes two main changes: 1) a shift to higher energy (indicating a contraction of Fe-As distances), and 2) a decreased spectral difference between the E||ab and E||c polarizations (indicating reduced structural/electronic anisotropy). |
Review
#1233
SrFe1.77Ni0.23As2
Fe K-edge
▶
LLM Prompt
Sample Information
Material: SrFe1.77Ni0.23As2
Crystal Structure: ThCr2Si2-type tetragonal
Sample Form: single crystal
Measurement Mode: fluorescence
- Ni-doped (x=0.23) iron-based superconductor measured at the Fe K-edge
Measurement
We plan to measure the Fe K-edge XANES spectrum of this sample.
Questions
Based on all the information above:
1. Describe the expected spectral features of the Fe K-edge XANES for SrFe1.77Ni0.23As2, including the origin of the pre-peak.
2. How does the polarization dependence (E||ab vs E||c) of the Fe K-edge XANES spectrum for the x=0.23 sample reflect its structural and electronic properties compared to lower Ni concentrations?
3. What physical changes in the local geometry cause the Fe K-edge XANES spectrum of SrFe1.77Ni0.23As2 to shift to higher energies relative to the parent compound?
Ground Truth
Compound: SrFe1.77Ni0.23As2
Oxidation state: not reported
Measurement: Fe K-edge fluorescence at ESRF BM23 and ALBA CLAESS
Edge position: ~7112
Spectral shape: The spectrum shifts to higher energy compared to x=0.00 and x=0.16. The difference between E||ab and E||c polarizations is minimized at x=0.23, indicating reduced anisotropy.
Labeled peaks:
| Label | Energy (eV) | Intensity | Origin | Source |
|---|---|---|---|---|
| P | ~7111 | weak | hybridized Fe 3d and As 4p orbitals | paper_data |
Distinguishing features: Lowest electronic and structural anisotropy among the studied series (x=0.00, 0.16, 0.23), evidenced by the smallest difference between E||ab and E||c spectra in both the continuum and the pre-peak P.
Key reasoning: The Fe K-edge XANES spectra shift towards higher energy with increasing Ni substitution (x=0.23), indicating a decrease in near-neighbor distances (contraction of Fe-As distances). The spectral difference between E||ab and E||c polarizations decreases, showing that the structural and electronic anisotropy decreases with Ni concentration. The pre-peak P reflects a direct transition into unoccupied Fe 3d admixed with As 4p orbitals.
Reasoning source: Section 3.2, Pages 7-8
Scoring Rubric (total: 100 pts)
| Q | Type | Max | Question | Reference Answer | Scoring Criteria |
|---|---|---|---|---|---|
| q1 | spectral | 30 | Describe the expected spectral features of the Fe K-edge XANES for SrFe1.77Ni0.23As2, including the origin of the pre-peak. | The Fe K-edge XANES spectrum for SrFe1.77Ni0.23As2 features an edge position at approximately 7112 eV and a weak pre-peak (P) at ~7111 eV. Compared to lower Ni concentrations, the overall spectrum shifts to higher energies and shows the smallest difference between E||ab and E||c polarizations. These spectral features arise because the high Ni substitution (x=0.23) in the tetragonal lattice induces a contraction of the Fe-As near-neighbor distances, which drives the energy shift and reduces structural anisotropy. Additionally, the pre-peak P emerges due to a direct electronic transition into unoccupied Fe 3d orbitals that are admixed with As 4p orbitals. | Award 15 points for identifying the pre-peak (P) at ~7111 eV and 15 points for correctly attributing its origin to hybridized Fe 3d and As 4p orbitals. |
| q2 | reasoning | 35 | How does the polarization dependence (E||ab vs E||c) of the Fe K-edge XANES spectrum for the x=0.23 sample reflect its structural and electronic properties compared to lower Ni concentrations? | For the x=0.23 single crystal sample, the Fe K-edge XANES spectrum exhibits the smallest difference between the E||ab and E||c polarizations in both the continuum and the pre-peak P compared to x=0.00 and x=0.16. This minimized polarization dependence indicates that the material has the lowest electronic and structural anisotropy among the studied series. This occurs because increasing the Ni substitution to x=0.23 in the ThCr2Si2-type tetragonal structure systematically decreases the structural and electronic anisotropy of the lattice. As a result, the local environment around the Fe atoms becomes more isotropic, yielding highly similar spectral responses regardless of the incident X-ray polarization direction. | Award 15 points for stating that the spectral difference between E||ab and E||c polarizations is minimized at x=0.23. Award 20 points for explaining that this indicates reduced structural and electronic anisotropy compared to lower Ni concentrations. |
| q3 | reasoning | 35 | What physical changes in the local geometry cause the Fe K-edge XANES spectrum of SrFe1.77Ni0.23As2 to shift to higher energies relative to the parent compound? | The Fe K-edge XANES spectrum of SrFe1.77Ni0.23As2 shifts to a higher energy (~7112 eV) compared to the undoped parent compound. This spectral shift is caused by a decrease in the near-neighbor distances within the crystal lattice. Specifically, substituting Ni into the structure at x=0.23 induces a contraction of the local Fe-As bond lengths. Because the XANES edge position is highly sensitive to local geometry, this structural contraction around the absorbing Fe atoms alters the local potential, thereby shifting the absorption edge to higher energies. | Award 35 points for explaining that the shift to higher energy indicates a decrease in near-neighbor distances, specifically the contraction of the Fe-As bond lengths upon Ni substitution. |
Review
Role of Synthetic Parameters on the Structural and Optical Properties of N,Sn-Copromoted Nanostructured TiO2: A Combined Ti K-Edge and Sn L2,3-Edges X-ray Absorption Investigation
BNL-NSLS-II-8-ID
Synthesis
Martina Fracchia et al.
DOI: 10.3390/nano10061224
5 scenarios
▶
#1234
TiO2
Ti K
▶
LLM Prompt
Sample Information
Material: TiO2
Method: sol-gel
Precursors: TTIP, 2-propanol, NH4OH, H2O
Temperature C: 400
Duration Hours: 6
Atmosphere: O2
Post Treatment: calcination
Sample-Specific Conditions
- Sn content and post-treatment: 0% Sn, calcination
- Undoped TiO2, calcined
Preparation
- Sol-gel synthesis using TTIP (37.6 mmol), 2-propanol, NH4OH, and H2O (molar ratios 1:20:0.5:100). Stirred at 60 °C for 90 min, dried at 80 °C overnight. Calcined at 400 °C under O2 flux (9 NL/h) for 6h.
Measurement
We plan to measure the Ti K XANES spectrum of this sample.
Questions
Based on all the information above:
1. What candidate reference spectra should be included in a linear combination fit (LCF) analysis of the Ti K-edge XANES spectrum for this sol-gel synthesized TiO2 sample to accurately determine its phase composition?
2. Based on the synthesis conditions (sol-gel, undoped, calcined at 400 °C), estimate the phase fractions of the TiO2 polymorphs present in this sample.
Ground Truth
Material: TiO2
Measurement: Ti K-edge in transmission mode at the XAFS beamline, Elettra synchrotron
Fit method: Linear combination fit
Phase fractions: (±2%)
| Phase | Fraction |
|---|---|
| anatase | 0.76 |
| brookite | 0.24 |
Fit basis (paper's reference spectra):
- rutile
- anatase
- brookite
Source evidence: Table 1 and Figure 1a, Section 3.1
Key reasoning: The synthesis of nanometric TiO2 can lead to the stabilization of brookite and anatase. For the undoped Ti_C sample calcined at 400 °C, the linear combination fit of the Ti K-edge XANES spectrum shows a mixture of 76% anatase and 24% brookite. Unlike heavily Sn-doped samples where Sn favors rutile formation, the undoped sample does not form rutile at this relatively low calcination temperature.
Reasoning source: Section 3.1, pages 4-5
Scoring Rubric (total: 100 pts)
| Q | Type | Max | Question | Reference Answer | Scoring Criteria |
|---|---|---|---|---|---|
| q1 | identification | 43 | What candidate reference spectra should be included in a linear combination fit (LCF) analysis of the Ti K-edge XANES spectrum for this sol-gel synthesized TiO2 sample to accurately determine its phase composition? | The linear combination fit (LCF) analysis for this sample should include reference spectra for the rutile, anatase, and brookite phases of TiO2. These specific references are necessary because the sol-gel synthesis of nanometric TiO2 typically leads to the stabilization of anatase and brookite. Furthermore, while rutile is not expected to form in this undoped sample due to the relatively low calcination temperature of 400 °C, it must be included in the fit basis to verify its absence. This is particularly important because the presence of dopants like Sn would normally favor rutile formation, so confirming the phase behavior of this 0% Sn control sample requires testing all three primary polymorphs. | Full points for identifying anatase, brookite, and rutile as the necessary reference spectra for TiO2 phase analysis. |
| q2 | quantification | 57 | Based on the synthesis conditions (sol-gel, undoped, calcined at 400 °C), estimate the phase fractions of the TiO2 polymorphs present in this sample. | The estimated phase fractions for this sample are 76% anatase and 24% brookite, with an uncertainty of 2%. These specific values arise because the sol-gel synthesis method stabilizes the formation of nanometric anatase and brookite phases. The complete absence of rutile is directly due to the sample conditions: it is undoped (0% Sn) and calcined at a relatively low temperature of 400 °C. Unlike heavily Sn-doped samples where the dopant favors rutile formation, the lack of Sn combined with the mild 400 °C calcination temperature restricts the final composition entirely to a mixture of anatase and brookite. | Full points for estimating approximately 76% anatase and 24% brookite (accepting ranges like 70-80% anatase and 20-30% brookite). Deduct points if rutile is predicted to be present in significant amounts. |
Review
#1235
N,Sn-copromoted TiO2
Ti K
▶
LLM Prompt
Sample Information
Material: N,Sn-copromoted TiO2
Method: sol-gel
Precursors: TTIP, SnCl4*5H2O, 2-propanol, NH4OH, H2O
Temperature C: 400
Duration Hours: 6
Atmosphere: O2
Post Treatment: calcination
Sample-Specific Conditions
- Sn content and post-treatment: 20% Sn, calcination
- 20% Sn-doped TiO2, calcined
Preparation
- Sol-gel synthesis using TTIP, SnCl4*5H2O, 2-propanol, NH4OH, and H2O (Ti:Sn molar ratio 1:0.2). Stirred at 60 °C for 90 min, dried at 80 °C overnight. Calcined at 400 °C under O2 flux (9 NL/h) for 6h.
Measurement
We plan to measure the Ti K XANES spectrum of this sample.
Questions
Based on all the information above:
1. Based on the synthesis conditions (20% Sn doping, calcination at 400 °C), what TiO2 phase is expected to exclusively form in this sample, and what is the physical reasoning for the stabilization of this specific polymorph?
2. When performing a linear combination fit (LCF) to analyze the Ti K-edge XANES spectrum of this synthesized TiO2 sample, what candidate reference spectra should be included in the basis set to properly evaluate the phase composition?
Ground Truth
Material: N,Sn-copromoted TiO2 (20% Sn/Ti molar ratio, calcined)
Measurement: Ti K-edge XAS in transmission mode at the XAFS beamline, Elettra synchrotron
Fit method: Linear combination fit
Phase fractions: (±5%)
| Phase | Fraction |
|---|---|
| rutile | 1.0 |
Fit basis (paper's reference spectra):
- rutile
- anatase
- brookite
Source evidence: Table 1 and Section 3.1, Page 5
Key reasoning: Doping with tin favors the formation and stabilization of rutile, which is isostructural with SnO2 in its most stable modification (cassiterite). The formation of pure rutile in the TiSn20_C sample is driven by its high Sn content coupled with the calcination procedure, despite the relatively low calcination temperature (400 °C).
Reasoning source: Section 3.1, Page 5
Scoring Rubric (total: 100 pts)
| Q | Type | Max | Question | Reference Answer | Scoring Criteria |
|---|---|---|---|---|---|
| q1 | reasoning | 57 | Based on the synthesis conditions (20% Sn doping, calcination at 400 °C), what TiO2 phase is expected to exclusively form in this sample, and what is the physical reasoning for the stabilization of this specific polymorph? | The sample is expected to exclusively form the rutile phase of TiO2 (1.0 fraction). This phase selection is directly driven by the specific sample conditions, namely the high 20% Sn/Ti molar ratio and the 6-hour calcination in O2 at 400 °C. Doping with tin favors the formation and stabilization of rutile because it is isostructural with SnO2 in its most stable modification, cassiterite. Consequently, the high Sn content coupled with the calcination procedure forces the complete formation of pure rutile, overcoming the fact that 400 °C is typically a relatively low calcination temperature for this phase. | Full credit requires identifying 100% rutile formation and explaining that Sn doping stabilizes rutile because it is isostructural with SnO2 (cassiterite), and that the combination of high Sn content and calcination drives this complete phase conversion. |
| q2 | identification | 43 | When performing a linear combination fit (LCF) to analyze the Ti K-edge XANES spectrum of this synthesized TiO2 sample, what candidate reference spectra should be included in the basis set to properly evaluate the phase composition? | To properly evaluate the phase composition of this synthesized sample, the linear combination fit (LCF) basis set should include reference spectra for rutile, anatase, and brookite. These references represent the standard TiO2 polymorphs that could potentially form during the sol-gel synthesis and subsequent calcination at 400 °C. Including all three is necessary to accurately determine the final composition and confirm the complete phase transformation to a 1.0 fraction of rutile. This pure rutile formation is ultimately detected because the high 20% Sn doping stabilizes the rutile structure—which is isostructural with SnO2 (cassiterite)—driving complete transformation during the O2 calcination process. | Full credit requires listing the three standard TiO2 polymorphs: rutile, anatase, and brookite. |
Review
#1236
N,Sn-copromoted TiO2
Ti K
▶
LLM Prompt
Sample Information
Material: N,Sn-copromoted TiO2
Method: sol-gel
Precursors: TTIP, SnCl4*5H2O, 2-propanol, NH4OH, H2O
Temperature C: 100
Duration Hours: 170
Post Treatment: hydrothermal
Sample-Specific Conditions
- Sn content and post-treatment: 20% Sn, hydrothermal
- 20% Sn-doped TiO2, hydrothermal
Preparation
- Sol-gel synthesis using TTIP, SnCl4*5H2O, 2-propanol, NH4OH, and H2O (Ti:Sn molar ratio 1:0.2). Stirred at 60 °C for 90 min, dried at 80 °C overnight. Hydrothermal treatment of 1.5 g xerogel in 50 mL water at 100 °C for 170 h.
Measurement
We plan to measure the Ti K XANES spectrum of this sample.
Questions
Based on all the information above:
1. Based on the synthesis conditions (20% Sn doping, hydrothermal treatment at 100 °C), what TiO2 phases are expected to be present and what are their approximate fractions?
2. What reference spectra are required to perform a linear combination fit of the Ti K-edge XANES spectrum for this sample?
Ground Truth
Material: N,Sn-copromoted TiO2
Measurement: Ti K-edge in transmission mode at Elettra synchrotron
Fit method: LCF
Phase fractions: (±2%)
| Phase | Fraction |
|---|---|
| anatase | 0.55 |
| rutile | 0.45 |
Fit basis (paper's reference spectra):
- anatase
- rutile
Source evidence: Table 1 and Section 3.1, page 5
Key reasoning: Despite the relatively high quantity of tin (20%), the sample is a mix of anatase and rutile. The mild hydrothermal synthesis prevents most of the tin atoms from penetrating the TiO2 lattice, leaving SnO2 confined at the surface of the nanoparticles. This lower bulk penetration of Sn heteroatoms during the low-temperature post-treatment limits the Sn-induced stabilization of the rutile phase compared to calcined samples.
Reasoning source: Section 3.1, page 5
Scoring Rubric (total: 100 pts)
| Q | Type | Max | Question | Reference Answer | Scoring Criteria |
|---|---|---|---|---|---|
| q1 | quantification | 57 | Based on the synthesis conditions (20% Sn doping, hydrothermal treatment at 100 °C), what TiO2 phases are expected to be present and what are their approximate fractions? | The sample is expected to consist of approximately 55% anatase and 45% rutile, with an uncertainty of about 2%. Despite the relatively high 20% tin doping level, these specific fractions arise because the mild hydrothermal treatment at 100 °C for 170 hours prevents most of the tin atoms from penetrating the TiO2 lattice. Instead, the SnO2 remains confined at the surface of the nanoparticles. This lower bulk penetration of Sn heteroatoms during the low-temperature post-treatment limits the Sn-induced stabilization of the rutile phase that would typically occur in calcined samples, resulting in the observed mixed-phase composition. | Full points for identifying anatase and rutile with fractions around 55% and 45% respectively. Partial points for identifying the correct phases without accurate fractions. |
| q2 | identification | 43 | What reference spectra are required to perform a linear combination fit of the Ti K-edge XANES spectrum for this sample? | To perform a linear combination fit of the Ti K-edge XANES spectrum for this sample, reference spectra for anatase and rutile are required. These specific reference phases are necessary because the sol-gel synthesis followed by a mild hydrothermal treatment at 100 °C produces a mixed-phase TiO2 structure. Even with a high 20% Sn doping level, the low-temperature hydrothermal conditions prevent significant bulk penetration of Sn into the TiO2 lattice, confining it to the surface. Consequently, the Sn-induced stabilization of the rutile phase is limited compared to higher-temperature calcination, leading to the coexistence of both anatase and rutile phases that must be accounted for in the fit. | Full points for listing anatase and rutile reference spectra. |
Review
#1237
N,Sn-copromoted TiO2
Ti K
▶
LLM Prompt
Sample Information
Material: N,Sn-copromoted TiO2
Method: sol-gel
Precursors: TTIP, SnCl4*5H2O, 2-propanol, NH4OH, H2O
Temperature C: 400
Duration Hours: 6
Atmosphere: O2
Post Treatment: calcination
Sample-Specific Conditions
- Sn content and post-treatment: 5% Sn, calcination
- 5% Sn-doped TiO2, calcined
Preparation
- Sol-gel synthesis using TTIP, SnCl4*5H2O, 2-propanol, NH4OH, and H2O (Ti:Sn molar ratio 1:0.05). Stirred at 60 °C for 90 min, dried at 80 °C overnight. Calcined at 400 °C under O2 flux (9 NL/h) for 6h.
Measurement
We plan to measure the Ti K XANES spectrum of this sample.
Questions
Based on all the information above:
1. What candidate reference spectra are needed to perform a Linear Combination Fit (LCF) of the Ti K-edge XANES spectrum for this sample?
2. Estimate the phase fractions of the TiO2 polymorphs present in this sample after calcination at 400 °C.
3. Explain the physical reasoning for why this specific Sn concentration (5%) results in a mixed-phase composition rather than a pure phase upon calcination at 400 °C.
Ground Truth
Material: N,Sn-copromoted TiO2 (5% Sn-doped TiO2, calcined)
Measurement: Ti K-edge in transmission mode at the XAFS beamline at Elettra synchrotron
Fit method: Linear combination fit (LCF)
Phase fractions: (±7%)
| Phase | Fraction |
|---|---|
| anatase | 0.58 |
| brookite | 0.14 |
| rutile | 0.28 |
Fit basis (paper's reference spectra):
- rutile
- anatase
- brookite
Source evidence: Table 1 and Section 3.1 (Page 5)
Key reasoning: At a lower Sn/Ti ratio of 5% (TiSn5_C), the quantity of tin is too low to induce the neat formation of rutile TiO2, unlike the 20% Sn sample which forms pure rutile. Doping with Sn generally favors rutile formation because Sn(IV) substitutional doping reduces the formation energy of rutile with respect to anatase. However, 5% Sn is insufficient to fully stabilize pure rutile at the low calcination temperature of 400 °C, resulting in a mixture of anatase, brookite, and rutile.
Reasoning source: Section 3.1, Page 5
Scoring Rubric (total: 100 pts)
| Q | Type | Max | Question | Reference Answer | Scoring Criteria |
|---|---|---|---|---|---|
| q1 | identification | 20 | What candidate reference spectra are needed to perform a Linear Combination Fit (LCF) of the Ti K-edge XANES spectrum for this sample? | The candidate reference spectra needed to perform a Linear Combination Fit (LCF) of the Ti K-edge XANES spectrum are rutile, anatase, and brookite. These specific phases are expected because the sample is a 5% Sn-doped TiO2 synthesized via sol-gel and calcined at 400 °C. While Sn(IV) substitutional doping generally favors rutile formation by reducing its formation energy compared to anatase, the 5% Sn concentration is too low to induce the formation of pure rutile at this low calcination temperature. Consequently, the material does not fully convert, resulting in a mixed-phase composition that requires anatase, brookite, and rutile references to accurately fit the spectrum. | Full credit for identifying anatase, rutile, and brookite as the necessary reference spectra. |
| q2 | quantification | 40 | Estimate the phase fractions of the TiO2 polymorphs present in this sample after calcination at 400 °C. | The estimated phase fractions for this sample are 58% anatase, 28% rutile, and 14% brookite, with an uncertainty of 7%. These specific values result from the combination of the 5% Sn doping level and the 400 °C calcination temperature under an O2 atmosphere. Sn(IV) doping lowers the formation energy of rutile relative to anatase, which promotes the formation of the 28% rutile fraction. However, because the 5% Sn quantity is insufficient to fully stabilize pure rutile at the relatively low temperature of 400 °C, the majority of the sample remains as anatase (58%) along with a minor brookite component (14%). | Full credit for estimating ~58% anatase, ~28% rutile, and ~14% brookite (within the 7% uncertainty margin). |
| q3 | reasoning | 40 | Explain the physical reasoning for why this specific Sn concentration (5%) results in a mixed-phase composition rather than a pure phase upon calcination at 400 °C. | The mixed-phase composition arises because the 5% Sn concentration is too low to induce the neat formation of pure rutile TiO2 at the low calcination temperature of 400 °C. Generally, Sn(IV) substitutional doping favors rutile formation because it reduces the formation energy of rutile with respect to anatase. However, at a low Sn/Ti ratio of 5%, this energetic stabilization is insufficient to drive a complete phase transformation during the 6-hour calcination at 400 °C. As a result, the system cannot fully convert to pure rutile, leaving a mixture of anatase, brookite, and rutile phases. | Full credit for explaining that while Sn doping favors rutile formation (by lowering its formation energy relative to anatase), a 5% Sn concentration is too low to induce the complete transformation to pure rutile at 400 °C, leaving a mixture of anatase, brookite, and rutile. |
Review
#1238
N,Sn-copromoted TiO2
Ti K
▶
LLM Prompt
Sample Information
Material: N,Sn-copromoted TiO2
Method: sol-gel
Precursors: TTIP, SnCl4*5H2O, 2-propanol, NH4OH, H2O
Temperature C: 100
Duration Hours: 170
Post Treatment: hydrothermal
Sample-Specific Conditions
- Sn content and post-treatment: 5% Sn, hydrothermal
- 5% Sn-doped TiO2, hydrothermal
Preparation
- Sol-gel synthesis using TTIP, SnCl4*5H2O, 2-propanol, NH4OH, and H2O (Ti:Sn molar ratio 1:0.05). Stirred at 60 °C for 90 min, dried at 80 °C overnight. Hydrothermal treatment of 1.5 g xerogel in 50 mL water at 100 °C for 170 h.
Measurement
We plan to measure the Ti K XANES spectrum of this sample.
Questions
Based on all the information above:
1. Based on the synthesis conditions (5% Sn-doped TiO2, hydrothermal treatment at 100 °C), what is the expected dominant TiO2 phase, and why?
2. What reference spectra should be included in a linear combination fit (LCF) to properly analyze the Ti K-edge XANES spectrum of this sample?
Ground Truth
Material: N,Sn-copromoted TiO2
Measurement: Ti K-edge in transmission mode at the XAFS beamline, Elettra synchrotron
Fit method: Linear combination fit
Phase fractions: (±5%)
| Phase | Fraction |
|---|---|
| anatase | 1.0 |
Fit basis (paper's reference spectra):
- rutile
- anatase
- brookite
Source evidence: Table 1 and Figure 1b, Page 5
Key reasoning: The milder hydrothermal procedure and the low Sn content (5%) do not induce the formation of rutile TiO2. The XAS spectrum of TiSn5_H shows no trace of rutile, and all of the peaks clearly coincide with the anatase reference spectrum. The derivative spectra confirm the presence of Ti exclusively in the Ti(IV) oxidation state.
Reasoning source: Section 3.1, Page 5
Scoring Rubric (total: 100 pts)
| Q | Type | Max | Question | Reference Answer | Scoring Criteria |
|---|---|---|---|---|---|
| q1 | reasoning | 57 | Based on the synthesis conditions (5% Sn-doped TiO2, hydrothermal treatment at 100 °C), what is the expected dominant TiO2 phase, and why? | The expected dominant phase for this sample is 100% anatase TiO2. This outcome is a direct result of the specific synthesis conditions, namely the low Sn content (5%) and the milder hydrothermal post-treatment at 100 °C for 170 hours. These mild conditions do not provide the necessary driving force to induce the formation of rutile TiO2. Consequently, the material crystallizes exclusively as anatase with Ti in the Ti(IV) oxidation state, and its XANES spectrum perfectly coincides with the anatase reference without any trace of rutile. | Full points for identifying anatase as the dominant (100%) phase and explaining that the mild hydrothermal conditions and low Sn content are insufficient to induce rutile formation. |
| q2 | identification | 43 | What reference spectra should be included in a linear combination fit (LCF) to properly analyze the Ti K-edge XANES spectrum of this sample? | A linear combination fit (LCF) for this sample should include reference spectra for the rutile, anatase, and brookite phases of TiO2. These references are necessary because the distinct connectivity of the TiO6 octahedral units in each polymorph leads to different binding energies and densities of empty states, making them easily distinguishable in the Ti K-edge spectrum. Although the fit basis includes all three phases to ensure a complete analysis, the specific sample conditions—namely the low 5% Sn content and mild 100 °C hydrothermal treatment—do not induce rutile formation. Therefore, the LCF will ultimately yield a 1.0 (100%) fraction for anatase, confirming that these mild synthesis conditions produce exclusively anatase TiO2. | Full points for listing anatase, rutile, and brookite as the necessary reference spectra for TiO2 polymorph analysis. |
Review
Synthesis of Nanoceria with Varied Ratios of Ce3+/Ce4+ Utilizing Soluble Borate Glass
BNL-NSLS-II-8-ID
Synthesis
Kisa S. Ranasinghe et al.
DOI: 10.3390/nano12142363
11 scenarios
▶
#1239
Ce-doped sodium borate glass
Ce L3-edge
▶
LLM Prompt
Sample Information
Material: Ce-doped sodium borate glass
Method: melt-quenching
Precursors: Na2O·2B2O3·0.04CeO2
Temperature C: 1100
Duration Hours: 1
Atmosphere: air
Cooling Method: quenched between two steel plates
Sample-Specific Conditions
- CeO2 doping amount: 0.04 mol
- Sodium borate glass doped with 0.04 mol CeO2, melted at 1100 °C for 1 h
Preparation
- Sodium carbonate and diboron trioxide mixed with powdered CeO2 to create Na2O·2B2O3·0.04CeO2 glass. Melted in a platinum crucible using a high-temperature furnace in air atmosphere and quenched between two steel plates.
Measurement
We plan to measure the Ce L3-edge XANES spectrum of this sample.
Questions
Based on all the information above:
1. What candidate reference spectra or oxidation states are needed to model the Ce L3-edge XANES spectrum of this sample?
2. Estimate the phase fractions of the Ce species in this sodium borate glass sample melted at 1100 °C in air.
3. Based on the synthesis conditions (melt-quenching in air at 1100 °C), explain the expected oxidation state distribution of Cerium in this glass.
Ground Truth
Material: Ce-doped sodium borate glass
Measurement: Ce L3-edge XANES
Fit method: LCF
Phase fractions: (±10%)
| Phase | Fraction |
|---|---|
| Ce3+ | 0.419 |
| Ce4+ | 0.581 |
Fit basis (paper's reference spectra):
- Ce3+
- Ce4+
Source evidence: Data source: text
Key reasoning: The sample was prepared by melt-quenching Na2O·2B2O3·0.04CeO2 in air at 1100 °C for 1 h. Under these synthesis conditions, Cerium exists in a mixed valence state, with a slight majority as Ce4+ (58.1%) and a significant portion as Ce3+ (41.9%).
Reasoning source: Sample description and phase fractions
Scoring Rubric (total: 100 pts)
| Q | Type | Max | Question | Reference Answer | Scoring Criteria |
|---|---|---|---|---|---|
| q1 | identification | 30 | What candidate reference spectra or oxidation states are needed to model the Ce L3-edge XANES spectrum of this sample? | To model the Ce L3-edge XANES spectrum of this sample, reference spectra for Ce3+ and Ce4+ oxidation states are required. These specific states are needed because the sample was prepared by melt-quenching a Na2O·2B2O3·0.04CeO2 precursor mixture in an air atmosphere at 1100 °C for 1 hour. Under these high-temperature melting conditions, the cerium from the CeO2 precursor does not remain purely in a 4+ state but instead forms a mixed valence state. Consequently, both Ce3+ and Ce4+ references are necessary to accurately capture the resulting oxidation state distribution in the quenched glass. | Full points for identifying both Ce3+ and Ce4+ as the necessary basis components. |
| q2 | quantification | 40 | Estimate the phase fractions of the Ce species in this sodium borate glass sample melted at 1100 °C in air. | The estimated phase fractions for the cerium species in this sample are 41.9% Ce3+ and 58.1% Ce4+, with a fitting uncertainty of 10%. These specific values result from melting the Na2O·2B2O3·0.04CeO2 glass precursors at 1100 °C for 1 hour in an air atmosphere, followed by rapid cooling between two steel plates. Under these specific high-temperature synthesis conditions, the cerium transitions into a mixed valence state rather than remaining entirely as the initial CeO2 precursor. As a result, the final quenched glass retains a slight majority of cerium as Ce4+ (58.1%) alongside a significant portion of Ce3+ (41.9%). | Full points for estimating approximately 42% Ce3+ and 58% Ce4+. Partial points for predicting a mixed valence state with both species present in significant amounts. |
| q3 | reasoning | 30 | Based on the synthesis conditions (melt-quenching in air at 1100 °C), explain the expected oxidation state distribution of Cerium in this glass. | The expected oxidation state distribution of cerium in this glass is a mixed valence state consisting of 58.1% Ce4+ and 41.9% Ce3+. This distribution is a direct outcome of the melt-quenching process, where Na2O·2B2O3·0.04CeO2 precursors are melted at 1100 °C for 1 hour in an air atmosphere. Under these specific high-temperature synthesis conditions, the cerium does not remain entirely in the Ce4+ state of the initial CeO2 dopant. Instead, the combination of the 1100 °C melting step and subsequent quenching between steel plates stabilizes a mixed valence state. This mechanism results in a final distribution where a slight majority exists as Ce4+ and a significant portion exists as Ce3+. | Full points for explaining that the air atmosphere and high-temperature glass melting conditions lead to a mixed valence state containing both Ce3+ and Ce4+. |
Review
#1240
Ce-doped sodium borate glass
Ce L3-edge
▶
LLM Prompt
Sample Information
Material: Ce-doped sodium borate glass
Method: melt-quenching
Precursors: Na2O·2B2O3·0.01CeO2
Temperature C: 1100
Duration Hours: 1
Atmosphere: air
Cooling Method: quenched between two steel plates
Sample-Specific Conditions
- CeO2 doping amount: 0.01 mol
- Sodium borate glass doped with 0.01 mol CeO2, melted at 1100 °C for 1 h
Preparation
- Sodium carbonate and diboron trioxide mixed with powdered CeO2 to create Na2O·2B2O3·0.01CeO2 glass. Melted in a platinum crucible using a high-temperature furnace in air atmosphere and quenched between two steel plates.
Measurement
We plan to measure the Ce L3-edge XANES spectrum of this sample.
Questions
Based on all the information above:
1. Based on the synthesis conditions (melt-quenching at 1100 °C in air using a CeO2 precursor), predict the expected oxidation states of Cerium in the final sodium borate glass and estimate their relative fractions.
2. Explain the physical/chemical reasoning for the final oxidation state distribution of Cerium in this sample, specifically addressing the role of the precursor and the melting atmosphere.
3. What candidate reference spectra are required to perform Linear Combination Fitting (LCF) on the Ce L3-edge XANES spectrum of this specific glass sample?
Ground Truth
Material: Ce-doped sodium borate glass
Measurement: Ce L3-edge XANES
Fit method: LCF
Phase fractions: (±10%)
| Phase | Fraction |
|---|---|
| Ce3+ | 0.707 |
| Ce4+ | 0.293 |
Fit basis (paper's reference spectra):
- Ce3+ reference spectrum
- Ce4+ reference spectrum
Source evidence: Data source: text; Sample ID: S1NBCe glass (1100 °C, 1 h)
Key reasoning: Despite using CeO2 (Ce4+) as the precursor and melting the sample in an oxidizing air atmosphere, the high-temperature (1100 °C) melt-quenching process induces a partial reduction of cerium. This results in a mixed oxidation state in the final sodium borate glass, with Ce3+ being the dominant phase (70.7%) and Ce4+ as the minority phase (29.3%).
Reasoning source: Deduced from the provided synthesis conditions (1100 °C, air, CeO2 precursor) and the final phase fractions.
Scoring Rubric (total: 100 pts)
| Q | Type | Max | Question | Reference Answer | Scoring Criteria |
|---|---|---|---|---|---|
| q1 | prediction | 40 | Based on the synthesis conditions (melt-quenching at 1100 °C in air using a CeO2 precursor), predict the expected oxidation states of Cerium in the final sodium borate glass and estimate their relative fractions. | The expected oxidation states of Cerium in the final sodium borate glass are a mixture of Ce3+ and Ce4+. Specifically, the relative fractions are estimated to be 70.7% Ce3+ and 29.3% Ce4+, with an uncertainty of 10%. These specific fractions result from the high-temperature (1100 °C) melt-quenching process, which induces a partial reduction of the cerium ions. Even though the synthesis uses a CeO2 (Ce4+) precursor and takes place in an oxidizing air atmosphere, the thermal energy at 1100 °C is sufficient to drive this reduction mechanism, making Ce3+ the dominant phase in the final quenched glass. | Award 40 points if the response correctly predicts a mixture of Ce3+ and Ce4+ with Ce3+ being the dominant species (~70%). Award 20 points if the response predicts a mixture but incorrectly assumes Ce4+ is dominant due to the air atmosphere and CeO2 precursor. Award 0 points if the response predicts only a single oxidation state (pure Ce3+ or pure Ce4+). |
| q2 | reasoning | 30 | Explain the physical/chemical reasoning for the final oxidation state distribution of Cerium in this sample, specifically addressing the role of the precursor and the melting atmosphere. | The final oxidation state distribution consists of 70.7% Ce3+ and 29.3% Ce4+, representing a mixed-valence state dominated by Ce3+. Initially, the synthesis utilizes powdered CeO2 as a precursor, which introduces cerium entirely in the Ce4+ oxidation state. Furthermore, the melting process occurs in an oxidizing air atmosphere, which would typically favor the retention of this higher oxidation state. However, the high-temperature melt-quenching process at 1100 °C for 1 hour induces a partial reduction of the cerium ions. This thermal reduction mechanism overcomes the oxidizing environment, resulting in the conversion of the majority of the Ce4+ precursor into the Ce3+ phase within the final sodium borate glass. | Award 30 points if the response explains that high-temperature melting (1100 °C) of the glass melt drives the reduction of Ce4+ to Ce3+ (shifting the redox equilibrium), overcoming the oxidizing effect of the air atmosphere and the initial Ce4+ state of the CeO2 precursor. Award 15 points for a partial explanation. |
| q3 | identification | 30 | What candidate reference spectra are required to perform Linear Combination Fitting (LCF) on the Ce L3-edge XANES spectrum of this specific glass sample? | To perform Linear Combination Fitting (LCF) on the Ce L3-edge XANES spectrum of this sample, a Ce3+ reference spectrum and a Ce4+ reference spectrum are required. These specific reference spectra are necessary because the final sodium borate glass contains a mixture of both oxidation states. Although the initial precursor is exclusively CeO2 (Ce4+) and the melting occurs in an oxidizing air atmosphere, the high-temperature (1100 °C) melt-quenching process induces a partial reduction of the cerium. Consequently, this thermal reduction mechanism yields a final composition of 70.7% Ce3+ and 29.3% Ce4+, necessitating both reference standards to accurately model the mixed-valence XANES data. | Award 30 points for explicitly identifying that both Ce3+ and Ce4+ reference spectra are needed to fit the mixed-valence state of the sample. Award 0 points if only one oxidation state reference is mentioned. |
Review
#1241
Ce-doped sodium borate glass
Ce L3-edge
▶
LLM Prompt
Sample Information
Material: Ce-doped sodium borate glass
Method: melt-quenching
Precursors: Na2O·2B2O3·0.05CeO2
Temperature C: 1200
Atmosphere: air
Cooling Method: quenched between two steel plates
Sample-Specific Conditions
- Melting temperature: 1200 °C
- Sodium borate glass doped with 0.05 mol CeO2, melted at 1200 °C
Preparation
- Sodium carbonate and diboron trioxide mixed with powdered CeO2 to create Na2O·2B2O3·0.05CeO2 glass. Melted in a platinum crucible using a high-temperature furnace in air atmosphere and quenched between two steel plates.
Measurement
We plan to measure the Ce L3-edge XANES spectrum of this sample.
Questions
Based on all the information above:
1. What candidate reference spectra or basis functions are needed to model the Ce L3-edge XANES spectrum of this glass sample using Linear Combination Fitting (LCF)?
2. Based on the synthesis conditions (melted at 1200 °C in air from a CeO2 precursor), estimate the relative phase fractions of the Ce oxidation states in the final glass.
3. Provide the physical reasoning for the expected oxidation states in this sample. Specifically, explain how the 1200 °C melting temperature affects the final Ce3+/Ce4+ ratio despite the use of an air atmosphere and a Ce4+ precursor.
Ground Truth
Material: Ce-doped sodium borate glass
Measurement: Ce L3-edge XANES
Fit method: Linear Combination Fitting (LCF)
Phase fractions: (±10%)
| Phase | Fraction |
|---|---|
| Ce3+ | 0.79 |
| Ce4+ | 0.21 |
Fit basis (paper's reference spectra):
- Ce3+ reference spectrum
- Ce4+ reference spectrum
Source evidence: Extracted from text data source
Key reasoning: Despite using CeO2 (Ce4+) as a precursor and melting in an oxidizing air atmosphere, the high melting temperature of 1200 °C shifts the redox equilibrium strongly toward the reduced state. This thermal reduction in the borate glass melt results in a predominantly Ce3+ composition (79%), with only a minor fraction of Ce4+ remaining.
Reasoning source: Text
Scoring Rubric (total: 100 pts)
| Q | Type | Max | Question | Reference Answer | Scoring Criteria |
|---|---|---|---|---|---|
| q1 | identification | 20 | What candidate reference spectra or basis functions are needed to model the Ce L3-edge XANES spectrum of this glass sample using Linear Combination Fitting (LCF)? | To model the Ce L3-edge XANES spectrum of this glass sample using Linear Combination Fitting (LCF), the required basis functions are a Ce3+ reference spectrum and a Ce4+ reference spectrum. These specific reference spectra are needed because the sample is synthesized using a CeO2 (Ce4+) precursor melted in a sodium borate glass matrix. Despite the oxidizing air atmosphere, the high melting temperature of 1200 °C induces a thermal reduction process that shifts the redox equilibrium toward the reduced state. Consequently, the final quenched glass contains a mixture of both Ce3+ and Ce4+ oxidation states, necessitating both references for accurate spectral fitting. | Full points if the answer identifies the need for both Ce3+ and Ce4+ reference spectra. |
| q2 | quantification | 40 | Based on the synthesis conditions (melted at 1200 °C in air from a CeO2 precursor), estimate the relative phase fractions of the Ce oxidation states in the final glass. | The estimated relative phase fractions in the final glass are 0.79 (79%) for Ce3+ and 0.21 (21%) for Ce4+, with an uncertainty of 10%. These specific values result from the competing effects of the synthesis conditions on the cerium redox equilibrium. Although the glass is prepared from a Ce4+ precursor (CeO2) and melted in an oxidizing air atmosphere, the high processing temperature of 1200 °C strongly drives thermal reduction within the borate glass melt. This high-temperature thermodynamic shift overcomes the oxidizing environment, resulting in a predominantly reduced Ce3+ composition with only a minor fraction of Ce4+ remaining upon quenching. | Full points if the answer predicts a predominantly Ce3+ composition (~79%) with a minority Ce4+ component (~21%). Partial points for correctly identifying that Ce3+ is the majority species without exact percentages. |
| q3 | reasoning | 40 | Provide the physical reasoning for the expected oxidation states in this sample. Specifically, explain how the 1200 °C melting temperature affects the final Ce3+/Ce4+ ratio despite the use of an air atmosphere and a Ce4+ precursor. | The final oxidation states in this sodium borate glass are determined by the redox equilibrium established during the melt-quenching process. The synthesis begins with a Ce4+ precursor (CeO2) and takes place in an oxidizing air atmosphere, which would typically favor the retention of the Ce4+ state. However, the high melting temperature of 1200 °C acts as the dominant thermodynamic driver, shifting the redox equilibrium strongly toward the reduced state via thermal reduction. As a result of this high-temperature mechanism, the melt undergoes significant reduction before being quenched between steel plates, yielding a final composition that is predominantly Ce3+ (79%) with only a minor remaining fraction of Ce4+ (21%). | Full points if the answer explains that high melting temperatures (1200 °C) drive the thermal reduction of Ce4+ to Ce3+, shifting the redox equilibrium toward the reduced state despite the oxidizing atmosphere. |
Review
#1242
Ce-doped sodium borate glass
Ce L3-edge
▶
LLM Prompt
Sample Information
Material: Ce-doped sodium borate glass
Method: melt-quenching
Precursors: Na2O·2B2O3·0.05CeO2
Temperature C: 1300
Atmosphere: air
Cooling Method: quenched between two steel plates
Sample-Specific Conditions
- Melting temperature: 1300 °C
- Sodium borate glass doped with 0.05 mol CeO2, melted at 1300 °C
Preparation
- Sodium carbonate and diboron trioxide mixed with powdered CeO2 to create Na2O·2B2O3·0.05CeO2 glass. Melted in a platinum crucible using a high-temperature furnace in air atmosphere and quenched between two steel plates.
Measurement
We plan to measure the Ce L3-edge XANES spectrum of this sample.
Questions
Based on all the information above:
1. Based on the synthesis conditions (melted at 1300 °C in air using a CeO2 precursor), predict the expected oxidation states of Cerium in the resulting sodium borate glass and estimate their relative fractions.
2. Explain the physical reasoning for the predicted Ce oxidation state distribution in this glass, specifically addressing the competing effects of the precursor/atmosphere and the melting temperature.
3. What candidate reference spectra would be necessary to perform a Linear Combination Fitting (LCF) analysis on the Ce L3-edge XANES spectrum of this sample?
Ground Truth
Material: Ce-doped sodium borate glass
Measurement: Ce L3-edge XANES
Fit method: LCF
Phase fractions: (±10%)
| Phase | Fraction |
|---|---|
| Ce3+ | 0.87 |
| Ce4+ | 0.13 |
Fit basis (paper's reference spectra):
- Ce3+ reference
- Ce4+ reference
Source evidence: Sample data for S5NBCe glass (1300 °C)
Key reasoning: The glass was synthesized using CeO2 (Ce4+) as a precursor and melted in an air atmosphere. However, the high melting temperature (1300 °C) acts as the key variable that shifts the thermodynamic equilibrium to favor the reduction of Ce4+ to Ce3+ in the glass melt. As a result, the quenched glass is predominantly composed of Ce3+ (87%) with a minor fraction of remaining Ce4+ (13%).
Reasoning source: Sample description and key variable analysis
Scoring Rubric (total: 100 pts)
| Q | Type | Max | Question | Reference Answer | Scoring Criteria |
|---|---|---|---|---|---|
| q1 | prediction | 40 | Based on the synthesis conditions (melted at 1300 °C in air using a CeO2 precursor), predict the expected oxidation states of Cerium in the resulting sodium borate glass and estimate their relative fractions. | The expected oxidation states of Cerium in the sodium borate glass are Ce3+ and Ce4+. The relative fractions are estimated to be 87% Ce3+ and 13% Ce4+, with an uncertainty of 10%. These specific fractions arise because, despite using a Ce4+ precursor (CeO2) and melting in an oxidizing air atmosphere, the high melting temperature of 1300 °C acts as the dominant variable. This high temperature shifts the thermodynamic equilibrium of the glass melt to strongly favor the reduction of Ce4+ to Ce3+. Consequently, the quenched glass predominantly contains Ce3+ with only a minor residual fraction of Ce4+. | Award full points if the response correctly identifies a mixture of Ce3+ and Ce4+, with Ce3+ being the dominant phase (approx. 85-90%) and Ce4+ being the minor phase (approx. 10-15%). Deduct points if Ce4+ is predicted to be the majority phase. |
| q2 | reasoning | 40 | Explain the physical reasoning for the predicted Ce oxidation state distribution in this glass, specifically addressing the competing effects of the precursor/atmosphere and the melting temperature. | The oxidation state distribution of 87% Ce3+ and 13% Ce4+ is the result of competing thermodynamic factors during synthesis. The use of a CeO2 precursor and an air atmosphere initially provides an oxidizing environment that would typically favor the Ce4+ state. However, the high melting temperature of 1300 °C acts as the key variable that overrides these oxidizing conditions. At this elevated temperature, the thermodynamic equilibrium in the sodium borate glass melt shifts significantly to favor the reduction of Ce4+ to Ce3+. Therefore, upon quenching between steel plates, the high-temperature equilibrium is frozen in, resulting in a predominantly Ce3+ glass with a minor fraction of remaining Ce4+. | Award full points for explaining that while the CeO2 precursor and air atmosphere are oxidizing, the high melting temperature (1300 °C) thermodynamically drives the reduction of Ce4+ to Ce3+ in the glass melt, resulting in a predominantly Ce3+ composition. |
| q3 | identification | 20 | What candidate reference spectra would be necessary to perform a Linear Combination Fitting (LCF) analysis on the Ce L3-edge XANES spectrum of this sample? | To perform a Linear Combination Fitting (LCF) analysis on the Ce L3-edge XANES spectrum of this sample, candidate reference spectra for Ce3+ and Ce4+ are necessary. These specific references are required because the sample conditions dictate a mixed oxidation state in the final glass. Although the initial precursor was CeO2 (Ce4+) and the melting occurred in air, the high synthesis temperature of 1300 °C shifts the thermodynamic equilibrium to favor the reduction of Ce4+ to Ce3+. As a result, the quenched sodium borate glass contains a mixture of 87% Ce3+ and 13% Ce4+, necessitating both reference spectra to accurately model the experimental data. | Award full points for stating that both Ce3+ and Ce4+ reference standards are required to fit the spectrum. |
Review
#1243
Ce-doped sodium borate glass
Ce L3-edge
▶
LLM Prompt
Sample Information
Material: Ce-doped sodium borate glass
Method: melt-quenching
Precursors: Na2O·2B2O3·0.01CeO2
Temperature C: 1200
Duration Hours: 1
Atmosphere: air
Cooling Method: quenched between two steel plates
Sample-Specific Conditions
- Melting temperature: 1200 °C
- Sodium borate glass doped with 0.01 mol CeO2, melted at 1200 °C for 1 h
Preparation
- Sodium carbonate and diboron trioxide mixed with powdered CeO2 to create Na2O·2B2O3·0.01CeO2 glass. Melted in a platinum crucible using a high-temperature furnace in air atmosphere and quenched between two steel plates.
Measurement
We plan to measure the Ce L3-edge XANES spectrum of this sample.
Questions
Based on all the information above:
1. Based on the synthesis conditions (melt-quenching at 1200 °C for 1 h in air), predict the expected oxidation states of Ce in the resulting sodium borate glass and estimate their relative phase fractions.
2. To quantify the oxidation states in this sample using Ce L3-edge XANES, what specific reference spectra must be included in the linear combination fitting (LCF) basis?
3. Discuss the effect of the 1200 °C melting temperature on the cerium oxidation state in this glass system. How does this specific condition drive the observed phase distribution despite the synthesis occurring in an air atmosphere?
Ground Truth
Material: Ce-doped sodium borate glass
Measurement: Ce L3-edge XANES
Fit method: Linear Combination Fitting (LCF)
Phase fractions: (±10%)
| Phase | Fraction |
|---|---|
| Ce3+ | 0.93 |
| Ce4+ | 0.07 |
Fit basis (paper's reference spectra):
- Ce3+ reference spectrum
- Ce4+ reference spectrum
Source evidence: Phase fractions data provided in the sample text description
Key reasoning: The melting temperature is the key variable determining the cerium oxidation state in this glass system. Melting the Na2O·2B2O3·0.01CeO2 precursor mixture at a high temperature of 1200 °C for 1 hour, even in an oxidizing air atmosphere, strongly favors the reduction of Ce4+ to Ce3+, resulting in a predominantly Ce3+ (93%) phase distribution in the quenched glass.
Reasoning source: Sample description and key variable analysis
Scoring Rubric (total: 100 pts)
| Q | Type | Max | Question | Reference Answer | Scoring Criteria |
|---|---|---|---|---|---|
| q1 | prediction | 40 | Based on the synthesis conditions (melt-quenching at 1200 °C for 1 h in air), predict the expected oxidation states of Ce in the resulting sodium borate glass and estimate their relative phase fractions. | The expected oxidation states of Ce in the resulting sodium borate glass are Ce3+ and Ce4+, with estimated relative phase fractions of 0.93 (93%) and 0.07 (7%), respectively. These specific values result from the high melting temperature of 1200 °C applied for 1 hour during the melt-quenching process. Even though the synthesis occurs in an oxidizing air atmosphere, this high temperature acts as the key variable that strongly favors the reduction of the initial Ce4+ from the CeO2 precursor to Ce3+. Consequently, the thermal conditions overcome the oxidizing environment, yielding a predominantly Ce3+ phase distribution in the final quenched glass. | Award full points for correctly identifying Ce3+ as the dominant state (~93%) and Ce4+ as the minor state (~7%). Deduct points if the dominant state is incorrect or if the estimated fractions deviate by more than 15%. |
| q2 | identification | 20 | To quantify the oxidation states in this sample using Ce L3-edge XANES, what specific reference spectra must be included in the linear combination fitting (LCF) basis? | To quantify the oxidation states in this sample using Linear Combination Fitting (LCF) of the Ce L3-edge XANES spectrum, the basis must include a Ce3+ reference spectrum and a Ce4+ reference spectrum. These specific references are required because processing the Na2O·2B2O3·0.01CeO2 precursor mixture under the given conditions produces a mixed-valence state. Specifically, melting the glass at a high temperature of 1200 °C for 1 hour strongly drives the reduction of the initial Ce4+ to Ce3+, despite the air atmosphere. Therefore, both Ce3+ and Ce4+ references are necessary to accurately model the resulting predominantly Ce3+ (93%) and minor Ce4+ (7%) phase distribution in the quenched glass. | Award full points for stating that both Ce3+ and Ce4+ reference spectra are required for the fitting basis. |
| q3 | reasoning | 40 | Discuss the effect of the 1200 °C melting temperature on the cerium oxidation state in this glass system. How does this specific condition drive the observed phase distribution despite the synthesis occurring in an air atmosphere? | The 1200 °C melting temperature is the key variable determining the cerium oxidation state in this sodium borate glass system. When the Na2O·2B2O3·0.01CeO2 precursor mixture is melted at this high temperature for 1 hour, the thermal conditions strongly favor the reduction of Ce4+ to Ce3+. This high-temperature reduction mechanism is powerful enough to overcome the oxidizing effects of the air atmosphere used during synthesis. As a result, the thermodynamic drive at 1200 °C dictates the final outcome, producing a quenched glass with a predominantly Ce3+ phase distribution consisting of 93% Ce3+ and only 7% Ce4+. | Award full points for explaining that the high melting temperature (1200 °C) acts as the key variable that thermodynamically drives the reduction of Ce4+ to Ce3+ in the glass melt, overcoming the oxidizing effect of the air atmosphere to produce a highly reduced (93% Ce3+) final state. |
Review
#1244
Ce-doped sodium borate glass
Ce L3-edge
▶
LLM Prompt
Sample Information
Material: Ce-doped sodium borate glass
Method: melt-quenching
Precursors: Na2O·2B2O3·0.01CeO2
Temperature C: 1000
Duration Hours: 1
Atmosphere: air
Cooling Method: quenched between two steel plates
Sample-Specific Conditions
- Melting temperature: 1000 °C
- Sodium borate glass doped with 0.01 mol CeO2, melted at 1000 °C for 1 h
Preparation
- Sodium carbonate and diboron trioxide mixed with powdered CeO2 to create Na2O·2B2O3·0.01CeO2 glass. Melted in a platinum crucible using a high-temperature furnace in air atmosphere and quenched between two steel plates.
Measurement
We plan to measure the Ce L3-edge XANES spectrum of this sample.
Questions
Based on all the information above:
1. Based on the synthesis conditions (melt-quenching at 1000 °C in air using a CeO2 precursor), what are the expected Ce oxidation states in this sodium borate glass, and what are their estimated fractions?
2. Explain the physical reasoning for the final oxidation state distribution in this glass, specifically addressing the apparent contradiction between the precursor/atmosphere used and the final phase fractions.
3. What candidate reference spectra would be required to perform a Linear Combination Fit (LCF) on the Ce L3-edge XANES spectrum of this sample?
Ground Truth
Material: Ce-doped sodium borate glass
Measurement: Ce L3-edge XANES
Fit method: Linear Combination Fitting (LCF)
Phase fractions: (±10%)
| Phase | Fraction |
|---|---|
| Ce3+ | 0.9 |
| Ce4+ | 0.1 |
Fit basis (paper's reference spectra):
- Ce3+ reference
- Ce4+ reference
Source evidence: Sample conditions and phase fractions provided in text
Key reasoning: Despite using CeO2 (a Ce4+ compound) as the precursor and melting the glass in an oxidizing air atmosphere, the high melting temperature of 1000 °C drives the reduction of Ce4+ to Ce3+. Consequently, the resulting melt-quenched glass is predominantly composed of Ce3+ (90%), with only a minor fraction of residual Ce4+ (10%).
Reasoning source: Synthesis conditions and resulting phase fractions
Scoring Rubric (total: 100 pts)
| Q | Type | Max | Question | Reference Answer | Scoring Criteria |
|---|---|---|---|---|---|
| q1 | quantification | 40 | Based on the synthesis conditions (melt-quenching at 1000 °C in air using a CeO2 precursor), what are the expected Ce oxidation states in this sodium borate glass, and what are their estimated fractions? | The expected Ce oxidation states in this sodium borate glass are Ce3+ and Ce4+, with estimated fractions of 90% Ce3+ and 10% Ce4+ (with a 10% uncertainty). These specific values result directly from the high-temperature melt-quenching process used during synthesis. Although the initial precursor was CeO2 (a Ce4+ compound) and the melting occurred in an oxidizing air atmosphere, the high melting temperature of 1000 °C for 1 hour drives the reduction of Ce4+ to Ce3+. Consequently, the final quenched glass is predominantly composed of Ce3+, leaving only a minor 10% fraction of residual Ce4+. | Award full points for identifying both Ce3+ and Ce4+ and correctly estimating their fractions at approximately 90% Ce3+ and 10% Ce4+. Deduct points proportionally for incorrect phases or significantly inaccurate fraction estimates. |
| q2 | reasoning | 40 | Explain the physical reasoning for the final oxidation state distribution in this glass, specifically addressing the apparent contradiction between the precursor/atmosphere used and the final phase fractions. | The synthesis of this sodium borate glass presents an apparent contradiction because it utilizes a Ce4+ precursor (CeO2) and is melted in an oxidizing air atmosphere, which would typically favor the retention of the Ce4+ state. However, the high melting temperature of 1000 °C acts as the primary driving force for the reduction of Ce4+ to Ce3+ during the 1-hour dwell time. As a result of this thermally driven reduction mechanism, the melt-quenching process yields a final oxidation state distribution that is heavily reduced. This explains why the final glass matrix is predominantly Ce3+ (90%), with only a small residual amount of unreduced Ce4+ (10%) remaining. | Award full points for explaining that the high melting temperature (1000 °C) thermodynamically drives the reduction of Ce4+ to Ce3+, overcoming the oxidizing nature of the air atmosphere and the initial Ce4+ state of the CeO2 precursor. |
| q3 | identification | 20 | What candidate reference spectra would be required to perform a Linear Combination Fit (LCF) on the Ce L3-edge XANES spectrum of this sample? | To perform a Linear Combination Fit (LCF) on the Ce L3-edge XANES spectrum of this sample, candidate reference spectra for Ce3+ and Ce4+ are required. These specific references are necessary because the sample is a Ce-doped sodium borate glass synthesized from a CeO2 (Ce4+) precursor, which dictates the initial presence of Ce4+. Despite the oxidizing air atmosphere and the Ce4+ starting material, the high melting temperature of 1000 °C drives the reduction of the cerium ions during the 1-hour melting process. Therefore, the final melt-quenched glass contains a mixture of predominantly Ce3+ (90%) along with residual Ce4+ (10%), necessitating both reference spectra to accurately model the XANES data. | Award full points for stating that both a Ce3+ reference spectrum and a Ce4+ reference spectrum are needed to model the mixed oxidation state of the glass. |
Review
#1245
Ce-doped sodium borate glass
Ce L3-edge
▶
LLM Prompt
Sample Information
Material: Ce-doped sodium borate glass
Method: melt-quenching
Precursors: Na2O·2B2O3·0.05CeO2
Temperature C: 1100
Duration Hours: 1
Atmosphere: nitrogen
Cooling Method: quenched between two steel plates
Sample-Specific Conditions
- Atmosphere: Nitrogen
- Sodium borate glass doped with 0.05 mol CeO2, melted at 1100 °C for 1 h in nitrogen
Preparation
- Sodium carbonate and diboron trioxide mixed with powdered CeO2 to create Na2O·2B2O3·0.05CeO2 glass. Melted in a platinum crucible using a high-temperature furnace in nitrogen atmosphere and quenched between two steel plates.
Measurement
We plan to measure the Ce L3-edge XANES spectrum of this sample.
Questions
Based on all the information above:
1. Based on the synthesis conditions (melt-quenching at 1100 °C in a nitrogen atmosphere using a CeO2 precursor), predict the expected phase fractions of Ce3+ and Ce4+ in the resulting glass.
2. Explain the physical reasoning for the expected oxidation states of Cerium in this sample, specifically considering the precursor used and the melting atmosphere.
3. What candidate reference spectra would be required to perform Linear Combination Fitting (LCF) on the Ce L3-edge XANES spectrum of this specific sample?
Ground Truth
Material: Ce-doped sodium borate glass
Measurement: Ce L3-edge XANES
Fit method: Linear Combination Fitting (inferred from phase fractions)
Phase fractions: (±10%)
| Phase | Fraction |
|---|---|
| Ce3+ | 0.84 |
| Ce4+ | 0.16 |
Fit basis (paper's reference spectra):
- Ce3+ reference
- Ce4+ reference
Source evidence: Sample conditions and phase fractions provided in the text for S5NBCe glass (Nitrogen atmosphere)
Key reasoning: The glass was synthesized using CeO2, which is a Ce4+ precursor. Melting the sample at 1100 °C in a nitrogen atmosphere provides a reducing environment that converts the majority of the cerium to Ce3+ (84%). A minor fraction of cerium remains unconverted as Ce4+ (16%).
Reasoning source: Inferred from the synthesis conditions (nitrogen atmosphere, CeO2 precursor) and the resulting phase fractions
Scoring Rubric (total: 100 pts)
| Q | Type | Max | Question | Reference Answer | Scoring Criteria |
|---|---|---|---|---|---|
| q1 | prediction | 40 | Based on the synthesis conditions (melt-quenching at 1100 °C in a nitrogen atmosphere using a CeO2 precursor), predict the expected phase fractions of Ce3+ and Ce4+ in the resulting glass. | The expected phase fractions in the resulting glass are 84% Ce3+ and 16% Ce4+, with an uncertainty of 10%. These specific values result from the synthesis conditions applied to the CeO2 precursor, which initially contains cerium entirely in the 4+ oxidation state. Melting the sample at 1100 °C for 1 hour in a nitrogen atmosphere creates a strongly reducing environment. This reducing atmosphere drives the conversion of the majority of the cerium from Ce4+ to Ce3+ (84%), while a minor fraction (16%) remains unconverted in the final quenched glass. | Award full points if the predicted fractions are approximately 84% Ce3+ and 16% Ce4+. Award partial points if the model correctly predicts that Ce3+ is the dominant phase with a minor Ce4+ component. |
| q2 | reasoning | 40 | Explain the physical reasoning for the expected oxidation states of Cerium in this sample, specifically considering the precursor used and the melting atmosphere. | The cerium in this sodium borate glass originates from a powdered CeO2 precursor, meaning it begins entirely in the Ce4+ oxidation state. During synthesis, the mixture is melted at a high temperature of 1100 °C for 1 hour under a nitrogen atmosphere. The nitrogen atmosphere provides a reducing environment during the melt-quenching process. Consequently, this reducing condition drives a chemical reduction mechanism that converts the majority of the initial Ce4+ ions into Ce3+ (84%). Because the reduction is not entirely complete, a residual 16% of the cerium remains unconverted as Ce4+ in the final glass matrix. | Award full points if the explanation correctly identifies that the CeO2 precursor starts as Ce4+, and the nitrogen atmosphere drives the reduction of the majority of Cerium to Ce3+, leaving a small residual amount of Ce4+. |
| q3 | identification | 20 | What candidate reference spectra would be required to perform Linear Combination Fitting (LCF) on the Ce L3-edge XANES spectrum of this specific sample? | To perform Linear Combination Fitting (LCF) on the Ce L3-edge XANES spectrum of this sample, candidate reference spectra for Ce3+ and Ce4+ are required. These specific reference phases are necessary because the sample is synthesized using a CeO2 precursor, which initially introduces Ce4+ into the sodium borate glass melt. Melting the mixture at 1100 °C in a nitrogen atmosphere creates a reducing environment that converts most of the cerium to Ce3+. However, because the conversion is incomplete, both Ce3+ (84%) and unconverted Ce4+ (16%) coexist in the final quenched material, necessitating both references to accurately fit the measured spectrum. | Award full points if the model identifies that both Ce3+ and Ce4+ reference spectra are needed to fit the data. |
Review
#1246
Ce-doped sodium borate glass
Ce L3-edge
▶
LLM Prompt
Sample Information
Material: Ce-doped sodium borate glass
Method: melt-quenching
Precursors: Na2O·2B2O3·0.05CeO2
Temperature C: 1100
Duration Hours: 1
Atmosphere: air
Cooling Method: quenched between two steel plates
Sample-Specific Conditions
- Baseline S5NBCe: Standard
- Sodium borate glass doped with 0.05 mol CeO2, melted at 1100 °C for 1 h
Preparation
- Sodium tetraborate decahydrate mixed with powdered CeO2 to create Na2O·2B2O3·0.05CeO2 glass. Melted in a platinum crucible using a high-temperature furnace in air atmosphere and quenched between two steel plates.
Measurement
We plan to measure the Ce L3-edge XANES spectrum of this sample.
Questions
Based on all the information above:
1. Based on the synthesis conditions (melt-quenching a Na2O·2B2O3·0.05CeO2 precursor at 1100 °C in air), predict the expected oxidation states of Ce in the resulting glass and estimate their relative phase fractions.
2. Explain the physical reasoning for the observed Ce oxidation states in this sample, specifically addressing the apparent contradiction between the synthesis atmosphere and the final phase composition.
3. What candidate reference spectra are required to accurately model the Ce L3-edge XANES spectrum of this glass sample using Linear Combination Fitting (LCF)?
Ground Truth
Material: Ce-doped sodium borate glass
Measurement: Ce L3-edge XANES
Fit method: LCF
Phase fractions: (±10%)
| Phase | Fraction |
|---|---|
| Ce3+ | 0.64 |
| Ce4+ | 0.36 |
Fit basis (paper's reference spectra):
- Ce3+ reference
- Ce4+ reference
Source evidence: Sample metadata and phase fractions provided in the dataset
Key reasoning: The sample was prepared by melt-quenching at a high temperature (1100 °C) in an air atmosphere. Despite the oxidizing conditions of the air atmosphere, the high-temperature melting process in the sodium borate glass matrix favors the reduction of cerium, resulting in a predominantly reduced state (64% Ce3+) with a minority of oxidized cerium (36% Ce4+).
Reasoning source: Sample preparation conditions and resulting phase fraction data
Scoring Rubric (total: 100 pts)
| Q | Type | Max | Question | Reference Answer | Scoring Criteria |
|---|---|---|---|---|---|
| q1 | prediction | 40 | Based on the synthesis conditions (melt-quenching a Na2O·2B2O3·0.05CeO2 precursor at 1100 °C in air), predict the expected oxidation states of Ce in the resulting glass and estimate their relative phase fractions. | The expected oxidation states of Ce in the resulting sodium borate glass are Ce3+ and Ce4+. The estimated relative phase fractions are 64% Ce3+ and 36% Ce4+, with an uncertainty of 10%. These specific fractions arise because the sample was prepared by melt-quenching at a high temperature of 1100 °C. Despite the oxidizing air atmosphere, the high-temperature melting process within the sodium borate glass matrix favors the reduction of cerium. Consequently, this thermal reduction mechanism leads to a predominantly reduced state (Ce3+) alongside a minority oxidized state (Ce4+). | Award full points if the response correctly identifies both Ce3+ and Ce4+ and estimates the fractions near 64% Ce3+ and 36% Ce4+ (allow ±10% margin). Award partial points if the correct oxidation states are identified but the fractions are significantly off. |
| q2 | reasoning | 40 | Explain the physical reasoning for the observed Ce oxidation states in this sample, specifically addressing the apparent contradiction between the synthesis atmosphere and the final phase composition. | The final phase composition consists of 64% Ce3+ and 36% Ce4+, which appears contradictory given the oxidizing air atmosphere used during synthesis. This outcome occurs because the sample was synthesized via melt-quenching at a high temperature of 1100 °C for 1 hour. In this specific sodium borate glass matrix, the high-temperature melting process strongly favors the reduction of cerium. Therefore, the thermal reduction mechanism overrides the oxidizing effect of the air atmosphere, resulting in a predominantly reduced Ce3+ state rather than the fully oxidized Ce4+ state expected from the precursor and atmosphere. | Award full points if the response explains that despite the oxidizing air atmosphere, the high-temperature (1100 °C) melt-quenching process in the borate glass matrix drives the reduction of a majority of the Ce4+ precursor to Ce3+. |
| q3 | identification | 20 | What candidate reference spectra are required to accurately model the Ce L3-edge XANES spectrum of this glass sample using Linear Combination Fitting (LCF)? | To accurately model the Ce L3-edge XANES spectrum of this glass sample using Linear Combination Fitting (LCF), candidate reference spectra for Ce3+ and Ce4+ are required. These specific references are necessary because the sample contains a mixture of 64% Ce3+ and 36% Ce4+. This mixed oxidation state arises from the high-temperature (1100 °C) melt-quenching process in the sodium borate glass matrix. Even though the synthesis occurred in an oxidizing air atmosphere, the high temperature favors the reduction of the CeO2 precursor, necessitating both Ce3+ and Ce4+ references to capture the predominantly reduced and minority oxidized states. | Award full points if the response correctly identifies that both Ce3+ and Ce4+ reference spectra are needed. |
Review
#1247
Nanoceria
Ce L3-edge
▶
LLM Prompt
Sample Information
Material: Nanoceria
Method: dissolution and extraction
Precursors: Na2O·2B2O3·0.05CeO2
Temperature C: 37
Duration Hours: 2
Post Treatment: Centrifuged at 1500 rcf, dried overnight at 70 °C
Sample-Specific Conditions
- Extraction centrifugation speed: 1500 rcf
- Nanoceria extracted from S5NBCe glass after 2 h dissolution and 1500 rcf centrifugation
Preparation
- 3.0 g of powdered glass samples were treated with 50 mL of DI water. Vigorously mixed and incubated in a shaker at 37 °C for 2 h. Nanoceria extracted by centrifugation at 1500 rcf for 5 min. Supernatant removed and precipitate dried overnight at 70 °C.
Measurement
We plan to measure the Ce L3-edge XANES spectrum of this sample.
Questions
Based on all the information above:
1. What candidate reference spectra or basis functions are required to properly model the Ce L3-edge XANES spectrum of this extracted nanoceria?
2. Estimate the relative phase fractions of the cerium oxidation states in the nanoceria extracted from S5NBCe glass after 2 h dissolution and 1500 rcf centrifugation.
3. Based on the provided synthesis and extraction conditions, which cerium oxidation state is expected to dominate the composition of the extracted nanoceria?
Ground Truth
Material: Nanoceria
Measurement: Ce L3-edge XANES
Fit method: not reported
Phase fractions: (±10%)
| Phase | Fraction |
|---|---|
| Ce3+ | 0.61 |
| Ce4+ | 0.39 |
Fit basis (paper's reference spectra):
- Ce3+
- Ce4+
Source evidence: text
Key reasoning: The extraction of nanoceria from S5NBCe glass via 2 h dissolution and 1500 rcf centrifugation produces a mixed-valence cerium oxide material. Under these specific extraction conditions, the resulting nanoceria is predominantly Ce3+ (61%) with a smaller fraction of Ce4+ (39%).
Reasoning source: text
Scoring Rubric (total: 100 pts)
| Q | Type | Max | Question | Reference Answer | Scoring Criteria |
|---|---|---|---|---|---|
| q1 | identification | 20 | What candidate reference spectra or basis functions are required to properly model the Ce L3-edge XANES spectrum of this extracted nanoceria? | To properly model the Ce L3-edge XANES spectrum of this extracted nanoceria, reference spectra for Ce3+ and Ce4+ are required as basis functions. These specific phases are expected because the extraction of nanoceria from the Na2O·2B2O3·0.05CeO2 (S5NBCe) glass precursor produces a mixed-valence cerium oxide material. The synthesis conditions, specifically the 2-hour dissolution in DI water at 37 °C followed by centrifugation at 1500 rcf and drying at 70 °C, stabilize both oxidation states in the resulting precipitate. Therefore, both Ce3+ and Ce4+ components must be included to accurately capture the electronic structure of the sample. | Full points for identifying that both Ce3+ and Ce4+ reference spectra are needed. |
| q2 | quantification | 50 | Estimate the relative phase fractions of the cerium oxidation states in the nanoceria extracted from S5NBCe glass after 2 h dissolution and 1500 rcf centrifugation. | The relative phase fractions of the cerium oxidation states in the extracted nanoceria are estimated to be 61% Ce3+ and 39% Ce4+, with an uncertainty of 10%. These specific values result directly from the extraction conditions applied to the S5NBCe glass precursor. The 2-hour dissolution in DI water at 37 °C, combined with the specific centrifugation speed of 1500 rcf, isolates a mixed-valence cerium oxide material. Under these exact processing parameters, the resulting nanoceria stabilizes predominantly in the Ce3+ state (61%) with a smaller, yet significant, fraction of Ce4+ (39%). | Full points for estimating approximately 61% Ce3+ and 39% Ce4+. Partial credit for correctly identifying that Ce3+ is the majority phase (>50%) and Ce4+ is the minority phase. |
| q3 | reasoning | 30 | Based on the provided synthesis and extraction conditions, which cerium oxidation state is expected to dominate the composition of the extracted nanoceria? | Based on the synthesis and extraction conditions, the Ce3+ oxidation state is expected to dominate the composition of the extracted nanoceria at 61%, alongside a 39% fraction of Ce4+. This dominant Ce3+ fraction arises from the specific method of extracting the nanoceria from the Na2O·2B2O3·0.05CeO2 glass precursor. The 2-hour aqueous dissolution at 37 °C followed by separation via centrifugation at 1500 rcf specifically yields a mixed-valence cerium oxide material. These targeted extraction and separation conditions inherently favor the stabilization and isolation of a predominantly Ce3+ material. | Full points for explicitly stating that Ce3+ is the dominant oxidation state in the mixed-valence nanoceria under these specific extraction conditions. |
Review
#1248
Nanoceria
Ce L3-edge
▶
LLM Prompt
Sample Information
Material: Nanoceria
Method: dissolution and extraction
Precursors: Na2O·2B2O3·0.05CeO2
Temperature C: 37
Duration Hours: 2
Post Treatment: Centrifuged at 14,000 rcf, dried overnight at 70 °C
Sample-Specific Conditions
- Extraction centrifugation speed: 14,000 rcf
- Nanoceria extracted from S5NBCe glass after 2 h dissolution and 14,000 rcf centrifugation
Preparation
- 3.0 g of powdered glass samples were treated with 50 mL of DI water. Vigorously mixed and incubated in a shaker at 37 °C for 2 h. Nanoceria extracted by centrifugation at 14,000 rcf for 30 min. Supernatant removed and precipitate dried overnight at 70 °C.
Measurement
We plan to measure the Ce L3-edge XANES spectrum of this sample.
Questions
Based on all the information above:
1. What candidate reference spectra or basis functions are required to model the Ce L3-edge XANES spectrum of the nanoceria extracted from the S5NBCe glass?
2. Based on the specific extraction conditions (2 h dissolution at 37 °C followed by centrifugation at 14,000 rcf), estimate the relative phase fractions of the cerium oxidation states in the resulting nanoceria.
3. What is the dominant oxidation state in the nanoceria extracted at 14,000 rcf, and what does this indicate about the composition of the nanoparticles isolated under these conditions?
Ground Truth
Material: Nanoceria extracted from S5NBCe glass
Measurement: Ce L3-edge XANES
Fit method: Not explicitly stated in provided text (LCF implied for phase fractions)
Phase fractions: (±10%)
| Phase | Fraction |
|---|---|
| Ce3+ | 0.63 |
| Ce4+ | 0.37 |
Fit basis (paper's reference spectra):
- Ce3+ reference
- Ce4+ reference
Source evidence: Sample description and phase fractions data provided in the text
Key reasoning: Nanoceria extracted from S5NBCe glass after 2 h dissolution and 14,000 rcf centrifugation results in a mixed oxidation state. The specific extraction conditions isolate nanoparticles with a predominantly Ce3+ character (63%) alongside a significant Ce4+ component (37%).
Reasoning source: Sample description text
Scoring Rubric (total: 100 pts)
| Q | Type | Max | Question | Reference Answer | Scoring Criteria |
|---|---|---|---|---|---|
| q1 | identification | 30 | What candidate reference spectra or basis functions are required to model the Ce L3-edge XANES spectrum of the nanoceria extracted from the S5NBCe glass? | To model the Ce L3-edge XANES spectrum of the extracted nanoceria, a Ce3+ reference and a Ce4+ reference are required as basis functions. These specific references are necessary because the nanoceria extracted from the Na2O·2B2O3·0.05CeO2 precursor glass exhibits a mixed oxidation state. The specific extraction conditions, namely the 2-hour dissolution in DI water at 37 °C followed by centrifugation at 14,000 rcf, isolate nanoparticles that contain both Ce3+ and Ce4+ components. Therefore, both oxidation state references are needed to accurately capture the predominantly Ce3+ character alongside the significant Ce4+ fraction present in the dried precipitate. | Full points for identifying that both Ce3+ and Ce4+ reference spectra are needed to model the mixed oxidation state of the nanoceria. |
| q2 | quantification | 40 | Based on the specific extraction conditions (2 h dissolution at 37 °C followed by centrifugation at 14,000 rcf), estimate the relative phase fractions of the cerium oxidation states in the resulting nanoceria. | The relative phase fractions for the extracted nanoceria are estimated to be 0.63 (63%) for Ce3+ and 0.37 (37%) for Ce4+, with an uncertainty of 10%. These specific values result from the dissolution of the Na2O·2B2O3·0.05CeO2 glass in DI water at 37 °C for 2 hours, which releases the nanoparticles from the glass matrix. The subsequent centrifugation at exactly 14,000 rcf selectively isolates a population of nanoceria that inherently possesses this predominantly Ce3+ character alongside a significant Ce4+ component. The combination of this specific incubation time, temperature, and centrifugation speed dictates the exact mixed oxidation state ratio of the recovered precipitate. | Full points for estimating approximately 63% Ce3+ and 37% Ce4+. Partial credit for identifying that Ce3+ is the dominant phase but with inaccurate percentages. |
| q3 | reasoning | 30 | What is the dominant oxidation state in the nanoceria extracted at 14,000 rcf, and what does this indicate about the composition of the nanoparticles isolated under these conditions? | The dominant oxidation state in the nanoceria extracted at 14,000 rcf is Ce3+, which constitutes 63% of the sample, while Ce4+ makes up the remaining 37%. This indicates that the nanoparticles isolated under these conditions have a highly mixed oxidation state composition with a predominantly Ce3+ character. This specific composition arises directly from the extraction protocol, where the Na2O·2B2O3·0.05CeO2 glass is dissolved in water at 37 °C for 2 hours. The targeted centrifugation speed of 14,000 rcf selectively precipitates a fraction of nanoceria that maintains this exact 63% Ce3+ to 37% Ce4+ ratio after being dried overnight at 70 °C. | Full points for stating that Ce3+ is the dominant oxidation state and explaining that the 14,000 rcf centrifugation isolates a mixed-valence nanoceria fraction that is predominantly Ce3+ (63%) with a 37% Ce4+ component. |
Review
#1249
Nanoceria
Ce L3-edge
▶
LLM Prompt
Sample Information
Material: Nanoceria
Method: dissolution and extraction
Precursors: Na2O·2B2O3·0.05CeO2
Temperature C: 37
Post Treatment: Settled under gravity (0 rcf), dried overnight at 70 °C
Sample-Specific Conditions
- Extraction centrifugation speed: 0 rcf (average)
- Nanoceria extracted from S5NBCe glass with no centrifugation (average over incubation times)
Preparation
- 3.0 g of powdered glass samples were treated with 50 mL of DI water. Vigorously mixed and incubated in a shaker at 37 °C. Nanoceria extracted by allowing to settle under gravity (0 rcf). Supernatant removed and precipitate dried overnight at 70 °C.
Measurement
We plan to measure the Ce L3-edge XANES spectrum of this sample.
Questions
Based on all the information above:
1. What candidate reference spectra or basis functions are needed to model the Ce L3-edge XANES spectrum of this extracted nanoceria sample?
2. Based on the extraction method (0 rcf gravity settling from S5NBCe glass), estimate the relative phase fractions of the cerium oxidation states in the resulting nanoceria.
3. Explain the expected oxidation state composition of the nanoceria resulting from the dissolution of the S5NBCe glass matrix and extraction without centrifugation (0 rcf).
Ground Truth
Material: Nanoceria
Measurement: Ce L3-edge XANES
Fit method: LCF
Phase fractions: (±10%)
| Phase | Fraction |
|---|---|
| Ce3+ | 0.66 |
| Ce4+ | 0.34 |
Fit basis (paper's reference spectra):
- Ce3+
- Ce4+
Source evidence: Sample conditions and phase fractions provided in text
Key reasoning: Nanoceria extracted from the S5NBCe glass matrix via dissolution and gravity settling (0 rcf) results in a mixed oxidation state. The average composition over incubation times yields a predominantly Ce3+ state (66%) with 34% Ce4+, reflecting the chemical state of the ceria nanoparticles after the borate glass matrix is dissolved.
Reasoning source: Sample description text
Scoring Rubric (total: 100 pts)
| Q | Type | Max | Question | Reference Answer | Scoring Criteria |
|---|---|---|---|---|---|
| q1 | identification | 20 | What candidate reference spectra or basis functions are needed to model the Ce L3-edge XANES spectrum of this extracted nanoceria sample? | To model the Ce L3-edge XANES spectrum of this sample using Linear Combination Fitting (LCF), reference spectra for Ce3+ and Ce4+ are required. These specific basis functions are needed because the nanoceria is extracted from the Na2O·2B2O3·0.05CeO2 (S5NBCe) glass matrix via dissolution in DI water at 37 °C and gravity settling (0 rcf). This specific extraction process, which dissolves the borate glass matrix and isolates the ceria nanoparticles, results in a mixed oxidation state. Therefore, both Ce3+ and Ce4+ references are necessary to accurately capture the chemical state of the resulting precipitate after it is dried overnight at 70 °C. | Full points for identifying both Ce3+ and Ce4+ reference spectra as the necessary basis for fitting. |
| q2 | quantification | 40 | Based on the extraction method (0 rcf gravity settling from S5NBCe glass), estimate the relative phase fractions of the cerium oxidation states in the resulting nanoceria. | The estimated relative phase fractions for the extracted nanoceria are 0.66 (66%) for Ce3+ and 0.34 (34%) for Ce4+, with an uncertainty of 10%. These specific values arise because the nanoceria is extracted from the S5NBCe glass matrix via dissolution in DI water at 37 °C and allowed to settle under gravity (0 rcf). Averaging over the incubation times, this gentle extraction method without centrifugation leaves the collected ceria nanoparticles in a predominantly Ce3+ state. The resulting 66% Ce3+ and 34% Ce4+ composition directly reflects the stabilized chemical state of the nanoparticles after the borate glass matrix is dissolved and the precipitate is dried at 70 °C. | Full points for estimating Ce3+ at approximately 66% and Ce4+ at approximately 34%. Partial credit if the correct dominant phase (Ce3+) is identified without exact percentages. |
| q3 | reasoning | 40 | Explain the expected oxidation state composition of the nanoceria resulting from the dissolution of the S5NBCe glass matrix and extraction without centrifugation (0 rcf). | The expected oxidation state composition of the extracted nanoceria is a mixture of 66% Ce3+ and 34% Ce4+. This composition occurs because the powdered Na2O·2B2O3·0.05CeO2 glass is treated with DI water at 37 °C, which dissolves the borate glass matrix and frees the ceria nanoparticles. By allowing the particles to settle under gravity (0 rcf) rather than using high-speed centrifugation, and averaging over the incubation times, a specific population of the nanoparticles is collected. After removing the supernatant and drying the precipitate at 70 °C, the resulting nanoceria retains a mixed oxidation state that is predominantly Ce3+, reflecting its chemical state upon release from the glass matrix. | Full points for explaining that the extraction process from the borate glass matrix via gravity settling yields a mixed oxidation state that is predominantly Ce3+ (majority) with a significant Ce4+ component. |
Review
Characterization of iron speciation in urban and rural single particles using XANES spectroscopy and micro X-ray fluorescence measurements: investigating the relationship between speciation and fractional iron solubility
APS
Environmental
M. Oakes et al.
DOI: 10.5194/acp-12-745-2012
5 scenarios
▶
#1250
aerosol
Fe K
▶
LLM Prompt
Sample Information
Material: aerosol
Sample Origin: Fort Yargo, Winder, GA (rural)
Sample-Specific Conditions
- Site and Season: Rural, Summer
- PM2.5 atmospheric aerosol particles
Measurement
We plan to measure the Fe K XANES spectrum of this sample.
Questions
Based on all the information above:
1. Estimate the phase fractions of Fe(II) and Fe(III) for PM2.5 atmospheric aerosol particles collected at the rural Fort Yargo site during the summer.
2. Based on the environmental conditions (rural site, summer), what specific mineralogical class of iron-containing particles was exclusively observed at this site, and how does this relate to the observed oxidation states?
3. If one were to calibrate the oxidation state of these aerosol particles using XANES pre-edge centroid positions, what specific Fe(II) and Fe(III) reference minerals would be appropriate to establish the 0% and 100% Fe(III) baselines?
Ground Truth
Material: PM2.5 atmospheric aerosol particles
Measurement: Fe K-edge XANES, fluorescence mode, 2-ID-D beamline at Advanced Photon Source
Fit method: Pre-edge centroid position interpolation
Phase fractions: (±15%)
| Phase | Fraction |
|---|---|
| Fe(II) | 0.22 |
| Fe(III) | 0.78 |
Fit basis (paper's reference spectra):
- augite
- pyrite
- iron (II) sulfate
- iron (II) oxalate
- goethite
- hematite
- iron (III) oxalate
- iron (III) sulfate
Source evidence: Figure 6, page 753
Key reasoning: Iron speciation was determined by calculating the pre-edge centroid position of single particles and interpolating between the mean centroid positions of Fe(II) and Fe(III) mineral standards. For the Fort Yargo summer sample, particles were exclusively associated with processed Fe-aluminosilicates. The pre-edge centroid analysis indicated an average Fe(II) content of approximately 22%, with the remainder being Fe(III).
Reasoning source: Section 3.2 (page 749-750) and Section 3.4 (page 752)
Scoring Rubric (total: 100 pts)
| Q | Type | Max | Question | Reference Answer | Scoring Criteria |
|---|---|---|---|---|---|
| q1 | quantification | 30 | Estimate the phase fractions of Fe(II) and Fe(III) for PM2.5 atmospheric aerosol particles collected at the rural Fort Yargo site during the summer. | The estimated phase fractions for the PM2.5 atmospheric aerosol particles are 22% Fe(II) and 78% Fe(III), with an uncertainty of 15%. These specific values result from the environmental conditions at the rural Fort Yargo site during the summer, where the aerosol particles are exclusively associated with processed Fe-aluminosilicates. The environmental processing of these particles leads to a predominantly oxidized state, which was quantified by calculating the pre-edge centroid positions of single particles and interpolating between Fe(II) and Fe(III) mineral standards. | Full points for estimating approximately 22% Fe(II) and 78% Fe(III). |
| q2 | reasoning | 40 | Based on the environmental conditions (rural site, summer), what specific mineralogical class of iron-containing particles was exclusively observed at this site, and how does this relate to the observed oxidation states? | Based on the rural summer conditions at the Fort Yargo site, the PM2.5 atmospheric aerosol particles were exclusively associated with processed Fe-aluminosilicates. This specific mineralogical class arises because the environmental conditions promote the processing of the aerosols, which directly impacts their oxidation state. Consequently, the processed Fe-aluminosilicates exhibit a predominantly oxidized state, consisting of 78% Fe(III) and 22% Fe(II), as determined by pre-edge centroid position interpolation. | Must identify that the particles were exclusively associated with processed Fe-aluminosilicates and that they exist in a mixed Fe(II)/Fe(III) oxidation state. |
| q3 | identification | 30 | If one were to calibrate the oxidation state of these aerosol particles using XANES pre-edge centroid positions, what specific Fe(II) and Fe(III) reference minerals would be appropriate to establish the 0% and 100% Fe(III) baselines? | To calibrate the oxidation state of these aerosol particles, the appropriate reference minerals include augite, pyrite, iron (II) sulfate, and iron (II) oxalate for the Fe(II) baseline, alongside goethite, hematite, iron (III) oxalate, and iron (III) sulfate for the Fe(III) baseline. These specific reference phases are required because the PM2.5 aerosols from this rural summer site are exclusively processed Fe-aluminosilicates that contain a mixture of both oxidation states. By interpolating between the mean pre-edge centroid positions of these Fe(II) and Fe(III) standards, researchers can accurately quantify the 22% Fe(II) and 78% Fe(III) fractions that result from the environmental processing of the particles. | Must list representative Fe(II) minerals (e.g., augite, pyrite, iron(II) sulfate, iron(II) oxalate) and Fe(III) minerals (e.g., goethite, hematite, iron(III) sulfate, iron(III) oxalate) used as basis standards. |
Review
#1251
aerosol
Fe K
▶
LLM Prompt
Sample Information
Material: aerosol
Sample Origin: Fort Yargo, Winder, GA (rural)
Sample-Specific Conditions
- Site and Season: Rural, Winter
- PM2.5 atmospheric aerosol particles
Measurement
We plan to measure the Fe K XANES spectrum of this sample.
Questions
Based on all the information above:
1. Based on the environmental conditions (rural site, winter season), estimate the expected oxidation states of iron and their approximate fractions in the PM2.5 aerosol particles.
2. What candidate reference materials (Fe(II) and Fe(III) standards) should be included in the basis set to properly model and calibrate the pre-edge centroid positions of these atmospheric aerosol samples?
3. Explain the mineralogical reasons for the observed high Fe(II) fraction at this rural winter site. What specific mineral phases or structural motifs are associated with this reduced iron content?
Ground Truth
Material: PM2.5 atmospheric aerosol particles
Measurement: Fe K-edge XANES, fluorescence mode, 2-ID-D beamline at Advanced Photon Source
Fit method: Pre-edge centroid position interpolation
Phase fractions: (±15%)
| Phase | Fraction |
|---|---|
| Fe(II) | 0.53 |
| Fe(III) | 0.47 |
Fit basis (paper's reference spectra):
- augite
- pyrite
- iron (II) sulfate
- iron (II) oxalate
- goethite
- hematite
- iron (III) oxalate
- iron (III) sulfate
Source evidence: Figure 6 and Section 3.2 (page 6)
Key reasoning: The rural site (Fort Yargo) during the winter exhibited a much higher Fe(II) content than other filters, with a median Fe(II) content of 49% (as shown in Figure 6). Particles at this site during winter contained a mixture of Al-substituted Fe-oxides and processed Fe-aluminosilicates. The presence of Fe(II) in particles that otherwise appear to be iron oxides suggests the presence of surface-reduced species, while some of the more reduced particles strongly resembled silicates like biotite.
Reasoning source: Section 3.2 (Iron oxidation state and mineralogy) and Section 3.4 (Mineralogy of iron-containing particles at different sites)
Scoring Rubric (total: 100 pts)
| Q | Type | Max | Question | Reference Answer | Scoring Criteria |
|---|---|---|---|---|---|
| q1 | prediction | 30 | Based on the environmental conditions (rural site, winter season), estimate the expected oxidation states of iron and their approximate fractions in the PM2.5 aerosol particles. | The expected oxidation states for these PM2.5 aerosol particles are Fe(II) and Fe(III), with approximate fractions of 0.53 (53%) and 0.47 (47%), respectively, and an uncertainty of 15%. These specific fractions arise because the rural Fort Yargo site during the winter season exhibits an unusually high Fe(II) content compared to other environments. This elevated Fe(II) fraction is driven by the environmental processing of the aerosols, which produces a mixture of processed Fe-aluminosilicates resembling biotite and Al-substituted Fe-oxides containing surface-reduced species. | Full points for identifying a roughly equal mixture of Fe(II) and Fe(III) (e.g., ~53% Fe(II) and ~47% Fe(III)). Partial credit for identifying that both oxidation states are present but with inaccurate fractions. |
| q2 | identification | 30 | What candidate reference materials (Fe(II) and Fe(III) standards) should be included in the basis set to properly model and calibrate the pre-edge centroid positions of these atmospheric aerosol samples? | The basis set should include augite, pyrite, iron (II) sulfate, iron (II) oxalate, goethite, hematite, iron (III) oxalate, and iron (III) sulfate. These specific reference materials are required because the PM2.5 aerosol particles from this rural winter site contain a complex mixture of Al-substituted Fe-oxides, processed Fe-aluminosilicates, and surface-reduced species. This diverse set of standards covers the necessary range of Fe(II) and Fe(III) oxidation states and coordination environments needed to accurately interpolate the pre-edge centroid positions for the varied mineralogy produced under these atmospheric conditions. | Full points for listing a representative set of the paper's basis minerals, including Fe(II) standards (augite, pyrite, iron(II) sulfate, iron(II) oxalate) and Fe(III) standards (goethite, hematite, iron(III) oxalate, iron(III) sulfate). |
| q3 | reasoning | 40 | Explain the mineralogical reasons for the observed high Fe(II) fraction at this rural winter site. What specific mineral phases or structural motifs are associated with this reduced iron content? | The high Fe(II) fraction (0.53) observed at this rural winter site is mineralogically driven by the presence of processed Fe-aluminosilicates and Al-substituted Fe-oxides. Specifically, the reduced iron content is associated with highly reduced particles that strongly resemble silicates such as biotite. Furthermore, the presence of Fe(II) in particles that otherwise appear to be standard iron oxides suggests the formation of surface-reduced species, which arise from the specific atmospheric processing conditions of PM2.5 aerosols at the Fort Yargo site during winter. | Full points for explaining that the particles contain a mixture of Al-substituted Fe-oxides and processed Fe-aluminosilicates, and that the high Fe(II) content is likely due to surface-reduced species on iron oxides or the presence of reduced silicates like biotite. |
Review
#1252
aerosol
Fe K
▶
LLM Prompt
Sample Information
Material: aerosol
Sample Origin: Fire Station 8, Atlanta, GA (urban)
Sample-Specific Conditions
- Site and Season: Urban, Summer
- PM2.5 atmospheric aerosol particles
Measurement
We plan to measure the Fe K XANES spectrum of this sample.
Questions
Based on all the information above:
1. Estimate the expected phase fractions of Fe(II) and Fe(III) for an urban summer PM2.5 aerosol sample.
2. What candidate reference spectra (Fe(II) and Fe(III) minerals) would be appropriate to include in a basis set or calibration curve to determine the oxidation state of these environmental aerosol particles?
Ground Truth
Material: PM2.5 atmospheric aerosol particles
Measurement: Fe K-edge XANES, fluorescence mode, 2-ID-D beamline
Fit method: Pre-edge centroid position interpolation
Phase fractions: (±16%)
| Phase | Fraction |
|---|---|
| Fe(II) | 0.25 |
| Fe(III) | 0.75 |
Fit basis (paper's reference spectra):
- augite
- pyrite
- iron (II) sulfate
- iron (II) oxalate
- goethite
- hematite
- iron (III) oxalate
- iron (III) sulfate
Source evidence: Figure 2, Figure 6, and Table 2
Key reasoning: Iron in the single particles was present as a mixture of Fe(II) and Fe(III). The Fe(II) fraction in single particles from both urban and rural sites was generally between 5 and 35%, with the majority consisting of roughly 25% Fe(II). The XANES spectra closely follow the spectra of iron oxides (e.g., goethite and hematite), suggesting the majority of Fe is iron oxides. The presence of Fe(II) in these iron oxide particles may suggest the presence of surface reduced species.
Reasoning source: Section 3.2 (Iron oxidation state and mineralogy), page 750
Scoring Rubric (total: 100 pts)
| Q | Type | Max | Question | Reference Answer | Scoring Criteria |
|---|---|---|---|---|---|
| q1 | quantification | 50 | Estimate the expected phase fractions of Fe(II) and Fe(III) for an urban summer PM2.5 aerosol sample. | The expected phase fractions for this urban summer PM2.5 aerosol sample are 0.25 (25%) for Fe(II) and 0.75 (75%) for Fe(III), with an uncertainty of 16%. In atmospheric aerosol particles from urban sites, iron is typically present as a mixture of these two oxidation states, with the Fe(II) fraction generally ranging between 5% and 35%. This specific 75% Fe(III) majority arises because the bulk of the iron in these particles exists as iron oxides, as evidenced by XANES spectra that closely follow goethite and hematite. The 25% Fe(II) fraction in these iron oxide particles likely results from the presence of surface reduced species on the environmental aerosols. | Full points for estimating approximately 25% Fe(II) and 75% Fe(III) (accepting ranges like 5-35% for Fe(II) as discussed in the text). |
| q2 | identification | 50 | What candidate reference spectra (Fe(II) and Fe(III) minerals) would be appropriate to include in a basis set or calibration curve to determine the oxidation state of these environmental aerosol particles? | An appropriate basis set for these PM2.5 atmospheric aerosol particles should include Fe(II) references such as augite, pyrite, iron (II) sulfate, and iron (II) oxalate, alongside Fe(III) references including goethite, hematite, iron (III) oxalate, and iron (III) sulfate. These specific reference phases are necessary because the urban aerosol sample consists of a mixture of Fe(II) and Fe(III) species, with the majority of the iron existing as iron oxides. Goethite and hematite are expected because the sample's XANES spectra closely follow these Fe(III) oxides. Meanwhile, the Fe(II) minerals, sulfates, and oxalates are required to account for the surface reduced species present on the particles, enabling accurate oxidation state determination via pre-edge centroid position interpolation. | Full points for listing a representative mix of Fe(II) and Fe(III) standards relevant to environmental aerosols, such as augite, pyrite, iron(II) sulfate/oxalate, goethite, hematite, and iron(III) sulfate/oxalate. |
Review
#1253
aerosol
Fe K
▶
LLM Prompt
Sample Information
Material: aerosol
Sample Origin: Fort McPherson, Atlanta, GA (urban)
Sample-Specific Conditions
- Site and Season: Urban, Summer
- PM2.5 atmospheric aerosol particles
Measurement
We plan to measure the Fe K XANES spectrum of this sample.
Questions
Based on all the information above:
1. Based on the sample conditions (urban PM2.5 aerosol from Atlanta during summer), what are the expected oxidation states of iron, and what are their estimated fractions?
2. What reference materials or basis functions would be appropriate to use for determining the Fe oxidation state in this aerosol sample via pre-edge centroid analysis?
3. Explain the physical and mineralogical reasoning for the observed mixture of Fe(II) and Fe(III) in these urban summer aerosols, and how the XANES pre-edge feature is used to quantify them.
Ground Truth
Material: aerosol
Measurement: Fe K-edge XANES, fluorescence mode, 2-ID-D beamline at the Advanced Photon Source
Fit method: Pre-edge centroid position interpolation
Phase fractions: (±17%)
| Phase | Fraction |
|---|---|
| Fe(II) | 0.34 |
| Fe(III) | 0.66 |
Fit basis (paper's reference spectra):
- augite
- pyrite
- iron (II) sulfate
- iron (II) oxalate
- goethite
- hematite
- iron (III) oxalate
- iron (III) sulfate
Source evidence: Table 2, page 753
Key reasoning: The oxidation state of iron in single aerosol particles was determined using the pre-edge centroid position of the Fe K-edge XANES spectra. A linear interpolation was established between the mean pre-edge centroid positions of pure Fe(II) and Fe(III) reference minerals. The pre-edge centroid positions of particles from the Fort McPherson Summer sample yielded an average Fe(II) fraction of 34%. The particles were primarily characterized as Al-substituted Fe-oxides and processed Fe-aluminosilicates containing mixtures of Fe(II) and Fe(III).
Reasoning source: Section 2.3 (page 748) and Section 3.2 (page 749-750)
Scoring Rubric (total: 100 pts)
| Q | Type | Max | Question | Reference Answer | Scoring Criteria |
|---|---|---|---|---|---|
| q1 | quantification | 30 | Based on the sample conditions (urban PM2.5 aerosol from Atlanta during summer), what are the expected oxidation states of iron, and what are their estimated fractions? | The expected oxidation states of iron in this sample are Fe(II) and Fe(III), with estimated fractions of 34% Fe(II) and 66% Fe(III), alongside a 17% uncertainty. These specific fractions arise because the urban summer PM2.5 aerosol particles from Fort McPherson are primarily composed of Al-substituted Fe-oxides and processed Fe-aluminosilicates. In this urban atmospheric environment, these mineralogical forms naturally contain a mixture of both Fe(II) and Fe(III) oxidation states. The quantification is achieved by measuring the pre-edge centroid position of the Fe K-edge XANES spectra and applying a linear interpolation between pure Fe(II) and Fe(III) reference minerals. | Score based on identifying Fe(II) and Fe(III) as the primary oxidation states, with Fe(II) around 34% and Fe(III) around 66%. |
| q2 | identification | 30 | What reference materials or basis functions would be appropriate to use for determining the Fe oxidation state in this aerosol sample via pre-edge centroid analysis? | Appropriate reference materials for this analysis include augite, pyrite, iron (II) sulfate, iron (II) oxalate, goethite, hematite, iron (III) oxalate, and iron (III) sulfate. These specific pure Fe(II) and Fe(III) reference minerals are necessary because the urban summer PM2.5 aerosol particles from Atlanta consist of complex mixtures like Al-substituted Fe-oxides and processed Fe-aluminosilicates. By establishing the mean pre-edge centroid positions of these diverse reference standards, a linear interpolation can be created. This interpolation allows for the accurate determination of the mixed Fe(II) and Fe(III) oxidation states present in the atmospheric aerosol sample. | Score based on mentioning a mix of Fe(II) minerals (e.g., augite, pyrite, Fe(II) sulfate/oxalate) and Fe(III) minerals (e.g., goethite, hematite, Fe(III) sulfate/oxalate) to establish the 0% and 100% Fe(III) bounds. |
| q3 | reasoning | 40 | Explain the physical and mineralogical reasoning for the observed mixture of Fe(II) and Fe(III) in these urban summer aerosols, and how the XANES pre-edge feature is used to quantify them. | The observed mixture of 34% Fe(II) and 66% Fe(III) in the urban summer PM2.5 aerosols from Atlanta occurs because the particles are primarily characterized as Al-substituted Fe-oxides and processed Fe-aluminosilicates. These specific mineralogical forms, found in this urban atmospheric environment, inherently contain both oxidation states of iron. To quantify this mixture, the pre-edge centroid position of the Fe K-edge XANES spectra is analyzed for single aerosol particles. A linear interpolation is then established between the mean pre-edge centroid positions of pure Fe(II) and Fe(III) reference minerals to determine the exact fractions. | Score based on explaining that the aerosols consist primarily of Al-substituted Fe-oxides and processed Fe-aluminosilicates which contain mixed oxidation states, and that the pre-edge centroid position shifts with valence, allowing quantification by interpolating between Fe(II) and Fe(III) reference positions. |
Review
#1254
aerosol
Fe K
▶
LLM Prompt
Sample Information
Material: aerosol
Sample Origin: South Dekalb, Atlanta, GA (urban)
Sample-Specific Conditions
- Site and Season: Urban, Summer
- PM2.5 atmospheric aerosol particles
Measurement
We plan to measure the Fe K XANES spectrum of this sample.
Questions
Based on all the information above:
1. What candidate reference spectra or mineral classes should be considered when analyzing the Fe K-edge XANES of these urban PM2.5 aerosol particles?
2. Estimate the relative fractions of Fe(II) and Fe(III) in this urban summer aerosol sample.
3. Based on the expected XANES spectral shape for these urban aerosols, what is the dominant mineralogy, and how does this relate to the observed Fe(II) fraction?
Ground Truth
Material: PM2.5 atmospheric aerosol particles
Measurement: Fe K-edge XANES, fluorescence mode, 2-ID-D beamline at Advanced Photon Source
Fit method: Pre-edge centroid position interpolation
Phase fractions: (±15%)
| Phase | Fraction |
|---|---|
| Fe(II) | 0.2 |
| Fe(III) | 0.8 |
Fit basis (paper's reference spectra):
- augite
- pyrite
- iron (II) sulfate
- iron (II) oxalate
- goethite
- hematite
- iron (III) oxalate
- iron (III) sulfate
Source evidence: Figure 6 (SD Summer bar for % Fe(II))
Key reasoning: Iron in the urban aerosol particles is present as a mixture of Fe(II) and Fe(III). The XANES spectra closely follow the spectra of iron oxides (e.g., goethite and hematite) and lack resemblance to silicates, sulfides, or sulfates, suggesting the majority of Fe is in iron oxides (specifically Al-substituted Fe-oxides and processed Fe-aluminosilicates). The presence of ~20% Fe(II) in particles that otherwise appear to be iron oxides suggests the presence of surface reduced species.
Reasoning source: Section 3.2 (Iron oxidation state and mineralogy) and Section 3.3 (Elemental composition of iron-containing particles)
Scoring Rubric (total: 100 pts)
| Q | Type | Max | Question | Reference Answer | Scoring Criteria |
|---|---|---|---|---|---|
| q1 | identification | 30 | What candidate reference spectra or mineral classes should be considered when analyzing the Fe K-edge XANES of these urban PM2.5 aerosol particles? | The candidate reference spectra should include augite, pyrite, iron (II) sulfate, iron (II) oxalate, goethite, hematite, iron (III) oxalate, and iron (III) sulfate. These references are necessary because urban PM2.5 atmospheric aerosol particles contain a complex mixture of Fe(II) and Fe(III) species. While the sample's spectra primarily resemble iron oxides like goethite and hematite (specifically Al-substituted Fe-oxides and processed Fe-aluminosilicates), references for silicates, sulfides, sulfates, and oxalates must be included to rule out or quantify other potential environmental iron sources. The presence of surface reduced species in these urban summer aerosols further necessitates a comprehensive basis set covering both oxidation states. | Full credit if the answer identifies iron oxides (e.g., goethite, hematite) as the primary expected reference spectra, while also mentioning the need for Fe(II) and Fe(III) standards from other classes (silicates like augite, sulfates, oxalates) to properly calibrate or fit the oxidation state. |
| q2 | quantification | 30 | Estimate the relative fractions of Fe(II) and Fe(III) in this urban summer aerosol sample. | The estimated relative fractions for this urban summer aerosol sample are 20% Fe(II) and 80% Fe(III), with an uncertainty of 15%. These specific values arise because the iron in these PM2.5 atmospheric particles is predominantly present as Fe(III) within iron oxides, such as Al-substituted Fe-oxides and processed Fe-aluminosilicates. The ~20% Fe(II) fraction results from the presence of surface reduced species on particles that otherwise appear to be bulk iron oxides. This specific oxidation state distribution reflects the chemical state and environmental processing of atmospheric aerosols collected in an urban summer environment. | Full credit if the estimated Fe(II) fraction is approximately 20% (accept 15-30%) and the Fe(III) fraction is approximately 80% (accept 70-85%). |
| q3 | reasoning | 40 | Based on the expected XANES spectral shape for these urban aerosols, what is the dominant mineralogy, and how does this relate to the observed Fe(II) fraction? | The XANES spectra for these urban PM2.5 aerosols closely follow the spectral shape of iron oxides, specifically goethite and hematite, indicating that the dominant mineralogy consists of Al-substituted Fe-oxides and processed Fe-aluminosilicates. The spectra lack resemblance to silicates, sulfides, or sulfates. Because the bulk of the aerosol particles is dominated by these Fe(III) oxides, the observed 20% Fe(II) fraction is not due to bulk Fe(II) minerals. Instead, this Fe(II) fraction arises from surface reduced species present on the iron oxide particles, reflecting the environmental processing these atmospheric aerosols undergo in an urban summer environment. | Full credit if the answer explains that the dominant mineralogy consists of iron oxides (or Al-substituted Fe-oxides/processed Fe-aluminosilicates) based on the spectral shape, and that the observed Fe(II) fraction likely exists as surface reduced species on these oxide particles. |
Review
Evolution of fluid redox in a fault zone of the Pic de Port-Vieux thrust in the Pyrenees Axial Zone (Spain)
ESRF-BM23
Environmental
Delphine Charpentier et al.
DOI: 10.5194/egusphere-2024-386
4 scenarios
▶
#1255
Chlorite (mineral)
Fe K
▶
LLM Prompt
Sample Information
Material: Chlorite (mineral)
Sample Origin: Damage zone, Pic de Port-Vieux thrust, Pyrenees Axial Zone (Spain)
Sample-Specific Conditions
- Microstructural position: Damage zone, releasing overstep
- Synkinematic chlorite in a releasing overstep between shear surfaces
Measurement
We plan to measure the Fe K XANES spectrum of this sample.
Questions
Based on all the information above:
1. Based on the geological context of the damage zone (releasing overstep) and the fluid evolution in the Pic de Port-Vieux thrust, estimate the expected Fe3+ fraction (Fe3+/Fetotal) for this synkinematic chlorite sample.
2. Explain the geochemical reasoning for why the chlorite in the damage zone exhibits this specific intermediate Fe3+ fraction, particularly in comparison to the fluid-rock interactions occurring in the core zone.
3. To accurately determine the oxidation state and coordination environment of iron in this chlorite sample using Fe K pre-edge peak analysis, what specific reference standards (representing different oxidation states and coordination geometries) should be included in the calibration basis?
Ground Truth
Material: Chlorite (mineral)
Measurement: Fe K-edge XANES, fluorescence mode, BM23 beamline at ESRF
Fit method: Pre-edge peak fitting (centroid energy position and integrated area calibration)
Phase fractions: (±5%)
| Phase | Fraction |
|---|---|
| Fe3+ (octahedral) | 0.31 |
| Fe2+ (octahedral) | 0.69 |
Fit basis (paper's reference spectra):
- staurolite ([IV]Fe2+)
- siderite ([VI]Fe2+)
- andradite ([VI]Fe3+)
- sanidine ([IV]Fe3+)
Source evidence: Page 13, Section 4.2 (text); Figure 7 (variogram)
Key reasoning: The chlorite in the damage zone formed from a fluid expelled from the core zone. This fluid had a slightly less marked reducing budget after the initial precipitation of Fe-rich chlorites (both Fe3+-rich and Fe2+-rich) in the core zone. Consequently, the damage zone chlorite incorporated an intermediate and homogeneous proportion of Fe3+ (around 31-32%) compared to the highly variable extremes found in the core zone. The homogeneous composition in the damage zone is attributed to fluid flow essentially driven by fracture networks and extensional openings.
Reasoning source: Page 16-17, Section 5.2
Scoring Rubric (total: 100 pts)
| Q | Type | Max | Question | Reference Answer | Scoring Criteria |
|---|---|---|---|---|---|
| q1 | quantification | 30 | Based on the geological context of the damage zone (releasing overstep) and the fluid evolution in the Pic de Port-Vieux thrust, estimate the expected Fe3+ fraction (Fe3+/Fetotal) for this synkinematic chlorite sample. | The expected Fe3+ fraction (Fe3+/Fetotal) for this synkinematic chlorite sample is 0.31 (or 31%), with an uncertainty of 5%, while the remaining 0.69 (69%) is octahedral Fe2+. This specific intermediate and homogeneous fraction arises because the chlorite formed in a releasing overstep within the damage zone from fluids expelled from the core zone. After the initial precipitation of highly variable Fe-rich chlorites in the core zone, the expelled fluid possessed a slightly less marked reducing budget. Because fluid flow in this damage zone was driven by fracture networks and extensional openings, the chlorite homogeneously incorporated ~31% Fe3+ rather than the extreme variations seen in the core. | Full credit for estimating an Fe3+ fraction of approximately 0.31 (or 31% ± 5%). Partial credit for identifying a mixed Fe2+/Fe3+ state with Fe2+ dominating. |
| q2 | reasoning | 40 | Explain the geochemical reasoning for why the chlorite in the damage zone exhibits this specific intermediate Fe3+ fraction, particularly in comparison to the fluid-rock interactions occurring in the core zone. | The intermediate Fe3+ fraction of 0.31 in the damage zone chlorite is the direct result of fluid evolution as it migrated from the core zone into the releasing overstep. Initially, fluid-rock interactions in the core zone precipitated Fe-rich chlorites with highly variable extremes of both Fe3+ and Fe2+. As this fluid was expelled into the damage zone, its reducing budget became slightly less marked. Because fluid flow in the damage zone was primarily driven by fracture networks and extensional openings between shear surfaces, the synkinematic chlorite that precipitated incorporated a much more homogeneous, intermediate proportion of Fe3+ compared to the core zone. | Full credit for explaining that the fluid migrating to the damage zone had a slightly less marked reducing budget after the initial precipitation of Fe-rich chlorites in the core zone, leading to an intermediate and homogeneous Fe3+ incorporation. |
| q3 | identification | 30 | To accurately determine the oxidation state and coordination environment of iron in this chlorite sample using Fe K pre-edge peak analysis, what specific reference standards (representing different oxidation states and coordination geometries) should be included in the calibration basis? | To accurately determine the oxidation state and coordination environment of iron, the calibration basis must include staurolite ([IV]Fe2+), siderite ([VI]Fe2+), andradite ([VI]Fe3+), and sanidine ([IV]Fe3+). These specific reference standards are required to calibrate the centroid energy position and integrated area of the pre-edge peak for all possible Fe configurations. These standards are necessary because the synkinematic chlorite in this damage zone precipitated from fluids expelled from the core zone, resulting in a specific mixture of oxidation states (31% octahedral Fe3+ and 69% octahedral Fe2+). The less marked reducing budget and fracture-driven fluid flow in the releasing overstep created this homogeneous intermediate composition, which can only be accurately quantified by bounding the fit with these exact tetrahedral and octahedral, Fe2+ and Fe3+ end-members. | Full credit for identifying standards that cover both Fe2+ and Fe3+ in both tetrahedral and octahedral coordinations, specifically mentioning analogs like staurolite ([IV]Fe2+), siderite ([VI]Fe2+), andradite ([VI]Fe3+), and sanidine ([IV]Fe3+). |
Review
#1256
Chlorite (mineral)
Fe K
▶
LLM Prompt
Sample Information
Material: Chlorite (mineral)
Sample Origin: Damage zone, Pic de Port-Vieux thrust, Pyrenees Axial Zone (Spain)
Sample-Specific Conditions
- Microstructural position: Damage zone, extensional vein
- Synkinematic chlorite in a high angle extensional vein
Measurement
We plan to measure the Fe K XANES spectrum of this sample.
Questions
Based on all the information above:
1. Identify the expected iron oxidation states and their coordination environments in this synkinematic chlorite sample, and estimate their relative fractions.
2. Explain the geochemical reasoning for the observed Fe3+ fraction in this damage zone chlorite, considering the fluid evolution and redox conditions in the fault zone.
Ground Truth
Material: Chlorite (mineral)
Measurement: Fe K-edge XANES, fluorescence mode, BM23 beamline at ESRF
Fit method: Pre-edge centroid position calibration
Phase fractions: (±5%)
| Phase | Fraction |
|---|---|
| Fe3+ (octahedral) | 0.32 |
| Fe2+ (octahedral) | 0.68 |
Fit basis (paper's reference spectra):
- staurolite ([IV]Fe2+)
- siderite ([VI]Fe2+)
- andradite ([VI]Fe3+)
- sanidine ([IV]Fe3+)
Source evidence: Section 4.2 (Estimation of iron speciation from XANES spectra), Figure 7, and text on page 13
Key reasoning: The pre-edge centroid energy for chlorite in Area 2 of the damage zone is around 7113.5 eV, which falls on the mixing line between octahedral Fe2+ and octahedral Fe3+ standards, indicating all iron is in octahedral sites. The calculated XFe3+ is 32±5%. This intermediate Fe3+ content reflects precipitation from a fluid that had a slightly less marked reducing budget after earlier hematite dissolution and chlorite precipitation in the core zone.
Reasoning source: Section 4.2 and Section 5.2 (Evolution of fluid – rock interactions in the PPV fault zone)
Scoring Rubric (total: 100 pts)
| Q | Type | Max | Question | Reference Answer | Scoring Criteria |
|---|---|---|---|---|---|
| q1 | quantification | 50 | Identify the expected iron oxidation states and their coordination environments in this synkinematic chlorite sample, and estimate their relative fractions. | In this synkinematic chlorite sample from the damage zone extensional vein, iron is expected to be entirely in octahedral coordination, consisting of 32±5% octahedral Fe3+ and 68% octahedral Fe2+. These specific fractions and coordination environments are determined because the Fe K-edge XANES pre-edge centroid energy (around 7113.5 eV) falls exactly on the mixing line between octahedral Fe2+ and octahedral Fe3+ standards. This intermediate Fe3+ fraction arises from the specific fluid conditions during the formation of the extensional vein in the damage zone. Specifically, the chlorite precipitated from a fluid with a slightly less marked reducing budget, which evolved after an earlier phase of hematite dissolution and chlorite precipitation in the fault's core zone. | Full points for identifying both Fe2+ and Fe3+ in purely octahedral coordination, with fractions of approximately 32% Fe3+ and 68% Fe2+. |
| q2 | reasoning | 50 | Explain the geochemical reasoning for the observed Fe3+ fraction in this damage zone chlorite, considering the fluid evolution and redox conditions in the fault zone. | The observed Fe3+ fraction of 32±5% in this damage zone chlorite reflects the evolving redox conditions of the fluid during its precipitation in the high-angle extensional vein. This intermediate Fe3+ content indicates that the mineral precipitated from a fluid possessing a slightly less marked reducing budget. This specific fluid composition evolved as a result of earlier fluid-rock interactions, namely hematite dissolution and prior chlorite precipitation that occurred in the core zone of the fault. Consequently, as the fluid moved into the damage zone, its altered redox state dictated the mixed octahedral Fe2+ (68%) and Fe3+ (32%) incorporation into the synkinematic chlorite structure, as evidenced by the pre-edge centroid energy falling on the octahedral mixing line. | Full points for explaining that the intermediate Fe3+ content (compared to the core zone) results from precipitation from a fluid with a slightly less marked reducing budget, following earlier hematite dissolution and iron re-incorporation in the core zone. |
Review
#1257
Chlorite (mineral)
Fe K
▶
LLM Prompt
Sample Information
Material: Chlorite (mineral)
Sample Origin: Core zone, Pic de Port-Vieux thrust, Pyrenees Axial Zone (Spain)
Sample-Specific Conditions
- Microstructural position: Core zone, interboudin domain
- Synkinematic chlorite in an interboudin domain
Measurement
We plan to measure the Fe K XANES spectrum of this sample.
Questions
Based on all the information above:
1. Estimate the Fe3+ and Fe2+ phase fractions for the synkinematic chlorite located in the interboudin domain of the core zone.
2. What reference standard materials are appropriate to use for calibrating the pre-edge features to determine the oxidation state and coordination environment (tetrahedral vs. octahedral) of iron in these samples?
3. Explain the geochemical mechanism that leads to the specific Fe3+ enrichment observed in the chlorite from the interboudin domain of the core zone.
Ground Truth
Material: Chlorite (mineral)
Measurement: Fe K-edge XANES in fluorescence mode at ESRF BM23 beamline
Fit method: Pre-edge centroid position calibration
Phase fractions: (±9%)
| Phase | Fraction |
|---|---|
| Fe3+ (octahedral) | 0.39 |
| Fe2+ (octahedral) | 0.61 |
Fit basis (paper's reference spectra):
- staurolite ([IV]Fe2+)
- siderite ([VI]Fe2+)
- andradite ([VI]Fe3+)
- sanidine ([IV]Fe3+)
Source evidence: Section 4.2 (Estimation of iron speciation from XANES spectra) and Section 5.2
Key reasoning: Highly reducing fluids circulating in the core zone dissolved hematite, enriching the local brine in Fe3+. This localized enrichment favored the crystallization of Fe3+-rich chlorite in the interboudin extensional domains (Area 1). The pre-edge centroid positions indicate that all iron cations in the measured chlorite are located in octahedral sites.
Reasoning source: Section 4.2 and Section 5.2: Evolution of fluid - rock interactions in the PPV fault zone
Scoring Rubric (total: 101 pts)
| Q | Type | Max | Question | Reference Answer | Scoring Criteria |
|---|---|---|---|---|---|
| q1 | quantification | 38 | Estimate the Fe3+ and Fe2+ phase fractions for the synkinematic chlorite located in the interboudin domain of the core zone. | The estimated fractions for the synkinematic chlorite are 0.39 for octahedral Fe3+ and 0.61 for octahedral Fe2+, with an uncertainty of 9%. These specific values arise because highly reducing fluids circulating in the core zone dissolved hematite, enriching the local brine in Fe3+. This localized enrichment directly favored the crystallization of Fe3+-rich chlorite in the interboudin extensional domains. Additionally, pre-edge centroid position calibration indicates that all iron cations in this measured chlorite are located exclusively in octahedral sites. | Full points if Fe3+ is estimated at ~0.39 (39%) and Fe2+ at ~0.61 (61%), within the 9% uncertainty margin. |
| q2 | identification | 25 | What reference standard materials are appropriate to use for calibrating the pre-edge features to determine the oxidation state and coordination environment (tetrahedral vs. octahedral) of iron in these samples? | The appropriate reference standard materials for pre-edge centroid position calibration are staurolite ([IV]Fe2+), siderite ([VI]Fe2+), andradite ([VI]Fe3+), and sanidine ([IV]Fe3+). These standards are necessary to accurately determine the iron speciation of the synkinematic chlorite formed in the core zone. Given that highly reducing fluids dissolved hematite and enriched the local brine in Fe3+, the chlorite crystallized with a specific mixture of iron oxidation states in the interboudin domain. By comparing the sample's pre-edge features to these specific tetrahedral and octahedral standards, it is revealed that all iron cations in the measured chlorite are located in octahedral sites. | Full points for identifying standards that cover both oxidation states and coordination environments, specifically mentioning staurolite ([IV]Fe2+), siderite ([VI]Fe2+), andradite ([VI]Fe3+), and sanidine ([IV]Fe3+). |
| q3 | reasoning | 38 | Explain the geochemical mechanism that leads to the specific Fe3+ enrichment observed in the chlorite from the interboudin domain of the core zone. | The specific Fe3+ enrichment observed in the synkinematic chlorite from the interboudin domain is caused by highly reducing fluids circulating in the core zone. These fluids dissolved hematite, which consequently enriched the local brine in Fe3+. This localized chemical enrichment directly favored the crystallization of Fe3+-rich chlorite in the interboudin extensional domains. Pre-edge centroid positions from the Fe K-edge XANES spectra confirm this outcome, demonstrating that the resulting iron is entirely accommodated in the octahedral sites of the chlorite structure as a mixture of 39% Fe3+ and 61% Fe2+. | Full points for explaining that highly reducing fluids dissolved hematite in the core zone, which enriched the local brine in Fe3+ and subsequently favored the crystallization of Fe3+-rich chlorite in the interboudin extensional domains. |
Review
#1258
Chlorite (mineral)
Fe K
▶
LLM Prompt
Sample Information
Material: Chlorite (mineral)
Sample Origin: Core zone, Pic de Port-Vieux thrust, Pyrenees Axial Zone (Spain)
Sample-Specific Conditions
- Microstructural position: Core zone, mylonitized vein margin
- Synkinematic chlorite at the margin of a mylonitized quartz vein
Measurement
We plan to measure the Fe K XANES spectrum of this sample.
Questions
Based on all the information above:
1. Based on the sample conditions (synkinematic chlorite at the margin of a mylonitized quartz vein in the core zone), what are the expected iron oxidation states, their coordination, and their approximate fractions?
2. What reference standards would be appropriate to calibrate the pre-edge features for determining the iron oxidation state and coordination in this chlorite sample?
3. Explain the geochemical processes and redox conditions that lead to the specific Fe3+/Fe2+ ratio observed in the chlorite at the margin of the mylonitized quartz vein compared to other areas in the fault zone.
Ground Truth
Material: Chlorite (mineral)
Measurement: Fe K-edge XANES, fluorescence mode, BM23 beamline at ESRF
Fit method: Pre-edge peak fitting and centroid energy position calibration
Phase fractions: (±7%)
| Phase | Fraction |
|---|---|
| Fe3+ (octahedral) | 0.16 |
| Fe2+ (octahedral) | 0.84 |
Fit basis (paper's reference spectra):
- staurolite ([IV]Fe2+)
- siderite ([VI]Fe2+)
- andradite ([VI]Fe3+)
- sanidine ([IV]Fe3+)
Source evidence: Section 4.2, page 13
Key reasoning: The chlorite in Area 2 of the core zone (at the edge of the mylonitized quartz vein) formed under reducing conditions. The fluid, initially highly reducing, dissolved hematite and formed Fe3+-rich chlorite in the interboudin domain (Area 1). Subsequent reduction of some iron to Fe2+ led to the formation of Fe2+-rich chlorite at the edge of quartz veins (Area 2). The XFe3+ evolution is compatible with the decrease in oxygen fugacity buffered by the hematite-chlorite equilibrium.
Reasoning source: Section 5.2, page 16
Scoring Rubric (total: 100 pts)
| Q | Type | Max | Question | Reference Answer | Scoring Criteria |
|---|---|---|---|---|---|
| q1 | quantification | 30 | Based on the sample conditions (synkinematic chlorite at the margin of a mylonitized quartz vein in the core zone), what are the expected iron oxidation states, their coordination, and their approximate fractions? | The expected iron oxidation states in this sample are octahedral Fe3+ at a fraction of 0.16 and octahedral Fe2+ at a fraction of 0.84, with an uncertainty of 7%. These specific fractions arise because the synkinematic chlorite at the margin of the mylonitized quartz vein (Area 2 of the core zone) formed under progressively reducing conditions. While an initially highly reducing fluid dissolved hematite to form Fe3+-rich chlorite in other domains, the subsequent reduction of some iron to Fe2+ led to the formation of this Fe2+-dominated chlorite at the vein edge. This specific iron speciation is the direct result of a decrease in oxygen fugacity buffered by the hematite-chlorite equilibrium. | Full points for identifying octahedral Fe2+ and Fe3+ with fractions around 84% and 16% respectively. Partial points for correct oxidation states but inaccurate fractions. |
| q2 | identification | 30 | What reference standards would be appropriate to calibrate the pre-edge features for determining the iron oxidation state and coordination in this chlorite sample? | Appropriate reference standards for calibrating the pre-edge centroid energy position include staurolite for tetrahedral Fe2+ ([IV]Fe2+), siderite for octahedral Fe2+ ([VI]Fe2+), andradite for octahedral Fe3+ ([VI]Fe3+), and sanidine for tetrahedral Fe3+ ([IV]Fe3+). These specific standards are necessary to cover the full range of potential iron oxidation states and coordination environments, allowing for the accurate quantification of the sample's actual octahedral Fe2+ and Fe3+ fractions. This specific iron speciation must be measured because the chlorite at the margin of the mylonitized quartz vein formed under evolving reducing conditions. Specifically, a decrease in oxygen fugacity buffered by the hematite-chlorite equilibrium caused the subsequent reduction of iron, resulting in the Fe2+-rich composition observed at this microstructural position. | Full points for listing standards that cover both Fe2+ and Fe3+ in both tetrahedral and octahedral coordinations (e.g., staurolite, siderite, andradite, sanidine). |
| q3 | reasoning | 40 | Explain the geochemical processes and redox conditions that lead to the specific Fe3+/Fe2+ ratio observed in the chlorite at the margin of the mylonitized quartz vein compared to other areas in the fault zone. | The specific Fe3+/Fe2+ ratio (0.16 octahedral Fe3+ to 0.84 octahedral Fe2+) observed in the synkinematic chlorite at the mylonitized quartz vein margin is the result of evolving reducing conditions within the core zone. Initially, a highly reducing fluid dissolved hematite, which formed Fe3+-rich chlorite in the interboudin domain (Area 1). As the system evolved, the subsequent reduction of some iron to Fe2+ led to the precipitation of the Fe2+-rich chlorite specifically at the edge of the quartz veins (Area 2). This progressive evolution of the Fe3+ fraction is directly controlled by a decrease in oxygen fugacity that is buffered by the hematite-chlorite equilibrium during the deformation process. | Full points for explaining that the fluid was initially highly reducing, dissolved hematite, and subsequently some iron was reduced to Fe2+, leading to the formation of Fe2+-rich chlorite at the edge of the quartz veins, buffered by the hematite-chlorite equilibrium. |
Review
Atomic-scale environment of niobium in ore minerals as revealed by XANES and EXAFS at the Nb K-edge
ESRF-BM23
Pure Phase
Quentin Bollaert et al.
DOI: 10.5194/ejm-36-55-2024
16 scenarios
▶
#1259
(Mn,Fe)(Nb,Ta)2O6
Nb K-edge
▶
LLM Prompt
Sample Information
Material: (Mn,Fe)(Nb,Ta)2O6
Crystal Structure: Chains of edge-sharing NbO6 octahedra
Oxidation State: 5+
Sample Form: cellulose-diluted pellet
Measurement Mode: transmission
- Natural columbite-(Mn) mineral reference
Measurement
We plan to measure the Nb K-edge XANES spectrum of this sample.
Questions
Based on all the information above:
1. Describe the expected spectral shape and key features (pre-edge, white line, post-edge) of the Nb K-edge XANES spectrum for Columbite-(Mn). Include energy positions and relative intensities where applicable.
2. What electronic transitions give rise to the pre-edge feature (Feature A) and the B feature in the Nb K-edge XANES spectrum of this sample?
3. How does the local structure of Nb in Columbite-(Mn) influence the intensity of the pre-edge feature and the position of the C feature?
4. What specific spectral features distinguish the Nb K-edge XANES spectrum of Columbite-(Mn) from that of pyrochlores?
Ground Truth
Compound: (Mn,Fe)(Nb,Ta)2O6
Oxidation state: 5+
Measurement: Nb K-edge transmission mode
Edge position: not reported
Spectral shape: Spectrum shows an intense pre-edge feature, a split B feature with a low-intensity shoulder, and a low-energy C feature.
Labeled peaks:
| Label | Energy (eV) | Intensity | Origin | Source |
|---|---|---|---|---|
| Feature A (pre-edge) | 18982.83 | 0.245 | 1s -> 4d transition (weakly quadrupole-allowed) / 1s -> 5p-4d (dipolar allowed by hybridization) | paper_data |
| Feature B | 19004 | low-intensity shoulder | 1s -> 4p transition | paper_data |
| Feature C | 19010 | moderate | transition to higher-energy np states, shape resonance, and multiple scattering | paper_data |
Distinguishing features: Split B feature and low-energy C feature distinguish it from pyrochlores.
Key reasoning: The intense pre-edge feature (0.245) at 18982.83 eV indicates a high degree of Nb site distortion. The B feature is split into two poorly resolved features including a low-intensity shoulder at 19004 eV, showing a high degree of distortion of NbO6 octahedra. The low-energy C feature at ca. 19010 eV is correlated with the longest Nb-O distances.
Reasoning source: Section 4.1 Relationship between niobium site geometry and K-edge XANES spectroscopic properties
Scoring Rubric (total: 100 pts)
| Q | Type | Max | Question | Reference Answer | Scoring Criteria |
|---|---|---|---|---|---|
| q1 | spectral | 30 | Describe the expected spectral shape and key features (pre-edge, white line, post-edge) of the Nb K-edge XANES spectrum for Columbite-(Mn). Include energy positions and relative intensities where applicable. | The expected Nb K-edge XANES spectrum for Columbite-(Mn) features an intense pre-edge peak (Feature A) at 18982.83 eV with a relative intensity of 0.245. The main edge exhibits a split Feature B, which includes a low-intensity shoulder at 19004 eV, followed by a moderate-intensity Feature C at approximately 19010 eV. These specific spectral features arise because the (Mn,Fe)(Nb,Ta)2O6 sample consists of chains of edge-sharing NbO6 octahedra with a high degree of Nb site distortion. Specifically, the intense pre-edge and the split B feature are direct consequences of this highly distorted octahedral geometry, while the low-energy position of Feature C correlates with the longest Nb-O distances in the structure. | Must mention the intense pre-edge feature at ~18982.8 eV, the split B feature with a low-intensity shoulder at ~19004 eV, and the low-energy C feature at ~19010 eV. |
| q2 | reasoning | 25 | What electronic transitions give rise to the pre-edge feature (Feature A) and the B feature in the Nb K-edge XANES spectrum of this sample? | In the Nb K-edge XANES spectrum of this sample, the pre-edge feature (Feature A) at 18982.83 eV originates from a 1s -> 4d transition that is weakly quadrupole-allowed, as well as a 1s -> 5p-4d transition that becomes dipolar-allowed through hybridization. Feature B at 19004 eV arises from the 1s -> 4p electronic transition. These transitions manifest with their specific intensities and shapes because the (Mn,Fe)(Nb,Ta)2O6 sample contains highly distorted chains of edge-sharing NbO6 octahedra. This high degree of Nb site distortion promotes the 5p-4d orbital hybridization required to intensify the pre-edge transition and causes the splitting of the 1s -> 4p transition into a poorly resolved feature with a low-intensity shoulder. | Must identify the pre-edge as arising from 1s -> 4d transitions (with 5p-4d hybridization allowing dipolar transitions) and the B feature as a 1s -> 4p transition. |
| q3 | reasoning | 25 | How does the local structure of Nb in Columbite-(Mn) influence the intensity of the pre-edge feature and the position of the C feature? | The local structure of Nb in Columbite-(Mn) consists of chains of edge-sharing NbO6 octahedra that exhibit a high degree of site distortion. This severe distortion of the NbO6 octahedra directly causes the intense pre-edge feature (Feature A) at 18982.83 eV, which reaches an intensity of 0.245 due to enhanced 5p-4d hybridization. Furthermore, the specific geometry of these distorted octahedra includes elongated bond lengths, and the low-energy position of Feature C at approximately 19010 eV is directly correlated with these longest Nb-O distances. Therefore, the structural deviations from a perfect octahedron in the (Mn,Fe)(Nb,Ta)2O6 mineral dictate both the high pre-edge intensity and the low-energy placement of the multiple scattering C feature. | Must explain that the high degree of Nb site distortion (distorted NbO6 octahedra) leads to an intense pre-edge feature, and the long Nb-O distances correlate with the low-energy position of the C feature. |
| q4 | spectral | 20 | What specific spectral features distinguish the Nb K-edge XANES spectrum of Columbite-(Mn) from that of pyrochlores? | The Nb K-edge XANES spectrum of Columbite-(Mn) is distinguished from that of pyrochlores by the presence of a split Feature B and a low-energy Feature C. Specifically, Feature B exhibits a poorly resolved splitting with a low-intensity shoulder at 19004 eV, while Feature C appears at a lower energy of approximately 19010 eV. These distinguishing features arise because the (Mn,Fe)(Nb,Ta)2O6 sample possesses a unique local structure consisting of highly distorted chains of edge-sharing NbO6 octahedra. This high degree of Nb site distortion causes the splitting of the B feature, and the longest Nb-O distances within these specific octahedral chains shift the C feature to its characteristic low-energy position. | Must mention the split B feature and the low-energy C feature as distinguishing characteristics compared to pyrochlores. |
Review
#1260
NaNbO3
Nb K-edge
▶
LLM Prompt
Sample Information
Material: NaNbO3
Crystal Structure: Perovskite structure with interconnected NbO6 octahedra
Oxidation State: 5+
Sample Form: cellulose-diluted pellet
Measurement Mode: transmission
- Natural lueshite mineral reference
Measurement
We plan to measure the Nb K-edge XANES spectrum of this sample.
Questions
Based on all the information above:
1. What are the expected energy, intensity, and physical origin of the pre-edge feature (Feature A) in the Nb K-edge XANES spectrum of this lueshite sample?
2. Describe the characteristics and physical origin of the main edge 'B feature' in the Nb K-edge XANES spectrum of lueshite.
3. What structural information can be inferred from the well-defined, low-intensity features occurring a few tens of electronvolts after the edge jump in the lueshite spectrum?
4. How does the XANES spectrum of lueshite compare to other perovskite-group minerals, such as Nb perovskite, in terms of phase identification?
Ground Truth
Compound: NaNbO3
Oxidation state: 5+
Measurement: Nb K-edge XANES in transmission mode at SAMBA beamline (SOLEIL)
Edge position: not reported
Spectral shape: Spectrum shows a moderate pre-edge, a split B feature at high energy, and well-defined low-intensity features after the edge jump.
Labeled peaks:
| Label | Energy (eV) | Intensity | Origin | Source |
|---|---|---|---|---|
| Feature A (pre-edge) | 18983.71 | 0.203 | 1s -> 4d transition | paper_data |
| Feature B | 19003 | moderate | 1s -> 4p transition / multiple scattering paths involving second-nearest neighbors | paper_data |
| Feature C | not explicitly reported | moderate | transition to higher-energy np states, shape resonance, and multiple scattering | paper_data |
Distinguishing features: Distinct from Nb perovskite despite both being perovskite-group minerals.
Key reasoning: The XANES spectrum of lueshite exhibits a pre-edge feature at 18983.71 eV with an intensity of 0.203, corresponding to a 1s -> 4d transition. The B feature is split and located at a high energy (19003 eV), which is related to multiple scattering paths involving second-nearest neighbors. Well-defined low-intensity features after the edge jump indicate strong ordering of next-nearest-neighbor atoms.
Reasoning source: Section 4.1 (Relationship between niobium site geometry and K-edge XANES spectroscopic properties)
Scoring Rubric (total: 100 pts)
| Q | Type | Max | Question | Reference Answer | Scoring Criteria |
|---|---|---|---|---|---|
| q1 | spectral | 30 | What are the expected energy, intensity, and physical origin of the pre-edge feature (Feature A) in the Nb K-edge XANES spectrum of this lueshite sample? | The pre-edge feature (Feature A) in the Nb K-edge XANES spectrum is expected to appear at 18983.71 eV with an intensity of 0.203. The physical origin of this feature is a 1s -> 4d electronic transition. These spectral characteristics arise directly from the sample's composition as NaNbO3 (lueshite) with Nb in a 5+ oxidation state. Specifically, the local geometry of the interconnected NbO6 octahedra within the perovskite crystal structure dictates the available unoccupied 4d states and local symmetry, producing this distinct pre-edge signature. | Full points if the answer identifies the energy at ~18983.7 eV, the intensity around 0.203, and attributes the origin to a 1s -> 4d transition. |
| q2 | spectral | 30 | Describe the characteristics and physical origin of the main edge 'B feature' in the Nb K-edge XANES spectrum of lueshite. | The main edge 'B feature' in the lueshite spectrum is split, exhibits moderate intensity, and is located at a high energy of 19003 eV. The physical origin of this feature is a 1s -> 4p electronic transition coupled with multiple scattering paths involving second-nearest neighbors. This specific spectral shape arises because the sample is a crystalline NaNbO3 perovskite. The highly ordered arrangement of interconnected NbO6 octahedra and surrounding atoms in the lueshite structure creates distinct multiple scattering paths for the photoelectron, causing the B feature to split and shift to this specific energy. | Full points if the answer notes that the B feature is split (with a low-intensity shoulder at 19004 eV), positioned at a high energy (19003 eV), and originates from a 1s -> 4p transition and multiple scattering paths involving second-nearest neighbors. |
| q3 | reasoning | 20 | What structural information can be inferred from the well-defined, low-intensity features occurring a few tens of electronvolts after the edge jump in the lueshite spectrum? | The well-defined, low-intensity features occurring a few tens of electronvolts after the edge jump indicate a strong ordering of next-nearest-neighbor atoms in the material. These features arise directly from the sample's identity as a natural lueshite mineral (NaNbO3) with a highly crystalline perovskite structure. The regular, repeating network of interconnected NbO6 octahedra and sodium cations provides a highly ordered extended environment. This long-range structural coherence dictates the multiple scattering of the photoelectron at higher energies, producing these distinct post-edge spectral oscillations. | Full points if the answer explains that these post-edge features correspond to multiple scattering that involves strong ordering of the next-nearest-neighbor atoms. |
| q4 | identification | 20 | How does the XANES spectrum of lueshite compare to other perovskite-group minerals, such as Nb perovskite, in terms of phase identification? | The XANES spectrum of lueshite is distinct from that of Nb perovskite, allowing it to be identified as a pure phase (1.0 fraction) despite both being perovskite-group minerals. This spectral distinction arises because the specific composition of lueshite (NaNbO3) creates a unique local geometry compared to other perovskites. The specific arrangement of interconnected NbO6 octahedra and the presence of sodium in the lueshite lattice alter the multiple scattering paths and electronic transitions. Consequently, these unique structural and electronic properties of the NaNbO3 sample produce a distinct spectral fingerprint—such as the split B feature at 19003 eV—that differentiates it from other Nb-bearing perovskites. | Full points if the answer states that the XANES signatures of lueshite and Nb perovskite are distinct from each other, allowing them to be differentiated despite both being perovskite-group minerals. |
Review
#1261
CaTi1-2xFexNbxO3
Nb K-edge
▶
LLM Prompt
Sample Information
Material: CaTi1-2xFexNbxO3
Crystal Structure: Perovskite structure with interconnected NbO6 octahedra
Oxidation State: 5+
Sample Form: cellulose-diluted pellet
Measurement Mode: transmission
- Natural Nb perovskite mineral reference
Measurement
We plan to measure the Nb K-edge XANES spectrum of this sample.
Questions
Based on all the information above:
1. Describe the expected spectral shape and key features of the Nb K-edge XANES spectrum for this Nb perovskite sample.
2. What electronic transitions or physical phenomena give rise to the pre-edge feature and the C feature in this spectrum?
3. How do the spectral features of this Nb perovskite reflect its local structural environment?
4. How can the XANES signature of this Nb perovskite be used to distinguish it from other perovskite-group minerals like lueshite?
Ground Truth
Compound: CaTi1-2xFexNbxO3
Oxidation state: 5+
Measurement: Nb K-edge XANES, transmission mode, SAMBA beamline
Edge position: not reported
Spectral shape: Spectrum displays a pre-edge with a small shoulder, the most intense C feature among the studied minerals, and well-defined multiple scattering features.
Labeled peaks:
| Label | Energy (eV) | Intensity | Origin | Source |
|---|---|---|---|---|
| Feature A (pre-edge) | 18985.45 | 0.221 | 1s -> 4d transition / charge transfer between 4d of Nb5+ and 2p of O2- | paper_data |
| Feature C | not reported | strong (most intense) | transition to higher-energy np states, shape resonance, and multiple scattering | paper_data |
Distinguishing features: Most intense C feature and distinct XANES signature compared to lueshite, allowing differentiation of perovskites.
Key reasoning: The pre-edge feature of Nb perovskite reveals a small shoulder assigned to charge transfer between 4d orbitals of Nb5+ and 2p orbitals of O2-. The spectrum displays the most intense C feature, consistent with a limited distortion of the NbO6 octahedra. Well-defined features of low intensity occur after the edge jump, corresponding to multiple scattering involving strong ordering of next-nearest-neighbor atoms.
Reasoning source: Section 4.1
Scoring Rubric (total: 100 pts)
| Q | Type | Max | Question | Reference Answer | Scoring Criteria |
|---|---|---|---|---|---|
| q1 | spectral | 25 | Describe the expected spectral shape and key features of the Nb K-edge XANES spectrum for this Nb perovskite sample. | The expected Nb K-edge XANES spectrum for this CaTi1-2xFexNbxO3 sample features a pre-edge (Feature A) at 18985.45 eV with an intensity of 0.221 and a small shoulder. It also displays a very strong, most intense Feature C, along with well-defined, low-intensity features after the edge jump. These specific spectral features arise directly from the sample's perovskite structure containing Nb5+ in interconnected NbO6 octahedra. Specifically, the intense C feature reflects the limited distortion of these NbO6 octahedra in the lattice, while the well-defined post-edge features result from multiple scattering due to the strong ordering of next-nearest-neighbor atoms in this crystalline environment. | Must mention the pre-edge feature at ~18985.45 eV with a small shoulder, the highly intense C feature, and well-defined multiple scattering features. |
| q2 | reasoning | 25 | What electronic transitions or physical phenomena give rise to the pre-edge feature and the C feature in this spectrum? | In this CaTi1-2xFexNbxO3 sample, the pre-edge feature (Feature A) originates from a 1s to 4d electronic transition. The small shoulder on this pre-edge is specifically assigned to charge transfer between the 4d orbitals of the Nb5+ ions and the 2p orbitals of the surrounding O2- ligands. Meanwhile, the intense Feature C arises from transitions to higher-energy np states, shape resonances, and multiple scattering effects. These phenomena are directly dictated by the sample's composition and structure, where the 5+ oxidation state of Nb drives the specific 4d-2p charge transfer, and the interconnected NbO6 octahedra with limited distortion facilitate the strong shape resonances and multiple scattering seen in Feature C. | Must attribute the pre-edge to a 1s -> 4d transition and/or charge transfer between Nb5+ 4d and O2- 2p orbitals. Must attribute the C feature to transitions to higher-energy np states, shape resonance, or multiple scattering. |
| q3 | reasoning | 25 | How do the spectral features of this Nb perovskite reflect its local structural environment? | The spectral features of the CaTi1-2xFexNbxO3 sample are a direct reflection of its specific perovskite crystal structure and local coordination. The presence of the most intense C feature indicates that there is only limited distortion within the interconnected NbO6 octahedra of the sample. Furthermore, the well-defined, low-intensity features occurring after the edge jump correspond to multiple scattering events. These scattering events arise because the sample's crystalline perovskite lattice enforces a strong ordering of next-nearest-neighbor atoms around the central Nb5+ absorber. | Must connect the intense C feature to a limited distortion of the NbO6 octahedra, and the well-defined multiple scattering features to strong ordering of next-nearest-neighbor atoms. |
| q4 | identification | 25 | How can the XANES signature of this Nb perovskite be used to distinguish it from other perovskite-group minerals like lueshite? | The CaTi1-2xFexNbxO3 sample can be distinguished from other perovskite-group minerals like lueshite by its distinct XANES signature, most notably its exceptionally intense C feature. This differentiation is possible because the specific spectral shape is highly sensitive to the local structural environment of the Nb atoms. In this sample, the interconnected NbO6 octahedra experience only limited distortion, which produces the uniquely strong C feature and well-defined multiple scattering peaks. Consequently, comparing the intensity of Feature C and the specific multiple scattering profile allows for the clear identification of this Nb perovskite phase relative to other minerals with different octahedral distortions. | Must mention that Nb perovskite has a distinct XANES signature, specifically the most intense C feature, which differentiates it from lueshite. |
Review
#1262
CeO2:Nb
Nb K-edge
▶
LLM Prompt
Sample Information
Material: CeO2:Nb
Crystal Structure: Edge-sharing CeO8 polyhedra (Nb substitutes Ce)
Oxidation State: 5+
Sample Form: powder
Measurement Mode: fluorescence
- Synthetic Nb-doped cerianite
Measurement
We plan to measure the Nb K-edge XANES spectrum of this sample.
Questions
Based on all the information above:
1. Describe the expected spectral shape of the Nb K-edge XANES for Nb-doped cerianite, specifically focusing on the pre-edge and the main edge (B feature).
2. What structural change occurs when Nb5+ substitutes for Ce4+ in the cerianite lattice, and how does this physically explain the intensity of the pre-edge feature?
3. What specific electronic transitions give rise to the pre-edge (Feature A) and the split main edge features (B1 and B2) in this spectrum?
4. What distinguishes the Nb K-edge XANES spectrum of Nb-doped cerianite from other typical Nb-bearing oxides?
Ground Truth
Compound: CeO2:Nb
Oxidation state: 5+
Measurement: Nb K-edge XANES in fluorescence mode
Edge position: not reported
Spectral shape: Spectrum stands out with a very sharp and intense pre-edge feature at low energy and a clearly split B feature (B1 and B2).
Labeled peaks:
| Label | Energy (eV) | Intensity | Origin | Source |
|---|---|---|---|---|
| Feature A (pre-edge) | 18982.58 | 0.306 | 1s -> 4d transition | Table 2 / Figure 1 |
| Feature B1 | 18998 | moderate | 1s -> 4p transition | text |
| Feature B2 | 19006 | moderate | 1s -> 4p transition | text |
Distinguishing features: Sharpest and most intense pre-edge feature among the studied compounds; clearly split B feature.
Key reasoning: The substitution of Nb5+ for Ce4+ in cerianite reduces the coordination number of the cation from eight to four. This breaking of centrosymmetry results in a very sharp and intense pre-edge feature at low energy (18982.58 eV). The B feature is also clearly split into two well-marked features (B1 and B2).
Reasoning source: Section 4.1 and Abstract
Scoring Rubric (total: 100 pts)
| Q | Type | Max | Question | Reference Answer | Scoring Criteria |
|---|---|---|---|---|---|
| q1 | spectral | 30 | Describe the expected spectral shape of the Nb K-edge XANES for Nb-doped cerianite, specifically focusing on the pre-edge and the main edge (B feature). | The expected Nb K-edge XANES spectrum for Nb-doped cerianite features a very sharp and intense pre-edge peak (Feature A) at a low energy of 18982.58 eV with an intensity of 0.306. Additionally, the main edge exhibits a clearly split B feature, consisting of two well-marked peaks labeled B1 (18998 eV) and B2 (19006 eV). These distinct spectral features arise because the substitution of Nb5+ for Ce4+ in the cerianite lattice reduces the cation coordination number from eight to four. This structural change breaks the centrosymmetry of the original edge-sharing CeO8 polyhedra, which strongly enhances the pre-edge intensity and splits the main edge transitions. | Full points if the answer mentions a very sharp and intense pre-edge feature at low energy (~18982.6 eV) and a clearly split B feature (B1 and B2 at ~18998 and 19006 eV). |
| q2 | reasoning | 35 | What structural change occurs when Nb5+ substitutes for Ce4+ in the cerianite lattice, and how does this physically explain the intensity of the pre-edge feature? | When Nb5+ substitutes for Ce4+ in the cerianite lattice, the local crystal structure changes as the cation coordination number is reduced from eight (in the original edge-sharing CeO8 polyhedra) to four. This reduction in coordination number fundamentally breaks the centrosymmetry of the local environment around the Nb absorber. Because the centrosymmetry is broken, it results in a very sharp and intense pre-edge feature (Feature A) at 18982.58 eV. Therefore, the high intensity of the pre-edge is a direct physical consequence of the lower-symmetry, four-fold coordination environment adopted by the Nb5+ dopant in the powder sample. | Full points if the answer explains that the coordination number of the cation reduces from eight to four, which breaks centrosymmetry and allows for strong dipole transitions, resulting in a highly intense pre-edge. |
| q3 | reasoning | 20 | What specific electronic transitions give rise to the pre-edge (Feature A) and the split main edge features (B1 and B2) in this spectrum? | In the Nb K-edge XANES spectrum of Nb-doped cerianite, the pre-edge (Feature A) at 18982.58 eV originates from the 1s -> 4d electronic transition. The split main edge features, B1 at 18998 eV and B2 at 19006 eV, both originate from 1s -> 4p electronic transitions. These specific transitions and their resulting spectral signatures occur because Nb5+ substitutes for Ce4+ in the lattice, reducing the coordination number from eight to four. This breaking of centrosymmetry in the original CeO8 polyhedra strongly promotes the 1s -> 4d transition, yielding an intense pre-edge, while simultaneously splitting the 1s -> 4p transitions into two distinct, well-marked features. | Full points if the answer correctly assigns the pre-edge to a 1s -> 4d transition and the B features to 1s -> 4p transitions. |
| q4 | identification | 15 | What distinguishes the Nb K-edge XANES spectrum of Nb-doped cerianite from other typical Nb-bearing oxides? | The Nb K-edge XANES spectrum of Nb-doped cerianite is distinguished by having the sharpest and most intense pre-edge feature (at 18982.58 eV) among studied compounds, as well as a clearly split main B feature (B1 and B2). These unique distinguishing characteristics are directly caused by the specific doping mechanism in this synthetic powder sample. When Nb5+ substitutes for Ce4+ in the cerianite structure, it reduces the local coordination number from eight (typical of CeO8 polyhedra) to four. This severe breaking of centrosymmetry in the local geometry is what drives the exceptionally high pre-edge intensity and the distinct splitting of the main edge. | Full points if the answer notes it has the sharpest and most intense pre-edge feature among the studied compounds and a distinctly split B feature. |
Review
#1263
(Ca,Na)2Nb2O6F
Nb K-edge
▶
LLM Prompt
Sample Information
Material: (Ca,Na)2Nb2O6F
Crystal Structure: Corner-sharing NbO6 octahedra
Oxidation State: 5+
Sample Form: cellulose-diluted pellet
Measurement Mode: transmission
- Natural fluorcalciopyrochlore mineral reference
Measurement
We plan to measure the Nb K-edge XANES spectrum of this sample.
Questions
Based on all the information above:
1. Describe the expected characteristics of the pre-edge feature (Feature A) for this fluorcalciopyrochlore sample and explain what it indicates about the local Nb structure.
2. What electronic transitions are responsible for the pre-edge (Feature A) and the main edge shoulder (Feature B) in the Nb K-edge XANES spectrum of this material?
3. How does the position of the post-edge 'C feature' in this sample compare to minerals with longer Nb-O distances, and what is the physical origin of this feature?
Ground Truth
Compound: (Ca,Na)2Nb2O6F
Oxidation state: 5+
Measurement: Nb K-edge XAS, transmission mode, SAMBA beamline at SOLEIL
Edge position: not reported
Spectral shape: The spectrum exhibits a low-intensity pre-edge feature at higher energy, a B feature, and a C feature that is shifted towards higher energies due to short Nb-O distances.
Labeled peaks:
| Label | Energy (eV) | Intensity | Origin | Source |
|---|---|---|---|---|
| Feature A (pre-edge) | 18983.93 | 0.200 | 1s -> 4d transition | Table 2 / Section 4.1 |
| Feature B | ~18999 | not explicitly quantified | 1s -> 4p transition | Section 4.1 |
| Feature C | shifted towards higher energies (range 19010-19022 eV) | moderate | transition to higher-energy np states, shape resonance, and multiple scattering | Section 4.1 |
Distinguishing features: Lower pre-edge intensity (0.200) compared to highly distorted Nb minerals, reflecting relatively regular NbO6 octahedra in the pyrochlore structure.
Key reasoning: The pre-edge feature of fluorcalciopyrochlore has a low intensity (0.200) and is located at a higher energy (18983.93 eV), which indicates a lower degree of distortion of the Nb site compared to other Nb minerals. The C feature is shifted towards higher energies, which correlates with the shorter Nb-O distances found in pyrochlores.
Reasoning source: Section 4.1 Relationship between niobium site geometry and K-edge XANES spectroscopic properties
Scoring Rubric (total: 100 pts)
| Q | Type | Max | Question | Reference Answer | Scoring Criteria |
|---|---|---|---|---|---|
| q1 | spectral | 35 | Describe the expected characteristics of the pre-edge feature (Feature A) for this fluorcalciopyrochlore sample and explain what it indicates about the local Nb structure. | The expected pre-edge feature (Feature A) for this sample is characterized by a low intensity of 0.200 and is located at a relatively high energy of 18983.93 eV. Because the sample is a natural fluorcalciopyrochlore mineral, (Ca,Na)2Nb2O6F, composed of corner-sharing NbO6 octahedra, these spectral characteristics directly reflect its local geometry. Specifically, the low pre-edge intensity arises because the Nb site in this pyrochlore structure has a lower degree of distortion compared to other highly distorted Nb minerals. This indicates that the Nb5+ ions reside in relatively regular octahedral environments within the crystal structure. | Must mention the low intensity (~0.200) and higher energy position (~18983.9 eV) of the pre-edge, and explain that this indicates a lower degree of distortion (relatively regular NbO6 octahedra) compared to other Nb minerals. |
| q2 | reasoning | 30 | What electronic transitions are responsible for the pre-edge (Feature A) and the main edge shoulder (Feature B) in the Nb K-edge XANES spectrum of this material? | In the Nb K-edge XANES spectrum of this material, the pre-edge (Feature A) originates from the 1s to 4d electronic transition, while the main edge shoulder (Feature B) at ~18999 eV is assigned to the 1s to 4p transition. These specific transitions arise from the electronic configuration of the Nb5+ oxidation state being probed in the (Ca,Na)2Nb2O6F sample. Because the sample consists of corner-sharing NbO6 octahedra with a relatively regular local geometry, this lower degree of structural distortion directly influences the transition probabilities, resulting in the characteristic low intensity (0.200) observed for the 1s to 4d pre-edge transition. | Must identify the pre-edge as a 1s -> 4d transition and Feature B as a 1s -> 4p transition. |
| q3 | spectral | 35 | How does the position of the post-edge 'C feature' in this sample compare to minerals with longer Nb-O distances, and what is the physical origin of this feature? | The post-edge 'C feature' in this sample is shifted towards higher energies (in the range of 19010-19022 eV) compared to minerals with longer Nb-O distances. The physical origin of this feature includes transitions to higher-energy np states, shape resonances, and multiple scattering effects. This high-energy shift occurs specifically because the (Ca,Na)2Nb2O6F fluorcalciopyrochlore sample possesses shorter Nb-O bond distances within its corner-sharing NbO6 octahedra. Consequently, the compact local geometry of the Nb5+ sites in this specific pyrochlore structure directly modifies the multiple scattering paths, pushing the C feature to higher energies. | Must state that the C feature is shifted towards higher energies due to the shorter Nb-O distances in pyrochlores, and mention its origin involves transitions to higher-energy np states, shape resonances, or multiple scattering. |
Review
#1264
(Na,Ca,U)2Nb2O6O
Nb K-edge
▶
LLM Prompt
Sample Information
Material: (Na,Ca,U)2Nb2O6O
Crystal Structure: Completely metamict
Oxidation State: 5+
Sample Form: cellulose-diluted pellet
Measurement Mode: transmission
- Natural metamict U-rich oxynatropyrochlore
Measurement
We plan to measure the Nb K-edge XANES spectrum of this sample.
Questions
Based on all the information above:
1. Describe the expected spectral shape of this metamict U-rich oxynatropyrochlore at the Nb K-edge, specifically focusing on the pre-edge and post-edge (Feature C) features.
2. What structural phenomena explain the specific characteristics of the pre-edge and post-edge features in this metamict sample compared to crystalline pyrochlores?
3. What electronic transitions or scattering phenomena give rise to the pre-edge (Feature A) and the post-edge (Feature C) in this Nb K-edge spectrum?
Ground Truth
Compound: (Na,Ca,U)2Nb2O6O
Oxidation state: 5+
Measurement: Nb K-edge transmission mode at SAMBA beamline (SOLEIL)
Edge position: not reported
Spectral shape: Spectrum shows an intense pre-edge feature and a broad, weak C feature.
Labeled peaks:
| Label | Energy (eV) | Intensity | Origin | Source |
|---|---|---|---|---|
| Feature A (pre-edge) | 18985.0 | 0.260 | 1s -> 4d transition | Table 2 / Section 4.1 |
| Feature C | not reported | weak and broad | transition to higher-energy np states, shape resonance, and multiple scattering | Section 4.1 |
Distinguishing features: Broad C feature and intense pre-edge distinguish it from crystalline pyrochlores, reflecting metamictization.
Key reasoning: The spectrum exhibits an intense pre-edge feature and a broad, weak C feature. The intense pre-edge is related to the loss of site symmetry due to radiation damage (metamictization). The broad and weak C feature indicates a broad distribution of Nb-O bond lengths and the loss of long-range periodicity, characteristic of metamict structures.
Reasoning source: Section 4.1
Scoring Rubric (total: 100 pts)
| Q | Type | Max | Question | Reference Answer | Scoring Criteria |
|---|---|---|---|---|---|
| q1 | spectral | 30 | Describe the expected spectral shape of this metamict U-rich oxynatropyrochlore at the Nb K-edge, specifically focusing on the pre-edge and post-edge (Feature C) features. | The expected Nb K-edge XANES spectrum for this sample features an intense pre-edge peak (Feature A) at 18985.0 eV with an intensity of 0.260, alongside a broad and weak post-edge Feature C. Because the sample is a natural U-rich oxynatropyrochlore that has become completely metamict due to radiation damage, its structural properties dictate this specific spectral shape. The intense pre-edge arises from the loss of site symmetry inherent to the radiation-damaged state. Furthermore, the broad and weak nature of Feature C reflects the broad distribution of Nb-O bond lengths and the loss of long-range periodicity characteristic of this completely metamict crystal structure. | Award full points if the answer mentions an intense pre-edge feature and a broad, weak post-edge (Feature C). |
| q2 | reasoning | 40 | What structural phenomena explain the specific characteristics of the pre-edge and post-edge features in this metamict sample compared to crystalline pyrochlores? | The specific spectral characteristics of this sample are driven by its completely metamict crystal structure, which results from radiation damage in the natural U-rich oxynatropyrochlore. The intense pre-edge feature is caused by a significant loss of local site symmetry around the Nb atoms due to this radiation damage. In contrast to crystalline pyrochlores, the metamict state lacks long-range periodicity and possesses a broad distribution of Nb-O bond lengths. These structural phenomena—specifically the structural disorder and varied bond lengths—directly cause the post-edge Feature C to become broad and weak. | Award full points if the answer explains that the intense pre-edge is due to the loss of site symmetry from radiation damage (metamictization), and the broad/weak post-edge indicates a broad distribution of Nb-O bond lengths and loss of long-range periodicity. |
| q3 | reasoning | 30 | What electronic transitions or scattering phenomena give rise to the pre-edge (Feature A) and the post-edge (Feature C) in this Nb K-edge spectrum? | In this Nb K-edge spectrum, the pre-edge (Feature A) at 18985.0 eV originates from a 1s to 4d electronic transition. The post-edge (Feature C) arises from transitions to higher-energy np states, shape resonances, and multiple scattering phenomena. These specific transitions and scattering effects manifest as an intense pre-edge and a broad, weak Feature C because the sample is a completely metamict U-rich oxynatropyrochlore. The radiation damage inherent to this metamict state causes a loss of site symmetry that intensifies the 1s to 4d transition, while the resulting loss of long-range periodicity and broad distribution of Nb-O bond lengths dampen and broaden the multiple scattering signals of Feature C. | Award full points if the answer attributes the pre-edge to a 1s -> 4d transition and the post-edge (Feature C) to transitions to higher-energy np states, shape resonance, and/or multiple scattering. |
Review
#1265
YNbO4
Nb K-edge
▶
LLM Prompt
Sample Information
Material: YNbO4
Crystal Structure: Isolated NbO4 tetrahedra
Oxidation State: 5+
Sample Form: powder
Measurement Mode: transmission
- Natural fergusonite-(Y) mineral reference
Measurement
We plan to measure the Nb K-edge XANES spectrum of this sample.
Questions
Based on all the information above:
1. Describe the expected Nb K-edge XANES spectral shape for this natural fergusonite-(Y) sample, specifically focusing on the relative intensity of the pre-edge and the shape of the post-edge (Feature C) region.
2. What structural and physical characteristics of this natural fergusonite-(Y) sample account for its specific pre-edge intensity and the broad, weak nature of its post-edge features?
3. What electronic transition is responsible for the pre-edge feature (Feature A) observed in the Nb K-edge XANES spectrum of this sample?
Ground Truth
Compound: YNbO4
Oxidation state: 5+
Measurement: Nb K-edge XAS, transmission mode, BM23 beamline
Edge position: not reported
Spectral shape: The spectrum exhibits an intense pre-edge feature and a broad, weak C feature.
Labeled peaks:
| Label | Energy (eV) | Intensity | Origin | Source |
|---|---|---|---|---|
| Feature A (pre-edge) | 18982.24 | 0.250 | 1s -> 4d transition | paper_data |
| Feature C | not reported | weak and broad | transition to higher-energy np states, shape resonance, and multiple scattering | paper_data |
Distinguishing features: Intense pre-edge feature (0.250) at 18982.24 eV and a broad, weak C feature indicative of metamictization and fourfold coordination.
Key reasoning: Fergusonite-(Y) contains Nb5+ in fourfold coordination (isolated NbO4 tetrahedra). Its XANES spectrum exhibits an intense pre-edge feature (0.250 at 18982.24 eV) and a broad, weak C feature. These features reflect both the specific local geometry (fourfold coordination) and the metamictization (loss of long-range periodicity) common in this radionuclide-rich phase.
Reasoning source: Section 4.1 (Relationship between niobium site geometry and K-edge XANES spectroscopic properties)
Scoring Rubric (total: 100 pts)
| Q | Type | Max | Question | Reference Answer | Scoring Criteria |
|---|---|---|---|---|---|
| q1 | spectral | 30 | Describe the expected Nb K-edge XANES spectral shape for this natural fergusonite-(Y) sample, specifically focusing on the relative intensity of the pre-edge and the shape of the post-edge (Feature C) region. | The expected Nb K-edge XANES spectrum for this natural fergusonite-(Y) sample exhibits an intense pre-edge feature (Feature A) at 18982.24 eV with an intensity of 0.250, alongside a broad and weak post-edge Feature C. These specific spectral features arise directly from the sample's structural conditions, specifically the presence of Nb5+ in fourfold coordination as isolated NbO4 tetrahedra. Furthermore, the broad and weak nature of Feature C is a result of metamictization, which causes a loss of long-range periodicity in this natural radionuclide-rich mineral phase. | Full points if the answer correctly identifies an intense pre-edge feature and a broad, weak post-edge (Feature C) region. |
| q2 | reasoning | 40 | What structural and physical characteristics of this natural fergusonite-(Y) sample account for its specific pre-edge intensity and the broad, weak nature of its post-edge features? | The intense pre-edge feature (0.250 at 18982.24 eV) is directly accounted for by the specific local geometry of the sample, which consists of Nb5+ in fourfold coordination within isolated NbO4 tetrahedra. The broad, weak nature of the post-edge features (Feature C) is caused by metamictization, a physical characteristic common in this natural radionuclide-rich mineral phase. This metamictization leads to a loss of long-range periodicity in the crystal structure. Consequently, the transitions to higher-energy np states, shape resonances, and multiple scattering events that typically define Feature C are broadened and weakened. | Full points if the answer attributes the intense pre-edge to the fourfold coordination of Nb5+ (isolated tetrahedra) and the broad/weak post-edge features to metamictization (loss of long-range periodicity/broad distribution of Nb-O bond lengths). |
| q3 | reasoning | 30 | What electronic transition is responsible for the pre-edge feature (Feature A) observed in the Nb K-edge XANES spectrum of this sample? | The pre-edge feature (Feature A) observed at 18982.24 eV in the Nb K-edge XANES spectrum is caused by the 1s to 4d electronic transition. This transition yields an intense pre-edge peak (intensity of 0.250) due to the specific local geometry of the sample. Specifically, the sample consists of Nb5+ in fourfold coordination within isolated NbO4 tetrahedra. This specific fourfold coordination environment directly dictates the intense manifestation of the 1s to 4d transition in the resulting spectrum. | Full points if the answer correctly identifies the 1s -> 4d transition. |
Review
#1266
Na2Ca4ZrNb(Si2O7)2O3F
Nb K-edge
▶
LLM Prompt
Sample Information
Material: Na2Ca4ZrNb(Si2O7)2O3F
Crystal Structure: Isolated NbO6 octahedra
Oxidation State: 5+
Sample Form: cellulose-diluted pellet
Measurement Mode: transmission
- Natural wöhlerite mineral reference
Measurement
We plan to measure the Nb K-edge XANES spectrum of this sample.
Questions
Based on all the information above:
1. Describe the expected spectral features (pre-edge and C feature) for the Nb K-edge XANES spectrum of wöhlerite, including their energy positions and relative intensities.
2. What structural characteristics of the Nb site in wöhlerite are indicated by its specific pre-edge intensity and C feature position?
3. What are the physical origins (electronic transitions or scattering phenomena) of the pre-edge feature and the C feature in this spectrum?
Ground Truth
Compound: Na2Ca4ZrNb(Si2O7)2O3F
Oxidation state: 5+
Measurement: Nb K-edge XANES, transmission mode, SAMBA beamline at SOLEIL
Edge position: not reported
Spectral shape: The spectrum is characterized by an intense pre-edge feature and a low-energy C feature.
Labeled peaks:
| Label | Energy (eV) | Intensity | Origin | Source |
|---|---|---|---|---|
| Feature A (pre-edge) | 18984.08 | 0.258 | 1s -> 4d transition (with dipolar 1s -> 5p-4d contribution due to distortion) | paper_data |
| Feature C | ca. 19010 | moderate | transition to higher-energy np states, shape resonance, and multiple scattering | paper_data |
Distinguishing features: The high pre-edge intensity reflects highly distorted NbO6 octahedra, and the low-energy C feature correlates with long Nb-O distances.
Key reasoning: Wöhlerite exhibits one of the most intense pre-edge features (0.258) at 18984.08 eV, which indicates a high degree of Nb site distortion. Additionally, it has a low-energy C feature (ca. 19010 eV), which correlates with the longest Nb-O distances among the studied minerals.
Reasoning source: Section 4.1
Scoring Rubric (total: 100 pts)
| Q | Type | Max | Question | Reference Answer | Scoring Criteria |
|---|---|---|---|---|---|
| q1 | spectral | 35 | Describe the expected spectral features (pre-edge and C feature) for the Nb K-edge XANES spectrum of wöhlerite, including their energy positions and relative intensities. | The Nb K-edge XANES spectrum of wöhlerite (Na2Ca4ZrNb(Si2O7)2O3F) is expected to show an intense pre-edge feature (Feature A) at 18984.08 eV with a relative intensity of 0.258. Additionally, it will exhibit a moderate-intensity C feature at a low energy of approximately 19010 eV. These specific spectral features arise directly from the structural conditions of the sample, which consists of isolated Nb5+ in NbO6 octahedra. Specifically, the high intensity of the pre-edge feature is produced by a high degree of distortion in these NbO6 octahedra, while the low-energy position of the C feature results from the sample possessing the longest Nb-O distances among related minerals. | Full points for identifying the intense pre-edge at ~18984 eV and the low-energy C feature at ~19010 eV. |
| q2 | reasoning | 35 | What structural characteristics of the Nb site in wöhlerite are indicated by its specific pre-edge intensity and C feature position? | The specific pre-edge intensity and C feature position indicate that the Nb5+ site in wöhlerite (Na2Ca4ZrNb(Si2O7)2O3F) consists of highly distorted, isolated NbO6 octahedra with long Nb-O bond distances. The intense pre-edge feature (0.258 at 18984.08 eV) is a direct result of the high degree of distortion within the isolated NbO6 octahedra of this mineral. Furthermore, the low-energy position of the C feature (ca. 19010 eV) correlates structurally with the longest Nb-O distances among studied minerals. Therefore, these spectral signatures arise because the specific composition and crystal structure of wöhlerite force the Nb5+ ions into highly asymmetric octahedral environments with extended bond lengths. | Full points for connecting the intense pre-edge to a high degree of Nb site distortion and the low-energy C feature to long Nb-O distances. |
| q3 | reasoning | 30 | What are the physical origins (electronic transitions or scattering phenomena) of the pre-edge feature and the C feature in this spectrum? | In the Nb K-edge XANES spectrum of wöhlerite (Na2Ca4ZrNb(Si2O7)2O3F), the pre-edge feature (Feature A) originates from a 1s to 4d electronic transition. Because the sample's crystal structure contains highly distorted, isolated NbO6 octahedra, this transition gains a dipolar 1s to 5p-4d contribution, which explains its high intensity (0.258). The C feature arises from transitions to higher-energy np states, shape resonances, and multiple scattering phenomena. The specific low-energy position of this C feature (ca. 19010 eV) occurs because the Nb5+ ions in this specific mineral composition exhibit exceptionally long Nb-O bond distances, which directly modulates the multiple scattering pathways. | Full points for attributing the pre-edge to 1s -> 4d (and 1s -> 5p-4d) transitions and the C feature to transitions to higher-energy np states, shape resonance, and/or multiple scattering. |
Review
#1267
Ca7Nb(Si4O14)O3F
Nb K-edge
▶
LLM Prompt
Sample Information
Material: Ca7Nb(Si4O14)O3F
Crystal Structure: Isolated NbO6 octahedra
Oxidation State: 5+
Sample Form: cellulose-diluted pellet
Measurement Mode: transmission
- Natural niocalite mineral reference
Measurement
We plan to measure the Nb K-edge XANES spectrum of this sample.
Questions
Based on all the information above:
1. What are the expected characteristics (energy, intensity, and physical origin) of the pre-edge feature for niocalite at the Nb K-edge, and what structural property does this reflect?
2. Describe the position and physical origin of the main post-edge feature (Feature C) in the Nb K-edge XANES spectrum of niocalite. How does its energy position relate to the local atomic environment?
3. Based on the XANES spectral features, how does the local Nb environment in niocalite compare to other Nb minerals in terms of site distortion and Nb-O bond lengths?
Ground Truth
Compound: Ca7Nb(Si4O14)O3F
Oxidation state: 5+
Measurement: Nb K-edge XANES in transmission mode at 20 K
Edge position: not reported
Spectral shape: The spectrum features an intense pre-edge peak and a low-energy C feature, characteristic of highly distorted NbO6 octahedra with long Nb-O distances.
Labeled peaks:
| Label | Energy (eV) | Intensity | Origin | Source |
|---|---|---|---|---|
| Feature A (pre-edge) | 18983.95 | 0.240 | 1s -> 4d transition (dipolar 1s -> 5p-4d transitions allowed by 5p-4d hybridization upon breaking centrosymmetry) | paper_data |
| Feature C | 19010 | moderate | transition to higher-energy np states, shape resonance, and multiple scattering | paper_data |
Distinguishing features: Intense pre-edge feature (0.240) indicating high Nb site distortion, and a low-energy C feature (~19010 eV) correlating with long Nb-O distances.
Key reasoning: The XANES spectrum of niocalite exhibits an intense pre-edge feature (0.240 at 18983.95 eV), which reflects a high degree of Nb site distortion. It also displays a low-energy C feature at approximately 19010 eV, which correlates with the longest Nb-O distances found in this mineral.
Reasoning source: Section 4.1 (Relationship between niobium site geometry and K-edge XANES spectroscopic properties)
Scoring Rubric (total: 100 pts)
| Q | Type | Max | Question | Reference Answer | Scoring Criteria |
|---|---|---|---|---|---|
| q1 | spectral | 40 | What are the expected characteristics (energy, intensity, and physical origin) of the pre-edge feature for niocalite at the Nb K-edge, and what structural property does this reflect? | The pre-edge feature (Feature A) for niocalite is expected at 18983.95 eV with a high intensity of 0.240. Its physical origin is the 1s to 4d transition, which becomes dipole-allowed via 5p-4d hybridization upon the breaking of centrosymmetry. Because the Ca7Nb(Si4O14)O3F sample contains isolated Nb5+O6 octahedra that are highly distorted, this lack of centrosymmetry drives strong orbital hybridization. Consequently, this high degree of Nb site distortion directly produces the intense pre-edge peak observed in the 20 K transmission measurement. | Award full points if the answer identifies the pre-edge energy (~18983.95 eV), its high intensity (~0.240), its origin (1s -> 4d transition / 5p-4d hybridization), and correctly links it to a high degree of Nb site distortion. |
| q2 | spectral | 35 | Describe the position and physical origin of the main post-edge feature (Feature C) in the Nb K-edge XANES spectrum of niocalite. How does its energy position relate to the local atomic environment? | The main post-edge feature (Feature C) in the Nb K-edge XANES spectrum of niocalite is located at a low energy of approximately 19010 eV with moderate intensity. The physical origin of this feature involves transitions to higher-energy np states, shape resonances, and multiple scattering events. Because the Ca7Nb(Si4O14)O3F sample consists of isolated, highly distorted Nb5+O6 octahedra, it contains notably long Nb-O bond distances. These extended Nb-O distances in the local atomic environment directly shift the multiple scattering resonances to lower energies, resulting in the characteristic low-energy position of Feature C observed during the 20 K transmission measurement. | Award full points if the answer states the C feature is at a low energy (~19010 eV), originates from transitions to higher-energy np states/shape resonance/multiple scattering, and explains that this low-energy position correlates with the longest Nb-O distances. |
| q3 | reasoning | 25 | Based on the XANES spectral features, how does the local Nb environment in niocalite compare to other Nb minerals in terms of site distortion and Nb-O bond lengths? | The local Nb environment in niocalite is characterized by a high degree of site distortion and exceptionally long Nb-O bond lengths. This is evidenced by the intense pre-edge feature (0.240 at 18983.95 eV) and the low-energy position of Feature C (~19010 eV) in the Nb K-edge XANES spectrum. Because the Ca7Nb(Si4O14)O3F sample contains isolated Nb5+O6 octahedra, the specific crystal structure induces severe breaking of centrosymmetry and extended bond distances. Consequently, the strong 5p-4d hybridization yields the intense pre-edge peak reflecting high distortion, while the long Nb-O distances shift the multiple scattering resonances to lower energies, distinguishing its highly distorted local environment from less distorted Nb minerals. | Award full points if the answer concludes that niocalite has one of the highest degrees of Nb site distortion (evidenced by the intense pre-edge) and the longest Nb-O distances (evidenced by the low-energy C feature) among Nb minerals. |
Review
#1268
TiO2:Nb
Nb K-edge
▶
LLM Prompt
Sample Information
Material: TiO2:Nb
Crystal Structure: Edge-sharing TiO6 octahedra (Nb substitutes Ti)
Oxidation State: 5+
Sample Form: powder
Measurement Mode: fluorescence
- Synthetic Nb-doped anatase
Measurement
We plan to measure the Nb K-edge XANES spectrum of this sample.
Questions
Based on all the information above:
1. What is the expected energy position and electronic origin of the pre-edge feature for this 10 wt% Nb-doped anatase sample?
2. How does the pre-edge intensity of the 10 wt% Nb-doped anatase compare to lower doping levels (e.g., 1% or 5%), and what specific structural change does this variation reflect?
3. What is the oxidation state of Nb in this sample, and what phase dominates the composition?
Ground Truth
Compound: TiO2:Nb
Oxidation state: 5+
Measurement: Nb K-edge XANES in fluorescence mode at SAMBA beamline (SOLEIL)
Edge position: not reported
Spectral shape: The spectrum exhibits a pre-edge feature whose intensity tracks the local structural distortion induced by higher Nb incorporation in the anatase lattice.
Labeled peaks:
| Label | Energy (eV) | Intensity | Origin | Source |
|---|---|---|---|---|
| Feature A (pre-edge) | 18982.85 | 0.250 | 1s -> 4d transition | paper_data |
Distinguishing features: The pre-edge intensity (0.250) is higher than that of lower-doped anatase samples (1% and 5% Nb), reflecting greater local structural distortion.
Key reasoning: The pre-edge feature in the Nb-doped anatase spectrum with 10 wt% Nb is more intense (0.250) than those with 1% and 5% Nb (0.220). This difference indicates an increasing distortion of the local structure with increasing amounts of Nb in the anatase structure, which is corroborated by the increase of the unit-cell parameters.
Reasoning source: Section 4.1: Relationship between niobium site geometry and K-edge XANES spectroscopic properties
Scoring Rubric (total: 100 pts)
| Q | Type | Max | Question | Reference Answer | Scoring Criteria |
|---|---|---|---|---|---|
| q1 | spectral | 30 | What is the expected energy position and electronic origin of the pre-edge feature for this 10 wt% Nb-doped anatase sample? | The expected energy position of the pre-edge feature (Feature A) is 18982.85 eV, originating from the 1s -> 4d electronic transition. This specific spectral feature arises because the sample consists of synthetic Nb-doped anatase powder where Nb5+ substitutes Ti in edge-sharing TiO6 octahedra. The incorporation of 10 wt% Nb into the anatase lattice induces a significant local structural distortion around the absorbing atoms. Consequently, this distortion allows the 1s -> 4d transition to occur with a distinct intensity of 0.250, reflecting the altered octahedral geometry around the Nb5+ ions in this highly doped composition. | Award full points if the answer identifies the energy around 18982.85 eV and attributes the origin to a 1s -> 4d transition. |
| q2 | reasoning | 40 | How does the pre-edge intensity of the 10 wt% Nb-doped anatase compare to lower doping levels (e.g., 1% or 5%), and what specific structural change does this variation reflect? | The pre-edge intensity of the 10 wt% Nb-doped anatase is 0.250, which is notably higher than the intensity of 0.220 observed for lower doping levels like 1% and 5% Nb. This variation reflects an increasing distortion of the local structure around the Nb atoms as more Nb5+ substitutes Ti in the edge-sharing TiO6 octahedra of the anatase lattice. Because the sample contains a high concentration (10 wt%) of Nb5+ dopants, the anatase structure experiences greater local structural distortion, which is also corroborated by an increase in the unit-cell parameters. Therefore, the elevated pre-edge intensity directly results from the altered local geometry induced by this specific high-doping composition. | Award full points if the answer states that the pre-edge intensity is higher (0.250 vs 0.220) for the 10 wt% sample and explains that this indicates increasing distortion of the local structure (Nb site) with higher Nb incorporation. |
| q3 | identification | 30 | What is the oxidation state of Nb in this sample, and what phase dominates the composition? | The oxidation state of Nb in this sample is 5+, and the composition is entirely dominated by a single phase of Nb-doped anatase (1.0 fraction). This pure phase composition is expected because the sample is synthesized specifically as a TiO2:Nb powder where Nb substitutes Ti within the anatase crystal structure. The 5+ oxidation state and 100% phase fraction result from the synthetic conditions designed to incorporate 10 wt% Nb directly into the edge-sharing TiO6 octahedra. The successful substitution of Nb5+ into the anatase lattice without forming secondary phases leads to the observed local structural distortions and corresponding unit-cell parameter increases. | Award full points if the answer correctly identifies the oxidation state as 5+ and the phase as 100% Nb-doped anatase. |
Review
#1269
TiO2:Nb
Nb K-edge
▶
LLM Prompt
Sample Information
Material: TiO2:Nb
Crystal Structure: Edge- and corner-sharing TiO6 octahedra (Nb substitutes Ti)
Oxidation State: 5+
Sample Form: powder
Measurement Mode: fluorescence
- Synthetic Nb-doped rutile
Measurement
We plan to measure the Nb K-edge XANES spectrum of this sample.
Questions
Based on all the information above:
1. Describe the expected pre-edge feature (energy and relative intensity) for the Nb K-edge XANES spectrum of Nb-doped rutile.
2. What electronic transition gives rise to the pre-edge feature at the Nb K-edge, and why is its intensity particularly low in the Nb-doped rutile structure?
3. How does the pre-edge intensity of Nb-doped rutile distinguish it from Nb incorporated into highly distorted octahedral environments?
Ground Truth
Compound: TiO2:Nb
Oxidation state: 5+
Measurement: Nb K-edge XANES, fluorescence mode, SAMBA beamline at SOLEIL
Edge position: not reported
Spectral shape: The spectrum exhibits a very weak pre-edge feature at 18982.71 eV, reflecting a highly symmetric, weakly distorted octahedral Nb site.
Labeled peaks:
| Label | Energy (eV) | Intensity | Origin | Source |
|---|---|---|---|---|
| Pre-edge feature (A) | 18982.71 | 0.163 | weakly quadrupole-allowed 1s -> 4d transition | Table 2, Section 4.1 |
Distinguishing features: The pre-edge intensity (0.163) is the lowest among the studied Nb compounds, distinguishing it from Nb in more distorted octahedral environments where 5p-4d hybridization allows stronger dipolar transitions.
Key reasoning: The pre-edge feature of Nb-doped rutile has a very low intensity (0.163), which confirms a weakly distorted Nb site. This is expected from the symmetry of the Ti site in pure rutile, where Nb5+ substitutes for Ti4+ in edge- and corner-sharing octahedra.
Reasoning source: Section 4.4.1 and Section 4.1
Scoring Rubric (total: 100 pts)
| Q | Type | Max | Question | Reference Answer | Scoring Criteria |
|---|---|---|---|---|---|
| q1 | spectral | 30 | Describe the expected pre-edge feature (energy and relative intensity) for the Nb K-edge XANES spectrum of Nb-doped rutile. | The expected pre-edge feature (A) for the Nb K-edge XANES spectrum of Nb-doped rutile is located at 18982.71 eV and exhibits a very low relative intensity of 0.163. These spectral features arise directly from the sample conditions, where Nb5+ substitutes for Ti4+ within the edge- and corner-sharing TiO6 octahedra of the synthetic rutile powder. Because this substitution occurs in the highly symmetric Ti site of pure rutile, the resulting Nb site is only weakly distorted. This highly symmetric, weakly distorted octahedral environment restricts the transition probability, thereby producing the observed very weak pre-edge intensity. | Full points if the answer identifies the pre-edge feature at approximately 18982.7 eV and correctly describes its intensity as very low (or specifically ~0.163). |
| q2 | reasoning | 40 | What electronic transition gives rise to the pre-edge feature at the Nb K-edge, and why is its intensity particularly low in the Nb-doped rutile structure? | The pre-edge feature at the Nb K-edge originates from a weakly quadrupole-allowed 1s to 4d electronic transition. Its intensity is particularly low in the Nb-doped rutile structure because the Nb5+ ions substitute for Ti4+ within the edge- and corner-sharing TiO6 octahedra of the pure rutile lattice. This specific substitution provides a highly symmetric, weakly distorted octahedral environment for the Nb atoms. Because the site lacks the significant distortion required to promote 5p-4d hybridization and stronger dipolar transitions, the transition remains strictly weakly quadrupole-allowed, resulting in the low intensity of 0.163. | Full points if the answer attributes the pre-edge to a weakly quadrupole-allowed 1s -> 4d transition and explains that the low intensity is due to the weakly distorted/highly symmetric nature of the octahedral Ti site that Nb substitutes into, which limits 5p-4d hybridization. |
| q3 | prediction | 30 | How does the pre-edge intensity of Nb-doped rutile distinguish it from Nb incorporated into highly distorted octahedral environments? | The pre-edge intensity of Nb-doped rutile is extremely low (0.163), which distinguishes it from Nb incorporated into highly distorted octahedral environments where the intensity would be much higher. This distinction is a direct result of the sample's structure, where Nb5+ substitutes for Ti4+ in the highly symmetric edge- and corner-sharing TiO6 octahedra of the pure rutile lattice. This substitution creates a weakly distorted Nb site that only permits a weakly quadrupole-allowed 1s to 4d transition. In contrast, highly distorted octahedral environments promote 5p-4d hybridization, which allows for much stronger dipolar transitions and consequently higher pre-edge intensities. | Full points if the answer states that Nb-doped rutile has the lowest pre-edge intensity among the studied compounds, whereas highly distorted sites would exhibit much more intense pre-edge features due to broken centrosymmetry. |
Review
#1270
Fe2O3:Nb
Nb K-edge
▶
LLM Prompt
Sample Information
Material: Fe2O3:Nb
Crystal Structure: Face- and edge-sharing FeO6 octahedra (Nb substitutes Fe)
Oxidation State: 5+
Sample Form: powder
Measurement Mode: fluorescence
- Synthetic Nb-doped hematite
Measurement
We plan to measure the Nb K-edge XANES spectrum of this sample.
Questions
Based on all the information above:
1. Describe the expected energy, intensity, and physical origin of the pre-edge feature for Nb in this Nb-doped hematite sample.
2. How does the local coordination geometry of the substituted Nb ion compare to the native Fe site in pure hematite, and what structural mechanism drives this difference?
3. What is the oxidation state of Nb in this material, and what specific substitution mechanism maintains charge balance when it incorporates into the hematite lattice?
Ground Truth
Compound: Fe2O3:Nb
Oxidation state: 5+
Measurement: Nb K-edge XAS, fluorescence mode, SAMBA beamline at SOLEIL
Edge position: not reported
Spectral shape: The spectrum exhibits a pre-edge feature (Feature A) at 18982.14 eV with an intensity of 0.215, followed by main edge features B and C.
Labeled peaks:
| Label | Energy (eV) | Intensity | Origin | Source |
|---|---|---|---|---|
| Feature A (pre-edge) | 18982.14 | 0.215 | 1s -> 4d transition (weakly quadrupole-allowed, with intensity influenced by 5p-4d hybridization upon breaking centrosymmetry) | paper_data |
Distinguishing features: The pre-edge intensity (0.215) reflects a relatively regular NbO6 octahedron due to local site symmetrization, unlike the highly distorted Fe site in pure hematite.
Key reasoning: Nb5+ substitutes for Fe3+ in the hematite structure. Charge balance is maintained by substituting 5Fe3+ for 3Nb5+, coupled with the formation of cation vacancies. This structural readjustment induces local relaxation, resulting in the symmetrization of the Nb site and the formation of regular NbO6 octahedra, which contrasts with the highly distorted Fe site in pure hematite.
Reasoning source: Section 4.4.3 (Nb-doped hematite)
Scoring Rubric (total: 100 pts)
| Q | Type | Max | Question | Reference Answer | Scoring Criteria |
|---|---|---|---|---|---|
| q1 | spectral | 30 | Describe the expected energy, intensity, and physical origin of the pre-edge feature for Nb in this Nb-doped hematite sample. | The expected pre-edge feature (Feature A) for this synthetic Nb-doped hematite powder occurs at 18982.14 eV with an intensity of 0.215. The physical origin of this feature is a 1s to 4d electronic transition, which is weakly quadrupole-allowed but gains intensity through 5p-4d hybridization upon the breaking of centrosymmetry. This specific intensity of 0.215 arises because the Nb5+ substitution into the hematite lattice induces local structural relaxation. This relaxation leads to the symmetrization of the Nb site and the formation of a relatively regular NbO6 octahedron, which dictates the observed pre-edge spectral shape and intensity. | Award full points if the response correctly identifies the pre-edge energy (~18982.14 eV), its intensity (~0.215), and attributes its origin to a 1s -> 4d transition. |
| q2 | reasoning | 40 | How does the local coordination geometry of the substituted Nb ion compare to the native Fe site in pure hematite, and what structural mechanism drives this difference? | In this Nb-doped hematite sample, the substituted Nb ion forms a relatively regular NbO6 octahedron, which strongly contrasts with the highly distorted Fe site found in pure hematite. This difference is driven by the structural readjustment required when Nb5+ substitutes for Fe3+ in the face- and edge-sharing octahedral lattice. To maintain charge balance, three Nb5+ ions replace five Fe3+ ions, accompanied by the formation of cation vacancies. This specific substitution mechanism and the resulting vacancies induce local structural relaxation, leading to the symmetrization of the Nb site and the observed regular octahedral geometry. | Award full points if the response explains that the Nb site undergoes symmetrization to form regular NbO6 octahedra (unlike the highly distorted native Fe site) due to structural relaxation driven by the creation of cation vacancies for charge compensation. |
| q3 | reasoning | 30 | What is the oxidation state of Nb in this material, and what specific substitution mechanism maintains charge balance when it incorporates into the hematite lattice? | The oxidation state of Nb in this synthetic Nb-doped hematite powder is 5+. When Nb5+ incorporates into the hematite crystal structure, it substitutes for native Fe3+ ions within the face- and edge-sharing octahedral network. Because of the difference in valence, charge balance is maintained by a specific mechanism where three Nb5+ ions substitute for five Fe3+ ions, coupled with the formation of cation vacancies. This vacancy-driven structural readjustment is necessary to accommodate the highly charged Nb5+ ions, ultimately inducing local relaxation and symmetrization of the resulting NbO6 octahedra. | Award full points if the response identifies the oxidation state as 5+ and explains that charge balance is maintained by substituting 3 Nb5+ ions for 5 Fe3+ ions, creating cation vacancies. |
Review
#1271
FeOOH:Nb
Nb K-edge
▶
LLM Prompt
Sample Information
Material: FeOOH:Nb
Crystal Structure: Chains of edge-sharing FeO6 octahedra (Nb substitutes Fe)
Oxidation State: 5+
Sample Form: powder
Measurement Mode: fluorescence
- Synthetic Nb-doped goethite
Measurement
We plan to measure the Nb K-edge XANES spectrum of this sample.
Questions
Based on all the information above:
1. Describe the expected energy, intensity, and physical origin of the pre-edge feature in the Nb K-edge XANES spectrum of this Nb-doped goethite sample.
2. What is the crystallographic coordination environment of the substituted Nb in this sample, and how does the breaking of centrosymmetry in this environment affect the XANES pre-edge?
3. Based on the pre-edge intensity, what can be inferred about the local site distortion of Nb in goethite compared to other Nb-bearing phases?
Ground Truth
Compound: alpha-FeOOH
Oxidation state: 5+
Measurement: Nb K-edge XANES, fluorescence mode, SAMBA beamline (SOLEIL)
Edge position: not reported
Spectral shape: The spectrum exhibits a pre-edge feature at 18983.17 eV with an intensity of 0.216, reflecting the distortion of the sixfold-coordinated Nb site.
Labeled peaks:
| Label | Energy (eV) | Intensity | Origin | Source |
|---|---|---|---|---|
| Pre-edge feature (A) | 18983.17 | 0.216 | 1s -> 4d transition (with 5p-4d hybridization) | Table 2, Section 4.1 |
Distinguishing features: Moderate pre-edge intensity (0.216) indicating an intermediate degree of Nb site distortion compared to highly distorted sites (e.g., wöhlerite, columbite) or weakly distorted sites (e.g., rutile).
Key reasoning: Nb5+ substitutes for Fe3+ in the goethite structure, which consists of chains of edge-sharing FeO6 octahedra joined by corner-sharing FeO6. The pre-edge feature arises from a weakly quadrupole-allowed 1s -> 4d transition, which gains intensity through 5p-4d hybridization upon breaking centrosymmetry.
Reasoning source: Section 2.2, Section 4.1
Scoring Rubric (total: 100 pts)
| Q | Type | Max | Question | Reference Answer | Scoring Criteria |
|---|---|---|---|---|---|
| q1 | spectral | 40 | Describe the expected energy, intensity, and physical origin of the pre-edge feature in the Nb K-edge XANES spectrum of this Nb-doped goethite sample. | The expected pre-edge feature in the Nb K-edge XANES spectrum of this sample is located at 18983.17 eV with a normalized intensity of 0.216. The physical origin of this feature is a weakly quadrupole-allowed 1s -> 4d electronic transition. Because the sample consists of Nb5+ substituting for Fe3+ in the goethite structure, the Nb occupies a sixfold-coordinated site within chains of edge-sharing octahedra. This specific structural environment breaks centrosymmetry, which allows the pre-edge transition to gain intensity through 5p-4d hybridization. Consequently, these spectral features directly reflect the local distortion of the Nb site dictated by the synthetic Nb-doped goethite host lattice. | Full credit requires identifying the pre-edge energy (~18983.17 eV), the intensity (~0.216), and stating that it originates from a 1s -> 4d transition that gains intensity via 5p-4d hybridization. |
| q2 | reasoning | 30 | What is the crystallographic coordination environment of the substituted Nb in this sample, and how does the breaking of centrosymmetry in this environment affect the XANES pre-edge? | In this synthetic Nb-doped goethite sample, the substituted Nb5+ ions occupy sixfold-coordinated sites by replacing Fe3+ within the alpha-FeOOH crystal structure. This host structure consists of chains of edge-sharing FeO6 octahedra that are joined by corner-sharing FeO6 units. Because Nb substitutes into these specific octahedral sites, the local coordination environment lacks perfect centrosymmetry. This breaking of centrosymmetry is crucial because it promotes 5p-4d orbital hybridization at the absorbing atom. As a result of this hybridization dictated by the host structure, the normally weak, quadrupole-allowed 1s -> 4d transition gains intensity, producing the distinct pre-edge feature observed in the XANES spectrum. | Full credit requires mentioning that Nb5+ substitutes for Fe3+ in sixfold coordination within chains of edge-sharing FeO6 octahedra (joined by corner-sharing), and that breaking centrosymmetry allows dipolar 1s -> 5p-4d transitions, dramatically influencing the pre-edge intensity. |
| q3 | interpretation | 30 | Based on the pre-edge intensity, what can be inferred about the local site distortion of Nb in goethite compared to other Nb-bearing phases? | Based on the measured pre-edge intensity of 0.216, it can be inferred that the Nb site in goethite exhibits an intermediate degree of local distortion. This moderate distortion level contrasts with highly distorted sites found in phases like wöhlerite or columbite, and weakly distorted sites like those in rutile. This specific degree of distortion arises because Nb5+ substitutes for Fe3+ within the goethite structure's chains of edge-sharing FeO6 octahedra. The resulting structural geometry breaks centrosymmetry just enough to cause moderate 5p-4d hybridization. Therefore, the intermediate pre-edge intensity directly reflects the unique structural constraints and resulting electronic hybridization imposed on the sixfold-coordinated Nb5+ ion by the host lattice. | Full credit requires stating that the moderate pre-edge intensity (0.216) indicates an intermediate degree of local Nb site distortion, lower than highly distorted sites (like wöhlerite or columbite) but higher than weakly distorted sites (like rutile). |
Review
#1272
(H2O,[])Nb2(O,OH)6(H2O)
Nb K-edge
▶
LLM Prompt
Sample Information
Material: (H2O,[])Nb2(O,OH)6(H2O)
Crystal Structure: Corner-sharing NbO6 octahedra
Oxidation State: 5+
Sample Form: cellulose-diluted pellet
Measurement Mode: transmission
- Natural hydropyrochlore mineral reference
Measurement
We plan to measure the Nb K-edge XANES spectrum of this sample.
Questions
Based on all the information above:
1. Describe the expected characteristics of the pre-edge feature (energy and intensity) for this hydropyrochlore sample and explain what these characteristics indicate about the local Nb site geometry.
2. What electronic transitions give rise to the pre-edge feature (Feature A) and the shoulder on the rising edge (Feature B) in the Nb K-edge XANES spectrum of this material?
3. How does the position of the main resonance peak (Feature C) in the XANES spectrum of this sample compare to other Nb minerals, and what structural parameter does this position reflect?
Ground Truth
Compound: (H2O,[])Nb2(O,OH)6(H2O)
Oxidation state: 5+
Measurement: Nb K-edge XANES in transmission mode at 20 K (SAMBA beamline, SOLEIL)
Edge position: not reported
Spectral shape: The spectrum exhibits a low-intensity pre-edge feature (A) at higher energy, a B feature on the rising edge, and a main resonance C feature shifted to higher energies.
Labeled peaks:
| Label | Energy (eV) | Intensity | Origin | Source |
|---|---|---|---|---|
| Feature A (pre-edge) | 18984.00 | 0.226 | 1s -> 4d transition (with 5p-4d hybridization upon breaking centrosymmetry) | Table 2 and Section 4.1 |
| Feature B | ~18999 | not explicitly quantified | 1s -> 4p transition | Section 4.1 |
| Feature C | shifted towards higher energies (in the 19010-19022 eV range) | not explicitly quantified | transition to higher-energy np states, shape resonance, and multiple scattering | Section 4.1 |
Distinguishing features: Lower intensity (0.226) and higher energy (18984.00 eV) of the pre-edge feature compared to most other Nb minerals, indicating lower Nb site distortion. The C feature is shifted to higher energies reflecting short Nb-O distances.
Key reasoning: The pre-edge feature of hydropyrochlore is located at 18984.00 eV with an intensity of 0.226. This relatively low intensity and higher energy position compared to most other Nb minerals indicate a lower degree of distortion of the Nb site. The C feature is shifted towards higher energies, reflecting the short Nb-O distances typical of pyrochlores.
Reasoning source: Section 4.1
Scoring Rubric (total: 100 pts)
| Q | Type | Max | Question | Reference Answer | Scoring Criteria |
|---|---|---|---|---|---|
| q1 | spectral | 35 | Describe the expected characteristics of the pre-edge feature (energy and intensity) for this hydropyrochlore sample and explain what these characteristics indicate about the local Nb site geometry. | The pre-edge feature (Feature A) for this hydropyrochlore sample is expected to be located at 18984.00 eV with a relatively low intensity of 0.226. Because the sample consists of a natural hydropyrochlore mineral with corner-sharing NbO6 octahedra, this specific energy and intensity profile arises directly from its local geometry. Specifically, the relatively low intensity and higher energy position compared to most other Nb minerals indicate a lower degree of distortion within the NbO6 octahedral site. This lower distortion limits the extent of 5p-4d hybridization that occurs upon breaking centrosymmetry, resulting in the observed weak pre-edge intensity. | Full points if the answer mentions a low-intensity pre-edge (0.226) at a relatively high energy (18984.00 eV) and correctly attributes this to a lower degree of distortion of the Nb site. |
| q2 | reasoning | 35 | What electronic transitions give rise to the pre-edge feature (Feature A) and the shoulder on the rising edge (Feature B) in the Nb K-edge XANES spectrum of this material? | In the Nb K-edge XANES spectrum of this hydropyrochlore sample, the pre-edge feature (Feature A) originates from the 1s → 4d electronic transition. Because the Nb5+ ions are situated in corner-sharing NbO6 octahedra, any breaking of centrosymmetry in this local geometry allows for 5p-4d orbital hybridization, which weakly allows this otherwise forbidden transition. Meanwhile, the shoulder on the rising edge (Feature B) at approximately 18999 eV is attributed to the dipole-allowed 1s → 4p electronic transition. These specific transitions are characteristic of the Nb5+ oxidation state and the specific octahedral coordination environment present in the sample. | Full points if the answer identifies the pre-edge (Feature A) as a 1s -> 4d transition (with possible 5p-4d hybridization) and Feature B as a 1s -> 4p transition. |
| q3 | spectral | 30 | How does the position of the main resonance peak (Feature C) in the XANES spectrum of this sample compare to other Nb minerals, and what structural parameter does this position reflect? | The main resonance peak (Feature C) in the XANES spectrum of this sample is shifted towards higher energies (in the 19010-19022 eV range) compared to most other Nb minerals. This shift arises directly from the structural characteristics of the natural hydropyrochlore mineral, specifically reflecting the short Nb-O distances typical of pyrochlores. Because the sample consists of a (H2O,[])Nb2(O,OH)6(H2O) framework with corner-sharing NbO6 octahedra, these short interatomic distances strongly influence the multiple scattering and shape resonances of the photoelectron. Consequently, the transition to higher-energy np states is pushed to a higher energy position, serving as a direct spectral indicator of the compact local Nb-O coordination environment. | Full points if the answer states that the C feature is shifted towards higher energies, which reflects the short Nb-O distances characteristic of pyrochlores. |
Review
#1273
([],Ba)Nb2O6
Nb K-edge
▶
LLM Prompt
Sample Information
Material: ([],Ba)Nb2O6
Crystal Structure: Corner-sharing NbO6 octahedra
Oxidation State: 5+
Sample Form: cellulose-diluted pellet
Measurement Mode: transmission
- Natural Ba-rich kenopyrochlore mineral reference
Measurement
We plan to measure the Nb K-edge XANES spectrum of this sample.
Questions
Based on all the information above:
1. Describe the expected spectral shape and key features (pre-edge and post-edge features) for the Nb K-edge XANES spectrum of Ba-rich kenopyrochlore. What do the position and intensity of these features indicate about the local Nb structural environment?
2. What specific electronic transitions are responsible for the pre-edge feature (Feature A) and the main edge shoulder (Feature B) in the Nb K-edge XANES spectrum of this material?
3. How does the XANES spectrum of this pyrochlore-group mineral distinguish itself from other Nb minerals that possess highly distorted Nb sites?
Ground Truth
Compound: ([],Ba)Nb2O6
Oxidation state: 5+
Measurement: Nb K-edge XANES in transmission mode at SAMBA beamline (SOLEIL)
Edge position: not reported
Spectral shape: The spectrum displays three distinct features: a low-intensity pre-edge (A) at higher energy, a B feature, and a C feature shifted to higher energies reflecting short Nb-O distances.
Labeled peaks:
| Label | Energy (eV) | Intensity | Origin | Source |
|---|---|---|---|---|
| Feature A (pre-edge) | 18983.67 | 0.214 | 1s -> 4d transition (weakly quadrupole-allowed, gains intensity via 5p-4d hybridization upon breaking centrosymmetry) | paper_data |
| Feature B | ~18999 | not reported | 1s -> 4p transition | paper_data |
| Feature C | ~19012 (shifted to higher energy) | not reported | transition to higher-energy np states, shape resonance, and multiple scattering | paper_data |
Distinguishing features: Lower intensity (0.214) and higher energy (18983.67 eV) of the pre-edge feature compared to non-pyrochlore Nb minerals, indicating a lower degree of Nb site distortion. The C feature is shifted to higher energies due to shorter Nb-O distances.
Key reasoning: The Nb K-edge XANES spectrum of Ba-rich kenopyrochlore exhibits a pre-edge feature of relatively low intensity (0.214) at higher energy (18983.67 eV) compared to other Nb minerals, indicating a lower degree of distortion of the Nb site. The C feature is shifted towards higher energies, which correlates with the shorter Nb-O distances typical of pyrochlores.
Reasoning source: Section 4.1 (Relationship between niobium site geometry and K-edge XANES spectroscopic properties)
Scoring Rubric (total: 100 pts)
| Q | Type | Max | Question | Reference Answer | Scoring Criteria |
|---|---|---|---|---|---|
| q1 | spectral | 40 | Describe the expected spectral shape and key features (pre-edge and post-edge features) for the Nb K-edge XANES spectrum of Ba-rich kenopyrochlore. What do the position and intensity of these features indicate about the local Nb structural environment? | The expected Nb K-edge XANES spectrum for the ([],Ba)Nb2O6 sample displays three distinct features: a pre-edge (Feature A) at 18983.67 eV, a main edge shoulder (Feature B) at ~18999 eV, and a post-edge peak (Feature C) at ~19012 eV. Because the sample consists of a natural Ba-rich kenopyrochlore with corner-sharing NbO6 octahedra, the local structural environment directly dictates these spectral characteristics. Specifically, the relatively low intensity (0.214) and higher energy of the pre-edge feature arise from a lower degree of distortion in the Nb site of this mineral. Furthermore, the post-edge Feature C is shifted towards higher energies, which is a direct consequence of the shorter Nb-O distances typical of this pyrochlore structure. | Full credit requires mentioning the three main features (A, B, C), noting the low intensity and higher energy of the pre-edge (indicating low Nb site distortion), and the shift of the C feature to higher energies (indicating shorter Nb-O distances). |
| q2 | reasoning | 30 | What specific electronic transitions are responsible for the pre-edge feature (Feature A) and the main edge shoulder (Feature B) in the Nb K-edge XANES spectrum of this material? | In the Nb K-edge XANES spectrum of this ([],Ba)Nb2O6 sample, the pre-edge feature (Feature A) originates from a 1s to 4d electronic transition. This transition is weakly quadrupole-allowed but gains its observed intensity (0.214) through 5p-4d orbital hybridization that occurs when the centrosymmetry of the corner-sharing NbO6 octahedra is broken. The main edge shoulder (Feature B) at ~18999 eV is attributed to the dipole-allowed 1s to 4p electronic transition. These specific transitions and their resulting intensities are expected because the Nb5+ ions in the Ba-rich kenopyrochlore structure possess a specific, less-distorted octahedral geometry that governs the degree of orbital mixing. | Full credit requires identifying the pre-edge as a 1s -> 4d transition (and mentioning 5p-4d hybridization upon breaking centrosymmetry) and Feature B as a 1s -> 4p transition. |
| q3 | reasoning | 30 | How does the XANES spectrum of this pyrochlore-group mineral distinguish itself from other Nb minerals that possess highly distorted Nb sites? | The XANES spectrum of this Ba-rich kenopyrochlore distinguishes itself from highly distorted Nb minerals primarily through the characteristics of its pre-edge (Feature A) and post-edge (Feature C). Because the ([],Ba)Nb2O6 sample features corner-sharing NbO6 octahedra with a lower degree of structural distortion, its pre-edge feature exhibits a relatively low intensity (0.214) and appears at a higher energy (18983.67 eV) compared to more distorted non-pyrochlore Nb minerals. Additionally, the post-edge Feature C is shifted to higher energies (~19012 eV). This shift occurs because the specific pyrochlore composition and structure of the sample result in shorter Nb-O distances, which directly modifies the shape resonance and multiple scattering effects in the spectrum. | Full credit requires stating that the pre-edge feature has a lower intensity and is located at a higher energy compared to minerals with highly distorted Nb sites, and that the C feature is shifted to higher energies. |
Review
#1274
(Y,Ln,Ca,Th)(Ti,Nb)2(O,OH)6
Nb K-edge
▶
LLM Prompt
Sample Information
Material: (Y,Ln,Ca,Th)(Ti,Nb)2(O,OH)6
Crystal Structure: Corner- and edge-sharing NbO6
Oxidation State: 5+
Sample Form: cellulose-diluted pellet
Measurement Mode: transmission
- Natural aeschynite-(Y) mineral reference
Measurement
We plan to measure the Nb K-edge XANES spectrum of this sample.
Questions
Based on all the information above:
1. Describe the expected spectral shape of the Nb K-edge XANES for natural aeschynite-(Y), specifically focusing on the characteristics of the pre-edge and post-edge features.
2. What structural phenomenon explains the intense pre-edge feature and the broad, weak post-edge observed in the aeschynite-(Y) spectrum, and how does it affect the local atomic environment?
3. What electronic transitions are responsible for the pre-edge feature (Feature A) and the post-edge feature (Feature C) in the Nb K-edge XANES spectrum of this mineral?
Ground Truth
Compound: (Y,Ln,Ca,Th)(Ti,Nb)2(O,OH)6
Oxidation state: 5+
Measurement: Nb K-edge XANES in transmission mode
Edge position: not reported
Spectral shape: The spectrum shows an intense pre-edge feature and a broad, weak C feature.
Labeled peaks:
| Label | Energy (eV) | Intensity | Origin | Source |
|---|---|---|---|---|
| Feature A (pre-edge) | 18982.79 | 0.229 | 1s -> 4d transition | paper_data |
| Feature C | not reported | weak | transition to higher-energy np states | paper_data |
Distinguishing features: Intense pre-edge feature and broad, weak post-edge features characteristic of metamictization (loss of long-range periodicity and disruption of local symmetry).
Key reasoning: The spectrum of aeschynite-(Y) exhibits a broad and weak C feature, indicating a broad distribution of Nb-O bond lengths and the loss of long-range periodicity. This, along with its intense pre-edge feature (0.229 at 18982.79 eV), reflects the metamictization of the aeschynite-(Y) structure, which is common in these radionuclide-rich phases.
Reasoning source: Section 4.1 (Relationship between niobium site geometry and K-edge XANES spectroscopic properties)
Scoring Rubric (total: 100 pts)
| Q | Type | Max | Question | Reference Answer | Scoring Criteria |
|---|---|---|---|---|---|
| q1 | prediction | 30 | Describe the expected spectral shape of the Nb K-edge XANES for natural aeschynite-(Y), specifically focusing on the characteristics of the pre-edge and post-edge features. | The expected Nb K-edge XANES spectrum for natural aeschynite-(Y) will exhibit an intense pre-edge feature (Feature A) at 18982.79 eV with an intensity of 0.229, alongside a broad and weak post-edge feature (Feature C). This specific spectral shape arises because the sample is a natural, radionuclide-rich mineral containing Th, which induces metamictization over time. This radiation-induced damage causes a loss of long-range periodicity and disrupts the local symmetry of the corner- and edge-sharing NbO6 octahedra. Consequently, the resulting broad distribution of Nb-O bond lengths dampens the post-edge features and intensifies the pre-edge peak. | Award full points if the response correctly identifies an intense pre-edge feature (around 18982.8 eV) and a broad, weak post-edge (Feature C). |
| q2 | reasoning | 40 | What structural phenomenon explains the intense pre-edge feature and the broad, weak post-edge observed in the aeschynite-(Y) spectrum, and how does it affect the local atomic environment? | The structural phenomenon responsible for these spectral features is metamictization, which is common in radionuclide-rich phases like this Th-containing mineral. Because the (Y,Ln,Ca,Th)(Ti,Nb)2(O,OH)6 sample contains radioactive thorium, it undergoes radiation damage that leads to the loss of long-range periodicity. This metamictization disrupts the local symmetry of the corner- and edge-sharing NbO6 network, creating a broad distribution of Nb-O bond lengths. This highly disordered local atomic environment directly causes the intense pre-edge feature and the broad, weak post-edge C feature observed in the spectrum. | Award full points if the response attributes the spectral features to metamictization (radiation damage from radionuclides like Th), which causes a loss of long-range periodicity, disruption of local symmetry, and a broad distribution of Nb-O bond lengths. |
| q3 | spectral | 30 | What electronic transitions are responsible for the pre-edge feature (Feature A) and the post-edge feature (Feature C) in the Nb K-edge XANES spectrum of this mineral? | In the Nb K-edge XANES spectrum of this mineral, the pre-edge feature (Feature A) originates from the 1s to 4d electronic transition, while the post-edge feature (Feature C) is caused by transitions to higher-energy np states. These specific transitions manifest with distinct intensities—an intense pre-edge and a weak, broad post-edge—due to the sample's composition as a radionuclide-rich (Th-containing) phase. The resulting metamictization disrupts the local symmetry of the Nb5+ in its corner- and edge-sharing NbO6 coordination environment. This loss of long-range periodicity and broad distribution of Nb-O bond lengths enhances the 1s to 4d transition while smearing out the higher-energy np transitions. | Award full points if the response correctly assigns the pre-edge feature to a 1s -> 4d transition and the post-edge feature (Feature C) to transitions to higher-energy np states. |
Review
Size-Controlled Synthesis of Rhodium Nanocatalysts and Applications in Low-Temperature Hydroformylation
BNL-NSLS-II-8-ID
Catalyst
Andrew Lamkins et al.
DOI: 10.53941/mi.2025.100001
3 scenarios
▶
#1275
Rh
Rh K-edge
▶
LLM Prompt
Sample Information
Material: Rh
Support: SBA-15
Reaction Conditions: Room temperature
Sample-Specific Conditions
- particle size: 1.6 nm
- SBA-15 supported Rh nanoparticles with 1.6 nm average size
Measurement
We plan to measure the Rh K-edge XANES spectrum of this sample.
Questions
Based on all the information above:
1. What candidate reference spectra are needed to model the Rh K-edge XANES spectrum of this sample using Linear Combination Fitting (LCF)?
2. Estimate the phase fractions of metallic Rh and oxidized Rh (Rh3+) in this 1.6 nm Rh/SBA-15 sample after exposure to air.
3. Explain the physical reasoning for the expected phase composition of this 1.6 nm Rh nanoparticle sample upon exposure to air. Why does it reach this specific degree of oxidation?
Ground Truth
Material: Rh
Measurement: Rh K-edge, fluorescence mode, beamline 8-ID ISS at National Synchrotron Light Source II
Fit method: Linear Combination Fitting (LCF)
Phase fractions:
| Phase | Fraction |
|---|---|
| Rh2O3 | 0.69 |
| metallic Rh | 0.31 |
Fit basis (paper's reference spectra):
- Rh foil
- Rh2O3
Source evidence: Table 2, page 6
Key reasoning: The 1.6 nm Rh nanoparticles have a very high proportion of surface atoms, corresponding to a measured dispersion of 70%. Because surface atoms are easily oxidized upon exposure to air, a large fraction of the metallic Rh is converted to Rh3+. The resulting fraction of oxidized Rh (69%) closely matches the dispersion of the catalyst.
Reasoning source: Section 3, page 7
Scoring Rubric (total: 100 pts)
| Q | Type | Max | Question | Reference Answer | Scoring Criteria |
|---|---|---|---|---|---|
| q1 | identification | 20 | What candidate reference spectra are needed to model the Rh K-edge XANES spectrum of this sample using Linear Combination Fitting (LCF)? | The candidate reference spectra needed to model the Rh K-edge XANES spectrum of this sample using Linear Combination Fitting (LCF) are Rh foil (metallic Rh) and Rh2O3. These specific references are required because the sample consists of 1.6 nm Rh nanoparticles supported on SBA-15 at room temperature, which possess a very high proportion of surface atoms corresponding to a 70% dispersion. Upon exposure to air, these highly dispersed surface atoms are easily oxidized to Rh3+, while the core atoms remain metallic. Therefore, a combination of metallic Rh and oxidized Rh (Rh2O3) references is necessary to accurately capture the mixed-phase nature of these small nanoparticles. | Full points for identifying metallic Rh (or Rh foil) and Rh2O3 as the necessary reference spectra. |
| q2 | quantification | 40 | Estimate the phase fractions of metallic Rh and oxidized Rh (Rh3+) in this 1.6 nm Rh/SBA-15 sample after exposure to air. | The estimated phase fractions for this sample are 0.69 (69%) oxidized Rh (Rh2O3) and 0.31 (31%) metallic Rh. These specific values result directly from the 1.6 nm average particle size of the Rh nanoparticles on the SBA-15 support. At this small size, the nanoparticles have a measured dispersion of 70%, meaning a very high proportion of the atoms are located on the surface. Because surface atoms are easily oxidized upon exposure to air at room temperature, the resulting 69% fraction of oxidized Rh closely matches the 70% surface dispersion of the catalyst, leaving the remaining 31% as the unoxidized metallic core. | Full points for estimating ~69% Rh2O3 (or oxidized Rh) and ~31% metallic Rh. Partial credit for recognizing that the sample is predominantly oxidized (>50% oxide). |
| q3 | reasoning | 40 | Explain the physical reasoning for the expected phase composition of this 1.6 nm Rh nanoparticle sample upon exposure to air. Why does it reach this specific degree of oxidation? | The expected phase composition of 69% Rh2O3 and 31% metallic Rh is physically driven by the 1.6 nm size of the Rh nanoparticles supported on SBA-15. At this extremely small size, the nanoparticles exhibit a very high proportion of surface atoms, which corresponds to a measured dispersion of 70%. When the sample is exposed to air at room temperature, these exposed surface atoms are easily oxidized, converting a large fraction of the metallic Rh into Rh3+. The oxidation is primarily limited to these surface sites, which explains why the resulting degree of oxidation (69%) so closely matches the 70% dispersion of the catalyst, while the protected core atoms remain metallic. | Full points for explaining that the small particle size (1.6 nm) leads to a high proportion of surface atoms (high dispersion), which are readily oxidized in air, resulting in an oxide fraction that closely matches the surface dispersion (~70%). |
Review
#1276
Rh
Rh K-edge
▶
LLM Prompt
Sample Information
Material: Rh
Support: SBA-15
Reaction Conditions: Room temperature
Sample-Specific Conditions
- particle size: 3.2 nm
- SBA-15 supported Rh nanoparticles with 3.2 nm average size
Measurement
We plan to measure the Rh K-edge XANES spectrum of this sample.
Questions
Based on all the information above:
1. What candidate reference spectra are needed to model the Rh K-edge XANES of this air-exposed 3.2 nm Rh nanoparticle sample using linear combination fitting?
2. Estimate the phase fractions of metallic Rh and oxidized Rh in this sample. Provide specific percentages.
3. Explain the physical reasoning for the observed phase composition. Why is the sample partially oxidized, and how does the oxidized fraction relate to the physical properties of the 3.2 nm nanoparticles?
Ground Truth
Material: Rh
Measurement: Rh K-edge, fluorescence mode, beamline 8-ID ISS at National Synchrotron Light Source II
Fit method: Linear Combination Fitting (LCF)
Phase fractions:
| Phase | Fraction |
|---|---|
| Rh2O3 | 0.37 |
| metallic Rh | 0.63 |
Fit basis (paper's reference spectra):
- Rh foil
- Rh2O3
Source evidence: Table 2 and Figure 3a, Page 6
Key reasoning: The XANES energy of Rh-3.2/SBA-15 is 23.2200 keV, very close to the Rh foil, indicating a high fraction of metallic Rh. However, there is a slight increase in the white line intensity compared to the foil, indicating partially oxidized Rh NPs. The fraction of oxidized Rh (37%) is close to the measured dispersion for this catalyst (30%), suggesting that the surface atoms of the nanoparticles oxidize rapidly upon exposure to air.
Reasoning source: Section 3 (Results and Discussion), Pages 6-7
Scoring Rubric (total: 101 pts)
| Q | Type | Max | Question | Reference Answer | Scoring Criteria |
|---|---|---|---|---|---|
| q1 | identification | 25 | What candidate reference spectra are needed to model the Rh K-edge XANES of this air-exposed 3.2 nm Rh nanoparticle sample using linear combination fitting? | The candidate reference spectra needed to model the Rh K-edge XANES using linear combination fitting are Rh foil (metallic Rh) and Rh2O3. These specific references are required because the 3.2 nm Rh nanoparticles supported on SBA-15 at room temperature consist of a metallic core with an oxidized surface. The sample's XANES energy of 23.2200 keV closely matches the metallic Rh foil, while a slight increase in the white line intensity indicates partial oxidation. This dual-phase composition arises because the surface atoms of the 3.2 nm nanoparticles oxidize rapidly upon exposure to air, necessitating both metallic and oxide standards. | Full credit for identifying metallic Rh (or Rh foil) and Rh2O3 (or Rh3+ oxide) as the necessary reference spectra. |
| q2 | quantification | 38 | Estimate the phase fractions of metallic Rh and oxidized Rh in this sample. Provide specific percentages. | The estimated phase fractions for this sample are 63% metallic Rh and 37% oxidized Rh (Rh2O3). These specific values result directly from the physical properties of the 3.2 nm Rh nanoparticles supported on SBA-15 at room temperature. The 37% oxidized fraction closely matches the measured 30% dispersion for this specific catalyst size. This relationship demonstrates that the 63% metallic fraction corresponds to the unoxidized core of the nanoparticles, while the 37% oxide fraction represents the surface atoms that rapidly oxidize upon exposure to air. | Full credit for estimating ~63% metallic Rh and ~37% Rh2O3 (accept within ±10% margin). |
| q3 | reasoning | 38 | Explain the physical reasoning for the observed phase composition. Why is the sample partially oxidized, and how does the oxidized fraction relate to the physical properties of the 3.2 nm nanoparticles? | The observed phase composition of 63% metallic Rh and 37% oxidized Rh is a direct consequence of the 3.2 nm particle size of the SBA-15 supported catalyst. At room temperature, the surface atoms of these nanoparticles oxidize rapidly upon exposure to air, leaving the core metallic. This physical structure is evidenced by the XANES data, where the edge energy (23.2200 keV) indicates a highly metallic core, but an increased white line intensity confirms partial oxidation. The 37% oxidized fraction closely correlates with the measured 30% dispersion of the 3.2 nm nanoparticles, confirming that the oxidation is primarily restricted to the exposed surface atoms. | Full credit for explaining that the nanoparticles oxidize rapidly upon exposure to air, and that the oxidized fraction (~37%) closely corresponds to the fraction of surface-exposed atoms (dispersion) for this specific particle size. |
Review
#1277
Rh
Rh K-edge
▶
LLM Prompt
Sample Information
Material: Rh
Support: SBA-15
Reaction Conditions: Room temperature
Sample-Specific Conditions
- particle size: 6.4 nm
- SBA-15 supported Rh nanoparticles with 6.4 nm average size
Measurement
We plan to measure the Rh K-edge XANES spectrum of this sample.
Questions
Based on all the information above:
1. Based on the sample conditions (6.4 nm Rh nanoparticles on SBA-15), what is the dominant phase expected in the bulk XANES analysis, and what reference spectra should be included in a Linear Combination Fitting (LCF) model?
2. Explain why this 6.4 nm Rh nanoparticle sample shows predominantly metallic character in its XANES spectrum despite being exposed to air, and contrast this with what would be expected for much smaller Rh nanoparticles.
3. Describe the expected XANES spectral shape and edge position for this Rh-6.4/SBA-15 sample. How does its white line intensity compare to that of smaller Rh nanoparticles?
Ground Truth
Material: Rh
Measurement: Rh K-edge fluorescence mode at beamline 8-ID ISS
Fit method: LCF
Phase fractions:
| Phase | Fraction |
|---|---|
| metallic Rh | 1.0 |
| Rh2O3 | 0.0 |
Fit basis (paper's reference spectra):
- Rh foil
- Rh2O3
Source evidence: Page 6, Figure 3a, Table 2
Key reasoning: The XANES energy of the 6.4 nm particles is 23.2200 keV, which is very close to the Rh foil at 23.2208 keV, indicating a high fraction of metallic Rh. Because these are larger particles, they have a lower proportion of surface atoms compared to smaller nanoparticles. Consequently, the fraction of oxidized Rh formed upon exposure to air is too small to detect by bulk XANES, leaving the spectrum nearly identical to metallic Rh foil.
Reasoning source: Page 6, Section 3 (Results and Discussion), paragraph 2 and Page 7, paragraph 1
Scoring Rubric (total: 100 pts)
| Q | Type | Max | Question | Reference Answer | Scoring Criteria |
|---|---|---|---|---|---|
| q1 | identification | 31 | Based on the sample conditions (6.4 nm Rh nanoparticles on SBA-15), what is the dominant phase expected in the bulk XANES analysis, and what reference spectra should be included in a Linear Combination Fitting (LCF) model? | The dominant phase expected in the bulk XANES analysis of the 6.4 nm Rh/SBA-15 sample is metallic Rh (oxidation state 0), with a fitted fraction of 1.0. The reference spectra that should be included in the Linear Combination Fitting (LCF) model are Rh foil and Rh2O3. This purely metallic bulk composition is identified because the sample's XANES energy is 23.2200 keV, which is very close to the Rh foil reference at 23.2208 keV. Furthermore, because the 6.4 nm nanoparticles are relatively large, they possess a lower proportion of surface atoms compared to smaller particles. Consequently, any oxidized Rh that forms upon room-temperature air exposure is too small of a fraction to detect by bulk XANES, leaving the spectrum identical to metallic Rh. | Full points for identifying metallic Rh (or Rh0) as the dominant phase (~100%) and listing Rh foil and Rh2O3 as the necessary reference spectra for the LCF model. |
| q2 | reasoning | 38 | Explain why this 6.4 nm Rh nanoparticle sample shows predominantly metallic character in its XANES spectrum despite being exposed to air, and contrast this with what would be expected for much smaller Rh nanoparticles. | The 6.4 nm Rh nanoparticle sample shows predominantly metallic character (1.0 metallic Rh, 0.0 Rh2O3) because its relatively large particle size results in a lower proportion of surface atoms. When exposed to air at room temperature, only the surface atoms oxidize, and this oxidized fraction is too small to be detected by bulk XANES measurements. Therefore, the overall bulk signal remains nearly identical to metallic Rh foil. In contrast, much smaller Rh nanoparticles (such as 1.6 nm or 3.2 nm) have a significantly higher proportion of surface atoms. As a result, these smaller particles would exhibit a detectable fraction of oxidized Rh and a corresponding increase in white line intensity due to this partial oxidation. | Full points for explaining that larger particles (6.4 nm) have a lower proportion of surface atoms, meaning the fraction of oxidized Rh formed in air is too small to detect in bulk XANES. Must mention that smaller nanoparticles would have a higher proportion of surface atoms and thus show a larger, detectable fraction of oxidized Rh. |
| q3 | spectral | 31 | Describe the expected XANES spectral shape and edge position for this Rh-6.4/SBA-15 sample. How does its white line intensity compare to that of smaller Rh nanoparticles? | The expected XANES spectral shape for the 6.4 nm Rh/SBA-15 sample is nearly identical to the metallic Rh foil reference, with an edge position at 23220.0 eV. The white line intensity is low, directly matching that of the Rh foil. These spectral features occur because the 6.4 nm nanoparticles are large enough that their surface-to-volume ratio is low, making any room-temperature surface oxidation undetectable in the bulk XANES signal. Consequently, the spectrum lacks the slight increase in white line intensity (the first peak in the XANES spectrum) that is characteristically observed in smaller, partially oxidized Rh nanoparticles like the 3.2 nm or 1.6 nm sizes. | Full points for stating the edge position is around 23.2200 keV (or 23220 eV), the overall shape is nearly identical to Rh foil, and it lacks the increased white line intensity seen in smaller, more oxidized nanoparticles. |
Review
Sorption model for yttrium in fluorapatite: Geochemical implications
ESRF-BM23
Environmental
C. Bonnet et al.
DOI: 10.7185/geochemlet.2326
2 scenarios
▶
#1278
sedimentary phosphorite
Y K
▶
LLM Prompt
Sample Information
Material: sedimentary phosphorite
Sample Origin: Morocco
Sample-Specific Conditions
- Origin: Sedimentary
- Sedimentary fluorapatite
Measurement
We plan to measure the Y K XANES spectrum of this sample.
Questions
Based on all the information above:
1. What candidate reference spectra (endmembers) are required to model the Y K-edge XANES and EXAFS spectra of this sedimentary fluorapatite using linear combination fitting?
2. Estimate the relative phase fractions of the different yttrium speciation modes (substituted vs. adsorbed) in this sedimentary phosphorite sample.
Ground Truth
Material: sedimentary phosphorite (B-type carbonated fluorapatite)
Measurement: Y K-edge XANES and EXAFS at ESRF
Fit method: Linear combination fit (LCF)
Phase fractions:
| Phase | Fraction |
|---|---|
| Y substituted at Ca(2) site | 0.59 |
| Y adsorbed on FAp | 0.41 |
Fit basis (paper's reference spectra):
- H-FAp (hydrothermal fluorapatite, representing Y substituted at Ca(2) site)
- Y-ads (synthetic Y-adsorbed fluorapatite)
Source evidence: Figure 1 caption and Section 'Yttrium Speciation in Sedimentary Fluorapatite' (page 3)
Key reasoning: The XANES spectrum of sedimentary fluorapatite (S-FAp) exhibits an intermediate white line intensity (feature I) compared to the purely substituted (H-FAp) and purely adsorbed (Y-ads) endmembers. Linear combination fitting confirms this intermediate nature, suggesting a mixture of Y substituted at the Ca(2) site and Y adsorbed as an inner shell complex in the c axis channel. This mixed speciation is consistent with the nano-crystallinity typically observed in sedimentary deposits, which favors adsorption mechanisms alongside substitution.
Reasoning source: Section 'Yttrium Speciation in Sedimentary Fluorapatite' (page 3) and Figure 1 caption
Scoring Rubric (total: 100 pts)
| Q | Type | Max | Question | Reference Answer | Scoring Criteria |
|---|---|---|---|---|---|
| q1 | identification | 42 | What candidate reference spectra (endmembers) are required to model the Y K-edge XANES and EXAFS spectra of this sedimentary fluorapatite using linear combination fitting? | To model the Y K-edge XANES and EXAFS spectra of this sedimentary fluorapatite, the required reference spectra are H-FAp (hydrothermal fluorapatite) and Y-ads (synthetic Y-adsorbed fluorapatite). These specific endmembers are necessary because the sample's spectrum exhibits an intermediate white line intensity, indicating a mixture of Y substituted at the Ca(2) site (represented by H-FAp) and Y adsorbed as an inner shell complex in the c-axis channel (represented by Y-ads). This mixed speciation arises directly from the sample's sedimentary origin, as sedimentary deposits typically exhibit nano-crystallinity that provides high surface area, thereby favoring adsorption mechanisms alongside structural substitution. | Full credit for identifying a substituted fluorapatite reference (e.g., hydrothermal FAp representing Y at the Ca(2) site) and an adsorbed yttrium reference (e.g., synthetic Y-adsorbed FAp). |
| q2 | quantification | 58 | Estimate the relative phase fractions of the different yttrium speciation modes (substituted vs. adsorbed) in this sedimentary phosphorite sample. | The relative phase fractions for this sedimentary phosphorite sample are 0.59 for Y substituted at the Ca(2) site and 0.41 for Y adsorbed on the fluorapatite. These specific values are derived from linear combination fitting of the sample's intermediate white line intensity, which falls between purely substituted and purely adsorbed endmembers. This significant fraction of adsorbed yttrium (41%) alongside substituted yttrium (59%) is expected given the sample's sedimentary origin. The nano-crystallinity typically observed in such sedimentary deposits creates conditions that strongly favor surface adsorption mechanisms in the c-axis channel alongside standard structural substitution. | Full credit for estimating approximately 60% Y substituted at the Ca(2) site and 40% Y adsorbed on the fluorapatite (accepting values within +/- 10% of the 59/41 split). |
Review
#1279
hydrothermal fluorapatite
Y K
▶
LLM Prompt
Sample Information
Material: hydrothermal fluorapatite
Sample Origin: Durango, Mexico
Sample-Specific Conditions
- Origin: Hydrothermal
- Hydrothermal fluorapatite
Measurement
We plan to measure the Y K XANES spectrum of this sample.
Questions
Based on all the information above:
1. Based on the hydrothermal origin of this fluorapatite, what is the dominant yttrium speciation (phase/site), and what structural evidence from the local atomic environment supports this assignment?
2. Describe the expected relative intensity of the white line (Feature I) for this hydrothermal fluorapatite compared to yttrium adsorbed on fluorapatite (Y-ads).
3. Why is the hypothesis of a coupled substitution involving a second heavy trivalent cation plus a vacancy (e.g., 2REE3+ + vacancy = 3Ca2+) rejected for this specific hydrothermal sample?
Ground Truth
Material: hydrothermal fluorapatite (H-FAp)
Measurement: Y K-edge XANES and EXAFS
Fit method: EXAFS shell fitting and wavelet analysis
Phase fractions:
| Phase | Fraction |
|---|---|
| Y substituted at Ca(2) site | 1.0 |
Fit basis (paper's reference spectra):
- theoretical Ca(2) atomic landscape / ab initio EXAFS calculations
Source evidence: Page 2, 'Yttrium Speciation in Hydrothermal Fluorapatite' section; Conclusions section
Key reasoning: Shell fitting of the EXAFS spectrum reveals 7.0(7) oxygen atoms at 2.37(2) Å, confirming Y integrates into the 7-fold coordinated Ca(2) site via substitution. The next nearest neighbor environment (5 P and 10 Ca) matches the theoretical Ca(2) atomic landscape. The lack of a high k contribution in the next nearest environment eliminates the hypothesis of a coupled substitution involving a second heavy trivalent cation plus a vacancy.
Reasoning source: Page 2, 'Yttrium Speciation in Hydrothermal Fluorapatite' section
Scoring Rubric (total: 100 pts)
| Q | Type | Max | Question | Reference Answer | Scoring Criteria |
|---|---|---|---|---|---|
| q1 | reasoning | 35 | Based on the hydrothermal origin of this fluorapatite, what is the dominant yttrium speciation (phase/site), and what structural evidence from the local atomic environment supports this assignment? | In this hydrothermal fluorapatite sample from Durango, Mexico, the dominant yttrium speciation is Y3+ fully substituted at the Ca(2) crystallographic site (fraction = 1.0). This specific speciation arises because the hydrothermal formation conditions facilitate the direct integration of yttrium into the host crystal lattice. Structural evidence from EXAFS shell fitting confirms this mechanism by revealing 7.0(7) oxygen atoms at a distance of 2.37(2) Å, which corresponds to the 7-fold coordinated Ca(2) site. Additionally, the next nearest neighbor environment of 5 P and 10 Ca atoms perfectly matches the theoretical Ca(2) atomic landscape, proving complete structural substitution. | Full credit requires identifying that Y exclusively substitutes at the Ca(2) site (fraction 1.0) and mentioning the supporting evidence: a 7-fold oxygen coordination and a next-nearest neighbor environment matching the theoretical Ca(2) landscape (5 P and 10 Ca). |
| q2 | spectral | 30 | Describe the expected relative intensity of the white line (Feature I) for this hydrothermal fluorapatite compared to yttrium adsorbed on fluorapatite (Y-ads). | The white line (Feature I) at approximately 17050 eV for this hydrothermal fluorapatite is expected to have a significantly lower maximum intensity compared to yttrium adsorbed on fluorapatite (Y-ads). This spectral difference occurs because the hydrothermal origin of the sample drives the complete incorporation of Y3+ into the crystalline lattice at the Ca(2) site, rather than leaving it as a surface-adsorbed species. Because the yttrium is structurally constrained within the specific 7-fold coordinated Ca(2) atomic landscape, its local electronic environment differs fundamentally from the less constrained adsorbed state, directly resulting in the attenuated white line intensity. | Full credit requires stating that the maximum of the white line is significantly lower for the hydrothermal fluorapatite (H-FAp) compared to the adsorbed yttrium (Y-ads). |
| q3 | reasoning | 35 | Why is the hypothesis of a coupled substitution involving a second heavy trivalent cation plus a vacancy (e.g., 2REE3+ + vacancy = 3Ca2+) rejected for this specific hydrothermal sample? | The hypothesis of a coupled substitution involving a second heavy trivalent cation plus a vacancy is rejected due to the lack of a high-k scattering contribution in the next nearest neighbor environment. During the formation of this hydrothermal fluorapatite, yttrium integrates directly into the Ca(2) site, surrounded by a standard landscape of 5 P and 10 Ca atoms. If a coupled substitution mechanism involving another heavy rare earth element had occurred under these hydrothermal conditions, EXAFS would detect a heavy-atom scattering signal at high k-values. The complete absence of this high-k signal confirms that the hydrothermal conditions favored isolated Y substitution at the Ca(2) site rather than heavy cation-vacancy clustering. | Full credit requires explaining that the lack of a high k (wavenumber) contribution in the next nearest environment around Y eliminates the possibility of a second heavy trivalent cation in the local structure. |
Review
Direct precipitation of siderite in ferruginous environments
APS
Environmental
A. Grengs et al.
DOI: 10.7185/geochemlet.2414
4 scenarios
▶
#1280
sediment
Fe K-edge
▶
LLM Prompt
Sample Information
Material: sediment
Sample Origin: Canyon Lake, Michigan, USA
Sample-Specific Conditions
- depth: 22 cm
- Anoxic sediment core from ferruginous Canyon Lake
Measurement
We plan to measure the Fe K-edge XANES spectrum of this sample.
Questions
Based on all the information above:
1. Based on the environmental conditions (anoxic, ferruginous sediment at 22 cm depth), what are the most likely candidate reference spectra needed to model the Fe K-edge EXAFS data using linear combination fitting?
2. Estimate the relative phase fractions of the identified iron phases in this sediment sample.
Ground Truth
Material: sediment
Measurement: Fe K-edge EXAFS at Advanced Photon Source (APS) beamline 9BM
Fit method: linear combination fitting
Phase fractions: (±15%)
| Phase | Fraction |
|---|---|
| biogenic Fe-oxyhydroxide | 0.58 |
| greigite | 0.33 |
| siderite | 0.09 |
Fit basis (paper's reference spectra):
- biogenic Fe-oxyhydroxide (Bio Fe)
- greigite
- siderite
Source evidence: Figure 3c
Key reasoning: Despite the highly reducing, anoxic, and ferruginous nature of the water column and sediments, poorly ordered Fe-(oxyhydr)oxide (Bio Fe) persists as the dominant phase at this depth. Greigite is present as a secondary phase, though its abundance is limited by the small sulfate reservoir available for reduction in the water column. Siderite is a minor component at 22 cm, as its precipitation is kinetically limited despite being supersaturated throughout the porewater, only becoming a major phase deeper in the core.
Reasoning source: Results and Discussion: 'Primary iron phases in Canyon Lake' and 'Sediment geochemistry and mineralogy'
Scoring Rubric (total: 100 pts)
| Q | Type | Max | Question | Reference Answer | Scoring Criteria |
|---|---|---|---|---|---|
| q1 | identification | 46 | Based on the environmental conditions (anoxic, ferruginous sediment at 22 cm depth), what are the most likely candidate reference spectra needed to model the Fe K-edge EXAFS data using linear combination fitting? | To model the Fe K-edge EXAFS data for this sediment sample, the necessary reference spectra are biogenic Fe-oxyhydroxide (Bio Fe), greigite, and siderite. Despite the highly reducing, anoxic, and ferruginous conditions of the Canyon Lake sediment, poorly ordered biogenic Fe-oxyhydroxide persists as a primary phase. Greigite is also expected as a secondary phase, though its formation is restricted by the small sulfate reservoir available for reduction in the water column. Finally, siderite must be included as a minor component at this 22 cm depth because its precipitation is kinetically limited, even though it is supersaturated throughout the porewater. | Full points for identifying a poorly crystalline Fe(III) oxyhydroxide (like Bio Fe), a mixed-valence iron sulfide (greigite), and an iron carbonate (siderite). Partial credit for missing one phase or suggesting other reasonable but incorrect phases for this specific environment. |
| q2 | quantification | 54 | Estimate the relative phase fractions of the identified iron phases in this sediment sample. | The estimated relative phase fractions for this sediment at 22 cm depth are 0.58 (58%) biogenic Fe-oxyhydroxide, 0.33 (33%) greigite, and 0.09 (9%) siderite, with an uncertainty of 15%. Biogenic Fe-oxyhydroxide dominates the composition because this poorly ordered phase persists despite the highly reducing, anoxic, and ferruginous nature of the sediment. Greigite makes up roughly a third of the iron phases, as its abundance is limited by the small sulfate reservoir available for reduction in the water column. Siderite accounts for only a small fraction (9%) at this specific depth because its precipitation is kinetically limited despite being supersaturated in the porewater, preventing it from becoming a major phase until deeper in the core. | Full points if the estimated fractions are within ±15% of the ground truth: Bio Fe (~58%), greigite (~33%), and siderite (~9%). Partial credit if the relative order of abundance is correct (Bio Fe > greigite > siderite). |
Review
#1281
sediment
Fe K-edge
▶
LLM Prompt
Sample Information
Material: sediment
Sample Origin: Canyon Lake, Michigan, USA
Sample-Specific Conditions
- depth: 64 cm
- Anoxic sediment core from ferruginous Canyon Lake
Measurement
We plan to measure the Fe K-edge XANES spectrum of this sample.
Questions
Based on all the information above:
1. Based on the environmental conditions (anoxic, ferruginous lake sediment at 64 cm depth), what candidate reference spectra should be included in a linear combination fitting (LCF) model for the Fe K-edge data?
2. Estimate the relative phase fractions of the iron-bearing species in this 64 cm sediment sample.
Ground Truth
Material: sediment
Measurement: Fe K-edge EXAFS (Advanced Photon Source, beamline 9BM)
Fit method: Linear combination fitting (LCF)
Phase fractions: (±15%)
| Phase | Fraction |
|---|---|
| biogenic Fe-oxyhydroxide | 0.495 |
| greigite | 0.307 |
| siderite | 0.198 |
Fit basis (paper's reference spectra):
- biogenic Fe-oxyhydroxide (Bio Fe)
- greigite
- siderite
Source evidence: Figure 3c and Table S-5a, page 3
Key reasoning: The sediment Fe reservoir is dominated by unsulfidised Fe(II) phases, but poorly ordered Fe(III) as biogenic Fe-oxyhydroxide (Bio Fe) persists due to the system's limited ability to reduce the large Fe pool. Greigite is present as a minor component limited by the small sulfate reservoir in the water column. Siderite is supersaturated throughout the porewater, but its precipitation is kinetically limited; its emergence at ~60-64 cm is attributed to an environmental change, likely wildfire ash deposition, which increased porewater pH and provided nucleation sites to overcome the kinetic barrier for crystalline siderite precipitation.
Reasoning source: Results and Discussion: 'Sediment geochemistry and mineralogy' (page 2) and 'Controls on siderite occurrence' (page 4)
Scoring Rubric (total: 100 pts)
| Q | Type | Max | Question | Reference Answer | Scoring Criteria |
|---|---|---|---|---|---|
| q1 | identification | 40 | Based on the environmental conditions (anoxic, ferruginous lake sediment at 64 cm depth), what candidate reference spectra should be included in a linear combination fitting (LCF) model for the Fe K-edge data? | The linear combination fitting (LCF) model for the Fe K-edge data should include reference spectra for biogenic Fe-oxyhydroxide (Bio Fe), greigite, and siderite. These specific phases are expected in this anoxic, ferruginous sediment core due to the unique geochemical conditions present at the 64 cm depth. Poorly ordered Fe(III) as biogenic Fe-oxyhydroxide persists in the sediment because the system has a limited ability to completely reduce the large iron pool. Greigite forms as a minor component because sulfidation is strictly limited by the small sulfate reservoir in the lake's water column. Finally, siderite is included because, despite being kinetically limited elsewhere in the core, an environmental change at ~60-64 cm (likely wildfire ash deposition) increased porewater pH and provided nucleation sites for its precipitation. | Full points for identifying a poorly ordered Fe(III) oxide (like biogenic Fe-oxyhydroxide/ferrihydrite), an iron sulfide (greigite), and an iron carbonate (siderite). |
| q2 | quantification | 60 | Estimate the relative phase fractions of the iron-bearing species in this 64 cm sediment sample. | The estimated relative phase fractions for this 64 cm sediment sample are 49.5% biogenic Fe-oxyhydroxide, 30.7% greigite, and 19.8% siderite, with an uncertainty of 15%. These specific values reflect the balance of geochemical processes and limitations within the anoxic, ferruginous lake sediment. The dominant fraction of biogenic Fe-oxyhydroxide (49.5%) results from the system's limited capacity to reduce the massive iron pool, allowing poorly ordered Fe(III) to persist. The moderate greigite fraction (30.7%) is constrained by the small sulfate reservoir available in the water column. The 19.8% siderite fraction specifically arises at this 64 cm depth due to a localized environmental change, likely wildfire ash deposition, which raised the porewater pH and provided nucleation sites to overcome the kinetic barriers of siderite precipitation. | Full points if the estimated fractions are within ±15% of the ground truth: ~50% biogenic Fe-oxyhydroxide, ~31% greigite, and ~20% siderite. |
Review
#1282
sediment
Fe K-edge
▶
LLM Prompt
Sample Information
Material: sediment
Sample Origin: Canyon Lake, Michigan, USA
Sample-Specific Conditions
- depth: 110 cm
- Anoxic sediment core from ferruginous Canyon Lake
Measurement
We plan to measure the Fe K-edge XANES spectrum of this sample.
Questions
Based on all the information above:
1. Based on the environmental conditions (anoxic, ferruginous sediment), what candidate reference spectra should be included in a linear combination fitting (LCF) model for the Fe K-edge EXAFS of this sample?
2. Estimate the relative phase fractions of the primary iron-bearing minerals at the 110 cm depth in this sediment core.
Ground Truth
Material: sediment
Measurement: Fe K-edge EXAFS at Advanced Photon Source (APS) beamline 9BM
Fit method: Linear combination fitting (LCF)
Phase fractions: (±15%)
| Phase | Fraction |
|---|---|
| biogenic Fe-oxyhydroxide | 0.584 |
| greigite | 0.327 |
| siderite | 0.089 |
Fit basis (paper's reference spectra):
- biogenic Fe-oxyhydroxide (Bio Fe)
- greigite
- siderite
Source evidence: Figure 3c, page 3
Key reasoning: Despite the highly reducing nature of the Canyon Lake water column and sediments, poorly crystalline ferric (oxyhydr)oxides (Bio Fe) persist in the sediment core, likely due to the limited ability of the system to oxidise the large Fe reservoir, resulting in Bio Fe delivery from the water column. Greigite is present as a mixed-valence sulfide, though its abundance is limited by the small sulfate reservoir available for reduction. Siderite is a minor component at 110 cm (approx. 9%) compared to the ~60 cm horizon (20%), because the primary trigger for substantial siderite precipitation—an increase in pH driven by wildfire ash deposition—was localized to the mid-core depths.
Reasoning source: Results and Discussion: Sediment geochemistry and mineralogy; Primary iron phases in Canyon Lake; Controls on siderite occurrence (pages 2-4)
Scoring Rubric (total: 100 pts)
| Q | Type | Max | Question | Reference Answer | Scoring Criteria |
|---|---|---|---|---|---|
| q1 | identification | 40 | Based on the environmental conditions (anoxic, ferruginous sediment), what candidate reference spectra should be included in a linear combination fitting (LCF) model for the Fe K-edge EXAFS of this sample? | The linear combination fitting (LCF) model for this sample should include reference spectra for biogenic Fe-oxyhydroxide (Bio Fe), greigite, and siderite. Despite the highly reducing, anoxic nature of the ferruginous sediment, poorly crystalline ferric (oxyhydr)oxides (Bio Fe) persist because the system has a limited ability to oxidize the large Fe reservoir, leading to continuous Bio Fe delivery from the water column. Greigite, a mixed-valence sulfide, forms under these conditions but its presence is restricted by the small sulfate reservoir available for reduction. Siderite is also included as a minor phase at this 110 cm depth, as the primary trigger for its substantial precipitation (a pH increase driven by wildfire ash deposition) was localized to shallower mid-core depths. | Full points for identifying biogenic Fe-oxyhydroxide (or poorly crystalline Fe(III) oxides), greigite (or Fe sulfides), and siderite (Fe carbonate). Partial credit for missing one phase or including reasonable but unselected phases like green rust or magnetite. |
| q2 | quantification | 60 | Estimate the relative phase fractions of the primary iron-bearing minerals at the 110 cm depth in this sediment core. | At the 110 cm depth, the relative phase fractions are estimated to be 58.4% biogenic Fe-oxyhydroxide (Bio Fe), 32.7% greigite, and 8.9% siderite, with an estimated uncertainty of 15%. The dominant fraction of Bio Fe (~58%) results from its continuous delivery from the water column, allowing it to persist despite the highly reducing, anoxic conditions of the ferruginous sediment. The greigite fraction (~33%) is strictly limited by the small sulfate reservoir available for reduction in this specific lake environment. Finally, siderite makes up only a minor fraction (~9%) at 110 cm compared to shallower depths, because the main driver for its precipitation—an increase in pH caused by wildfire ash deposition—was localized to the mid-core depths around 60 cm. | Full points for estimating ~58-59% biogenic Fe-oxyhydroxide, ~33% greigite, and ~9% siderite. Deduct points proportionally for deviations >10% from the ground truth values. |
Review
#1283
sediment
Mn K-edge
▶
LLM Prompt
Sample Information
Material: sediment
Sample Origin: Canyon Lake, Michigan, USA
Sample-Specific Conditions
- depth: 64 cm
- Anoxic sediment core from ferruginous Canyon Lake
Measurement
We plan to measure the Mn K-edge XANES spectrum of this sample.
Questions
Based on all the information above:
1. What manganese phase dominates the sediment at the 64 cm depth in this ferruginous lake, and what environmental or historical trigger is proposed to have caused its precipitation in this specific horizon?
2. Describe the expected spectral shape of the Mn K-edge XANES for this 64 cm sediment sample. What specific spectral feature distinguishes it from other generic Mn(II) phases?
3. If you were to analyze this sample's XANES spectrum, what reference standards would be appropriate to include to confirm the oxidation state and specific mineralogy, based on the phases considered in this study?
Ground Truth
Material: sediment
Measurement: Mn K-edge XANES at Advanced Photon Source (APS) beamline 9BM
Fit method: Qualitative spectral comparison
Phase fractions: (±10%)
| Phase | Fraction |
|---|---|
| rhodochrosite | 1.0 |
Fit basis (paper's reference spectra):
- Rhodochrosite (MnCO3) standard
- Mn2+ standard
- Mn2O3 standard
Source evidence: Figure 3d and page 2 text
Key reasoning: The 64 cm depth corresponds to a horizon where a precipitation barrier was overcome, likely due to a historical wildfire ash deposition event that increased porewater pH and delivered CaCO3, catalyzing carbonate precipitation. The lack of an Mn-oxide flux in the lake suggests that the occurrence of this Mn-carbonate is governed by fundamental precipitation controls (such as competition from nucleation inhibitors or differential solubilities of Ca-Mn-Fe carbonates) rather than the diagenetic reduction of Mn-oxides.
Reasoning source: Results and Discussion (Controls on siderite occurrence), Page 4
Scoring Rubric (total: 101 pts)
| Q | Type | Max | Question | Reference Answer | Scoring Criteria |
|---|---|---|---|---|---|
| q1 | reasoning | 38 | What manganese phase dominates the sediment at the 64 cm depth in this ferruginous lake, and what environmental or historical trigger is proposed to have caused its precipitation in this specific horizon? | The sediment at the 64 cm depth is completely dominated by rhodochrosite (MnCO3), which accounts for 1.0 (100%) of the manganese fraction. This specific mineralogy arises in the anoxic, ferruginous conditions of Canyon Lake because a historical wildfire ash deposition event at this depth likely increased porewater pH and delivered CaCO3. This environmental trigger overcame a precipitation barrier, catalyzing the precipitation of the Mn-carbonate phase. Furthermore, the lack of an Mn-oxide flux in the lake indicates that this rhodochrosite formation is governed by fundamental precipitation controls, such as differential solubilities or competition from nucleation inhibitors, rather than the diagenetic reduction of Mn-oxides. | Full credit for identifying rhodochrosite (MnCO3) and explaining that a historical wildfire ash deposition event likely increased porewater pH and delivered CaCO3, overcoming the precipitation barrier. |
| q2 | spectral | 38 | Describe the expected spectral shape of the Mn K-edge XANES for this 64 cm sediment sample. What specific spectral feature distinguishes it from other generic Mn(II) phases? | The expected Mn K-edge XANES spectrum for this 64 cm sediment sample is dominated by reduced Mn(II), with a main peak energy positioned at approximately 6552 eV. The spectrum exhibits a distinctive double-peak at the white line, which perfectly matches a rhodochrosite standard. This specific double-peak feature at the main absorption edge is what distinguishes the sample from other aqueous or generic Mn(II) standards. These spectral features directly reflect the sample's structural and electronic properties at this depth, where a historical wildfire ash deposition event increased porewater pH and catalyzed the precipitation of pure MnCO3 in the anoxic sediment. | Full credit for stating the spectrum is dominated by Mn(II) (main peak ~6552 eV) and explicitly mentioning the 'distinctive double-peak' that characterizes rhodochrosite. |
| q3 | identification | 25 | If you were to analyze this sample's XANES spectrum, what reference standards would be appropriate to include to confirm the oxidation state and specific mineralogy, based on the phases considered in this study? | To confirm the oxidation state and specific mineralogy of this sample, appropriate reference standards would include a rhodochrosite (MnCO3) standard, a generic Mn2+ standard, and an oxidized Mn2O3 standard. These specific standards are necessary to evaluate the anoxic sediment from the 64 cm depth of Canyon Lake, which is expected to be dominated by reduced Mn(II). The inclusion of the rhodochrosite standard is critical because a historical wildfire ash deposition event at this specific horizon increased porewater pH and delivered CaCO3, triggering the precipitation of pure Mn-carbonate. Comparing the sample against both generic Mn2+ and Mn2O3 ensures that the distinctive double-peak of the resulting rhodochrosite can be accurately distinguished from other aqueous Mn(II) phases or any oxidized Mn inputs. | Full credit for listing Rhodochrosite (MnCO3), a Mn2+ standard, and a Mn(III) standard like Mn2O3 to rule out oxidized phases. |
Review